Embed Size (px)
Citation preview

It is with tremendous ill grace that I grudgingly acknowledge the contribution of a few other people. (Hugh Grant, 1995)
Christian de Capitani
Equilibrium assemblagesand Phase Diagrams
What is the Theriak-Domino Software?
Some applications
Petrogenetic grid > < equilibrium assemblage diagram
With the help of:(chronologically)
Tom BrownHugh GreenwoodRob BermanMarcus KirschenChristian MeyreThorsten NagelKonstantin PetrakakisPhilipp HunzikerRomain BousquetFred GaidiesDoug Tinkham

What is the Theriak-Domino Software?The THERIAK-DOMINO Software is a program collection to calculate and plot thermodynamic functions, equilibrium assemblages and equilibrium assemblage diagrams:
Theriak: stable mineral assemblage and phase compositions for a given bulkcomposition at specified P,T conditions.
Domino: - equilibrium assemblage diagrams (P, T, a, ln(a))- Pseudo-binary or pseudo-ternary phase diagrams- isopleths, density, volume or modal distributions- and more
Therbin,Therter: binary and ternary phase diagrams
Thalia,Thermo: thermodynamic functions (T, P or composition)
Guzzler, Explot, Makemap, Plotxy: transform graphics information to postscript files

What is the aim of thermodynamic
modeling?

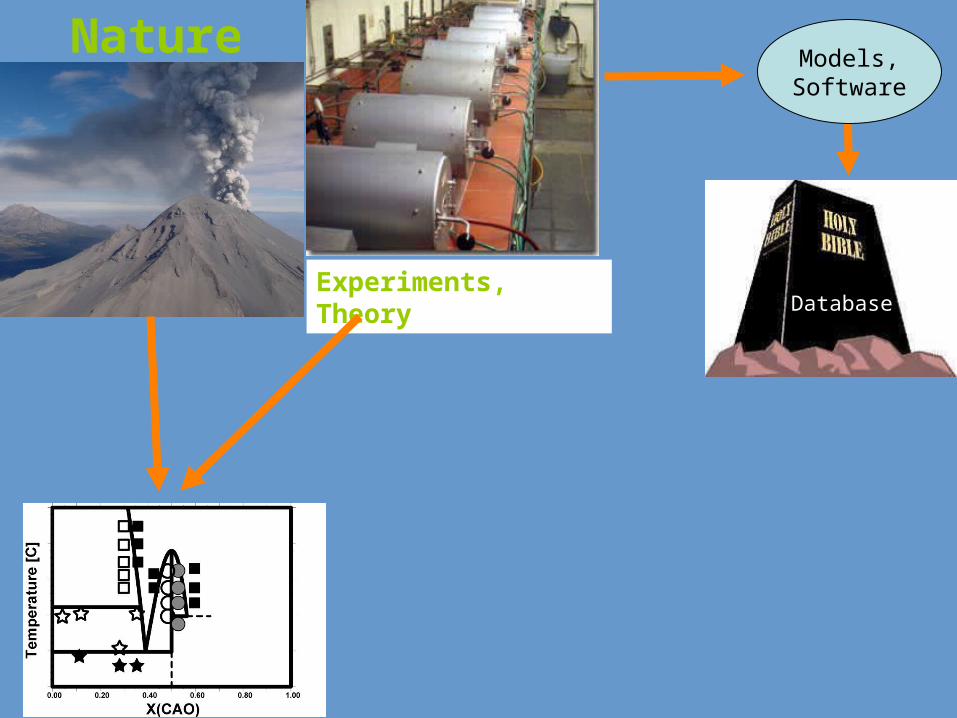
Nature
Experiments, Theory

Nature
Experiments, Theory
Nature
Experiments, Theory
Models,Software
Database

Nature
Experiments, Theory
SoftwareTheriak-Domino
Models,Software
Database

Nature
Experiments, Theory
Prediction
Models,Software
Database
SoftwareTheriak-Domino

Nature
Experiments, Theory
Models,Software
Prediction
Database
SoftwareTheriak-Domino

Petrogenetic grids: Focus on reactions
1. System (eg. K2O-MgO-Al2O3-SiO2-H2O)
2. Choose phases (eg. for pelites: Qz,Sil, And, Ky, Stau, Alm, Grs, Py, etc.)
4. Schreinemakers
3. Calculate all reactions

P-T phase diagram showing the experimental results of Koziol and Newton (1988), and the equilibrium curve for reaction (27-37). Open triangles indicate runs in which An grew, closed triangles indicate runs in which Grs + Ky + Qtz grew, and half-filled triangles indicate no significant reaction. The univariant equilibrium curve is a best-fit regression of the data brackets. The line at 650oC is Koziol and Newton’s estimate of the reaction location based on reactions involving zoisite. The shaded area is the uncertainty envelope.
After Koziol and Newton (1988) Amer. Mineral., 73, 216-233
Petrogenetic grids: Focus on reactions

K2O-MgO-Al2O3-SiO2-H2O K2O-FeO-MgO-Al2O3-SiO2-H2O
P-T grid for pelites, after Spear and Cheney (1989). (inF. Spear (1993): Metamorphic Phase Equilibria and Pressure-Temperature-Time Paths.
Petrogenetic grids: Focus on reactions

1 AKERMANITE2 ANTIGORITE3 BRUCITE4 CHRYSOTILE5 DIASPORE6 GEHLENITE7 HEMATITE8 HERCYNITE9 KALSILITE10 KAOLINITE11 LAWSONITE12 ALEUCITE13 BLEUCITE14 LIME15 MAGNETITE16 MERWINITE17 MONTICELLITE18 NEPHELINE19 PERICLASE20 PREHNITE21 PYROPHYLLITE22 SPINEL23 TALC24 WOLLASTONITE25 PSEUDOWOLLASTONI26 HEULANDITE27 LAUMONTITE28 STILBITE29 WAIRAKITE30 PUMPELLYITE231 A-QUARTZ32 B-QUARTZ
33 COESITE34 CORUNDUM35 ALPHA CRISTOBALITE36 BETA CRISTOBALITE37 LOW TRIDYMITE38 HIGH TRIDYMITE39 ANDALUSITE40 KYANITE41 SILLIMANITE42 FAYALITE43 FORSTERITE44 GROSSULAR45 PYROPE46 ALMANDINE47 ALBITE48 K-FELDSPAR49 ANORTHITE50 ANNITE51 PHLOGOPITE52 MARGARITE53 MUSCOVITE54 CELADONITE55 FE-CELADONITE56 PARAGONITE57 FE-STAUROLITE58 MG-STAUROLITE59 ORTHOENSTATITE60 PROTOENSTATITE61 FERROSILITE62 DIOPSIDE63 JADEITE64 HEDENBERGITE
65 CA-AL PYROXENE66 CLINOCHLORE67 DAPHNITE68 AMESITE69 CORDIERITE(DRY)70 FE_CORDIERITE71 MGCTD72 FECTD73 ZOISITE74 CLINOZOISITE75 EPIDOTE76 ANTHOPHYLLITE77 TREMOLITE78 FETREMOLITE79 TSCHERMAKITE80 PARGASITE81 FEPARGASITE82 GLAUCOPHANE83 STEAM84 OXYGEN85 HYDROGEN
85 possible phases:
K2O-Na2O-CaO-FeO-MgO-Al2O3-SiO2-H2O
4.117·1011 reactions(maximum)
Petrogenetic grids: Focus on reactions


Obere Tiefenstufe Untere Tiefenstufe
Al allein . . . . Disthen Disthen, SillimanitFe + Al . . . . Chloritoid, Granat AlmandinMg allein . . . . Antigorit Rhomb. Pyroxene; bei Si-Mangel OlivinMg + Al . . . . Chlorit Pyrop, CordieritMg + Ca . . . . Hornblende Diopsid, OmphacitCa + Al . . . . Zoisit, Epidot Anorthitreicher PlagioklasNa + Al . . . . Albit, bei Si-Mangel Albitsubstanz im Plagioklas, bei Si-Mangel
Glaukophan Na Al -Verbindung im OmphacitNa + Fe . . . . Na-Hornblenden Ägirin als Beimischung im OmphacitKa + Al . . . . Muscovit KalifeldspatK + Fe + Mg . . . Biotit BiotitTi . . . . . . meist mit Ca und Rutil
Si als Titanit
F. Becke: Über Mineralbestand und Struktur der kristallinen Schiefer.Comptes Rendus IX. Congrès géol. internat. de Vienne 1903
Temperature
Com
posi
tion
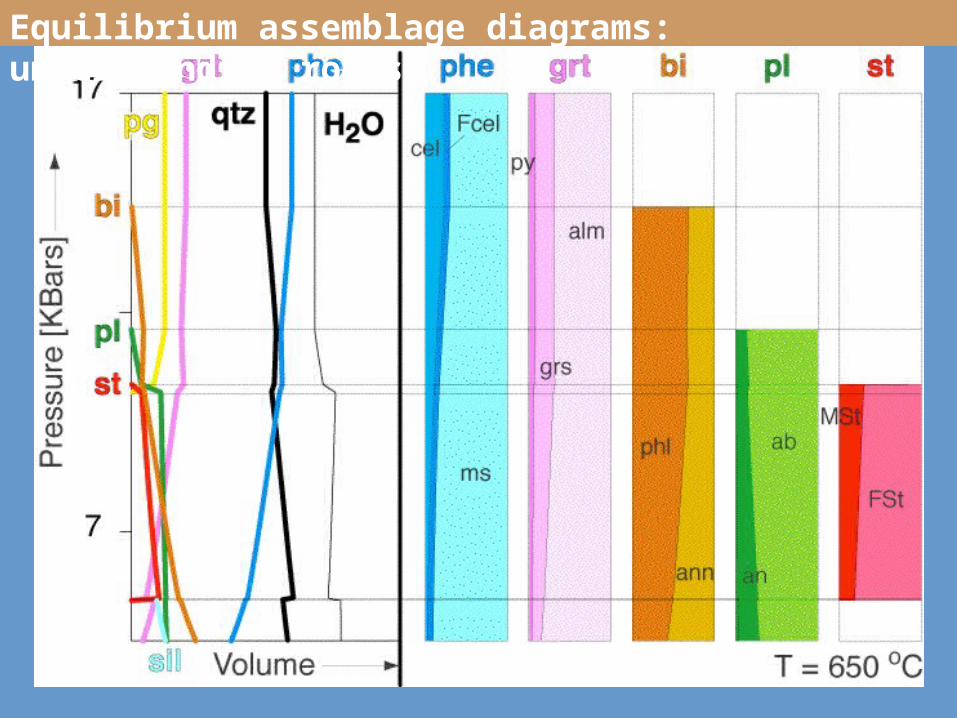
Equilibrium assemblage diagrams: Focus on equilibria
Most people would sooner die than think; in fact, they do so. (Bertrand Russell)

Equilibrium assemblage diagrams: Focus on equilibria

Equilibrium assemblage diagrams: Focus on equilibria

4. Schreinemakers
3. Calculate all reactions
equilibrium assemblage diagram
1. Chemical composition, eg.:
2. Choose phases (eg. for pelites: Qz,Sil, And, Ky, Stau, Alm, Grs, Py, etc.)
SiO2 59.58Al2O3 12.16FeO 4.87MgO 2.79CaO 0.53Na2O 1.27K2O 2.69H2O 30.00
Equilibrium assemblage diagrams: Focus on equilibria

Example of equilibrium calculation
Input Output
P and T
T = 700 oCP = 10000 Bar
bulk composition
molsSiO2 59.58Al2O3 12.16MgO 2.79FeO 4.87CaO 0.53Na2O 1.27K2O 2.69H2O 30.00 (excess)
mols phase composition
2.38 GARNET X(grossular) 0.038X(pyrope) 0.310X(almandine) 0.652
1.82 FSP X(albite) 0.836X(K-feldspar) 0.022 X(anorthite) 0.142
6.35 wh_mica X(muscovite) 0.717X( paragonite) 0.159X( M-celadonite) 0.090X( F-celadonite) 0.034
27.40 Quartz
23.65 Steam
Equilibrium assemblage diagrams: Focus on equilibria

T. Nagel, C. de Capitani and M. Frey, J. metamorphic Geol., 2002, 20, 309-324
Equilibrium assemblage diagrams: Focus on equilibria

Eqiulibrium assemblage Phase Diagrams

When are the results of a prediction useful?
When you learn something
Equilibrium assemblage diagrams
Simple problems: Summarize what is knownPlan experimental workTest data and solution models
Complex problems: Calculations help understand nature
Science is like sex: sometimes something useful comes out, but that is not the reason we are doing it. (Richard Feynman)

When are the results of a prediction useful?
When you learn something
When the results are unexpected
Equilibrium assemblage diagrams
Simple problems: Summarize what is knownPlan experimental workTest data and solution models
Complex problems: Calculations help understand nature
Did we interpret our observations correctly?Is the thermodynamic data correct?Is the software calculating correctly?
Science is like sex: sometimes something useful comes out, but that is not the reason we are doing it. (Richard Feynman)

When are the results of a prediction useful?
When you learn something
When the results are unexpected
When the results are oviously wrong
Equilibrium assemblage diagrams
Simple problems: Summarize what is knownPlan experimental workTest data and solution models
Complex problems: Calculations help understand nature
Did we interpret our observations correctly?Is the thermodynamic data correct?Is the software calculating correctly?
Opportunity to improve the databaseFix bugs in the software
Science is like sex: sometimes something useful comes out, but that is not the reason we are doing it. (Richard Feynman)

Eqiulibrium assemblages and Phase Diagrams
Petrogenetic grids equilibrium assemblage diagrams> <

Equilibrium assemblage diagrams: Simple problems
Equilibrium assemblage diagramPetrogenetic grid
Comparision
calculation input bulk compositionsystem and choice of phases
interpretation very easymay be difficult
solution models •Thermodynamic properties and activities of all endmembers must be known
• compositions are calculated
• only activities of some phasesneeded
• fixed compositions in input
focus chemical equilibriumreactions
I don't necessarily agree with everything I say. (Marshall McLuhan)

Equilibrium assemblage diagrams:
applications

coesite coesite
-quartz -quartzquartz
melttr tr
cr cr
Database from TWQ Database from THERMOCALC
Bulk composition: SiO2
Diagram: stable assemblages
Equilibrium assemblage diagrams: testing databases

coesitecoesite
-qtz
-qtzquartz
melttr tr
Database from TWQ Database from THERMOCALC
Bulk composition: SiO2
Diagram: densities [ccm/mol]
Equilibrium assemblage diagrams: testing databases
cr cr

Birch’s law (1964)
Vp
Vs
extended Birch’s law
Vp Vp
VsVs
V=aρ+b
Vel
ocity
(km
.s-1)
Density (g.cm-3)
Vel
ocity
(km
.s-1)
Density (g.cm-3)
0.2 GPa 0.6 GPa 1.0 GPa
Ludwig et al., 1970
Physical properties of rocks use for seismic velocities
R. Bousquet, C. de Capitani, D. Arcay, Strasbourg 2006
Equilibrium assemblage diagrams: seismic velocities

Pelites
density
MORB
density
Gabbro
density
Physical properties of rocks use for seismic velocities
R. Bousquet, C. de Capitani, D. Arcay, Strasbourg 2006
Equilibrium assemblage diagrams: seismic velocities

1 mm
T. Nagel, C. de Capitani and M. Frey, J. metamorphic Geol., 2002, 20, 309-324
Equilibrium assemblage diagrams: understanding rocks

Equilibrium assemblage diagrams: understanding rocks
T. Nagel, C. de Capitani and M. Frey, J. metamorphic Geol., 2002, 20, 309-324If you cannot convince them, confuse them. (Harry S Truman)

Equilibrium assemblage diagrams: understanding rocks
T. Nagel, C. de Capitani and M. Frey, J. metamorphic Geol., 2002, 20, 309-324If you cannot convince them, confuse them. (Harry S Truman)

Equilibrium assemblage diagrams: understanding rocks
T. Nagel, C. de Capitani and M. Frey, J. metamorphic Geol., 2002, 20, 309-324

Garnet
Equilibrium assemblage diagrams: understanding rocks
GARNET (rim)GROSSULAR 0.061PYROPE 0.209ALMANDINE 0.730
ALBITE 0.760K-FELDSPAR 0.018ANORTHITE 0.222
FELDSPAR
PARAGONITE 0.128 MUSCOVITE 0.872
WHITE MICA
PHLOGOPITE 0.617ANNITE 0.383
BIOTITE
STAUROLITEFE-STAUROLITE 0.906MG-STAUROLITE 0.094
TWQ
T. Nagel, C. de Capitani and M. Frey, J. metamorphic Geol., 2002, 20, 309-324

Equilibrium assemblage diagrams: understanding rocks
T. Nagel, C. de Capitani and M. Frey, J. metamorphic Geol., 2002, 20, 309-324

Equilibrium assemblage diagrams: understanding rocks
T. Nagel, C. de Capitani and M. Frey, J. metamorphic Geol., 2002, 20, 309-324
Equilibrium assemblage diagrams: understanding rocks

Equilibrium calculations (THERIAK etc.) are powerful tools to
• visualize the implications of databases
• help understanding natural processes
• help to develop new eqations of state and solution models
• help planning experimental work
Equilibrium assemblage diagrams: Final remarks
A conclusion is simply the place where someone got tired of thinking. (Arthur Block)
Difficulties for beginners
• software is a black box
• low rate of succes(You get what you asked for but it may not what you wanted).
Equilibrium assemblage diagrams: Final remarks
Equilibrium calculations (THERIAK etc.) are powerful tools to
• visualize the implications of databases
• help understanding natural processes
• help to develop new eqations of state and solution models
• help planning experimental work