Embed Size (px)
Citation preview

DISCLOSURE APPENDIX CONTAINS IMPORTANT DISCLOSURES, ANALYST CERTIFICATIONS, INFORMATION ON TRADE ALERTS, ANALYST MODEL PORTFOLIOS AND THE STATUS OF NON-U.S ANALYSTS. U.S. Disclosure: Credit Suisse does and seeks to do business with companies covered in its research reports. As a result, investors should be aware that the Firm may have a conflict of interest that could affect the objectivity of this report. Investors should consider this report as only a single factor in making their investment decision.
16 March 2011Americas/United States
Equity ResearchIT Hardware / OVERWEIGHT
IT Hardware INITIATION
Serving the Smart Era ■ From Cyclical to Structural Growth. Based on an extensive study of end
demand for the IT hardware and IT services sector, we see the $1.2tn market growing 4% per annum through 2015. Our analysis suggests that IT is being under consumed by the global economy when we look at levels of net tech investment, especially given the healthy corporate backdrop. Such underinvestment comes at a time when we believe IT infrastructure needs to cope with the megatrends of virtualization, move toward cloud computing, and explosive growth in smart devices, including smartphones and tablets. Given the above and sector valuations, we initiate coverage of the sector at Overweight.
■ PCs forecasting: Think Compute; Tablets a $120bn Opportunity. We have developed what we believe is the first econometric model for projecting computing demand. When combined with our commercial PC model, we conclude that installed base for computing products will rise to 2.4bn by 2015, driven by a high elasticity of demand and resulting in 14% unit and 4% revenue growth long term. Our proprietary PC price tier analysis suggests tablet unit volumes of 65mn/116mn in 2011/12 and long-term revenue of $120bn which represents 42%/42% of overall PC industry volumes/value.
■ Smartphones, Storage, and Services Driving the Market, while Traditional PCs and Printing and Servers Face Headwinds. Beyond tablets, we see healthy 14% revenue growth within smartphones (we are again raising our estimates), 10% revenue growth in networked storage, and 5% revenue growth in services. By contrast, we expect the PC industry excluding tablets to decline 6%, printing (hardware and supplies) to remain flat, and servers to decline 2% long term (through 2015).
■ Apple, EMC, and HP Are Outperform Rated, while IBM, Xerox, and NetApp Are Neutral Rated; Dell and Lexmark Are Underperform Rated. Apple is our top pick, and we initiate with EPS estimates that are 10%/24% above consensus for FY11/12 and see upside to $500. We believe Apple can maintain its competitive advantage in the industry owing to a well designed vertically integrated model and drive near 50% top and bottom-line growth long term driven by iPhone and iPad. EMC is a direct play on networked storage and virtualization and given the scope for sustained share gains, bottom-line growth should be robust at 20% per year, meaning EMC should trade at our target ex-cash P/E of 16x, giving upside to $34. For Dell, we initiate with an Underperform rating owing to anemic top-line growth and only gradual expansion in margins. Furthermore, any growth through M&A is risky, in our view as rivals have deeper pockets and the company’s track record is mixed. For Lexmark, while valuation is not demanding, we expect negative EPS momentum through 2011 to drive underperformance as the cyclical tailwinds that the company enjoyed in 2010 fade.
Research Analysts Kulbinder Garcha
212 325 4795 [email protected]
Deepak Sitaraman, CFA 212 325 5808
Andrew Muench 212 325 6745
Alban Gashi 212 538 3033
Vlad Rom 212 325 5442
Adam Khorshid 212 538 2433
Achal Sultania 44 20 7883 6884
Arjun Gopinath 44 20 7888 0700
Thompson Wu 212 325 7160

16 March 2011
IT Hardware 2
Table of contents Serving the Smart Era 3 Ten Themes for the Next Five Years 9
1) Cyclical Tailwinds for Now, Structurally 4% Growth 9 2) Compute Demand Drives Tablets to $120bn Market 12 3) Smartphones Set to Cross 1bn Unit Mark by 2015 13 4) Storage Has Several Secular Growth Drivers 14 5) Services Set for a Gradual Recovery 14 6) Lackluster Outlook—Servers, Traditional PCs, Printing 15 7) Radical Changes to the PC Value Chain? 15 8) Competition for the Datacenter... Heating Up 18 9) M&A—Sector Is Ripe for Continued Consolidation 23 10) The Cloud May Not Be That Incremental 25
Macro Trends Supportive of Tech 28 Get Your Head in the Clouds 37 PCs Disruption Coming 72 PC—Winners and Losers 107 Smartphone Growth to Continue 128 Smartphones—Winners and Losers 151 IT Services—2011 Shows a Gradual Recovery 197 Storage—Secular Growth 235 Storage – Winners and Losers 256 Servers—Anemic Growth Ahead 281 Servers – Winners and Losers 305 Printing—Secular Challenges 324

16 March 2011
IT Hardware 3
Serving the Smart Era Over the past three years, the IT sector has grown at a 1% CAGR. On the enterprise side, spending has been driven by the need for efficiency, resulting from the age old mantra that 70% of IT spending is on maintenance, with only 30% on innovation (as noted by IDC). Going forward, we see several megatrends, including the acceleration of virtualization, which drives a move toward the private and public clouds, as well as the acceleration of mobile computing (smartphones and tablets). Both these trends, in our view, will cause unprecedented data growth and in turn increased demand for IT infrastructure. More important, the analysis of such data using software and services will allow corporations to adjust their business strategies accordingly. In other words, IT spending will become less about efficiency and more about innovation. This will drive a shift in the sector toward all things smart: smart devices, smart software (for analytics), and ultimately smarter investing by enterprises.
Such a shift comes at a time when we would argue that there has been relative underinvestment in technology. This means that a healthy corporate backdrop should drive growth in the IT sector. As shown in Figure 1 our top-down and bottom-up analysis suggests that the IT sector will see 4-5% growth in each of the next two years and 4% longer term. From a device perspective, we believe that the innovation in smartphones and tablets will accelerate the move toward mobile computing and drive healthy value growth of 14% and 65% in these segments longer term. To compete in this increasingly complex consumer/corporate world, traditional IT vendors not only need to sustain hardware innovation, but equally need to master software and services as a discipline.
Figure 1: We Expect the Global IT Hardware and Services Sector to Grow 4% LT Driven by Strength in Tablets and Services, but Partially Offset by Weakness in Traditional PCs, Servers and Printing US$ in billions, unless otherwise stated IT Hardware (US$ bn) 2007 2008 2009 2010 2011E 2012E 2015E CAGR 10-15E Consumer PCs ex-tablets 91.1 100.7 101.6 115.1 99.7 91.5 83.4 -6.2%
% change 17.6% 10.5% 0.8% 13.3% -13.4% -8.2% Commercial PCs ex-tablets 142.1 141.7 117.5 123.2 124.2 122.1 88.2 -6.5%
% change 12.4% -0.3% -17.1% 4.9% 0.8% -1.7% Tablets 0.0 0.0 0.0 10.3 35.4 57.6 124.2 64.5%
% change NM NM NM NM 242.7% 62.8% Global PCs 233.2 242.4 219.0 248.6 259.3 271.1 295.7 3.5%
% change 14.4% 3.9% -9.6% 13.5% 4.3% 4.6% Servers 55.4 52.7 43.1 48.8 47.7 48.0 43.9 -2.1%
% change 4.9% -4.8% -18.3% 13.2% -2.2% 0.5% Storage 17.2 19.2 17.4 20.7 22.1 23.5 30.3 8.0%
% change 6.3% 11.4% -9.2% 18.7% 6.7% 6.5% Printing 132.0 135.2 122.9 124.2 126.6 129.7 126.5 0.4%
% change NM 2.5% -9.1% 1.1% 1.9% 2.5% Services 743.0 804.5 763.1 782.0 815.3 856.4 991.5 4.9%
% change 10.7% 8.3% -5.1% 2.5% 4.3% 5.1% Total IT Hardware 1,180.8 1,254.0 1,165.5 1,224.3 1,270.9 1,328.8 1,488.0 4.0%
% change NM 6.2% -7.1% 5.0% 3.8% 4.6% Smartphones 41.1 45.4 56.6 93.5 127.9 151.5 181.1 14.1%
% change NM 10.5% 24.6% 65.2% 36.9% 18.4%
Source: Gartner, Company data, Credit Suisse estimates.
So what does this mean for an investor focused on the IT hardware sector? In Figure 2, we list the top ten key conclusions for the sector based on our extensive analysis. These highlights combined with valuation lead us to our current recommendations. Our high–conviction, Outperform-rated stocks are Apple, EMC, and HP, while our key Underperform-rated stocks are Dell and Lexmark. We initiate with a Neutral rating on IBM, NetApp and Xerox.

16 March 2011
IT Hardware 4
Apple—The Most Valuable Company in the World? We conclude that Apple’s competitive advantage in its software and hardware combined with the momentum around its ecosystem should be able to deliver outsized revenue/earnings growth of 50%/46% in FY10-12, significantly ahead of expectations (around 24% higher for FY12). Our EPS estimates for FY11/12 are $25.11/$32.49.
■ iPhone still the driver. Across the key smartphone success factors of software, services, product portfolio, distribution, brand, IPR, and chipset efficiency, we believe, three years after the launch of the iPhone, few competitors have managed to narrow Apple’s advantage. This means within this fast-growth industry (smartphone unit growth of 52%/32% in 2011/2012), Apple’s smartphone share should continue to rise to 20% in 2012 driving volumes of 72mn/112mn in FY11/12 with revenue of $47bn and $67bn.
■ iPad—addressing a $120bn market LT. Our proprietary analysis for tablets (takes into account factors such as regression analysis for long-term computing demand, pricing by tier, and cannibalization of multiple industries) highlights that the tablet market could rise to $120bn by 2015. Within this segment, we believe Apple will dominate, given aggressive pricing, time to market advantage and a software edge, maintaining share as high as 50% long term. This means that iPad should become a $34bn business by FY12. Further, our proprietary BOM analysis implies that GMs for this business will expand to 35% by end-FY11 from around 27% levels seen in FY10.
■ Still room for an extra $10 in EPS. We believe that a low-end iPhone, greater push into emerging markets, or enterprise traction could add $10 of EPS. Even beyond this, we see scope for Apple to leverage its ecosystem and its current installed base of 200mn (rising to 700mn over coming years) with revenue from advertising, broadcasting or perhaps the TV business.
■ Valuation. We arrive at our $500 target price using a combination of P/E, DCF, and HOLT® analyses. On our CY12 estimate, Apple trades on a P/E multiple (ex-cash) of 8.9x, which we believe is inexpensive, given the potential for earnings growth of 46% over the next two years.
EMC—Virtualization and Cloud Drive Growth Our positive outlook for secular end-market growth and strong competitive positioning should drive 20% earnings growth per annum. Our pro forma 2011 EPS is $1.50 and our 2012 EPS of $1.83 is 7% above the consensus, and we see 30% upside potential.
■ Share gainer in a fast-growing market. We expect the networked storage market to grow at a 10% CAGR in 2010-15, driven by explosive data growth. Second, within this market, we believe EMC will expand its leading 26% storage market share given it ranks first on our proprietary storage vendor scorecard (this was also well supported by the recent Credit Suisse IT Survey). We forecast incremental share, driven by gains in the midrange and low-end to drive robust double-digit revenue growth for several years.
■ Long-term guidance of 13%+ revenue growth looks conservative for three reasons. First, we see continued success in backup and recovery (Data Domain and Avamar combined are now over a $1bn/year business). Second, given virtualization as a trend seems to be accelerating, this bodes well for VMware and presents an inherent strategic advantage given EMC’s ~80% ownership. Third, we see the potential for solid traction for the recently closed Isilon acquisition, VPLEX and Greenplum solutions.
■ Operating margins: scope for modest expansion. We forecast OMs rising to 22.9%/24.6% in 2011/12 from 22% in 2010, driven mainly by stable gross margins owing to a software rich solution, richer mix, and SG&A leverage.
■ Valuation: 30% upside potential. Our target price of $34 is based on a combination of P/E, DCF, and HOLT® analysis and suggests upside potential of 30%. The implied P/E

16 March 2011
IT Hardware 5
multiple of 16x (ex-cash) is warranted, in our view, given strong visibility on growth and impressive free cash flow dynamics (consistent FCF conversion of over 100% over the last 5 years).
HP—A $6.00 Print We believe HP’s transition from a hardware-centric business model continues, with services, storage, and networking rising in the mix and driving group margins higher. This should enable the company easily to deliver $6 of EPS in CY12; therefore, we see compelling upside potential of 45%. (Our EPS estimates for FY11/12 are $5.36/$5.80.)
■ Services (33% of OI) resuming growth with scope for margin expansion. Despite the recent hiccup, we see services growth ahead. Our proprietary IT services demand forecast suggests that when compared to GDP growth, hardware/software attach or to corporate profits, global IT services are being under-consumed globally, providing a backdrop for accelerating revenue growth. Additionally, we see HP gaining share given positive exposure to faster-growing emerging markets and a robust end to end offering. Finally we believe current cost saving plans will drive FY11/12 segment margins to 15.5%/16.0% and to over 17% by FY14 (15.8% in FY10).
■ ESSN (20% of OI) benefits from networking. Within ESSN, even allowing for share declines in servers, we believe that end market growth in storage, combined with the ramp of networking should drive sustainable margins.
■ Three moves the new CEO should consider. (1) Re-invigorate the software segment, which contributes only 5% to profit and is a tenth the size of IBM’s software business, through hiring and M&A. Here the company’s cumulative FCF of $65bn over the next five years offers flexibility. (2) Drive an all-out price war to accelerate share gains in networking at Cisco’s expense, since segment margins, though lower than Cisco’s, are materially accretive to HP’s 24% gross margins. (3) Consider exiting the PC business in light of its commodity status and limited strategic benefits.
■ Valuation—compelling upside potential. HP currently trades at a P/E of 7x our CY12 EPS versus peers Dell/IBM at 9x/11x and relative to the stock’s five-year historical multiple (12x). Our $60 target price is based on a blended average of P/E, DCF, and Credit Suisse HOLT® analyses.
IBM—The Big Blueprint
IBM is successfully pursuing a combined hardware, software, and services strategy that, in our view, serves as a high-quality blueprint for the entire IT sector. This strategy should drive aggregate market share gains and allow for sustainable FCF of $15bn+ per annum, driving EPS of $21.95 by 2015 (above company guidance). However, we believe shares currently reflect this potential growth, and hence we initiate on IBM with a Neutral rating and TP of $175. (Our EPS estimates for CY11/12 are $13.21/ $14.88.)
■ Services (40% of Profits)—Well Positioned within a Recovering Market. Our services end demand model shows that, when compared to GDP, hardware/software sales, and corporate profits, IT services are being under consumed by the global economy. This suggests accelerating services revenue growth in coming years. Given a strong emerging market bias and a robust end-to-end offering, we believe IBM will gradually capture share. For PTI margins that have doubled in recent years to 14%, we see only gradual expansion, given changing deal structures (smaller), and rising competitive dynamics especially from offshore players, which will largely offset efficiency drives. As such, we model 18% margins for the Services business by FY15.
■ Software (48% of Profits)—an M&A Machine that Could Drive Upside. Our analysis suggests that software acquisitions (if successful as in the past five years) could add

16 March 2011
IT Hardware 6
$3 to long-term EPS (by 2015), making IBM’s current projection of $0.90 of incremental EPS from acquisitions conservative.
■ Valuation. With over 50% of incremental EPS coming from M&A and buybacks over the next five years, we believe the quality of growth is somewhat low. As such, while at a P/E of 11x our CY12 EPS, we believe shares do deserve to trade at a discount to the S&P. A blended average of P/E, DCF, and HOLT® suggests fair value of $175, implying only 8% upside from current levels, and hence our Neutral rating. We would become more constructive below $150 or with increased evidence of robust organic growth.
Xerox—Turning the Page to Services
While the transformational nature of Xerox’s acquisition of ACS in 2010 highlights the long-term secular issues in Xerox’s legacy printing business, we believe it was a smart move, as it positions the company in a (relatively) faster growing market. However, given limited upside potential of 16% to our target price, we initiate coverage with a Neutral rating. (Our EPS estimates for CY11/12 are $1.10/ $1.30.)
■ Services (45% of revenue)— the growth segment; watch the synergies. Our Global Services demand model shows when that compared to GDP, hardware/software sales, and corporate profits, IT services are being under consumed by the global economy. This will drive accelerating revenue growth in coming years. Within this context, we see faster growth in segments such as process management (52% of Services segment revenue) and slower growth in hardware maintenance and support (13% of Services segment revenue). In Services, we note that strong execution on synergy targets could drive upside to estimates.
■ Technology (48% of revenue)—muted market outlook offsets company positioning. We forecast the printer hardware to be flat and supplies market to grow at a 1% CAGR between 2010 and 2015. While the outlook for the end market is indeed uninspiring, Xerox’s exposure (limited to the laser segment), enterprise focus, and ranking on the proprietary Credit Suisse printer vendor scorecard suggests that the company is positioned to maintain/grow share. Further, a lead in Managed Print, which is a secular growth area within printing ($8.5bn market in 2010), is a bright spot.
■ Valuation—limited upside. Our price target based of $12, which suggests about 16% upside from current levels, is based on a combination of P/E, DCF, and HOLT® analyses and implies a P/E multiple of 9.2x (in-line with the 2-year historical discount to the market multiple) on our 2012 EPS of $1.30. Increased visibility on long-term synergy targets and evidence of faster organic growth would make us more constructive on Xerox shares.
NetApp—Solid Growth, Limited Margin Leverage ONTAP Despite our positive outlook for end-market growth and the company’s competitive positioning, we initiate coverage with a Neutral rating, given our view that limited operating margin leverage will cap midterm earnings momentum, which we think is critical for shares trading at a 22x NTM P/E multiple. Our pro forma FY11/FY12 EPS estimates of $2.05/$2.33 are 0%/4%, respectively, above the consensus.
■ Share gainer in a Growing Market. Relative to our expectation for an 8% LT CAGR for the storage market, we expect the segments that NetApp is focused on (mid-range) to grow at a faster 13% CAGR. This positions NetApp well, given over 70% revenue exposure to this faster-growing segment. This view is reinforced by a second place ranking (after EMC) on the Credit Suisse storage vendor scorecard, which ranks vendors across eight metrics we believe are important in the storage market. We

16 March 2011
IT Hardware 7
expect long-term share to expand to over 17% from about 10% in 2010, and as such, we model robust FY12/13 revenue growth of 20.5%/22.3%.
■ Operating Margin Leverage is Capped. While NetApp is inherently a mid- 20s operating margin business (versus ~19% in FY11), the company is investing to capitalize on current momentum. We believe this is the right strategy; however, this caps margin leverage NT. In FY12, excluding any impact from Engenio, we expect operating margins of 19.3%, on steady gross margins (owing to a software-rich offering) and spending growth.
■ Valuation. Our target price of $54 is based on a combination of P/E, DCF, and HOLT® analyses and implies a P/E multiple of 20x our CY12 EPS of $2.70. This reflects a healthy premium to the market (toward the high end of the five-year historic range). While a premium multiple is warranted given growth prospects, limited scope for midterm earnings momentum makes it challenging to argue for an even richer premium.
Dell—A Long Transition to the Enterprise We believe that Dell is in the midst of an ambitious transformation to become a more strategic enterprise player; however, we are concerned that this will take some time. Meanwhile, we see limited structural organic revenue growth, with only gradual scope for further margin expansion, and consequently, a lack of bottom-line growth. (Our FY12/13 EPS estimates are $1.65/$1.63.)
■ Three issues against long-term revenue growth. First, we see the PC industry, excluding tablets, declining 6% long term. Second, within this segment, we believe that Dell may continue to gradually cede market share, owing to a weak emerging market position and distribution. Last, owing to virtualization and increased competition potentially, we see Dell’s server business seeing flat sales at best. Even allowing for growth in storage and services, the long-term blended revenue growth is flat (down 0.2%).
■ Gross Margin ~21% long term at best. Based on our analysis of gross margins by segment, we believe there will be expansion from 19.1% to 20.6% long term, driven by improved mix. Given limited levels of further opex improvements, we estimate OMs of 6.8%/6.7% in fiscal 2012/13.
■ In need of a transformation, but lacking the financial firepower to compete. Simply put, Dell needs a transformation, and the issue is that this will involve M&A in the software, services, and storage areas. Here, not only is the current track record mixed, but the company will also need to compete for targets with peers such as IBM, Hewlett-Packard, Oracle, and Cisco that have deeper pockets, and more attractive platforms.
■ Valuation, more of a relative Underperform. Our price target is $16, giving limited downside risk based on DCF, HOLT®, and P/E analysis and making Dell a relative Underperform. If the stock reverts to its historical multiple of 9x, the downside is $15 implying limited absolute downside.
Lexmark—Focus to Return to Secular Challenges Our 2011-12 EPS estimates of $4.44 and $4.16 are 6% and 12%, respectively, below the consensus. We expect negative EPS momentum through the year to drive underperformance, as cyclical tailwinds that the company enjoyed in 2010 fade and as secular issues related to the challenged outlook for market growth and the company’s positioning relative to peers come back into focus. Consequently, we are initiating coverage with an Underperform rating and a $35 price target.

16 March 2011
IT Hardware 8
■ Focus to shift to secular market challenges. We expect the printing hardware and supplies market to grow at a 0%/1% CAGR through 2015. On hardware, our outlook is driven by a fading refresh cycle near term, while on supplies (the main driver of profits), our view is driven by a shrinking installed base. We expect all the growth to come from developing regions.
■ Declining hardware and supplies revenue. Given limited developing market exposure and a fourth-place ranking (of four vendors) on the Credit Suisse printing vendor scorecard, we expect hardware revenue to decline. In addition, despite higher usage, driven by a focus on laser and business inkjets, we expect a shrinking installed base to drive declining supplies revenue.
■ 2012 earnings power closer to $4, not $5. Declining revenue growth will drive operating margins lower, in our view, with risks to margins being to the downside, as more investments are likely as the company addresses end-market concerns. As such, we expect the 2012 consensus estimate to move closer to our $4.16 estimate as the year progresses.
■ Valuation – a relative underperform. Our target price of $35 is based on a combination of P/E, DCF, and HOLT® analyses and implies a P/E multiple of 8.4x our 2012 EPS of $4.16. We note that over the last 2-years, Lexmark shares have traded at a 25%-35% discount to the market.

16 March 2011
IT Hardware 9
Ten Themes for the Next Five Years In this section, we lay out our long-term outlook for the $1.2tn IT industry (which includes communications equipment, mobile computing products such as tablets, etc.). Clearly, in such a significant industry, which accounts for ~2% of global GDP, the dynamics of supply, demand, and competition are especially complex in a backdrop of convergence and consolidation, as evidenced by recent M&A activity. We have attempted to develop a framework to project demand and think about which vendors are best positioned to capture value within the industry over time. As such, we arrive at ten important conclusions:
Figure 2: Ten Themes for the IT Industry 1) Cyclical tailwinds for now,
structurally 4% growth Our analysis of macroeconomic and corporate environment, combined with our proprietary IT Survey suggests that total IT industry (PCs, servers, storage, printing, and services) will continue to see cyclical recovery in 2011/2012, with industry revenues growing to $1.3tn, implying around 4-5% growth
2) Compute demand drives tablet market to $120bn long term
Our addressable market analysis for tablets (based on PC forecasts by price point) suggests that the tablet market could reach 298mn units by 2015 (42% of total PC units), with revenues of $120bn
3) Smartphones set to cross 1bn unit mark by 2015
Based on our proprietary affordability analysis, we estimate that the smartphone market will grow from 297mn units in 2010 to 594mn/1.04bn units in 2012/2015, implying a CAGR of 28.5% over the next five years
4) Storage has several secular growth drivers
Driven by accelerating unstructured data growth, server virtualization, and regulatory/compliance requirements, we believe storage will become increasingly important. As such, we expect storage (hardware, software, and services) revenue to grow at a healthy 7% per annum to $65bn by 2015
5) Services set for a gradual recovery
Based on our view that services is being underconsumed globally, we are looking for around 5% top-line growth for the services market ($780bn+ in revenue in 2010) over the next five years
6) Lackluster outlook: servers, traditional PCs, printing
We see muted outlook for servers and traditional PC markets, as we expect revenue declines at CAGRs of 2% and 6%, respectively. For the printer market, we expect revenue to grow only 1% in 2010-2015 owing to a shrinking installed printer base
7) Radical changes to the PC value chain?
We believe that strong tablet unit and revenue growth will come at the expense of traditional PC vendors. With Apple and Android having innovative platforms, industry profit share of vendors like Microsoft and Intel will come under pressure in the PC market
8) Competition for the datacenter . . .heating up
With an accelerating trend to become an end-to-end solution provider, we are seeing signs of traditional partners now competing head to head, with Cisco's push into the server market, Oracle's move into the server and storage markets, and HP's efforts in the networking space
9) M&A : sector is ripe for continued consolidation
Our analysis for gross cash, net cash, and R&D investments at top 50 technology companies over time suggests that M&A activities are likely to continue in the sector, with IBM, HP, and Dell likely to be most active
10) The cloud may not be as incremental as you think
Recently announced cloud offerings from IBM, HP, and Dell are fundamentally similar to infrastructure outsourcing services already being provided by these companies. As such, we expect the impact of cloud may not be as incremental as perceived by the market
Source: Company data, Credit Suisse estimates. Note: Intel covered by Credit Suisse Semiconductor analyst John Pitzer, Microsoft & Oracle covered by Credit Suisse Software analyst Phil Winslow, Cisco covered by Credit Suisse Communication Infrastructure analyst Paul Silverstein.
1) Cyclical Tailwinds for Now, Structurally 4% Growth Much of our analysis deals with the microeconomics of the IT hardware sector in terms of the fundamental demand drivers of servers, storage, services, and PCs. However, for an industry that represents nearly 50% of U.S. investment in private fixed assets, the macroeconomic environment is a key consideration. After economic factors such as GDP growth, corporate health, CEO confidence, and other leading indicators are taken into account, we conclude that there is a robust economic backdrop that lays the foundation for growth in IT spending at least through 2011. This will likely be a continuation of the cyclical recovery seen in 2010, and we base our conclusion on several factors:

16 March 2011
IT Hardware 10
Figure 3: G4 Investment % of GDP Figure 4: G4 Nonfinancial FCF % of GDP
15%
16%
17%
18%
19%
20%
21%
22%
23%
1981 1986 1991 1996 2001 2006 2011
G4 investment shareof GDPTrend
0.0%
0.5%
1.0%
1.5%
2.0%
2.5%
3.0%
3.5%
4.0%
4.5%
Q4 1995 Q4 1998 Q4 2001 Q4 2004 Q4 2007 Q4 2010
G4: Non financialcorporate FCF/GDPAverage
Source: Datastream, Credit Suisse estimates. Source: Datastream, Credit Suisse estimates.
A conducive macroeconomic and corporate backdrop. As depicted in Figure 3, the last few years have seen an unsustainable reduction in fixed investment as a percentage of GDP; returning to trend alone will result in a positive uptrend in tech spend. A combination of strong balance sheets, cash at record levels (in the U.S. at 6% of assets), and robust FCF (at 4% of GDP, the highest levels since 1995), combined with increasing levels of business confidence, means that corporations have the continued firepower to invest for growth; this is noted in Figure 4, Figure 5, and Figure 6. Further, G4 business investment stands at 16% of GDP (Figure 3), one of the lowest levels on record, yet tech accounts for a significant 40%+ of investment spending. The macroeconomic drivers behind corporate discretionary spending are very appealing and will prove to be supportive for IT spending in the coming years.
Figure 5: U.S. Nonfinancial Corporates—Cash as a % of Total Assets
Figure 6: U.S. Nonfinancial Corporates—Cash as a % of Market Capitalization
2.0%
2.5%
3.0%
3.5%
4.0%
4.5%
5.0%
5.5%
6.0%
6.5%
1953 1962 1972 1982 1991 2001 2011
cash % share of corporate assets
Average = 3.7%
2%
4%
6%
8%
10%
12%
14%
16%
18%
20%
22%
1952 1957 1961 1966 1971 1976 1981 1986 1990 1995 2000 2005 2010
cash $ share of market cap
Average = 9.2%
Source: Datastream, Credit Suisse estimates. Source: Datastream, Credit Suisse estimates.
Tech is being underconsumed. Having analyzed levels of technology, net investment relative to GDP, long-term trend, and depreciation, we find that levels of tech investment remain structurally below long-terms levels, even after the recovery in 2010. (See Figure 8). For example, net tech investment (capex minus depreciation to GDP) normally runs at an average of 0.62% with a peak to trough of 1.4%; however, it currently languishes at only 0.1%. This relative underconsumption of tech in major economies adds to the argument that spending should continue to recover in 2011. In fact, net tech investment in 2009 for IT hardware (Figure 7) was negative, implying that assets were depleted. Given a similar recovery in 2002, and combined with our proprietary IT forecast models, we are predicting 8% IT capex growth in 2011 and 5% in 2012, bringing us to prerecession 2007 levels of net technology investment as a percentage of GDP (dashed line in Figure 8). Furthermore, as we discuss in our macroeconomic analysis, other similar forward indicators, such as CEO confidence, corporate profits, the ISM index, and durable goods orders imply positive momentum ahead.

16 March 2011
IT Hardware 11
Figure 7: Investment in Hardware Turned Negative in ‘09 net investment in IT hardware and software as % of GDP
Figure 8: A Strong Potential Bounce in Investment net investment in IT as % of GDP
-0.1%
0.0%
0.1%
0.2%
0.3%
0.4%
0.5%
0.6%
0.7%
0.8%
0.9%
1980 1983 1986 1989 1992 1995 1998 2001 2004 2007
% o
f U.S
. GD
P
HW
SW
0.0%
0.2%
0.4%
0.6%
0.8%
1.0%
1.2%
1.4%
1980
1981
1982
1983
1984
1985
1986
1987
1988
1989
1990
1991
1992
1993
1994
1995
1996
1997
1998
1999
2000
2001
2002
2003
2004
2005
2006
2007
2008
2009
2010
E
2011
E
2012
E
% o
f U.S
. GD
P
Net technology investment in PCs, perip heral, communication equipment and software Histor ical average
Long-term average: 0.62%
Estimate
Source: BEA, Credit Suisse estimates. Source: BEA, Credit Suisse estimates.
Our proprietary Credit Suisse IT Survey is supportive of continued cyclical tailwinds. Based upon our survey of top IT decision makers at major global corporations, we find that some 63% of respondents expect IT spending to increase, with a consistent response across all regions. In aggregate, IT headcount growth is expected to grow some 6%, with spending increasing at significantly faster rates than in 2010; the fastest growth will be seen in areas such as services, storage, mobile devices, and software.
Figure 9: Credit Suisse IT Survey—What Are Your Year-Over-Year Growth Expectations for Your IT Spend in the Following Areas in 2011?
-2.0% -1.0% 0.0% 1.0% 2.0% 3.0% 4.0%
Printing
Servers
Networking
Security
PC
Mobile Devices and Services
Services
Storage
Source: Credit Suisse IT Survey, February 2011.
Beyond the cycle, a 4% growth industry. Beyond the cyclical component of the recovery in 2011 and 2012, we believe that revenue growth will be around 4% per annum, rising to a $1.3tn industry by year-end 2012 for the IT sector (PCs, servers, storage, printing, services). We note that each of our industry models are built upon specific proprietary analysis rather than simply looking at historical levels of revenue growth. Within the segments, we believe that attractive growth segments are tablets, smartphones, and IT storage; we see muted revenue growth for traditional PCs (ex tablets) and servers.

16 March 2011
IT Hardware 12
2) Compute Demand Drives Tablets to $120bn Market We fundamentally believe that PC projections that are based on forecasting seasonality for desktop, notebook, and netbook demand are flawed and subject to excessive volatility. We have developed what we believe is a unique alternative to forecasting demand for consumer and corporate compute power (all product categories):
Consumer PC growth of 17% (including tablets) long term. We have developed what we believe is the first econometric model for consumer PC demand using cross-sectional analysis across 42 countries and based upon over 1,000 data points. We find that there is a statistically significant relationship between PC affordability and the PC penetration per capita, (with R-squared ranging between 71% and 86% from our multiple regressions). Based on these fundamental relationships, we demonstrate that the elasticity of demand remains above 1.0. Simply put, this means that a move to lower price points will drive incremental volume. Also, based on an extrapolation of product teardowns, we demonstrate that an average quality low-end PC is plausible at a $200 ASP within the next five years. In turn, what this means is that the installed base for PCs will rise to 1.2bn from 680mn last year, with consumer PC volumes growing at a 17% CAGR (2% ex-tablets) LT.
Commercial PC volumes to show robust growth in 2011-12, driven by a corporate refresh. We estimate that the average age of the installed base currently is six years, which to us suggests that replacement volume will recover in the near term. Furthermore, our proprietary Credit Suisse IT Survey (polling 60 top IT decision makers at global firms) suggests a further boost, given the transition to Windows 7 and new hardware releases (more powerful specs and chip releases). As PC penetration of the labor force continues to increase, we forecast commercial PC volumes to grow 17%/16% in 2011/12 (13%/10% ex-tablets) and 11% long term (5% ex-tablets).
Tablets are different for many supply and demand considerations. The tablet market is inherently challenging to forecast, given its recent introduction. From a fundamental point of view, we do believe tablets are different, and there are several reasons why tablets will have a more meaningful impact on the PC industry than netbooks historically. These include: (1) optimization for media consumption, (2) numerous applications (app ecosystems), (3) hundreds of industry-specific uses (restaurants, healthcare, education etc.), (4) mobile operating systems that are optimized for the smaller form factor, and (5) leverage from new distribution channels (carriers) and (6) instant on/longer standby.
Tablets represent a $120bn market long term. We acknowledge that tablets are unlikely to replace all computing needs. For this reason, we adopt a price point-based approach that assumes that demand for a given level of computing necessity can be approximated by price level. We use our global PC forecast by price point to determine the addressable market for tablets; we conduct a penetration analysis at each of these tiers. For instance, a low-end PC for the consumer market at $300-499 can be better served by tablets (63% LT) versus the high-end $1,000+ category (we assume 0%). Likewise, we perform a similar application-based approach for the corporate market. We conclude that the tablet market could represent a $120bn market by 2015, with units reaching 298mn (or 42% of total PCs). Furthermore, while we believe that over 50% of tablet volume will be consumer based, we are surprised by the degree to which corporate adoption appears to be taking hold; this is further confirmed by results from the Credit Suisse IT Survey as seen in Figure 10 and Figure 11.

16 March 2011
IT Hardware 13
Figure 10: Tablet Adoption—High Enterprise Interest Question: Is your company currently deploying tablet devices, or might you consider deploying tablet devices sometime in the next 5 years?
Figure 11: 30% of Commercial PC Demand in 3 Years? Question: What % of your global employee base have/will have a tablet device (supported by enterprise) at the following points in time?
No25%
Yes75%
0%
5%
10%
15%
20%
25%
30%
35%
Currently 1 year from now 2 years from now 5 years from now
Source: Credit Suisse IT Survey, February 2011 Source: Credit Suisse IT Survey, February 2011
3) Smartphones Set to Cross 1bn Unit Mark by 2015 Based on our proprietary model, which takes into account the total cost of ownership (TCO) for a smartphone, income distribution, and penetration of the addressable market, we conclude that the addressable market for smartphones could be as high as 2bn longer term. We define TCO as the upfront cost that a consumer pays for a smartphone combined with the annual service cost for a basic voice and data plan associated with that device. Our smartphone model suggests that by 2015, the global smartphone subscriber base will reach 1.9bn, (i.e., 98% of the 2.0bn addressable market). Based on this long-term estimate, we believe that smartphone volumes will grow from 297mn in 2010 to 594mn/1.04bn in 2012/2015, implying a CAGR of 28.5% over the next five years. Despite seeming optimistic, our cannibalization analysis and handset price point work still suggest that the risks are to the upside.
Figure 12: Smartphone Market—Our Long-Term Forecasts Are Based on Three Different Methodologies Analysis Methodology Result Implication
Total Cost of Ownership
Proprietary Credit Suisse model that forecasts the smartphone market using the TCO (total cost of ownership) of a smartphone, income distribution, and penetration of the addressable market
2.0bn addressable market for smartphones by 2015, up from 0.7bn in 2009
By 2015, we estimate 2.0bn people to be potential smartphone subscribers, and we assume 1.9bn smartphone subscribers, which implies about 98% penetration of the addressable market. Hence, we believe our smartphone subscriber estimates could prove conservative
Cannibalization of consumer electronics devices
Forecasting smartphone market based on incremental opportunity to cannibalize other consumer electronic devices such as MP3 players, gaming consoles, PNDs, cameras, and midend phones
988mn smartphone units in 2015 based on smartphones cannibalizing other CE device segments
Our 1.04bn estimate for smartphone volumes by 2015 looks achievable based on our cannibalization work; this suggests that smartphone volumes could be as high as 988mn
BOM reduction and price band analyses
Looking at smartphone market based on bill-of-materials reduction for a midend smartphone and how quickly smartphones could penetrate lower price tiers
1.04bn smartphone units in 2015 based on the BOM reduction and price band analyses
The 1.04bn smartphone unit number by 2015 is again in-line with our published volume forecast based on TCO and affordability analysis
Source: Credit Suisse estimates.

16 March 2011
IT Hardware 14
4) Storage Has Several Secular Growth Drivers We project the storage hardware, software, and services market ($47bn in 2010) to grow at a healthy rate of 7% per annum to over $65bn in 2015. In particular, demand for storage capacity is being driven by accelerating unstructured data growth, driven by the explosion of digital content, server virtualization, and regulatory and compliance requirements. As such, we expect storage will become increasingly important, not only as enterprises cope with rapid data growth, but also as they continue to optimize their virtualization implementations.
Figure 13: Virtual Machines Will Increasingly Contribute to Unstructured Data Growth
0%
10%
20%
30%
40%
50%
60%
70%
1 year 3 year 5 year
IDC structured data IDC unstructured data CS virtual machine data
Source: IDC, Credit Suisse IT Survey. Note: IDC 5-year CAGR extrapolated from 4 years.
Within the storage hardware market, there continues to be an ongoing secular shift from direct attached (to the server) architectures toward networked storage architectures. This means that networked storage (SAN and NAS), which accounted for 83% of storage hardware spending in 2010E (up from 62% in 2005), will rise to 92% of storage hardware spending by 2015E. Even beyond growth, we believe the market represents an attractive and strategically important segment, as software and services collectively account for 56% of the overall storage market opportunity. In turn, this explains the frenzy of M&A activity in the space by all major vendors, including HP, Dell, IBM, NetApp, and EMC over the past five years.
5) Services Set for a Gradual Recovery While companies like IBM, HP, and Dell have historically been viewed as hardware companies, the actual end market for IT services dwarfs the hardware market opportunity, as services is over a $780bn market, some 2x the value of hardware procured. We conclude that the macro backdrop for IT services is positive in the long term. Over the next five years, whether we look at IT spending relative to GDP levels, attach rates to hardware and software, or corporate revenue forecasts, (based on S&P forecasts) we find that IT services are being underconsumed globally; this points to accelerating growth ahead. For example, global IT services as a percentage of global GDP are 1.3%; however, in 2000-09, it has risen consistently from 1.07% to 1.32% and hit a high water mark of 1.37% in 2008. If this trend resumes, then the CAGR in the services market would be 5.8% per annum. (We are forecasting slightly lower annual growth of 4.9% during the same time period.) Within this context, we see faster growth in segments such as process management and slower growth in segments such as hardware maintenance and support.

16 March 2011
IT Hardware 15
Overall, after limited revenue growth in IT services in 2010, we believe that 2011 will continue to show late cycle characteristics.
6) Lackluster Outlook—Servers, Traditional PCs, Printing Servers Anemic Server Market Revenue Growth Ahead
We believe that overall server market revenue will decline at a 2% CAGR in 2010-15, declining to $44bn by 2015. In particular, the x86 market (98% of units and 65% of revenue) has enjoyed strong growth in 2010 (sales were up some 29% in 2010). This is attributed to both a cyclical recovery and a very substantial x86 processor redesign. Going forward, we expect revenue CAGR of -2% in 2010-15E, with the 8% long-term growth in the 2-way under $2,000 category (owing internet traffic, Web-based applications, and high-performance computing workloads) being more than offset by a 3% long-term revenue decline in the 2-way above $2,000/4-way and above categories owing to the impact of server virtualization. We would note that, in the latter category, lower volumes are mitigated by higher overall ASPs, which mitigate the revenue decline for virtualization-focused systems.
PC Ex-Tablets—Lackluster Prospects
Given our view that tablets will represent 42% of computing needs longer term, unit and revenue growth in this segment will be substantial. However, excluding tablets, we believe the traditional PC market will only grow a mere 3% in unit terms and will actually decline 6% in revenue terms to $172bn in 2015 from $238bn in 2010. We expect particular weakness in desktop and netbook shipments. Simply put, we believe that tablets will be able to address lower-end computing needs, especially in the consumer market.
Printing—a Flat Market
We expect that the $51bn printer hardware market (last year) will see flat growth long term. Following two years of declining shipment growth (a 6% decline in 2008 and a 14% decline in 2009), the printing hardware market benefited from a refresh cycle in 2010 that resulted in overall shipment growth of 8% and overall revenue growth of 5%. Within this, we believe the shift to multifunction devices, and away from single-function printers and standalone copiers, will continue. Overall, we expect flat MFP and single-function printer revenue growth long term, while revenue from single-function devices will remain flat through 2015. Our outlook for the $73bn supplies market that generates the bulk of the printing industry’s profits is equally muted. We expect supplies industry revenue to also grow at a 1% CAGR from 2010 to 2015 owing to a shrinking installed base, which will offset more pages-printed-per-device.
7) Radical Changes to the PC Value Chain? A clear conclusion for the entire PC value chain is that the combination of strong tablet unit growth and revenue growth will come largely at the expense of traditional PCs. Combined with the share gains by Apple and the potential success of Android, this means that the traditional value chain in the PC industry may see radical change ahead. An important supply side consideration is the deficiency that currently exists in the Intel and Microsoft platforms for tablet use. Owing to innovation from platforms including Android, the tablet market has little dependence on the Wintel platform, and will have a more competitive processor market. Indeed as shown in Figure 14, this platform accounts for 50-80% of value and has done so consistently over the past several years.

16 March 2011
IT Hardware 16
Figure 14: Wintel Operating Profit Share of the Industry Has Been 66% on Average
0%
10%
20%
30%
40%
50%
60%
70%
80%
90%
100%
2005 2006 2007 2008 2009Wintel operating profit share Others operating profit share
5-year average Wintel profit from PC industry: 66%
Source: Company data, Credit Suisse estimates.
How value share will evolve in the industry is hard to predict; however, we believe that vendors such as Apple or HP are attempting a more vertically integrated approach to tablets. Traditional smartphone vendors including Samsung and Motorola are aligning themselves with the Android platform. The tablet market’s share of the computing value chain may eventually become similar to the smartphone market. The contrast is startling; whether the actual branded hardware vendors vertically integrate or otherwise, they may have some 90% share of value in this industry. In the PC market, the equivalent portion is 20%.

16 March 2011
IT Hardware 17
Figure 15: The Operating Profit Share of the Smartphone Industry Is different than the PC Industry, Given the Nonexistence of a Chip/Software Duopoly (Wintel)
0%
10%
20%
30%
40%
50%
60%
70%
80%
90%
100%
Handset vendors PC vendors
Ope
ratin
g pr
ofit
shar
e of
indu
stry
*
Apple
Nokia
Samsung
RIM
HTC
Qualcomm
Other chipset vendorsEMS vendors
Apple
HP
DellLenovo
Acer
Microsoft
Intel
EMS vendors We compare the handset and PC industries* to illustrate the wide disparity in how profits are shared across the supply chain/ vendors. Here we make the following points:
1) The top five handset vendors (by profit) generate nearly 90% of the industry's profits, vs. only 20% for the PC industry.
2) Software is integrated at the vendor level for handsets/ smartphones but largely owned by Microsoft in the PC industry. As such, Microsoft alone accounts for ~35% of industry profits.
3) Handset vendors have choice of CPU (Qualcomm, Texas Instruments, NVIDIA, Marvell etc) whereas Intel predominately controls supply for the PC industry. For this reason, chipset vendors in the handset industry only account for some 10% of industry profits, vs. over 40% for Intel in the PC industry.
Given tablet vendors will have a choice of OS and chipset provider, we think the tablet industry evolves in a similar way to handsets, with vendors sharing more of industry profits and vendors like Microsoft and Intel losing profit share.* Industry as top five hardware vendors, software vendors, chipset providers and EMS companies
1
1
90%
20%
2
3
35%
40%3 10%
Source: Company data, Credit Suisse estimates.
We would highlight that, from the Wintel perspective, the previously mentioned dynamics are only confined to the tablet portion of the market. Clearly, there will be a significant portion of revenues and profits for which the platform will essentially remain untouched.
The alternative argument
To be clear, CS Intel analyst John Pitzer and Microsoft analyst Phil Winslow have a more optimistic view for the competitiveness of both companies in the PC market, but specifically for their potential in the tablet market based upon several factors:
Improvements coming from Oaktrail and Medfield. Intel has demonstrated several Oak Trail (32nm integrated SoC for Windows) based 8-10” tablets and gaming consoles to launch in 1H11 from several OEMs (Dell, Samsung, Toshiba, Acer, Asus) with multiple OS (Windows 7, Android, MeeGo). The company have recently reported 35 tablet wins with the first Android based tablets in 3Q11. John Pitzer believes that Intel will improve power consumption characteristics of its products, focused on the tablet market at 32nm (products expected in 2H) and further in 2012 with 22nm ramp for SOCs (Medfield).
Windows 8 in 2012. In mid-February, Android Central posted supposedly “leaked” screenshots of a Dell presentation slide deck depicting a tablet roadmap that targets a January 2012 release of a Windows 8 tablet. To date, Microsoft has not specified a release date or a detailed development timeline for Windows 8 but noted the traditional 24-36 month development cycle at CES 2011 this past January. Given that Microsoft reportedly compiled Windows 8 Milestone 2 in December, the Credit Suisse Software Team believes that a beta of Windows 8 may be released as early as the September

16 March 2011
IT Hardware 18
quarter, and they continue to expect that Windows 8 will be released in 2012. Though the Credit Suisse Software Team expects enterprise adoption of Windows 8 to be considerably lower than Windows 7 given the strong adoption of Windows 7 and the short release period between the two operating systems, the team views Windows 8 as a meaningful release for Microsoft in terms of the company’s positioning in the consumer market—particularly in the tablet segment. The Credit Suisse Software Team believes that Windows 8 will not only support ARM in addition to x86 but will also be available with three user interfaces for OEMs to chose from, one of which will be tablet-optimized based on Microsoft’s Metro UI, which serves as the interface for Windows Phone 7 and Xbox. The Credit Suisse Software Team also expects meaningful improvements in power consumption and boot time with the release of Windows 8, which are important characteristics in the tablet market. Therefore, the Credit Suisse Software Team ultimately believes that Microsoft will have a much larger positioning in the tablet market than Wall Street currently anticipates, especially in the still nascent corporate tablet market.
Integrated Versus Fragmented Debate. Apple is unique in their integrated approach – they sell a system in which they own all of the software IP and critical components of the hardware IP. The opposite business model is in the PC market if Dell, Microsoft and Intel were all the same company. In stark contrast, Apple’s competitors in both the smartphone and tablet markets are forced to choose from multiple vendors increasing the complexity with regards to software and hardware integration. While Google’s Android (covered by Credit Suisse Entertainment, Internet, and Cable DBS analyst Spencer Wang) is becoming the de facto OS in these new markets, the integration of software to silicon is significantly complicated by a highly fragmented market in the apps processor arena. In our opinion the integration issues only become more complex as you move from smartphone to tablet – from a 4” to a 10” screen, OS and silicon solutions need to be more robust and more highly integrated. In our opinion it is partly the reason for the lack of 10” tablets coming to market in 4Q10/1Q11 in favour of less robust, and in our opinion, less interesting 7” tablets. This move towards standards could make Intel more viable in the tablet market.
8) Competition for the Datacenter... Heating Up An accelerating trend in the sector is the desire for large IT vendors, including HP, IBM, Cisco, Oracle, and Dell, to become end-to-end solution providers or sole suppliers for the complete solution within the datacenter, including networking, software, storage, servers, and services. The driver of this strategy is the vendors’ desire to capture incremental customer wallet share as data centers are rearchitected for private or public cloud implementations. As a result, we see traditional partners now competing head to head, most clearly demonstrated by Cisco’s move into the x86 blade server market with its UCS offering, Oracle’s push into servers and storage with Exadata and Exalogic, and HP’s move into networking. While no one vendor has yet mastered the complete stack of hardware, software, and services (as shown in Figure 16), with many of the products and strategies still evolving, we would highlight the following in order to determine the impact on the technology industry:

16 March 2011
IT Hardw
are 19
Figure 16: Competition for the Datacenter is Driving More Convergence
FAS10%
PowerVaultCompellant
10%
Partner0%
Partner0%
Partner0%
Symmetrix/Celerra/
CLARiion/Centera – 26%
StorageWorks11%
IBM Systems Storage
13%
StorageTek/ZFS/Exadata
3%
Partner0%
Partner0%
Partner0%
Partner0%
Nexus/Catalyst
74%
Partner0%
ProCurve/3Com
9%
Partner0%
Partner0%
Partner0%
PowerEdge15%
Partner0%
Partner0%
UCS1%
Partner0%
ProLiant/Integrity
31%
System z/p/x31%
X86/SPARC/Exadata/Exalogic
7%
Akorri1%
Partner0%
Hyper-V13%
Partner0%
Partner0%
VMware41%
Partner0%
PowerVM6%
Oracle VM1%
Partner0%
Partner0%
Windows63%
Partner0%
Partner0%Partner
0%
HP-UX/NonStop/Ope
nVMS4%
AIX/zOS7%
Solaris/Oracle
UnbreakableLinux1%
Partner0%
Partner0%
SQL Server19%
Sybase ASE/IQ3%
Partner0%
Greenplum1%
Partner0%
DB224%
Oracle 11g/MySQL
43%
Partner0%
Partner0%
.NET3%
NetWeaver1%
Partner0%
Partner0%
Partner0%
WebSphere45%
Fusion Middleware
27%
Partner0%
Partner0%
Visual Studio11%
PowerBuilder
3%
Partner0%
SpringSource
0%
Quality Center1%
Rational21%
Java Development
Tools20%
Partner0%
Partner0%
MicrosoftDynamics
14%
Business Suite 77%
Partner0%
Partner0%
Partner0%
Lotus ECM2%
Applications UnlimitedFusion
Applications 5%
On Command2%
Kace1%
System Center3%
Partner0%
Cisco Works1%
Ionix6%
OpenView/Mercury/Opsware
5%
Tivoli10%
EnterpriseManager
1%
FAS10%
PowerVaultCompellant
10%
Partner0%
Partner0%
Partner0%
Symmetrix/Celerra/
CLARiion/Centera – 26%
StorageWorks11%
IBM Systems Storage
13%
StorageTek/ZFS/Exadata
3%
Partner0%
Partner0%
Partner0%
Partner0%
Nexus/Catalyst
74%
Partner0%
ProCurve/3Com
9%
Partner0%
Partner0%
Partner0%
PowerEdge15%
Partner0%
Partner0%
UCS1%
Partner0%
ProLiant/Integrity
31%
System z/p/x31%
X86/SPARC/Exadata/Exalogic
7%
Akorri1%
Partner0%
Hyper-V13%
Partner0%
Partner0%
VMware41%
Partner0%
PowerVM6%
Oracle VM1%
Partner0%
Partner0%
Windows63%
Partner0%
Partner0%Partner
0%
HP-UX/NonStop/Ope
nVMS4%
AIX/zOS7%
Solaris/Oracle
UnbreakableLinux1%
Partner0%
Partner0%
SQL Server19%
Sybase ASE/IQ3%
Partner0%
Greenplum1%
Partner0%
DB224%
Oracle 11g/MySQL
43%
Partner0%
Partner0%
.NET3%
NetWeaver1%
Partner0%
Partner0%
Partner0%
WebSphere45%
Fusion Middleware
27%
Partner0%
Partner0%
Visual Studio11%
PowerBuilder
3%
Partner0%
SpringSource
0%
Quality Center1%
Rational21%
Java Development
Tools20%
Partner0%
Partner0%
MicrosoftDynamics
14%
Business Suite 77%
Partner0%
Partner0%
Partner0%
Lotus ECM2%
Applications UnlimitedFusion
Applications 5%
On Command2%
Kace1%
System Center3%
Partner0%
Cisco Works1%
Ionix6%
OpenView/Mercury/Opsware
5%
Tivoli10%
EnterpriseManager
1%Management
Applications
Application Development & Deployment
Middleware
Database
Operating
System
Virtualization
Servers
Networking
Storage
ORACLE IBM HP EMC CISCO SAP Microsoft DELL NETAPP
Market Share Per Company w/ Product Name
$53B
$130B
$16B
$21B
$34B
$3.5B
$49B
$21B
$21B
$65B
Technology Market
Category Size
Source: Company data, Credit Suisse estimates

16 March 2011
IT Hardware 20
Bundling Versus Best-of-breed, Purchasing Patterns Will Not Shift Over Night
Few would doubt the strength of Cisco or Oracle’s salesforce or distribution. The question is whether bundled or best-of-breed solutions are preferred. While the debate around this is not a new issue, we would highlight, as noted in Figure 17 and Figure 18, that at least from a purchasing perspective, there appears to be a strong bias toward best–of-breed products. In the Credit Suisse IT Survey, some 67% of IT decision makers (Figure 17) noted a preference for best-of-breed versus purchasing from one vendor.
Figure 17: 67% of Respondents Prefer Best-of-breed Question: If you were to build (or currently have) an internal private cloud, you would:
Figure 18: 43% of Respondents Don’t Want 1 Supplier Question: In 2014, if you could choose to purchase the majority of your IT hardware/software/services from one vendor, who would it be?
Choose a single vendor that could provide all of the
elements - regardless of cost
8%
Choose a single vendor that could provide all of the
elements - only if it was cheaper
23%
Build a solution from several best of breed hardware, software,
and services vendors67%
Other:2%
I don't agree with the "converged
infrastructure" or "one IT supplier"
notion43%
HP18%
IBM13%
EMC/VMware12%Microsoft
7%
Oracle0%
Cisco0%
Dell3%
Apple2%
Other2%
Source: Credit Suisse IT Survey, February 2011. Source: Credit Suisse IT Survey, February 2011.
Exadata and Exalogic Are Likely to Have Some Impact
As noted by Credit Suisse Software Analyst Phil Winslow (noted in the reports Dr. Exalove, Part I: Or How I Learned to Stop Worrying (about Sun) and Love Exadata, dated 12 October 2010 and Dr. Exalove, Part II: Or How I Learned to Stop Worrying (about Sun) and Love Exalogic Too, dated November 23, 2010), due to Oracle’s strength in both database and middleware software and, a growing market share in enterprise applications, the Credit Suisse Software Team believes that Oracle continues to build a robust and growing pipeline for the Oracle Exadata Database Machine and that Oracle’s appliance strategy—from Exadata to Exalogic—positions Oracle to be a disruptive force in the server, networking, and storage hardware markets. As a result of Oracle’s strength in the database layer, the Credit Suisse Software Team believes that Oracle is uniquely positioned to increase server performance and lower storage hardware costs through innovation in the software stack – this will put pressure on competing hardware vendors.
Oracle’s Exadata product is often thought of as the Oracle Sun Database Machine, as it combines Sun database and storage servers, storage disks, and Oracle database software into an integrated system that is optimized for running Oracle’s market-leading database software. Theoretically, these advantages make Exadata well suited for OLTP applications and data warehousing, especially where Oracle database software is the preferred solution. Our survey highlighted several key conclusions on Exadata:
Significant awareness, but considered expensive. There is significant awareness of the Exadata solution, as demonstrated by nearly 40% of survey respondents having already evaluated the product (Figure 19), but the majority of respondents on average do not intend to purchase the product in the near term (Figure 20). Oracle clearly targets Exadata at the company's database software installed base. Therefore, because the results detailed in Figure 20 include both customers and non-customers of the Oracle Database, Figure 20 likely understates the potential demand within the Oracle Database installed

16 March 2011
IT Hardware 21
base for Exadata. Given that convincing a customer of IBM's DB2 database to switch to Exadata represents a much more challenging sales process (given that the customer much migrate its data from one RDBMs to another) as compared with existing Oracle Database customers, who can more easily migrate the software to the Exadata platform. While the appliance is on the high end in terms of price, it is important to note that it does include a bundle of software, storage, and servers.
Figure 19: Exadata—High Level of Awareness . . . Question: Have you evaluated Oracle's Exadata appliance?
Figure 20: . . . Planned Purchases Will Be Gradual Question: How likely are you to purchase Oracle's Exadata appliance in the future (1=unlikely, 10= very likely)?
Yes38%
No62%
0.00% 5.00% 10.00% 15.00% 20.00% 25.00% 30.00%
10
9
8
7
6
5
4
3
2
1
% of respondents
Source: Credit Suisse IT Survey, February 2011. Source: Credit Suisse IT Survey, February 2011.
A strong installed base means that it will likely have some impact on the industry. Oracle will target its vast software customer base with this solution, and it is showing early success. At the end of 2010, the company noted a $2bn sales pipeline for Exadata, up from $1bn in mid-2010. The Exadata solution is optimized for Oracle’s database software, and this definitely gives the company an advantage in bundling for applications that are heavily dependent on high-performance instances of Oracle’s database technology. This is also true for Oracle’s more recently released Exalogic product. In comparison to Exadata, the Oracle Exalogic Elastic Cloud is an appliance that combines 64-bit x86 processors, an InfiniBand-based I/O fabric, and solid-state storage with the market-leading Oracle WebLogic Server, other enterprise Java Oracle middleware products, and a choice of Oracle Solaris or Oracle Linux operating system software. Exalogic is optimized for Oracle’s middleware and application products, and hence gives Oracle the opportunity to move these workloads to Oracle hardware.
Cisco’s UCS—Impressive Technology, but a Long Way from Main Stream Adoption.
Awareness is high. With its Unified Computing System (UCS) offering, Cisco entered the server market with a broad, flexible data center strategy that bundles servers, networking, and management software into a modular, cohesive architecture that can be managed as a single entity. Owing to increased competition from IBM and HP for the data center, Cisco likely felt that it was necessary to enter the server market, as it was losing leverage by not directly controlling the server IP. As depicted in Figure 21, in a relatively short period of time, there is a strong awareness of Cisco’s UCS offering, with almost 50% of survey respondents having evaluated it at some point.

16 March 2011
IT Hardware 22
Figure 21: UCS—Awareness Even Higher than Oracle’s Exadata have you evaluated/are you evaluating Cisco's UCS offering?
Yes, evaluating23%
No46%
Have never heard of it3%
Yes, will likely purchase in the next 12 months
10%
Yes, yet will not likely purchase in the next 12
months18%
Source: Credit Suisse IT Survey, February 2011.
UCS, seen as an expensive solution. A customer evaluating Cisco’s UCS products is generally not only looking only to buy servers, but instead is looking for a comprehensive data center solution that includes servers, networking, management tools and storage. Cisco’s UCS offering is typically more expensive on an equivalent basis with other competitive offerings, as respondents to our survey noted in Figure 22.
Figure 22: Cisco UCS Is the Priciest Server Solution Question: Please rate the following server vendors across price/performance, using the following scale: 1 = Very poor performance 5 = Excellent performance
2 2.5 3 3.5 4 4.5
Cisco UCS
Fujitsu
Sun/Oracle
IBM
HP
Dell
Source: Credit Suisse IT Survey, February 2011.

16 March 2011
IT Hardware 23
Early run rates are impressive. Cisco is experiencing early success with UCS, claiming over 4,000 customers and an annualized run rate of $650 Million (nearly 7x year-over-year growth) at the end of February 2011. However, with less than 1% share of the server market, Cisco has a considerable way to go in order to catch HP, IBM, and Dell in the server market. Cisco has the luxury of building high-performance data center architecture from the ground up (with little hindrance from legacy technology), and although UCS may enjoy a performance advantage, it is widely expected that HP and IBM will catch up in the near term. Although Cisco’s go-to-market plan will likely focus on IT shops that are already existing networking customers, those very same customers may hesitate to give Cisco a larger share of wallet owing to the fear of vendor lock-in.
9) M&A—Sector Is Ripe for Continued Consolidation We estimate that the IT hardware, software, and services vendors spent a staggering $500bn on M&A over the past five years. Going forward, we believe, if anything, this trend could accelerate.
Figure 23: Gross Cash to Sales—Healthy Levels of Cash Figure 24: Net Cash to Sales Are Close to Highs
15.5%
21.0%
25.0%23.6%
22.0%20.9%
19.5%
26.9%
22.9%
25.7%
28.2%
0%
5%
10%
15%
20%
25%
30%
2000 2001 2002 2003 2004 2005 2006 2007 2008 2009 2010
Gro
ss c
ash
as %
of s
ales
-5.6%
-2.4%
9.9%10.6%
8.5%
7.0%
4.1%
11.3%
8.0%
2.4%
9.2%
-10%
-5%
0%
5%
10%
15%
2000 2001 2002 2003 2004 2005 2006 2007 2008 2009 2010Net
cas
h as
% o
f sal
es
Source: Company data, Credit Suisse estimates. Source: Company data, Credit Suisse estimates.
Technology companies have the firepower to spend. A glance at Figure 23 shows that the level of gross cash to sales is at 23% (similar to the average over the past ten years). However, net cash levels of 8% are higher than the historical average of 6%, as shown in Figure 24. In addition, we note that FCF levels for the top 50 technology companies are also at record levels, both in absolute terms and as a percentage of sales. Clearly, such significant cash flow can also be used for a combination of dividends/ buybacks; however, given the supportive macroeconomic backdrop, we argue that M&A will be a priority.

16 March 2011
IT Hardware 24
Figure 25: FCF Generation (Both Absolute and Margins) Has Also Been at Record Highs FCF for the top 50 technology companies over time
2.7%
5.7%
9.0%
7.4%7.1%
9.1%
6.7%
10.7%
10.0%
8.6%
9.8%
0
25000
50000
75000
100000
125000
150000
175000
2000 2001 2002 2003 2004 2005 2006 2007 2008 2009 2010
FCF
($ m
n)
0%
2%
4%
6%
8%
10%
12%
FCF
mar
gin
(%)
FCF ($ mn) FCF margin (%) Source: Company data, Credit Suisse research.
Underinvestment in tech R&D? A glance at Figure 26 reveals that in aggregate R&D intensity in the technology industry continues to decline for the top 50 companies. This was only 6.5% of sales in 2010, which is not only lower than history but also lower than several other sectors. We would argue this lower R&D as percentage of sales points to less internal investment and more potential external investments through acquisition.
Figure 26: R&D to Sales Ratio for Technology Companies Is at an All-Time Low R&D to sales ratio for the top 50 technology companies over time
7.2%
7.9%
7.0% 7.0%6.9%
6.7%
6.9%7.0%
6.5%
7.7%
7.5%
5%
6%
7%
8%
2000 2001 2002 2003 2004 2005 2006 2007 2008 2009 2010
R&
D a
s %
of s
ales
Source: Company data, Credit Suisse research.
M&A in technology is on the up. A glance at Figure 27 and Figure 28 shows that some $113bn of M&A was completed in 2010, with 190 deals being completed in the global communications, hardware, software, and services industry. This represented a significant uptick over the prior two years (average of $85bn), but still below the record levels seen in

16 March 2011
IT Hardware 25
2007 ($172bn), which shows an increasing appetite for deals. Interestingly, we also notice that around 70% of transactions (both in terms of deal count and deal value) have been in the software and services area in 2010.
Figure 27: M&A Appetite Has Seen an Increase in 2010... Figure 28: ...With Software/Services Being a Focus Area
66
26 25 2842 37
50 45 34 31 38
62
2849
58
72104
10592
7653
8411
27
48
40
6074
60
28
48
11
11
31
23 32
43
17
20
7
1
4
4
1
0
50
100
150
200
250
300
2000 2001 2002 2003 2004 2005 2006 2007 2008 2009 2010
Num
ber o
f M&
A d
eals
in H
ardw
are,
Sof
twar
e an
d Se
rvic
es
Comm Equipment Software Services Electronics
139
56
89
124
173
212
238243
213
129
190
64%
16% 15% 18% 17% 19%
30%
18%9%
34%27%
26%
24%
44%43%
56%43%
34%
29%35%
14%
39%
9%
8%
39% 30%
21%
28% 18%
40% 40%29%
29%
1%
52%
3%9% 6%
11%18%
13% 15%23%
5%
0%
10%
20%
30%
40%
50%
60%
70%
80%
90%
100%
2000 2001 2002 2003 2004 2005 2006 2007 2008 2009 2010
Bre
akdo
wn
of M
&A
dea
ls in
Har
dwar
e, S
oftw
are
and
Serv
ices
Comm Equipment Software Services Electronics
$187bn $47bn $20bn $38bn $65bn $93bn $112bn $172bn $113bn$86bn $84bn
Source: Company data, Credit Suisse research. Source: Company data, Credit Suisse research.
Convergence and the rise of the megacaps. As the technology sector has continued to consolidate, megacaps vendors, including IBM, Cisco, Oracle, and HP, have continued to get larger. For these companies, there appears to be a move toward a more vertically integrated industry structure, with blurring lines between hardware and software, and unlike the silo approach of the previous decade. Time will tell whether such strategies prove successful. However, what is clear is that, given levels of existing cash, FCF generation, and the intent to drive a bundled solution for the datacenter, consolidation in the industry is likely to continue.
IBM, HP, and Dell are likely to be very active in M&A. Within our sector, we believe that the most active companies when it comes to M&A are likely to be IBM, HP, and Dell. Indeed, all three have significant potential excess cash for acquisitions. IBM openly highlights that the company may spend as much as $20bn on M&A in the next five years, mainly in software. We also believe that the incoming CEO at HP may seek to reinvigorate its stagnant portfolio, and Dell is likely to use acquisitions to get to its targeted enterprise business mix. Even for Apple, we believe that with $60bn of net cash along with a business model and ecosystem that continue to evolve rapidly, if the company is to monetize its installed base of over 200mn users, M&A may be necessary.
Figure 29: IBM, Dell, and HP Accounted for 5% of Deal Value in Global Sector Since 2006 US$ in millions, unless otherwise stated Deal value ($ bn) IBM HP Dell Sub-total Global 2006 2,839 4,555 0 7,394 112,433 2007 5,516 0 1,723 7,239 172,494 2008 237 360 155 752 86,471 2009 836 0 3,760 4,597 83,927 2010 4,070 2,253 820 7,143 112,895 Total over 2005-2010 13,498 7,168 6,459 27,125 568,220 as % of sector deal value 2.4% 1.3% 1.1% 4.8%
Source: Company data, Credit Suisse research.
10) The Cloud May Not Be That Incremental Nowadays, rarely a conference call, presentation, or trade journal article goes by without some reference to the revolutionary benefits of cloud computing as extolled by the IT industry. However, what matters in the context of this report is what cloud computing means for the IT industry from the viewpoint of investors.

16 March 2011
IT Hardware 26
In theory, if all workloads shifted to the public cloud, all this involves is the change in the purchaser of IT infrastructure from enterprise IT departments to service providers. For example, we note that certain service providers such as Google actually manufacture their own servers, while other service providers such as Rackspace (covered by Credit Suisse Small Cap Software analyst Greg Dunham) buy commodity components from IT vendors such as Dell. The location and the ongoing operations of the underlying hardware and software are essentially transferred. When viewed from this perspective, the shift toward cloud computing will only be partially incremental. As service providers grow in size and numbers, the efficiencies they gain will allow them to use the same amount of IT equipment (and headcount) to service a larger number of customers. Indeed, some 70% of respondents in the Credit Suisse IT Survey felt that, as a result of cloud computing, IT spending would be flat to down (as shown in Figure 30).
Figure 30: Cloud Computing Will Reduce IT Spend in the Coming Years Question: Adoption of cloud computing will cause your overall IT spend to:
0.0%
10.0%
20.0%
30.0%
40.0%
50.0%
60.0%
70.0%
80.0%
1 year from now 3 years from now 5 years from now
% o
f res
pond
ents
Increase Decrease Not change
Source: Credit Suisse IT Survey, February 2011.
From a vendor perspective, we believe that the components of cloud computing are similar to existing datacenter architectures. Recently announced cloud offerings by all major vendors, including IBM, HP, and Dell are fundamentally similar to infrastructure outsourcing services that they have provided through their services arms for several years. The real change is then to ensure that their portfolios are aligned with new purchasers—service providers, customers seeking private cloud implementations, and customers seeking public cloud services directly from the vendors themselves. In this context, the discussion about who is well positioned for the cloud is similar to much of this report in comparing the strategic pros and cons of each company’s overall portfolio. For example, IBM has a broad portfolio from servers and storage to software and services, whereas Dell predominantly serves the commodity part of the server market, which is valued by cloud service providers when building infrastructure for commodity services. The question then becomes whether the shift toward cloud computing could allow newer entrants for IT infrastructure to win share, and we note that, according to the Credit Suisse IT Survey, Cisco is heavily favored to win incremental cloud infrastructure business, as seen in Figure 31.

16 March 2011
IT Hardware 27
Figure 31: Cisco Is Likely to Be a Key Beneficiary of Cloud Deployments on a scale of 1-5 (1= unlikely, 5= very likely), how likely are the following vendors to GAIN significant revenue as cloud computing adoption increases?
2.50 2.70 2.90 3.10 3.30 3.50 3.70 3.90
Dell
Oracle
Microsoft
EMC
HP
IBM
Cisco
Source: Credit Suisse IT Survey, February 2011.

16 March 2011
IT Hardware 28
Macro Trends Supportive of Tech Much of our analysis deals with the microeconomics of the IT hardware sector in terms of the fundamental demand drivers of servers, storage, services, and PCs. However, for an industry that is some $1.2trillion (including hardware, software, and services) and that represents nearly 50% of U.S. investment in private fixed assets, the macroeconomic environment is a key consideration. After economic factors such as GDP growth, corporate health, CEO confidence, and several others are taken into account, we see a positive macroeconomic backdrop for an industry, which is ultimately the foundation for growth, efficiency, and productivity. As noted by John Maynard Keynes in The General Theory of Employment, Interest and Money, 1936:
"there is the instability due to the characteristic of human nature that a large proportion of our positive activities depend on spontaneous optimism rather than mathematical expectations, whether moral or hedonistic or economic. Most, probably, of our decisions to do something positive, the full consequences of which will be drawn out over many days to come, can only be taken as the result of animal spirits - a spontaneous urge to action rather than inaction, and not as the outcome of a weighted average of quantitative benefits multiplied by quantitative probability "
We would argue that such animal spirits are what lead to the cyclical volatility in investment, most recently Figureed by a rapid decline in spending in 2009 and subsequent snap back in 2010. The key issue now is where tech spending is in relation to the economic cycle. To analyze this, we have relied upon three different approaches: first, we consulted our economic and equity strategists for broad indicators of actual investment in tech capex; second, we looked at specific levels of technology spending in the U.S. market (0.1% of net tech spending versus GDP); and lastly, our own proprietary CIO survey. The overarching conclusion is that, despite the tech IT investment recovery in 2010, major economies are still under consuming technology versus trend, and this will result in an upward bias to estimates in 2011. We highlight the following conclusions:
A conducive macroeconomic and corporate backdrop. A combination of strong balance sheets, cash at record levels (in the U.S. at 6% of assets), robust FCF (at 4% of GDP. the highest levels since 1995), and high levels of business confidence mean that corporations have the continued firepower to invest for growth. Further, G4 business investment stands at 16.4% of GDP, one of the lowest levels on record, yet tech accounts for a whopping 40%+ of spending. The macroeconomic drivers behind corporate discretionary spending are very appealing and will prove to be supportive in the coming years for IT spending.
Tech is being under consumed. Having analyzed levels of technology, net investment relative to GDP, long-term trend, and depreciation, we find that levels of tech investment remain structurally below long-terms levels even after the recovery in 2010. For example, net tech investment (capex minus depreciation to GDP) normally runs at an average of 0.62%, with a peak to trough of 1.4%; however, it currently languishes at only 0.1% This relative under consumption of tech in major economies adds to the argument that spending should continue to recover in 2011. In fact, net tech investment in 2009 for IT hardware was negative, implying that assets were depleted, and a recovery as seen earlier in 2001 would suggest a 0.3% recovery from current levels. Furthermore, forward indicators such as CEO confidence, corporate profits, the ISM index, and durable goods orders imply positive momentum ahead.
Cyclical recovery to continue. The end conclusion from a top-down perspective is that, despite an 8% recovery in revenues in 2010, the levels of tech spending in 2010 provide a base for a continued cyclical rebound and revenue growth in 2011-12 that has an upward bias and will realistically remain above long-term trends until this under consumption is corrected. We estimate the gap of tech investment versus recent trend levels is some 12% above current revenue levels.

16 March 2011
IT Hardware 29
Our proprietary Credit Suisse IT Survey is supportive of continued cyclical tailwinds. Based upon our survey of top IT decision makers at major global corporations, we find that 63% of respondents expect IT spending to increase, with a consistent response across all regions. In aggregate, IT headcount growth is expected to expand about 6%, with spending increasing at significantly faster rates than in 2010, with the fastest growth in areas such as services, storage, mobile devices, and software.
Corporations Have the Firepower to Invest Reassuringly, we believe that the overall macroeconomic backdrop for IT spending from corporations is positive, given several factors:
Record levels of cash flow and a capacity to spend. As noted by our global equity strategist Andrew Garthwaite, we are positive on corporate discretionary spending. There is near-record underinvestment by the corporate sector in the G4 economies, and record highs in free cash flow as a proportion of GDP, as shown in Figure 32 and Figure 33. With FCF at record highs, financing will be much easier, and there will be a strong incentive to invest for future growth.
Figure 32: G4 Investment % of GDP Figure 33: G4 Nonfinancial FCF % of GDP
15%
16%
17%
18%
19%
20%
21%
22%
23%
1981 1986 1991 1996 2001 2006 2011
G4 investment shareof GDPTrend
0.0%
0.5%
1.0%
1.5%
2.0%
2.5%
3.0%
3.5%
4.0%
4.5%
Q4 1995 Q4 1998 Q4 2001 Q4 2004 Q4 2007 Q4 2010
G4: Non financialcorporate FCF/GDPAverage
Source: Datastream, Credit Suisse estimates. Source: Datastream, Credit Suisse estimates.
Balance sheets have record cash levels. We note that there are very high levels of cash on the balance sheet (6% of assets and 12% of market cap in the U.S. as of Q3 2010), as shown in Figure 34 and Figure 35. When balance sheets are this strong, it is often followed by increased M&A and fixed investment.
Figure 34: U.S. Nonfinancial Corporates—Cash as a % of Total Assets
Figure 35: U.S. Nonfinancial Corporates—Cash as a % of Market Capitalization
2.0%
2.5%
3.0%
3.5%
4.0%
4.5%
5.0%
5.5%
6.0%
6.5%
1953 1962 1972 1982 1991 2001 2011
cash % share of corporate assets
Average = 3.7%
2%
4%
6%
8%
10%
12%
14%
16%
18%
20%
22%
1952 1957 1961 1966 1971 1976 1981 1986 1990 1995 2000 2005 2010
cash $ share of market cap
Average = 9.2%
Source: Datastream, Credit Suisse estimates. Source: Datastream, Credit Suisse estimates.
Technology is the single biggest category of U.S. nonresidential fixed equipment investment. An economic backdrop that is supportive to capex will directly benefit technology spending, owing to technology’s majority share of fixed asset spending. (See Figure 36.) This share is consistently growing over time; as shown in Figure 37, net tech investment (tech investment net of depreciation) has been growing at an 11% rate over the past 50 years; this compares with a 7% growth rate of overall nonresidential investment. Notice in Figure 37 that technology has resumed its prerecession upward trend and is likely to be the primary beneficiary of a continued growth in broader investment.

16 March 2011
IT Hardware 30
Figure 36: Composition of U.S. Nonresidential Investment in Equipment
Figure 37: U.S. Tech Spending as a % of Total Nonresidential Investment
Industrial equipment17%
Agricultural machinery3%
Furniture and fixtures4%
Computers and peripheral equipment
9%
Software28%
Communication equipment
9%
Transportation equipment7%
Nonmedical instruments3%
Medical equipment and instruments
8%
Other equipment12%
5%
10%
15%
20%
25%
30%
35%
40%
45%
Q1 1961 Q1 1966 Q1 1971 Q1 1976 Q1 1981 Q1 1986 Q1 1991 Q1 1996 Q1 2001 Q1 2006 Q1 201
US Tech spending, % total non-res. investmentTrend
Source: BEA, Credit Suisse estimates. Source: Datastream, Credit Suisse estimates.
Business and CEO confidence is high. The CEO Confidence Survey (conducted by the Conference Board) depicted in Figure 38 has a strong predictive relationship with GDP and interest rates. GDP is widely known to be coincidental with tech spending, and therefore this survey is a good leading indicator of future tech spending. A total of 100 CEOs are involved in the quarterly report, and they are asked questions about their economic and industry outlook. The measure now reads 62.3, which is above the historical average and bodes well for future tech spending (a reading of more than 50 points reflects a generally positive outlook). Another closely followed technology indicator is the NY Fed’s Empire State Manufacturing Survey. The survey is sent on the first day of each month to the same pool of about 200 manufacturing executives in New York state, typically the president or CEO. As in the CEO Confidence Survey, they are polled for sentiment and outlook. A portion of this survey specifically asks for outlook on tech spending, and the results are depicted in Figure 39. This indicator also is above average and predicts a continuance in tech spending growth.
Figure 38: The Conference Board Measure of CEO Confidence (CEO Confidence Survey)
Figure 39: NY Fed Empire State Tech Spending Survey
0.00
10.00
20.00
30.00
40.00
50.00
60.00
70.00
80.00
90.00
Jun-76
Jun-78
Jun-80
Jun-82
Jun-84
Jun-86
Jun-88
Jun-90
Jun-92
Jun-94
Jun-96
Jun-98
Jun-00
Jun-02
Jun-04
Jun-06
Jun-08
Jun-10
Expectations for the economy 6 months from now
Average = 54.25
-30
-20
-10
0
10
20
30
40
Jul-01 Jul-02 Jul-03 Jul-04 Jul-05 Jul-06 Jul-07 Jul-08 Jul-09 Jul-10
Tech spending 6mos from now
Average=13.7
Source: The Conference Board, Credit Suisse estimates. Source: NY Fed, Credit Suisse estimates.
Orders indicators are calling for an uptick in production. One of the most useful leading indicators of production is the ISM New Orders index (Figure 40), an index linked to new orders by purchasing managers. An index score above 50 is considered positive, with levels above 60 being extremely positive. The past two readings have been above 60, indicating a strong uptick in orders, which should be followed by a strong uptick in production and shipments. Durable goods orders (DGOs) tracked by the census also appear strong (see Figure 41) and further support the positive inclination of the ISM trend;

16 March 2011
IT Hardware 31
the census number is helpful in that it is specific to computers and electronic products. Please note that DGOs are depicted via year-over-year growth rate, and that they are increasing, but not as convincingly as they did throughout 2010.
Figure 40: ISM New Orders Figure 41: Durable Goods Orders—Computers and Electronics, Y/Y Growth Rate %
0.00
10.00
20.00
30.00
40.00
50.00
60.00
70.00
80.00
Feb-81
Feb-83
Feb-85
Feb-87
Feb-89
Feb-91
Feb-93
Feb-95
Feb-97
Feb-99
Feb-01
Feb-03
Feb-05
Feb-07
Feb-09
ISM NO
Avg. NO = 54.43
-40.00%
-30.00%
-20.00%
-10.00%
0.00%
10.00%
20.00%
30.00%
40.00%
Jan-93 Jan-95 Jan-97 Jan-99 Jan-01 Jan-03 Jan-05 Jan-07 Jan-09 Jan-11
Y/Y
% G
row
th
DGO - Computers & Electronics
Avg = 2.52%
Source: ISM, Credit Suisse estimates. Source: Census, Credit Suisse estimates.
Levels of Tech Investment Are Below Trend Moving beyond the macro backdrop, we believe that levels of tech investment remain significantly below trend. As noted by our global equity strategist Andrew Garthwaite and our U.S. economist Jay Feldman, there is a net underinvestment in technology.
U.S. tech investment appears low versus trend. Net tech investment as a percentage of GDP is at a record low, as shown in Figure 42. The net subtracts out depreciation from gross investment. We are below the 0.62% trend line of net U.S. technology investment to GDP. Many investment projects were put on hold during the recession, but the recapitalization that began in 2010 should continue into 2011.
Figure 42: Net Technology Investment as % of U.S. GDP
0.0%
0.2%
0.4%
0.6%
0.8%
1.0%
1.2%
1.4%
1980
1981
1982
1983
1984
1985
1986
1987
1988
1989
1990
1991
1992
1993
1994
1995
1996
1997
1998
1999
2000
2001
2002
2003
2004
2005
2006
2007
2008
2009
2010
E
2011
E
2012
E
% o
f U.S
. GD
P
Net technology investment in PCs, peripheral, communication equipment and software Historical average
Long-term average: 0.62%
Estimate
Source: BEA, Credit Suisse estimates.
Net investment is approaching depletion levels. Looking at levels of net investment (capex spending minus depreciation) of technology, we note that at the end of 2009, as depicted in Figure 42, net investment was nearing zero (capex and depreciation converging). Clearly, the trends seen in the late 1990s may not return, but levels of net investment near

16 March 2011
IT Hardware 32
zero can be interpreted as an unsustainable depletion of assets. Capex spending beyond depreciation levels indicates spending above replenishment, and in our view, is necessary for companies to use technology investment as a fuel for innovation and productivity.
The life of the install base is high, implying underinvestment. Another way to think of current levels of investment is the implication on the replacement life of assets. With net investment near depreciation, only one of two things can be happening: either assets have a much longer useful life or there is significant underinvestment. While technology innovation can certainly prolong the life of the installed base, we believe it is unlikely to have stretched this far.
We will be back to prerecession technology capex levels within 12-18 months. Based on our estimates (from our proprietary industry models on PCs, Servers, Storage, Services, and Printing) for 2010 IT hardware sector growth, which can be used as a proxy for capex growth, as well as assumptions for run-rate depreciation, we have created a forecast for 2010-12 net tech spending versus GDP. This is depicted by the dashed line labeled Estimate in Figure 42. We assume 8% IT capex growth in 2011, and 5% in 2012 that will bring us to pre-recession 2007 levels of net technology investment as a percentage of GDP.
Underinvestment is pronounced in IT Hardware. To further examine the level of underinvestment, we deconstructed Figure 42 (net tech investment as a % of GDP) into hardware and software components. Figure 43 splits out US net hardware investment and net software investment as a percentage of GDP. The magnitude of underinvestment in hardware is clearly more pronounced and reinforces the emergence of a technology refresh cycle that began in late 2009, and in our view should continue into 2011.
Figure 43: Net Investment in Hardware and Software as % of U.S. GDP
-0.1%0.0%0.1%0.2%0.3%0.4%0.5%0.6%0.7%0.8%0.9%
1980 1983 1986 1989 1992 1995 1998 2001 2004 2007
% o
f U.S
. GDP
HW
SW
Source: BEA, Credit Suisse estimates.
Corporate profits are signaling pent-up tech demand. One of our favorite leading indicators is corporate profits, as rising corporate profits typically result in accelerating investments in technology infrastructure. Note in Figure 44 that corporate profits are currently growing at record levels, and we expect technology spending to directly benefit, especially given that technology spending is below trend as a percentage of corporate profits. (See Figure 45). As the corporate sector regains steady footing, and with bolstered confidence, it will likely deploy its record cash piles into technology infrastructure.

16 March 2011
IT Hardware 33
Figure 44: U.S. Technology Fixed Investment and Corporate Profits, % Annual Growth
Figure 45: U.S. Technology Spending as a % of Corporate Profits
-30%
-20%
-10%
0%
10%
20%
30%
40%
50%
1988 1990 1992 1994 1996 1998 2000 2002 2004 2006 2008 2010% a
nnua
l gro
wth
Corporate Profits
Tech Spend
5%
15%
25%
35%
45%
55%
65%
75%
Q1 1961 Q1 1965 Q1 1969 Q1 1973 Q1 1977 Q1 1981 Q1 1985 Q1 1989 Q1 1993 Q1 1997 Q1 2001 Q1 2005 Q1 2009
US Tech spending % corporateprofits
Source: BEA, Credit Suisse estimates. Source: BEA, Credit Suisse estimates.
The Tech Pulse index is indicating healthy growth in the technology sector. The Tech Pulse index tracks economic activity in the U.S. technology sector (see Figure 46), but is limited in that it is a coincident indicator. The index is constructed by the San Francisco Federal Reserve from technology-specific portions of five main economic indicators in: employment, investment, production, shipment, and consumption. In Figure 47, we depict the year-over-year percentage growth in the indicator, giving us a feel for continued positive growth, albeit less positive than 2010. This coincident indicator combined with the previously noted leading indicators (ISM, DGO, Empire State, CEO Confidence, and corporate profits) contribute to our generally positive outlook for 2011, as we have significant runway before any obviously negative signs appear on the horizon
Figure 46: SF Fed Tech Pulse Index, Y/Y Growth %
-40%
-30%
-20%
-10%
0%
10%
20%
30%
40%
50%
Jan-86 Jan-88 Jan-90 Jan-92 Jan-94 Jan-96 Jan-98 Jan-00 Jan-02 Jan-04 Jan-06 Jan-08 Jan-10
Source: SF Fed, Credit Suisse estimates.
Implications for the IT hardware; the cycle continues. Based on the exhibits and data above, we can make a compelling argument for the relative levels of underinvestment in the technology sector and a supportive macro backdrop both from coincident and leading indicators. When combined with our bottoms-up analysis, it helps us form several important views with respect to 2011 and early 2012. As shown in Figure 47, on a year-over-year growth basis, several of our key end markets saw a cyclical recovery that started in mid-2009 and carried them through 2010. Based on the economic data and our bottoms-up analysis, we believe that growth will continue to remain resilient through 2011 and into early 2012.

16 March 2011
IT Hardware 34
Figure 47: Y/Y % Growth Rate—Servers, Storage, PCs, Printers
-30%
-20%
-10%
0%
10%
20%
1Q09 2Q09 3Q09 4Q09 1Q10 2Q10 3Q10 4Q10E 1Q11E 2Q11E 3Q11E 4Q11E
TotalServersStoragePCsPrinters
Source: Credit Suisse estimates.
Our Credit Suisse IT Survey Supports This At the end of January 2011, we conducted our semiannual Credit Suisse IT Survey to help us gain additional insight into where we are in the IT spending cycle. Our survey was completed by 70 top IT decision makers (Figure 48).
Figure 48: Credit Suisse IT Survey—What is Your Title?
CIO63%
IT Director18%
IT Consultant2%
CTO7%
CEO/President5%
IT Manager5%
Source: Credit Suisse IT Survey.
Our survey respondents were positive on the economy and their IT budget growth into 2011. Nearly 90% described the economy as stable or improving, with 57% feeling that the economy was improving/ (See Figure 49.) More reassuring was the fact that 63% had an IT budget that was bigger than it was one year ago. (See Figure 50.)

16 March 2011
IT Hardware 35
Figure 49: Credit Suisse IT Survey—What Is Your Current View on the Economy?
Figure 50: Credit Suisse IT Survey—How Does Your Current Outlook for Your Overall IT Budget Compare with One Year Ago?
Improving57%
Steady33%
Declining8%
Unsure2%
Higher63% Same
25%
Lower12%
Source: Credit Suisse IT Survey. Source: Credit Suisse IT Survey.
Respondents plan on spending more money in IT, and will grow IT headcount in 2011. Their positive views on the economy, along with larger budgets, will likely result in spending more in IT products and services in 2011 than they did in 2010. (See Figure 51.) This will come in the form of products, services, and increased headcount. (See Figure 52.)
Figure 51: Credit Suisse IT Survey—What Are Your Year-Over-Year Growth Expectations for Your IT Spend Next Year versus This Past Year?
Figure 52: Credit Suisse IT Survey—What Is Your Expected IT Headcount Growth Rate in 2011 versus 2010? What Was It in 2010 versus 2009?
1.7%
3.5%
0.0% 0.5% 1.0% 1.5% 2.0% 2.5% 3.0% 3.5% 4.0%
2010 (vs. 2009)
2011 (vs. 2010)
0.6%
5.7%
0.0% 1.0% 2.0% 3.0% 4.0% 5.0% 6.0%
2010 vs 2009
2011 vs 2010
Source: Credit Suisse IT Survey. Source: Credit Suisse IT Survey.
Services, storage, mobile devices, and software will be the biggest beneficiary of increased tech spending. Consistent with our proprietary models, Figure 53, reinforces our thesis that several areas of technology will continue to experience growth in 2011. This will be led be services, storage, mobile devices, and software. Our companies with significant exposure to these businesses should experience the strongest growth.

16 March 2011
IT Hardware 36
Figure 53: Credit Suisse IT Survey—What Are Your Year-Over-Year Growth Expectations for Your IT Spend in the Following Areas in 2011?
-2.0% -1.0% 0.0% 1.0% 2.0% 3.0% 4.0%
Printing
Servers
Networking
Security
PC
Mobile Devices and Services
Services
Storage
Source: Credit Suisse survey.

16 March 2011
IT Hardware 37
Get Your Head in the Clouds It seems that rarely a conference call, presentation, or trade journal article goes by without some reference to the revolutionary benefits of cloud computing as extolled by the IT industry. However, what matters in the context of this report is what cloud computing means for the IT industry specifically for investors. We address five key questions:
What is cloud computing? Before even discussing the impacts of cloud computing on the PC industry, it is important to highlight that its very definition is loose and has become clouded, excuse the pun, in IT marketing hype. In its essence, we view cloud computing as the increasingly common choice among enterprises to forgo purchasing, owning, and servicing their own infrastructure and instead shifting some of their workloads to another service provider. The public cloud is an immature market in which new external service providers ranging from Google to Amazon (covered by Credit Suisse Entertainment, Internet, and Cable DBS analyst Spencer Wang) to Salesforce.com (covered by Credit Suisse Software analyst Phil Winslow) effectively provide some degree of computing power on a pay-as-you go basis. A private cloud, in contrast, is essentially when a large enterprise centralizes its IT and acts as an internal service provider to its business units.
Why adopt cloud computing, why now? Any shift toward cloud computing is going to be gradual; however, the fundamental driver is the desire to shift from the reactive IT spending status quo in which 70% of IT spending goes to maintaining existing operations, whereas only 30% is actually spent on innovation. The hope is that by outsourcing IT processes and infrastructure, datacenter utilization will increase and additional resources will be available for business group to focus IT spend on innovation and gaining leverage from IT. Key drivers for increased adoption now versus anytime in the past are: (1) numerous reports of successful cloud computing implementations of key workloads like CRM, (2) the widespread adoption of virtualization of everything from desktops to servers to applications, and (3) the emergence of a slew of new service providers, including new offerings from traditional IT vendors. Private cloud computing has the added benefit of quantifying IT’s contribution to the business, as it will encourage the perception of IT as a service provider, and will allow for comparison with other external providers of similar services. Clearly, this is a fundamental change in how IT is consumed and delivered by enterprises, and the trend is increasing on a long-term basis.
Why not cloud, the shift towards cloud computing will be slow. While this shift is clearly happening, we believe that the transition toward cloud computing will be gradual, as supported by our semiannual Credit Suisse IT Survey and discussions with industry leaders. Although the growth appears to be rapid on a small base, cloud expenditure is still an insignificant portion of overall IT spending. A small subset of applications are cloud ready, and IT is slowly testing the viability of the public cloud delivery model for commoditized, commonized applications and processes. IT’s reluctance to go full steam ahead centers around concerns about security, reliability, and vendor lock-in. There also is an element of self preservation involved, since outsourcing portions of IT can and will result in IT headcount reductions in areas that are commoditized and outsourced. This trend could take hold as public cloud offerings increase in diversity and are offered at cost-effective price levels owing to the scale advantages afforded by public cloud operators. Private clouds are of more interest to enterprises (than public clouds) in the near term, as they do not overhaul the way they are currently doing business and allows them to more efficiently leverage IT resources.
How big is the cloud opportunity? Quantifying the cloud is fundamentally challenging, given the fact that Gartner estimates the market at $68bn and IDC estimates it at $22bn for year-end 2010. Owing to the popularity of the cloud computing trend and the marketing blitz by Microsoft, IBM, and Salesforce.com, almost all vendors are repositioning their existing offerings within the context of the cloud. This has made it difficult to determine what cloud computing really is and is not. Significant portions of cloud computing revenue

16 March 2011
IT Hardware 38
are existing products and services that have been recategorized to fuel the fad. Gartner and IDC’s projections for five years from now are $150bn and $55bn. This significant disparity in forecasts is in itself very telling and reflects a struggle to discretely define the bounds of cloud computing. Based upon our strict definition, we estimate the opportunity for public cloud service providers will be significant at $34bn in 2014 from $11bn today. The opportunity will become significant over multiple decades, and as such it has attracted a nontraditional profile of service providers from the IT and telecommunications sectors such as Amazon, Verizon, and Google.
What does it mean for IT spending; is it additive? In theory, if all workloads shifted to the public cloud, all this involves is the change in the purchaser of IT infrastructure from enterprise IT departments to service providers. For example, we note that certain service providers such as Google actually manufacture their own servers, while other service providers such as Rackspace buy commodity components from IT vendors like Dell. The location and the ongoing operations of the underlying hardware and software are essentially transferred. When viewed from this perspective, the shift toward cloud computing will only be partially incremental. As service providers grow in size and numbers, the efficiencies they gain will allow them to use the same amount of IT equipment (and headcount) to service a larger number of customers. Indeed, some 70% of respondents in our IT Survey felt that, as a result of cloud computing, IT spending would be flat to down (as shown in Figure 30 below).
Figure 54: Cloud Computing Will Reduce IT Spend in the Coming Years adoption of cloud computing will cause your overall IT spend to:
0.0%
10.0%
20.0%
30.0%
40.0%
50.0%
60.0%
70.0%
80.0%
1 year from now 3 years from now 5 years from now
% o
f res
pond
ents
Increase Decrease Not change
Source: Credit Suisse IT Survey, February 2011.
What does it mean for IT vendors? We believe that essentially the components of cloud computing are very similar to the existing architecture of existing data centers. While IBM, HP, and Dell have jumped on the bandwagon in announcing cloud portfolios, our analysis suggests that the fundamental architecture is very similar. Even recently announced cloud offerings by all three vendors are fundamentally similar to infrastructure outsourcing services that they have provided through their services arms for several years. The real change is then to ensure that their portfolios are aligned with new purchasers: service providers, customers seeking private cloud, and customers seeking public cloud services directly from the vendors themselves. In this context, we would note that the discussion about who is well positioned for the cloud is similar to much of this report in comparing the strategic pros and cons of each company’s overall portfolio. For example, IBM has a wide and strong portfolio from servers and storage to software and services, whereas Dell serves the commodity part of the server market, which is valued by cloud service providers when building infrastructure for commodity services. The question then becomes whether

16 March 2011
IT Hardware 39
the shift toward cloud computing could allow newer entrants for IT infrastructure to win share, and here we note that, according to our IT survey, Cisco is heavily favored to win cloud infrastructure business, given its broad range of services as well as strong networking offerings.
Figure 55: Cisco Is Likely to Be a Key Beneficiary of Cloud Deployments on a scale of 1-5 (1= unlikely, 5= very likely), how likely are the following vendors to GAIN significant revenue as cloud computing adoption increases?
2.50 2.70 2.90 3.10 3.30 3.50 3.70 3.90
Dell
Oracle
Microsoft
EMC
HP
IBM
Cisco
Source: Credit Suisse IT Survey, February 2011.
What is Cloud Computing? Our Definition of the Cloud
Before discussing the opportunities and risks associated with cloud computing, it is worthwhile to be very clear about its very definition. Indeed, while trade journals, industry veterans, and vendors increasingly use the term cloud or marketing hype, this can be confusing for an investor. At a very basic level, we believe the adoption of cloud computing involves a given CIO deciding that rather than owning and operating technology components that the time has come to move all or certain workloads to a service provider’s facilities. Cloud computing, at least in our view, then simply redefines how technology products and services are delivered by vendors and consumed by customers. We expect enterprises increasingly to move away from building and operating their own computing infrastructure. Two good examples of this are:
■ FedEx. In a Jan 24, 2011, InformationWeek article, a typical example of private cloud computing was discussed: “Just last fall, FedEx opened a new data center in Colorado Springs based on this idea of general purpose computing. It uses commodity x86 servers, each with just a single 10-gig Ethernet cord into the back for networking, replacing the bevy of wires of the past for host-bus adapters, NIC cards, etc. Before applications move into the new data center, they are commonized—revised to use the same database and messaging technology, for example, so they can move easily among servers.” FedEx is using this cloud infrastructure inside its own data center—a private cloud—but Carter [its CIO] says,”Workloads could easily shift to public clouds run by vendors such as Amazon and others, if that made strategic sense down the road.”

16 March 2011
IT Hardware 40
■ The GSA (General Services Administration) announced in October of 2010 that federal, state, and local governments would have access to cloud-based infrastructure (IaaS) offerings through a storefront at Apps.gov. This move allows vendors to aid government with cloud storage, virtual machines, and Web hosting services to ensure expansion of government IT cloud computing. Apps.gov offerings include on-demand self-service and resource pooling with nearly unlimited storage and automatic monitoring of resource utilization. The GSA's IaaS offerings also provide rapid elasticity and provisioning of virtual machines, storage, and bandwidth. Federal Chief Information Officer Vivek Kundra was quoted: “Offering IaaS on Apps.gov makes sense for the federal government and for the American people. Cloud computing services help to deliver on this Administration’s commitment to provide better value for the American taxpayer by making government more efficient. Cloud solutions not only help to lower the cost of government operations, they also drive innovation across government.”
To be clear, cloud computing is not a new technology; it is a different consumption and delivery model for existing technology. It is riding the rapid uptake of virtualization (discussed later) and Web-based software in corporate IT environments. In many ways, it continues the march toward outsourced IT and allows a company to focus on its core competency (which typically is not IT). The technology elements comprising a cloud computing solution have been in use since the inception of the Internet. However, the cloud computing terminology, conveniently refers to the go-to-market focus of several hardware, software, networking, and services vendors who are targeting consumers and businesses with outsourced technology and the provisioning of technology as a service. The underlying goals are to hide the details of the technology from the end user, who can then focus on achieving the benefits of the technology, and obviating the need for the technology expertise to install and maintain the technology.
Public versus Private Cloud
Cloud computing is divided into two broad categories
The public cloud. The service provider offering a public cloud service manages all of the necessary hardware and software at their own data center. A common example of a public cloud service is Salesforce.com, which provides customer relationship management (CRM) software to businesses. A business is able to rent the software from Salesforce.com, and its users access the software from a web browser rather than buying and installing servers, storage, and networking. Per IDC and several industry analysts, cloud services are typically:
■ Accessible over the Internet via a standard client or browser
■ Standardized IT capabilities or services built for a mass audience
■ Self-service deployment and management
■ Elastic and scalable to accommodate growth
■ Incorporate usage-based pricing on a short-term or long-term basis with little upfront commitment
■ Hosted on shared infrastructure
■ Transparent to the user with regard to the technical infrastructure underpinning the service
There are three loosely defined segments of public cloud computing services. Public cloud service providers generally offer one or a combination of SaaS, IaaS, and PaaS. SaaS is by far the largest and most well known category of cloud computing services, and here are the general definitions:

16 March 2011
IT Hardware 41
■ SaaS (Software as a Service), where software applications are accessed via a web browser;
■ IaaS (Infrastructure as a Service), which allows a business to rent basic computing services such as servers, storage, networking, and extra computing power to augment or replace the purchase of its own hardware and software; and
■ PaaS (Platform as a Service), which offers development, testing, and deployment tools for writing cloud applications that are Web and/or mobile accessible.
The private cloud. In contrast, private cloud refers to on-premise technology, with access restricted to a single enterprise. A private cloud allows the IT organization to act as the internal cloud provider to the internal users. Private cloud refers to the notion that big businesses would like their internal IT provided as a set of services to various business units. Think of it as a business adopting public cloud concepts in order to build its own internal cloud. The delivery of IT as a service, however, is very compelling to executives at large businesses in that it allows them to quantify the business value of discrete IT services; these internal IT services can then be benchmarked against those of external providers. Invariably, this will lead to potential internal political challenges, as business units will be able to choose between the IT services provided by external vendors and those provided by internal IT. These concepts, again, are not new. Large IT organizations within enterprises have tried to provide technology as a set of services for a number of years, and traditionally have only been successful in doing this for a few discrete services via the use of software only. The rapid adoption of virtualization and operations/automation tools in the past five years is enabling the creation of internal resource pools of servers, storage, software, and networking; this allows IT to create internal cloud services much like an external service provider would.
Be Careful of the Hype
As with any new technology, especially in a sales-intensive business, there is a risk that marketing departments overhype the term cloud, as shown in Figure 56.
Indeed, we note some recent observations by industry veterans.
"The interesting thing about cloud computing is that we've redefined cloud computing to include everything that we already do. I can't think of anything that isn't cloud computing with all of these announcements. The computer industry is the only industry that is more fashion-driven than women's fashion. Maybe I'm an idiot, but I have no idea what anyone is talking about. What is it? It's complete gibberish. It's insane. When is this idiocy going to stop? We'll make cloud computing announcements. I'm not going to fight this thing. But I don't understand what we would do differently in the light of cloud."
- Wall Street Journal, Oracle CEO Larry Ellison, September 2008
"I don't know what it means. . .I have nothing against the term cloud, my thought in the industry is that when we talk about some opportunity, people tend to insert the word cloud, and that's going to be the answer to whatever question ... (like) it's magic."
- Mark Hurd, Oracle President and Former HP CEO, November 2010
To be clear, we believe that there is a clear shift to cloud computing occurring, but equally we would not expect it to change the industry over night.

16 March 2011
IT Hardware 42
Figure 56: Hype Cycle for Cloud Computing, 2010
Source: Gartner, 2010.
Over the next few years, private clouds will be much more relevant to the enterprise than public clouds. Owing in part to factors such as security and reliability concerns, large organizations are hesitant to use public cloud services beyond the few SaaS (hosted software) applications they are typically using today; they generally would rather keep their sensitive data on premise. Our IT survey respondents confirmed this notion (see Figure 57), which can be interpreted as private cloud being the current priority, and public cloud adoption will see a gradual increase over time.
Figure 57: External Cloud Infrastructure Has Room to Grow what percent of your total IT hardware spending goes/might go to cloud infrastructure vs. workload-specific spending at the following points in time?
0%5%
10%15%20%25%30%35%40%45%50%
Internal cloudinfrastructure
External cloudinfrastructure
Workload-specificspending
Now In 5 years
Source: Credit Suisse IT Survey, February 2011.
Given the need for many types of components to construct an internal cloud, several vendors have jumped on the opportunity to tout their ability to be a single sourcer or a majority sourcer of the technology elements. This obviously benefits the vendors by potentially increasing the size of their average sale and allows them to position several product lines at once in the course of a sales opportunity. Large vendors (HP, Dell, Cisco, IBM, and EMC) will position their ability to provide an end-to-end solution, and smaller vendors (NetApp, Salesforce.com, CA) will tout their ability to provide a higher-

16 March 2011
IT Hardware 43
performance solution via a best-of-breed approach that utilizes their superiority in a specific portion of the solution.
Virtualization as a Driver of Cloud Computing Virtualization is part of how you do cloud, but it is not the cloud itself. There are many components that make up a cloud computing implementation, including servers, storage, networking, and software. As IDC notes, the software components enabling cloud computing include virtualization, automated provisioning, service-level management, performance monitoring, consumption-based capacity optimization, and chargeback applications. A number of other management software products are also needed to enable the dynamic resource scaling and automated provisioning capabilities that are the hallmark of cloud environments. We have intentionally included this long list of components to make it clear that cloud computing is not virtualization; the terms are not interchangeable (although one could mistake them to be, since they are often incorrectly used in the press). However, virtualization is the key enabler of cloud computing, and its rapid adoption is fuelling the cloud computing conversation.
What is virtualization? Virtualization has been in use since the 1960s and was widely associated with IBM’s mainframes. It allowed a large mainframe to be subdivided into virtual machines—multiple, separate, logical computing environments within the overall hardware computing environment. Currently, VMware, Citrix, Microsoft, (covered by Credit Suisse Software analyst Phil Winslow) and RedHat provide virtualization software that can be deployed in today’s client-server architectures. VMware is by far the most successful virtualization software provider, and the introduction of its virtualization tools in the early 2000s sparked this new era in client-server computing. Virtualization software allows the partitioning of hardware resources into pools, as opposed to the previous constraint of tethering specific workloads to specific hardware devices. Virtualization allows for workloads to be moved seamlessly between physical devices, maximizing efficient use of hardware resources. A practical example of this concept would be the installation of Parallels or VMware software on a Mac in order to run Microsoft Windows on the Mac Operating System, essentially creating a computer within a computer; imagine this same concept on large datacenter servers running hundreds and thousands of workloads. Different virtual machines can run different operating systems and multiple applications on a single physical server, turning a single server into multiple servers. In addition to subdividing physical resources, virtualization can be used to pool (or combine) physical resources like storage; storage virtualization can convert multiple storage devices into one large storage device. The same concepts also apply in application, desktop, and network virtualization.
Virtualization is a very significant trend. This trend is so substantial, in fact, that large enterprise CIOs increasingly discuss data center infrastructure in terms of number of virtual machines rather than server-centric metrics. Chief decision makers at some of the largest IT shops confirmed this growing trend in our survey, as depicted in Figure 58 and Figure 59.

16 March 2011
IT Hardware 44
Figure 58: Virtualization of Servers Is a Growing Trend what percent of your newly purchased x86 servers were/are/will be virtualized at the following points in time?
Figure 59: As Is the Number of Virtual Machines per Server what was/is/will be the average number of VMs per virtualized server CPU at the following points in time?
0.0%
10.0%
20.0%
30.0%
40.0%
50.0%
60.0%
70.0%
80.0%
1 year ago Now 1 year fromnow
2 years fromnow
5 years fromnow
0
10
20
30
40
50
60
1 year ago Now 1 year from now 2 years fromnow
5 years fromnow
Source: Credit Suisse IT Survey, February 2011. Source: Credit Suisse IT Survey, February 2011.
What are the benefits of virtualization? Companies traditionally dedicated a specific application workload to a single specific machine since they did not want applications to interfere with one another; this architecture proliferated with the advent of client-server architecture and servers that were cheap in comparison with mainframes. Over the years, this resulted in data centers full of underutilized machine; by most estimates, before virtualization, servers were only 15-25% utilized. Virtualization software enables multiple workloads on the same machine, and hence allows for a much more efficient use of hardware. Multiple servers can then be converted into a computing pool that is flexible and scalable. The result is a significant reduction in:
■ Hardware, labor, and management costs—fewer machines can be purchased per workload, and fewer people are required to manage the hardware infrastructure.
■ Time—provisioning, maintenance, and testing of new workloads can be completed rapidly.
■ Energy—when servers go unused, data center electricity and cooling costs are unnecessarily high, wasting energy and natural resources.
Software as a Service as a Driver of Cloud Computing—Cloud-Ready Workloads Software as a Service (SaaS) is by far the biggest category (Figure 60) of the $11bn cloud computing market, as it is arguably the service that started the entire cloud trend. SaaS’s most well known face is Salesforce.com, as it has been pushing the cloud computing concept for nearly ten years; its is expected to reach $2bn in 2011 revenue. SaaS has experienced steadily growing success in that it allows the enterprise to try out portions of cloud computing on a workload basis. As implementations grow in success and trust is gained, an organization can then try outsourcing more workloads or infrastructure.

16 March 2011
IT Hardware 45
Figure 60: SaaS Is By Far the Biggest Category of Cloud Computing Gartner estimate of 2011 Cloud Computing Composition
SaaS68%
IaaS30%
PaaS2%
Source: Gartner, Credit Suisse estimates.
In Gartner’s recent November 2010 SaaS forecast, they identified how well known categories of software are broadly being affected by the SaaS delivery model:
■ SaaS continues to penetrate the CRM market, accounting for nearly 24% of total CRM market revenue in 2009. SaaS in CRM exhibits more general market adoption, ranging between 11% and nearly 40% of total software revenue, depending on the CRM subsegment. SaaS may exceed 26% of CRM market total revenue in 2010.
■ The content, communications, and collaboration (CCC) market continues to show the widest disparity of SaaS revenue generation, with SaaS representing 4% of enterprise content management (ECM) and approximately 82% of Web conferencing.
■ Project and portfolio management (PPM) is a fast-growing market for SaaS, with a compound annual growth rate (CAGR) of more than 40% projected for the next five years.
■ Office suites and digital content creation (DCC) also continue to show rapid growth for SaaS, although starting from a smaller base, with a 31.7% CAGR and a 36.7% CAGR. Adoption is driven by new entrants in office suites but limited by broadband availability and quality.
■ Revenue growth associated with SaaS will be double the total aggregated growth rates for both ERP and supply chain management (SCM), but adoption of SaaS within ERP and SCM varies based on process complexity. SaaS within ERP remains a relatively small proportion of the overall market (in comparison with other software segments)

16 March 2011
IT Hardware 46
Despite these rapid growth exhibits, Software-as-a-Service is growing from a relatively small base and comprises less than 5% of the entire enterprise software market. In Figure 61 , SaaS overall is growing nearly 15.8% Y/Y, at about 2.7x the rate of the broad software market’s 5.8% rate. Most telling, however, is the magnitude of SaaS revenue, representative of a still fragmented market filled with many small players in the CCC (content, communications, and collaboration) and CRM (customer relationship management) software segments.
Figure 61: SaaS Is Less Than 5% of the Entire Software Market for the Foreseeable Future comparison of WW Software Market vs. WW SaaS Market.
Worldwide Software Revenue by Primary market 2009 2010 2011 2012 2013 20142009-2014 CAGR (%)
Application 129,638 133,389 139,664 147,348 156,454 166,781 5.2%Application development and deployment 64,575 67,250 71,050 75,908 81,773 88,485 6.5%System Infrastructure software 78,069 81,375 86,378 92,252 98,923 106,248 6.4%Total Enterprise Software 272,282 282,014 297,092 315,508 337,150 361,514 5.8%Worldwide SaaS Software Revenue by Application Software Market 2009 2010 2011 2012 2013 2014
2009-2014 CAGR (%)
CCC 2,434 2,855 3,411 4,162 5,084 5,995 19.8%Office Suites 68 101 149 197 247 270 31.7%DCC 65 97 149 215 287 309 36.7%CRM 2,279 2,614 2,911 3,282 3,731 4,187 12.9%ERP 1,248 1,341 1,461 1,610 1,800 2,005 10.0%SCM 807 912 1,041 1,187 1,364 1,535 13.7%PPM 70 136 211 274 331 385 41.0%Other App Software 964 1,121 1,328 1,542 1,780 1,853 14.0%Total Enterprise SaaS Software 7,935 9,178 10,662 12,469 14,624 16,540 15.8%Source: Gartner (2010), IDC (2010), Credit Suisse estimates.
To get a better understanding of how key IT decision makers are thinking about their midterm purchasing plans for these specific software areas, we gave them several categories to prioritize with regard to SaaS migration. Not surprisingly, as Figure 62 depicts, they confirmed that CRM was the top priority, closely followed by email, and then business intelligence and data storage. Notice, however, that computing cycles (generally falling in the IaaS category) are last in priority, and security, ERP, and supply chain (all highly trusted applications) are also at the bottom of the priority list. As IT organizations become comfortable with the performance, economics, and security of the small parts of clouds that they do use, they will accelerate their adoption of broader external/internal cloud services, and this will play out in the growth of Infrastructure-as-a-Service (IaaS) and Platform-as-a-Service (PaaS) as well.

16 March 2011
IT Hardware 47
Figure 62: Cloud-Ready Workloads in the next 12-24 months, how likely are you to adopt the following cloud offerings as augmentation/replacement for your internal workload? (scale of 1 to 5, I being not likely and 5 being very likely)
2.00
2.20
2.40
2.60
2.80
3.00
3.20
3.40
3.60
3.80
4.00
CRM Email PersonalProductivity
BusinessIntelligence
Data Storage HRM (HumanResources
Management)
LOBApplications
ERP SecuritySoftware
Supply Chain ComputingCycles
Average: 2.75
Source: Credit Suisse IT Survey, February 2011
Why Adopt Cloud Computing? There are several considerations that must be weighed in deciding to migrate specific workloads or portions of infrastructure to the cloud delivery model. As with any investment decision in an enterprise, (1) economics, (2) risk, and (3) options should be key considerations in weighing the total business value attributable to the investment. For the move toward cloud computing, Gartner found that these three elements and a few others were top of mind in weighing the move toward cloud computing adoption. As Figure 63 depicts, Gartner identified the following six areas as being the most relevant: economics, agility, trust & risk, creativity & innovation, simplicity, and social impact.

16 March 2011
IT Hardware 48
Figure 63: The Cloud Computing Decision Is Weighed Against Six Key Factors areas of business value and their relative importance to weighing cloud computing
Social Impact5%
Simplicity10%
Creativity and Innovation
15%
Trust and Risk20%
Agility25%
Economics25%
Source: Gartner (September 2009), Credit Suisse estimates.
Economic and hard dollar benefits are not the only major differentiator in deploying applications in the cloud vs. (traditional) on-site. Innovation and agility are at least equally important, as shown in Figure 64. Not surprisingly, however, trust/risk is the key area of concern when discussing any outsourcing of IT—enterprises are reluctant to house their sensitive data off-site, and the convenience of transparent IT is countered with the question: “where is my data, and who has access to it?”
Figure 64: Creativity and Innovation are Top Benefits; Trust and Risk the Biggest Concern on a relative scale, which cloud features provide higher value than on-site ones?
-0.1
-0.08-0.06-0.04
-0.020
0.02
0.040.06
0.08
Economics Agility Creativity andInnovation
Simplicity Trust and Risk Social Impact
Source: Gartner Survey (2009), Credit Suisse estimates.

16 March 2011
IT Hardware 49
Creativity & Innovation
When IT organizations are no longer concerned with running infrastructure they can focus on solving business problems with innovative technology. Gartner, IDC, and several vendor studies agree that typical IT organizations invest over two-thirds of their time and budgets on day-to-day operations and in a reactive, tactical mindset as opposed to a proactive, strategic, “alignment with the business” way of operating. (See Figure 65.) This is often owing to an inundation of requests to IT which are nonstrategic and break/fix related. By definition, these low-value requests are often a poor allocation of a highly skilled IT worker’s time. A cloud service provider can afford to time-multiplex these types of requests among its shared IT staff, as it is centralizing talent for use among a broad range of client organizations and developing a competency in commodity, mass IT requests, and services. When an individual business outsources these operational and infrastructure services to a cloud service provider, it frees up its internal staff to focus on strategic and innovative projects that can improve the core business. The vast number of available cloud applications allows an organization to experiment with new technologies with relatively little cost commitment.
Figure 65: Cloud Computing’s Flexibility Offers Hope for Increased Proactive Innovation IT organizations typically spend up to 70% of their budgets on operations and maintenance, leaving just 30% for business innovation.
Operations and Maintenance
70%
Innovation30%
Source: InformationWeek Analytics Survey (2010).
Economics
The first factor often discussed with cloud computing is the financial benefits associated with the pay-per-use model. Renting software and infrastructure (from service providers) replaces the typically large upfront capex investment (associated with buying your own IT) with a predictable operations expense. Since cloud computing calls for the centralized management and automation of technology as a pool of resources, the same amount of IT labor (headcount) can effectively manage a larger number of hardware and software components. This allows cloud service providers to leverage economies of scale and provision equivalent technology at a lower cost than most dedicated, internal IT shops. In theory, they should be able to pass these cost savings on to customers, and the majority of respondents to our IT survey feel that the cloud movement will reduce their IT costs going forward. (See Figure 66.)

16 March 2011
IT Hardware 50
Figure 66: IT Decision Makers Expect Cloud Computing to Reduce IT Spend adoption of cloud computing will cause your overall IT spend:
To grow27%
To decline43%
Will not change our IT spend30%
Source: Credit Suisse IT Survey, February 2011.
The discrete areas of spending that organizations are looking to cloud computing for cost savings include:
■ Lower total cost of ownership
■ Lower IT hardware and software costs
■ Lower datacenter facility costs
■ Lower maintenance costs
■ Lower IT staff headcount
Although one would think these savings are most prominent by leveraging the public cloud model, the private cloud model will enable the same initial cost savings to the overall corporation, as IT will be forced into becoming an internal service provider to the business. By acting as such, the IT department will be forced to optimize its own infrastructure, as it risks being outsourced in some portion, if not completely (depending on the size of the organization). As Figure 67 depicts, organizations expect to reap the economic (and ancillary) benefits via private cloud first, as they try to squeeze more out of the infrastructure investments they have already made. It can be argued that there is a conflict of interest here, as IT is vested in self-preservation. As cloud service providers ramp up capabilities in discrete IT services, their advertised cost per service can be benchmarked against the total cost of providing a service via the internal IT department.

16 March 2011
IT Hardware 51
Figure 67: Enterprises Expect to Reap Cloud Benefits with Private (Internal) Cloud First rate the following criteria for their importance in your decision to move applications to a public or private cloud; 0 = not at all likely and 10 = extremely likely
4 4.5 5 5.5 6 6.5 7
Save on IT staff head count
Lower IT software costs
Lower IT services/maintenancecosts
Speed time to deployment
Simplified management
Lower datacenter facility costs
Lower IT hardware costs
Improve response to changes inworkload demand
Lower total cost of ownership
Improve utilization of ITresource
Aids in disaster recovery
Improved availability
Private Cloud Public Cloud
Source: IDC Survey (2010), Credit Suisse estimates.
Speed/Agility/Simplicity
Historically, when a business unit required a new workload or IT service, it submitted a request to internal IT and it could be weeks or months for the approval, acquisition, and provisioning of the software and hardware necessary to put the workload into production. With the advent of public cloud service providers, desired applications are a few clicks away and can be sourced by an external service provider, potentially allowing business units to disintermediate internal IT. Clouds in general allow for the faster provisioning of technology, as the pools of resources are already in place to support customer expansion.
In a January 24, 2011, InformationWeek article, FedEx’s CIO provided thoughts on Cloud Computing: “I started in the late ’70s, right around ‘80, working this stuff, so I’ve ridden every wave from mainframe to minicomputers to PCs to client server to object-oriented--let's throw CASE in there somewhere back in the ‘80s—to Internet technologies. As those waves crashed, we and everyone else have remnants of those things. What’s happening now—for the first time, in my opinion—is there’s truly a general-purpose computing environment that’s workload agnostic. You can throw different kinds of workloads on the same computing server infrastructure. There’s network convergence—all the networks are IP, there’s not a bunch of unique protocols. And there’s converged storage technology. Then there’s software like Java that can make it all very portable across platforms.”
External cloud services allow organizations to leverage technology that previously was out of their reach owing to either a lack of internal skillset or the ability to afford the large upfront capital cost. Since external cloud service providers can pool talent in addition to the hardware and software resources, they will more likely have a higher technical competence than most IT organizations. This benefits small and medium businesses that cannot afford the best level of talent or the hardware/software underpinnings.

16 March 2011
IT Hardware 52
Trust & Risk
Security, service quality, and reliability are the top concern of enterprise cloud evaluators. These risks are often the most cited reasons that enterprises will adopt private cloud over public cloud in the near term. Private cloud alleviates these concerns, but note that it is harder to make an internal organization as accountable as an external service provider, as the external provider can be replaced more easily. When IT is outsourced, the service provider can be monitored and managed to ensure delivery is suitable for the enterprise and that the delivery quality is comparable for the price paid.
Note in Figure 64 that trust and risk are the biggest detraction of off-site cloud computing, as enterprises are not keen on storing critical data off-site, with concerns around both security and reliability. In addition to the safety of the data, a longstanding concern with any externally hosted service is the availability of the service and the ever present threat of losing the network connection, and hence losing access to the service.
For small and medium businesses, however, it can be argued that a major cloud services vendor is able to maintain a more secure environment owing to its ability to leverage better talent and more reliable infrastructure. A recent MarketBridge study (quoted in CRN on Jan. 21, 2011) polling 1,000 North American small and midsized businesses found that security was a top reason to move applications to public clouds, as “48% of SMBs said they believe data security would be better in the cloud”.
Social Impact
Cloud computing is being positioned as the green solution, as it consolidates infrastructure resulting in a smaller environmental footprint through the lesser and more efficient use of hardware, energy, and real estate. Cloud computing is generally not geographically constrained, so IT can be delivered in emergency situations and to developing nations, and hence facilitating greater global collaboration.
Why Not Cloud? Security and reliability is of paramount concern with the public cloud. A recent IDC survey found, as depicted in Figure 68, that security is by far the most pressing concern around cloud computing. Organizations are not ready to give up their most critical data, and this was also highlighted in Figure 62, as our Credit Suisse IT Survey respondents strongly favored cloud for the applications that are most proven to be cloud ready via years of consistently positive feedback. New portions of IT will likely be required to earn this same level of trust (via success stories and gradual adoption) before being fully trusted to a cloud provider.

16 March 2011
IT Hardware 53
Figure 68: Security Is the Overriding Challenge Facing Cloud Adoption what do you see as the top 2 challenges in moving to a public/private cloud? 0 = not at all likely and 10 = extremely likely
0 10 20 30 40 50 60 70 80
Other
Need more automation tools
Doubt the savings/projected ROI numbers
Vendor lock-in
Ability to meet service-level agreements
IT organization is not structured to implement changes inprocesses and policies
Staff is not skilled enough to implement this type of infrastructure
Issues with downtime/availability
Difficulty integrating this infrastructure with current installedtechnology
Cost prohibitive/price
Technology is immature at this time
Security concerns
Source: IDC Survey (2010), Credit Suisse estimates.
The technology is immature. Given that cloud computing represents less than 5% of all IT spending, it is relatively unproven versus technologies that enterprises have relied on for decades. CIOs are hesitant to rush into cloud computing at the rate that vendor marketing campaigns would like you to think they are being adopted. The immaturity of the technology is highlighted as the second concern in Figure 68.
Costs may actually rise with increasing levels of cloud computing adoption. With private cloud computing, by definition, companies must buy resources in pools and they must buy excess capacity to handle future workloads in order to mimic the elastic capacity of a true service provider. This may actually increase their cost of technology acquisition, hence partially explaining why the large IT hardware vendors are pushing the concept so aggressively (average customer order size will be larger). With public cloud, there are several risk factors that can contribute to rising costs, among them are integration costs, customization costs, and vendor lock-in. Integrating a public cloud service with other portions of internal IT might pose challenges, owing to the use of disparate technologies. Since cloud services tend to be homogenous (one size fits all), they often must be customized for an organization to fully leverage their benefits for a specific use. As the customization level increases, the vendor lock-in likelihood will rise. Vendor lock-in also becomes a serious concern when someone else is managing a mission critical portion of an enterprises IT infrastructure.
It is difficult to differentiate when using commoditized technology. By definition of the early public cloud, it is based on, and is the provisioning of, relatively commoditized technologies. As an enterprise, it is difficult to differentiate your operation if you are using the same software, hardware, and IT processes as your competitor (who might also be using the same cloud services). In the long run, it can be argued that cloud computing is detrimental to creativity and innovation because it is the provisioning of commonized technology to the whole customer base. If IT is core to your business, it will be hard to differentiate from competition if everyone is using the same applications and software

16 March 2011
IT Hardware 54
platforms. Therefore, in the near future, we expect that companies will only leverage the most commoditized technologies via the cloud, and will continue to look to differentiate their operations by innovating internally.
Large IT shops are clouds in and of themselves. In a recent CIO Magazine article considering the use of private cloud versus public cloud, Intel's CIO, Diane Bryant, was quoted saying, “I have a very large infrastructure—I have 100,000 servers in production—and so I am a cloud. I have the economies of scale, I have the virtualization, I have the agility. For me to go outside and pay for a cloud-based service—I can't make the total cost of ownership work.” This is a classic response from large IT shops. Such IT departments, for example in the Fortune 500, control a level of IT expenditure that affords them leverage against vendors that is on a similar scale to what many of the modern day cloud providers are touting. They are likely best served with considering the private cloud approach, if not for its novel technology, then for the sake of transforming their approach to one of an internal service provider.
Vendor viability is a major risk factor. A large percentage of SaaS providers are still relatively small (see service provider table in Figure 70) and their long-term viability has not yet been established. If a vendor goes out of business or is acquired, there is a downside risk of service disruption or significant price increases.
Who Are the Major Cloud Service Providers? A discussion around major cloud service providers would mainly focus on public cloud service providers; in the next three to six months; however, we anticipate an acceleration of external private cloud service providers. Although private cloud is primarily used to describe an internal, on-site cloud deployment dedicated to an enterprise, we are beginning to see the emergence of externally hosted private clouds that are not generally accessible to the public; our IT hardware vendors will play a big part in external and internal private clouds, as will be discussed in the next section.
The public cloud service provider industry is relatively fragmented, with Salesforce.com being its most well known and largest constituent at $1.3 billion in 2010 revenues. The provisioning of software as a service (SaaS) is most often associated with cloud computing, owing to the prevalence and popularity of SaaS vendors. SaaS allows enterprises to test cloud computing with relatively low-risk applications, and their growing trust is leading them to explore the hosting of infrastructure (IaaS) and the development of their own custom applications (PaaS). Although some vendors only participate in a specific area of cloud computing, the top providers are increasingly blurring the lines. The top cloud service providers happen to be household names (Google, Microsoft, Amazon), and consumers who are using SaaS applications at home have come to expect the same types of applications in the workplace. It is no surprise that our survey respondents (Figure 69) felt that several traditionally consumer names would become more strategic in the Enterprise as cloud computing matures.

16 March 2011
IT Hardware 55
Figure 69: New Entrants Will Emerge in the Enterprise Landscape How likely are the following vendors to become more strategic in the Enterprise as cloud computing matures? (scale of 1 to 5, I being not likely and 5 being very likely)
0.00 0.50 1.00 1.50 2.00 2.50 3.00 3.50 4.00 4.50
Terremark
Apple
Savvis
AT&T
Verizon
Rackspace
Red Hat
Amazon
Salesforce
Avg: 3.1
Source: Credit Suisse IT Survey, February 2011.
A recent joint survey by the UK Oracle User Group and Fujitsu (discussed in CIO.com on January 25, 2011), found a wide discrepancy as to what a cloud service truly meant. Of the respondents using cloud services, over one-half felt it was synonymous with SaaS, 21% felt it meant IaaS, and only 3% who were using cloud services associated it with PaaS. These percentages map well to the Gartner derived market estimates in Figure 76.
Although PaaS is the smallest segment of cloud computing, it is widely considered to have significant growth potential, owing to the proliferation of Internet-connected devices that can now access cloud infrastructure. The vast array of operating systems and hardware manufacturers fragmenting the client device industry, combined with the customer desire to have ubiquitous applications, is driving the need for new software to be written and hosted in the cloud. Gartner follows about 60 companies in the PaaS market, the majority of which are below $5 million in total company revenue. Of the leading PaaS incumbents, Microsoft has the most successful track record in the application development market. Please see Figure 70 for a sampling of prominent SaaS, IaaS, and PaaS cloud providers.

16 March 2011
IT Hardware 56
Figure 70: Public Cloud Service Providers
Company $M 2010E Revenue
$M Cloud Revenue
SaaS IaaS PaaS Product Offering Comments Employees
Salesforce.com $1,306 $1,306 X X - CRM and related products for SaaS- Force.com is their original PaaS offering but is constrained to their own SaaS products- Recently acquired Heroku for Ruby hosted applications (PaaS)
- Widely considered the largest SaaS vendor- Claims 82,000 customers - Heroku claims 85,000 deployed applications and tens of thousands of developers- Heroku is currently hosted on Amazon
3969
Amazon $34,261 $750 (Est.) X X - EC2 (Elastic Compute Cloud) pay-by-the-hour compute services- Cloud storage, cloud databases- Elastic Beanstalk announcement is entry into PaaS. Partners with Engine Yard for a more complete PaaS offering
- 80-90% of IaaS market (Est.)- Considered extremely technical and developer centric due to very little assistance
24300
Google $21,703 N/A X - App Engine managed cloud environment for developers, with connectors to Google Apps; supports Java and Python
- Claims 130,000 live applications and 250,000 developers- Forthcoming App Engine for Business will increase enterprise adoption
19835
Microsoft $62,484 N/A X X X - Azure for IaaS and PaaS- Office 365, Exchange, SharePoint, and Dynamics CRM for SaaS- The broadest enterprise-ready SaaS portfolio
- Claims at least 20,000 customers of Azure- Azure is arguably the most flexible PaaS offering with many possible deployment scenarios- Recently dropped CRM pricing to compete aggressively with salesforce.com
89000
Engine Yard N/A N/A X - Ruby PaaS offerings- Partners with Amazon and Terremark for hosting
- Competes with Heroku; Heroku was recently acquired by Salesforce.com
N/A
Rackspace $776 N/A X - Web hosting, complex managed hosting, Xen-based cloud IaaS, PHP/.NET PaaS, cloud storage, and cloud backup
- Better known as a web hosting provider- Must strengthen its VMware relationship
N/A
Terremark $292 N/A X - Web hosting, colocation, managed hosting, vCloud Express, and Enterprise Cloud
- Excellent VMware partner (VMware is one of its investors)- Very strong in public sector
859
Savvis $929 X - Web hosting, colocation, managed hosting, VMware-based IaaS
- Significant market share in hosting and colocation
2167
Verizon $105,952 N/A X - Verizon Business offers colocation, managed hosting, and cloud IaaS on Vmware
- Long track record in hosting 222927
ATT $124,361 N/A X - Offers colocation, managed hosting (dedicated & virtual), cloud IaaS, cloud storage, and cloud content delivery
- Long track record in hosting- Strong enterprise reputation
282720
Intuit $3,455 X Financial management for consumers and small business
Rumored to do $1B in SaaS 7700
NetSuite $192 X Enterprise resource planning (accounting, inventory, etc)
968
LivePerson $110 X Live chat (customer service) 416Concur $293 X Employee spend management (expenses) 1200Taleo $238 X Human resources 916
SuccssFactors $203 X Human resources 664Constant Contact $174 X Email marketing for small business 625
LogMeIn $100 X Remote machine access 338LivePerson $110 X Live chat (customer service) 416
Type of Cloud Offering
Source: Credit Suisse Estimates, 2011.
Microsoft, the largest software company in the world, is the largest looming threat to incumbent cloud computing providers, as it is investing heavily in cloud marketing, product development, and new data centers; CEO Steve Ballmer recently stated that “Microsoft is betting our company on cloud computing.” Their strategy includes providing SaaS (Office 365 and Dynamics CRM), IaaS (Azure), and PaaS (Azure); this further demonstrates that the lines between the three categories are blurring, especially for large tech vendors. This reinforces the notion that computing is becoming a utility, and there is increasing pressure to hide the technical details of how that utility is delivered (much like any other utility you are familiar with). Additionally, Microsoft is a well known name among enterprises and already controls a significant amount of enterprise wallet share; their introduction of cloud services will provide for a smoother transition and reduced perception of risk.

16 March 2011
IT Hardware 57
The use of SaaS in the enterprise is typically a tactical decision specific to a particular need, and is not a strategic outsourcing decision. But as more enterprises are experiencing success with SaaS, they are more willing to give IaaS a try - opening the possibility for the cloud to capture an increasing share of their infrastructure. Amazon is considered the leading pure IaaS vendor with services spanning elastic computing, cloud storage, and cloud content delivery. IaaS typically requires a greater deal of trust since enterprise organizations are competent at running their own infrastructure. In contrast, many popular SaaS applications are in software categories that typically are not developed in-house, so the use of SaaS doesn’t fundamentally change the function of the software, but rather its delivery. IaaS involves locating the infrastructure offsite, and therefore new complications around security, network speed, service quality, and compliance must be considered; vendor reputation will be a key criterion in choosing a IaaS provider.
In Gartner’s recent SaaS study, they noted that an increasing number of enterprises are using SaaS applications that were procured and deployed without participation from IT, creating both management and internal political issues. There are hundreds of SaaS companies to choose from, and Figure 71 below is a sampling of representative vendors in each major SaaS area.

16 March 2011
IT Hardware 58
Figure 71: SaaS by Enterprise Software Market, Representative Vendors Category Representative Vendors
CCC – Content, Communications, and
Collaboration
ECM — Alterian, Auersoft, Clickability, Content Management, CrownPeak, EPiServer, Eprise (SilkRoad Technology), Hyland, IBM, NetReach, Open Text, PaperHost, PaperThin, SpringCM, Treeno Software, Xerox
E-discovery — AccessData, Anacomp, Autonomy, Case Central, CommVault, Epiq Systems, FTI, Huron Consulting, Iron Mountain, kCura, LexisNexis, Renew Data, SummationE-mail — Cisco, Google, HP, IBM, MicrosoftSearch — Atomz, SLI SystemsTeam collaboration — DesignLinks International, EMC, Grove Technologies, Huddle-Ninian Solutions, IntraLinks, Jive Software, TeamSpaceWeb conferencing — Adobe, AT&T, Cisco, Citrix, IBM, InterCall (Genesys Conferencing), Microsoft, Netviewer
Sales — Access Commerce, ATG, BigMachines, Callidus, CDC Software, Demandware, FPX (formerly Firepond), Imano, Infopia, Involve Technology, Kadient, Landslide, Microsoft Dynamics CRM, NetCommissions, NetSuite, Oracle CRM On Demand, Sage, salesforce.com, SAP, SugarCRM, Venda, Volusion, Webcom, Xactly, ZohoMarketing — Alterian, Aprimo, Assetlink, BrandMaker, Coremetrics, ExactTarget, Genalytics, IBM (Unica), L-Soft, Lyris, Marketo, Microsoft Dynamics CRM, Mtivity, NetSuite, Responsys, RightNow Technologies, SAP, SAS Institute, SilverpopCustomer service and support — AIM Technology, Confirmit, Corrigo, eGain, Enkata, Globalpark, HardMetrics, InStranet, InVision, Knowledge Solutions, Medallia, Merced Systems, Oracle, Parature, ResponseTek, RightNow Technologies, salesforce.com, SAP, Teleopti, TOA Technologies, VirtualLogger
DCC – Digital Content Creation
Adobe, Corel, Google, Microsoft, Avid, Yahoo, Paint.NET, Serif
HCM — Cornerstone on Demand, CyberShift, Infor (Workbrain), Kenexa, Saba, SilkRoad, Softscape, Sonar 6, SuccessFactors, Taleo, Ultimate Software, VirtualEdge, Workday, WorkscapeFMSs — Epicor Express, Exact Online, FinancialForce.com, Intaact, NetSuite, SAP (Business ByDesign), Twinfield, WorkdayManufacturing and operations — Epicor Express, Glovia, NetSuite, Plex Systems, SAP (Business ByDesign)
Office Suites Adobe, AdventNet, Ajax13, Approver.com, Corel, ExpressO, Google, iNetOffice, Microsoft, Open Source Software Institute, Peepal Technology, Sheetster, Simple Groupware Solutions, Smartsheet.com, Software Garden, Team and Concepts, ThinkFree, TrimPath, Vyew
PPM – Project and Portfolio Management
@Task, Atlantic Global, Augeo, CA, Clarizen, Compuware, Daptive, Element Software, EPM, Genius Inside, HyperOffice, Innotas, Instantis, OpenAir, Planview, PowerSteering, Project InVision, Project.net, Projectplace, Qtask, Severa, Skire, Tenrox, VCS OnlineSourcing/procurement — Ariba, Emptoris, Ketera, Procuri, QuadremSupply and demand chain planning —Agentrics, BetweenMarkets, Elemica, KinaxisWarehouse management — SmartTurn (RedPrairie)Transportation management — Descartes, GT Nexus, LeanLogistics, Log-Net, Manhattan Associates, MercuryGate, Sterling Commerce/IBMGlobal trade compliance — Integration Point, Management Dynamics, TradeBeam/CDCSPP — SyncraExpense management — Cerylion, Invoice InsightCompliance management — Axentis (Wolters Kluwer), BI International, Paisley (Thomson Reuters)E-learning — ACS Learning Services, GeoLearning, Global Scholar, Learn.com, Mzinga, NIIT, OutStart, Plateau Systems, Saba, SumTotalInstant messaging — FaceTime Communications, Google, Jabber, MessageLabs (Symantec)Disaster management — Send Word NowData cleansing — HyperQualityData integration — InformaticaBusiness process management — Appian, SavvionStorage — Amazon, Google, SymantecRetail management — DigiPoS Store SolutionsHealthcare management — TriZettoPhysical security management — CrimeReports
CRM – Customer Relationship Management
ERP – Enterprise Resource Planning
SCM – Supply Chain Management
Others
Source: Gartner, November 2010
How Big Is the Cloud Opportunity? Before even arriving at any sensible estimate for the revenue opportunity for IT vendors, we believe that it is important to arrive at the actual consumption demand from the user’s perspective. There are three loosely defined segments of cloud computing services, with one category—SaaS—being the largest and most well known category of cloud computing services:
■ SaaS (software as a service), in which software applications are accessed via a web browser;
■ IaaS (infrastructure as a service), which allows a business to rent basic computing services such as servers, storage, networking, and extra computing power to augment or replace the purchase of their own hardware and software; and

16 March 2011
IT Hardware 59
■ PaaS (platform as a service), which offers development, testing, and deployment tools for writing cloud applications that are web and/or mobile accessible. Public cloud service providers generally offer one or a combination of SaaS, IaaS, and PaaS.
In such an immature market, arriving at any meaningful conclusion is challenging. Gartner publicly estimates the cloud services market at $68 billion dollars in 2010, and growing 20% Y/Y to nearly $150 billion to 2014. The breakdown of its forecast is depicted in Figure 72:. Figure 72: Gartner’s Estimate of Cloud Services, Worldwide, 2009-2014 ($B) Gartner’s Cloud Forecast 2009 2010 2011 2012 2013 2014 CAGR(%) 2009-14EBusiness Process Services Advertising 29 32 35.4 42.8 50.3 55.1 13.7 E-Commerce 3.86 4.32 5.25 6.46 7.42 9.01 18.4 Payments 3.19 3.55 3.92 4.37 4.81 5.26 10.5 Human Resources 8 9.3 10.9 12.5 14.1 15.5 14.1 Supply Management 1.4 1.6 2.3 3.9 7 10.3 49.1 Demand Management 2.8 3 4.6 5.5 6.3 7.2 20.8 Finance and Accounting, and Administration 1.4 2.1 2.5 3.1 4.69 5.62 32.0 Operations 1.37 2.03 2.4 3.49 5.23 6.69 37.3 Business Process Services Total 51.02 57.9 67.27 82.12 99.85 114.68 17.6 Applications Total 5.79 7.55 9.83 12.87 16.31 20.72 29.0 Application Infrastructure Platform Infrastructure 0.11 0.14 0.2 0.28 0.5 0.65 42.7 Integration Services 0.048 0.072 0.106 0.16 0.237 0.348 48.7 Application Infrastructure Total 0.158 0.212 0.306 0.44 0.737 0.998 44.6 System Infrastructure Compute Services 1.3 2.1 3.7 5.6 8 10.5 56.1 Storage Services 0.034 0.071 0.163 0.338 0.582 0.902 92.6 Backup Services 0.37 0.451 0.55 0.671 0.819 0.999 22.0 Systems Infrastructure Total 1.70 2.62 4.41 6.61 9.40 12.40 48.8 Cloud Services Total 58.6 68.3 81.3 102.1 126.3 148.8 20.5 Source: Gartner (May 2010).
In comparison, IDC’s estimate in Figure 74 is $22 billion in 2010, and growing 25.5% Y/Y to $55 billion by 2014. The fact that two major analysts have such a wide disparity in how they characterize the size of the cloud market further reinforces the widespread belief that cloud computing is a loosely defined marketing term, which is yet to define a specific set of technology products and service. Gartner’s numbers are inflated by what it defines as remotely provided business process services, including the online advertising market that Google dominates. In order to get a better feel for what top IT decision makers felt is and is not cloud, we posed the question in Figure 73 and our respondents resoundingly felt that Gartner’s inclusion of advertising does not belong within the cloud computing definition.

16 March 2011
IT Hardware 60
Figure 73: Respondents Do Not Feel that Advertising Should be Included in “Cloud” In sizing the cloud computing market, should we include the following?
0% 10% 20% 30% 40% 50% 60% 70% 80% 90% 100%
Online compute and storageservices
Business process servicesdelivered via Internet
(Payroll, E-Commerce, etc.)
Backup services
Web Hosting
Google's Ad revenue
Advertising networks andadvertising exchanges
Internet display advertising
% of respondents answering "yes"
Source: Credit Suisse IT Survey, February 2011.
Both the Gartner (Figure 72) and the IDC forecast (Figure 74) include services that existed long before the term cloud even existed. This is a key driver in our hesitation to fully buy into the accretive impact of cloud computing. A good portion of services classified as cloud computing will come as no surprise to our IT hardware vendors, as they are participating in those sales opportunities already.
Figure 74: Worldwide Public IT Cloud Services Revenue by Segment, 2009-2014 ($M) IDC’s Cloud Forecast
2009 2010 2011 2012 2013 2014 2009 Share
(%) 2009-2014 CAGR (%)
2014 Share (%)
Applications 8,118 10,431 13,040 15,332 17,470 20,580 49.1 20.4% 37.1 Application development and deployment
1,647 2,264 3,130 4,325 6,075 8,618 10.0 39.2% 15.5
System Infrastructure software
3,385 4,381 5,676 7,194 8,877 11,345 20.5 27.4% 20.5
Servers 1,974 2,958 3,890 4,960 6,000 7,548 11.9 30.8% 13.6 Storage(basic) 1,424 2,140 2,998 4,098 5,414 7,366 8.6 38.9% 13.3 Total 1,6549 22,173 28,734 35,911 43,837 55,457 100.0 27.4% 100.0 Growth(%) 34% 29.60% 25% 22.10% 26.50%
Source: IDC (April 2010).
In the Credit Suisse IT Survey, we asked 60 top IT decision makers which of the two forecasts they relied upon, and the results are reflected in Figure 75. Over 50% of our respondents felt that neither forecast was the one on which to count.

16 March 2011
IT Hardware 61
Figure 75: The Majority of Respondents Do Not Rely on IDC or Gartner Cloud Forecasts Gartner publicly estimates the cloud services market at $68Billion in 2010, and $150 Billion in 2014. In comparison, IDC’s estimate is $22 Billion in 2010, and $55 Billion by 2014. Whose forecast is right?
Gartner23%
IDC22%
Neither, it is too early to predict cloud
computing's size31%
Neither, they are both just trying to increase
the hype17%
Other:7%
Source: Credit Suisse IT Survey, February 2011.
The majority of vendors that are considered to be cloud providers do not disclose specifics for their cloud-related revenue, so there is a tendency to take pre-existing revenue streams and categorize them as cloud. Given what our surveys are telling us, we prefer the more conservative cloud estimate using Gartner’s numbers and stripping out pre-existing business process services. We believe that the market is best approximated by taking a subset of Gartner’s Figure 72 numbers, with the following mapping: SaaS = Applications, PaaS = Applications Infrastructure and IaaS = Systems Infrastructure. Figure 76 below is a subset of Figure 72. The numbers in Figure 76 represent the undoubtedly new products and services comprising accretive IT spend.
Figure 76: WW Public Cloud Services for SaaS, IaaS, and PaaS ($M) 2009 2010 2011 2012 2013 2014 2009 share 2009-2014
CAGR 2014 share
SaaS (Software as a Service) 5,790 7,550 9,830 12,870 16,310 20,720 75.70% 29.00% 60.70% IaaS (Infrastructure as Service) 1,700 2,620 4,400 6,600 9,400 12,400 22.20% 48.80% 36.30% PaaS (Platform as a Service) 158 212 306 440 737 998 2.10% 44.60% 2.90% Total 7,648 10,382 14,536 19,910 26,447 34,118 - 34.90% -
Source: Gartner, May 2010
Is It Incremental to IT Spending? The trend can’t be questioned, but the rate of growth must be questioned. Our server, storage, and services models give us insight into how cloud computing will influence infrastructure demand and the numbers are simply not there right now. The adoption of private clouds is an architectural decision that fundamentally doesn’t alter the type of technology components Enterprise IT will purchase, as the components are already fundamental to running any data center. When an organization decides to outsource technology to a cloud service provider, they will directly spend less on infrastructure equipment, but the purchase of infrastructure is still made by the cloud provider.

16 March 2011
IT Hardware 62
Organizations expect to save money as they adopt cloud computing in the coming years. (See Figure 66.) This might be good news for customers, but poses a challenge to our IT hardware vendors, as IT hardware purchasing could be increasingly consolidated to a smaller number of ever-growing service providers. Instead of each customer buying their own IT hardware and software, a larger percentage of customers will get their IT indirectly through cloud services from companies like Amazon, Google, and Rackspace. This will likely be counterbalanced by the large IT hardware companies providing their own cloud services with their own equipment as a foundation.
Figure 77, however, clearly depicts a key differentiator between public and private clouds. Server unit shipment growth and revenue growth within private clouds are significantly higher than in public clouds. Despite a rapid unit growth in public cloud servers, the types of servers are indicative of the public services themselves—relatively commoditized, one-size-fits-all technology applications. The server ASP in public clouds is significantly below their private cloud counterparts. This leads us to believe that mega infrastructure technology providers will target the private cloud approach in the near term.
Figure 77: Worldwide Public and Private Cloud Computing Server Revenue and Shipments, 2009–2014 2009 2010 2011 2012 2013 2014 2009-2014
CAGR(%)Revenue($M) Public 582 603 642 678 688 718 4.3% Private 2577 3188 3953 4477 4939 5714 17.3% Shipments (000) Public 318 435 516 610 695 876 22.5% Private 121 181 241 300 361 474 31.3%
Source: IDC, 2010.
Our covered companies will supply components to the public cloud providers, and will reposition their products within the context of private cloud. This will likely net sum to zero, as the cloud providers will buy the software that IT traditionally would have purchased. Our analysis focuses on identifying an unforeseen disruption to our IT hardware companies, and we simply do not foresee a discontinuation of business as usual; this is a revenue shift story and not an accretive revenue story. A key example would be Dell, which is widely known to supply hardware to large cloud computing companies like Rackspace (RAX-US); despite this fact, Dell’s company performance has not shown any fundamental shift as it continues to do business as usual.
As shown in Figure 78, top IT decision makers told us three things about cloud computing: (1) it will shift the balance of power among IT vendors, (2) they expect it to save them money (reinforcing Figure 30), and (3) it represents a major paradigm shift. The key beneficiary of cloud computing will be the existing SaaS vendors. As evidenced in Figure 77, SaaS is the bulk of cloud spending right now, as organizations are trying the public cloud on a piecemeal basis. This is good for SaaS vendors as they should take share from existing client/server based software vendors. As for our covered IT hardware companies, they will need to expand their software offerings, either internally or via acquisition, to leverage the oncoming cloud computing trend.

16 March 2011
IT Hardware 63
Figure 78: The Expectations for Cloud Computing Are High On a scale of 1-5, please rate your agreement with the following statements, where 1 = Strongly disagree and 5 = Strongly agree. Cloud computing, SaaS, IaaS, and PaaS...
1 2 3 4 5
...are marketing terms that I donot fully understand
...are overused terms for whatare already existing products
and services
...are a major paradigm shift inthe IT industry, on par with other
major shifts like mainframe toclient/server and the Internet
...will save my company moneyin the next 3 years
...will shift the balance of poweramong hardware, software, and
cloud vendors
3 = neither agree nor disagree
Source: Credit Suisse IT Survey, February 2011.
Who Is Positioned Well for the Cloud? Owing to the level of press, customer inquiry, and analyst coverage devoted to cloud computing, the majority of technology hardware and software vendors are positioning their products within the context of cloud computing. Regardless of where a cloud is located—external or internal—it requires a scalable, integrated architecture composed of server, networking, and storage hardware combined with application and operations software. Large technology vendors who have a broad portfolio of technology elements have embraced the cloud concept because it is a logical argument as to why a potential customer should buy more technology at one time (in an attempt to increase average sale size). IBM has the longest history in selling these integrated stacks of technology under different names, such as converged infrastructure and adaptive enterprise”.
Along with Cisco and Microsoft, IBM is leading the marketing push for cloud computing. In Figure 79, that IBM was voted the most strategically positioned among our covered IT hardware companies. VMware, with its leading virtualization products, is the key enabling technology for cloud computing, and hence its strength among our respondents. Microsoft is well on the path to providing public cloud services, and as a software company, stands to gain considerably from the adoption of SaaS. Cisco, as the dominant provider of networking infrastructure, is viewed by our respondents as being the most crucial hardware company to the proliferation of cloud computing, as the cloud will depend on the integrity of the network for its delivery, security, and performance.

16 March 2011
IT Hardware 64
Figure 79: Software and Networking Are Strategically Positioned for the Cloud How will the adoption of cloud computing affect the strategic importance (i.e. wallet share) of the following vendors?
0.00 0.50 1.00 1.50 2.00 2.50 3.00 3.50 4.00 4.50 5.00
Apple
Dell
Oracle
NetApp
EMC
HP
IBM
Microsoft
Cisco
VMware
Source: Credit Suisse IT Survey, February 2011.
Technology vendors with only a portion of the entire stack have long pushed the best-of-breed argument with the reasoning being that small, specialized technology providers have the best performing technology in their respective area. Within the context of providing a comprehensive technology solution, the best-of-breed approach argues that the customer is best served to choose the best vendor in each area and integrate multiple technologies for a peak performing solution.
This has been a recurring theme in IT for decades—an almost cyclical question—as to whether technology solutions are optimally purchased as systems or chosen piecemeal on the basis of component merits. We gathered feedback from dozens of CIO’s in our Credit Suisse IT Survey, and the response was resoundingly in favor of the best-of-breed approach (Figure 80). This is not to say that the mega-vendors are at a disadvantage in private cloud deployments since they also sell their solutions on a component basis. What this really tells us, however, is that customers are hesitant to buy intact private cloud computing solutions such as the cloud-in-a-box touted by Oracle. Vendors who sell a system-in-a-box often face an uphill adoption challenge due to the fact that the majority of customer IT architectures are heterogeneous and consist of several vendor technologies. Self contained systems, therefore, can only address a portion of a customer’s business challenges, and their performance advantage is isolated to specific, often high-end applications. Furthermore, the lack of in-house expertise required to implement and operate a proprietary, high-end system-in-a-box may require the customer to take on considerable time and labor expense (consulting services). In contrast, modular systems leverage pre-existing skillsets and technology, and customers seem to be leaning toward more modular, best-of-breed solutions Figure 80 for their private cloud initiatives.

16 March 2011
IT Hardware 65
Figure 80: IT Decision Makers Prefer Best-of-Breed for Private Clouds If you were to build (or currently have) an internal private cloud, you would:
Build a solution from several best of breed hardware, software,
and services vendors67%
Choose a single vendor that could provide all of the
elements - only if it was cheaper
23%
Choose a single vendor that could provide all of the
elements - regardless of cost
8%Other:
2%
Source: Credit Suisse IT Survey, February 2011.
Regardless of whether an IT hardware vendor (like IBM, HP, Dell) is pushing a best-of-breed or total solution approach, there are fundamentally two groups of buyers they are targeting in the context of the cloud concept.
(1) The same group of IT buyers and organizations they’ve called on for years and who are interested in private cloud infrastructure and services (and potentially public cloud services from the IT vendors themselves), and
(2) public cloud service providers who are potentially new buyers of IT infrastructure.
The private cloud is typically aimed at traditional, internal IT buyers, and IT hardware vendors are pushing their pre-existing technologies to these buyers within the private cloud architecture. All service providers offering public cloud services, whether they are PaaS, IaaS, or SaaS require data centers and integrated technology stacks. Therefore, most of our hardware technology vendors are targeting data centers in one way or another, and their cloud offerings are suitable for the public or the private cloud.
An increasing trend we expect in the coming months is a slew of IT hardware vendors entering the cloud service provider space with both public and private cloud offerings. HP and IBM have offered hosting and managed services for several years, but they are not publicly advertised as to not conflict with their hosting/cloud provider customers and other channels which buy their infrastructure in bulk. Our convictions were reaffirmed by the Credit Suisse IT Survey, in which our respondents, in Figure 81, indicated that there is a strong likelihood that Microsoft, IBM, Cisco, HP, Oracle, and EMC would become public cloud service providers in the near term to midterm.

16 March 2011
IT Hardware 66
Figure 81: Large IT Vendors Will Soon Be Public Cloud Providers In the next 12-24 months, which of the following vendors will likely become public cloud service providers (5=very likely, 1=unlikely)?
2 2.5 3 3.5 4 4.5 5
Apple
Dell
EMC
Oracle
HP
Cisco
IBM
Microsoft
Source: Credit Suisse IT Survey, February 2011.
In a recent interview with Microsoft’s Windows Azure team, Dell cloud evangelist Barton George said he foresees the distinction between private clouds, where Dell currently plays, and public clouds dissolving:
In much the same way that we really focused on distinctions between Internet, intranet, and extranet in the early days of those technologies, there is perhaps an artificial level of distinction between virtualization, private cloud, and public cloud. As we move forward, these differences are going to melt away, to a large extent. That doesn't mean that we're not going to still have private cloud or public cloud, but we will think of them as less distinct from one another. It's similar to the way that today, we keep certain things inside our firewalls on the Internet, but we don't make a huge deal of it or regard those resources inside or outside as being all that distinct from each other.
IBM
IBM performed very well in the Credit Suisse IT Survey: among our covered IT hardware companies, it was first in strategic positioning (Figure 79), first in likely revenue gain from cloud computing (Figure 85), first in likelihood to become a public cloud vendor (Figure 81), second in servers for private cloud (Figure 83), and fourth in storage for private cloud (Figure 84). IBM has a vast array of cloud computing hardware, software, and services. No company in the world can match its depth in hardware, software, and services; although HP has offerings in each of these three areas, IBM’s services and software organizations are significantly larger than what HP can bring to bear. IBM’s cloud product portfolio is extremely broad and premium priced when compared with competition. Some example include: application software available on Amazon Web Services (AWS); CloudBurst, a private cloud appliance that competes with the Vblock solution from the VCE coalition and the Exalogic solution from Oracle; the IBM Smart Business Test and Development service that runs on IBM Cloud; SaaS integration tools like Cast Iron; IBM Application Development Services for Cloud; Rational and Tivoli software for cloud; IBM

16 March 2011
IT Hardware 67
implementation services for cloud; IBM Federal Community Cloud; IBM Smart Analytics Cloud and IBM Cloud Labs, to cite many examples. Also, IBM acquired Cast Iron in April 2010 in order to ease customer transition to public and private cloud architectures.
Of the three major infrastructure vendors, IBM has the strongest potential to organically offer, converged SaaS, IaaS, and PaaS services. HP and Dell would require partnerships to offer PaaS, as they do not have IBM’s proficiency in application development and deployment. On January 27, 2011, IBM announced new partnerships around LotusLive public cloud services for providing email, Web conferencing, and collaboration. This is largely a counter to Microsoft and Google’s momentum in similar cloud based tools; it also mentioned new initiatives with SugarCRM (salesforce.com competitor) and Ariba.
Figure 82: No One IT Supplier to Handle It All In the year 2014 , if you could choose to purchase the majority of your IT hardware/software/services from one vendor, who would it be?
I don't agree with the "converged
infrastructure" or "one IT supplier"
notion43%
HP18%
IBM13%
EMC/VMware12%
Microsoft7%
Oracle0%
Cisco0%
Dell3%
Apple2%
Other2%
Source: Credit Suisse IT Survey, February 2011.
HP
HP offers cloud service under many names, depending on the organization spear-heading the customer effort. Traditionally, however, its cloud offering was dual pronged: the Converged Infrastructure product offering and the services led CloudStart offering. Converged Infrastructure refers to a modular architecture consisting of various customizable products from HP’s software, storage, networking, and server offerings. Cloud Start leverages Converged Infrastructure products to enable customers rapidly to build private clouds. This gives HP flexibility in capturing customer business based on the customer’s preference for the do-it-yourself or consulting-led approach. These offerings are primarily aimed at private cloud installations, but could easily be positioned to public cloud providers as well. HP’s server hardware was a favorite response among our survey participants, as shown in Figure 83

16 March 2011
IT Hardware 68
Figure 83: HP Servers Are Well Positioned for the Private Cloud Which server vendors are best positioned to gain share as a result of your re-architecting for internal cloud?
0.00 1.00 2.00 3.00 4.00 5.00 6.00
Other
Whitebox x86
Fujitsu
Sun/Oracle
Dell
Cisco UCS
IBM
HP
Source: Credit Suisse IT Survey, February 2011.
On January 25, 2011, HP announced a cloud compute service for enterprises called “HP Enterprise Cloud Services-Compute;” this is effectively an enterprise private cloud hosted at HP data centers. It also announced an integrated package of hardware, software, and services for building private, internal clouds under the name CloudService. The bulk of these offerings leverage HP’s existing product and services portfolio and leverage HP’s breadth to compete against best-of-breed solutions from Oracle, Cisco, and EMC. We expect similar upcoming announcements from Dell and IBM.
HP’s vast portfolio of hardware, software, and services products is only matched by IBM, and its breadth gives them extreme flexibility for the many faces of cloud computing, whether private, public, or a combination of both. It has the ability to push the entire private cloud solution, best-of-breed components, or position itself as a public provider.
EMC
Owing to its 80% stake in VMware, EMC is undoubtedly strategically positioned in cloud deployments, as depicted in Figure 79. Virtually (no pun intended) all cloud deployments must begin and end with virtualization, and this fact places EMC with an entry point into a majority of cloud opportunities. VMware controls the foundation of cloud computing—virtualization—with over a 50% market share according to IDC. EMC positions the Atmos brand as its cloud storage platform. Atmos is a combination of software and storage hardware that is optimized for global, multitenant, scalable pools of storage that can be leveraged within a cloud deployment. The Credit Suisse IT Survey results depicted (Figure 84) EMC as a customer favorite in storage positioning for internal (private) cloud deployments.

16 March 2011
IT Hardware 69
Figure 84: EMC Storage Is Well Positioned for the Private Cloud Which storage vendors are best positioned to gain share as a result of your re-architecting for internal cloud?
0.00 1.00 2.00 3.00 4.00 5.00 6.00 7.00 8.00
Other
Sun/Oracle
Hitachi
Dell
IBM
HP
NetApp
EMC
Source: Credit Suisse IT Survey, February 2011.
Although EMC alone appears to be a one dimensional storage vendor, in November 2009 it entered into a joint venture with Cisco and VMware named VCE (The Virtual Computing Environment Company). The VCE coalition is tasked with expanding customer adoption of the three companies combined cloud solution, named Vblock. This combined solution is a very potent competitor to IBM and HP comprehensive technology offerings. They go to market by enabling a community of systems integrators, service providers, channel partners, and independent software vendors (ISVs). The coalition has also established unified presales, professional services and support capabilities to simplify customer engagement. This best-of-breed solution is well positioned to capitalize on the customer preference for using best in class products to build out their private clouds. (See Figure 80.)
Dell
Unlike HP and IBM, Dell lacks essential storage, networking, and software components to provide an end-to-end cloud offering. Dell’s cloud strategy is loosely defined around existing components and services, which can provide elements of a cloud solution. Their recent acquisition of Boomi, a SaaS integration company indicates a desire to be a more strategic cloud provider; Boomi facilitates the connection of private and public cloud software applications (similar to IBM’s Cast Iron acquisition).
Dell, however, ranks last among our covered IT hardware companies in strategic positioning (Figure 79) and potential revenue gain (Figure 85) for cloud computing. This is despite the fact that Dell is a commonly mentioned supplier to several of the top cloud providers. But, as we’ve discussed earlier, they are providing relatively commoditized hardware within a (cloud) paradigm that is focused on squeezing cost out of IT. It seems logical for Dell to instead consider providing its own cloud services based on its hardware products. A limitation for them, however, will be their lack of depth (compared with IBM and HP) in software. Dell does have a growing presence in IT (operations) management software, and this is a key piece to both becoming and supplying a cloud provider.
During the last week of January 2011, rumors began circulating of Dell’s potential entry into the public cloud arena, widely viewed as a me-too offering alongside HP and IBM announcements of new cloud services. As a major supplier to several cloud providers, Dell will have to carefully balance the upside to these services with channel conflict it may incur by competing with service provider customers. If Dell were to offer IaaS and/or PaaS services, it would likely leverage its strong partnership with Microsoft and base the offerings around Microsoft’s Azure products.

16 March 2011
IT Hardware 70
NetApp
NetApp is the second-largest independent Network-Attached-Storage vendor in the world behind EMC and No. 3 to EMC and IBM for external disk storage. Storage is a key element of cloud architecture, making NetApp invariably part of the cloud conversation. They acquired Akorri Networks in January 2011—a virtualization management software company—in a move that gives them access to Akorri’s large virtualization customer base as a means to cross-sell NetApp storage devices. NetApp is looking to leverage virtualization in a manner similar to EMC, giving it access to storage opportunities in the private and public cloud. As shown in Figure 84, our IT survey was very favorable to NetApp’s storage potential for cloud computing – it was second only to EMC.
As a best-of-breed storage vendor, NetApp has strong potential to play to customer private cloud preferences for piecing together the best components for a high performance solution (as our survey reinforce in Figure 80). Like EMC, NetApp has a very strong relationship with Cisco and VMware, called the “Imagine Virtually Anything” initiative, allowing it to compete with HP and IBM for storage hardware and storage software portions of cloud deployments.
Cisco
Despite not being one of our covered IT hardware companies, we must mention Cisco since they are one of the main beneficiaries of cloud computing. In fact, our survey respondents resoundingly mentioned them as the company with the most to gain strategically (Figure 79) and on a revenue basis (Figure 85). Note in Figure 79 that it is no coincidence that the largest virtualization, networking, and software companies are at the top of the list. Each of these three areas are a mandatory element of cloud computing, and one would expect that cloud computing will bolster their strategic importance. With Cisco’s recent entry (the UCS products) into the server space, its position is arguably stronger and should make them a formidable competitor for HP and IBM for the entire data center.
Cisco UCS (Unified Computing System) is a highly integrated network, server, and software offering that serves as a private cloud “starter kit”, and is a direct competitor to Oracle’s self-contained Exalogic product. A customer evaluating Cisco’s UCS products is generally not looking to only buy servers, but instead is looking for a comprehensive data center solution that includes servers, networking, management tools, and storage. At the core of Cisco’s UCS architecture is the tight integration of internally developed networking and server building blocks that leverage Cisco’s significant IP and innovation in networking and I/O. This combination of products is aimed at competing with IBM and HP, both who have comprehensive data center offerings. Owing to increased competition from IBM and HP for the data center, Cisco felt it was necessary to enter the server market as it was losing leverage by not directly controlling the server IP. To round out their cloud offering, Cisco will often partner with EMC or NetApp for storage and VMware for virtualization software.

16 March 2011
IT Hardware 71
Figure 85: Cisco Is Heavily Favored to Gain Revenue as Cloud Computing Grows How likely are the following vendors to GAIN significant revenue as cloud computing adoption increases (5=very likely, 1=unlikely)
2 2.2 2.4 2.6 2.8 3 3.2 3.4 3.6 3.8 4
Dell
HP
EMC
Microsoft
IBM
Oracle
Cisco
Source: Credit Suisse IT Survey, February 2011.
Oracle
As one of the largest enterprise software companies in the world, Oracle controls a key element of the data center: middleware and database software. Software is the driving force behind the majority of cloud computing as it exists today, given the dominant share held by SaaS implementations. Our survey respondents (Figure 85) feel Oracle stands to gain significant revenue from cloud computing, especially as it migrates its applications to public and private cloud delivery models. Oracle’s January 2010 acquisition of Sun gave them a server and storage offering that makes them a stronger competitor to HP and IBM. Oracle’s most well known cloud offering is their recently (9/2010) announced Exalogic Elastic Cloud. This is a self-contained cloud-in-a-box system containing 30 servers, each loaded with two six-core processors for a total of 360 processor cores. They are interconnected with each other and storage via Infiniband connections.
Oracle also touts the Exadata product line, which is often thought of as the “Oracle Sun Database Machine”, as it combines Sun server and storage technology into an integrated system that is optimized for running Oracle’s market-leading database software. This architecture is aimed at reducing total cost of ownership, and Oracle has publicly referred to Exalogic as a cloud-in-a-box."

16 March 2011
IT Hardware 72
PCs Disruption Coming Over the past five years, PC industry units and revenues have grown 12%/4%, reaching 368mn units with revenues of $249bn in 2010 and representing one of the largest segments in the IT sector. Throughout this period the PC evolved to higher performance specifications, has become more mobile (with tablets being the newest addition) and has increased its penetration in emerging markets. Our extensive proprietary analysis of the PC industry leads us to 10 important conclusions over the next five years.
Figure 86: Top 10 PC Conclusions 1 We have built the first econometric model for PCs (based on 42 countries and 1,000+ data points), and can statistically prove a significant
relationship between PC affordability and PC penetration per capita given R2 values for our regressions between 71% and 86%. 2 Based on our proprietary Bill of Materials analysis (BOM), we believe that long term an acceptable (quality) PC/ tablet can sell at an
average point of $200/$300 respectively. 3 Based on our expectations for GDP growth/ ASP declines of 4%/ -8% long-term we expect consumer unit growth of 18%/18% in 2011/12
(-3%/2% ex-tablets) and 17% LT (2% ex-tablets). 4 As the average age of commercial PCs declines from 6 years last year to 5 years over the next two years we expect unit growth of
17%/16% in 2011/12 (13%/10% ex-tablets). Long term we believe increasing commercial PC penetration of the labor force will drive unit growth of 11% (5% ex-tablets).
5 Combining our consumer and commercial PC models, we expect overall (global) PC unit growth of 18%/17% in 2011/12 (5%/6% ex-tablets) and 14% LT (3% ex-tablets).
6 We expect emerging market unit growth of 19% long-term, driving units from these regions to 55% of global PC demand by 2015 from 46% today.
7 Tablets will be a dominant PC category versus netbooks given i) media optimization, ii) scale up functionality, iii) optimized mobile OS iv) carrier channels and v) instant on/ standby,
8 The transition to tablets will afford PC vendors a once in a lifetime opportunity to break the Wintel duopoly and capture higher value share.9 Based on our expectation for a shift in volumes down PC price tiers, we expect tablet penetration to be highest in lower tiers given the
compute power needs at these levels. Long-term we estimate tablets will penetrate 11% of the desktop market and 54% of the traditional mobile PC market resulting in units of 298mn and revenue of $124bn.
10 We expect traditional PC volumes (the market excluding tablets) to grow 3% LT and decline 6% in revenue terms.
Source: Company data, Credit Suisse estimates.
1) An econometric approach to modeling the consumer, a highly elastic market. We have developed what we believe is the first econometric model for consumer PC demand using a cross section across 42 countries and based upon over 1,000 data points. We find that there is a statistically significant relationship between PC affordability and the PC penetration per capita, (with R squared ranging between 71% and 86% for our multiple regressions). Based on these fundamental relationships, we demonstrate that the elasticity of demand remains above 1.0 and this means that a move to lower price points will drive incremental volume.
2) PCs at $200 are not that far away. Based on an extrapolation of product teardowns, for which we discuss two devices which have sold in significant volume: Dell’s Inspiron Mini 9 (netbook), and the Apple iPad (tablet). We look at how the BOM may evolve in a competitive market and demonstrate that an average quality low-end PC is plausible around $200 ASP within the next five years (with a tablet device on average at $260). We believe the ability for vendors to deliver credible PCs at low price points will drive strong elasticity of demand and penetration.
3) Consumer PC growth of 17% (including tablets) long term. We forecast PC volume growth of 18%/ 18% in 2011/12 (-3%/ 2% ex-tablets) and 17% long-term (2% ex-tablets), given our view that PCs can be delivered in volume at price points as low as $200. This we think will drive the installed base for consumer PCs to 1.2bn LT from 680mn last year.
4) Commercial PC volumes to show robust growth in 2011/12, driven by a corporate refresh. We estimate that the average age of the installed base is now nearly six years, which to us suggests that replacement volume will recover in the near term. Furthermore, our proprietary CS CIO survey suggests a further boost given the transition to Windows 7 and new hardware releases (more powerful specs and chip releases). As PC penetration of the labor force continues to increase, we forecast commercial PC volume growth 17%/16% in 2011/12 (13%/10% ex-tablets) and 11% LT (5% ex-tablets).

16 March 2011
IT Hardware 73
5) Overall PC units to grow 18%/17% in 2011/2012 (5%/6% ex-tablets) and 14% long term (3% ex-tablets) driven by a move down market. Long term, we believe that the PC market will rise in volume terms to 712mn from 368mn last year driven by a shift down market. In fact, based on our pricing analysis, we estimate that some 67% of volume or 475mn units will sell below a price category of $500 by 2015 (versus 31% in 2010). This combined with increasing competition means that we expect ASPs of $675 in 2010 to decline to $415 long term (CAGR of -9% versus -7% historically). However, despite this pricing pressure, we expect long-term PC revenue growth of 4%.
6) A shift towards emerging markets. We expect emerging markets to represent 55% of PC demand longer term (versus 46% in 2010), driven by increasing penetration per capita and improving affordability as devices continue to become less expensive.
7) Tablets are different from netbooks. We believe there are several reasons why tablets will have a more meaningful impact on the PC industry than netbooks historically. These include (1) optimization for consuming media, (2) functionality that can be scaled up (3) a mobile OS optimized for the smaller form factor, (4) leverage from new carrier channels and (5) instant on/ longer standby. So far we have observed a high level of usage similar to smartphones, with significant interest in each of consumer and corporate environments.
8) The PC value chain and industry structure may change. We estimate that nearly three quarters of the PC industry (supply chain) profits accrue to the Wintel duopoly versus a mere 20% for the top five PC vendors. In contrast, for the handset market (where software/chipset are delocalized) the top five OEMs account for some 90% of industry profits. We expect the tablet market to emerge with a profit structure in between these two markets, and for this reason believe PC vendors will have a once in a generation opportunity to break the Wintel duopoly and capture a higher value.
9) Tablets to represent a $120bn market long term. The tablet market is inherently challenging to forecast given its recent introduction. For this reason, we adopt a price-point based approach which assumes that the demand for a given level of computing necessity can be approximated by price level. We use our global PC forecast by price point to next determine the addressable market for tablets based on a penetration analysis at each of these tiers. We for instance, assume that a low-end PC at $300-499 can be better served by tablets (49% of LT PC demand) versus the high-end $1,000-plus (we assume 2%). We conclude that the tablet market could represent a $120bn market by 2015 with units reaching 298mn (or 42% of total PCs).
Figure 87: We Expect Tablets to Account for Nearly Half of all PC Shipments Less Than $499 by 2015 PCs % by price band Tablet % by price band Tablets by price (mn) 2010 2011E 2012E 2015E 2010 2011E 2012E 2015E 2010 2011E 2012E 2015E $0-$299 6% 8% 11% 19% 0% 10% 17% 47% 0 3 9 62 $300-$499 25% 30% 34% 48% 6% 24% 36% 49% 5 31 62 166 $500-$699 33% 30% 28% 21% 7% 16% 21% 38% 8 21 30 56 $700-$999 24% 21% 18% 9% 4% 10% 16% 22% 4 9 14 13 $1,000+ 13% 11% 9% 4% 0% 0% 2% 2% 0 0 1 0
Total 100% 100% 100% 100% 5% 15% 23% 42% 17 65 116 298 Source: Company data, Credit Suisse estimates
10) The traditional PC industry will see revenue declines. Given our assumption that tablets will represent 42% of PC demand longer term, this inherently drives a significant level of unit and revenue growth. However, excluding tablets, we believe the traditional PC market will only grow 3% in unit terms and actually decline 6% in revenue terms.

16 March 2011
IT Hardw
are 74
Figure 88: We Expect Robust Growth in the Consumer and Commercial Markets to Drive PC units +18%/+17% in 2011/12 US$ in millions, unless otherwise stated
Global (units in 000's, rev in $mn) 2005 2006 2007 2008 2009 2010 2011E 2012E 2013E 2014E 2015E CAGR 05-10 CAGR 10-15EGlobal installed base
Desktop 639,355 685,619 727,826 769,155 789,881 812,472 823,510 837,174 854,858 874,692 896,053 4.9% 2.0%Mobile 162,496 207,696 269,196 355,678 456,239 576,269 720,539 882,458 1,063,788 1,264,237 1,497,237 28.8% 21.0%Total 801,851 893,316 997,022 1,124,833 1,246,119 1,388,741 1,544,050 1,719,632 1,918,646 2,138,928 2,393,289 11.6% 11.5%
% mobile 20.3% 23.3% 27.0% 31.6% 36.6% 41.5% 46.7% 51.3% 55.4% 59.1% 62.6%
Global net add shipmentsDesktop 50,639 47,756 47,223 46,233 29,760 34,988 37,226 42,062 47,625 50,237 54,334 -7.1% 9.2%Mobile 31,398 45,233 61,551 86,539 100,628 120,110 144,354 162,014 181,442 200,580 233,154 30.8% 14.2%Total 82,037 92,988 108,774 132,771 130,388 155,098 181,580 204,076 229,067 250,817 287,488 13.6% 13.1%
% of global units 39% 40% 41% 45% 42% 42% 42% 40% 40% 40% 40%
Global replacement shipmentsDesktop 97,479 102,334 109,342 104,141 108,681 111,468 120,063 128,754 126,438 124,812 121,070 2.7% 1.7%Mobile 32,072 35,633 45,953 55,315 69,283 101,529 131,815 174,912 212,757 254,874 303,935 25.9% 24.5%Total 129,551 137,967 155,295 159,457 177,964 212,997 251,878 303,666 339,195 379,686 425,005 10.5% 14.8%
% of global units 61% 60% 59% 55% 58% 58% 58% 60% 60% 60% 60%
Average age of instal led base (yrs)Desktop 6.0 6.2 6.3 7.0 7.1 7.1 6.8 6.4 6.6 6.8 7.2Mobile 4.1 4.6 4.5 4.9 5.1 4.5 4.4 4.1 4.1 4.2 4.2Total 5.6 5.8 5.8 6.3 6.3 5.9 5.5 5.1 5.1 5.1 5.0
Global unit shipmentsDesktop 148,119 150,090 156,564 150,374 138,441 146,457 157,290 170,816 174,063 175,050 175,404 -0.2% 3.7%Mobile 63,470 80,866 107,504 141,854 169,911 221,638 276,169 336,926 394,199 455,454 537,089 28.4% 19.4%
Notebook 63,470 80,866 107,504 133,404 138,861 170,756 180,808 193,998 211,910 221,957 227,671 21.9% 5.9%Netbook NM NM NM 8,450 31,050 33,683 30,117 27,004 22,297 16,262 11,324 NM -19.6%Tablet NM NM NM NM NM 17,200 65,243 115,923 159,991 217,234 298,095 NM 76.9%
Total 211,588 230,955 264,068 292,228 308,352 368,095 433,458 507,742 568,261 630,504 712,493 11.7% 14.1%Seq. change (%) 15.4% 9.2% 14.3% 10.7% 5.5% 19.4% 17.8% 17.1% 11.9% 11.0% 13.0%
Total ex-tablets 211,588 230,955 264,068 292,228 308,352 350,895 368,215 391,818 408,270 413,269 414,399 10.6% 3.4%Seq. change (%) 15.4% 9.2% 14.3% 10.7% 5.5% 13.8% 4.9% 6.4% 4.2% 1.2% 0.3%
Consumer PC units 78,714 89,387 104,721 123,041 147,704 190,112 224,960 266,015 308,970 352,640 411,394 19.3% 16.7%Seq. change (%) 19.4% 13.6% 17.2% 17.5% 20.0% 28.7% 18.3% 18.2% 16.1% 14.1% 16.7%
Commercial PC units 132,874 141,569 159,348 169,187 160,648 177,984 208,499 241,727 259,291 277,863 301,099 6.0% 11.1%Seq. change (%) 13.1% 6.5% 12.6% 6.2% -5.0% 10.8% 17.1% 15.9% 7.3% 7.2% 8.4%
Global unit shipments share (%)Desktop 70.0% 65.0% 59.3% 51.5% 44.9% 39.8% 36.3% 33.6% 30.6% 27.8% 24.6%Mobile 30.0% 35.0% 40.7% 48.5% 55.1% 60.2% 63.7% 66.4% 69.4% 72.2% 75.4%
Notebook 30.0% 35.0% 40.7% 45.7% 45.0% 46.4% 41.7% 38.2% 37.3% 35.2% 32.0%Netbook NM NM NM 2.9% 10.1% 9.2% 6.9% 5.3% 3.9% 2.6% 1.6%Tablet NM NM NM NM NM 4.7% 15.1% 22.8% 28.2% 34.5% 41.8%
Total 100.0% 100.0% 100.0% 100.0% 100.0% 100.0% 100.0% 100.0% 100.0% 100.0% 100.0%
Global ASP (US$)Desktop 805 726 727 692 615 605 552 505 458 417 379 -5.5% -8.9%Mobile 1,292 1,174 1,111 975 788 722 621 548 501 460 427 -11.0% -10.0%
Notebook 1,292 1,174 1,111 1,008 872 803 704 616 552 496 451 -9.1% -10.9%Netbook NM NM NM 457 415 373 326 288 263 241 221 NM -10.0%Tablet NM NM NM NM NM 600 528 494 468 439 416 NM -7.0%
Total 951 883 883 830 710 675 596 533 488 448 415 -6.6% -9.3%Seq. change (%) -12.8% -7.1% 0.0% -6.1% -14.4% -4.9% -11.8% -10.5% -8.5% -8.2% -7.3%
Total ex-tablets 951 883 883 830 710 679 608 545 496 452 414 -6.5% -9.4%Seq. change (%) -12.8% -7.1% 0.0% -6.1% -14.4% -4.4% -10.5% -10.4% -9.0% -8.8% -8.5%
Global revenue (US$ mn)Desktop 119,175 108,988 113,820 104,077 85,134 88,665 86,810 86,281 79,702 72,931 66,462 -5.7% -5.6%Mobile 82,019 94,950 119,429 138,353 133,914 159,973 171,567 184,576 197,656 209,486 229,265 14.3% 7.5%
Notebook 82,019 94,950 119,429 134,493 121,036 137,075 127,300 119,508 116,875 110,117 102,617 10.8% -5.6%Netbook NM NM NM 3,860 12,878 12,578 9,818 7,779 5,873 3,919 2,498 NM -27.6%Tablet NM NM NM NM NM 10,320 34,450 57,289 74,908 95,450 124,151 NM 64.5%
Total 201,195 203,937 233,250 242,430 219,047 248,638 258,378 270,857 277,357 282,417 295,727 4.3% 3.5%Seq. change (%) 0.6% 1.4% 14.4% 3.9% -9.6% 13.5% 3.9% 4.8% 2.4% 1.8% 4.7%
Total ex- tablets 201,195 203,937 233,250 242,430 219,047 238,319 223,927 213,568 202,449 186,967 171,576 3.4% -6.4%Seq. change (%) 0.6% 1.4% 14.4% 3.9% -9.6% 8.8% -6.0% -4.6% -5.2% -7.6% -8.2%
Consumer revenue % of total 36.7% 38.0% 39.1% 41.6% 46.4% 50.4% 50.3% 51.1% 54.2% 56.8% 59.3%Commercial revenue % of total 63.3% 62.0% 60.9% 58.4% 53.6% 49.6% 49.7% 48.9% 45.8% 43.2% 40.7%
We estimate the overall PC market (consumer and commercial) will be 433mn/ 507mn units in 2011/12 (+18%/+17%) driven by:
1) Consumer market growth driven by emerging markets. We expect that improving affordability at the low-end of the market to drive strong growth in EMs (which represented 45% of unit market in 2010) and overall consumer unit growth of 18%/ 18% in 2011/12 (to 225mn/ 266mn units).
2) Corporate refresh to boost commercial PC market. We believe the commercial PCs will grow 17%/16% in 2011/12 to 208mn/ 242mn units as i) the average age of PCs is high at 6 years (versus 5 years historically), ii) Windows 7 is installed at enterprises and iii) PCs see continued performance improvements.
3) Replacement rate to show a moderate up tick. As PC ASPs continue to decline (thus increasing affordability in the consumer market) and corporations refresh their fleets over the next two years, we expect the long-term replacement rate to trend toward 20% (5-year cycle).
Large tablet opportunity. We expect tablet shipments of 65mn/ 116mn in 2011/12 and 298mn LT—representing 42% of overall PC shipments.
22
33
11
Source: Company data, Credit Suisse estimates.

16 March 2011
IT Hardware 75
Consumer vs. Commercial, Desktop versus Mobile Our approach to modeling the PC industry is based upon the fundamental belief that the driver for each market, i.e., the consumer and corporate markets, are quite diverse, and for this reason, we choose to model these segments of the market separately. For the consumer market, we employ an affordability-based approach, whereas in the commercial segment our model is driven by penetration of the labor force and corporate refresh cycles. Within each of these markets we observe a clear industry shift toward mobile, and as such, forecast these segments as two distinct pieces.
PCs: A Debate Around Whether to Include Tablets Before we begin discussing the fundamental drivers to our PC forecasts, we believe it is necessary to define what constitutes a PC. We refer to Gartner’s definition below:
“A PC is a general-purpose computer that is distinguished from other computers by its adherence to hardware and software compatibility. A PC system is viewed as a single unit, which includes a CPU, a monitor, a mouse and a keyboard. Furthermore, Gartner does not include thin-client terminals in the PC classification. This category includes desk-based PCs, all-in-one PCs, mini-PCs, other desk-based PC terms such as white-box and self-assembled PCs, mobile PCs such as netbooks and tablet PCs.”
Interestingly, while many reputable industry sources have included tablet PCs in their definition of a PC, they excluded media tablets. For example, Intel provides PC unit forecasts excluding the media tablet market. Furthermore, Gartner has recently cited media tablets as being a key reason for PC weakness in 2010:
“Worldwide PC shipments grew at a lower rate than our projection […} Overall, holiday PC sales were weak in many key regions due to the intensifying competition in consumer spending. Media tablets and other consumer electronics devices, such as game consoles, all competed against PCs.”
Here Gartner defines a tablet PC as a note-book style device, presumably based on the x86 architecture and a media tablet as follows:
Media tablets are "computer processors in a tablet-size form factor, which are optimized for communications and media consumption. Their processors are more powerful than previous-generation tablets, but less capable than the same/equivalent generation of laptops or PCs.”
While debate around content consumption and creation on media tablets will continue to evolve, we believe that in large instances media tablets (which heretofore will just be referred to as tablets, with tablet PCs being included in our notebook PC estimate) will at the least, become a substitute at the low-end of the PC market. Indeed, even within our CIO survey we found that there remains significant corporate appetite for PCs. We think this definition is an important distinction to make, because once tablets are included in our forecasts a very different perspective of the PC market evolves:

16 March 2011
IT Hardware 76
Figure 89: Y/Y PC Growth Higher This Next Year When Tablets Are Included
0
20
40
60
80
100
120
140
Q109 Q209 Q309 Q409 Q110 Q210 Q310 Q410 Q111 Q211 Q311 Q411
Uni
ts (m
n)
-5%
0%
5%
10%
15%
20%
25%
% Y
oY g
row
th ra
te
Desktop Mobile Tablet YoY annualized PC growth rate YoY annualized PC ex tablet growth rate Source: Company data, Credit Suisse estimates, Gartner.
The market is not slowing. As shown in Figure 88, while we expect the PC market excluding tablets to experience a deceleration in positive unit growth through 2015 (at a 3% CAGR versus 11% from 2005-2010), over the past few quarters, once tablets are included, we think that market growth has actually been quite resilient. In fact, as shown in Figure 89, while traditional PC volumes in the last four quarters are still up 13.8% yoy, when we include tablets this increases to 19.4% yoy growth. The difference only becomes further pronounced going forward.
Figure 90: Despite the First Tablet Launches in 2010, Smartphone Y/Y Has Accelerated
0
20
40
60
80
100
120
Q108 Q208 Q308 Q408 Q109 Q209 Q309 Q409 Q110 Q210 Q310 Q410
Smar
tpho
ne u
nits
(mn)
0%
10%
20%
30%
40%
50%
60%
70%
80%
90%
100%
Smar
tpho
ne Y
/Y g
row
th, %
Smartphone units Smartphone Y/Y unit growth, %
Apple iPad launch
Source: Company data, Credit Suisse estimates, Gartner.
Will the tablet market cannibalize the smartphone market? As we demonstrate above in Figure 90 smartphone unit growth has begun accelerating despite the launch of tablets like

16 March 2011
IT Hardware 77
Apple’s iPad (April 2010) and subsequently Samsung’s Galaxy Tab in Q410. This we think is a strong argument against the view that tablets have begun and will continue to cannibalize smartphone unit sales. Furthermore, from a form factor perspective we think smartphones as ultraportable will inherently occupy a separate use case/ environment.
An Econometric Analysis for the Consumer Market Fundamentally, we believe the core of any predictive consumer PC market size analysis should be based on strong linkages between key economic variable like price, GDP per head (income proxy) and penetration per capita. Following this analysis, we then think it makes sense to have the debate around which PC form factor will garner the most momentum or take market share. With this as our starting point, we ran several regressions among these variables with the dependent variable in each case being penetration per capita and conclude that the relationship is statistically significant. We would highlight three main points:
R-Squared Values of 70%-Plus between PC Penetration per User and Affordability.
Given cross sectional data for 42 countries over 8 years (see Figure 91), we find a statistically significant relationship between PC penetration per user and ASP/GDP per head (which we use as a proxy for affordability). In fact, R-squared values for the four regressions we use in our econometric model (to account for geographical bias) range from 71%, used in our developing market regression analysis to 97% in the US market. (See Figure 92.)
Figure 91: The 42 Countries Used in Our Regression Analysis Represent 70% of the Global Population and 88% of Global GDP # Country Pop (mn) GDP ($bn) # Country Pop (mn) GDP ($bn) 1 Argentina 41 333 24 Netherlands 17 811 2 Australia 22 1,024 25 New Zealand 4 121 3 Austria 8 395 26 Norway 5 381 4 Belgium 11 480 27 Norway 5 381 5 Brazil 193 1,693 28 Philippines 94 173 6 Canada 34 1,377 29 Portugal 11 236 7 Chile 17 170 30 Russia 140 1,281 8 China 1,341 5,506 31 Singapore 5 210 9 Colombia 46 243 32 South Africa 50 296 10 Denmark 6 316 33 Spain 46 1,463 11 Finland 5 244 34 Sweden 9 424 12 France 63 2,698 35 Switzerland 8 506 13 Germany 82 3,450 36 Taiwan 23 414 14 Greece 11 318 37 Thailand 68 284 15 Hong Kong 7 223 38 Turkey 71 662 16 India 1,216 1,357 39 United Kingdom 62 2,216 17 Indonesia 235 572 40 United States 310 14,492 18 Ireland 4 222 41 Venezuela 29 321 19 Italy 60 2,140 42 Vietnam 88 99 20 Japan 127 5,212
21 Korea 49 883 Total 4,762 54,749 22 Malaysia 28 206 Global 6,810 61,963 23 Mexico 109 918 % of global 70% 88% Source: IMF, Credit Suisse estimates.

16 March 2011
IT Hardw
are 78
Figure 92: Summary of Regressions Used on Our Econometric PC Model and Methodology
United States regression by quarter
20%
30%
40%
50%
60%
0% 1% 2% 3% 4% 5%
PC ASP / GDP per capita
PC p
enet
ratio
n pe
r cap
ita
2009
2006
2003
R2: 97%y = -.236ln(x) - .505t-statistic intercept: -20t-statistic x: -34Std. deviation: 1.2%Number of data points: 37
First econometric model. We have developed what we believe to be the first econometric-based PC model based on the fundamental relationship between PC penetration per capita and affordability(income or as a proxy GDP per capita):
High R2 values. Our regressions prove a high level of correlation amongst the data, with R2s ranging from 71% to 97%.
T-stat values at >15 suggest a high level of significance for the regression coefficients.
Based on our regression analysis, we believe there is a clear
link between ASP, GDP/income and units which can be used to drive a long-term demand model for the PC market.
1
11 )/(
ln+
++ ⋅+=
t
tt capitaGDP
ASPbanpenetratio
#4#4
#4#4
Global (developed + emerging) regression by quarter
-10.0%
0.0%
10.0%
20.0%
30.0%
40.0%
50.0%
0% 10% 20% 30% 40% 50% 60% 70% 80%
PC ASP / GDP per capita
PC p
enet
ratio
n pe
r cap
ita
2009
2006
200 3
R2: 80%y = -.099ln(x) - .125t-statistic intercept: -66t-statistic x: -28Std. deviation: 4.8%Number of data points: 1,070
#3#3 #3#3
Developed market regressions by quarter
0%
10%
20%
30%
40%
50%
60%
0% 2% 4% 6% 8% 10% 12%PC ASP / GDP per capita
PC p
enet
ratio
n pe
r cap
ita
2009
2009
R2: 71%y = -.126ln(x) - .187t-statistic intercept: -14t-statistic x: -34Std. deviation: 3.2%Number of data points: 486
R2: 86%y = -.123ln(x) - .288t-statistic intercept: -21t-statistic x: -30Std. deviation: 1.8%Number of data points: 154
2006
2003
200320
06
#2
#2
#1
#1
Source: Company data, Credit Suisse estimates.
Countries included (19 total): Australia, Austria, Canada, Denmark, Finland, France, Germany, Hong Kong, Japan, Korea, Netherlands, New Zealand, Norway, Singapore, Sweden, Switzerland, Taiwan, United States, United Kingdom; Countries included (6 total): Belgium, Greece, Ireland, Italy, Portugal, Spain

16 March 2011
IT Hardware 79
The Elasticity of Demand Is Greater than One
Using quarterly PC unit shipment data and the corresponding global average ASPs, we have plotted a simple demand curve for the consumer PC market. (See Figure 93.) This then allows us to estimate the incremental volume impact from a unit change in price. In fact, while demand elasticity for global consumer PCs still remains at 1.2 (as of 2009), this has come down over the last six years from 3.1 in 2003. That said, the global elasticity remains above one, which suggests that any industry price cuts will generate relatively higher volumes and actually be accretive to industry units.
Figure 93: Demand Elasticity for Global PCs Is Greater than One
y = -430.68Ln(x) + 5107R2 = 0.8984
$600
$700
$800
$900
$1,000
$1,100
$1,200
$1,300
0 5,000 10,000 15,000 20,000 25,000 30,000 35,000 40,000Global quantity demanded quarterly ('000)
ASP
(US$
)
2003 - Elasticity: -3.1
2004 - Elasticity: -2.7
2005 - Elasticity: -2.0
2006/07 - Elasticity: -1.6
2008 - Elasticity: -1.5
2009 - Elasticity: -1.2
Price elasticity of demand for PCs on a global level is
still greater than 1, which means that a further
reduction in ASPs will lead to a more than offsetting
increase (additional 20%) in quantity.
Source: Company data, Credit Suisse estimates, Gartner.
So How Do We Use This to Be Predictive?
Once the core relationship between GDP per capita, pricing, and penetration is established based upon the regressions shown in Figure 92 (which we again highlight to make the distinction between developed and emerging markets), forecasting becomes more straight forward on a long-term basis using the core inputs of ASP decline by country as well as GDP and population growth. Given GDP and population growth rates over the long term prove to be relatively stable, the key assumption driving our forecast, therefore ends up being how the ASP of a PC may evolve.
How Low Could PC Price Points Go? $200 As discussed, we have found that PC penetration for consumers is closely linked to the ASP of the device. While the decline in component prices, and hence the BOM of the device is clearly the largest driver of ASP declines, equally we’ve found that new device categories, like netbooks, are further able to penetrate lower price points given lower

16 March 2011
IT Hardware 80
specifications. Taking into account these data, one thing appears to be consistent: ASPs for the consumer market have seen a relatively stable decline of ~7% over the past five years. Furthermore, this trend has been observed across all price points as demonstrated in Figure 94. While in 2004, only 3% of total PC volume sold for less than a $500 ASP, this number last year was significantly higher at 31%. For this reason, we can conclude that the long-term installed base for PCs is ultimately determined by the retail ASP of the PC at least at the lower-end of the market.
Figure 94: A Shift Toward Lower Price Points Has Been a Clear Trend Over the Past Eight Years
0%
10%
20%
30%
40%
50%
60%
70%
80%
90%
100%
< $9
9
< $1
99
< $2
99
< $3
99
< $4
99
< $5
99
< $6
99
< $7
99
< $8
99
< $9
99
< $1
099
< $1
,199
< $1
,299
< $1
,399
< $1
,499
< $1
,500
Cum
ulat
ive
unit
shar
e un
der p
rice
poin
t, %
2002 2003 2004 2005 2006 2007 2008 2009 2010
2002
2003
2004
2005
2006/072008
2009
Over the past six years (2004-10):
1) The cumulative percentage of total global volume under a $500 ASP has increased to 31% from 3%.
2) And the cumulative percentage of total global volume under a $1,000 ASP has increased to 87%
1
1
2
2
2010
Source: Company data, Credit Suisse estimates, Gartner.
Product Portfolio to Evolve to Lower Price Points
The key issue next is forecasting the average low end retail price of a PC in the long term. To understand this we have looked at two major elements of the market.
Product portfolio has room to expand in the low end. We believe notebooks today selling under $500 in the top 10 PC OEMs’ portfolios only represent some 10% of their total selling product SKUs. This we think offers significant opportunity for consumers to choose a lower-end device over time as component costs continue to decline (whilst maintaining similar performance specs). This compares with nearly 72% of the top 10 PC OEMs portfolios in netbooks selling under $500. While the two categories of mobile PCs differ in terms of specifications, we think the netbook market serves to demonstrate the willingness of PC vendors to price a product at the lower end of the market given lower costs.
BOM extrapolation. A second method we have used to ascertain how low PC price points can go is based on the extrapolation of product teardowns, for which we discuss two devices which are selling well: Dell Inspiron Mini 9 (netbook), and Apple iPad (tablet). The reasons for selecting such devices are two fold: (1) we believe that the specifications of

16 March 2011
IT Hardware 81
each of these two devices deliver an adequate level of computing power; (2) the devices are branded (which would in theory suggest acceptable quality per an average consumer). From the teardowns, we can argue for the long-term price of a PC or computing device based on how the cost/BOM may evolve in a competitive market (taking into account LT forecasts for margins, both on the company and retail levels). Our analysis leads us to conclude that an decent quality low-end PC is plausible around $200 ASP within the next five years.
■ Dell Inspiron Mini 9. This PC is a netbook which originally launched in Q308 at a price of $350, but was subsequently lowered to $280 over the next six months. The device features a Intel N270 processor (1.6 GHz) running a Linux-based OS and has 512MB of DDR2 RAM, a 8.9” screen and offers connectivity through Wi-Fi (though not through Bluetooth or a cellular baseband chip). Based on the teardown data from Portelligent (see Figure 95 below), we estimate the BOM of this device (adjusting for specific “standard’ factors” i.e., adding Windows software at $35) is close to $270 today. Over the long term, we estimate component declines in-line with historical data: (1) digital engine and processor declines at 6% per annum, (2) NAND and DRAM prices decline at 16%/19% pa, and (3) the nondigital engine and OS declines at 4% per annum. We believe this means (assuming constant commercial and retail margins of 5% each) that BOM will reach ~$180 LT, suggesting a LT ASP of $200.
■ Apple iPad. While several vendors have launched tablets to the market so far this year, given the success of Apple’s iPad and based on the fact that Apple has priced the device aggressively from launch suggests to us that this is the best used for long-term extrapolation for an average tablet device. We’ve made certain adjustments to the model (as noted in Figure 96) like reducing the storage (memory) of the device. Longer term, we assume component declines are consistent with that of the PC industry (as discussed in the paragraph above) and LT we believe the BOM of a low-end average tablet can reach $300. Based on our assumption for industry commercial (15% LT) and retail margins (5% LT), this implies a LT ASP of $300.
Of course, the above is not to say that we expect the ASP for the PC industry to fall to $200 long term, but we use this as an illustration to show how the low end of the market can evolve. In reality, vendors will seek to stabilize or increase pricing by constantly upgrading functionality and performance. This said, we do expect a number of vendors to be able to supply PCs at this price point and as such think that while it is an illustrative example, it has significant implications for the industry in light of our conclusions around affordability and PC penetration discussed above.

16 March 2011
IT Hardw
are 82
Figure 95: PC BOM Extrapolation for Dell Inspiron Mini 9 (Netbook) Suggests a LT Price of ~$200
Low-end mobile PC BOM 2009 2010E 2011E 2012E 2013E 2014E 2015E CAGR 2010-15EIntel Atom Processor 22.6 20.4 19.1 17.9 16.8 15.7 14.7 -6%Intel Graphics/Memory Controller 17.7 15.7 14.7 13.8 13.0 12.2 11.4 -6%I/O Controller Hub 13.0 11.5 10.8 10.2 9.5 8.9 8.4 -6%Serial Flash Memory 0.3 0.3 0.3 0.2 0.2 0.2 0.2 -6%MLC NAND Flash Memory 6.1 4.6 3.9 3.3 2.8 2.3 2.0 -16%SDRAM Memory 4.6 3.3 2.7 2.2 1.7 1.4 1.2 -19%WLAN Baseband/MAC/Transceiver 4.9 4.4 4.1 3.8 3.6 3.4 3.2 -6%Others IC Component 14.9 13.3 12.4 11.7 11.0 10.3 9.6 -6%Digital engine costs ($) 84.1 73.5 68.0 63.1 58.6 54.4 50.6 -7%
Modular & Odd Form Components 7.5 6.9 6.6 6.3 6.0 5.8 5.5 -4%Small Active Components 2.1 2.0 1.9 1.8 1.7 1.7 1.6 -4%Passive Components 4.1 3.7 3.6 3.4 3.3 3.2 3.0 -4%Connector Components 6.8 6.2 6.0 5.7 5.5 5.2 5.0 -4%Substrates 8.0 7.3 7.0 6.7 6.5 6.2 5.9 -4%Insertion 4.1 3.7 3.6 3.4 3.3 3.1 3.0 -4%Card Test 0.8 0.7 0.7 0.6 0.6 0.6 0.6 -4%Display Module 35.7 31.7 29.8 27.9 26.2 24.6 23.1 -6%Battery Pack 20.2 18.0 16.8 15.8 14.8 13.9 13.0 -6%Enclosures 26.3 24.1 23.1 22.2 21.2 20.3 19.5 -4%Miscellaneous 3.5 3.2 3.1 2.9 2.8 2.7 2.6 -4%Non Digital engine costs ($) 118.9 107.6 102.1 96.8 91.9 87.2 82.8 -5%
Component BOM excl. assembly ($) 203.0 181.0 170.1 159.9 150.5 141.7 133.4 -6%
Final Assembly & Test 25.3 22.8 21.5 20.2 19.0 18.0 17.0 -6%as a % of factory ASP 8.5% 8.5% 8.5% 8.5% 8.5% 8.5% 8.5% NMTotal Component BOM ($) 228.3 203.8 191.6 180.1 169.5 159.7 150.4 -6%
Supporting Material & Pack Out 3.8 3.4 3.3 3.2 3.0 2.9 2.8 -4%Freight and Insurance 2.0 1.8 1.8 1.7 1.6 1.5 1.5 -4%Testing and Quality 1.0 0.9 0.9 0.8 0.8 0.8 0.7 -4%Software 35.0 32.2 30.8 29.5 28.3 27.1 26.0 -4%Accessories 0.0 0.0 0.0 0.0 0.0 0.0 0.0 NMTotal BOM ($) 270.0 242.2 228.4 215.4 203.2 192.0 181.4 -6%
Factory ASP ($) 283.5 254.3 239.8 226.1 213.4 201.6 190.5 -6%Gross margin (%) 5.0% 5.0% 5.0% 5.0% 5.0% 5.0% 5.0% NM
Retail ASP ($) 297.7 267.0 251.8 237.4 224.0 211.7 200.0 -6%Retailer margin (%) 5% 5% 5% 5% 5% 5% 5% NM
1) Extrapolating a low-end mobile PC BOM. We begin with a Dell Inspiron Mini 9 BOM (based on a Portelligent teardown) and make the following assumptions through 2015:
a) Digital engine declines (ex. processor/ memory) at 6% based on historical levels of decline in semi content pricing.
b) Atom processor price declines at a rate historical to Intel’s PC CPUs (~6% pa).
c) NAND and DRAM price declines of 16%/19% respectively based on historical DRAM trends.
d) Non-digital engine declines of 4% based on historical trends.
e) Microsoft OS (at $35) remains the dominant PC OS, with a modest price decline of 4% pa.
2) Margins for PC OEMs and Retailers to remain at 5%.
3) We expect low-end mobile PC to sell for $200 in 2015, down from $300 today (-6% CAGR).
2211
33
Source: Portelligent, Company data, Credit Suisse estimates.

16 March 2011
IT Hardw
are 83
Figure 96: Tablet Extrapolation of Apple’s iPad Suggests a LT Price of ~$300
Product 16GB 3G iPad 16GB WiFi only Lowest-end iPad with cellular capabilitiesYear 2010 2010 2010 2011E 2012E 2013E 2014E 2015ERF Transceiver 2.7 0.0 2.7 2.5 2.4 2.2 2.1 2.0 -6%Baseband 14.3 0.0 14.3 13.4 12.6 11.8 11.1 10.5 -6%Application / Media Processor 16.3 16.3 16.3 15.5 14.7 14.0 13.3 12.6 -5%Memory (internal) 7.3 5.5 7.3 6.5 5.9 5.3 4.8 4.3 -10%Memory (external) 23.3 23.3 11.7 10.5 9.4 8.5 7.7 6.9 -10%Analog component 21.1 15.5 21.1 19.8 18.7 17.5 16.5 15.5 -6%Accelerometer 1.0 1.0 1.0 1.0 0.9 0.8 0.8 0.7 -6%Compass 1.0 1.0 1.0 1.0 0.9 0.9 0.8 0.8 -6%GPS 1.6 0.0 1.6 1.5 1.4 1.3 1.2 1.1 -6%Wi-Fi + Bluetooth 5.1 5.1 5.1 4.8 4.5 4.2 4.0 3.8 -6%Digital Engine costs ($) 93.7 67.8 82.0 76.5 71.4 66.6 62.2 58.1 -6.7%
PCB (Substrates) 6.7 5.3 6.7 6.4 6.2 5.9 5.7 5.5 -4%Insertion 8.1 6.8 8.1 7.8 7.4 7.2 6.9 6.6 -4%Card Test 1.1 0.9 1.1 1.1 1.0 1.0 0.9 0.9 -4%Modules 34.8 31.7 34.8 33.4 32.1 30.8 29.6 28.4 -4%Discretes 6.7 5.2 6.7 6.5 6.2 6.0 5.7 5.5 -4%Connectors 6.1 5.9 6.1 5.9 5.6 5.4 5.2 5.0 -4%Mechanical 24.3 24.3 24.3 23.3 22.4 21.5 20.6 19.8 -4%Display 58.5 58.5 58.5 56.2 53.9 51.8 49.7 47.7 -4%Battery Pack 23.3 23.3 23.3 22.4 21.5 20.6 19.8 19.0 -4%Non Digital engine costs ($) 169.6 161.9 169.6 162.9 156.3 150.1 144.1 138.3 -4.0%
Component BOM excl. assembly ($) 263.3 229.8 251.6 239.3 227.7 216.7 206.3 196.4
Final Assembly & Test ($) 47.9 38.0 36.5 34.0 31.8 29.5 27.5 25.5 -6.9%as % of factory ASP 8.0% 8.0% 8.5% 8.6% 8.7% 8.7% 8.9% 8.9%Total Component BOM ($) 311.2 267.8 288.1 273.3 259.5 246.2 233.8 221.9 -5.1%
Freight and insurance 5.0 5.0 5.0 5.0 5.0 5.0 5.0 5.0 0.0%Testing and quality 5.0 5.0 5.0 5.0 5.0 5.0 5.0 5.0 0.0%IPR 9.3 0.0 8.6 8.2 7.8 7.5 7.0 6.8 -4.7%
as % of total component BOM 3.0% 0.0% 3.0% 3.0% 3.0% 3.0% 3.0% 3.0%Software 10.0 10.0 5.0 5.0 5.0 5.0 5.0 5.0 0.0%Maps 10.0 10.0 5.0 5.0 5.0 5.0 5.0 5.0 0.0%Accessories 4.1 4.1 0.0 0.0 0.0 0.0 0.0 0.0 NMTotal BOM ($) 354.7 301.9 316.7 301.5 287.2 273.7 260.8 248.7 -4.7%
Factory ASP ($) 599.0 475.2 430.8 397.4 366.4 337.6 310.7 285.7 -7.9%Gross margin (%) 40.8% 36.5% 36.0% 31.8% 27.6% 23.3% 19.1% 14.9% 4.2%
Retail ASP ($) 629.0 499.0 452.3 417.2 384.7 354.5 326.2 300.0 -7.9%Retailer margin (%) 5% 5% 5% 5% 5% 5% 5% 5%
Decline2010-15E 1) Extrapolating a mainstream
tablet BOM. We reduce external memory from the iPad BOM (based on Portelligent teardowns) and assume the following through 2015:
a) Digital engine declines (ex. application processor/ memory) at 6% based on historical levels of decline in semi content pricing.
b) Application processor pricing declines at a comparable rate to historical PC CPUs (~5% yoy).
c) Memory declines 10% yoy based on historical NAND prices.
d) Non-digital engine declines of 4% based on historical trends.
2) Margins to compress, tablets to become commoditized over time. We expect gross margins earned by vendors to decline to 15% from the high-30s today.
3) We expect low-end (mainstream) tablets to sell for $300 in 2015, down from $450 today (-8% CAGR).
33
22
11
11
Source: Portelligent, Company data, Credit Suisse estimates.

16 March 2011
IT Hardw
are 84
Figure 97: Consumer PCs to Grow 18%/18% in Each 2011/12 and 17% LT; Tablets to Represent 54% of Consumer PC Volume LT (221mn Units) US$ in millions, unless otherwise stated
Consumer (units in 000's, rev in 2005 2006 2007 2008 2009 2010 2011E 2012E 2013E 2014E 2015E CAGR 05-10 CAGR 10-15EPopulation 6,418,308 6,495,365 6,574,253 6,653,231 6,732,227 6,809,514 6,888,616 6,968,298 7,048,702 7,130,182 7,210,479 1.2% 1.2%
Seq. change (%) 1.3% 1.2% 1.2% 1.2% 1.2% 1.1% 1.2% 1.2% 1.2% 1.2% 1.1%
GDP ($ bi llions) 53,257 55,520 57,867 58,913 57,825 60,054 62,082 64,414 66,840 69,364 71,965 2.4% 3.7%Seq. change (%) 3.7% 4.2% 4.2% 1.8% -1.8% 3.9% 3.4% 3.8% 3.8% 3.8% 3.7%
GDP per capita 8,298 8,548 8,802 8,855 8,589 8,819 9,012 9,244 9,483 9,728 9,981Seq. change (%) 2.4% 3.0% 3.0% 0.6% -3.0% 2.7% 2.2% 2.6% 2.6% 2.6% 2.6%
Installed baseDesktop 295,224 319,127 339,949 358,404 368,177 363,876 344,668 324,418 305,617 286,050 264,582 4.3% -6.2%Mobile 70,023 93,395 125,960 173,670 239,379 319,117 418,506 530,236 656,149 794,774 957,912 35.4% 24.6%Total 365,247 412,522 465,909 532,074 607,557 682,993 763,174 854,655 961,766 1,080,824 1,222,494 13.3% 12.3%
Seq. change (%) 13.1% 12.9% 12.9% 14.2% 14.2% 12.4% 11.7% 12.0% 12.5% 12.4% 13.1%% mobile 19.2% 22.6% 27.0% 32.6% 39.4% 46.7% 54.8% 62.0% 68.2% 73.5% 78.4%
ASP (US$)Desktop 800 711 711 691 616 621 568 518 466 425 385 -4.9% -9.1%Mobile 1,245 1,123 1,068 920 728 675 581 521 490 459 431 -11.5% -8.6%
Notebook 1,245 1,123 1,068 972 844 785 687 602 551 506 468 -8.8% -9.8%Netbook NM NM NM 457 415 371 324 287 265 244 222 NM -9.7%Tablet NM NM NM NM NM 600 528 494 468 439 416 NM -7.0%
Total 939 867 870 819 688 659 578 520 486 455 426 -6.8% -8.3%Total ex-tablets 939 867 870 819 688 665 595 535 499 468 438
PC penetration per capita 5.7% 6.4% 7.1% 8.0% 9.0% 10.0% 11.1% 12.3% 13.6% 15.2% 17.0%Seq. change (bps) 59 66 74 91 103 101 105 119 138 151 180
Net add shipmentsDesktop 26,258 24,176 22,999 21,827 15,184 7,411 6,518 7,662 10,614 10,270 10,919 -22.4% 8.1%Mobile 16,059 23,372 32,565 47,710 65,709 79,738 99,389 111,730 125,913 138,625 163,138 37.8% 15.4%Total 42,316 47,548 55,564 69,537 80,894 87,149 105,907 119,392 136,527 148,895 174,057 15.5% 14.8%
% of total 54% 53% 53% 57% 55% 46% 47% 45% 44% 42% 42%
Replacement shipmentsDesktop 27,916 31,467 34,971 32,638 37,924 48,219 45,379 42,774 37,427 33,776 28,777 11.6% -9.8%Mobile 8,482 10,372 14,185 20,866 28,886 54,743 73,674 103,849 135,016 169,969 208,561 45.2% 30.7%Total 36,398 41,839 49,157 53,504 66,810 102,963 119,052 146,623 172,443 203,745 237,337 23.1% 18.2%
% of total 46% 47% 47% 43% 45% 54% 53% 55% 56% 58% 58%
Average age of installed base (yrs)Desktop 9.6 9.4 9.1 10.4 9.5 7.6 8.0 8.1 8.7 9.0 9.9Mobile 6.4 6.8 6.6 6.0 6.0 4.4 4.3 4.0 3.9 3.9 3.8Total 8.9 8.7 8.4 8.7 8.0 5.9 5.7 5.2 5.0 4.7 4.6
Unit shipments 0.8% 8.6% 17.6% 11.6% 9.5%Desktop 54,173 55,643 57,970 54,465 53,108 55,631 51,897 50,436 48,041 44,046 39,696 0.5% -6.5%Mobile 24,541 33,744 46,750 68,576 94,596 134,481 173,063 215,579 260,930 308,594 371,698 40.5% 22.5%
Notebook 24,541 33,744 46,750 61,672 69,099 89,348 90,103 97,832 115,096 128,458 140,650 29.5% 9.5%Netbook 0 0 0 6,904 25,497 28,133 25,481 22,694 18,622 13,150 10,235 NM -18.3%Tablet 0 0 0 0 0 17,000 57,479 95,053 127,212 166,986 220,813 NM 67.0%
Total 78,714 89,387 104,721 123,041 147,704 190,112 224,960 266,015 308,970 352,640 411,394 19.3% 16.7%Seq. change (%) 19.4% 13.6% 17.2% 17.5% 20.0% 28.7% 18.3% 18.2% 16.1% 14.1% 16.7%
Total ex-tablets 78,714 89,387 104,721 123,041 147,704 173,112 167,481 170,962 181,759 185,654 190,581 17.1% 1.9%Seq. change (%) 19.4% 13.6% 17.2% 17.5% 20.0% 17.2% -3.3% 2.1% 6.3% 2.1% 2.7%
Unit shipments share (%)Desktop 68.8% 62.2% 55.4% 44.3% 36.0% 29.3% 23.1% 19.0% 15.5% 12.5% 9.6%Mobile 31.2% 37.8% 44.6% 55.7% 64.0% 70.7% 76.9% 81.0% 84.5% 87.5% 90.4%
Notebook 31.2% 37.8% 44.6% 50.1% 46.8% 47.0% 40.1% 36.8% 37.3% 36.4% 34.2%Netbook 0.0% 0.0% 0.0% 5.6% 17.3% 14.8% 11.3% 8.5% 6.0% 3.7% 2.5%Tablet 0.0% 0.0% 0.0% 0.0% 0.0% 8.9% 25.6% 35.7% 41.2% 47.4% 53.7%
Total 100.0% 100.0% 100.0% 100.0% 100.0% 100.0% 100.0% 100.0% 100.0% 100.0% 100.0%
Revenue (US$ mn)Desktop 43,336 39,576 41,206 37,652 32,704 34,532 29,495 26,127 22,370 18,698 15,298 -4.4% -15.0%Mobile 30,557 37,908 49,932 63,092 68,887 90,777 100,546 112,330 127,904 141,582 160,052 24.3% 12.0%
Notebook 30,557 37,908 49,932 59,935 58,297 70,131 61,934 58,850 63,414 65,005 65,811 18.1% -1.3%Netbook 0 0 0 3,156 10,590 10,446 8,263 6,506 4,930 3,205 2,277 NM -26.3%
Tablet 0 0 0 0 0 10,200 30,350 46,975 59,560 73,372 91,965 NM 55.2%Total 73,893 77,484 91,138 100,744 101,591 125,308 130,042 138,457 150,274 160,280 175,350 11.1% 7.0%
Seq. change (%) 4.0% 4.9% 17.6% 10.5% 0.8% 23.3% 3.8% 6.5% 8.5% 6.7% 9.4%Total ex-tablets 73,893 77,484 91,138 100,744 101,591 115,109 99,691 91,482 90,714 86,908 83,385 9.3% -6.2%
Seq. change (%) 4.0% 4.9% 17.6% 10.5% 0.8% 13.3% -13.4% -8.2% -0.8% -4.2% -4.1%
We expect robust consumer PC unit growth of +18%/ +18% in 2011/12 (units of 225mn/266mn) with revenue growth of +4%/+7% over this period (to $130bn/$138bn). LT we expect PC units to grow 17% (2% ex-tablets) driving a revenue CAGR of 11% (to $175bn). However we think the market ex-tablets declines 6% LT to $83bn.
1) Installed base of consumer PCs will rise to 1.2bn LT. We believe improving affordability at the lower-end of the market (especially relevant in emerging markets, which represented 40% of installed base last year) will drive the installed based of consumer PCs to 1.2bn LT versus 680mn in 2010 (representing a CAGR of 12%).
2) Significant opportunity in tablets. We expect tablets to represent 57mn/95mn units in 2011/12 and 221mn units LT. As described in the below section titled ‘Working out the tablet market… a look by price point’, we employ price band analysis (as a proxy for use case) to derive the cannibalization of tablets on the PC market. Long-term we expect tablets to represent 54% of consumer PC demand.
3) Tick up in replacement rate. As the PC market in developed regions continues to mature and ASPs decline at 8% (versus 6% historically), we expect the replacement cycle to decline toward 5 years versus a 7 year cycle historically.
22
11
33
Source: Gartner, Company data, Credit Suisse estimates.

16 March 2011
IT Hardware 85
Consumer Installed Base Rising to 1.2bn Will Drive Unit Growth of 17% Long Term Once we have our key input on pricing, we then apply our global GDP estimates for each country based on IMF forecasts (around 3-4% per annum globally). Our affordability metric/output, which is the ASP to GDP per capita ratio then drives a country-specific level of penetration gains based on the regressions discussed above in the section titled ‘An econometric analysis for the consumer’. In turn we arrive at four main conclusions.
The installed base of consumer PCs will swell to 1.2bn LT. We expect the installed base of consumer PCs will reach 1.2bn units by 2015, up from 0.7bn in 2010, implying a LT CAGR of 12%. As we demonstrate above, we believe the fundamental driver of this continued LT growth is the improvement in affordability. This trend toward lower-priced PCs most significantly affects emerging markets, which will represent a consumer PC installed base of 628mn LT or 51% of the global total.
Replacement rates to see modest uptick driving replacement volume growth of 18% LT. We estimate the replacement rate for consumer PCs increases toward 22% (implying a replacement cycle of 5 years) as (1) affordability continues to improve based on lower ASPs and (2) developed markets continue to mature. We expect the replacement market to rise to 237mn LT or 58% of overall volume.
Consumer PC revenue to grow 7% per year to $175bn LT. The average ASP of a consumer PC was around $659 in 2010, and as discussed earlier, we see the lower end of the market evolving to $200 and thus estimate that the average device ASP will decline at a rate of 8% per year to $426 in 2015. This means that even with 17% unit growth, this leads to only 7% revenue growth to $175bn by 2015. Excluding tablets, we think units will only grow 2% LT with pricing pressure driving a decline in LT revenue growth (-6% CAGR).
Mobility will be a key part of the market. Mobile PCs now represent 71% of the consumer PC market shipments, and we expect this to reach 90% by 2015 as tablets and lower end notebooks grow in the mix.
Emerging markets to account for over 50% of PC volume and value long term. Based on our model, we believe that while growth will prove solid globally, we expect significantly more growth from emerging regions which will represent 55% of industry volume long-term (versus 46% today). As such, we expect emerging regions to represent 53% of industry revenue by 2015, up from 40% in 2010.
Sanity Checking Our Analysis; Conservative? While above we paint an optimistic view of the consumer PC segment driven by a move toward lower price points and thus improving affordability resulting in robust growth for the installed base, we believe it is important to also sanity check our analysis. In fact when we look at both the addressable market and our implied penetration rate assumptions we argue that our analysis could be conservative:
Addressable market. One way of looking at the potential market for PCs is to determine what an individual on average is willing to spend (in terms of total income) on the product. If in the long term we assume ASPs for the average low-end PC reaches $200, we can find a theoretical income threshold at which a person is or isn’t willing to purchase a PC. We discuss below two ways to approximate this threshold including: (1) using the propensity to spend in the mobile market (device plus the cost of service), and (2) consumer electronics as a percentage of total consumer spending (for the U.S. as an example). We conclude that an income threshold of 1.6% globally (ASP to GDP per capita) for consumer PC spending, which is how we derive our global addressable market estimate of 2.2bn. This suggests that global penetration per capita of consumer PC market is around 31% currently. (For details please refer to Figure 98.)

16 March 2011
IT Hardw
are 86
Figure 98: Addressable Market Based on a Threshold Level of Consumer Spending on PCs (of Total Income) Near 1.6% Globally
TCO ($) Capping factors % of total population
2010 2015E % CAGR 2010 2015EAccess to Electricity Literacy 2010 2015E
Additional population 2010 2015E
Developed countries North America 1.30%
US 618 220 -19% 1.3% 47,513 16,949 100% 99.0% 148.9 292.8 187.9 48% 90%Canada 602 220 -18% 1.3% 46,308 16,888 100% 99.0% 16.4 32.5 21.0 48% 90%
Western Europe 0.80%Austria 666 250 -18% 0.8% 83,238 31,250 100% 98.0% 1.6 6.9 5.6 19% 81%Belgium 672 254 -18% 0.8% 83,970 31,798 100% 99.0% 1.7 7.8 6.4 16% 71%Denmark 610 252 -16% 0.8% 76,207 31,558 100% 99.0% 2.0 5.0 3.8 37% 90%Finland 630 244 -17% 0.8% 78,750 30,515 100% 100.0% 0.9 4.5 3.8 17% 83%France 623 240 -17% 0.8% 77,867 29,951 100% 99.0% 12.1 45.1 36.0 19% 70%Germany 639 253 -17% 0.8% 79,820 31,629 100% 99.0% 13.8 65.1 58.3 17% 81%Greece 618 262 -16% 0.8% 77,208 32,717 100% 96.0% 0.7 4.6 4.3 6% 41%Ireland 635 231 -18% 0.8% 79,318 28,851 100% 99.0% 1.0 3.8 2.8 22% 83%Italy 600 248 -16% 0.8% 75,003 31,018 100% 98.4% 8.5 31.1 22.6 14% 50%Netherlands 620 240 -17% 0.8% 77,510 30,005 100% 99.0% 3.9 13.7 9.9 23% 82%Norway 650 253 -17% 0.8% 81,241 31,606 100% 100.0% 2.8 5.1 2.3 57% 100%Portugal 641 253 -17% 0.8% 80,077 31,632 100% 93.3% 0.3 2.3 2.0 3% 21%Spain 576 239 -16% 0.8% 71,979 29,823 100% 97.8% 5.9 23.3 17.4 13% 50%Sweden 614 236 -17% 0.8% 76,769 29,547 100% 99.0% 2.2 8.0 5.9 23% 85%Switzerland 682 253 -18% 0.8% 85,216 31,568 100% 99.0% 2.7 7.2 4.6 34% 90%United Kingdom 588 228 -17% 0.8% 73,529 28,534 100% 99.0% 9.8 39.4 29.6 16% 61%
Other developed 0.80%Australia 738 276 -18% 0.8% 92,249 34,509 100% 98.0% 3.7 15.4 11.7 17% 65%Hong Kong 690 272 -17% 0.8% 86,263 33,956 100% 93.5% 0.9 3.1 2.2 12% 41%Israel 527 208 -17% 0.8% 65,907 25,953 100% 97.0% 1.0 3.8 2.8 13% 46%Japan 834 292 -19% 0.8% 104,297 36,449 100% 99.0% 10.5 82.4 71.8 8% 65%Korea 555 223 -17% 0.8% 69,398 27,868 100% 97.9% 2.8 11.2 8.4 6% 23%New Zealand 734 291 -17% 0.8% 91,778 36,327 100% 99.0% 0.3 1.4 1.1 6% 30%Singapore 695 286 -16% 0.8% 86,818 35,702 100% 92.5% 0.7 2.8 2.1 14% 50%Taiwan 471 193 -16% 0.8% 58,910 24,157 100% 96.1% 2.6 7.3 4.8 11% 30%
Total developed 641 240 -18% 0.9% 69,899 26,294 100.0% 98.6% 258 726 468 26% 71%
Emerging countriesAsia Pacific 1.80%
China 446 160 -19% 2.5% 17,844 6,405 99.4% 91.6% 80.1 544.9 464.7 6% 40%India 382 118 -21% 2.5% 15,266 4,735 66.3% 61.0% 4.1 131.0 126.9 0% 10%Indonesia 472 193 -16% 1.8% 26,240 10,728 64.5% 90.4% 0.2 6.5 6.3 0% 3%Malaysia 593 192 -20% 1.8% 32,934 10,684 99.4% 88.7% 1.6 7.0 5.4 6% 23%Philippines 454 173 -18% 1.8% 25,237 9,615 89.7% 92.6% 0.0 0.4 0.3 0% 0%Thailand 479 177 -18% 1.8% 26,594 9,813 99.3% 92.6% 0.9 8.0 7.1 1% 11%Vietnam 454 154 -19% 1.8% 25,248 8,561 97.6% 90.3% 0.0 0.0 0.0 0% 0%
Eastern Europe 1.80%Czech Republic 526 212 -17% 1.8% 29,230 11,780 99.8% 99.0% 1.6 6.9 5.2 16% 66%Hungary 559 216 -17% 1.8% 31,061 12,013 99.8% 99.4% 0.8 6.5 5.6 8% 65%Poland 565 204 -18% 1.8% 31,374 11,343 99.8% 99.8% 5.0 23.3 18.3 13% 61%Russia 558 202 -18% 1.8% 31,021 11,236 99.8% 99.4% 8.8 58.6 49.8 6% 42%
Middle East & Africa 1.80%South Africa 457 166 -18% 1.8% 25,379 9,249 89.5% 86.4% 5.3 10.9 5.6 11% 21%Turkey 556 212 -18% 1.8% 30,908 11,764 89.5% 87.4% 7.9 22.9 15.1 11% 30%
Latin America 1.80%Argentina 530 166 -21% 1.8% 29,439 9,240 97.2% 97.2% 4.8 17.0 12.1 12% 40%Brazil 506 157 -21% 1.8% 28,124 8,708 98.3% 88.6% 23.1 81.0 58.0 12% 41%Chile 586 199 -19% 1.8% 32,532 11,052 98.5% 95.7% 1.9 5.5 3.6 11% 30%Colombia 595 191 -20% 1.8% 33,068 10,611 93.6% 90.4% 1.2 7.3 6.0 3% 15%Mexico 554 191 -19% 1.8% 30,802 10,597 100.0% 86.1% 11.9 34.4 22.4 11% 30%Peru 524 161 -21% 1.8% 29,119 8,920 85.7% 92.9% 0.9 6.4 5.5 3% 20%Venezuela 543 172 -21% 1.8% 30,159 9,564 99.0% 93.0% 3.5 12.9 9.4 12% 40%
ROWRest of Asia-Pacific 549 188 -19% 1.8% 30,523 10,422 83.4% NA 14.7 67.8 53.1 3% 12%Rest of Eastern Europe 597 186 -21% 1.8% 33,177 10,332 98.9% NA 9.9 38.3 28.4 15% 59%Rest of MEA 543 203 -18% 1.8% 30,184 11,303 89.5% NA 112.4 361.8 249.4 9% 25%Rest of LatAm 571 173 -21% 1.8% 31,732 9,624 91.2% NA 10.9 34.1 23.1 11% 31%
Total emerging countries 482 169 -19% 2.0% 23,920 8,453 75.3% 79.1% 311.6 1,493.1 1,181.5 5% 24%
Global Total 505 179 -19% 1.6% 30,660 10,991 78.9% 82.0% 569.1 2,218.9 1,649.8 8.4% 30.8%
Cutoff(%)Country 1) We expect that the average
low-end PC ASP will be $200 in 2015 (from $300 today, a -6% CAGR). By adjusting up/ down this ASP in specific countries by the amount ASPs have been above/ below the global average over the 2004-2010 period, we arrive at a blended (weighted) TCO of $180 in 2015.
2) Our affordability work shows that an additional 0.5bn/1.2bn people will be able to afford a PC in developed/ emerging markets by 2015.
3) 2.2bn people will be able to afford a PC by 2015, nearly a four fold increase from the current addressable population of 570mn.
11
33
22
22
33
Source: Company data, Credit Suisse estimates.

16 March 2011
IT Hardware 87
(1) Propensity to spend in the mobile market. As shown in Figure 99, we find that in the mobile voice and related services market consumers are prepared to spend as much as 1.7% of their income such services. It could be argued that given the advent of smaller form factors, increased mobility and wireless connectivity the consumer PC market may also evolve similarly.
Figure 99: By 2015, We Estimate Globally an Individual Will Spend 1.7% of His Income on Mobile (Device + Service) GDP and revenue in US$ billions, subscriptions and shipments in mn
2015 estimates Total GDP
Subscriptions
ARPU per year
Services revenues
Mobile handset shipments
Handset ASP ($)
% subsidy from carriers
Handset revenues
Mobile telecoms revenue
2015 mobile total as % of GDP
North America 18,123 409.3 589.4 241.3 245.3 128 44% 17.5 258.8 1.43%
Western Europe 17,860 608.3 381.6 232.1 248.2 122 36% 19.4 251.5 1.41%
Latin America 5,091 689.2 116.0 79.9 192.1 93 0% 17.9 97.8 1.92%
Eastern Europe 3,280 588.7 94.9 55.9 138.2 80 0% 11.1 67.0 2.04%
Africa 1,913 843.7 86.6 73.1 180.3 61 0% 11.0 84.1 4.40%
Middle East 2,861 356.5 153.3 54.7 93.9 76 0% 7.1 61.8 2.16%
Asia-Pacific (ex Japan) 17,147 3,569.7 71.5 255.4 978.7 76 0% 74.9 330.3 1.93%
Japan 5,690 123.6 533.9 66.0 42.0 301 0% 12.6 78.6 1.38%
Global 71,965 7,189.0 147.2 1,058.3 2,118.8 171.6 1,229.9 1.71%
Source: IMF, Gartner, Credit Suisse estimates.
(2) The U.S. example. In the U.S., PC penetration per household is some 132%, and as such we can regard it as a relatively mature market. When we look at PCs and peripherals as a percentage of the U.S. consumer’s personal consumption (ex. food/energy), and take into account the increasing trend of this spending (~0.1% per year), we believe PCs and peripherals might represent 1.5-2.0% of consumer spending (in-line with global average above).
Figure 100: Based on Current Trends, by 2015 PCs and Related Equipment Could Represent Some 1.8% of U.S. Personal Consumption (Ex-Food/Energy)
Consumer electronics and services as a % of U.S. personal consumption (ex. food/ energy)
2.9% 2.9% 3.0% 3.1% 3.3% 3.5% 3.4% 3.4% 3.4% 3.4% 3.4% 3.6% 3.8% 3.9% 3.9% 3.9% 4.0% 4.1% 4.1% 4.2% 4.3%
0.5% 0.6% 0.7% 0.8%1.0%
1.1% 1.2% 1.3% 1.4% 1.6% 1.8%2.0%
2.2% 2.2% 2.5% 2.6% 2.8% 3.0% 3.1% 3.3% 3.5%
1.8%1.7%
1.6%1.5%
1.4%1.2%
1.1%0.9%0.8%
0.7%
0.6%0.5%
0.4%0.3%0.2%0.2%
0.1%
0.0%0.0%0.1%
0.1%
0%
1%
2%
3%
4%
5%
6%
7%
8%
9%
10%
1995
1996
1997
1998
1999
2000
2001
2002
2003
2004
2005
2006
2007
2008
2009
2010
2011
E
2012
E
2013
E
2014
E
2015
E
% o
f per
sona
l con
sum
ptio
n (e
x. fo
od/ e
nerg
y)
Consumer electronics services (cellular, broadband etc.) Other consumer electronics hardware PCs and peripherals
Consumer electronics services have stayed steady as a percentage of U.S. persional consumption over the past 15 years, while hardware and in particular PCs have been rising in the overall mix.
< actual forecast >
Source: IMF, Company data, Credit Suisse estimates.

16 March 2011
IT Hardware 88
Penetration still below many other industries. Another means of looking at penetration is to contrast PC penetration gains with other consumer devices, for example mobile handsets and smartphones, as shown in Figure 101. Indeed our assumptions for global PC penetration gains per capita (over five years) of 7 percentage points compares with only around two years in the mobile handset market and about three years in the smartphone market. Clearly, the subsidized model, an essential feature of mobile phones, lowers initial price points making a PC purchase fundamentally different hence we believe a slower uptake is more relevant.
Figure 101: Our PC per Capita and per Household Estimates Appear Conservative When Compared with the Handset and Smartphone Markets
Consumer 1996 1997 1998 1999 2000 2001 2002 2003 2004 2005 2006 2007 2008 2009 2010 2011E 2012E 2013E 2014E 2015E # yearsPenetration per capita (%) (lapse)
PCsNorth America - - - - 26% 28% 30% 32% 34% 37% 40% 43% 46% 51% 56% 60% 65% 69% 72% 76% 5As ia Pacific - - - - 1% 2% 2% 2% 3% 3% 4% 4% 5% 5% 6% 6% 7% 8% 10% 11% 5Western Europe - - - - 13% 14% 16% 17% 19% 22% 24% 26% 29% 33% 36% 39% 42% 45% 47% 50% 5Eastern Europe - - - - 2% 2% 3% 3% 4% 5% 6% 7% 9% 11% 13% 15% 17% 19% 21% 23% 5Middle East & Africa - - - - 0% 0% 0% 0% 0% 1% 1% 1% 1% 1% 1% 2% 2% 3% 5% 7% 5Latin America - - - - 2% 2% 3% 3% 4% 5% 6% 8% 9% 11% 12% 14% 16% 18% 20% 23% 5Global - - - - 3% 4% 4% 5% 5% 6% 6% 7% 8% 9% 10% 11% 12% 14% 15% 17% 5
Handsets (subscriptions)North America 16% 20% 24% 30% 38% 44% 48% 53% 60% 68% 75% 81% 85% 90% 93% 96% 98% 100% 102% 104% 3As ia Pacific 1% 2% 3% 5% 7% 10% 13% 17% 20% 25% 31% 40% 50% 60% 70% 78% 85% 91% 95% 98% 2Western Europe 9% 14% 24% 40% 63% 74% 79% 86% 94% 103% 109% 118% 124% 127% 130% 133% 135% 137% 138% 140% 1Eastern Europe 0% 1% 2% 4% 7% 13% 19% 28% 45% 67% 82% 96% 108% 117% 125% 131% 135% 138% 141% 145% 1Middle East & Africa 1% 2% 3% 6% 10% 14% 18% 22% 27% 37% 48% 62% 76% 83% 90% 96% 101% 106% 110% 114% 3Latin America 1% 3% 4% 8% 12% 16% 19% 23% 31% 44% 54% 66% 78% 85% 91% 95% 99% 102% 104% 106% 3Global 2% 4% 5% 8% 12% 16% 19% 23% 28% 35% 43% 52% 62% 70% 77% 83% 89% 92% 96% 98% 2
SmartphonesNorth America - - - - 1% 1% 1% 1% 1% 1% 3% 6% 11% 17% 26% 38% 50% 61% 71% 81% 2As ia Pacific - - - - 0% 0% 0% 0% 0% 1% 2% 2% 3% 4% 5% 7% 10% 14% 18% 22% 1Western Europe - - - - 0% 0% 1% 2% 2% 4% 5% 9% 12% 18% 30% 46% 62% 77% 90% 100% 1Eastern Europe - - - - 0% 0% 0% 0% 0% 1% 2% 3% 3% 4% 6% 8% 11% 15% 18% 21% 3Middle East & Africa - - - - 0% 0% 0% 0% 0% 1% 1% 2% 2% 2% 3% 3% 4% 6% 7% 9% 8Latin America - - - - 0% 0% 0% 0% 0% 0% 0% 1% 1% 2% 4% 7% 11% 14% 18% 21% 3Global - - - - 0% 0% 0% 0% 0% 1% 2% 3% 4% 5% 7% 10% 14% 18% 22% 27% 3
We believe our estimates for consumer PC penetration per capita could prove conservative when viewed relative to the penetration gains observed in each the mobile handset and smartphone markets.
We assume that on a global level consumer PC penetration per capita rises to 17% by 2015 from 10% in 2010.
Handset market. We observe that in the handset market it took on average only two years (versus our assumption for five in the PC market) to increase penetration per capita from the same levels.
Smartphone market. We observe that in the smartphone market, which only emerged in the early part of the last decade, that penetration per capita increased from ~10% to ~22% in around three years.
11
5 years
2 years
3 years
Source: Gartner, Company data, Credit Suisse estimates.

16 March 2011
IT Hardw
are 89
Figure 102: Commercial PCs to Grow +17%/+16% in 2011/12 (to 208mn/ 242mn Units) and 11% LT (to 301mn Units) US$ in millions, unless otherwise stated
Commercial (units in 0 00's, rev i 2005 2006 2007 2008 2009 2010 2011E 2012E 2013E 2014E 2015E CAGR '05-10 CAGR 10-15EPopulation 6,010,336 6,092,775 6,156,144 6,240,807 6,309,383 6,391,233 6,474,090 6,557,937 6,642,770 6,729,031 6,816,745 1.2% 1.3%
Seq. change (%) 1.09% 1.37% 1.04% 1.38% 1.10% 1.30% 1.30% 1.30% 1.29% 1.30% 1.30%
Labor force 2,559,996 2,613,211 2,653,417 2,698,575 2,714,827 2,753,346 2,792,191 2,832,198 2,873,430 2,915,914 2,959,682 1.5% 1.5%Seq. growth (%) 1.8% 2.1% 1.5% 1.7% 0.6% 1.4% 1.4% 1.4% 1.5% 1.5% 1.5%% of popula tion 42.6% 42.9% 43.1% 43.2% 43.0% 43.1% 43.1% 43.2% 43.3% 43.3% 43.4%
Insta lled baseDes ktop 344,131 366,493 387,876 410,750 421,703 448,596 478,843 512,756 549,241 588,642 631,470 5.4% 7.1%Mobi le 92,473 114,301 143,236 182,008 216,859 257,152 302,033 352,222 407,639 469,462 539,325 22.7% 16.0%
Total 436,604 480,794 531,112 592,758 638,562 705,749 780,876 864,978 956,880 1,058,105 1,170,795 10.1% 10.7%Seq. change (%) 9.9% 10.1% 10.5% 11.6% 7.7% 10.5% 10.6% 10.8% 10.6% 10.6% 10.7%
Penetration, % of labor forceDes ktop 13.4% 14.0% 14.6% 15.2% 15.5% 16.3% 17.1% 18.1% 19.1% 20.2% 21.3%Mobi le 3.6% 4.4% 5.4% 6.7% 8.0% 9.3% 10.8% 12.4% 14.2% 16.1% 18.2%
Total 17.1% 18.4% 20.0% 22.0% 23.5% 25.6% 28.0% 30.5% 33.3% 36.3% 39.6%
Net add shipmentsDes ktop 24,382 23,580 24,224 24,406 14,576 27,577 30,708 34,401 37,011 39,967 43,415 2.5% 9.5%Mobi le 15,339 21,861 28,986 38,829 34,919 40,372 44,965 50,284 55,529 61,955 70,017 21.4% 11.6%
Total 39,721 45,441 53,210 63,234 49,494 67,949 75,673 84,684 92,539 101,922 113,431 11.3% 10.8%% of total 30% 32% 33% 37% 31% 38% 36% 35% 36% 37% 38%
Replacement shipmentsDes ktop 69,563 70,867 74,370 71,504 70,757 63,249 74,685 85,980 89,011 91,036 92,293 -1.9% 7.9%Mobi le 23,590 25,261 31,768 34,449 40,396 46,785 58,141 71,063 77,740 84,904 95,374 14.7% 15.3%
Total 93,153 96,128 106,138 105,953 111,153 110,034 132,826 157,043 166,752 175,941 187,668 3.4% 11.3%% of total 70% 68% 67% 63% 69% 62% 64% 65% 64% 63% 62%
Replacement rate, % (last 1 yr avg.)Des ktop 21.7% 20.6% 20.3% 18.4% 17.2% 15.0% 16.6% 18.0% 17.4% 16.6% 15.7%Mobi le 30.6% 27.3% 27.8% 24.1% 22.2% 21.6% 22.6% 23.5% 22.1% 20.8% 20.3%
Total 23.5% 22.0% 22.1% 19.9% 18.8% 17.2% 18.8% 20.1% 19.3% 18.4% 17.7%
Average age of installed base (yrs)Des ktop 4.6 4.9 4.9 5.4 5.8 6 .7 6.0 5 .6 5.8 6 .0 6.4Mobi le 3.3 3.7 3.6 4.2 4.5 4 .6 4.4 4 .3 4.5 4 .8 4.9
Total 4.3 4.5 4.5 5.0 5.3 5 .8 5.3 5 .0 5.2 5 .4 5.6
Unit shipmentsDes ktop 93,945 94,447 98,594 95,909 85,333 90,826 105,393 120,380 126,022 131,004 135,708 -0.7% 8.4%Mobi le 38,929 47,122 60,754 73,278 75,315 87,158 103,106 121,347 133,269 146,859 165,391 17.5% 13.7%
Notebook 38,929 47,122 60,754 71,733 69,762 81,408 90,705 96,167 96,814 93,500 87,020 15.9% 1.3%
Netbook NM NM NM 1,546 5,553 5,550 4,637 4,310 3,675 3,112 1,089 NM -27.8%Table t NM NM NM 0 0 200 7,764 20,870 32,780 50,248 77,281 NM 229.2%
Total 132,874 141,569 159,348 169,187 160,648 177,984 208,499 241,727 259,291 277,863 301,099 6.0% 11.1%Total ex-tablets 132,874 141,569 159,348 169,187 160,648 177,784 200,735 220,857 226,512 227,616 223,818 6.0% 4.7%
Unit shipments seq. change (%)Des ktop 7.4% 0.5% 4.4% -2.7% -11.0% 6.4% 16.0% 14.2% 4.7% 4.0% 3.6%Mobi le 29.9% 21.0% 28.9% 20.6% 2.8% 15.7% 18.3% 17.7% 9.8% 10.2% 12.6%
Notebook 29.9% 21.0% 28.9% 18.1% -2.7% 16.7% 11.4% 6.0% 0.7% -3.4% -6.9%
Netbook NM NM NM NM 259.3% -0.1% -16.5% -7.0% -14.7% -15.3% -65.0%Tablet NM NM NM NM NM NM 3782.1% 168.8% 57.1% 53.3% 53.8%
Total 13.1% 6.5% 12.6% 6.2% -5.0% 10.8% 17.1% 15.9% 7.3% 7.2% 8.4%Total ex-tablets 13.1% 6.5% 12.6% 6.2% -5.0% 10.7% 12.9% 10.0% 2.6% 0.5% -1.7%
Unit shipments share (%)Des ktop 70.7% 66.7% 61.9% 56.7% 53.1% 51.0% 50.5% 49.8% 48.6% 47.1% 45.1%Mobi le 29.3% 33.3% 38.1% 43.3% 46.9% 49.0% 49.5% 50.2% 51.4% 52.9% 54.9%
Notebook 29.3% 33.3% 38.1% 42.4% 43.4% 45.7% 43.5% 39.8% 37.3% 33.6% 28.9%Netbook NM NM NM 0.9% 3.5% 3.1% 2.2% 1.8% 1.4% 1.1% 0.4%
Table t NM NM NM 0.0% 0.0% 0.1% 3.7% 8.6% 12.6% 18.1% 25.7%
Total 100.0% 100.0% 100.0% 100.0% 100.0% 100.0% 100.0% 100.0% 100.0% 100.0% 100.0%
ASP (US$)Des ktop 807 735 736 693 614 596 544 500 455 414 377 -5.9% -8.8%Mobi le 1,322 1,211 1,144 1,027 863 794 689 595 523 462 418 -9.7% -12.0%
Notebook 1,322 1,211 1,144 1,039 899 822 721 631 552 482 423 -9.1% -12.5%Netbook NM NM NM 455 412 384 335 295 257 229 203 NM NM
Table t NM NM NM NM NM 600 528 494 468 439 416 NM -7.0%
Total 958 893 892 837 731 693 616 548 490 440 400 -6.3% -10.4%Seq. change (%) -12.8% -6.8% -0.2% -6.1% -12.7% -5.2% -11.2% -11.0% -10.5% -10.3% -9.0%
Revenue (US$ mn)Des ktop 75,839 69,411 72,614 66,425 52,430 54,134 57,315 60,154 57,332 54,233 51,164 -6.5% -1.1%Mobi le 51,463 57,042 69,497 75,261 65,027 69,196 71,021 72,246 69,751 67,904 69,213 6.1% 0.0%
Notebook 51,463 57,042 69,497 74,558 62,739 66,944 65,366 60,658 53,460 45,112 36,806 5.4% -11.3%
Netbook NM NM NM 704 2,288 2,132 1,555 1,273 944 714 221 NM -36.4%Tablet NM NM NM NM NM 120 4,100 10,314 15,347 22,078 32,186 NM 206.0%
Total 127,302 126,453 142,111 141,686 117,456 123,330 128,336 132,400 127,083 122,138 120,377 -0.6% -0.5%Seq. change (%) -1.3% -0.7% 12.4% -0.3% -17.1% 5.0% 4.1% 3.2% -4.0% -3.9% -1.4%
Total ex-tablets 127,302 126,453 142,111 141,686 117,456 123,210 124,236 122,086 111,736 100,059 88,191 -0.7% -6.5%Seq. change (%) -1.3% -0.7% 12.4% -0.3% -17.1% 4.9% 0.8% -1.7% -8.5% -10.4% -11.9%
We expect commercial PC unit growth of +17%/ +16% in 2011/12 (units of 208mn/242mn) with revenue growth of +4%/+3% over this period (to $128bn/$132bn). LT we expect PC units to grow 11% (5% ex-tablets) driving a revenue CAGR of -1% (to $120bn).
1) Steady growth for the installed base.We expect the installed base to grow in-line with historical levels (11% versus 10% historically) given modest increases in the penetration gains of the commercial labor force. We expect a LT installed base for commercial PCs of 1.2bn.
2) A opportunity for tablets. We expect tablets to represent 8mn/21mn units in 2011/12 and 77mn units LT (26% of units).
3) Replacement to see a modest uptick. Owing to the current corporate refresh which is being driven by higher performance machines and the adoption of Windows 7, we expect the replacement cycle for commercial PCs to decline in the near term by ~1 year (to 5 years by 2012) before cycling back to historical levels of 5 to 5.5 years.
22
11
33
Source: Company data, Credit Suisse estimates.

16 March 2011
IT Hardware 90
Corporate Refresh Is Two Years of Robust Growth Following our discussion of the consumer PC market, we turn our attention to commercial PCs which represented 48% of global units and 50% of global PC revenues last year. Unlike the consumer PC market, in the commercial market, sales are more driven by responses of enterprises to new hardware releases (more powerful specifications, new chip releases), software refresh as well as by the steady penetration of the laborforce as productivity increases. For 2011/12, we forecast units of 208mn/242mn (+17%/+16% yoy) and 11% longer term to 301mn driven by several factors:
Installed base to see steady growth of 11% LT. According to Gartner estimates, the installed base of commercial PCs is currently around 700mn, and has grown ~10% over the past five years. Going forward, given (1) continued productivity improvements in PCs (higher specs at lower prices), (2) the industrialization of emerging markets, and (3) consistent and increasing penetration gains of the laborforce we expect the installed base to grow 11% per annum through 2015 to 1.2bn users LT.
Figure 103: Long-Term Installed Base Growth of 11% Modestly Above Historical Averages in millions, unless otherwise stated 2005 2006 2007 2008 2009 2010 2011E 2012E 2013E 2014E 2015E CAGR 2005-10 CAGR 2010-15ENorth America 127 131 136 143 147 156 166 176 187 197 207 4.3% 5.7% Asia Pacific 134 152 172 195 219 247 280 318 362 414 475 13.0% 14.0% Western Europe 88 96 104 114 119 129 138 148 159 169 179 7.9% 6.9% Eastern Europe 37 42 49 58 60 68 76 86 95 106 117 13.0% 11.5% Middle East & Africa 22 26 31 36 39 44 48 53 58 63 69 14.3% 9.5% Latin America 29 33 39 47 53 62 72 83 96 109 124 16.7% 14.9%
Global 437 481 531 593 639 706 781 865 957 1,058 1,171 10.1% 10.7%
Source: Company data, Credit Suisse estimates
Adoption of Windows 7: still in the early innings. While Windows 7 has only launched in October 2009, it is already one of the fastest selling versions of the Windows operating system. In fact, at the Consumer Electronics Show in January 2011, Microsoft CEO Steve Ballmer noted that 20% of PCs now connected to the Internet are running Windows 7. Given the ‘gap’ seen in many commercial environments, whereby corporations remained with Windows XP despite the release of the newer Windows Vista, we expect an upgrade to Windows 7 which is being met with improved functionality and performance from hardware vendors. As shown in Figure 104 and Figure 105, according to the Credit Suisse IT Survey, the Windows 7 upgrade is only now beginning to take place at enterprises, with only 27% (on average) of enterprises meeting the target completion date between Q3/Q4 2011.

16 March 2011
IT Hardware 91
Figure 104: Enterprises Are Still Only 27% Completed on Average with Their Windows 7 Upgrade Question: How complete is your Windows 7 integration?
Figure 105: Enterprises on Average Expect to Complete the Windows 7 Upgrade between Q3/Q4 2011 Question: When do you expect to complete your Windows 7
integration testing (target date)?
0.00% 5.00% 10.00% 15.00% 20.00% 25.00% 30.00% 35.00% 40.00% 45.00%
0-10%
11-20%
21-30%
31-40%
41-50%
51-60%
61-70%
71-80%
81-90%
91-99%
100% (completely integrated)
NA - We will skip Windows7
% of respondents
Average point of Windows 7 integration: 27%
0%
5%
10%
15%
20%
25%
Alreadycompleted
Q1 2011 Q2 2011 Q3 2011 Q4 2011 Q1 2012 Q2 2012 Q3 2012 Q4 2012 N/A
% o
f res
pond
ents
Average end-date between Q3-Q4 2011
Source: Credit Suisse IT Survey. Source: Credit Suisse IT Survey.
An aging installed base of PCs. We estimate that over the past few years (see Figure 106) the average age of the commercial PC installed base had been between 5-6 years, some 1-2 years longer than historical ages owing to a slower macroeconomic environment and therefore reduced corporate spending.
Figure 106: We Expect Average Age of PCs to Decline in 2011/12 Owing to the PC Refresh, Then Slowly Rising LT 2006 2007 2008 2009 2010 2011E 2012E 2013E 2014E 2015E Avg 2006-10 Avg 2011-15E North America 3.7 3.8 4.2 4.5 5.0 4.5 4.1 4.3 4.8 4.9 4.3 4.5 Asia Pacific 5.9 5.7 6.2 5.7 5.3 5.0 4.8 5.0 5.2 5.3 5.7 5.1 Western Europe 4.0 3.9 4.3 4.8 5.6 5.0 4.7 4.8 4.9 4.9 4.5 4.9 Eastern Europe 4.8 4.6 5.2 7.1 9.6 8.6 6.8 6.9 7.1 7.5 6.3 7.4 Middle East & Africa 5.0 5.1 5.4 5.6 6.2 5.7 5.5 5.6 5.8 6.0 5.5 5.7 Latin America 5.4 5.2 6.1 6.6 10.7 8.9 8.2 8.6 9.0 9.8 6.8 8.9
Global 4.5 4.5 5.0 5.3 5.8 5.3 5.0 5.2 5.4 5.6 5.0 5.3
Source: Company data, Credit Suisse estimates.
We would highlight that at this age, most PCs begin to fail and the actual cost of repairing such devices on the client side can be prohibitively high. For this reason, and as corroborated by our Credit Suisse IT Survey, most enterprises are planning a ‘major’ PC refresh for their businesses (on average) at the end of 2011 as demonstrated in Figure 107.

16 March 2011
IT Hardware 92
Figure 107: Enterprise on Average Expect to Upgrade PCs Around the End of 2011 Question: When do you expect a major PC refresh?
0%
5%
10%
15%
20%
25%
30%
35%
Alreadyoccurred
Calendar2011-Q1
Calendar2011-Q2
Calendar2011-Q3
Calendar2011-Q4
Calendar2012
Calendar2013
Rollingtargets
% o
f res
pond
ents
Average refreshtimeline at end-2011
Source: Credit Suisse IT Survey.
Developing market units to more than double over the next five years. While we expect the Windows 7 refresh to positively influence demand both in developed and developing regions, we think a more significant structural trend is the continued use of PCs in emerging regions. In fact, we believe that over the next five years, PC units in developing regions will grow at a 15% CAGR, versus a CAGR of only 6% for the developed regions.
Figure 108: Commercial Unit Volume in Emerging Markets Will Exceed that of Developed Markets in 2010 and LT US$ in millions, unless otherwise stated 2009 2010 2011E 2012E 2013E 2014E 2015E CAGR 2010-15E Developed markets 81 86 98 110 112 112 115 6.0% Developing markets 80 92 111 132 147 166 186 15.1%
Total 161 178 208 242 259 278 301 11.1%
Source: Company data, Credit Suisse estimates.
Performance remains a key consideration. One simple driver of the PC upgrade cycle is the evolution of the system and processor performance as affirmed below by an IDC survey of commercial PC buyers conducted in 2009 (price being the second).

16 March 2011
IT Hardware 93
Figure 109: IDC’s Commercial PC Buyers Survey Reveals that Performance (41%) and Cost (31%) Are the Two Core Drivers of Enterprises’ Purchase Decision
What will be your organization's primary consideration when purchasing future PCs?
0% 5% 10% 15% 20% 25% 30% 35% 40% 45%
Vendor services
Other
Inclusion of energy efficientcomponents
Bundled software
Security/ network features
Relationship with vendor
Vendor support/ reputation
Ease and ability to upgrade
Cost of the system
System performance
Source: IDC.
Desktop virtualization, a potential negative headwind. The idea of a server-hosted desktop, which effectively consolidates the computational power of individual desktops and instead replaces the user’s machine with a thin client, could prove to be a headwind for corporate PCs in the intermediate term. If desktop virtualization were to become a trend in enterprises, whether for security or cost reasons, this would in theory put downward pressure on the sale of traditional PC units (and ASPs given decreasing need for performance). However, this threat may not be imminent in the near term as suggested by our Credit Suisse IT Survey (Figure 110), which indicates only a modest rise in expected desktop virtualization (to ~25% of machines) two years from now versus today (~14% today).

16 March 2011
IT Hardware 94
Figure 110: The CS IT Survey Suggests 25% of Desktops May Be Virtualized in 2 Years Question: What percent of your desktops are/ might be virtualized (VDI, Citrix etc) at these points in time?
0.0% 5.0% 10.0% 15.0% 20.0% 25.0% 30.0%
Currently
2 Years from now
Source: Credit Suisse IT Survey.
Tablets a $120bn Question Long Term While the PC tablet concept has existed for nearly ten years (think laptop with swivel screen), the “tablet” market as we know it today, which involves a finger-input on touch screen (which is the way we define the category), was only brought mainstream by Apple’s iPad in 2010. This introduction by Apple sparked the interest of mobile industry peers as well as traditional PC hardware vendors (the tablet in fact is a convergence between the mobile and PC industries). In Figure 111, we list a few of these key vendors.
Figure 111: Sample of Larger PC/Handset Vendors Entering the Tablet Market Vendor Operating system(s) Vendor Operating system(s) Acer Android/ Windows HP webOS/ Windows Apple iOS Lenovo Android/ Windows Archos Android/ Windows LG Android Asus Android/ Windows Motorola Android Avaya Android Panasonic Android Cisco Android RIM BB Tablet OS Dell Android Samsung Android/ Windows Eken Android ViewSonic Android
Source: Company data, Credit Suisse estimates.
A further complication is whether tablets, are cannibalistic or additive to the PC industry. While initially many industry participants expected media tablets to be niche products, we would argue that the usage case continues to evolve daily. This leads us to believe tablets may meaningfully affect the PC industry and more so than netbooks, which appear to have already peaked in Q409 at around 10mn units. (See Figure 112.)

16 March 2011
IT Hardware 95
Figure 112: Global Netbook Sales Appear to Have Peaked in Q409 Units in millions, unless otherwise stated
0.0
2.0
4.0
6.0
8.0
10.0
12.0
Q108 Q208 Q308 Q408 Q109 Q209 Q309 Q409 Q110 Q210 Q310 Q410
Glo
bal n
etbo
ok s
hip
men
ts (m
n)
Source: Company data, Credit Suisse estimates.
A few reasons we think tablets are fundamentally different devices than netbooks are the following.
■ Optimized for consuming media. The tablet form factor allows the user to hold onto the device at a comfortable angle for viewing video clips, movies, playing games and reading. This compares with the clamshell form factor of netbooks which inherently lends itself to being set on a flat surface.
■ Functionality can be quickly scaled up. With the exception of the iPad, most tablet devices (and we expect nearly all in the future) will allow users to swap out for a larger memory card, and add a keyboard if necessary (as opposed to having it permanently attached to the device).
■ Mobile OS optimized for smaller form factor. We think Windows is optimized for larger screens, but when it comes to sizes 10” and below (which is addressed by netbooks and tablets), we think the user experience should change to accommodate the reduced screen real estate. Tablet OSs like iOS, Android and webOS were created to optimize the user experience at smaller screen sizes, versus Windows.
■ Instant on and longer standby. When it comes to checking mail, browsing a website or taking notes/pictures, users inherently prefer this functionality to be responsive—which is made possible via flash memory. A mobile optimized processor (ARM-based so far) and mobile OS allow for standby of up to 30 days (as see on the iPad) versus at most a few days on a netbook.
Corporate uptake and interest appears meaningful. While we believe products like the iPad have been initially designed with the consumer in mind we would highlight that the level of corporate interest has been surprisingly high. In fact some 80% of the Fortune 100 are deploying or piloting the iPad according to Apple’s CFO, Peter Oppenheimer.
“Enterprise CIOs are adding iPad to their approved device list at an amazing rate. Today over 80% of the Fortune 100 are already deploying or piloting iPad, up from 65% in the September quarter. Some recent examples include JPMorgan Chase, Cardinal Health, Wells Fargo, Archer Daniels Midland, Sears Holding and DuPont.” – Peter Oppenheimer, Apple, CFO
In Figure 113, we note a few instances of tablet trials in large corporations and a few school districts. We would highlight the diversity by which these devices are being used.

16 March 2011
IT Hardware 96
Figure 113: Various Announcements Indicate Strong Interest for Tablets in Enterprise and Education Company Name # of employees Product used/tested Use Case Details
ING 110,325 Playbook JPMorgan 222,316 iPad Investment Banking Pilot expected to end 5/2011 Mercedes Benz iPad Sales Distribution to 40 dealers Wells Fargo 267,300 iPad Conference Aid bought 15 P&G 127,000 iPad Lowe's 166,000 iPad Novartis 99,834 iPad Manulife Financial Playbook Sun Life Financial Inc Playbook Initial order of 1000 expected TD Bank Financial Group. 75,000 Playbook Will get Demo devices in Dec SAP 48,471 iPad Initial distribution of 100 SAP 48,471 Playbook Tellabs 3,295 iPad Supply Chain Hyatt 45,000 iPad Guest Service Elm iPad EHS Audit Jetstar iPad On flight Entertainment FT 1,800 iPad Lloyd iPad Underwriting Slips Rehab Care 18,000 iPad Patient Service NBC Universal iPad BBC iPad Journalism Kaweah Delta Health Care 3,200 iPad Healthcare Running Citrix virtual desktop Denver International Airport 1,100 Playbook Security Operation Deploy up to 300 tablets Arhaus Furniture iPad Logistics 50 iPads for delivery drivers Markley Enterprise 75 iPad Designing 3 iPads Sales Development Services iPad Advertising Anglebury Press iPad Design Display Redlands Police Department 98 iPad Servillance RC Auto Corporation iPad Sales Pizza Capers iPad Taking Orders Colorado Department of Corrections Playbook Stradley Ronon Stevens & Young, LLP Playbook Lake Travis Independent School District, Playbook
Source: Company data, Credit Suisse estimates.
Our Credit Suisse IT Survey equally illustrates strong interest in corporate tablet adoption as represented in Figure 114 and Figure 115, and shows to 30% of PCs LT could be tablets.

16 March 2011
IT Hardware 97
Figure 114: Mobile PCs Like Notebooks and Netbooks Stand the Highest Chance of Being Replaced by Tablets Question: What is the probability that a tablet will replace the following
devices in the next three years?
Figure 115: Which Our Survey Suggests May Be Upward of 30% of Total Commercial PC Demand Question: What % of your global employee base have/ will have a
tablet device (supported by enterprise) at these points in time?
Other5%
Smartphone12%Desktop
14%
GPS15%
Notebook23%
Netbook31%
0%
5%
10%
15%
20%
25%
30%
35%
Currently 1 year from now 2 years from now 5 years from now
Source: Credit Suisse IT Survey. Source: Credit Suisse IT Survey.
Apps support from the start. Another aspect of the tablet market which makes it attractive relative to traditional Windows-based PCs is the number of apps available on the various platforms (generally for a nominal price), as shown in Figure 117. In addition to sheer number of apps, the variety of offerings from books to games, entertainment, education and productivity is extensive (and we would argue relatively complete).
Figure 116: Apple App Store Growth Has Been Strong Since Launch, Offering Over 325,000 Apps
Figure 117: iPad-Specific Apps Have Seen Significant Growth, Reaching Over 65,000 Apps by February 2011
0
50,000
100,000
150,000
200,000
250,000
300,000
350,000
May
-08
Jun-
08Ju
l-08
Aug
-08
Sep-
08O
ct-0
8N
ov-0
8D
ec-0
8Ja
n-09
Feb-
09M
ar-0
9A
pr-0
9M
ay-0
9Ju
n-09
Jul-0
9A
ug-0
9Se
p-09
Oct
-09
Nov
-09
Dec
-09
Jan-
10Fe
b-10
Mar
-10
Apr
-10
May
-10
Jun-
10Ju
l-10
Aug
-10
Sep-
10O
ct-1
0N
ov-1
0D
ec-1
0
Total apps count on Apple's App Store
0
10,000
20,000
30,000
40,000
50,000
60,000
Apr
-10
May
-10
Jun-
10
Jul-1
0
Aug
-10
Sep-
10
Oct
-10
Nov
-10
Dec
-10
Total apps count on Apple's iPad app store
Source: Company data, Credit Suisse estimates Source: Company data, Credit Suisse estimates
Carrier support opens a new channel. Given key drivers of tablet demand include the need for instant on, connectivity (Wi-Fi but also cellular) and mobility, the carrier channel becomes a natural and globally well established outlet for sale to consumers. Although netbooks did try their hand at carrier distribution (embedded with cellular connectivity) in the U.S. and Western Europe, and they failed quickly; we believe these devices weren’t compelling from a user standpoint. In fact, we’d highlight a few core differences between these devices, suggesting a more significant uptake for tablets given: (1) always on—tablets are and netbooks are not, (2) mobility—the tablet form factor nearly twice as thin, (3) battery life—the iPad gets ~10 hours web surfing and watching videos vs. a typical netbook at merely half this time, (4) apps ecosystem and cloud-based synchronization for tablet OSs versus Windows, and (5) wider array of tablet choices for consumers, from OS to hardware.

16 March 2011
IT Hardware 98
Significant vendor support. Tablets in our view represent the ultimate convergence product, falling somewhere in between a smartphone and a traditional PC. By consequence this has attracted the interest of myriad companies as highlighted above in Figure 111, which can develop a wide range of products across numerous price points.
High usage product. As with mobile devices, the tablet is often being used to replace one’s time spent on a computer (which nowadays largely includes web-related activities like e-mail and web browsing). In fact, according to a Cooper Murphy Copywriter survey of over 1,000 U.K. iPad owners, on average an individual spent nearly 10 hours a week (or about an hour and a half per day) on their tablet, which compares with between 2 and 5 hours for smartphone usage based on various surveys published on the internet.
Working Out the Tablet Market; Look by Price Point The tablet market has certainly seen fast growth over the last year, but we now address the more important question of how significant the tablet market opportunity is long-term. While there are a number of ways one might forecast the tablet market, we take a price-point based approach given we think this serves as a strong proxy for use case (in the following section we provide a cannibalization-based approach as a way to think about upside to our estimate). Based on this approach, we expect users to spend some $120bn on tablets longer term.
Figure 118: We Expect that PC Volumes Continue to Move Down Market Longer Term
0%
10%
20%
30%
40%
50%
60%
70%
80%
90%
100%
< $9
9
< $1
99
< $2
99
< $3
99
< $4
99
< $5
99
< $6
99
< $7
99
< $8
99
< $9
99
< $1
099
< $1
,199
< $1
,299
< $1
,399
< $1
,499
< $1
,500
Cum
ulat
ive
unit
shar
e un
der p
rice
poin
t, %
2011E 2012E 2013E 2014E 2015E 2006 2002
2015E
Over the next five years (2010-15E), we expect:
1) The cumulative percentage of global PC volumes at less than $500 ASP to increase from 31% to 67%.
2) And the cumulative percentage of total global volume under ASP of $1,000 to increase from 87% to 96%.
1
2
2014E2013E
20102011E2012E
2006
2002
Source: Company data, Credit Suisse estimates.
Step 1. Projecting the PC industry by price point. For both consumer and corporate markets as discussed earlier (and as seen in Figure 94), we have observed a clear shift down market for PC volume. In particular, we would note that PCs selling under an ASP of $500 increased to 31% of total volume (as of 2010) from a mere 3% in 2004. We then argued that we expect this price trend to continue through 2015 as (1) new entrants (handset vendors primarily) enter the market, (2) BOM continues to decline, and (3) vendors move to address the emerging market opportunity. As such we expect that by 2015 (shown in Figure 118) cumulative PC volume under an ASP of $500 increases to nearly two-thirds of global units (67%).

16 March 2011
IT Hardware 99
Step 2. Projecting out the desktop and mobile markets… a theoretical exercise. Before we move on to the percentage of the market we think tablets will occupy, our approach requires that we estimate how large the desktop and mobile PC markets could be, by price point, had tablets never been introduced. We acknowledge this is somewhat of a theoretical exercise, but recall that the fundamental basis for our model is agnostic to form factor. For this reason, we can estimate the price points which tablets are most likely to occupy based on use case (discussed in step 3).
Step 3. Tablets will cannibalize only certain price tiers, but still see volumes of 298mn longer term. Now that we have an estimate of the size of the overall PC market by price point we believe a framework for thinking about the potential size of the tablet market becomes more straightforward. As shown in Figure 119, we believe that the market for lower-end PC market i.e., in the price range of $0 to $499 will see significant penetration by tablets long-term in the range of 45-50%. The contrasts with less penetration of overall PC units in higher price bands, like $1,000-plus, where we think tablets only represent 2% of global volume. The end result based on this approach is that tablets can represent a 65mn/ 116mn unit market in 2011/12 and 298mn unit market in the long term.

16 March 2011
IT Hardware 100
Figure 119: Tablets to Represent a 298mn Unit Opportunity (42% of Total PC Units) Long Term in millions, unless otherwise stated
PC percentage breakdown by price band Tablet share of PCs by price band Tablet unit estimates by price band (mn)2010 2011E 2012E 2013E 2014E 2015E 2010 2011E 2012E 2013E 2014E 2015E 2010 2011E 2012E 2013E 2014E 2015E
Consumer Consumer ConsumerDesktop Desktop Desktop$0-$299 11% 13% 15% 17% 19% 21% $0-$299 0% 0% 11% 18% 28% 48% $0-$299 0 0 1 2 3 6$300-$499 33% 36% 39% 42% 46% 49% $300-$499 0% 4% 11% 19% 30% 36% $300-$499 0 1 2 4 8 10$500-$699 32% 29% 26% 23% 20% 16% $500-$699 0% 5% 4% 8% 11% 14% $500-$699 0 1 1 1 1 1$700-$999 12% 11% 10% 10% 9% 8% $700-$999 0% 1% 1% 1% 1% 1% $700-$999 0 0 0 0 0 0$1,000+ 12% 11% 10% 8% 7% 6% $1,000+ 0% 0% 0% 0% 0% 0% $1,000+ 0 0 0 0 0 0Total 100% 100% 100% 100% 100% 100% Total 0% 3% 7% 13% 21% 30% Total 0 2 4 7 12 17
Mobile Mobile Mobile$0-$299 3% 6% 10% 14% 17% 21% $0-$299 0% 27% 35% 44% 54% 66% $0-$299 0 3 7 15 28 49$300-$499 29% 33% 37% 41% 45% 49% $300-$499 15% 50% 69% 72% 69% 67% $300-$499 5 29 54 75 92 116$500-$699 30% 27% 24% 22% 19% 16% $500-$699 24% 38% 40% 40% 48% 57% $500-$699 8 17 21 22 27 33$700-$999 24% 21% 18% 15% 12% 9% $700-$999 13% 20% 25% 21% 23% 21% $700-$999 4 7 9 8 8 6$1,000+ 14% 13% 11% 9% 7% 5% $1,000+ 0% 0% 0% 0% 0% 0% $1,000+ 0 0 0 0 0 0Total 100% 100% 100% 100% 100% 100% Total 14% 33% 43% 47% 52% 57% Total 17 56 91 120 155 204
Total Total Total$0-$299 5% 8% 11% 14% 18% 21% $0-$299 0% 17% 29% 38% 50% 64% $0-$299 0 3 8 17 31 55$300-$499 31% 34% 38% 41% 45% 49% $300-$499 10% 38% 56% 62% 63% 63% $300-$499 5 29 56 80 100 126$500-$699 31% 28% 25% 22% 19% 16% $500-$699 16% 29% 32% 34% 42% 51% $500-$699 8 18 21 23 28 34$700-$999 20% 18% 16% 14% 11% 8% $700-$999 11% 17% 21% 18% 20% 18% $700-$999 4 7 9 8 8 6$1,000+ 14% 12% 11% 9% 7% 5% $1,000+ 0% 0% 0% 0% 0% 0% $1,000+ 0 0 0 0 0 0Total 100% 100% 100% 100% 100% 100% Total 10% 26% 36% 41% 47% 54% Total 17 57 95 127 167 221Units (mn) 173 225 266 309 353 411
Commercial Commercial CommercialDesktop Desktop Desktop$0-$299 11% 13% 15% 17% 19% 21% $0-$299 0% 0% 0% 0% 1% 2% $0-$299 0 0 0 0 0 1$300-$499 27% 31% 35% 39% 43% 47% $300-$499 0% 0% 0% 2% 3% 6% $300-$499 0 0 0 1 2 4$500-$699 37% 35% 33% 30% 28% 25% $500-$699 0% 0% 0% 1% 2% 3% $500-$699 0 0 0 0 1 1$700-$999 19% 17% 14% 11% 9% 6% $700-$999 0% 0% 0% 0% 0% 0% $700-$999 0 0 0 0 0 0$1,000+ 6% 5% 4% 3% 2% 1% $1,000+ 0% 0% 0% 0% 0% 0% $1,000+ 0 0 0 0 0 0Total 100% 100% 100% 100% 100% 100% Total 0% 0% 0% 1% 2% 4% Total 0 0 0 1 3 6
Mobile Mobile Mobile$0-$299 2% 4% 6% 8% 10% 11% $0-$299 0% 6% 15% 15% 15% 37% $0-$299 0 0 1 1 2 7$300-$499 13% 20% 26% 33% 39% 46% $300-$499 0% 10% 18% 26% 33% 50% $300-$499 0 2 6 11 19 37$500-$699 32% 31% 31% 30% 29% 29% $500-$699 0% 10% 22% 29% 40% 45% $500-$699 0 3 8 12 17 21$700-$999 35% 31% 26% 21% 16% 11% $700-$999 0% 7% 16% 22% 39% 39% $700-$999 0 2 5 6 9 7$1,000+ 18% 15% 12% 9% 6% 3% $1,000+ 0% 1% 6% 9% 10% 10% $1,000+ 0 0 1 1 1 0Total 100% 100% 100% 100% 100% 100% Total 0% 8% 17% 24% 33% 45% Total 0 8 21 32 48 72
Total Total Total$0-$299 6% 8% 10% 12% 14% 16% $0-$299 0% 1% 4% 5% 6% 16% $0-$299 0 0 1 1 2 7$300-$499 20% 25% 31% 36% 41% 47% $300-$499 0% 4% 8% 13% 18% 29% $300-$499 0 2 6 12 21 41$500-$699 35% 33% 32% 30% 29% 27% $500-$699 0% 4% 11% 15% 22% 27% $500-$699 0 3 8 12 18 22$700-$999 27% 24% 20% 16% 12% 9% $700-$999 0% 5% 10% 15% 26% 27% $700-$999 0 2 5 6 9 7$1,000+ 12% 10% 8% 6% 4% 2% $1,000+ 0% 1% 5% 7% 8% 8% $1,000+ 0 0 1 1 1 0Total 100% 100% 100% 100% 100% 100% Total 0% 4% 9% 13% 18% 26% Total 0 8 21 33 50 77Units (mn) 178 208 242 259 278 301
Global Global GlobalDesktop Desktop Desktop$0-$299 11% 13% 15% 17% 19% 21% $0-$299 0% 0% 3% 6% 9% 16% $0-$299 0 0 1 2 3 6$300-$499 29% 33% 36% 40% 44% 48% $300-$499 0% 2% 4% 8% 11% 15% $300-$499 0 1 2 5 9 14$500-$699 36% 33% 31% 28% 25% 23% $500-$699 0% 1% 1% 2% 4% 5% $500-$699 0 1 1 1 2 2$700-$999 17% 15% 13% 11% 9% 7% $700-$999 0% 0% 0% 0% 0% 0% $700-$999 0 0 0 0 0 0$1,000+ 8% 7% 6% 5% 3% 2% $1,000+ 0% 0% 0% 0% 0% 0% $1,000+ 0 0 0 0 0 0Total 100% 100% 100% 100% 100% 100% Total 0% 1% 2% 5% 8% 11% Total 0 2 4 8 14 23
Mobile Mobile Mobile$0-$299 2% 5% 8% 12% 15% 18% $0-$299 0% 22% 30% 37% 46% 60% $0-$299 0 3 9 17 30 56$300-$499 22% 28% 33% 38% 43% 48% $300-$499 11% 40% 54% 59% 58% 62% $300-$499 5 31 60 86 111 152$500-$699 31% 29% 27% 24% 22% 20% $500-$699 13% 26% 33% 36% 45% 52% $500-$699 8 20 29 34 44 53$700-$999 29% 24% 21% 17% 13% 9% $700-$999 6% 14% 21% 22% 29% 27% $700-$999 4 9 14 14 17 13$1,000+ 16% 14% 11% 9% 7% 5% $1,000+ 0% 1% 2% 3% 3% 2% $1,000+ 0 0 1 1 1 0Total 100% 100% 100% 100% 100% 100% Total 8% 23% 34% 39% 46% 54% Total 17 64 112 152 203 275
Total Total Total$0-$299 6% 8% 11% 13% 16% 19% $0-$299 0% 9% 17% 24% 33% 47% $0-$299 0 3 9 18 33 62$300-$499 25% 30% 34% 39% 43% 48% $300-$499 6% 24% 36% 42% 44% 49% $300-$499 5 31 62 92 120 166$500-$699 33% 30% 28% 26% 23% 21% $500-$699 7% 16% 21% 24% 31% 38% $500-$699 8 21 30 35 46 56$700-$999 24% 21% 18% 15% 12% 9% $700-$999 4% 10% 16% 17% 23% 22% $700-$999 4 9 14 14 17 13$1,000+ 13% 11% 9% 8% 6% 4% $1,000+ 0% 0% 2% 2% 2% 2% $1,000+ 0 0 1 1 1 0Total 100% 100% 100% 100% 100% 100% Total 5% 15% 23% 28% 34% 42% Total 17 65 116 160 217 298Units (mn) 351 433 508 568 631 712
1) Higher tablet penetration at lower price tiers. We think tablets offer the user a less expensive alternative to web-browsing/ email and other connectivity than a desktop or mobile PC. While we expect this to change over time as tablet OSs become more feature rich and hardware specs improve, we expect high penetration in low PC price tiers. Between $300-$499, where we expect the highest number of tablet devices to be sold, we assume 24%/36% penetration in 2011/12 and 49% long-term.
2) Consumer versus commercial. While the tablet device certainly does and will have significant enterprise applications, we continue to believe tablets are best suited for consumers who place a higher value on i) always on, ii) ultra portable, iii) connected devices. We assume that longer-term tablets represent more than half of consumer PC volumes and 26% of commercial volumes (42% combined).
3) Mobile versus static. Given tablets address the mobile segment of the PC market more than the static desktop market, we assume higher penetration of mobile PCs (54% of global volumes) versus only 11% for desktops.
We forecast tablet units of 65mn/116mn in 2011/12 and 298mn LT, representing 42% of overall PC demand. Here we have used a
price-point based penetration approach to forecasting the market given a strong argument for use case by price tier.
11
33
22
22
Source: Company data, Credit Suisse estimates.

16 March 2011
IT Hardw
are 101
Figure 120: Cannibalization of Other End Market Suggests Our LT Estimate for Tablet Units Could Be 18% Higher or 355mn (versus 298mn LT) US$ in millions, unless otherwise stated
Current market/ estimates Potential cannibalisation CannibalisedUnits (mn) ASP (US$) Revenue ($mn) Units (mn) ASP (US$) Revenue ($mn) Units (%) Revenue (%)
PCsConsumer 190 659 125,308 17 600 10,200 NM NMCommercial 178 693 123,330 0 600 120 NM NMTotal PCs 368 675 248,638 17 600 10,320 NM NM
Other product categories:eReaders 7 293 1,915 2 293 479 25% 25%PNDs 41 245 9,923 4 245 992 10% 10%Portable Gaming Devices 31 172 5,408 24 172 4,056 75% 75%Gaming Consoles 48 252 12,042 0 252 0 0% 0%Portable DVD Player 9 130 1,210 2 130 302 25% 25%Automotive DVD Player 12 461 5,494 0 461 0 0% 0%Total other product categories 147 244 35,991 32 184 5,829 21% 16%
Total markets addressed 516 552 284,629 49 331 16,149 9% 6%Normalized for tablet price 27 600 16,149
Current market/ estimates Potential cannibalisation CannibalisedUnits (mn) ASP (US$) Revenue ($mn) Units (mn) ASP (US$) Revenue ($mn) Units (%) Revenue (%)
PCsConsumer 411 426 175,350 221 416 91,965 NM NMCommercial 301 410 123,330 77 416 32,186 NM NMTotal PCs 712 419 298,680 298 416 124,151 NM NM
Other product categories:eReaders 7 181 1,327 7 181 1,327 100% 100%PNDs 22 223 4,860 5 223 1,215 25% 25%Portable Gaming Devices 64 148 9,485 64 148 9,485 100% 100%Gaming Consoles 66 308 20,325 23 308 7,114 35% 35%Portable DVD Player 4 94 367 4 94 367 100% 100%Automotive DVD Player 17 397 6,690 8 397 3,345 50% 50%
Total other product categories 180 239 43,053 112 203 22,852 62% 53%
Total markets addressed 892 383 341,733 410 358 147,003 46% 43%Normalized for tablet price 353 416 147,003
Upside to our current estimate 55 Up 18%
2015E
2010 In addition to the PC market, we think it is also important to consider the potential impact (upside) of tablets cannibalizing other consumer electronics markets.
Conclusion: If we assume the tablet market cannibalizes by 2015:
• 100% of eReaders
• 25% of PNDs
• 100% of Portable Gaming Devices
• 35% of Gaming Consoles
• 100% of Portable DVD Players
• 50% of Automotive DVD Players
This suggests overall consumer electronic cannibalization of 43%, leading to an additional 55mn units (based on the LT average tablet ASP of $416). Based on our LT tablet forecast of 298mn, an additional 55mn units implies a further 18% upside.
Source: Company data, Credit Suisse estimates.

16 March 2011
IT Hardware 102
Tablet Cannibalization Is Not Just About PCs While our preferred methodology for projecting tablets, as is shown in the section above, involves a combination of top down PC forecasting and price (as a proxy for use case), equally we think it is important to consider the disruption tablets may cause to other industries. When this cannibalization of other industries is taken into consideration we think it could add 55mn units to our long-term (2015) tablet estimate of 298mn, implying further upside of 18%. Here we would make the following observations around whether our estimates could prove conservative or optimistic.
Cannibalization of the commercial PC environment. Corporate penetration is still quite low. As shown in Figure 119, we are still only assuming that within the corporate market tablet penetration remains low at 26% by 2015, though we would note that our Credit Suisse IT Survey suggests this could be as high as 30% by 2015. Further, our proprietary survey suggests that traditional mobile PCs stand the risk of being replaced (notebooks and netbooks).
Cannibalization of other consumer industries could offer upside. The tablet is similar to the smartphone in the sense that replaces not only a large proportion of tasks competed on a desktop or laptop, but it could also cause disintermediation of use for other product categories like the below. (For details please refer to Figure 120.)
■ E-readers. Given tablets’ large screens of 7” and 10”, relative to smartphones, it would seem that a natural extension of the device would be e-reading. In fact, according to a recent Cooper Murphy Copywriters poll of over 1,000 U.K. iPad owners, respondents preferred reading newspapers, magazines and books on an iPad relative to all other devices or physical forms of the media. (See Figure 121 and Figure 122.) We estimate that nearly 100% of the e-reader market could be cannibalized by tablet devices by 2015 (from 25% today).
Figure 121: The Highest Number of Respondents (31%) Prefer to Read Newspapers and Magazines on an iPad
Figure 122: And When Asked About Preferred Method for Reading Books, Respondents (41%) Again Chose the iPad
What is your preferred method of reading newspapers and magazines?
iPad31%
Laptop/Computer26%
Print24%
Mobile Phone12%
E-Reader7%
What is your preferred method of reading books?
iPad41%
Print36%
Laptop/Computer12%
Mobile Phone4%
E-Reader7%
Source: Cooper Murphy Copywriters poll of 1,034 UK iPad owners Source: Cooper Murphy Copywriters poll of 1,034 UK iPad owners
■ Portable DVD players, TVs, MP3 and other CEs. As highlighted in Figure 120, there are a number of devices that currently fill the need for on the go entertainment, ranging from MP3 players to portable DVD players. While tablets only address a fraction of these devices given limitations on connectivity (external ports on the tablet or wireless connections/standards) and device content, over time we think it makes sense for a user to own one integrated device. For PNDs, gaming consoles and automotive DVD players we assume LT cannibalization of 25%/35%/50% and complete cannibalization for portable gaming devices and portable DVD players.

16 March 2011
IT Hardware 103
■ High-end smartphones. While our analysis of additional consumer electronics (versus just computers) in Figure 120 focuses on products with single functionality, given the ease of consolidation into a single platform like a tablet, equally we would be remiss not to highlight the possibility that tablets cannibalize ultra converged devices like high-end smartphones (taking into consideration the evolution of technologies like VoIP). Given our estimate that over 130mn smartphones will sell in the high-end by 2015 (>$500 ASP), even 25% cannibalization of this market would suggest a further 10% upside to our current LT tablet forecast.
Figure 123: High-End Smartphones (>$500) Will Represent Over 130mn Units by 2015 in millions, unless otherwise stated Smartphone market (mn) Price band 2008 2009 2010 2011E 2012E 2013E 2014E 2015E <= $50 0 1 1 5 7 15 31 50 $50 - $100 0 0 6 9 15 30 56 83 $100 - $150 0 8 26 28 42 63 92 146 $150 - $200 5 20 48 68 99 132 160 182 $200 - $250 17 15 54 73 105 141 162 167 $250 - $300 20 24 18 36 56 81 98 111 $300 - $350 19 36 26 51 62 64 67 69 $350 - $400 23 11 20 31 33 35 36 37 $400 - $450 5 8 29 41 41 40 39 37 $450 - $500 29 10 11 18 20 21 23 25 > $500 21 39 58 91 113 119 125 133
Total 139 172 297 451 594 740 888 1,041 Source: Company data, Credit Suisse estimates.
What’s next for tablets? The X-factor to forecasting the growth trajectory of this market LT. Perhaps the most challenging aspect of looking at how tablets can impact the overall telecom and consumer electronics market is considering all the future applications that can be addressed by such a device. While we have tried to capture this in the above analysis, inherently we believe our estimates could be conservative as they ignore newer applications. Good examples include (1) using the tablet as a remote for the home, (2) as a menu at a restaurant, or (3) as a point of sale device at a convenience store or a pharmacy. Admittedly, these are niche markets for tablets now, but we argue they shouldn’t be entirely ignored.
Once in a Lifetime Chance to Break a Monopoly Within the PC industry the Wintel duopoly is hardly a new phenomena, however we find it is worth exploring in light of new PC form factors (particularly tablets) given hardware vendors’ opportunity to use new suppliers and effectively break the strangle hold Microsoft and Intel have on the industry. As shown in Figure 124, Microsoft and Intel (Wintel) have accounted for over 75% of industry operating profits last year. We would highlight the following key reasons the vendors representing the other 25% of operating profits in the industry would be interested in supporting a viable alternative.
(1) ARM-based chips leading for now. ARM-based tablet chips are gaining significant traction versus the x86-based Atom processor given (1) a power management advantage currently, which cannot be over stated on a portable device and (2) support from leading OSs like Android, iOS and webOS. While Intel expects its “Oak Trail” tablet chips to close this gap (we would note that during CES in January 2011, the company highlighted design wins with over 100 tablets), product timing and viability (consumer uptake of Windows 7 tablets) remains to be seen. We’d further note that key ARM-based suppliers like Qualcomm, Apple, Samsung, NVIDIA and Marvell are already designing dual-core processors (some even quad-core) which will further the narrow the performance gap.

16 March 2011
IT Hardware 104
Figure 124: The Operating Profit Share of the Smartphone Industry Is Much Different than that of the PC Industry Given the Nonexistence of a Chip/Software Duopoly (Wintel)
0%
10%
20%
30%
40%
50%
60%
70%
80%
90%
100%
Handset vendors PC vendors
Ope
ratin
g pr
ofit
shar
e of
indu
stry
*
Apple
Nokia
Samsung
RIM
HTC
Qualcomm
Other chipset vendorsEMS vendors
Apple
HP
DellLenovo
Acer
Microsoft
Intel
EMS vendors We compare the handset and PC industries* to illustrate the wide disparity in how profits are shared across the supply chain/ vendors. Here we make the following points:
1) The top five handset vendors (by profit) generate nearly 90% of the industry's profits, vs. only 20% for the PC industry.
2) Software is integrated at the vendor level for handsets/ smartphones but largely owned by Microsoft in the PC industry. As such, Microsoft alone accounts for ~35% of industry profits.
3) Handset vendors have choice of CPU (Qualcomm, Texas Instruments, NVIDIA, Marvell etc) whereas Intel predominately controls supply for the PC industry. For this reason, chipset vendors in the handset industry only account for some 10% of industry profits, vs. over 40% for Intel in the PC industry.
Given tablet vendors will have a choice of OS and chipset provider, we think the tablet industry evolves in a similar way to handsets, with vendors sharing more of industry profits and vendors like Microsoft and Intel losing profit share.* Industry as top five hardware vendors, software vendors, chip providers and EMS suppliers
1
1
90%
20%
2
3
35%
40%3 10%
Source: Company data, Credit Suisse estimates.
(2) Microsoft Windows not optimized for touch-screen yet. Based on our conversations with industry experts and former Microsoft employees, we believe Windows 7 simply cannot be optimized for touch (in terms of finger input on capacitive touch screens). Here we would highlight a few key points.
■ The company has historically focused on integration of touch around handwriting recognition/ stylus (versus finger touch).
■ Most Windows applications are written for a mouse/fine point (i.e., stylus) and therefore are not conducive to use with a finger (capacitive touch).
■ Microsoft traditionally optimized their software to function as a platform which would support all hardware-types. Given the tight vertical integration of hardware and software vendors in the smartphone and tablet markets, the company may need to redefine its target hardware suppliers. A good example of this is support of only Qualcomm-based Snapdragon chips in the new Windows Phone 7 smartphones.
■ Windows 8 (which the company noted will also be compatible with ARM-based processors) will likely be optimized for touch, but this we think will be released in 2012. Given the current x86 platform is not optimized for battery life, this makes for vendors using Windows on a tablet even less convincing. Here we’d note that the iPad’s ARM-based application processor has a battery life of ~10 hours on normal usage, but an Wintel based tablet on average may only last for 5-7 hours on average.

16 March 2011
IT Hardware 105
(3) Vendors can pick and choose OS and chipset—more industry competition. The two clear winners from a disaggregation of the Wintel duopoly are PC/handset vendors and consumers. First PC and handset vendors can choose from a varying number of ARM-based chip suppliers including Qualcomm, Samsung, NVIDIA and Marvell but also OSs like Android. As innovation accelerates to fill sockets, consumers stand to benefit from enhanced technology at competitive prices.
(4) Google offering close integration with hardware vendors on key launches. One key difference between the Microsoft and Google approach to their respective operating systems’ hardware partners (Windows and Android, respectively) is a platform versus targeted strategy. Whereas Microsoft has taken the platform approach, whereby any vendor can plug and play with the operating system (and therefore quality/performance is left up to the partner), in our view, Google has taken a more focused approach by working closely with key vendors to provide an optimized hardware solution. This can be evidenced by new Android launches on key hardware devices as shown in Figure 125; for example, Google worked with HTC and Motorola to provide the highest quality experience for the consumer in the flagship product launches.
Figure 125: Google Worked Closely with HTC and Motorola on Key Android Launches Android release Key hardware vendor/ device
Android 1.0/ 1.5/ 1.6 HTC Dream i.e. G1 Android 2.0 Motorola DROID Android 2.1 HTC (Google) Nexus One Android 3.0 Motorola XOOM
Source: Company data, Credit Suisse estimates
All this means that as the industry shifts toward tablets (which we think will represent 42% of total PC volume 2015), Wintel’s share of PC industry operating profits declines as that of other chip and OS vendors increases.
What Does a Tablet Need to Become? We acknowledge that our positive view on the tablet market (298mn units LT or 42% of global PC volumes) inherently assumes a number of hardware and form factor upgrades longer-term. In particular, the tablet today which is primarily used for content consumption will need to be optimized also for content creation. Below we note a few of these changes.
Improved processing power. As shown in Figure 126, we see that on average the speed of a netbook is 1.6GHz at a price point of ~$350. On the other hand, tablets have 25% less processing power but on average cost nearly 80% more. We expect that this difference moderates over time as the ‘novelty’ device premium for tablets reduces and ARM-based vendors continue to advance processor speeds. In fact, tablets are already embedding dual core processors at a rate faster than netbooks.
Figure 126: Netbooks Still Have a Price/Performance Advantage to Tablets, but Tablets Are Closing this Gap Top selling netbooks * ASP Processor Speed Cores Tablet launches ASP Processor Speed Cores Toshiba NB505 $299.99 Atom N455 1.7 GHz 1 Apple iPad $600.00 Apple A4 1.0 GHz 1 ASUS Eee PC 1001PX $259.99 Atom N450 1.7 GHz 1 Samsung Galaxy Tab $750.00 Samsung 1.0 GHz 1 ASUS Eee PC 1015PEM $365.54 Atom N550 1.5 GHz 2 Blackberry Playbook $600.00 TI 4430 1.0 GHz 2 Acer Aspire One AOD255E $269.99 Atom N455 1.7 GHz 1 Motorola XOOM $600.00 Tegra 2 1.0 GHz 2 Toshiba NB305 $379.99 Atom N550 1.5 GHz 2 HP Slate 500 $800.00 Atom Z540 1.9 GHz 1 ASUS Eee PC Seashell 1215N $481.54 Atom D525 1.8 GHz 2 Dell Streak 7" $600.00 Tegra 2 1.0 GHz 2 HP Mini 110-3130NR $369.99 Atom N455 1.7 GHz 1 Cisco Cius $800.00 Atom 1.6 GHz 1 Gateway LT3119u $369.00 AMD L310 1.2 GHz 2 LG G-Slate $600.00 Tegra 2 1.0 GHz 2 ASUS Eee PC T101MT $459.55 Atom N450 1.7 GHz 1 ASUS Eee Transformer $400.00 Tegra 2 1.0 GHz 2 Toshiba Mini NB255 $328.99 Atom N455 1.7 GHz 1 ASUS Eee Pad Memo $600.00 Snapdragon 1.2 GHz 2
Average $358.46 1.6 GHz 1.4 Average $635.00 1.2 GHz 1.6 Source: Amazon.com, Credit Suisse estimates.

16 March 2011
IT Hardware 106
Accessories to assist in content creation. While tablets’ functionality nowadays is clearly focused around the touch interface and limited need for outside peripherals, we think this is more a function of what the device is being used for (content consumption), versus what we think it will be used for longer-tem (content consumption and creation). The accessories that generally sell with an iPad today (see Figure 127) are used to protect and connect the device (to a computer/monitor/power outlet) versus altering the functionality of the device. The exception to this is the external/dockable keyboard which allows users to faster input text, whether it be for email or notes. This is the type of peripheral we expect to drive increased content creation on the device therefore moving it to become the users’ primary PC device.
Figure 127: Majority of Accessories that Sell with an iPad Do Not Influence the Way the Device Is Being Used Key iPad accessories Price Description Apple iPad keyboard dock $69.00 Combines a charging dock with full-size keyboard Apple iPad case $39.00 Protects iPad and can be used in various positions Apple iPad dock $33.98 Docks and charges iPad, also includes a audio line out Apple iPad camera connection $29.00 Imports photos and videos from digital camera Apple iPad 10W USB power adapter $29.00 Charges iPad directly through an electrical outlet (6' long) Apple iPad dock connector to VGA adapter $29.00 Lets you connect your iPad to a TV, monitor or projector Macally viewing stand $18.01 Improves viewing angle, typing (horizontal/ vertical) Belkin screen protector $11.09 Provides a clear protective shield, preventing scratches Macally privacy screen $28.84 Darkens the screen (4 angles) to prevent viewing by others iPad Smart Cover $39.00 Magnetic cover for screen, introduced by Apple in conjunction with iPad 2
Average $32.59 Source: Apple.com.
A true power efficient multi-tasking solution. While most mobile OSs these days have some form of multi-tasking (iOS, Android, Blackberry OS/ QNX, Windows Phone 7, webOS etc), the solution is generally (not always) in the form of suspending and resuming the application to preserve battery life. We think that longer-term in order for tablets to be a true content creation device, a true multi-tasking solution—which means a user can actively run a program in the background, whether it’s crunching data or a streaming download without pausing another application, and that is also power efficient will be necessary. We don’t think the technical hurdle to creating this solution is high so would expect this limitation to be covered over the intermediate term.
A synchronization device to a primary device. All successfully selling tablets (i.e., iOS based iPad and Android-based currently), require the user to synchronize the device to a PC, which can assist the user in adding content, services, updates etc. While this is clearly diminishing over time as over the air updates become more popular and downloading content over 3G (or WiFi) is preferred, equally one less often links up their tablet or smartphone to a PC to offload data. We think that more standard functionality i.e., regular USB ports, may be necessary to transfer data from the device to the PC as the tablet becomes used more for content creation. While currently the Windows 7 based HP Slate 500 is the only tablet which provides this functionality, we expect other vendors add this feature to their products over time.

16 March 2011
IT Hardware 107
PC—Winners and Losers What makes a successful PC vendor? This is not an easy question to answer especially given constant change in industry dynamics, including new product categories (most recently tablets), mode of distribution (toward indirect channels from direct) and geographical exposure (strong growth in emerging markets compared to developed markets), etc. Last, it is important to note that ultimately even HP, the market leader in PC industry (market share at 18% last year), only enjoys a midsingle digit operating margin, which one might argue is hardly attractive. For this reason, we think execution on multiple fronts remains paramount to capturing value share. In this section, we attempt to score each of the vendors on six key metrics in order to determine who will win and lose LT.
Scorecard Categories (Weighting)
1. Tablets (30% weight): We expect tablets to represent 42% of the industry’s value share by 2015, and become a key area of focus for PC vendors going forward.
2. Distribution (20% weight): With 351mn PCs (excluding 17mn tablets) sold last year, we think distribution can deliver many benefits like i) improved time to market, ii) promotion, and iii) reach.
3. Emerging Market position (15% weight): Exposure to emerging markets is critical, with units growing 18% over the next five years (versus 10% in developed regions).
4. Brand (15% weight): In any consumer electronics and enterprise category, strength of brand (as a signal of quality) frequently contributes to a vendor’s success.
5. Scale and supply chain (10% weight): Vendors with a higher level of scale and more efficient supply chains enjoy benefits like i) purchasing power and ii) R&D leverage.
6. PC product portfolio (10% weight): Product success in our view may take a variety of angles including i) portfolio depth and breadth, ii) specs and iii) price points offered.
Vendor Conclusions (Ranking)
Apple (71/100—rank #1)—Benefitting from strength in high end and tablet market. In the traditional PC industry, Apple has adopted a fairly concentrated strategy, heavily supplying above the $1,000-plus price point and having a modest global unit and revenue share of 4%/9%. Longer term, as the PC market moves to incorporate tablets, we think Apple is best positioned in this category (scoring a 10/10) in our scorecard—both in terms of consumer and corporate adoption. This being said, Apple continues to hold a weak emerging market share in PCs and has limited portfolio breadth in the Mac line-up which may prove as a slight headwind in the near term.
HP (70/100—rank #2)—A close second, given lack of tablet visibility. While we do not deny the strategy HP is taking with webOS on tablets, we simply need to have visibility on i) uptake, ii) distribution and iii) ecosystem development before scoring the company higher in this category. Tablets aside, HP rates well on our scorecard in most other categories, namely brand and distribution. One weak area includes HP’s emerging market position.
Samsung (59/100—rank #3)—Addressing most categories well. Despite having only 3% revenue and value share in the PC industry, Samsung in our view is well positioned to continue gaining share given strength in i) scale and supply chain, ii) brand and iii) portfolio. While the company’s tablet strategy remains pinned to Android (which limits differentiation in our view), equally Samsung was the first of PC/smartphone OEMs to launch a tablet called Galaxy (following Apple’s iPad), which has already sold over 2mn units in the first 3 months.
Lenovo (54/100—rank #4)—Executing well in core areas of strength. Unlike other vendors which appear more balanced across all categories, Lenovo appears to have various pockets of strength (which to an extent outweigh the weaknesses). In fact, Lenovo has a very strong emerging market share (accounting for 30% of PC sales in China, which was

16 March 2011
IT Hardware 108
20% of global PC shipments as a country last year) and a favorable exposure to indirect distribution channels. Lenovo’s weaknesses include lack of tablet strategy, brand and scale.
Acer (52/100—rank #5)—Middle of the road. We score Acer a close number five to Lenovo primarily owing to a lower score in emerging market position (4/10). In fact, we observe that Acer in fact supplies a strong product portfolio primarily through indirect sales channels despite lower than average scores in brand, scale and emerging market position.
Dell (45/100)—rank #9)—Struggling on many fronts. Dell, in our view, is ill positioned to gain share in the PC industry owing to weak scores in the core areas of tablet (the Streak 7 in our view is not competitive), distribution (the company is highly exposed to sell through direct channels) and emerging market position. This said, Dell has maintained a strong brand image and given that the company supplies 12% of global PC demand, it still has a valuable level of scale relative to peers in the industry.
Unit and Value Share—The Story so Far Before diving into the discussion of our scorecard, we first think it is helpful to step back and put into context three key trends, we see affecting all vendors in the PC industry:
Figure 128: PC Vendors Unit and Value Share Evolution Over the Past Five Years PC unit share, % PC revenue share, %
Vendor 2006 2007 2008 2009 2010
Vendor 2006 2007 2008 2009 2010
Hewlett-Packard 15.3% 17.7% 18.1% 19.1% 17.9% Hewlett-Packard 16.1% 18.3% 19.3% 19.2% 18.4% Acer 8.3% 9.5% 10.6% 12.9% 12.7% Acer 6.8% 6.8% 6.8% 8.8% 8.5% Dell 15.7% 13.9% 14.1% 12.1% 12.0% Dell 21.0% 19.4% 18.7% 16.5% 16.2% Lenovo 7.2% 7.6% 7.5% 8.0% 9.7% Lenovo 7.9% 8.0% 7.9% 8.3% 9.1% Toshiba 4.0% 4.1% 4.6% 5.0% 5.4% Toshiba 4.8% 4.8% 5.3% 5.4% 5.3% ASUS 1.2% 1.7% 3.7% 4.3% 5.4% ASUS 1.5% 2.0% 2.9% 3.3% 4.4% Apple 2.4% 2.9% 3.4% 3.6% 4.1% Apple 4.7% 6.0% 7.3% 8.3% 8.9% Samsung 0.8% 1.0% 1.2% 2.1% 3.2% Samsung 1.0% 1.1% 1.3% 2.6% 3.2% Sony 1.6% 1.8% 2.0% 1.9% 2.3% Sony 2.5% 2.7% 3.0% 2.7% 3.2% Fujitsu 3.5% 3.2% 2.7% 1.7% 1.6% Fujitsu 4.0% 3.6% 3.2% 2.1% 2.0% Others 40.0% 36.5% 32.1% 29.2% 25.7% Others 29.8% 27.2% 24.3% 22.9% 20.7% Total 100.0% 100.0% 100.0% 100.0% 100.0% Total 100.0% 100.0% 100.0% 100.0% 100.0%Asian OEMs in top 10 22.5% 24.8% 27.7% 31.0% 34.9% Asian OEMs in top 10 23.5% 24.3% 25.1% 27.8% 30.5% Source: Gartner, Company data, Credit Suisse research
Unit and value share consolidating for the top 10 PC OEMs. As seen in Figure 128 above, the top 10 PC OEMs accounted for nearly 75% of the industry’s unit share in 2010 (80% of value share), up from 60% unit/70% value share just five years prior. The largest gainers over this period have been ASUS, Lenovo, Apple and HP, which have taken share from vendors like Dell, Fujitsu and others not mentioned above.
PC margins sticky in the low- to midsingle digits. Many PC companies tend not to report profitability which makes comparisons around profit share difficult to compare accurately. However, based on current information available and our estimates, we conclude that margins have tended to decline over time. Longer term, we think execution will be critical as competitive pressures and lower barriers to entry support continued thin profitability.
Asian vendors are gaining share. Owing to rapid growth in emerging markets (discussed below in ‘Emerging Market Position’) and in particular Asia Pacific, Asian PC vendors have gained a significant level of share as seen above in Figure 128. In fact, Asian-based vendors (only in the top 10 PC OEMs) have gained 12% of unit share and 7% of value share in the PC industry over the last five years.

16 March 2011
IT Hardw
are 109
Figure 129: Summary PC Scorecard Suggests Apple, HP, Samsung Will Be the Largest Share Gainers LT, with ASUS, Dell, and Fujitsu Likely to Lose Share
PC Scorecard Weight Apple HP Samsung Lenovo Acer Toshiba Sony ASUS Dell Fujitsu Others
Rank (weighted) 1 2 3 4 5 6 7 8 9 10 11Score (weighted) 71 70 59 54 52 51 48 48 45 38 32
Rank PC market share, % 7 1 8 4 2 5 9 6 3 10 NAGlobal PC market share (2010), % 4.1% 17.9% 3.2% 9.7% 12.7% 5.4% 2.3% 5.4% 12.0% 1.6% 25.7%
Rank PC revenue share, % 4 1 8 3 5 6 9 7 2 10 NAGlobal PC revenue share (2010), % 8.9% 18.4% 3.2% 9.1% 8.5% 5.3% 3.2% 4.4% 16.2% 2.0% 20.7%
Key metrics:Tablet 30.0% 10 5 6 3 4 3 4 4 4 3 3Distribution 20.0% 5 9 3 8 9 8 3 6 2 3 2Emerging market position 15.0% 2 5 6 10 4 3 3 6 4 3 7Brand 15.0% 10 10 7 3 4 5 6 3 7 5 1Scale and supply chain 10.0% 10 8 8 2 3 6 9 1 7 4 1PC product portfolio 10.0% 4 8 7 7 8 7 7 8 7 6 5
Apple (71/100 – rank #1) – Benefitting from strength in high end and tablet market. In the traditional PC industry, Apple has adopted a fairly concentrated strategy, heavily supplying above the $1,000+ price point and having a modest global unit and revenue share of 4%/9%. Longer term as the PC market moves to incorporate tablets, we think Apple is best positioned in this category (scoring a 10/10) in our scorecard—both in terms of consumer and corporate adoption. This said, Apple continues to hold a weak emerging market share in PCs and has limited portfolio breadth in the Mac line-up which may prove as a slight headwind in the near term.
HP (70/100 – rank #2) – A close second, given lack of tablet visibility. While we don’t deny the strategy HP is taking with webOS on tablets, we simply need to have visibility on i) uptake, ii) distribution and iii) ecosystem development before scoring the company higher in this category. Tablets aside, HP rates well on our scorecard in most other categories, namely brand and distribution. One weak area includes HP’s emerging market position.
Samsung (59/100 – rank #3) – Addressing most categories well. Despite having only 3% revenue and value share in the PC industry, Samsung in our view is well positioned to continue gaining share given strength in i) scale and supply chain, ii) brand and iii) portfolio. While the company’s tablet strategy remains pinned to Android (which limits differentiation in our view), equally Samsung was the first of PC/smartphone OEMs to launch a tablet called Galaxy (following Apple’s iPad), which has already sold over 2mn units in the first 3 months.
Lenovo (54/100 – rank #4) – Executing well in core areas of strength. Unlike other vendors which appear more balanced across all categories, Lenovo appears to have various pockets of strength (which to an extent outweigh the weaknesses). In fact, Lenovo has a very strong emerging market share (accounting for 30% of PC sales in China—which was 20% of global PC shipments as a country last year) and a favorable exposure to indirect distribution channels. Weaknesses include lack of tablet strategy, brand and scale.
Acer (52/100 – rank #5) – Middle of the road. We score Acer a close number five to Lenovo primarily owing to a lower score in emerging market position (4/10). In fact, we observe that Acer in fact supplies a strong product portfolio primarily through indirect sales channels despite lower than average scores in brand, scale and emerging market position.
Dell (45/100) – rank #9) – Struggling on many fronts. Dell in our view is ill positioned to gain share in the PC industry owing to weak scores in the core areas of tablet (the Streak 7 in our view is not competitive), distribution (the company is highly exposed to sell through direct channels) and emerging market position. This said, Dell has maintained a strong brand image and given the company supplies 12% of global PC demand—still has a valuable level of scale relative to the industry.
11
11
44
9922
33
55
Source: Company data, Gartner, Credit Suisse research

16 March 2011
IT Hardw
are 110
Figure 130: Tablet Scorecard and Key Tablet Product Launches (Including Expected Launches) from Major PC and Smartphone OEMs
Manufacturer Apple RIM Samsung Motorola Dell HP
ImageModel iPad WiFi PlayBook Galaxy Tab XOOM Streak 7 TouchPad
Announced Jan-10 Sep-10 Sep-10 Jan-11 Feb-11 Feb-11For Sale Jan-10 Early 2011 Nov-10 Feb-11 Feb-11 Summer 2011
Form factorDimensions (wxhxd) mm 189.7 x 242.8 x 13.4 130 x 193x 10 120.45 x 190.1 x 11.98 249.1x167.8x12.9 199.9 x 119.8 x 12.4 240 x 189 x 14Volume (cc) 617.2 250.9 274.3 539.2 297.0 635.0Weight (lbs) 1.6 0.88 0.8 1.6 1.0 1.6Display size (in) 9.7 7.0 7.0 10.1 7.0 9.7Resolut ion 1024 x 768 / 720p playback 1024 x 600/ 1080p playback 1024 x 600/ 1080p playback 1280 x 800 480 x 800 1024 x 768
Core internalsProcessor 1.0 GHz A4 1GHz Dual Core 1GHz ARM A8 1 GHz 2xCore NVIDIA Tegra 2 1 GHz 2xCore NVIDIA Tegra 2 1.2 GHz SnapdragonOperating sys tem iOS Tablet OS Android Android 3.0 Honeycomb Android webOS 3.0Memory 256MB 1GB 512MB 1GB 512MB 512MBStorage (flash) 16/32/64 GB 16GB/32GB 16GB/ 32GB 32 GB 16GB 16GB
FeaturesWireless technology GSM/UMTS/HSDPA Intend 3G/4G CDMA/HSDPA/GPRS 3G CDMA/ LTE upgradable GSM/UMTS/HSDPA Yes/ (3G expected)Camera No Yes Yes Yes Yes YesCamera megapixels NA 5MP/ 1080P HD video 3.1 + Flash /720p video 5.0 5MP NAFront-facing camera No 3MB 1.3MP Yes 1.3MP 1.3MPWi-Fi 802.11 a/b/g/n 802.11 a/b/g/n 802.11 b/g/n 802.11 b/g/n 802.11 b/g 802.11 b/g/nGPS Yes No Yes Yes Yes YesBluetooth 2.1 2.1 3.0 2.1 2.0 2.1Battery life (hrs) 10 NA 7 NA 4 NAHDMI out No MicroHDMI Via Dock (sold separately) Yes No NAUSB No MicroUSB No Yes 1 USB 2.0 NAApplication Store App Store App World Android Market Android Market Android Market TBD
Price 499/599/699 Est. ~$500 $599 ($399 w/ 2 yr agreement) $799 $449.99 NACarrier VZ/ S/ T/ TMO T-Mobile
Vendor scores and commentary:
Apple (10/10 – Rank #1). Apple’s iPad is the first tablet launch to see significant volume given i) a strong OS platform/ ecosystem, ii) aggressive pricing and iii) strong distribution.
Samsung (6/10 – Rank #2). Unlike other Android vendors, we rate Samsung higher given better carrier distribution and price. However, we think much is left to be desired in terms of better hardware and a tablet-version of Android.
HP (3/10 – Rank #3). While HP has yet to launch its first tablet (Summer 2011), we think the prospect for differentiation remains high using webOS. This said, we think the OS needs to see adoption/ a higher level of developer traction before rank the software/ services platform higher relative to iOS/ Android.
Virtual tie for all other vendors using Android/ Microsoft. Many vendors are experimenting with Android, which limits differentiation (we do rank Android OS highly). This said, hardware support for a tablet form factor from PC OEMs has been weak and carrier distribution for these vendors remains limited given prior focus on the traditional PC channels.
Tablet strategy Weight Apple Samsung HP ASUS Sony Dell Acer Toshiba Fujitsu Others Lenovo
Rank (weighted) 1 2 3 4 5 6 7 8 9 10 11Score (weighted) 10 6 5 4 4 4 4 3 3 3 3
Key MetricsOperating system 16.7% 10 7 5 6 7 6 6 6 6 7 6Product portfolio / hardware 16.7% 9 5 5 5 4 3 2 2 2 2 2Price 16.7% 10 5 4 4 2 2 3 3 3 2 3Carrier Distribution 16.7% 10 10 5 4 5 4 3 2 1 1 0Apps/ services (1) 16.7% 9 7 6 7 7 7 7 7 7 7 7Installed based (2) 16.7% 10 2 2 0 0 0 0 0 0 0 0
(1) Refers to avaliable content for download, developers support, and services(2) Refers to timing of launch (first-to-market), subsequent refreshes, and switching costs to ensure stickiness of customer
11
22
Android/Windows vendors share a competitive OS with a growing ecosystem
Source: Company data, Credit Suisse research

16 March 2011
IT Hardware 111
Tablets (30%)—Competitive and Supply Side Factors A key conclusion discussed in the above section titled ‘PCs disruption coming’ is that we expect tablets to have a significant impact on the PC market and value chain (capturing 42% of the industry’s value share by 2015) driven by i) mobility, ii) improving affordability, iii) effective distribution, iv) significant applications and v) supply side push. To assess who wins and loses in tablets longer term, we have employed a framework similar to that of the overall PC scorecard. Categories which we use to rank vendors include: i) operating system, ii) product portfolio/hardware, iii) price, iv) carrier distribution, v) apps/services and vi) installed base. When judging the key PC and smartphone vendors in the tablet category, we arrive at three main conclusions:
Supply Side Considerations
While we fundamentally believe that the end demand for tablets from a consumer demand perspective could remain robust, we equally believe that the opportunity has not gone unnoticed by many vendors (mentioned below) that come not only from the mobile device industry but also the traditional PC market. Before even discussing the strengths and weaknesses of each vendor in the tablet market, perhaps it is worth addressing the demand supply balance risks that could evolve. Here we would note several key points.
Significant launches by many vendors. Year to date, based on our proprietary tablet portfolio database, we believe that some 25 tablets have been launched by the leading ten PC or smartphone OEMs (of which have launched a tablet). Including all other vendors, we count a total of 59 tablet launches to date as shown in Figure 131.
Figure 131: We Count a Total of 59 Tablet Launches to Date (25 from Top Handset and PC OEMs) Vendor Tablets Vendor Tablets Vendor Tablets Acer 1 Fujitsu 1 NetBook Navigator 3 Aluratek 1 HP 2 Notion Ink 1 AOC 1 HTC 1 Open Peak 1 Apple 2 Huawei 1 Panasonic 3 Archos 1 Kno 1 Pandigital 1 Asus 4 Lenovo 3 Razer 1 Avaya 1 LG 1 RIM 4 Azpen 1 Motion Computing 1 Samsung 4 Cisco 1 Motorola 1 Toshiba 1 Dell 3 MSI 2 Velocity Micro 3 eFun Nextbook 3 NEC 1 Viliv 3
Total 59 Source: Company data, Credit Suisse research.
How will the tablet market play out? With such vibrant competition in the tablet market, we believe that clearly not everyone can win in terms of market share. In particular, the risk is that the tablet market will quickly commoditize unless vendors can differentiate in a significant way. We believe that vendors having a limited competitive edge will suffer from declining GMs and ASP pressure similar to the smartphone segment, whereas vendors with a differentiated platform and ecosystem can extract higher value over time.
Apple (10/10)—A Leadership Position, But How Long Will It Last?
While certainly not the first to launch a tablet device, in terms of consumer and corporate mindshare, we would argue that Apple’s iPad has been the first tablet device to make a significant impact in the market. The question now becomes the sustainability around the company’s unit share (which we estimate was ~85% last year). Longer term, while we estimate share will settle at ~50%, based on our tablet scorecard we think there remains a strong case to be made about Apple’s continued dominance in this product segment.

16 March 2011
IT Hardware 112
Operating systems lead. We believe that Apple has been able to effectively leverage the same OS for both the iPad and iPhone. As shown in Figure 132, while certain features for the iPad are missing such as multitasking, we believe that these are already being or will continue to be incorporated in future releases. However, we would highlight one advantage versus Microsoft based tablets is that the company has an optimized touch-screen experience. Clearly continued innovation here is necessary, however, we believe that rival platforms will take sometime to catch up.
Figure 132: Apple’s iOS Release Schedule Has Been Consistent and Continues to Bring New Features to Market Release Version Features Jun-07 1.0 i) Cover flow, ii) Visual voicemail, iii) Photos, iv) Calendar, v) SM Messaging, vi) Safari web browser, vii) Rich HTML
email, viii) Google Maps, ix) Widgets (Stock, Weather, Calculator, Calendar), x) Wi-Fi + EDGE Networking Sep-07 1.1 i) iTunes Wi-Fi Music store available, ii) Custom ring tones for $0.99, iii) Starbucks and Apple iTunes Wi-Fi iTunes
partnership, iv) Introduced iPod Touch, v) home button double-click shortcut, vi) support for TV out Dec-07 1.1.3 i) Google Maps "Locate Me", ii) Multiple SM Messaging, iii) Web Clips features, iv) Re-arrangeable widgets and icons, v)
Customizable homepages (up to nine), vi) Further content management support, vii) Software Development Kit (SDK), viii) Free for iPhone users, ix) $19.99 for iPod Touch
Jul-08 2.0 i) Support for Microsoft Exchange ActiveSync and Cisco IPsec VPN, ii) Push email functionality, iii) App Store, iv) Support for MobileMe, v) Multiple Calendar support, vi) Video orientation expanded, vii) YouTube plug-in for Safari
Sep-08 2.1 i) Genius playlist creation, ii) Improved iPod functionality, iii) Improved Podcast functionality, iv) Free for iPhone users, v) Free for iPod Touch users who upgraded to iPhone OS 2.0
Nov-08 2.2 i) Enhancements to Google Maps (Google Street View, Public transit and walking directions, Address display of dropped points, Share locations via email), ii) Several App Store changes, iii) Enhancements to Safari, iv) iTunes over EDGE and 3G, v) Improved iPod functionality
Jun-09 3.0 i) Cut, copy, and paste, ii) Multimedia messaging including pictures, audio, video files, iii) MobileMe offers "Find My iPhone" option, iv) Shake to shuffle during play in iPod, v) Apple push notification services, vi) Peer-to-peer connectivity, vii) Expanded search capabilities
Apr-10 3.2 i) Introduced with iPad, ii) support for landscape home screen, iii) 720p HD videos available in YouTube App, iv) iBook Jun-10 4.0 i) iPhone 4 with over 100 new features, ii) Multitasking, iii) folders, iv) retina display integration, v) mail - unified inbox &
threading, vi) enhanced camera and & photo apps (location) landscape mode, vii) deeper enterprise support, viii) iBooks, ix) UI customization, x) 5x digital zoom, xi) Bing
Sep-10 4.1 i) Game center, ii) TV show rentals ($0.99), iii) iTunes Ping, iv) HDR camera on iPhone 4, v) HD video uploads to YouTube & MobileMe on iPhone 4, vi) FaceTime calling from favorites
Nov-10 4.2 i) Mainly iPad update, ii) printing, iii) AirPlay (stream audio, video & photo over wifi), iv) Multitasking Mar-11 4.3 i) New Javascript engine for Safari, ii) Enhancements to AirPlay, iii) Personal hotspot support, iv) iTunes Home sharing
Source: Company data, Credit Suisse research
Priced for success. Unlike Apple’s strategy with the iPhone which was launched at a $600 ASP and delivered a gross margin of 50%-plus, with its iPad, the company decided for a much more aggressive price point ($499-829 at a GM of 37-42% at full ramp-up):
“…our potential competitors are having a tough time coming close to iPad's pricing even with their far smaller, far less expensive screens. The iPad incorporates everything we've learned about building high value products from iPhones, iPods and Macs. We create our own A4 chip, our own software, our own battery chemistry, our own enclosure, our own everything, and this results in an incredible product at a great price. The proof of this will be in the pricing of our competitors' products which will likely offer less for more.” […] “…we've priced, iPad pretty aggressively, so we're out to win this one.” – Steve Jobs, CEO, Apple
Vertically integrated. We believe that in the near term, Apple is advantaged in the tablet market versus peers given the company’s vertically integrated strategy; the A4 processor is designed in house and the iOS operating system is maintained in a closed environment. However, a counter argument can be made as to whether open systems and multiple vendors will prevail in the longer term (Android or Windows Phone 7 plus choice of chipset provider i.e., Qualcomm, Nvidia, Texas Instruments, Marvell etc.).
Leveraging the existing installed base. One key advantage of the iPad versus peer offerings is how it works with existing Apple products and services. For instance, a user can leverage existing iTunes content (i.e., music and select apps) and contacts on their iPad out of the box. We think further methods of synchronization, whether on Apple TV, iPods and new product categories, only enhances the utility of the iPad.

16 March 2011
IT Hardware 113
Carrier distribution. Given tablets are ultra portable devices that are increasingly selling with cellular data plans, we think distribution will naturally evolve toward the carrier channel. While many smartphone vendors (for example, RIM, Samsung and Motorola) are well positioned to take advantage of existing relationships, we show in Figure 133 that Apple has the widest distribution across the top 30 mobile operators globally in terms of subscriber base relative to other top 10 PC OEMs.
Figure 133: Top 10 PC OEM Carrier Distribution—Samsung and Apple Lead the Pack, Given Their Existing Mobile Businesses # Mobile operator Main Mkt Subs % of global Samsung Apple HP Sony ASUS Dell Acer Lenovo Toshiba Fujitsu
1 China Mobile China 564 11% X
2 Vodafone Europe 428 8% X X X X X
3 Telefonica/Movistar/O2 Europe 278 5% X X X X X
4 America Movil LatAm 215 4% X X X X
5 Bharti Airtel India 200 4% X
6 Telenor Norway 184 4% X X X X X
7 Orange France 182 4% X X X X
8 T-Mobile Europe 151 3% X X X X X
9 TeliaSonera Sweden 144 3% X X
10 China Unicom China 157 3% X
11 MTN Group S. Africa 137 3% X
12 Orascom Telecom Egypt 127 2% X X X X X
13 Etisalat UAE 100 2% X
14 Reliance India 111 2% X 15 MTS Russia 102 2% X X 16 Verizon USA 93 2% X X X X
17 AT&T USA 93 2% X X X X X X X
18 VimpelCom Russia 89 2% X X X X X X X
19 Telkomsel Indonesia 88 2% X X
20 Telecom Italia/ TIM Italy 72 1% X X X X X
21 Axiata Group Berhad Malaysia 67 1% X X X X X
22 Turkcell Turkey 62 1% X X X
23 Qtel Qatar 61 1%
24 Tata Teleservices India 73 1% X
25 Idea Celllar India 62 1%
26 BSNL India 61 1%
27 China Telecom China 75 1% X X
28 Vivo Brazil 57 1% X X X
29 NTT DoCoMo Japan 56 1% X X X
30 Maxis Communications Malaysia 55 1% X X X X
Top 30 global operators 4,144 81% 23 20 11 10 7 6 4 4 3 1
Source: Company data, Credit Suisse research
Applications from the get go. Apple enjoys touting the number of applications available for the iPhone at over 325,000 and as shown in Figure 134, Android is a not so distant second with over 200,000 apps. While the number of apps does not directly translate to a vendor’s advantage in terms of product success, we do think it has proven to be an important contributing factor. In fact, there are already ~65,000 apps available for the iPad alone, merely 8 months after launch.

16 March 2011
IT Hardware 114
Figure 134: Apple Leads Other Mobile OS in Terms of Application Ecosystem Momentum and Media Offering Feature/ Metric Apple Google Nokia RIM Microsoft Application content App Store Android Market Ovi Store App World Marketplace Number of apps >325,000 (65,000 iPad) >200,000 ~30,000 ~20,000 ~6,000 Book store iBookstore Amazon's Kindle X X X Music/ Video content iTunes Amazon MP3 Music Store 7digital Zune Marketplace Music catalogue size (mn) >13mn >12mn >9mn 9mn >6mn Movie catalogue size ('000s) >8.5 X X yes yes TV show catalogue size ('000s) >55 X X yes yes Developer community Number of downloads (mn) >10,000 >2,500 ~1,500 NA NA Revenue sharing with developers 70% 70% 70% 70% 70%
Source: Company data, Credit Suisse research
Android Vendors Collectively Will Win—However Which Will Prevail?
We count that Android is being shipped on ~65% of the total tablets selling or soon launching from the top 10 global PC OEMs. As a platform, Android has proven itself in the mobile landscape, now accounting for 31% of the world’s smartphone shipments in Q410. While we expect the platform to evolve quickly over the next year, we think it allows PC and smartphone vendors alike (without a proprietary OS solution) to design competitive products quickly. Longer term, however we question the level of value that each Android vendor will collectively attain given the OS essentially puts each hardware vendor on level ground.
Rapid OS innovation. As shown in Figure 135, Android has demonstrated strong progress over the last two and a half years on the mobile side, just recently evolving to embrace the tablet form factor with the announcement of Android 3.0 Honeycomb OS.
Figure 135: Android OS Has Shown Significant and Consistent Releases Since Its Debut in September 2008 Release date Version Features Sep 08-Feb 09 1.0/1.1 i) Maps adds details, ii) Support for saving attachments for MMS, iii) Support for marquee in layouts Apr-09 1.5 i) Satch/ record videos, ii) Upgraded soft keyboard/text prediction, iii) New widgets and folders for Home screen Sep-09 1.6 i) Improved Android Market, ii) Universal search, iii) Support for CDMA/EVDO, VPNs, text to speech, iv) Free turn
by turn Google navigation Oct-09 2.0/2.1 i) Optimized hardware speed, ii) Updated UI, iii) Improved maps, exchange integration, iv) Live wall papers May-10 2.2 i) USB tethering, ii) Flash 10.1, iii) Performance optimization, iv) Integration of Chrome's V8 JavaScript engine for
browser Dec-10 2.3/2.4 i) Revised UI design, ii) Support for larger screen, iii) New 3D game support Feb-10 3.0 i) Optimization for tablets, ii) 3D desktop with widgets, iii) Refined multi-tasking, iv) Browser enhancements i.e.
tabbed browsing Source: Company data, Credit Suisse research.
Applications—quickly growing. While Android remains a second to Apple’s App Store in terms of total apps offered as demonstrated in Figure 134 (Android at 200,000-plus versus Apple at 325,000-plus), the platform is quickly catching up.
Wider Google strategy will benefit the platform. While we think Google has little interest in becoming a hardware OEM, Android remains a key focus for the company to drive mobile search and hence display revenue in the future. In fact, Google’s strategy has now expanded beyond the PC and mobile phones to now include tablets and (potentially) TVs.
Android and the ecosystem. Discussing the prospect of every vendor that supports Android is beyond the scope of this report, and as such we only discuss key OEMs relevant to our scorecard below. This being said, it is important to recognize that collectively many smaller vendors are gaining relevance in both mobile and tablet markets by using Android, and these vendors too will influence the ultimate direction, scale and brand of the platform.

16 March 2011
IT Hardware 115
Samsung (6/10)—extending the Galaxy brand. So far the Galaxy Tab (see Figure 130 above for specifications) has already sold some 2mn units (end-January), which we think represents strong sales despite being only a 7” tablet and running the non-tablet optimized version of Android (Froyo v2.2). Ultimately, we think this lays testament to the strength of the company’s brand, scale and distribution. Given Samsung’s heritage in both mobile devices and PCs, we expect the company to become a major player in the tablet market longer term. Though Windows Phone 7 and a corresponding tablet version of the OS may be on the plate for later this year, we think Android will continue to be the dominant platform for the company. (It is unclear if the company will extend the Bada OS to support tablet form factors in the future depending on how viable the OS is on smartphones).
Motorola—one tablet so far, smaller form factors on the way. The XOOM is Motorola’s first Android 3.0 Honeycomb-based tablet launched last month with Verizon in the U.S. The tablet features 10.1" display, Nvidia Tegra 2 dual-core processor giving 2GHz of processing power, battery life which supports up to 10 hours of video playback and 32GB on board memory along with 1GB of RAM. The device also comes with both front facing and back facing cameras of 2MP and 5MP respectively along with support for Google Maps 5.0, access to over 3mn Google eBooks and Google Talk for video and voice chats. While the price point of $799 is significantly more expensive than the low-end WiFi only iPad at $499, we expect more affordable options from the company in the future at smaller screen sizes (7” tablets have already been discussed by management).
Dell (5/10)—two tablets so far, a 5” and 7” Streak. It appears that Dell is committed to launching tablets in the coming months based on Android given the company’s recent Streak launches (7” more recently announced at MWC). Given Dell’s heritage in PCs, we believe a modest market share in the corporate and consumer tablet markets long-term is not out of the question. This being said, it is difficult to assess success at this point given a few products and limited commentary from company management on its long term tablet strategy.
ASUS (4/10)—Android and Windows 7. At CES this year, ASUS announced the availability of four new tablet devices (Slider, Eee Pad Transformer, Eee Slate EP121 and Eee Pad MeMo), three are based on Android (2.2) and one on Windows 7. While we are impressed with the breadth in product form factor (each appears to serve a unique use case), we think the company may be fighting an uphill battle longer term given limited carrier distribution (currently), and potential difficulty in supporting the mobile supply chain (new chipset vendors, OS suppliers, etc) in addition to the company’s current PC suppliers.
HTC—only one tablet, but still in experimental phase. HTC has been relatively later than other Android smartphone vendors (like Motorola and Samsung) in joining the tablet bandwagon. However, the company announced its first tablet device called Flyer (7” tablet based on Android 2.4 Gingerbread) at MWC in February this year, which is expected to start shipping in Q211. With growing brand recognition and strong high-end smartphone distribution, we expect HTC to benefit from tablets long-term.
HP—A Shot at Differentiation with webOS
Following HP’s acquisition of Palm for $1.2bn in July 2010 (announced April 2010), the company has just recently announced its first tablet device, TouchPad, on webOS 3.0, which is expected to start shipping summer 2011. While much remains to be seen in terms of strategic direction for the platform and supporting hardware/integration with HP’s broad portfolio, we think this represents a good opportunity for the company to differentiate versus Android longer term. As shown in Figure 130, the TouchPad features high-end specs like a 1.2GHz Qualcomm Snapdragon processor, 9.7” screen and is expected to come in 16GB/32GB flavors.
RIM—How Much Potential Does the Playbook Have
RIM entered the tablet market with the Playbook device, first announced in September 2010, for a March 2011 launch. Initially, the company launched only the WiFi version but

16 March 2011
IT Hardware 116
recently at MWC, it also announced its plans to add other connectivity options like HSPA, LTE and WiMAX, which will be launched in second half of 2011.
QNX is a differentiated OS. While it is hard to imagine yet another mobile OS in an already crowed landscape, we think RIM’s QNX OS makes sense for the company as it is a significant improvement over the existing BlackBerry OS. Additionally, QNX brings improved functionality to the mobile environment in terms of real-time processing and ultra-low latency. In fact, the OS has traditionally been used in a variety of verticals—ranging from telcos and biomedical to automotive and gaming. Finally, we would note that QNX is a true multitasking OS, unlike peer offerings which tend to pause applications running in the background.
Vertically integrated. Similar to Apple, RIM is a vertically integrated company in terms of hardware and software control. With this said, RIM is relying on Texas Instruments to supply the application processor for the Playbook, which at this point has no disadvantage to peer tablets running on dual core 1GHz processors.
RIM's NOC based architecture could provide some benefits. Here management has argued that RIM’s proprietary Network Operations Center (NOC) could further differentiate the company’s products in the tablet market by providing compression and limiting the download of data from the server (given this is push technology) and thereby improving battery life. We think additional benefits from RIM’s NOC could stem from improved security and new opportunities in e-commerce.
Carrier distribution channel. While we do not include RIM in Figure 133 (given the company is not a top 10 PC OEM), we would note that we expect the company’s distribution to be similar to what is shown for Apple. Given our view that tablets will increasingly evolve toward being distributed vis-à-vis the carrier channel, we think previous mobile operator relationships RIM has established in the smartphone market will prove a valuable asset in the tablet market.
Apps strategy still in limbo. As demonstrated in Figure 134, RIM’s application strategy has failed to pique developers’ interest with only some 20,000 apps currently (versus Apple and Android at over 325,000 and 200,000 respectively). While it remains unclear what the company’s strategy will be in the tablet market, we think the QNX OS may provide an opportunity for the company to break its current trajectory.

16 March 2011
IT Hardw
are 117
Figure 136: Evolution of Distribution by Channel for PCs and Vendors’ share (2010) in Each Category % of global PC units % of distr ibution by channel in 2010
2005 2006 2007 2008 2009 2010 HP Acer Del l Lenovo Toshiba ASUS Apple Samsung Sony Fujitsu OthersIndirect distribut ion 68% 69% 71% 74% 78% 79% 14% 19% 16% 4% 11% 6% 6% 3% 4% 3% 2% 26%Direct dis tribution 32% 31% 29% 26% 22% 21% 1% 13% 1% 43% 6% 2% 1% 8% 1% 1% 1% 23%
Distr ibution by ChannelLocal Dealer 18% 18% 18% 17% 16% 17% 9% 17% 14% 2% 14% 5% 9% 4% 4% 1% 3% 28%Value-Added Reseller 13% 13% 13% 13% 11% 11% 7% 17% 10% 6% 13% 3% 3% 2% 1% 0% 3% 40%PC Store 10% 10% 10% 11% 11% 12% 15% 12% 14% 1% 11% 3% 6% 3% 4% 3% 0% 41%Direc t Salesforce 15% 15% 14% 12% 10% 9% -1% 14% 1% 41% 9% 2% 2% 7% 2% 0% 2% 20%Consumer Electronics Store 5% 6% 7% 8% 10% 10% 25% 19% 17% 9% 9% 18% 3% 4% 2% 4% 2% 13%Direc t Fax/Phone/Web 14% 12% 11% 10% 9% 9% 2% 14% 0% 59% 5% 1% 0% 10% 1% 1% 1% 7%General Merchandiser 6% 6% 7% 8% 9% 9% 20% 25% 35% 2% 1% 7% 9% 2% 9% 3% 0% 8%PC Supers tore 6% 7% 7% 7% 8% 7% 13% 19% 9% 0% 11% 5% 4% 4% 3% 6% 1% 38%Indirect Fax/Phone/Web 2% 2% 2% 3% 4% 4% 24% 19% 13% 6% 12% 3% 9% 2% 6% 2% 0% 28%Dealer Chain 3% 4% 4% 4% 3% 4% 13% 33% 13% 3% 13% 9% 7% 5% 1% 5% 3% 7%Direc t Retail 4% 4% 4% 4% 3% 3% 6% 9% 0% 0% 1% 4% 0% 4% 0% 1% 0% 81%Mass Merchant 2% 2% 2% 2% 3% 2% 12% 18% 19% 8% 7% 6% 5% 3% 2% 4% 5% 22%Remaining channels 1% 1% 1% 2% 3% 3% 38% 33% 20% 7% 9% 5% 12% 0% 6% 1% 2% 6%Total PCs 100% 100% 100% 100% 100% 100% 11% 18% 13% 12% 10% 5% 5% 4% 3% 2% 2% 26%
CAGR 05-10
ASUS (6/10): While ASUS has a favorable share in indirect distribution (6%) versus direct distribution (1%), overall the company’s low global market share (5%) suggests a potential opportunity to grow out further distribution.
Apple (5/10): Apple remains more exposed to direct channels (8% share) versus indirect (3%).
Sony, Fujitsu, Samsung (3/10): We rank these vendors a low 3/10 given global share of 2-3% and owing to a modestly better indirect share versus direct channel share.
Dell (2/10): While Dell has been making progress in moving away from a direct to consumer model, the company’s business remains highest levered to this segment (43% share) versus indirect (4%).
Others (2/10): Although in aggregate ‘Others’appears quite well positioned – if this is broken apart into the pieces each company contributes, we observe low overall shares in both indirect and direct channels.
11
1) Strong shift toward indirect channels. Over the last five years, the PC industry has made a strong shift toward indirect channels including i) PC Stores, ii) Consumer Electronics Stores and iii) Local Dealers to name a few. As of last year, Indirect PC units sales amounted to 278mn or ~80% of the global total 351mn units.
2) Scorecard methodology. To rate PC vendors in the category of distribution, we consider the relative position each has within indirect/ direct distribution. Then in each category we favor vendors with higher share in faster growing segments i.e. Consumer Electronics Store is the fastest growing Indirect channel with a 25% CAGR over the last five years.
HP (9/10): HP has the highest share in indirect distribution (19%), and versus the company’s exposure in direct distribution (13% share – given the sheer size of its PC business). HP appears to have well-balanced shares within each of the distribution channels.
Acer (9/10): Acer is nearly entirely levered to indirect forms of distribution (16% share) versus direct distribution (1% share). The company holds high shares (35%/ 17%) in each of the highest growing indirect channels: general merchandiser and consumer electronics stores respectively.
Toshiba (8/10): Despite only having a 5% global PC share, Toshiba has a favorable 6% share in the indirect distribution channels versus only 2% in direct channels.
Lenovo (8/10): Lenovo has a similar profile as Toshiba in terms of distribution, but has a slightly higher share in direct (6%). In terms of indirect distribution, the company does not appear to be levered to the higher growth segments.
Source: Gartner, Company data, Credit Suisse research.

16 March 2011
IT Hardware 118
Distribution (20%)—Exposure to Favorable Channels Given our view that PC volume (excluding tablets) will rise to 392mn/414mn units in 2012/2015, up from 351mn last year, we believe distribution and supply chain will remain a critical factor for vendor success in the industry. Here we expect that vendors having an extensive reach and a well organized strategy in terms of channel (indirect versus indirect) can reap multiple benefits. (For details on our rankings please see Figure 136.) We would note that a strong level of distribution affords vendors multiple benefits including the following.
■ Improved time to market. While this may seem obvious, taking too long in getting new products to the market is fraught with risks and may lead to disappointing sales.
■ Shelf space. Trust earned with retailers over the long term may lead to higher promotion for products, with price protection and minimal price volatility.
■ Increased penetration. We think the right channel partners may allow vendors to increase penetration in key/growing regions – for instance in emerging markets we think exposure to carrier channels may improve a vendor’s tablet sales/ positioning.
In order to actually measure these factors, we have looked at a combination of indirect channel distribution (favorable) versus direct distribution market share (less favorable) and carrier relationships (previously discussed in tablets section above, see Figure 133).
HP (9/10)—Broadest Reach and Most Favorable Exposure
Given HP’s global scale (see discussion in the below sections), it comes as no surprise that the company also executes well in terms of distribution. As seen in Figure 136, HP has a high indirect distribution share of 19%, which we think offsets a 13% share in direct distribution (keep in mind indirect channels account for some 5x the number of units as in the direct channel).
Acer (9/10)—Strong Exposure to the Indirect Channel
Acer ranks just as strongly as HP in our view given a strong indirect channel share (16%) with even higher shares in the faster growing categories of general merchandisers and consumer electronics stores within the indirect channel.
Apple (5/10)—Improving Distribution, But Unique Headwinds
Unlike all other vendors (except for Dell which we discuss below), Apple has a higher share of unit sales through direct versus indirect channels (8% versus 3%). This is largely owing to the company’s 10% market share in the ‘Direct Fax/Phone/Web’ and 7% market share in ‘Direct Salesforce’ which includes the company’s web store and retail locations. This said, this strategy continues to work well for the company versus the move away from this approach for other vendors in the industry.
Carrier channel advantage versus PC peers. As we have mentioned above in the tablet scorecard section above (Figure 133), Apple also has a strong position in the carrier channel by virtue of the company’s prior mobile relationships. While this is not yet a channel for distribution for traditional PCs, it cannot be ruled out longer term as devices become increasingly mobile and include cellular connectivity.
Dell (2/10)—Move Out of the Direct Model Still Under Way
What was once Dell’s strength, the direct to consumer model, might now be the company’s Achilles heel. While the company is transitioning away from this model, they have a 43% share in the direct channel versus 4% in the indirect channel and for this reason, we score the company lowest on our scorecard in terms of distribution.

16 March 2011
IT Hardw
are 119
Figure 137: Relevance of Emerging Markets Has Accelerated Over Past Five Years, with Lenovo, Asus, and Samsung Best Positioned to Gain Share
HP (5/10): While HP’s developed market share is much larger (22%) than the company’s emerging market share (14%) – equally the company remains well positioned in developing markets to gain further market share (with a share nearly as high as Lenovo at 15%).
Dell/ Acer (4/10): We think about Dell and Acer in a similar way to HP—each has a double digit share in each developing and developed markets, but favoring the mature countries.
Toshiba/ Sony/ Fujitsu: (3/10): These three companies each hold a sizably larger share in developed markets relative to developing markets, despite modest overall share.
Apple (2/10): Apple has the weakest emerging market position, likely owing to the company’s higher price point. Over time we see this as a potential issue for share gains longer-term as emerging markets gain more relevance.
% of global PC volumes 2010 market shares (%)2005 2006 2007 2008 2009 2010 HP Acer Dell Lenovo Toshiba ASUS Apple Samsung Sony Fujitsu Others
Developed regionsNA 30% 27% 25% 23% 24% 23% 5% 26% 12% 22% 5% 9% 3% 9% 1% 3% 0% 9%WE 22% 22% 21% 22% 21% 20% 8% 22% 23% 10% 5% 6% 8% 6% 5% 3% 2% 10%Asia Pac (developed) 13% 12% 11% 10% 10% 10% 6% 11% 8% 8% 6% 7% 4% 4% 7% 3% 9% 32%Subtotal 65% 61% 57% 56% 55% 53% 6% 22% 15% 15% 5% 7% 5% 7% 3% 3% 3% 14%
Developing regionsAsia Pac (developing) 17% 19% 21% 22% 26% 26% 20% 11% 7% 9% 22% 3% 5% 1% 2% 1% 0% 39%Latam 7% 8% 9% 9% 9% 9% 17% 19% 9% 8% 5% 3% 1% 1% 2% 2% 0% 50%CEE 7% 7% 8% 8% 6% 7% 11% 12% 17% 4% 7% 4% 13% 1% 7% 2% 1% 31%MEA 4% 5% 5% 5% 5% 5% 14% 21% 13% 14% 6% 7% 3% 1% 3% 1% 2% 30%Subtotal 35% 39% 43% 44% 45% 47% 17% 14% 10% 9% 15% 3% 5% 1% 3% 2% 0% 39%
Global 100% 100% 100% 100% 100% 100% 11% 18% 13% 12% 10% 5% 5% 4% 3% 2% 2% 26%
Global PC market CAGR 05-10
1) Emerging markets gaining momentum. PC demand in emerging markets has been increasing over the last five years at a CAGR of ~17% (versus a 6% CAGR for developed markets). As of last year, emerging market PC units (ex-tablets) of 166mn represented 47% of overall unit demand. We expect this trend to continue, with emerging markets comprising 66% of total global PC units (ex-tablets) by 2015.
2) Scorecard methodology. To rate PC vendors in the category of emerging markets, we consider the relative position each has within the developed markets and developing markets. Then in each category we favor vendors with higher share in faster growing segments i.e. Asia Pacific and Latin America.
Lenovo (10/10): Lenovo scores highest the best relative proportion of emerging market share (15%) to developed market share (5%). Furthermore, Lenovo remains highest exposed to the developing Asia Pacific countries, which are growing fastest among emerging regions.
Others (7/10): Given most other vendors are Asian-based manufacturers, this inherently lends itself to a favorable mix in terms of developing/ developed share (39%/ 14%). We don’t rate ‘Other’ as highly as Lenovo given it is an amalgamation of many PC vendors.
ASUS/ Samsung (6/10): Each ASUS and Samsung have balanced market share in both the developing and developed markets (5%/ 3% respectively). Aside from the aforementioned vendors, all other vendors have higher emerging market shares.
11
Source: Company data, Credit Suisse estimates

16 March 2011
IT Hardware 120
EM Position (15%)—Exposure to faster Growth Over the next five years, we expect PC shipments in emerging markets will grow at 18% compared to only 10% in developed regions (as shown in Figure 138). All this suggests that emerging markets will represent nearly 55% of global PC units (excluding tablets, this will be as high as 64% by 2015) and as such, we highlight this should represent a core focus for PC vendors looking to expand market share. Based on current regional market share data, which we detail in Figure 137, we reach the following conclusions for each of the vendors.
Figure 138: We Expect EM Units to Represent Nearly 60% of Total Volume Long Term, Up from 45% Last Year Units in mn 2002 2003 2004 2005 2006 2007 2008 2009 2010 2011E 2012E 2015E CAGR
2005-10 CAGR
2010-15EDeveloped market units 104 114 124 137 140 152 164 170 200 236 270 319 7.8% 9.8% Emerging market units 44 50 59 74 91 112 129 139 169 197 238 393 17.8% 18.5%
Global units 148 164 183 212 231 264 292 308 368 433 508 712 11.7% 14.1% % developed market 70% 69% 68% 65% 61% 57% 56% 55% 54% 54% 53% 45% % emerging market 30% 31% 32% 35% 39% 43% 44% 45% 46% 46% 47% 55%
Source: Gartner, Credit Suisse estimates
Lenovo (10/10)—Leader in Emerging Markets
Lenovo currently has a 10% global market share, but of this share the company leverages a high 15% emerging market share and only a 5% developed market share. Furthermore, Lenovo remains highest exposed to the developing Asia Pacific countries, which are growing fastest among emerging regions.
HP (5/10)—Strong EM Share, But Equally Highly Levered to the Developed Market
While HP does have a strong 14% emerging market share (second behind Lenovo), we would point out that the company still has a 22% share in developed markets. Furthermore, it may take time for the company to regain its footing in China (19% of global PC volume last year) following the company’s early-2009 hiccup (warranty not honored for faulty systems) and subsequent share loss as shown below in Figure 139.
Figure 139: Over Past Four Quarters, HP’s Market Share in China Has Nearly Halved, Primarily Benefitting Lenovo China market share, % Q109 Q209 Q309 Q409 Q110 Q210 Q310 Q410 Lenovo 22.6% 25.5% 24.5% 27.5% 23.6% 28.3% 26.9% 30.4% Hewlett-Packard 11.4% 12.6% 15.3% 11.7% 10.1% 7.9% 8.5% 6.9% Dell 6.7% 7.3% 7.2% 6.7% 7.9% 8.7% 9.2% 7.0% ASUS 4.5% 3.9% 6.1% 4.4% 6.2% 5.5% 6.9% 5.3% Founder Electronics 7.0% 6.6% 5.7% 6.3% 6.3% 7.0% 6.1% 4.9%
Top 5 vendors' share 52.3% 55.8% 58.7% 56.6% 54.0% 57.4% 57.6% 54.4% Source: Gartner, Credit Suisse research
Dell (4/10)—Developed Market Share Larger than Emerging Market Share
We believe Dell’s market share position by developed and emerging regions resembles that of HP, to only at a slightly lower level. For this reason, we give Dell a lower score than HP. (On the positive, Dell did not have similar issues to HP, but at the same time, the company’s share in China has not shown any meaningful growth over the last two years).
Apple (2/10)—Weak Emerging Market Position
While Apple is increasingly looking to introduce products like iPhone and iPad into emerging markets, the Mac business we think remains at a disadvantage given its high $1,000-plus price point. For this reason, Apple’s emerging market share is only 1% today, versus 7% in developed markets. Over time, we do not expect a radical shift in strategy with the Mac product line that would alter this allocation of share and for this reason, we score Apple lowest on our PC scorecard in the emerging markets category.

16 March 2011
IT Hardware 121
Brand (15%)—PC Industry Is No Exception One metric which has consistently proven itself as an important contributor to a company’s success across nearly all industries is brand, and the PC industry is no exception. To assess this metric, we have summarized the brand rankings of Millward Brown and Interbrand as shown in Figure 140 and Figure 141.
Figure 140: Millward Brown’s Brand Rankings Figure 141: Interbrand’s Brand Rankings
8
29
21
26
63
43
9
16 15
37
55
44
3 46
11
58
46
17
42
2 3
12
66
94
68
0
10
20
30
40
50
60
70
80
90
100
IBM Apple Hewlett-Packard Dell Sony Samsung
Mill
war
d B
row
n br
and
rank
ing
NA
2006
2007
2008
2009
2010
NA NA
2006
2007
2008
2009
2010
2006
2007
2008
2009
2010
2006
2007
2008
2009
2010
2006
2007
2008
2009
2010
2006
2007
2008
2009
2010
3
39
13
2526
20
3
33
12
31
21
2
24
12
32
19
2
20
11
35
19
2
17
10
41
34
19
25 25
29
0
5
10
15
20
25
30
35
40
45
IBM Apple Hewlett-Packard Dell Sony SamsungIn
terb
rand
bra
nd ra
nkin
g
2006
2007
2008
2009
2010
2006
2007
2008
2009
2010
2006
2007
2008
2009
2010
2006
2007
2008
2009
2010
2006
2007
2008
2009
2010
2006
2007
2008
2009
2010
Source: Millward Brown, Credit Suisse research Source: Interbrand, Credit Suisse research
Apple (10/10)—Synonymous With Quality?
Based partly on Apple’s wider product strategy, we note the company has consistently risen up the rankings for brand, now being regarded as the third highest ranked brand worldwide according to Millward Brown and seventeenth based on the Interbrand assessment. We believe this stems from a focused product strategy in most tiers where quality is emphasized over volume.
Figure 142: Brand Value as a Percentage of Market Cap Over the Past Five Years
45%
31%
17%
22%
29%
39%
0%
10%
20%
30%
40%
50%
60%
IBM Dell Hewlett-Packard Sony Apple Samsung
Mill
war
d B
row
n br
and
rank
ing
2006
2007
2008
2009
2010
2006
2007
2008
2009
2010
2006
2007
2008
2009
2010
2006
2007
2008
2009
2010
2006
2007
2008
2009
2010
2006
2007
2008
2009
2010
5Y AVG: 39%
5Y AVG: 35%
5Y AVG: 24% 5Y AVG: 27%
5Y AVG: 23%
5Y AVG: 17%
Source: Millward Brown, Credit Suisse research.

16 March 2011
IT Hardware 122
We believe it is this strategy combined with strong brand recognition which allows Apple to quickly address new market opportunities, like the tablet market with the iPad most recently. Furthermore, a strong brand has put Apple in a solid position to efficiently resolve product-related issues without significant consumer backlash—the most recent being iPhone 4’s antennae/reception troubles which surfaced in July 2010. Taking into consideration these factors, we have rated Apple 10/10.
HP (10/10)—Rising Up the Rankings
In-line with HP’s continuous PC market share gains in recent years, the company has also been improving its brand ranking in each Millward Brown (12th globally in 2010) and Interbrand (10th globally) over the past five years. Accordingly, the brand value now represents close to 31% of the company’s market cap, up from 20% only five years ago. We think that a strong global brand positions HP well to gain share as PCs continue to penetrate emerging markets. Last, we would note that given the company’s acquisition of Palm last year, we think this presents an enormous opportunity to leverage the company’s brand across new product segments like smartphone and eventually tablets that are based on its webOS platform.
Dell (7/10)—Significant Slip in Recent Years
Despite ranking in the mid-20s for global brand rankings in 2006, Dell’s ranking has fallen to 66th/41st place according to Millward Brown and Interbrand respectively as of 2010. We believe this deterioration in brand value reflects the company’s declining market share in the PC industry and the gradual erosion of the direct to consumer business model. Yet, despite ranking much lower versus history, it appears brand value (on average between Millward Brown and Interbrand) is a staggering 40% of the company’s market cap. All this said, Dell still ranks in the top 100 of global brands, which still represents significant value.
Scale and Supply Chain (10%)—Critical for Leverage In a commodity business like the traditional PC industry where levels of product and technology differentiation currently are limited, we believe that scale remains of critical importance delivering a few potential benefits:
Purchasing power. For key components, the ability to bulk purchase, achieve economies of scale and procure components at times of tightness in supply chain, all can become key competitive advantages in terms of time to market and cost within the industry.
Figure 143: Purchasing Power in Terms of COGS for the Top 10 PC OEMs US$ in millions, unless otherwise stated COGS Cost of assembly % of top 10 vendors Hewlett-Packard 68,886 59,242 23% Samsung Electronics (d) 54,219 46,628 18% Apple Computer 42,804 36,812 15% Dell 37,268 32,051 13% Lenovo 19,905 17,118 7% Toshiba (a) 17,934 15,423 6% Acer Group 17,379 14,946 6% Fujitsu (c ) 14,510 12,479 5% Sony (b) 12,596 10,833 4% ASUS 7,796 6,705 3% Source: Company data, Credit Suisse estimates
(a) Includes mobile communications, digital media network, and PCs/network segments (b) Includes PCs, networking, and digital imaging segments (c) Includes systems, network, PC and mobile segments (d) Includes handsets, networks, and PCs segments

16 March 2011
IT Hardware 123
R&D leverage. From an R&D perspective in both absolute terms and the ability to leverage across platforms and product sets, this can become a key competitive advantage within the PC supply chain.
Figure 144: Absolute R&D Spent Companywide for the Top 10 Global PC Vendors US$ in millions, unless otherwise stated 2006 2007 2008 2009 2010 Sony 4,507 4,607 5,230 5,035 4,623 Samsung 3,516 3,683 3,041 3,492 3,771 Toshiba 3,157 3,337 3,951 3,830 3,459 HP 3,591 3,611 3,543 2,819 2,959 Fujitsu 2,047 2,152 2,599 2,530 2,407 Apple 714 844 1,178 1,416 1,959 Lenovo 192 226 230 221 1,662 Acer 12 11 17 28 915 Dell 463 498 610 663 617 ASUS 237 281 439 465 511
Source: Company data, Credit Suisse research
While in our scorecard we rate each PC vendor on various success attributes, we think the category of scale should be measured across all vendors’ relevant product categories, not just for the product being discussed. Taking this into account, we would score the major PC vendors as follows.
Apple (10/10)—Focused Approach Around Component Reuse and Manufacturing
As shown previously in Figure 143, Apple products account for nearly 15% of all core hardware component purchases (of the top 10 PC OEMs) despite having a much lower share in all end markets. (Apple’s global PC and smartphone unit shares were 4%/16% last year).
Component re-use. As we demonstrate in Figure 145, one of Apple’s strengths is its ability to leverage a large number of similar components across its product range. In fact, the top 10 shared (value-based) components amount to some 38%/49% of the total BOM of each the iPad (3G + WiFi 16GB) and iPhone 4 (32GB), respectively. We think this approach to the industry is unique and also allows for the scale effect for Apple to be magnified—for instance, when Apple is placing orders for an Infineon chip, the company’s entire product line can be leveraged to bring total cost down. Last, paring down the total number of unique components provides a level of efficiency in working with particular products and suppliers, which is not necessarily the case across the industry.
Strategic sourcing. Last, it is important to mention Apple’s forward thinking when it comes to product portfolio and component needs. During the company’s F1Q11 conference call, COO Tim Cook spoke about the agreement Apple had made with a number of NAND flash suppliers in 2005.
“On the operational side of the house, as you probably remember, we have historically entered into certain agreements with different people to secure supply and other benefits. And the largest one in the recent past has been -- we signed a deal with several Flash suppliers back at the end of 2005 that totaled over $1 billion. Because we anticipated that Flash would become increasingly important across our entire product line, and increasingly important to the industry, and so we wanted a secure supply for the Company. […] And we constantly look for more of these. So in the past several quarters we have identified another area and come to some recent agreements that Peter talked about in his opening comments. – Tim Cook, Apple, COO

16 March 2011
IT Hardw
are 124
Figure 145: Apple Designs Products With Significant Component Overlap, Which Advantages Purchasing and Supply Chain Efficiencies
Functional Area 3G + WIFI 16 GB iPad Total Cost 32 GB iPhone 4 32 Total Cost1) Touch Screen Module Capacitive Touchscreen Module $28.50 Capacitive Touchscreen w/ Flex $8.152) NAND memory (a) Multichip Memory - 8 GB MLC NAND Flash x2 $23.32 Multi-Chip Memory - 32 GB MLC NAND Flash $46.643) ARM Applications Processor (b) ARM Applications Processor $16.30 ARM Applications Processor $16.004) Baseband processor (c) Digital Baseband Processor $14.25 GSM / W-CDMA Baseband $9.945) Mobile DDR SDRAM (a, e) Multi-chip Memory - 256 MB DDR SDRAM (a) $5.06 Multi-Chip Memory - 512 MB DDR SDRAM (e) $7.866) WiFi/Bluetooth Board (d) WiFi/Bluetooth Module - IC.63 $4.11 WiFi/Bluetooth Module - IC.63 $4.117) Touchscreen controller (d) Touchscreen Controller $3.97 Touchscreen Controller $1.308) UMTS transceiver (c) UMTS Transceiver $2.69 GSM / W-CDMA Transceiver $2.919) Single-Chip A-GPS Single-Chip A-GPS $1.47 Single-Chip A-GPS $1.4410) 3G Power mangement (c, f) Power Management (c) $1.33 Power Management (f) $1.62Sub-total (top 10 component costs) $101.00 $99.97Total device cost $266.76 $202.18% of BOM shared by iPad and iPhone 4 38% 49%Source: PortelligentSupplier note: a) Samsung b) Apple / Samsung, c) Infineon, d) Broadcom, e) Elpida, f) Dialog Semiconductor
Apple drives purchasing power through the sharing of key components across products. The 32 GB iPhone 4 is made up of 992 components compared to the 16 GB. iPad 3G + WIFI with 1,609 components, with the majority being discrete components. Nevertheless, the iPhone 4 and iPad 3G + WIFI share ten key components/suppliers including the ARM processor (from Apple/Samsung), NAND memory (from Samsung), Baseband processor (from Infineon), WIFI/Bluetooth board (by Broadcom) and touchscreen model etc.
Combined, these top 10 shared components account for 38%/49% of the BOM for the iPad 3G + WIFI/ iPhone 4 respectively.
aa
aabb
bb
cc
cc
dd
dd
iPad 3G + WiFi iPhone 4
Source: Portelligent, Credit Suisse research.

16 March 2011
IT Hardware 125
HP (8/10)—Largest Scale Across All Vendors
Whether it is owing to HP’s leading 18% market share in the PC industry, or more importantly from a purchasing power perspective, the company has material advantages from its scale. In fact, as shown in Figure 143 that HP COGS accounts for as much as 23% of the market for major components (of the top 10 global PC OEMs).
Samsung (8/10)—Product Lines Similar to Those of Apple
Given Samsung’s wide product breadth in the consumer electronics market, it comes as no surprise that the company accounts for nearly 18% of core components purchased (of the top 10 PC OEMs), second after HP. As the smartphone and tablet markets continue to expand and gain more relevance in the global consumer electronic market, Samsung also appears well positioned to gain further purchasing scale and efficiencies. Last, we would note that Samsung is in unique position to potentially grow scale faster than competitors given the company manufactures its own processor (Hummingbird), memory modules and LCD technologies (to name a few) which are also sold to its peers.
Dell (7/10)—Highly Levered to PCs, New Markets May Help Build Scale
Dell is among the top five PC vendors with a market share of 12%, and we estimate the vendor accounts for some 13% of core electronic components (shown in Figure 143, of the top 10 PC OEMs). While the company has clearly begun inroads in the smartphone market (with the Streak device) and tablet market (with larger versions of the Streak), we think any scale the company gains as they expand into these new product categories will be gradual.

16 March 2011
IT Hardw
are 126
Figure 146: PC Product Portfolio Database for Netbooks and Notebooks
OS Price range ($)Win 7 Win Vista Win XP Linux <$300 $300-$500 >$500 NA
Acer 7 10.3 2.9 1.0 5.1 0% 86% 0% 14% 0% 1.53 1.1 224 340 14% 71% 0% 14% 100% 100% 14% 0%Asus 60 9.9 3.6 1.0 5.7 5% 52% 0% 43% 5% 1.38 1.1 149 406 10% 22% 8% 60% 88% 98% 65% 0%Dell 2 10.1 3.0 1.3 9.5 0% 50% 0% 50% 0% 1.64 1.0 205 315 50% 50% 0% 0% 100% 100% 0% 0%Fujitsu 2 7.9 2.0 1.5 5.8 50% 100% 0% 0% 0% 1.63 1.5 140 649 0% 50% 50% 0% 100% 100% 100% 0%HP 3 10.6 2.9 1.0 6.4 0% 33% 0% 67% 0% 1.67 1.3 190 353 33% 67% 0% 0% 100% 100% 0% 0%Lenovo 5 10.9 2.8 1.1 6.0 20% 80% 0% 20% 0% 1.61 1.6 260 447 0% 80% 20% 0% 100% 100% 40% 20%Samsung 4 10.1 2.9 1.0 14.0 0% 100% 0% 0% 0% 1.66 1.0 250 390 0% 100% 0% 0% 100% 25% 50% 0%Sony 2 6.3 1.2 1.0 4.0 50% 50% 0% 50% 0% 1.60 1.3 140 900 0% 0% 50% 50% 50% 100% 100% 0%Toshiba 2 10.1 2.9 1.0 9.0 0% 100% 0% 0% 0% 1.66 1.5 250 400 0% 100% 0% 0% 100% 100% 0% 0%Total 87 9.6 2.7 1.1 7.3 7% 60% 0% 37% 3% 1.60 1.3 201 467 10% 37% 9% 44% 91% 95% 55% 1%
OS Price range ($)Win 7 Win Vista Win XP Mac <$500 $500-$800 >$800 + NA
Acer 27 14.9 5.5 1.1 4.8 0% 100% 0% 0% 0% 2.1 3.4 354 680 26% 52% 22% 0% 100% 100% 44% 0%Apple 6 13.9 4.4 0.7 7.2 0% 0% 0% 0% 100% 2.0 3.0 335 1,466 0% 0% 100% 0% 100% 100% 100% 0%Asus 103 15.2 5.9 1.2 5.6 0% 82% 17% 0% 0% 1.9 4.0 317 1,078 1% 6% 22% 71% 97% 99% 46% 0%Dell 16 13.9 5.0 1.1 4.8 13% 94% 0% 0% 0% 2.1 3.1 565 676 56% 13% 31% 0% 81% 100% 75% 19%Fujitsu 15 13.4 4.5 1.4 5.5 27% 100% 0% 0% 0% 2.2 3.1 277 1,268 0% 20% 80% 0% 100% 100% 93% 13%HP 19 15.2 5.6 1.2 5.0 5% 100% 0% 0% 0% 2.0 3.6 384 720 37% 32% 32% 0% 68% 100% 21% 0%Lenovo 32 14.3 4.8 9.9 4.6 6% 94% 6% 0% 0% 2.1 3.8 363 835 13% 59% 28% 0% 91% 94% 59% 3%Samsung 18 15.3 5.4 1.2 6.0 0% 100% 0% 0% 0% 2.3 4.3 523 820 0% 39% 33% 28% 100% 100% 44% 28%Sony 5 15.3 5.8 1.1 3.9 0% 100% 0% 0% 0% 2.1 8.0 528 808 0% 60% 40% 0% 100% 100% 100% 0%Toshiba 17 15.1 5.0 1.4 5.0 6% 82% 0% 18% 0% 2.1 3.6 376 805 18% 41% 41% 0% 100% 100% 71% 0%Total 258 14.6 5.2 2.0 5.2 4% 88% 8% 1% 2% 2.1 4.0 402 916 12% 26% 32% 30% 94% 99% 54% 4%
Total Screen size(inches)
Weight(lbs)
Camera(in MP) Bluetooth
Netbooks
Thickness(inches) TouchNotebooks CPU
(in GHz)
Total Screen size(inches)
Weight(lbs)
Thickness(inches)
Price(in US$)
Price(in US$)
Avg. RAM (in GB)
Avg. HDD (in GB)TouchBattery
(hrs)
Battery(hrs) Wi-Fi
CPU(in GHz) Cellular
Cellular
Camera(in MP) Wi-Fi Bluetooth
Avg. RAM (in GB)
Avg. HDD (in GB)
Netbooks:
1) Total. Asus has the largest current portfolio (60 total) of netbooks versus peers, while Fujitsu, Dell and Sony have the least product breadth.
2) Operating system. While the majority (60%) of netbooks today run Windows 7 OS (Fujitsu, Samsung and Toshiba all at 100% of their portfolios), Windows XP is still heavily used (42% of netbooks) by vendors like Asus, Dell, HP and Lenovo.
3) CPU/ Avg. RAM (config). Most netbook configurations fall in the 1.5-2GHz range for processor clock speed with between 1-1.5 GB of RAM. Sony and Fujitsu tend to have the higher-end configs, with Asus having a high proportion at the low-end of the market.
Price. Sony and Fujitsu appear to be addressing the high-end with most other vendors comparable in average netbook price between ~$300-$400.
Notebooks:
5) Total. Asus (103), Acer (27) and Lenovo (32) offer the highest number of products, whereas Apple (6) and Sony (5) have the least number of product SKUs.
6) Operating system. Compared to netbooks (lower-end config), nearly all Notebooks are now sold with Window 7, with the exception of Apple.
7) CPU/ Avg. RAM (config). Most netbook configurations fall in a tight 2-2.3GHz range for processor clock speed, but in terms of RAM Sony packs 8GB, compared with Apple (stock) and Fujitsu offering the least amount. (The same applies for hard drive size offered—Apple and Fujitsu offer the least amount of storage, compared with Dell and Sony at the high-end of the various portfolios).
8) Price. Acer, Asus, Dell, HP and Toshiba are most widely represented across different pricing tiers, with Apple, Fujitsu and Asus averaging ASPs >$1,000.
11 22 33 44
55 66 77 88
Source: Company data, Credit Suisse research

16 March 2011
IT Hardware 127
Product Portfolio (10%)—Balanced Portfolio Is Key In a PC market which is constantly changing, we believe a well balanced and diversified product portfolio offers a vendor a strong means of differentiation. For this reason, we do not think a one-size-fits-all approach works, but rather one which works across many form factors, product types, specifications and price points. Based on our PC product portfolio database shown in Figure 146, we attempt to take these factors into consideration, among others, as shown below in our PC scorecard. As such, we score the vendors as follows.
ASUS (8/10)—wide variety of product SKUs. We observe that ASUS has among the highest number of product SKUs each in the notebook (103 products) and netbook (87 products) categories. In fact, this allows the company to leverage higher scores on most other categories in our scorecard based on this product breadth, an example being price point. One area where ASUS tends to score lower is in core specs, including weight, battery life and CPU.
Acer (8/10)—similar to ASUS product portfolio. While the Acer product portfolio is not as extensive as that of ASUS, the company tends to score higher in the product spec categories for each notebook and netbook, in particular CPU.
HP (8/10)—robust portfolio for largest PC vendor. We noticed that while the total of HP’s product SKUs number is much less than ASUS and Acer, the company still is able to design a portfolio of devices which appear average across most metrics including weight, battery life, touch-enabled and OS. It is worth noting that in the notebook category HP’s 19 products are equally spread across the major price tiers, which we think is a product of the company’s diversified distribution (to both developed and emerging regions).
Dell (7/10)—middle of the road. We find of the top 10 global PC OEMs, Dell offers the fewest products to choose from (16 notebooks and 2 netbooks). While we think this may be a function of the company’s high global commercial share (see Figure 147) relative to consumer share. However, longer term, if the company looks to increase penetration in the emerging markets, we think a broader array in the portfolio is necessary.
Figure 147: Dell’s Share in the Commercial Market Is Twice that of Consumer in 2010 2006 2007 2008 2009 2010 Dell consumer market share, % 11.3% 8.3% 8.7% 8.4% 7.8% Dell commercial market share, % 18.5% 17.7% 17.9% 15.5% 16.1%
Source: Gartner, Company data, Credit Suisse research
Apple (4/10)—targeted strategy continues for now. Similar to nearly all of the company’s product lines, Apple adopted a relatively focused approach to the Mac business in terms of total number of product SKUs and the range of specifications among these devices. Furthermore, we would note that Apple does not compete in the netbook market, and instead offers a $1,000-plus alternative (in the notebook market) called MacBook Air. For these reasons, we tend to score Apple higher in the categories of weight and battery life, but lower in terms of screen size and price point.

16 March 2011
IT Hardware 128
Smartphone Growth to Continue It is no secret that smartphone adoption will continue to increase at the global level and drive robust volume growth for the industry. This, in our view, is driven by a combination of factors like carrier push, handset and chipset vendors driving smartphones to lower price points, and increasing consumer demand pull. We believe that most of the long-term forecasts for smartphone volumes are based on an estimate of smartphones increasing as a percentage of overall mobile handset market. However, given that smartphones continue to be significantly more expensive than a low-end device, we believe that any long-term forecast has to be based on linking the income distribution and total cost of ownership to device affordability. As such, we have used our proprietary analysis to look at the smartphone market based on three different approaches.
■ First, we have looked at the smartphone market from the perspective of affordability, taking in to account the total cost of ownership of device which is often overlooked.
■ Second, we have looked at the smartphone market opportunity by looking at how smartphones could cannibalize adjacent consumer electronics markets.
■ Third, we have analyzed the overall mobile phone market by price bands to determine the price tiers that smartphones can realistically target over the next five years. This approach relies heavily on our proprietary bill of materials (BOM) analysis.
Affordability/TCO approach supports a long-term addressable market of 2bn for smartphones. Based on our proprietary model that takes into account the total cost of ownership (TCO) for a smartphone, income distribution, and penetration of the addressable market, we conclude that the addressable market for smartphones could be as high as 1.96bn longer term. We define TCO as the upfront cost that a consumer pays for a smartphone combined with the annual service cost for a basic voice and data plan associated with that device. Our smartphone model suggests that by 2015, the global smartphone subscriber base will reach 1.92bn, i.e., 98% of the 1.96bn addressable market. Based on this long-term estimate, we believe that smartphone volumes will grow from 297mn in 2010 to 594mn/1.04bn in 2012/2015, implying a CAGR of 28.5% over the next five years.
Cannibalization of several markets simultaneously. Recognizing that the TCO approach is only one way to model the smartphone market, we have sanity checked our estimates by also looking at the incremental opportunity arising from smartphones cannibalizing other consumer electronic devices such as portable media players, PNDs, digital still cameras, portable gaming devices and midend phones. We conclude that cannibalization of these segments supports a smartphone volume estimate of 988mn longer term, which suggests that our 2015 estimate of 1.04bn units based on affordability is achievable.
BOM extrapolation and price point penetration analysis also suggests 1.04bn smartphone units by 2015. The third and final approach we have considered involves analysis of smartphone price declines over the next five years and evaluates how quickly smartphones could penetrate lower price tiers. Indeed, based on a teardown of the 5800 XpressMusic from Nokia, which we would define as a lower end smartphone, we conclude that through improvements in chipset efficiency and scale, the ASP of this device could fall to as low as $112 by 2015 compared to $300 in 2009. All this while still keeping the core functionality of the device intact. This, in turn, leads us to believe that penetration of lower price points could conceivably result in the smartphone market growing to 1.04bn units by 2015, which is in-line with our current estimate based on affordability analysis.

16 March 2011
IT Hardware 129
Figure 148: Smartphone Market—Long-Term Forecast Based on Three Different Methodologies Analysis Methodology Result Implication Total Cost of Ownership
Proprietary Credit Suisse model that forecasts the smartphone market using the TCO (total cost of ownership) of a smartphone, income distribution and penetration of the addressable market
1.96bn addressable market for smartphones by 2015, up from 0.7bn/0.9bn in 2009/2010
By 2015, we estimate 1.96bn people to be potential smartphone subscribers, and we are currently assuming 1.92bn smartphone subscribers, which imply about 98% of the addressable market. Hence, we believe our smartphone subscriber estimates are achievable
Cannibalization of CE devices
Forecasting smartphone market based on incremental opportunity to cannibalize other consumer electronic devices such as MP3 players, gaming consoles, PNDs, cameras and mid-end phones
988mn smartphone units in 2015 based on smartphones cannibalizing other CE device segments
Our 1.04bn estimate for smartphone volumes by 2015 looks achievable as can also be seen from our cannibalization work which suggests that smartphone volumes could be as high as 988mn
BOM reduction and price band analyses
Looking at smartphone market based on bill-of-materials reduction for a mid-end smartphone and how quickly smartphones could penetrate lower price tiers
1.04bn smartphone units in 2015 based on the BOM reduction and price band analyses
The 1.04bn smartphone unit number by 2015 is again inline with our published volume forecast based on TCO and affordability analysis
Source: Credit Suisse research
TCO versus Cost at the Point of Purchase Debate We believe that one of the key determinants in trying to estimate the size of the smartphone market longer term is affordability. To determine the affordability issue, we have looked at the total cost of ownership (TCO), which is the cost of smartphone device along with a voice/data tariff plan. As handset purchases have different dynamics in developed and developing markets given carrier subsidies allocated towards handsets, we have looked at the following definitions.
■ Factory ASP of the device. This is simply the price from the mobile device vendor to either the retail or carrier channel. Clearly a lower price here can have the impact of directly stimulating a lower upfront price for the consumer especially if the consumer wants to purchase the device without a contract.
■ Subsidized ASP of the device. This concept is primarily applicable in Western Europe, North America, Latin America, and in a few markets in Asia. Mobile carriers buy the device from the handset vendors and then offer a device subsidy in order to entice the customer into a monthly contract. This makes the effective price of the device (at the point of purchase) significantly lower than the factory ASP, as shown in Figure 149 and Figure 150. This method will stimulate demand, and especially in the case of high-end devices.
Figure 149: Subsidized and Unsubsidized ASPs in NA in US$, unless otherwise stated
Figure 150: Subsidized and Unsubsidized ASPs in WE in US$, unless otherwise stated
367 376364
345 343333
406 400 401 404424
411399 408
210 215
247228
217
170 172 169154 160
148135 144 139
$0
$50
$100
$150
$200
$250
$300
$350
$400
$450
Q107 Q207 Q307 Q407 Q108 Q208 Q308 Q408 Q109 Q209 Q309 Q409 Q110 Q210
ASP
in U
S$
Unsubsidised NA Smartphone ASP ($) Subsidised NA Smartphone ASP ($)
338
364
339
314 312 318
363378
355 355373
362382
372
257 262 253 246236 232
253 258244
231 239 237218
202
$0
$50
$100
$150
$200
$250
$300
$350
$400
$450
Q107 Q207 Q307 Q407 Q108 Q208 Q308 Q408 Q109 Q209 Q309 Q409 Q110 Q210
ASP
in U
S$
Unsubsidised WE Smartphone ASP ($) Subsidised WE Smartphone ASP ($)
Source: Company data, Credit Suisse estimates Source: Company data, Credit Suisse estimates
■ TCO—total cost of ownership. We define this as the annualized level of total cost that a consumer pays in the first year of any smartphone purchase equivalent to 12 months

16 March 2011
IT Hardware 130
ARPU (for a basic voice and data plan) plus the upfront cost of the device (if not fully subsidized or in case of no subsidies). While we believe that the price at the point of purchase will have an impact on smartphone adoption, we increasingly note that service offerings (such as a data service) are becoming a pivotal part of a consumer’s decision making process. For this reason, we believe that any analysis on the cost of a smartphone must take into account the total cost borne by the consumer, which, in addition to the price of the device, should also include the annual cost of services.
Approach 1—Forecasting Smartphones on TCO As discussed above, we fundamentally believe that any forecast of the smartphone market needs to have at its core the affordability and total cost of ownership (TCO) of smartphones. Given subsidies in developed markets, handsets are primarily bundled with a service package which tends to mask the true cost of the device. While we acknowledge that aggressive promotions can have a significant impact on the volume ramp-up of a given product, we still believe that the TCO remains crucial for the penetration of the overall market. To arrive at our TCO estimates, we have made several important assumptions, as are detailed in Figure 151.
■ Smartphone ASPs decline by some $150 by 2015. In Figure 155, we show that smartphone bill-of-materials can drop by around $85 over the period 2009-2015 (from $165 in 2009 to $82 in 2015) as chipset efficiency improves and component pricing declines. This will have drive down the ASP of a mid-end smartphone from around $250 in 2009 to $112 by 2015.
■ Normal levels of ARPU decline. We have assumed annual ARPU pressure of 6% in all markets (globally) to take into account pricing pressure at mobile operators.
■ Smartphone affordability threshold in each region. Based on Figure 156 and Figure 157, we arrive at smartphone affordability threshold in each region by looking at mobile telecoms as a percentage of GDP in each of the regions. As such, we have used a smartphone affordability threshold level of 1.35% in Western Europe, 1.3% in North America, 2.2% in Central/Eastern Europe and Asia-Pacific, 2.35% in Latin America and 3.8% in Africa.
Based on these core assumptions, we conclude that nearly 2bn people will be able to afford a smartphone by 2015, more than doubling from our estimated addressable base of 885mn people in 2010. We discuss each of our assumptions in detail in the following sections.

16 March 2011
IT Hardw
are 131
Figure 151: Smartphone TCO Analysis—Addressable Market for Smartphones Can Grow from Around 900mn to 2bn by 2015 Driven by Falling TCO Total cost of ownership is US$ and addressable population in millions
2010E 2015E % CAGR 2010E 2015E 2010E 2015E Additional population 2010E 2015E
Developed countriesNorth America
United States 720 378 -12.1% 56 26 102 230 128 33% 71%Canada 481 205 -15.6% 37 14 18 33 15 53% 91%
Western EuropeFrance 433 171 -17.0% 32 12 45 64 19 72% 100%Germany 517 202 -17.1% 38 15 54 77 23 66% 95%Italy 708 392 -11.1% 52 28 14 39 25 23% 63%Spain 320 235 -6.0% 24 17 29 38 10 63% 83%United Kingdom 378 278 -6.0% 28 20 38 52 14 61% 81%Rest of WE 412 196 -13.8% 30 14 63 91 28 66% 94%
Other developedAustralia 227 166 -6.0% 10 7 21 24 3 93% 100%Hong Kong 412 154 -17.9% 19 6 5 7 2 72% 100%Japan 412 154 -17.9% 24 10 127 126 -1 100% 100%Singapore 412 154 -17.9% 19 6 4 6 1 83% 100%South Korea 412 154 -17.9% 19 6 27 47 20 56% 95%Taiwan 412 154 -17.9% 19 6 13 23 10 56% 95%
Total developed countries 476 248 -12.2% 33 17 561 858 297 57% 85%
Emerging countriesChina 287 180 -8.9% 13 8 143 410 267 11% 30%India 179 101 -10.9% 5 3 18 193 175 1% 15%Indonesia 304 188 -9.1% 14 8 1 27 26 0% 11%Brazil 615 420 -7.3% 26 21 20 30 10 10% 15%Pakistan 234 141 -9.7% 11 6 0 1 1 0% 0%Nigeria 517 349 -7.6% 14 9 0 0 0 0% 0%Bangladesh 201 117 -10.3% 9 5 0 0 0 0% 0%Russia 526 338 -8.5% 24 20 15 35 20 11% 26%Mexico 515 347 -7.6% 22 17 11 24 13 10% 21%Philippines 345 222 -8.4% 16 9 0 1 1 0% 1%Egypt 339 213 -8.9% 9 5 2 11 9 3% 13%Turkey 433 276 -8.6% 18 13 8 24 16 12% 31%Thailand 276 145 -12.1% 12 6 7 18 11 11% 26%Other emerging 491 311 -8.7% 20 13 99 329 230 6% 18%Total emerging countries 386 222 -10.5% 16 10 324 1,103 779 6% 18%
Global Total 443 234 -12.0% 27 13 885 1,960 1,076 13% 28%
Addressable population, mn
Country
% of Total population Total cost of ownership Income cutoff level,
US$ (000s)
11
22
22
33
1) We expect the TCO for a
smartphone to decline by $209
or 12% per year over the next 5
years to $234 (from $443 in
2010). This decline will be driven
by:
1) $150 reduction in
smartphone ASP from
2010 to 2015
2) 6% annual reduction in
ARPU in all regions
2) Our affordability work shows that
an additional 300mn people will
be able to afford a smartphone in
developed markets and another
780mn in developing markets by
2015. The top three countries
with the largest absolute
addressable population growth
will be China, US and India.
3) Around 2bn people will be
able to afford a smartphone
by 2015, more than doubling
the current addressable
population base of 885mn.
Source: Company data, IMF, Credit Suisse estimates

16 March 2011
IT Hardware 132
TCO in the first year is $445 on average. We analyzed the TCO for a low-end smartphone by vendor and for 19 countries as listed in Figure 153. This demonstrates that the ownership cost for smartphones falls in a wide range. We believe this is owing to a number of factors such as the stage of the smartphone market in terms of nascence, competitive dynamics, and device positioning by vendor. We also note that our analysis is based on the TCO at the lower end of the market, as we believe this subsegment of the overall market will be key to driving adoption long term. In particular, we have looked at the lowest consistent level of cost faced by a consumer by isolating comparable terminals and minimum levels of data usage. We note that the TCO varies significantly in subsidized versus unsubsidized markets, with the cost ranging from $179 to $720 with an average of around $450. Extrapolating these TCO results to other countries and regions and accounting for similarity of carrier/vendor dynamics, we estimate that the average global TCO is currently around $445.
Subsidies result in different components of TCO. In heavily subsidized markets like North America and Western Europe, as seen in Figure 152, there is very little upfront cost at the low-end of the smartphone market. In developing regions, however, the upfront cost of the device can represent a significant proportion of the TCO.
Figure 152: TCO for a Low-End Smartphone—TCO Composition Varies Significantly by Region US$, unless otherwise stated
150
150
0
150
150
168
0
173
150
0
13
7
10
150
150
234
150
84
0
29
51
227
84
137
136
320
166
195
378
420
471
471
365
367
292
465
624
720
0 100 200 300 400 500 600 700 800
India
Bangladesh
Australia
Pakistan
China
Indonesia
Spain
Egypt
Philippines
UK
France
Germany
Canada
Mexico
Nigeria
Russia
Brazil
Italy
United States
Low-end smartphone TCO in 2010 (US$)
Upfront Device ASP (US$) One year ARPU (US$)
Source: Company data, Credit Suisse research
Forecasting the TCO long term. As shown in Figure 152, the two components of the smartphone TCO are: i) the upfront cost of the terminal (device) to the consumer, and ii) the annualized ARPU (voice and data) bundled with the device. As can be seen in subsidized markets (such as Western Europe and North America), this can be significantly different from unsubsidized markets such as Asia Pacific.

16 March 2011
IT Hardw
are 133
Figure 153: Total Cost of Ownership for a Low-End Smartphone Offering from RIM, Nokia, Apple, and Android in Different Countries Total cost of ownership in US$, population and handset sell through in millions. Low end TCO is the cost to consumer in the first year for a low-end smartphone offering
RIM Nokia Apple Android LowDeveloped CountriesUSA 310 184 720 880 880 770 720Germany 82 36 478 478 829 478 478France 63 27 433 694 967 455 433UK 62 43 378 378 661 378 378Italy 60 23 833 708 1,130 1,130 708Spain 46 23 437 320 937 504 320Canada 34 11 481 589 687 589 481Australia 22 9 346 227 556 227 227
Total developed (weighted avg) 680 356 605 692 861 656 605
Emerging CountriesChina 1,341 315 421 406 1,264 287 287India 1,216 232 379 336 678 179 179Indonesia 235 45 486 405 941 304 304Brazil 193 47 749 734 1,279 615 615Bangladesh 164 15 415 390 NA 201 201Pakistan 167 16 438 353 NA 234 234Nigeria 156 20 651 636 NA 517 517Russia 140 37 699 526 1,106 683 526Mexico 109 29 650 775 NA 515 515Philippines 94 11 491 611 1,225 345 345Egypt 78 14 666 435 973 339 339
Total emerging (weighted avg) 3,894 781 465 432 849 304 304
Total (straight avg) 4,573 1,137 535 562 855 480 480Total (weighted avg) 4,573 1,137 509 514 853 414 414
Low-end TCO for the first year (US$)Country Population2010 (mn)
Handset sell-through 2010 (mn)
1. In developed markets, RIM smartphones have the lowest cost of ownership at $605 while Nokia on an average has a 15% higher cost of ownership at $690 with Apple having a TCO of $860
2. In developing markets, Android based smartphones have the lowest cost of ownership at $300 (given recent launch of some low-end Android phones), followed by Nokia at $430 and RIM at $465
3. Globally the cost of ownership at the low end of the smartphone market is $415. We believe this cost of ownership and the decline here will be key for driving growth in low-end of the smartphone segment
11
22
33 33
Source: Company data, Credit Suisse research, Credit Suisse estimates.

16 March 2011
IT Hardware 134
Device price will be driven by BOM reductions. We have illustrated our assumptions on the bill-of-materials decline and the ASP reductions in Figure 155. While we expect the smartphone market to evolve with new features, we believe that at the low end and midend, it is informative to look at how quickly the BOM may decline. Here we have made assumptions that the like-for-like component BOM can decline by around 10% per annum. Allowing for other fixed costs in the total manufacturing expense and assuming some gross margin pressure at the manufacturer level, we estimate the total BOM can shrink to as low at $82 by 2015. For these reasons, we estimate that the ASP of a smartphone can be as low as $112 by 2015, a $150 decline from normalized 2009 levels. This allows us to then forecast the decline of the device ASP component (in the TCO calculation) by region. We note that in subsidized markets where the upfront cost is already quite low, there will be minimal reductions.
Expecting gradual ARPU declines. Forecasting ARPU declines is somewhat more challenging given that each carrier tends to bundle data in different ways with a range of voice minutes, texts, and data. We note however, that at both the manufacturer and carrier levels, there are several initiatives to bring down costs to the consumer over time. We assume a moderate decline in the ARPU in the low-end smartphone market by 2015 based on an annualized ARPU reduction of 6% in all markets globally.
Longer term TCO reduction to $234 by 2015. As shown globally, by taking into account the above assumptions for the low-end smartphone TCO (by region), we arrive at the conclusion that the smartphone addressable market could reach close to 2bn units by 2015 in terms of affordability. In essence, we assume that at the very least, the reduction in the BOM will pass straight on to the consumer and this implies that the TCO for a low-end smartphone offering could reach as low as $234 longer term, a $210 decline or 47% drop from the current TCO of $443, which implies a CAGR decline of 12%. Geographically, we continue to expect a variance in TCO, even in the year 2015 as shown in Figure 154.
Figure 154: TCO for a Low-End Smartphone Offering by 2015 in US$, unless otherwise stated
101
117
141
166
171
180
188
202
205
213
222
235
278
338
347
349
378
392
420
0 50 100 150 200 250 300 350 400 450
India
Bangladesh
Pakistan
Australia
France
China
Indonesia
Germany
Canada
Egypt
Philippines
Spain
UK
Russia
Mexico
Nigeria
United States
Italy
Brazil
TCO for a low-end smartphone by 2015 (US$) Source: Credit Suisse estimates

16 March 2011
IT Hardw
are 135
Figure 155: Our Analysis Based on a Decline in Component Cost and GM Pressure Suggests the ASP of a Midend Smartphone Could Reach $112 by 2015 Long term assumptions on BOM, ASP and GMs for a mid-end smartphone
Nokia 5800
XpressmusicNormalized Smartphone
Absolute cost ($) 2009 2009 2010E 2011E 2012E 2013E 2014E 2015E CAGR 09-15
RF Transceiver 3.9 3.9 3.5 3.1 2.8 2.5 2.3 2.1Bluetooth 1.7 0.0 0.0 0.0 0.0 0.0 0.0 0.0Logic Component 19.1 14.3 12.9 11.6 10.5 9.4 8.5 7.6Application Processor 0.0 0.0 0.0 0.0 0.0 0.0 0.0 0.0Memory 6.3 6.3 5.7 5.1 4.6 4.1 3.7 3.3 -10%Analog comp. 10.6 10.6 9.5 8.5 7.7 6.9 6.2 5.6GPS 1.7 1.7 1.5 1.4 1.2 1.1 1.0 0.9WiFi 3.6 3.6 3.2 2.9 2.6 2.3 2.1 1.9FM Stereo 0.6 0.6 0.5 0.5 0.4 0.4 0.4 0.3Accelerometer 1.2 1.2 1.1 1.0 0.9 0.8 0.7 0.6Digital Engine cost ($) 48.6 42.1 37.9 34.1 30.7 27.6 24.9 22.4 -10%
PCB (Substrates) 4.5 4.5 4.1 3.6 3.3 3.0 2.7 2.4Insertion 2.0 2.0 1.8 1.6 1.4 1.3 1.2 1.0Card Test 0.4 0.4 0.4 0.3 0.3 0.3 0.2 0.2Final Assembly 21.0 17.9 15.6 13.5 11.8 10.2 8.9 7.8Modules 13.5 13.5 12.2 10.9 9.8 8.9 8.0 7.2Discretes 3.0 3.0 2.7 2.4 2.2 2.0 1.8 1.6Connectors 2.0 2.0 1.8 1.6 1.5 1.3 1.2 1.1Mechanical 9.5 7.1 6.4 5.8 5.2 4.7 4.2 3.8Display price 19.5 14.6 13.2 11.8 10.7 9.6 8.6 7.8Battery Pack 4.8 4.8 4.3 3.8 3.5 3.1 2.8 2.5Camera 1 7.6 7.6 6.9 6.2 5.6 5.0 4.5 4.1 -10%Camera 2 1.8 0.0 0.0 0.0 0.0 0.0 0.0 0.0Memory external 12.0 12.0 10.8 9.7 8.7 7.9 7.1 6.4 -10%Non Digital engine costs ($) 101.5 89.4 79.9 71.5 63.9 57.2 51.1 45.8 -11%
Component BOM pre scale ($) 150.2 131.5 117.8 105.6 94.6 84.8 76.0 68.1 -10%Scale effect -5% -5% -5% -5% -5% -5%Total Component BOM ($) 150.2 131.5 111.9 100.3 89.9 80.6 72.2 64.7 -11%
Freight and insurance 5.0 5.0 4.5 4.1 3.6 3.3 3.0 2.7Testing and quality 5.0 5.0 4.5 4.1 3.6 3.3 3.0 2.7IPR 10.5 8.9 7.8 6.8 5.9 5.1 4.5 3.9Software 10.0 5.0 4.5 4.1 3.6 3.3 3.0 2.7Accessories 10.0 10.0 9.0 8.1 7.3 6.6 5.9 5.3Maps 10.0 0.0 0.0 0.0 0.0 0.0 0.0 0.0Other accessories ($) 50.5 33.9 30.3 27.0 24.1 21.5 19.2 17.2 -11%
Total BOM ($) 200.7 165.4 142.2 127.3 114.0 102.1 91.4 81.9 -11%Gross Margin 33.2% 33.2% 32.2% 31.2% 30.2% 29.2% 28.2% 27.2%
Factory ASP ($) 300.5 247.7 209.8 185.1 163.3 144.2 127.4 112.5 -12%
11
1) We expect the BOM of the digital engine to decline at a 10% CAGR, driven by a 10% decline in semiconductor content pricing.
2) We normalise costs of the following components by 25% due to increasing competition in:
A) Logic B) Mechanical components C) and display prices
We also assume that smartphones will integrate Wi-Fi /Bluetooth and will have only one camera
3) We forecast a 5% decline in costs from 2010 due to scale effects
4) We expect the normalised software costs fall to $5/device as Android is adopted and eventually vendors do not pay for maps
5) Our analysis suggests that smartphone BOM will decline to $82 LT (a CAGR of -11%). Based on this decline and applying normalized GM pressure, we expect ASPs to fall to $113 LT, an annualized decline of 12%
22
22
33
44
44
Source: Portelligent, Credit Suisse estimates

16 March 2011
IT Hardware 136
Linking our TCO Analysis to the Addressable Market As we demonstrated above and summarized in Figure 151, the TCO for a smartphone could realistically fall nearly 50% from the current level of $443, down to $234 by 2015; ASP and ARPU pressure will drive this trend. To be thorough, we will now analyze effects due to income distribution and population by region.
How much are consumers prepared to spend on smartphones? Once we have estimated the cost of a smartphone to the consumer, the next issue is to calculate a sensible income threshold level. After all, while a smartphone is a desirable item, there is a limit to the income level which the average consumer would be willing to spend on the combined hardware and services. Here we have approached this analysis by looking at two separate metrics.
Figure 156: Mobile Telecoms as % GDP in 2009 Figure 157: Mobile Telecoms as % GDP in 2015E
0.0%
0.5%
1.0%
1.5%
2.0%
2.5%
3.0%
3.5%
4.0%
4.5%
NorthAmerica
WesternEurope
Latin America EasternEurope
Africa Middle East Asia-Pacific(ex Japan)
Japan
Mob
ile T
elec
oms
as %
of G
DP
(200
9)
1.7% - Avg. global
2.6% - Avg. developing countries
1.4% - Avg. developed countries
0.0%
0.5%
1.0%
1.5%
2.0%
2.5%
3.0%
3.5%
4.0%
4.5%
NorthAmerica
WesternEurope
Latin America EasternEurope
Africa Middle East Asia-Pacific(ex Japan)
Japan
Mob
ile T
elec
oms
as %
of G
DP
(201
5)
2.4% - Avg. developing countries
1.5% - Avg. developed countries
1.8% - Avg. global
Source: Gartner, Credit Suisse estimates Source: Credit Suisse estimates
■ Mobile spending to GDP ratio of around 1.7% globally. We see in Figure 156 that globally, the amount of mobile spend varies by region, with consumers spending on average some 1.7% of GDP on mobile telephony and services. In fact, even on the assumption of a more penetrated market, as is the case in 2015, we believe that this still will be some 1.8% as shown in Figure 157. Hence, we would argue that the TCO of a smartphone should not represent more than this level of income. In other words, if we believe as shown in Figure 151, that the TCO of a smartphone will be $234 globally on a longer term basis, then a user would need a minimum income level of $13,000 to afford a smartphone. This provides our key income cut off level for different regions and can be used to determine the addressable market for smartphones.
■ In emerging markets, the level is higher at 2.6%. Given the 1.7% (global) and 1.4% (developed markets) threshold levels, we believe the higher 2.6% ratio for developing markets shows the importance of data and communication for users in these markets; they are prepared to spend a higher percentage of GDP on mobile telephony. In fact, as shown in Figure 156, we believe that subscribers in some emerging markets like Africa are spending 3.8% of GDP on mobile services.
Income distribution data suggests addressable market of 2bn longer term. Once we have concluded that users are prepared to spend as much as 1.3% to 3.8% of their income on smartphone purchases (depending on the geographic region), we can apply these cut off levels to determine the minimum level of GDP per head needed to purchase a smartphone based on the TCO for a low-end smartphone in that market. Over the longer term, we then use this estimate of required income to compute the level of population that is addressable. As shown in Figure 151, we believe that the addressable market for smartphones is nearly 2bn globally.

16 March 2011
IT Hardware 137
Smartphone Volumes to Grow at LT CAGR of 28.5% With a 2015 addressable market of some 2bn, we now turn our analysis to quantifying the market opportunity in terms of units. We conclude based upon our affordability, penetration, and replacement analysis, that the smartphone subscriber base longer term could be as high as 1.92bn by 2015 (around 98% penetration of the 2bn addressable market) and that the smartphone segment is set for a period of reaccelerating growth reaching volumes of 1.04bn by 2015 as shown in our summary smartphone model in Figure 160.
Penetration curves and the addressable market. We estimate that smartphone penetration was 24% given the installed base of 461mn smartphone subscribers at the end of 2010. The next step is to determine the evolution of this penetration on a longer term basis. Here we believe a sensible approach is to take a look at how the mobile voice market evolved. As shown in Figure 158, the voice market followed a typical “S” curve for penetration, as it increased from 28% to 70% over a five-year period, an increase of 40pp. Owing to the falling cost of ownership, carrier push, and consumer pull, we believe that penetration gains will be higher in smartphones than mobile voice. We estimate that smartphone effective penetration will increase from 24% in 2010 to 98% by 2015. This level of penetration would imply smartphone subscribers to the tune of 1.92bn by 2015. This likely is conservative, since it represents a smartphone penetration reaching only i) 27% of the global mobile subscriber base and population and ii) 49% of overall handsets by 2015.
Figure 158: Mobile Voice Saw Penetration Gains of 40pp over Five Years After Reaching ~30% Base year 1 is taken as the year when penetration in individual region reached near 10%
0%
10%
20%
30%
40%
50%
60%
70%
80%
Year 1 Year 2 Year 3 Year 4 Year 5 Year 6 Year 7 Year 8 Year 9 Year 10
% su
bscr
iber
pen
etra
tion
prog
ress
ion on
ce p
enet
ratio
n re
ache
s 10
% in
itiall
y
Western Europe USA North America China India APAC CEE Africa Latin America Global Average
Mobile voice penetration globally grew from 28% in year 5 to 70% in year-10, a 40pp absolute gain in 5 years.
Source: Company data, Credit Suisse estimates
Replacement rates. Since smartphones will operate at the higher-end of the market (versus the overall mobile industry), we assume that replacement rates in smartphones to be on an average 45% over 2011-2015, which remains above the global replacement rate of 27% we forecast for the overall handset industry. Looking at our regional replacement forecasts as demonstrated in Figure 159, we expect smartphone replacement levels in North America to average around 70% in the long term.

16 March 2011
IT Hardware 138
Figure 159: Smartphone Replacement Rate by Region Replacement rate measured as % of previous year’s smartphone subscriber base Replacement rates 2008 2009 2010 2011E 2012E 2013E 2014E 2015E NA 89% 69% 71% 70% 70% 69% 69% 68% Latam 40% 39% 42% 41% 41% 41% 41% 41% WE 49% 48% 52% 51% 51% 51% 51% 51% APAC 34% 31% 32% 33% 33% 33% 33% 33% Japan 44% 37% 37% 37% 37% 37% 37% 37% MEA 42% 33% 36% 38% 38% 38% 38% 38% CEE 39% 34% 39% 38% 39% 40% 40% 40% Global 47% 42% 46% 46% 46% 46% 45% 44% Source: Gartner, Company data, Credit Suisse estimates

16 March 2011
IT Hardw
are 139
Figure 160: Longer Term, We Expect Annual Smartphone Volume Shipments to Reach Over 1 Billion Units by 2015 in millions, unless otherwise stated
Smartphone model summary 2008A 2009A 2010A 2011E 2012E 2013E 2014E 2015E CAGR 10-12 CAGR 10-15Global mobile subscriptions ('000) 3,948,563 4,574,835 5,188,853 5,721,742 6,141,930 6,520,804 6,869,988 7,188,981 8.8% 6.7%Global new subscriptions 647,421 626,272 614,018 532,889 420,188 378,874 349,184 318,993Global mobile unit sell-through shipments 1,317,746 1,356,659 1,625,852 1,873,151 1,936,017 1,997,234 2,081,431 2,139,659 9.1% 5.6%
Global smartphone subscribers 230,569 305,084 461,466 699,839 971,512 1,268,691 1,586,034 1,923,748 45.1% 33.0%as % of total mobile subscribers 5.8% 6.7% 8.9% 12.2% 15.8% 19.5% 23.1% 26.8%
Global smartphone addressable market 1,960,492 1,960,492 1,960,492 1,960,492 1,960,492 1,960,492 1,960,492 1,960,492Smartphone Effective Penetration (subs / addressable market) 11.8% 15.6% 23.5% 35.7% 49.6% 64.7% 80.9% 98.1%
Net smartphone adds 58,051 74,515 156,383 238,373 271,673 297,179 317,343 337,714 31.8% 16.6%as % of total mobile net adds 9.0% 11.9% 25.5% 44.7% 64.7% 78.4% 90.9% 105.9%as % of total smartphone units 41.7% 43.2% 52.7% 52.8% 45.8% 40.1% 35.7% 32.4%
Replacements units 81,237 97,861 140,264 212,855 322,146 443,084 570,735 703,626 51.5% 38.1%as % of last year's smartphone subscribers 47.1% 42.4% 46.0% 46.1% 46.0% 45.6% 45.0% 44.4%as % of total smartphone units 58.3% 56.8% 47.3% 47.2% 54.2% 59.9% 64.3% 67.6%
Global smartphone units 139,288 172,376 296,647 451,228 593,819 740,262 888,079 1,041,339 41.5% 28.5%% change yoy 13.9% 23.8% 72.1% 52.1% 31.6% 24.7% 20.0% 17.3%as % of mobile shipments 10.6% 12.7% 18.2% 24.1% 30.7% 37.1% 42.7% 48.7%
Smartphone ASPs ($) 326 328 315 284 255 225 198 174 -10.0% -11.2%% change yoy -3.0% 0.7% -4.0% -10.0% -10.0% -12.0% -12.0% -12.0%
Global smartphone revenues ($ mn) 45,379 56,562 93,462 127,949 151,543 166,246 175,509 181,102 27.3% 14.1%% change yoy 10.5% 24.6% 65.2% 36.9% 18.4% 9.7% 5.6% 3.2%% of global handset market 25.0% 27.4% 41.8% 53.6% 64.4% 72.9% 79.3% 85.1%
1) Smartphone penetration still low at 24%. Given our estimate of an installed base of 461mn smartphone subscribers at the end of 2010 and our long-term smartphone addressable market forecast of around 2bn, we believe the effective penetration is still low at 24%. Based on penetration gains driven by a falling TCO, we believe that smartphone adoption will be faster than the typical S-Curve as was seen by mobile (voice) penetration, reaching 98% by 2015.
2) Strong volume growth in 2011. Driven by increasing affordability, we expect smartphones to continue to see strong volume growth in 2011 with global shipments of 451mn (up 52% yoy) resulting in revenues up 37% yoy in spite of 10% ASP pressure.
3) Longer-term >28% volume growth. We believe smartphones to remain one of the most attractive secular trends in technology, with volumes set to grow at a CAGR of 28.5% in the long term, reaching 1.04bn units by 2015.
4) Strong yoy growth in recent quarters supports our view on strong growth. Given 49%/50%/96%/86% yoy growth in smartphone volumes in recent quarters (Q110/Q210/Q310/Q410), we believe that our long term volume estimates for the smartphone market could still prove conservative.
Smartphone market to grow at 28.5% CAGR longer term
11
33
22
Source: Gartner, Company data, Credit Suisse estimates
Source: Gartner, Company data, Credit Suisse estimates

16 March 2011
IT Hardware 140
Approach 2—Cannibalization of Other CE Markets While many consumers will inherently use multiple devices, each for a distinct function, we believe that in aggregate, smartphones will seek to replace and effectively cannibalize a number of other consumer electronics segments. In this section, we look at the segments that have the potential of being replaced by smartphones over time, and what the ramifications are for smartphone volumes in the long term.
Portable media players. The portable media player market is dominated by the iPod, however it is hard to see this standalone segment not being impacted especially with the sheer range of music stores now available for access via smartphones (especially with DRM-free music). We assume that 100% of MP3 players can be cannibalized in an ideal scenario.
Personal navigation devices. Here we assume that 50% of PNDs can be potentially cannibalized by smartphones in the long term; the quality of GPS and mapping technologies on the latest smartphones is of comparable quality.
Digital still cameras. We assume that a smartphone with a robust enough camera (both in terms of pixel quality and memory capacity) will be able to successfully replace a significant percentage of point-and-shoot digital still cameras over time. In our analysis, we assume that all DSCs with camera quality less than 15MP can be potentially cannibalized by smartphones; this will be at least 30% of the overall DSC volumes.
Portable gaming devices. As shown in Figure 161, 32mn portable gaming devices are expected to be sold in 2010. However, with the onset of applications stores, and a particular focus on leveraging smartphones as gaming platforms, we believe much of the market can be cannibalized.
Midend phones. We assume that 75% of mid-end phones selling at a price point of $100-200 could be cannibalized by smartphones by 2015.
Figure 161: Based on Cannibalization of Adjacent Markets, Estimate Smartphone Units Could Reach 988mn by 2015 in millions, unless otherwise stated
Forecasts (2010) Potential cannibalisationSegments Units (mn) ASP ($) Revenues ($ mn) % cannibalised Units (mn) ASP ($) Revenues ($ mn) AssumptionPortable Media Players 148.5 118 17,552 100% 148.5 118 17,552 Assumed 100% of media players can be cannibalisedPersonal Navigation Devices 40.5 245 9,923 50% 20.3 245 4,961 Assumed 50% of PNDs can be cannibalisedDigital Still Cameras 116.9 225 26,271 30% 34.6 225 7,784 Assumed all DSCs with <15 MP camera can be cannibalisedPortable Gaming Devices 31.5 172 5,408 100% 31.5 172 5,408 Assumed all Nintendo DS and Sony PSP can be cannibalisedMid-end Phones 781.0 137 107,062 75% 585.8 137 80,297 Assumed 75% of all mid-end phones can be cannibalisedPotential for incremental revenues ($ mn) 166,215 116,002
Industry revenues which can be cannibalised by smartphones ($ mn) (A) 116,002Average smartphone ASP in 2015 ($) (B) 168Incremental smartphone units (mn) (C = A / B) 691
Global smartphone units in 2010 (mn) (D) 297Global smartphone units in 2015 (mn) (E = C + D) 988
Unit CAGR (2010-2015) 27.2%
Our cannibalisation analysis suggests that the smartphone market could be as big as 988mn units by 2015, which suggests that our current published estimate of 1.04bn units is achievable
Source: Gartner, IDC, Company data, Credit Suisse estimates
In aggregate, if we fold in cannibalization of the combined revenue potential from each of these segments, we estimate that smartphone units could reach as high as 988mn by 2015. Our current market estimate of 1.04bn smartphone units (for 2015) is only around 5% higher than what is suggested by the cannibalization analysis; our long-term smartphone volume estimates appear reasonable in comparison.
Approach 3—Price Band Work Suggests 1.04B Units A different way of looking at the long-term opportunity for smartphones is to evaluate the price segments that these devices will realistically address over the next several years. In Figure 162, we provide a summary of the overall mobile handset market by price point and note that 76% of volumes currently sell at a price under $200. Clearly the focus becomes how quickly smartphones can address lower price tiers. In this analysis, we conclude that the market opportunity could be as large as 1.04bn units in the long term, given several factors.

16 March 2011
IT Hardware 141
Figure 162: Overall Handset Market Volumes Broken Down by Price Bands Overall market split into $50 price bands 2010 market <= $50 $50-$100 $100-$150 $150-$200 $200-$250 $250-$300 $300-$350 $350-$400 $400-$450 $450-$500 > $500 Total units (mn) 496 243 255 215 139 44 51 27 38 15 65 % of total market 31% 15% 16% 14% 9% 3% 3% 2% 2% 1% 4%
Source: Company data, Credit Suisse estimates
As shown in Figure 155, our proprietary BOM analysis suggests that the ASP of a midend smartphone will likely be $112 by 2015 compared with $300 in 2009. This is a decline of $188 from 2009 levels, which implies around $150 from 2010 levels. As shown in Figure 163, this means that such a device could drop some 3 price bands from current levels thereby addressing the $0-50 smartphone market by 2015 vs. the $150-200 smartphone market currently. In addition, we also assume that all mobile phones selling at an ASP of over $250 by 2015 would be a smartphone. Shifting down the price bands for smartphones as shown below would suggest that the global smartphone market would be 1.04bn units by 2015. Interestingly, this also shows that nearly 50% of smartphone industry volumes could be selling at less than $200 by 2015.
Further perspective on our published estimate of 1.04bn smartphone units in 2015. This pricing work serves to make the important point that as the smartphone segment scales to lower prices, the volume opportunity will accelerate thereby supporting our view that global smartphone volumes on an annual basis could reach our estimate of 1.04bn units by 2015.
Figure 163: Our Price Band Analysis Suggests that Over 1bn Smartphone Units Is Possible Over the Long Term in millions, unless otherwise stated
Price point Smartphone units by
price band (mn), (a)Smartphone unit
breakdown (%) per price band
Overall handset units (mn), (b)
Smartphones as % of handsets in each
price band, (a) ÷ (b)
Overall handset units (mn), (d)
Smartphones as % of handsets in each
price band, (e)
Smartphone units in each price band, (d) x
(e)
Smartphone unit breakdown (%) per
price band <= $50 1 0.4% 496 0.3% 742 22.4% 166 15.9%$50-$100 6 1.9% 243 2.3% 318 39.0% 124 11.9%$100-$150 26 8.7% 255 10.1% 275 40.5% 112 10.7%$150-$200 48 16.2% 215 22.4% 201 51.0% 103 9.8%$200-$250 54 18.3% 139 39.0% 170 74.5% 126 12.1%$250-$300 18 6.0% 44 40.5% 111 100.0% 111 10.7%$300-$350 26 8.8% 51 51.0% 69 100.0% 69 6.6%$350-$400 20 6.9% 27 74.5% 37 100.0% 37 3.6%$400-$450 29 9.8% 38 75.6% 37 100.0% 37 3.6%$450-$500 11 3.6% 15 69.9% 25 100.0% 25 2.4%> $500 58 19.5% 65 88.8% 133 100.0% 133 12.8%Total 297 100.0% 1,589 2,119 1,044 100.0%
2010 2015
1) Our bill of material (BOM) analysis shows that ASPs for smartphones can decline by as much as $150 by 2015, which suggests that:
As price declines, smartphones will become less expensive and penetrate lower price points
Decline of $150 in smartphone ASP implies that smartphone pricing can drop three price bands, for example, a smartphone currently selling in the price band $250-$300 could drop to a price point of between $100-$150
We also believe that all phones selling at an ASP of more than $250 by 2015 would be a smartphone
2) Our analysis shows that smartphone volumes can reach as high as 1bn by 2015, and would highlight the following:
Our estimate of 1.04bn is inline with our current published smartphone forecast for 2015
Increased smartphone penetration in the lower price bands will mean that nearly 50% of volumes could be sold at an ASP of less than $200
Source: Company data, Gartner, NPD, Credit Suisse estimates

16 March 2011
IT Hardware 142
Scaling Smartphones Based upon our extensive TCO analysis (which we have also cross-checked with our cannibalization and BOM analyses), we conclude that industry-wide smartphone volumes are set to grow at a CAGR of 28.5% over the next five years (2010-2015). Furthermore, we believe that conclusions for all vendors in the handset industry, both traditional and nontraditional, are significant. In particular, we believe that not only will smartphones occupy a disproportionate share of industry value, but even newer entrants will need to master the art of operating at structurally lower price points.
Rising to 49%/85% of Industry Volume/Value by 2015 Clearly our optimistic view of the smartphone market has repercussions on the wider mobile handset industry. On our new estimates, we believe that longer term smartphones will become 49% of industry volume and 85% of industry value for the overall handset market by 2015. With such an increasing and dominant share of the industry revenues coming from smartphones, we believe execution in this segment remains important and will become crucial for the longevity of traditional handset vendors. In addition, we would highlight that strong smartphone growth does not imply that all segments within the handset market will grow. Having updated our industry wide segmentation analysis, we arrive at three main conclusions:
Figure 164: Smartphones to Continue to Rise to Over 80% of Industry Value by 2015 Up from 40% in 2010 in millions, unless otherwise stated Global Handset Volumes 2008 2009 2010 2011E 2012E 2013E 2014E 2015E CAGR 10-15E Basic Phones 407 435 511 598 645 683 724 761 8.3% Enhanced Phones 758 767 781 766 676 561 446 316 -16.5% Smartphones 139 172 297 451 594 740 888 1,041 28.5% Total handset units (mn) 1,304 1,375 1,589 1,815 1,915 1,985 2,059 2,119 5.9% Basic Phones 31% 32% 32% 33% 34% 34% 35% 36% NM Enhanced Phones 58% 56% 49% 42% 35% 28% 22% 15% NM Smartphones 11% 13% 19% 25% 31% 37% 43% 49% NM Total volume mix (%) 100% 100% 100% 100% 100% 100% 100% 100% NM Basic Phones 63 57 51 45 39 34 29 25 -13.0% Enhanced Phones 145 164 133 110 87 69 55 39 -21.7% Smartphones 328 328 315 284 255 225 198 174 -11.2% Blended ASP ($) 139 150 141 131 123 115 107 100 -6.5% Basic Phones 25,675 24,750 26,156 26,598 24,974 23,022 21,225 19,409 -5.8% Enhanced Phones 110,302 125,357 103,755 84,011 58,849 38,836 24,457 12,331 -34.7% Smartphones 45,379 56,562 93,462 127,949 151,543 166,246 175,509 181,102 14.1% Total handset revenue ($ mn) 181,356 206,669 223,373 238,557 235,366 228,104 221,191 212,842 -1.0% Basic Phones 14% 12% 12% 11% 11% 10% 10% 9% NM Enhanced Phones 61% 61% 46% 35% 25% 17% 11% 6% NM Smartphones 25% 27% 42% 54% 64% 73% 79% 85% NM Total revenue mix (%) 100% 100% 100% 100% 100% 100% 100% 100% NM
Source: Company data, Gartner, Credit Suisse estimates
Low-end to rise moderately in volume and value terms. In Figure 164, we show that the low-end of the mobile phone market represented 32% of industry volume and 12% of industry value in 2010. Longer term, we believe that this will rise to 36% of volumes in 2015. Owing to pricing pressure, however, we expect the segment will still represent only 9% of industry revenues. We also believe that there could be an incremental 1.5bn subscribers joining mobile networks for the first time, which supports our argument for

16 March 2011
IT Hardware 143
low-end volume growth at the global level. This is without taking into account the replacement market in emerging markets, which we expect should grow from currently depressed levels. This, we believe, will sustain a rising unit mix for the low-end segment.
Smartphones to occupy the dominant share of industry value. Given our estimate of a longer term smartphone market at 1.04bn units, and even allowing for price reductions over time, we arrive at the conclusion that smartphones could account for 49% of industry volume and 85% of industry value by 2015. Looking at our estimate of smartphone ASPs falling from $315 in 2010 to $174 by 2015 in Figure 164, we believe it is clear that it remains essential for traditional mobile phone vendors to master the core competencies in smartphones to even survive in the market long term.
Mid-end continues to shrink. Long term, we expect the midend segment to see significant declines as it falls to around 316mn units resulting in a rapidly falling industry share. In fact, by 2015 we believe this segment to represent only 15%/6% of industry volume/value compared to 49%/46% respectively in 2010.
Emerging Market Increasingly Important As the smartphone market continues to grow, we believe the segment will penetrate new regions in terms of volume. Here we would make some important observations around the mix shift geographically:
Figure 165: EMs Could Account for Nearly 55% of Global Smartphone Market by 2015 in %, unless otherwise stated
0%
10%
20%
30%
40%
50%
60%
70%
80%
90%
100%
2009 2010 2011E 2012E 2013E 2014E 2015E
Smar
tpho
ne v
olum
e br
eakd
own
by re
gion
(%)
NA WE Japan APAC Latam MEA CEE Source: Company data, Gartner, Credit Suisse estimates
Developing regions to take a larger part of the pie. As shown in Figure 165, we can infer that some 60% of smartphone volumes came from developed markets like WE, NA and Japan in 2010, whereas developing markets accounted for only 40%. However, moving forward we see that smartphone shipments in developing regions could be as high as 547mn up from 121mn in 2010, which would represent 53% of the global smartphone market. We expect this to be partly driven by increasing affordability and partly by rollout of 3G mobile networks.
More emphasis beyond carrier distribution. Given that little carrier subsidization takes place in markets outside of North America, Western Europe, and Latin America, we increasingly believe vendors will need to either build-out their own distribution network or sign agreements with carriers/distributors which presents another challenge for new

16 March 2011
IT Hardware 144
entrants in the industry. We believe this holds true especially for China and India, which are among the largest handset markets globally.
Low-End Rising in Importance Currently we see that smartphones are predominantly a high-end mobile device with an average ASP of $315 for 2010. In particular, looking at the price distribution of smartphones in Figure 166, we see that nearly 50% of smartphone volume is priced in the range of $300 and above. In fact, as we show in an earlier section titled ‘Approach 3: Price band work suggests 1.04bn units’ that based upon our BOM extrapolation analysis of a typical lower end smartphone, we believe that a smartphone can be available at a price point of as low as $112 by 2015 as compared with an ASP of $300 in 2009. Based upon this analysis, we arrive at the following important conclusions for the smartphone segment.
Figure 166: Our BOM and Pricing Analyses Suggest ~50% of Smartphone Units Could Sell at <$200 in the Long Term in millions, unless otherwise stated
Price point Smartphone units by
price band (mn), (a)Smartphone unit
breakdown (%) per price band
Overall handset units (mn), (b)
Smartphones as % of handsets in each
price band, (a) ÷ (b)
Overall handset units (mn), (d)
Smartphones as % of handsets in each
price band, (e)
Smartphone units in each price band, (d) x
(e)
Smartphone unit breakdown (%) per
price band <= $50 1 0.4% 496 0.3% 742 22.4% 166 15.9%$50-$100 6 1.9% 243 2.3% 318 39.0% 124 11.9%$100-$150 26 8.7% 255 10.1% 275 40.5% 112 10.7%$150-$200 48 16.2% 215 22.4% 201 51.0% 103 9.8%$200-$250 54 18.3% 139 39.0% 170 74.5% 126 12.1%$250-$300 18 6.0% 44 40.5% 111 100.0% 111 10.7%$300-$350 26 8.8% 51 51.0% 69 100.0% 69 6.6%$350-$400 20 6.9% 27 74.5% 37 100.0% 37 3.6%$400-$450 29 9.8% 38 75.6% 37 100.0% 37 3.6%$450-$500 11 3.6% 15 69.9% 25 100.0% 25 2.4%> $500 58 19.5% 65 88.8% 133 100.0% 133 12.8%Total 297 100.0% 1,589 2,119 1,044 100.0%
2010 2015
1) Our bill of material (BOM) analysis shows that ASPs for smartphones can decline by as much as $150 by 2015, which suggests that:
As price declines, smartphones will become less expensive and penetrate lower price points
Decline of $150 in smartphone ASP implies that smartphone pricing can drop three price bands, for example, a smartphone currently selling in the price band $250-$300 could drop to a price point of between $100-$150
We also believe that all phones selling at an ASP of more than $250 by 2015 would be a smartphone
2) Our analysis shows that smartphone volumes can reach as high as 1bn by 2015, and would highlight the following:
Our estimate of 1.04bn is inline with our current published smartphone forecast for 2015
Increased smartphone penetration in the lower price bands will mean that nearly 50% of volumes could be sold at an ASP of less than $200
Source: Company data, NPD, Credit Suisse estimates
Shifting down price tiers suggests a significant mix shift in the market. In essence, our BOM extrapolation analysis implies that each price tier could afford to shift down three price tiers as shown in Figure 166. In applying this analysis, we observe that smartphones increasingly penetrate price bands as low as $50. While we assume a healthy high-end market, nearly 50% of smartphone volumes could sell at an ASP of less than $200 in the long term.
Increasing pricing pressure ahead. We believe mix shift and increased competition will have a direct impact on pricing pressure, and as such, we assume a pricing decline of 11% over 2010-2015. However, given our expectation for strong volume growth (CAGR of 28.5% over 2010-2015), we believe revenues with this segment can still grow at a CAGR of 14%. In addition, we would note that this pricing pressure has already begun to play out, as new players like those listed in Figure 167 have entered the smartphone market over the past 12-18 months.
Figure 167: Newer Players Like Dell, Toshiba, and Asus Planning to Enter the Market Smartphone players Vendors Existing players Nokia, RIM, Apple, HTC, Motorola, Samsung, LG, Sony Ericsson, Palm Newer players Toshiba, Dell, Asus, Garmin, Huawei, ZTE, Acer, Lenovo
Source: Credit Suisse research

16 March 2011
IT Hardware 145
Move Toward Lower Price Points Already on Its Way One clear theme emerging from industry trends over the past 12-18 months is that smartphone portfolios for all vendors are rapidly evolving, and in particular, we have seen widespread industry support to drive the market towards lower price points.
Figure 168: Specifications for Low-End Smartphone Portfolio from Different Vendors Overall smartphone portfolio Low-end smartphone portfolio only >> Vendor # devices Avg ASP ($) # devices % low-end Avg ASP ($) Lowest ASP ($) Highest ASP ($)Nokia 22 306 10 45% 187 116 240 Samsung 68 355 15 22% 183 140 240 LG 41 338 8 20% 200 152 240 SEMC 13 395 2 15% 200 200 200 Motorola 32 352 9 28% 217 160 240 HTC 33 442 5 15% 219 178 240 RIMM 14 340 4 29% 220 200 240 Huawei 10 162 10 100% 162 79 231 ZTE 12 160 12 100% 160 79 240 Acer 19 334 7 37% 200 174 224 Apple 2 540 0 0% - - - Palm 6 350 0 0% - - -
Total 272 344 82 30% 189 134 237
Low-end smartphone portfolio only >> Vendor GSM UMTS/GSM Touchscreen Screen size (in) Camera (MP) Wi-Fi % Android Nokia 20% 80% 70% 2.8 3.0 40% 0% Samsung 40% 60% 87% 2.8 2.5 47% 20% LG 38% 50% 88% 2.9 3.0 75% 50% SEMC 0% 50% 100% 3.5 5.0 100% 100% Motorola 11% 44% 89% 3.1 3.8 89% 89% HTC 0% 100% 100% 2.9 3.9 80% 80% RIMM 25% 50% 0% 2.9 2.6 100% 0% Huawei 10% 90% 100% 3.2 3.7 80% 100% ZTE 25% 67% 92% 3.1 3.3 25% 58% Acer 14% 86% 100% 3.0 3.1 57% 57% Apple - - - - - - - Palm - - - - - - -
Total 22% 68% 85% 3.0 3.2 61% 51% * This database includes some low-end CDMA and TD-SCDMA devices as well Source: Company data, Credit Suisse research
Significant low-end launches. We see that since the beginning of 2010, key smartphone vendors have either announced or already launched a total of over 80 low-end platforms (which we define as an ASP <$250), representing 30% of these particular OEMs’ total smartphone portfolios on average. In terms of core functionality for these devices, we present the key specifications in the above Figure 168, and would highlight these particular features.
■ 3G has a broad representation. Of the 82 low-end smartphones launched or currently selling in the market, we estimate that 68% of devices are WCDMA, 22% are GSM/EDGE, and the remaining 10% based on other technologies (like CDMA or TD-SCDMA).
■ Touchscreen seems to be the predominant form factor. Two years ago, touchscreen was considered a high-end feature for smartphones. Today, however, 85% of low-end devices offer this capability. Interestingly, new-entrants like Huawei and Acer are

16 March 2011
IT Hardware 146
offering touchscreen on all new low-end devices, whereas the incumbent Nokia only offers this feature on 7 out of its 10 low-end smartphones.
■ Which supports the need for larger screen size. Even though a larger screen would materially affect the cost of building a lower-end device, we would point out that new lower-end devices are averaging a screen size of around 3.0”. As mentioned above, new entrants like Huawei, ZTE, and Acer offer the largest average screen sizes (at 3.2”/ 3.1”/ 3.0” respectively) in the low-end.
■ Not all features are emphasized in the low-end as yet. As shown in Figure 168, features like Wi-Fi, which are generally standard in higher-end smartphones, still only account for 61% of low end smartphone portfolios.
■ Factory ASP of $189 and probably going lower. Already we see that low-end smartphones introduced over the last 12 months have an average factory ASP of $189, with Huawei and ZTE already announcing Android based terminals at less than $100.
The wireless industry is supporting the move toward lower end. While device launches have clearly demonstrated the trend toward lower price points, we equally acknowledge that across the wireless supply chain ranging from vendors (like Nokia, HTC and Samsung) to wireless operators (such as Orange and China Unicom) and chipset companies (like MediaTek – covered by Credit Suisse Asian Foundries analyst Randy Abrams, Marvell, and Broadcom - covered by Credit Suisse Semiconductor analyst John Pitzer), it is clear that the industry has agreed for the need to grow this lower-end segment of the market. We have highlighted these recent comments in Figure 169.

16 March 2011
IT Hardware 147
Figure 169: We See Increasing Signs of Low-End Smartphones Being Embraced Across the Wireless Industry Date Company Comments 08-Feb-10 Broadcom Designed in Broadcom's proven 65 nanometer CMOS process, the new BCM21553 enables manufacturers to build
low cost, low power, next generation 3G HSUPA phones with breakthrough features, sleek form factors and very long battery lives.
09-Feb-10 MediaTek Microsoft and MediaTek announce a partnership to provide a multimedia-rich smart phone solution primarily aimed at EMs. As a result of this deal, consumers will be able to buy a wide range of feature-rich Windows phones with the best cost-performance ratio in the market.
10-Feb-10 ST-Ericsson "Our U6715 platform has been designed to enable the smartphone to break out of its current high-end niche and become a true mass-market product in 2010" - Marc Cetto, Head of 3G and Multimedia at ST-Ericsson.
12-Feb-10 Marvell "Marvell is delivering the platform for a $99 smartphone that provides instant access, live content, high performance 3D mobile gaming, rich HD media and a wealth of applications" - Weili Dai, GM of Consumer & Computing Business at Marvell.
15-Feb-10 Infineon Infineon announced the availability of XMM6260, the latest platform in its 3G slim-modem family...by adding advanced HSPA+ features, while significantly reducing board space, power consumption and BOM costs.
16-Feb-10 ZTE ZTE unveiled the low-cost T-Mobile touchscreen Vairy Touch II, available to UK prepay users from March. It will retail for £59.99 and supports EDGE technology.
16-Feb-10 Orange "In 2010 we will be offering an Android handset at €150 on prepay, and I would expect that we will have an Android handset at below €150 before Christmas. This was considered unachievable six months ago" - Yves Maitre, SVP of Mobile Multimedia and Devices at Orange.
17-Feb-10 China Unicom "...we need better handsets to put 3G into full use. We already have devices at the high-end, but we now plan to launch a low-cost 3G smartphone in the future” - Lu Yimin, President of China Unicom.
17-Feb-10 Huawei "Key to unlocking the potential usage of 3G is the need for a US$150 smartphone with iPhone-like capabilities” - Guo Ping, Chairman of Huawei Devices.
17-Feb-10 Symbian "The first Symbian smartphones with unsubsidised prices of €100 will reach the market this year...this year we will see a few products hitting that point" - Lee Williams, Head of Symbian Foundation.
22-Apr-10 Nokia "In Q1 Nokia delivered revenue and earnings growth on a year over year basis ... In our devices and services business, Nokia continued to show solid smartphone momentum in lower price points"
31-Mar-10 RIM "your assumption that low ASP products, is what's driving international, certainly 8520 has been successful has helped as a catalyst in some of those markets...and 8520 also had a great gross margin" - Edel Ebbs, IR at RIM.
21-Apr-10 Qualcomm "...the smartphone segment is continuing its strong momentum...and is taking an increasing share of what typically has been the feature phone segment...we're also pleased to see more and more operators experimenting with variable pricing plans for 3G data services" - Paul Jacobs, Chairman and CEO at Qualcomm.
21-Oct-10 Nokia "On the low end, these are interesting products for European markets as well, but I can't really give any further ASP dynamics regarding those products" - Timo Ihamuotila, CFO at Nokia.
26-Oct-10 Broadcom "In the rest of the world, people are looking for cost-effective smartphones, and smartphones they can buy at a more affordable price" - Scott McGregor, President and CEO at Broadcom.
28-Oct-10 HTC "In the European market, we are seeing our mid tier's product seeing a volume, as I indicated before. So I think in term of the readiness for the mid tier's pricing, I think we are much more ready than we were years ago" - Hui-Ming Cheng, CFO at HTC.
28-Oct-10 Motorola "At Verizon, we announced Citrus, an entry-level portable device with an eco-friendly design for first-time smartphone users. At AT&T, we launched three more devices -- Bravo, FLIPSIDE and FLIPOUT. With a variety of screen sizes and form factors and affordable retail price points, these devices give consumers added choice in their smartphone experiences" - Sanjay Jha, CEO of Mobile Devices at Motorola.
03-Nov-10 Qualcomm "We continue to see up side in the high end of the market, as well as new wave of opportunity coming in the form of lower cost, high volume 3G phones in both developed and developing geographies. The cost advantages of our integrated approach and platform compatibility among our products positions us to grow as these trends play out in the marketplace" - Steve Mollenkopf, EVP, President at Qualcomm.
05-Jan-11 HTC AT&T announced HTC Freestyle a low cost BREW smartphone. Freestyle specs include 3.2 inch screen, 512MB internal storage, 528MHz Qualcomm processor. It supports GSM/UMTS/HSPA and comes with HTC Sense UI.
07-Jan-11 ZTE ZTE launched a wide variety of Android devices in the year of 2010 including the Libero handset in Japan, the Blade handset in France, the Racer handset in the U.K. and the LIGHT tablet in Europe and Asia. The company continues to deliver innovative products that take advantage of the most advanced software on the market at an unsurpassed value to consumers.
21-Jan-11 HTC "So we will continue to, so from the portfolio perspective, as you can see and suggest from our 4Q ASP and at the moment in Q1, I think we do see continued quite good demand on our high-end product for the year, and definitely we start inspiration from our Wildfire. We will continue to work on the mid-tier product to further penetrate the whole smartphone market" - Joey Cheng, Director of IR at HTC.
26-Jan-11 Qualcomm "We do see a lot of movement towards mass-market smartphones that should help grow the market, but as a consequence also lower the average selling price a bit" - Bill Keitel, EVP & CFO at Qualcomm.
09-Feb-11 Broadcom Our BCM21850 processor and its Broadstone™ reference platform make it easier than ever for OEMs to bring to market all the smartphone features that people want in an affordable handset designs.
11-Feb-11 MediaTek "We believe that our new MT6573 platform enables our customers to meet this consumer demand and bring unprecedented levels of performance to lower-priced smartphones” - Jeffrey Ju, GM, Smartphone at MediaTek.
Source: Company data, Credit Suisse research.

16 March 2011
IT Hardware 148
Lower-end chipsets should support the expansion. A clear theme in the past few months has also been from the supply chain and particularly chipset companies to support this move to lower price points. As shown in Figure 170, MediaTek, ST-Ericsson, Broadcom, Infineon and Marvell have all developed lower-end solutions to specifically address this growing segment of the market.
Figure 170: Landscape of Lower-End Chipsets Recently Announced Vendor MediaTek ST-Ericsson Broadcom Infineon Marvell Chipset MT6516 U6715 BCM21553 XMM™6181 Pantheon PlatformDate of Announcement 11-Feb-09 10-Feb-10 8-Feb-10 15-Feb-10 12-Feb-10 Technology supported EDGE HSDPA HSDPA/HSUPA HSDPA/HSUPA - Smartphone segment - - - $100-$150 $99 Node - - 65nm - - Camera Yes Yes Yes Yes - MP 5 MP 5 MP 8 MP 5 MP - GPS - Yes - Yes - Bluetooth/ Wi-Fi -/ - Yes/Yes -/ - Yes/Yes -/ - Standby time - 720 - - - Operating system - Android Android, WinMo Android Android, WinMo, OthersVideo support - - HVGA - - ARM core - - ARM 11 - ARM 9 Source: Company data, Credit Suisse research
Tiered data pricing. As we discuss later in this report, from an affordability perspective, while having lower-end smartphone price points is seen as important from a handset vendor’s perspective, we acknowledge that the annualized ARPU level still remains a barrier to affordability. In this context, we believe it is reassuring that wireless carriers such as Vodafone, AT&T, and Verizon (covered by Credit Suisse Telecommunication Services analyst Jonathan Chaplin) all seem to acknowledge the need to introduce tiered data pricing. We believe that this move is being driven by the experience of carriers such as AT&T where management has previously noted that 3% of users are accounting for 40% of all traffic.

16 March 2011
IT Hardware 149
Figure 171: Several Industry Vendors Suggest Trends Are Moving to Accommodate Tired Data Pricing Date Company Comments 26-Oct-09 Verizon “We also recently expanded our data pricing plans to include two new lower cost, usage-based options for
customers with feature phones who may not necessarily want to pay for unlimited data" - John Killian, CFO at Verizon.
15-Feb-10 AT&T “Eventually, there needs to be a model that addresses the limited spectrum issue and supports continued growth in mobile broadband usage, innovation and investment” - John Donovan, CTO of AT&T, hinting that the operator may move away from flat-rate "all-you-can-eat" packages.
16-Feb-10 Research in Motion "...Manufacturers had better start building more efficient applications and more efficient services...If we don't start conserving bandwidth, in the next few years we are going to run into a capacity crunch. You are already experiencing the capacity crunch in the US" - Mike Lazaridis, co-CEO of RIM.
17-Feb-10 Ericsson "High speed networks are an enabler... but we must make them easier to manage, and move away from simplistic flat-rate charging" - Hans Vestberg, CEO of Ericsson.
17-Feb-10 China Unicom “In the near future flat-rate will become a common problem for operators, and we’re looking to implement alternative pricing models for mobile broadband” - Lu Yimin, President of China Unicom.
17-Feb-10 KDDI "...present policy of flat-rate data tariffs is a big headache. However, implementing multiple-level data pricing for business users has proven to be very complex..." - Tadashi Onodera, Chairman of KDDI.
17-Feb-10 TeliaSonera "Telecom operators will need to adopt variable pricing models for mobile data as network traffic rises and capacity gets strained" - Kenneth Karlberg, Head of Mobility Services at TeliaSonera.
17-Feb-10 Alcatel-Lucent "...the industry must begin to move away from the ‘all-you-can-eat’ pricing model that has allowed the huge growth in mobile data" - Ben Verwaayen, CEO of Alcatel-Lucent.
25-Oct-10 TeliaSonera "And I am convinced that we will not have flat rates; we will have some sort of variable pay. And a flat rate, I think, is only important when you start this kind of service. So if you would start in Eurasia with this in a big time, I wouldn't be surprised at all if you went in the flat rate for 12 months or 18 months" - Lars Nyberg, President & CEO of TeliaSonera.
27-Oct-10 Sprint "But again, there's a lot of increased data usage and we want to make sure that we're competitive and effective out there in the marketplace. So I will not rule out tiered data pricing" - Dan Hesse, CEO of Sprint.
28-Oct-10 NTT Docomo "So maybe for LTE customers, like AT&T did, maybe we can actually consider another tiered program" - Kazuto Tsubouchi, CFO at NTT DoCoMo.
04-Nov-10 Deutsche Telekom "We have introduced new mobile data plans in Germany and in the US, embracing tiered data pricing. 53% of all handsets sold in Germany in Q3 were smart phones. Remember, that was also one of our strategic objectives, to have more customers use smart phones and tablets and so forth" - Rene Obermann, Chairman & CEO of Deutsche Telekom.
09-Nov-10 Vodafone "...we have been followed nearly in all the markets but one in Europe for the time being, which is Netherland where we are still the only one to have really tiered pricing. And we expect, let's say, the other providers to follow, because we believe that it's the right move to implement" - Michel Combes, CEO of Europe at Vodafone.
11-Nov-10 Telefonica "...we've started implementing the tiered data pricing from the first of Oct. The good news is, as we expected, customers' usage pattern has continued to increase, so more and more users are actually moving into the band where we think there will be excess charges to pay" - Matthew Key, Head of Europe at Telefonica.
26-Jan-11 KPN “And, at the moment we launched the iPhone, we took the opportunity to go to tiered pricing; so, from flat fees to tiered pricing, which means volume-based pricing. It has been well taken by the market. And, in the coming two quarters, we will change all our data subscriptions to tiered pricing and to volume-based pricing” - Baptiest Coopmans, Managing Director Netherlands at KPN.
28-Jan-11 NTT DoCoMo "Another service is called the new two-tiered flat-rate service called Pake-hodai double 2. The upper limit will be the same. However, compared against the grand scheme, the number of packets allowed until you reach the upper limit will be much more. So, therefore, people who do not reach the upper limit that soon will find this new two-tiered flat-rate service much more reasonable" - Ryuji Yamada, President and CEO of NTT DoCoMo.
03-Feb-11 Vodafone "By the end of December, we had launched our tiered data pricing plans, which we illustrated in November, in eight European markets, and by the end of this quarter, we will have launched in every one of our markets" - Vittorio Colao, CEO of Vodafone Group.
03-Feb-11 TeliaSonera "Well, first of all, you know we have taken a very strong position that you can't have flat rate in mobile data. You have to have a correlation between the volume in the network and the price you pay for that volume" - Lars Nyberg, President & CEO of TeliaSonera.
08-Feb-11 Telenor "All you can eat, I think you have to add the fair usage policy attached to that. And it's very clear that the all-you-can-eat principle, we are of the opinion that that will potentially create call structures which will be very difficult to cover into the future. So the attachment of fair usage policy is very visible in all our subscriptions in for the time being" - Jon Fredrik Baksaas, President and CEO at Telenor.
10-Feb-11 Sprint "But given the usage characteristics, the changes in that that are taking place at a fairly rapid rate in the market, as well as competitive price moves, we may make a change sometime in the future. But we actually like the simplicity of the rate card that we currently have" - Dan Hesse, CEO of Sprint Nextel.
01-Mar-11 Verizon "But I think everybody would know that that is not a long-term strategy. That we are going to move to a tiered price [level]. So we will probably do that probably in the mid-summer timeframe, somewhere in that perspective" - Fran Shammo, CFO and EVP at Verizon.
Source: Company data, Credit Suisse research

16 March 2011
IT Hardware 150
Subsidized device pricing also suggests adoption at the lower end. As is the case with tiered data pricing, we believe carriers are also trying to drive smartphone adoption by increasing subsidies for lower-end devices. While tiered data pricing will clearly lower the TCO of smartphones, equally it has become quite affordable with carriers offering subsidies towards these devices. For example, Vodafone is currently offering smartphones from Nokia, RIM and HTC on 2-year contracts for some $387 per year as shown in Figure 172.
Figure 172: Lowest TCO Smartphones at Verizon, AT&T, and Vodafone Vodafone (UK) Verizon (US) AT&T (US) Lowest-priced smartphones
Device 1 Nokia C6 RIM Curve 9330 Palm Pixi Plus Price $0 $0 $0
Device 2 RIM Curve 8520 Palm Pixi Plus RIM Curve 8520 Price $0 $0 $30
Device 3 HTC Wildfire Motorola Citrus iPhone 3GS (8GB) Price $0 $0 $49
Average low-end price $0 $0 $26 Monthly ARPU
Data (allowance) 250 MB Unlimited 200 MB Data (pricing) Included in voice $30 $15 Messaging (low-end plan) Included in voice $5 $5 Voice (minutes) 300 450 450 Voice (low-end plan) $32 $40 $40
Annual TCO $387 $900 $733 Source: Company data, Credit Suisse research.

16 March 2011
IT Hardware 151
Smartphones—Winners and Losers With such a positive view on smartphone market growth as we have discussed in the preceding sections, we also believe this opportunity has not gone unnoticed and has been already attracting a raft of new competitors. This market is fast on its way to becoming a 1bn unit market and $180bn in value terms. This is attracting more competitors from adjacent technology segments, as smartphones provide a computing experience that to a degree overlaps with PCs, netbooks, and notebooks. Chipset companies such as Qualcomm can deliver scale to all OEMs, while reliable high quality operating systems such as Android make software expertise less of a barrier; these advantages serve to accelerate entry into the industry.
Against this backdrop, the key issue then becomes what it takes to win the smartphone market. A rising market will lift all players, but what investors really care about is who will dominate. In addition, market share gains should no longer be viewed in the traditional sense of simply higher volumes, or by hardware design and technology alone. Now the ability to monetize services needs to be addressed. Also, is a vertically integrated business model such as Apple/RIM more or less viable versus the horizontal considerations proposed by Android? The question then remains, what is needed to succeed in this ‘new smartphone world’? We believe that for smartphone manufacturers, seven key attributes are required, as shown in Figure 173. We then rank each vendor with a score out of 10 for each metric while trying to remain as objective as possible. We also recognize that many vendors are currently in a state of flux, with continually evolving strategies and, as such, we have sought to try to quantify the maximum scope for improvement. In the end, our conclusions shape our view as to how each vendor is likely to be placed going forward, and which vendors are most likely to take revenue share within the smartphone and related services industry. Ultimately, this will provide us a guide for areas of profitability. We arrive at the following important conclusions for each vendor in the industry.
■ Apple (7.8/10) remains the strongest vendor for now although scaling abilities remains to be seen. Three years after the first iPhone launch, we believe that few handset vendors come close to the quality of its hardware, software, and services. In particular, we believe the success of iTunes and its apps store are examples of the potential of new initiatives like iBooks and iAd; their growing ecosystem of services will reinforce consumer attraction and developer loyalty. The iPad and its success only reinforce the loyalty of Apple users and will likely serve to keep Apple’s market share stable in the handset space; this stability is atypical in the handset space. All of these factors are key to our determination of Apple’s first place ranking in our scorecard of smartphone vendors. We believe that after capturing 16% smartphone share in 2010, the vendor can expand to 19%/20% in 2011/2012 aided by distribution led growth in both NA and international markets. The key issue facing its smartphone business on a standalone basis is whether a lower end product is necessary at some point to ensure that the company is not to be completely eclipsed by the growing size of Android.
■ Samsung (6.3/10) ranks second on our scorecard. To be clear, this does not mean that we believe Samsung will reach the number two position within this segment, however it does signify a dramatic improvement in its smartphone related prospects. It should capture significant volume share within the industry. Indeed despite being late to recognizing the importance of the smartphone segment, the company has now increased development efforts around Android (although it is still preserving some efforts for Bada and Windows Phone 7 devices). Along with its strong carrier distribution and brand, the factors lead us to believe that Samsung can achieve smartphone share of close to 15% by 2012. The major obstacle facing them is a need for differentiation from other Android vendors; if they don’t overcome this, they may find themselves becoming yet another commoditized hardware company.

16 March 2011
IT Hardware 152
■ RIM (5.9/10) is in third position in smartphones. RIM has started suffering smartphone share weakness over the last 12 months, with share deteriorating to 16% in 2010 compared to 20% in 2009. While we continue to believe that its NA smartphone share of 30% will further decline and that its enterprise share of 64% may also see some pressure. We believe these share losses can be largely offset by share gains in international markets. In addition, while touch-screen devices from RIM have failed to inspire consumers, we believe that the QNX software (currently used in its tablet device) could give some optionality for the business in the long term, especially at the high end of the smartphone market. Armed with an increasingly consumer-focused portfolio and a robust distribution platform, our scorecard for RIM ranks the company third with a score of 59%. We expect RIM’s unit market share to remain at 15%/16% in 2011/2012 and revenue share of around 15%.
■ Nokia (5.8/10) is in a state of flux and risks of disruption are high. One of the main concerns for Nokia in its smartphone business has been its weak software and services offering, which in our view are the most important factors for success. However, given its strength in areas like brand, distribution, IPR, and chipset efficiency, Nokia manages to appear at fourth place in our smartphone scorecard. This has resulted in its smartphone unit share falling from as high as 50% in 2007 to around 30% currently. With the company recently having adopted Windows Phone 7 as its smartphone OS and acknowledging that 2011/2012 will be transition years, we believe its smartphone share will decline further to 20%/19% in 2011/2012 as Apple, RIM, and Android based vendors continue to gain share at Nokia’s expense.
■ Motorola (5.8/10) comes fifth based on ongoing improvements. Within a short space of time, Motorola Mobility has successfully executed in capturing some 5% smartphone share. So far the company has articulated and executed a multi-source chipset strategy along with a software strategy focusing on Android. Based upon its distribution and brand in NA, LatAm and China, we believe the company can sustain a smartphone share of 5-6% in 2011/2012. However, longer term, we are not sure if Motorola Mobility will be able to maintain differentiation on the Android platform despite having attracted over 6mn users on its MOTOBLUR skin.
■ HTC (5.6/10) ranked 6th amongst all vendors. While being a pure smartphone play, and having an early focus on Android, we now see that the company has been addressing some of its issues around distribution and brand. Further, a series of hit products namely Desire, Wildfire and Droid Incredible means that the company can increase its smartphone share to 11% long term, up from 8% in 2010.
■ SEMC (5.5/10), LG (4.4/10) and Palm (4.2/10) are laggards. With SEMC, we believe the company lacks the early mover advantage in terms of moving to platforms such as Android. Similarly with LG, we believe the vendor is still trying to evolve its smartphone strategy with increasing focus on Android (evidence by recent launch of its Optimus smartphones). Although with an improving portfolio in 1H11 and disruption at Nokia, we believe Sony Ericsson and LG can benefit from share gains in the smartphone segment as we assume 5% share for both these vendors in 2011/2012. In spite of our view that webOS remains a strong software platform, we believe that Palm will remain a laggard in this space given its weakness in brand and distribution (carrier relationships).

16 March 2011
IT Hardw
are 153
Figure 173: Credit Suisse Proprietary Smartphone Scorecard—Apple Remains the Leader With Samsung Moving Up the Ladder
Smartphones Weighting Apple Samsung RIM Nokia Motorola HTC SEMC LG Palm Software 30% 7.2 5.5 5.6 5.0 6.5 5.9 6.5 5.9 5.2Services 20% 8.8 5.1 5.6 4.4 6.2 5.4 6.2 5.4 5.4Product Portfiolio 20% 8.0 7.0 6.0 4.5 7.0 7.5 6.0 3.5 4.0Distribution & Supply Chain 10% 9.0 8.3 7.8 8.0 4.5 6.5 3.0 3.5 3.0Brand 10% 9.0 8.0 7.0 10.0 3.0 3.0 3.0 2.0 2.0IPR 5% 5.0 5.0 4.0 8.0 3.5 2.0 5.0 2.0 1.0Chipset efficiency 5% 5.0 6.0 5.0 7.0 5.5 5.0 5.0 5.0 4.0Total score 100% 7.8 6.3 5.9 5.8 5.8 5.6 5.5 4.4 4.2
% score 78% 63% 59% 58% 58% 56% 55% 44% 42%Overall Rank 1 2 3 4 5 6 7 8 9
Unit share (2010) 15.7% 8.6% 16.0% 34.4% 4.6% 8.3% 3.5% 1.9% 0.5%Rank 3 4 2 1 6 5 7 8 9
Value share (2010) 28.6% 6.6% 16.4% 22.0% 5.6% 9.2% 3.7% 1.4% 0.5%Rank 1 5 3 2 6 4 7 8 9
Scorecard methodology: We continue to believe that there are 7 key metrics in smartphone industry. As such, we have ranked the smartphone vendors on each of these metric. In addition, we have weighted each metric depending on the importance to arrive at our score for vendors:
Apple: On our scorecard, Apple maintains its #1 rank with a score of 7.8/10. Apple scores very high on software and services offered along with a strong brand and distribution. However, we believe that the position of the company remain weak on handset hardware IPR space, thus a lower score.
Samsung: On our scorecard, Samsung moves up to #2 position (from #7) previously as the company benefits from its Android OS strategy, strong distribution along with high brand recognition.
RIM: RIM holds on to its #3 position with a score of 5.9/10 as the company has improved its distribution & supply chain. However, RIM continues to suffer from poor IPR position and relatively weak brand compared to brand leaders like Apple, Nokia and Samsung.
Nokia: Nokia drops two place to #4 in our scorecard, mainly due to weak OS and services platform while the company continues to benefit from strong brand, hardware IPR and chipset strengths. In addition, the company suffers from a weak product portfolio.
Motorola: Motorola scores #5 in our smartphone vendor ranking, down from #4. Motorola has strong distribution network in NA but in areas like WE it still is poor; further we believe Motorola’s brand value has deteriorated. Thus, we score the vendor 5.8/10.
HTC: Although HTC has shown good product momentum, the vendor suffers from poor brand image, lack of IPR and modest distribution breadth, and hence we rank it #6 with a score of 5.6/10.
SEMC: SEMC ranks #7 on our scorecard and despite being focussed on Android, the vendor suffers from poor brand image, distribution and IPR position.
LG: LG ranks at #8 on our scorecard and with a weak brand and distribution, although it is working towards improving product portfolio with increased focus on Android.
Palm/HP: Palm scores at the bottom of our range with a score of 4.2/10 which despite the strength around its proprietary webOS, the vendor suffers from poor brand image, distribution and a weak product portfolio.
Source: Company data, Gartner, Credit Suisse estimates

16 March 2011
IT Hardware 154
Software—Core for a Successful Mobile Platform Since the launch of the iPhone in 2007, the smartphone segment of the mobile handset industry has seen a shift in focus, whereby the desirability of a device is driven by the user experience rather than just the design and aesthetics of the hardware. Furthermore, while “what the device can do” clearly has an impact on the user experience, “how it does it” is becoming increasingly more important, with this largely being driven by the underlying software platform used in the device. Unlike the PC market, where there are relatively few operating system platforms today, given that it is still early in the maturation of the smartphone market, there are several software platforms available to hardware OEMs.
Here we believe the success of a particular vendor in the smartphone segment is tied to the software choice the vendor makes. In order to understand the pros and cons of different OS platforms for smartphones and to be as objective as possible in our analysis, we have used a framework to evaluate each platform using the following criteria: i) user interface, ii) web browsing, iii) synchronization, iv) vendor support, and v) carrier economics. This is detailed in Figure 175.
Seven smartphone platforms likely too many in the long-term, but could coexist for several years. While some consolidation of OS’s is likely longer term, we believe that consolidation of operating system platforms is not eminent and we expect the seven smartphone platforms to coexist in the intermediate term. As seen in Figure 174, we expect Android and iOS to be the major gainers of smartphone OS share over 2011/2012, mostly at the expense of Symbian. Longer term, we question the viability of OS’ like Samsung Bada and Qualcomm Brew as the industry consolidates around major smartphone platforms (not dissimilar to what happened in PCs).
Figure 174: Smartphone OS—Android Share Gains Continue Driven by Wide Adoption in %, unless otherwise stated 2008 2009 2010 2011E 2012E Symbian 52.4% 46.9% 37.6% 20.0% 10.4% Android 0.5% 3.9% 22.6% 37.8% 38.2% BlackBerry (RIM) 16.6% 19.9% 16.0% 14.9% 16.0% iOS (iPhone) 8.2% 14.4% 15.7% 18.8% 20.2% Windows Mobile 11.8% 8.7% 4.2% 5.6% 12.4% Linux 7.6% 4.7% 2.2% 1.2% 1.1% webOS 0.0% 0.7% 0.4% 0.4% 0.5% Palm OS 1.8% 0.3% 0.0% 0.0% 0.0% Other OS 1.1% 0.3% 1.2% 1.2% 1.3% Total 100.0% 100.0% 100.0% 100.0% 100.0%
Source: Company data, Gartner, Credit Suisse estimates
Shift between legacy and newer platforms to continue. While aging platforms like Symbian and BlackBerry OS are attempting to transform themselves to enable the features and functionality commonplace today, their success in doing so remains to be seen. In fact, Nokia recently announced its strategy to gradually migrate from Symbian toward Windows Phone 7, which suggests that newer and nimbler operating systems like iOS, Android, and Windows Phone 7 will continue to gain traction (Figure 176). These are likely the future operating systems of the smartphone world. Below, we have ranked the prominent software providers using our proprietary Credit Suisse Mobile Scorecard:

16 March 2011
IT Hardw
are 155
Figure 175: Credit Suisse Proprietary Smartphone OS Scorecard—Apple’s iOS Remains the Leader Closely Followed by Google’s Android Platform
Mobile platform iOS Android W indows Phone 7 BlackBerry OS webOS Symbian Bada Brew MP MeeGo QNXVendor Apple Google Microsoft RIM HP Nokia Samsung Qualcomm Nokia/ Intel RIM
Overall Rank 1 2 3 4 5 6 7 8 NA NAOverall Score 8.0 7.5 5.7 5.6 5.3 4.6 4.3 3.6 NA NA
User interface 9 9 7 6 8 4 5 3 ? ?Browser 9 9 6 4 8 5 5 4 ? ?Synchronization 9 6 6 6 6 5 5 4 ? ?Vendor support 6 9 7 5 2 3 5 3 ? ?Carrier economics 3 3 3 7 2 7 3 3 ? ?Software score 7.2 7.2 5.8 5.6 5.2 4.8 4.6 3.4 ? ?Apps store 10 8 4 3 3 3 3 2 ? ?Music / Video 10 6 5 5 4 5 3 3 ? ?Messaging 7 7 6 9 7 6 6 6 ? ?Navigation 8 10 7 6 7 4 4 4 ? ?Developer friendliness 9 8 6 5 6 4 4 4 ? ?Services score 8.8 7.8 5.6 5.6 5.4 4.4 4.0 3.8 ? ?
Smartphone units (2010) 46.6 67.2 12.4 47.5 1.3 111.6 NA NA NA NA% market share 15.7% 22.6% 4.2% 16.0% 0.4% 37.6% - - - -
Smartphone subs (2010) 64.1 71.0 21.6 57.1 2.0 223.4 NA NA NA NA% market share 13.9% 15.4% 4.7% 12.4% 0.4% 48.4% - - - -
Scorecard methodology: We believe there are five key metrics each for software and services that determine a mobile platform’s long-term installed base of subscribers affording it a higher share of the total mobile internet opportunity. For software these are (1) User interface or UI, (2) Browser, (3) Synchronization, (4) Vendor support, (5) Carrier economics. For Services, these are (1) Apps store, (2) Music/ Video, (3) Messaging, (4) Navigation and (5) Developer friendliness. By scoring platforms on each metric (max of 10 points per each category), we come to a quantitative rank for each (see above) and make following observations:
iOS: On our scorecard, Apple ranks #1 with a score of 80/100 given high scores on ‘ecosystem’ categories, apps store and music/video, further enhanced by the platform’s smooth UI and browsing experience. However, iOS scores low on carrier economics given these devices tend to use a disproportionately high amount of data relative to other platforms.
Android: On our scorecard, Android ranks #2 with a score of 75/100 given a solid UI and browser, which is endorsed by a number of vendors and a strong developer community including Google at the focal point. However, the lagging factor is on services, where the music/video offering continue to lag Apple.
Windows Phone 7 Series: On our scorecard, Windows Phone 7 Series ranks #3 with a score of 57/100 helped by strong vendor support from Nokia. However, given the late 2010 launch of the platform and the still nascent apps/services offerings, we believe the platform will have to prove itself before deserving a higher score.
BlackBerry OS: We rank the BlackBerry OS a close #4 with a score of 56/100, with a lower software score due to poor browser and UI, while on the services side, the poor apps store drags down the score.
webOS: The webOS comes in at #5 with a score of 53/100, given strong scores on UI and browser, being more than offset by lower scores for vendor support driving a lower app store score.
Symbian: On our scorecard, Symbian ranks #6 with a score of 46/100 given below average contributions in most categories.
Bada: We rank Bada #7 with a score of 43/100 owing to little developer traction so far and a clunky navigation experience.
Brew MP: With a score of 36/100 the OS scores #8, due to both poor OS experience and also a poor services portfolio.
Note: All scores are based on a scale of 1 to 10, with 10 being the best, and 1 being the worst score
Source: Company data, Gartner, Credit Suisse estimates

16 March 2011
IT Hardware 156
Figure 176: Current Mobile Operating System Landscape—Apple’s iOS Remains the Leader
Source: Company data, Credit Suisse research
iOS (7.2/10)—Pioneer With Sustainable Advantage
While operating systems on mobile devices have existed for a long time, we would argue that few have done as much as Apple to bring consumer attention to the benefits of having a high quality OS. We would also argue that while many other platforms have continued to close the gap with Apple, the company still continues to differentiate in several ways:
Continuous improvements. As shown in Figure 177, we have seen continuous improvements in software functionality of Apple’s iOS ranging from the introduction of the App store to copy-paste to multitasking. The iOS was already seen as a leading software platform in its own right and the one to emulate in terms of intuitive navigation of menus, ease of set up, and integration of applications, which is largely assisted by its easy synchronization with iTunes. Notable improvements brought about by the most recent iPhone 4.3 include a new JavaScript engine for Safari browser, iTunes home sharing, Personal hotspot support, and enhancements to Airplay functionality. All of these new features enhance the user interface for what was already quite an intuitive software platform.

16 March 2011
IT Hardware 157
Figure 177: Continuous Evolution of Apple's iOS Platform Since June 2007 Means It Has Held Its Leading Position Jun-07 Sep-07 Dec-07 Jul-08iOS v1.0 v1.1 v1.1.3 v2.0
Cover flow for Albums/Songs Photos Calendar SMS Messaging Safari web browser Rich HTML email Google Maps Widgets (Stock, Weather, Calculator,
Calendar)
iTunes Wi-Fi Music store avai lable Custom ring tones for $0.99 Starbucks and Apple iTunes Wi-Fi iTunes
partnershi p Home button doubl e-click shortcut Support for TV out
Google Maps "Locate Me" Mult iple SM Messaging Web Clips features Re-arrangeable widgets and icons Customizable homepages (up to nine) Further content management support Software Development Kit (SDK) Free for iPhone users
Support for Microsoft Exchange Ac tiveSync and Cisco IPsec VPN
Push email funct ionality App Store Support for MobileMe Multiple Calendar support Video orientation expanded YouTube plug-in for Safari
Sep-08 Nov-08 Jun-09 Apr-10iOS v2.1 v2.2 v3.0 v3.2
Genius playlis t c reation Improved iPod funct ionali ty Improved Podcast funct ionali ty
Enhancements to Google Maps Several App Store changes Enhancements to Safari iTunes over EDGE and 3G Improved iPod functionality
Cut, copy and pas te Mult imedia messaging inc luding pictures,
audio, video files MobileMe offers "Find My iPhone" option Shake to shuffle during play i n iPod Appl e push notification services Peer-to-peer connectivity Expanded search capabilities
Introduced with iPad support for landscape home screen 720p HD videos available in YouTube App iBook iAds
Jun-10 Sep-10 Nov-10 Mar-11iOS v4.0 v4.1 v4.2 v4.3
Introduced with iPad iPhone 4 with over 100 new features Mult itasking Folders Mail - unified inbox and threading Enhanced camera and & photo apps
(location) landscape mode Deeper enterprise support iBooks UI customization 5x digital zoom Bing support
Game center TV show rentals ($0.99) iTunes Ping HDR camera on iPhone 4 HD video uploads to YouTube and
MobileMe on iPhone 4 FaceTime calling from favorites
Mainly iPad update Print ing AirPlay (stream audio, video & photo over
Wi-Fi) Mult itasking
New Javascript engine for Safari iTunes Home Sharing Enhancem ents to Airplay Personal hotspot supportChoice of using iPad side swith to either
lock the screen or mute the audio
Source: Company data, Credit Suisse research
Advantages in synchronization. Through iTunes, Apple has set the standard for synchronizing the device. While a PC is required for this, Apple is also enabling the transfer of data from the cloud via its MobileMe service: this enables the synchronization of contacts, emails and calendar functions from the Internet over the air.
Figure 178: Smartphone Share vs. Mobile Web Usage Share
33%
14%
3%
0%
3%
31%
16%
23%
6%
2%1% 1%
25%
42%
0%
5%
10%
15%
20%
25%
30%
35%
40%
45%
Symbian Blackberry WindowsMobile
Palm (webOS) Other Android iPhone OS
Operating System Share (Q410) Mobile Web and App Usage Share Source: Gartner, AdMob, Credit Suisse research
Apple demonstrates that not all browsing experiences are created equal. The statistics speak for themselves regarding Apple’s Safari browser as shown above in Figure 178. In fact, although Apple held only 16% smartphone share in the Q410, the vendor managed to

16 March 2011
IT Hardware 158
have 42% HTML browsing share, significantly ahead of Nokia’s Symbian at 23% despite holding on to a smartphone share of 33%. This proves the point that Apple’s WebKit-based Safari browser has become the smartphone industry standard for Internet browsing.
Android (7.2/10)—Innovative and Growing Platform
The Android platform, which was launched in 2008, has shown significant innovation from the very outset. While the number of iterations of the OS along with the fragmentation of device platforms may cause headache for developers and users, we would argue that on an overall basis, Android is now a close competitor to iOS in terms of functionality and thus we give it a score of 7.2/10 (similar to Apple’s iOS).
Significant improvements since launch. Android OS was launched by Google in September 2008, and since then we have seen at least six iterations (Figure 179) of the software platform with another smartphone version already expected in summer of 2011 (Android 2.4 or ‘Ice Cream’). Some of the notable features that Android offers are:
■ Multitasking. A key differentiating feature of Android OS was the early support for multitasking offered by the platform (starting from v1.0).
■ Flash support. Android has supported flash based applications since v1.5 (launched in April 2009). This is marketed as a key differentiator, as allowing flash based Web content gives the user access to a larger subset of the Internet.
■ Google services integration. Android OS also has had strong integration to Google’s slew of Web services like Gmail, Google maps, Google voice etc along with tight integration with the Android Market for applications.
Figure 179: Android Improvements Since Sep 2008 Have Been Impressive, But Not Yet on Par With iOS Sep-08 Feb-09 Apr-09 Sep-09
v1.0 v1.1 v1.5/ Cupcake v1.6/ Donut Watch/ record videos Upgraded soft keyboard/text prediction
Improved Android Market Universal search Support for CDMA/EVDO, VPNs, text to speech Free turn by turn Google navigation
Oct-09 May-10 Jan-11 Feb-11v2.0/2.1/ Éclair v2.2/ Froyo v2.3/ Gingerbread v3.0/ Honeycomb (for tablets)
Optimized hardware speed Updated UI Improved maps, exchange integration Live wall papers
USB tethering Flash 10.1 Performance optimization Integration of Chrome's V8 JavaScript engine for
browser
Revised UI Extra large screen size Support for NFC Improved copy and paste feature Gyroscope sensor New audio effects
New UI themes (system bar, action bar, customizable homescreens)
Redesigned keyboards Support for tablets New connectivity options (improved Wi-Fi,
keyboard over USB or Bluetooth)
Source: Company data, Credit Suisse research
PC synchronization or waiting for the cloud. Surprisingly the Android platform is one of the only key mobile operating systems which do not provide PC synchronization. This may be due to the fact that Google is focusing on a cloud model for data services. Although the device provides synchronization over the air with Gmail (mails, calendar and contacts), we believe that the lack of a competitive PC suite is currently a disadvantage of the platform, especially when it comes to synchronizing large amounts of media (audio and video).
Windows Phone 7 (5.8/10)—Decent Platform and Nokia Support, But Is It Enough?
After a number of updated versions (Figure 182) of Windows Mobile over the last few years, Microsoft launched its completely revamped smartphone operating system in late 2010, named Windows Phone 7. Many have touted this as Microsoft’s best mobile operating system yet. Overall, we believe this new platform is a significant improvement (Figure 180) compared with its previous Windows Mobile iterations. However, we rank it 5.8/10 given a lack of compatibility with tablets and a user experience which is not impressive (Figure 181) against the likes of iOS and Android. Having secured a partnership with Nokia is a definite positive, but it has yet to prove that it can reap significant market share.

16 March 2011
IT Hardware 159
Figure 180: Windows Phone 7 Shows Vastly Improved UI Figure 181: It Still Breaks No Ground versus Peers
Source: Microsoft Source: Engadget
Decent OS and UI but not breaking any new ground. Windows Phone 7 initially received positive reviews, but compared to iOS and Android, it still is not impressive. In fact, apart from integration of its Xbox Live and Zune services, the overall experience we believe still does not compare to what is being offered by both Apple and Android.
“Windows Phone 7 is the slickest, most impressive version of Windows on a mobile phone that Microsoft has yet produced. But that’s not saying much – and even if the actual quality of the operating system has much to recommend it, it offers little that will revolutionize the very crowded smartphone market” – The Telegraph (11 Oct 2010)
Figure 182: Microsoft Finally Launched Its Completely Revamped OS, WP7 After Years of Iterations on Windows MobileOct-01 Jun-03 Mar-04 May-05 Feb-07
Pocket PC 2002 Mobile 2003 Mobile 2003 SE Mobile 5 Mobile 6 240 x 320 Power PC devices but was
also used for mobile phones enhanced UI with theme support VPN support MSN messenger Window Media Player 8 with streaming Palm OS support Microsoft Reader 2 with DRM support Improved Pocket Outlook
Support for external keyboards Bluetooth support Enhanced Pocket Outlook Pocket Internet Explorer Windows Media Player 9.0 MIDI support for ringtones
VGA support for 640 x 480, 176 x 220, 480 x 480 screen resolution
Landscape switching for pocket PCs WiFi support
Office Mobile with mobile PowerPoint, graphing in Excel and table/graphics for Word Mobile
Windows Media Player 10 Caller ID with photo Enhanced Bluetooth support GPS management interface QWERTY keyboard support ActiveSync
320 x 320 and 800 x 480 WVGA support
Remote desktop access VoIP support Windows Live for Windows Mobile HTML email support for Outlook
Mobile JavaScript support on Internet
Explorer Mobile Operating System Live Update
Apr-08 May-09 May-05 Feb-10 Oct-10Mobile 6.1 Mobile 6.5 Mobile 6.5.1 Mobile 6.5.3 Phone 7
Redesigned home screen Threaded SMS full page zooming of Internet Explorer Enhanced ActiveSync
New UI Internet Explorer Mobile 6 browser
Improved UI with finger-touch upgrade to icon buttons from text improved threaded SMS
Enhanced finger-friendly UI Support for multi-touch Complete touch support
Upgrade of the entire OS Integration of Xbox Live and Zune
services
Source: Company data, Credit Suisse estimates
Is Nokia’s support enough to drive success? One of the issues with WP7 was the initial lack of smartphone vendor support. With the recent announcement of Nokia moving away from its current Symbian platform to Microsoft, we believe WP7 now has access to the biggest smartphone vendor—Nokia—with around 34% global smartphone share in 2010. With Nokia expected to lose further share (since it faces potential disruption at its low-end) and with WP7 still being only the third best software platform in our view after Apple and Android, Microsoft will need to continue improving the OS.
Lack of compatibility with tablets and lower end smartphones is an issue. While Microsoft will allow handset vendors to differentiate on form factor and some of the hardware specifications, the OS is mainly designed for devices with screen size of 4-6”, which will not be compatible with tablets. Although the company is expected to launch a new version called Windows Mobile/Phone 8 sometime in 2012 (which will be compatible with tablets), we believe the lack of current flexibility with hardware vendors will hurt the adoption of WP7 against competition like Android. In addition, all the current smartphones based on WP7 are based on Qualcomm’s Snapdragon 1GHz processor, which suggests that the platform is not ready for adoption in lower end smartphones; this is an advantage for Android over Windows.

16 March 2011
IT Hardware 160
RIM (5.6/10)—Evolving the BlackBerry OS, Experimenting With QNX Platform
RIM’s software strategy will increasingly evolve in coming years as we believe the company will move towards QNX (currently used in its PlayBook tablet) for both high-end smartphones and tablets. As such, we give it a score of 5.6/10.
Improving with OS 6.0 but not enough in our view. RIM announced a new version of BlackBerry OS called BlackBerry 6 at its Capital Markets Day in March 2010 with Torch 9800 being the first device based on the new platform. The new OS incorporates a number of improvements (Figure 183) such as: the new WebKit browser, support for multi-touch, redesigned UI with fluid navigation and multiple views, better multimedia experience, and threaded messaging. Although these improvements are noteworthy, we still believe that RIM continues to lag behind the competition in software platform given continued improvements at both Apple and Google.
Figure 183: RIM Has Brought Following Improvements On Its BlackBerry OS
OS 4.3 OS 4.5 OS 4.6 Video recording with flash L theme Media enhancements including VoiceNotes
Over the air software upgrades Automatic music playlist Audio-video streaming HTML email support DocsToGo viewing
Wi-Fi enhancements Inline video streaming w/browser application Full screen picture preview Video camera application accessible from camera
iconWeb support CSS 2.1 and AJAC
OS 4.7 OS 5.0 OS 6.0 Over the air software upgrades Fast, responsive, new UI. Easy copy paste improved web browsing and image quality
Faster, polished UI Files Flag emails Option to forward calendar entries Updated Maps apps
Richer browser Multitasking Favorers Multi view home screens Multi touch support for media player
Source: Company data, Credit Suisse research
QNX for tablets and high end smartphones. QNX (which is speculated to be launched in 2H 2011) is expected to be used for 'super high-end smartphones' and tablets. RIM acquired QNX in April 2010 for ~$200mn and we would highlight this is a real-time OS that is optimized for touchscreen devices. While currently being used only for the tablet market, we increasingly believe that the vendor will offer this OS for higher end smartphones, as the company had highlighted at CES in January 2011. (See Figure 184 and Figure 185.)
Figure 184: PlayBook Screenshots Indicate That.... Figure 185: ...QNX Could Offer Significant UI Improvements
Source: Research in Motion Source: Research in Motion
QNX is a real-time OS with a low foot print, along with low latency capabilities. The OS has been used for a long time in the industry (especially telecom industry, biomedical, etc). Another advantage of this OS, from RIM’s perspective, will be that developing apps for this platform can be done with many common development languages (mostly C and derivatives) which in our view should speed up the apps development for QNX platform.

16 March 2011
IT Hardware 161
BlackBerry OS for the mid and low-end? We believe that going forward, the existing BlackBerry OS will address the mass smartphone market (midend and low-end devices) and support social media applications including BlackBerry Messenger (the company has 56mn global subscribers as of last quarter). Note that we currently assume that RIM's global smartphone share stabilizes at around 15-16% through 2011/2012 taking into account no high-end recovery (in particular, for NA we expect RIM’s share to decline to 21% in 2011 from 51%/30% in 2009/2010).
webOS / Hewlett-Packard (5.2/10)—Good Platform But Issues With Carrier Support
Being a relatively new software platform that was written specifically by Palm for smartphone features and functionalities available today, webOS is one of the leading software platforms from a functionality point of view. We believe that the OS is capable of offering a user experience that is comparable to Apple or Android in many ways. It contains features (Figure 186) such as: ease of setup and use, multitasking, universal search (beyond just content on the device), a higher level of integration of the email/layered calendar/messaging functions (as well as between content stored on and off the device), and more intuitive notifications.
Figure 186: webOS Has Seen a Number of Iterations Since Its Launch in Mid-2009 Jun-09 Jun-09 Jun-09 Jul-091.0.2 1.0.3 1.0.4 1.1.0
Added Clock app Bug fix in email, calendar, and other apps Faster return to capture mode when taking pictures
Improved Google calendar/contacts sync Improved power management Non-SSL exchange active sync support Miscellaneous updates for email/phone and other
apps
Security fix on Email/System/Web Added NFL mobile Live Improve photo app Improve time zone support Facebook contact sync Improve Google contact sync Improve email connectivity Remote wipe Emoticons imp messaging Bug fix Web UI improvements
Oct-09 Nov-09 Dec-09 Jan-101.2.1 1.3.1 1.3.5 1.3.5.1
Amazon mp3 down load over carrier network Reinstall purchase apps for free Web browser bookmarkers backed up Bluetooth improvements Calendar update Contacts improvements Email copy and paste Improved music playback Photo app now supports JPG, BMP, PNG format Keyword search Web and security updates
Improved back up Yahoo integration for calendar, contacts & messaging Select all/copy all Widescreen video (without cropping) Security update
Multiple app simultaneous download and download in the background
Time display on screen lock Able to download future updates on 2Q Supports animated GIFs Security update
Calendar Exchange sync fixed
Feb-10 Mar-10 Aug-10 Oct-101.4.0 1.4.1.1 1.4.5 2 (HP webOS)
Improve amazon MP3 downloads Calendar updates and UI interface Record, edit, and upload video Sort emails Email/dial from email/IM dialog Improved hotmail, yahoo and gmail Improved app speeds Battery life improvements
Fixed camera app Bug fix in camera app, contracts, doc view, pdf view,
volume slider, video upload Change NFL tv to Sprints sports
Fix and enhance plug-in development kit Improved website text entry Security update
Multitasking with Stacks Just Type- universal search Improved HTML5 and Java support Hybrid PDK/SKD app fully supported Exhibition, allows apps to display while on
Touchstone Synergy, integrate exchange, gmail, yahoo, linkedin,
facebook, aol + and open to third party developers
Source: Company data, Credit Suisse research
Browser is useful but limited proof. The browser is just as easy to use as the iPhone’s (not surprisingly, it is built on the same WebKit used in Safari). It also offers multi-touch capabilities that allow for dynamic browsing such as pinch-and-zoom and scrolling, which, in our opinion, are much easier than using scroll bars and double tapping.
Synchronization is fine. Integrating contacts and linking them together is one of the many benefits of webOS’s Synergy. In fact ,upon the first login to Gmail, Yahoo!, and Facebook, all contacts in the respective services are automatically loaded (with all relevant details) into the device’s contacts list (this includes picture profiles of friends). This makes it easy to get up and running relatively quickly. Additionally, if the phone crashes or has a catastrophic moment, all data is synced daily to a server and can easily be reloaded without interruption of service. This, we note, is the benefit of a “cloud-based” storage mode, which we find the majority of other platforms still do not support in their current iterations.

16 March 2011
IT Hardware 162
Symbian (4.8/10)—Nokia Finally Giving Up On Its OS to Go Microsoft’s Way
Symbian still holds the dominant smartphone OS market share with a 38% share in 2010. Nokia shipped over 100mn smartphones last year. However, as shown in Figure 187, we expect its market share to drastically erode as Nokia moves towards the Windows Phone platform going forward. Although Nokia has noted that it will continue to have some refresh and over the air updates on existing Symbian (v3) OS, we believe the vendor will focus on its new software platform resulting in severe declines for Symbian share over 2011/2012. Even looking at the recent version of Symbian OS launched with new Nokia devices like N8, C6 and C7, we rate the OS 4.8/10 as it continues to offer poor UI and a weak services offering.
Figure 187: Smartphone OS—Android Share Gains to Continue by Wide Adoption in %, unless otherwise stated 2008 2009 2010 2011E 2012E Symbian 52.4% 46.9% 37.6% 20.0% 10.4% Android 0.5% 3.9% 22.6% 37.8% 38.2% BlackBerry (RIM) 16.6% 19.9% 16.0% 14.9% 16.0% iOS (iPhone) 8.2% 14.4% 15.7% 18.8% 20.2% Windows Mobile 11.8% 8.7% 4.2% 5.6% 12.4% Linux 7.6% 4.7% 2.2% 1.2% 1.1% webOS 0.0% 0.7% 0.4% 0.4% 0.5% Palm OS 1.8% 0.3% 0.0% 0.0% 0.0% Other OS 1.1% 0.3% 1.2% 1.2% 1.3% Total 100.0% 100.0% 100.0% 100.0% 100.0%
Source: Company data, Gartner, Credit Suisse estimates
Over the past two years, Nokia has acknowledged that previous versions of Symbian have not been competitive, but S^3 (and Symbian^4, which has been now rolled into S^3) along with MeeGo would make the necessary improvements. However, the key issue for us was whether these improvements prove competitive versus rival platforms (such as Apple iOS 4.2 and Android 2.3) today and in the future; we find their roadmap a point of concern.
UI remains poor in spite of improvements. Our impression of the Symbian operating system is that the UI has not fundamentally changed from the S60 interface despite support for capacitive touchscreen and multiple homepages. In addition, the Web browsing experience on the platform still remains a work in progress, and will hurt the overall customer experience.
No major improvements or roadmap since launch of Symbian^3. Since the launch of N8, which was the first Symbian^3 device, in late Q310 (after being delayed thrice in 2010), Nokia has not confirmed or introduced any new software improvements in the OS. On the other hand, peers have introduced newer versions of their operating systems, including: iOS (which launched v4.2), Android (v2.2 and v2.3) and RIM (QNX platform for the tablet device). We believe this demonstrates that in spite of the company promising ongoing improvements and updates, newer versions of the Symbian platform will continue to lag behind competing platforms.

16 March 2011
IT Hardware 163
Services—Remains the Key to Smartphone Success We believe that services remain one of the key differentiating factors in the smartphone segment. It is a major revenue growth area for incumbents and new entrants. In addition to creating differentiation and device stickiness, we believe there is an increasing focus from handset vendors to improve their services offering. However, we also highlight that services are very closely linked to the quality of vendors’ software platform(s). In this section, we seek to answer three key questions on the services business:
What Is the Benefit of a Successful Mobile Internet Services Strategy?
Apart from the services market being an incremental revenue opportunity for handset vendors, we believe another key reason for increasing focus towards services business is to offset the risks associated with hardware commoditization. After all, if we believe that there will be 1.92bn smartphone subscribers by 2015 and if each of them are prepared to spend some $60 per annum (assuming only $5 per month) on services, the revenue opportunity involved in services can be significant. Not to mention the incremental opportunities in m-commerce and mobile advertising. We also recognize that the mobile Internet services opportunity is being pursued by all companies including PC, software, mobile device and mobile carriers. What is clear is that traditional players cannot afford to ignore this sector or we believe they will be relegated to an ultimately commoditized part of the industry.
Figure 188: ASPs for Industry (ex Apple) Continue to Fall in US$, unless otherwise stated
Figure 189: As Have Industry Gross Margins in %, unless otherwise stated
225
250
275
300
325
350
375
1Q07
2Q07
3Q07
4Q07
1Q08
2Q08
3Q08
4Q08
1Q09
2Q09
3Q09
4Q09
Q11
0
Q21
0
Q31
0
Q41
0
ASP
($)
Weighted average Weighted average ex-Apple
30%
33%
35%
38%
40%
43%
45%1Q
07
2Q07
3Q07
4Q07
1Q08
2Q08
3Q08
4Q08
1Q09
2Q09
3Q09
4Q09
Q11
0
Q21
0
Q31
0
Q41
0
Gro
ss M
argi
n (%
)
Weighted average Weighted average ex-Apple
Source: Company data, Credit Suisse estimates Source: Company data, Credit Suisse estimates
ASPs under pressure as competition continue to intensify. Pricing in the smartphone segment continues to remain under pressure as traditional handset vendors (like Motorola, Samsung, Sony Ericsson) along with new entrants (like Dell, Acer, Lenovo, ZTE, Huawei) increase their focus on gaining share in the smartphone segment. In fact, we estimate that industry ASPs (excluding Apple) have declined to around $270 in Q410 from a level of $343 in Q107. (See Figure 188.)
Hardware GMs also fading. In addition, we also believe that GMs in the smartphone segment (excluding Apple) have already declined to 32% in Q410 compared to 39% in Q108 and 34% in Q109 (Figure 189) given the mix shift towards lower price point and increasing competition. Going forward, we believe that GMs here will stabilize around the 30% level, which is the level seen for overall handset industry. Here we would highlight that vendors with strong software and services offering (like Apple and RIM) have enjoyed GMs significantly higher than industry average.
What Does It Take to Succeed? Three Key Factors
The services strategies of all vendors continue to evolve. For a player to succeed with its services strategy, strong diversified and differentiated content will be required, which then will facilitate strong distribution. By content, we have not just looked at the quality of the

16 March 2011
IT Hardware 164
application stores (which are indeed important), but we also believe the music, video and alternative content should be considered. Second, we believe the installed base is crucial in attracting developers (as well as the quality of the software platform) as discussed in the previous section. Third, we do believe that carrier cooperation is preferable for services uptake as it is the carrier to some extent, who in the end controls the relationship with the end user.
Figure 190: Credit Suisse Services Scorecard—Similar to Software, Apple Tops the Charts in Services Also Mobile Platform iOS Android BlackBerry Windows
Phone 7 webOS Symbian Bada Brew MP
Vendor Apple Google RIM Microsoft HP Nokia Samsung Qualcomm Apps store 10.0 8.0 3.0 4.0 3.0 3.0 3.0 2.0 Music / Video 10.0 6.0 5.0 5.0 4.0 5.0 3.0 3.0 Messaging 7.0 7.0 9.0 6.0 7.0 6.0 6.0 6.0 Navigation 8.0 10.0 6.0 7.0 7.0 4.0 4.0 4.0 Developer friendliness 9.0 8.0 5.0 6.0 6.0 4.0 4.0 4.0
Total Services scorecard 8.8 7.8 5.6 5.6 5.4 4.4 4.0 3.8
Source: Credit Suisse research
How Do the Different Players Compare?
As noted above, judging a services strategy is difficult given the sheer number of players (from handset to software vendors), and the proliferation of business models. To arrive at our rankings for different players, as shown in Figure 190, we have tried to be as subjective as possible by looking at a number of factors like content (apps, music and video) both in terms of variety and quantity, installed base of users, and carrier partnerships.

16 March 2011
IT Hardware 165
Figure 191: Apps Stores— Apple Leads the Pack in Mobile Applications with Strong Developer Support Details on leading mobile application stores from handset vendors, mobile operators, software vendors and independent players Vendor Launched OS supported Developer
revenue share# of apps Billing system
Handset vendor Apple App Store Jul-08 iOS 70% >325,000 iTunes/Credit Card RIM BlackBerry App World Apr-09 BlackBerry OS 70% 17,650 PayPal, Credit Card, Operator billingNokia Ovi Store May-09 Symbian, Maemo, Java 70% >30,000 Credit Card, Operator billing Samsung Apps Store Sep-09 Bada, WinMo 70% 3,200 Credit Card, PayPal Motorola SHOP4APPS Jan-10 Android OS 70% NA Sony Ericsson PlayNow Arena Aug-09 Symbian, WinMo, Java 70% 1,265 Credit Card, Premium SMS LG Application Store Jul-09 WinMo, Java 80% 2,250 Credit Card Palm App Catalog Jun-09 Palm webOS 70% 5,200 Credit card Software vendor Google Android Market Oct-08 Android OS 70% ~200,000 Google Checkout, Operator billing Microsoft Windows Marketplace Oct-09 WinMo 70% 2,250 Credit Card, Operator billing Windows Phone Marketplace Nov-10 Windows Phone OS 70% 9,000 Credit Card, Operator billing Operator China Mobile (Mobile Market) Aug-09 Symbian, WinMo, Ophone 70% 48,250 Operator billing Vodafone 360 Sep-09 Widgets 70% 8,500 Operator billing SK Telecom (T Store) Sep-09 NA 70% 6,500 Operator billing AT&T AppCenter Jan-10 BlackBerry OS, WinMo, Java 70% 3,750 Operator billing Verizon VCast Oct-09 Android, BlackBerry, BREW,
WinMo 70% NA Operator billing
Orange Application Shop Dec-09 Android, BlackBerry, Symbian, WinMo
70% 5,000 Operator billing
Bharti Airtel App Central Feb-10 Java NA 1,250 Operator billing Others Ericsson eStore Feb-10 Java 70% 30,000 Credit Card, Operator billing Handango Android, BlackBerry, Symbian,
WinMo, Palm webOS 60% 6,600 Credit Card, PayPal
Mobango Dec-04 Android, BlackBerry, Symbian, WinMo, Palm webOS
NA 44,900 Credit card
Source: Company data, Credit Suisse research
Figure 192: Details on Music Stores Used by Handset and Software Vendors Vendor OS support Songs (mn) Labels signed Nokia Music Store Symbian 11.0 Universal, EMI, Sony, Warner, The Orchard, Beggars
Group, IODA, the Ministry of Sound, PIAS, Pinnacle Apple iTunes Store iOS 14.0 EMI, Universal, Warner, Sony and over 2,000 Independent
labels Sony Ericsson PlayNow Android, Symbian 5.0 Sony, Warner, EMI, the Orchard, IODA, The PocetGroup,
Hungama, X5 Music, Bonnier Amigo, Vidzone Microsoft Zune Windows Phone 7 11.0 Universal, EMI, Sony, Warner, Independent labels RIM (tie-up with 7Digital) BlackBerry OS 11.0 Universal, EMI, Sony, Warner LG MusicStation Max (tie-up with Omnifone) Android, WinMo 1.5 Universal, EMI, Sony, Warner Amazon MP3 Android, WinMo, Linux 13.0 Universal, EMI, Sony, Warner, Independent labels
Source: Company data, Credit Suisse research
Apple (8.8/10)—Leading the Way When It Comes to Services
As is the case in software, Apple is the clear leader when it comes to services offerings with diverse content in mobile applications, music, video and TV shows, and also its tight integration of all these services with its iTunes store.

16 March 2011
IT Hardware 166
App store—over 325K apps, 10bn downloads and still counting. With over 325,000 apps on Apple App Store for mobile devices (this includes around 65K apps for iPad), Apple seems to be the clear leader in terms of mobile applications content with the nearest competitor Android at around 200,000 apps. The success of its apps store is also evidenced by the fact that total downloads on its store crossed the 10bn mark recently (compared to 4bn in April 2010 and 5bn in June 2010).
Figure 193: Apple’s App Store Now Has Over 325K Mobile Applications
0
50,000
100,000
150,000
200,000
250,000
300,000
350,000
400,000
May
-08
Jul-0
8
Sep-
08
Nov
-08
Jan-
09
Mar
-09
May
-09
Jul-0
9
Sep-
09
Nov
-09
Jan-
10
Mar
-10
May
-10
Jul-1
0
Sep-
10
Nov
-10
Jan-
11
Tota
l num
ber o
f app
s
Source: Company data, Credit Suisse research
Music/Video—again the best content in the market. Looking at the number of songs available on the store, we see that the iTunes Store has over 14mn songs from major record labels like EMI, Universal, Warner, Sony BMG, and over 2,000 independent labels. This 14mn number is more than other players like Nokia and Amazon, as shown in Figure 192. The impact of this strong music catalogue is evident from the fact that Apple reached the 8bn mark for downloaded songs in July 2009, making it the largest legal music retailer worldwide. In addition, the company has been partnering with a number of film studios for movie and TV show content; this is facilitating their global expansion as can be seen in Figure 194. In fact, the company recently noted that iTunes users are currently renting and purchasing over 400,000 TV episodes and 150,000 movies per day.

16 March 2011
IT Hardware 167
Figure 194: Apple Has Been Continuously Partnering With Film Studios to Add Video Content List of film studios and network corporations Apple has tied up with for movies and TV shows Date Country Details 11-Nov-10 Japan Over 1,000 movies to rent or buy from major film studios including 20th Century Fox, Paramount Pictures, The Walt
Disney Studios to name a few along with top Japanese studios 30-Apr-10 Ireland /
France Movies from film studios including 20th Century Fox, Metro-Goldwyn-Mayer Studios Inc, Paramount Pictures, Sony Pictures Home Entertainment, Universal Studios, The Walt Disney Company and Warner Bros. Entertainment, as well as European studios including E1 Entertainment, Lionsgate UK and Optimum Releasing available on the iTunes Store
04-Aug-09 Mexico iTunes Store launched in Mexico with both music (most tracks priced at 12 pesos) and videos (videos priced at 24 pesos) 16-Apr-09 Germany Movies from film studios including Paramount Pictures, Warner Bros. Pictures, MGM Studios, The Walt Disney Studios,
Sony Pictures Television and independents including Universum and Shorts International to be available on iTunes store at a price of €13.99 for new releases, €9.99 for recent releases and €7.99 for catalog title purchases
16-Oct-08 US Four major networks ABC, CBS, FOX and NBC to offer HD programs on iTunes store at a price of $2.99 per episode 09-Sep-08 US Programs from NBC Universal to become available again on iTunes store at a price of $2.99 per episode and $0.99 for
select library content 14-Aug-08 Australia
/ NZ Movies from major film studios including 20th Century Fox, The Walt Disney Studios, Paramount Pictures, Warner Bros. Entertainment, MGM, Sony Pictures Television International and Lionsgate at a price of A$24.99 for new releases, A$17.99 for recent releases and A$9.99 for catalog title purchases. iTunes movies in New Zealand start at NZ$24.99 for new releases, NZ$17.99 for recent releases and NZ$9.99 for catalog title purchases
25-Jun-08 Australia TV programming from Australia's top networks including Australian Broadcasting Corporation, Seven Network and Nine Network, along with US-produced programs from The Walt Disney Company's ABC Studios, Disney Channel and MTV Networks at a price of A$2.99 per episode
04-Jun-08 Canada Movies from 20th Century Fox, The Walt Disney Studios, Warner Bros, Paramount Pictures, Sony Pictures Television International, Metro-Goldwyn-Mayer Studios (MGM), Maple Pictures and Lionsgate with new releases priced at CAN$19.99 and library titles at CAN$14.99
04-Jun-08 UK Movies from 20th Century Fox, The Walt Disney Studios, Warner Bros, Paramount Pictures, Sony Pictures Television International, Metro-Goldwyn-Mayer Studios (MGM) and Lionsgate UK with new releases priced at £10.99 and library titles at £6.99
01-May-08 US New movie releases on the day of DVD release from 20th Century Fox, The Walt Disney Studios, Warner Bros, Paramount Pictures, Universal Studios Home Entertainment, Sony Pictures Entertainment, Lionsgate, Image Entertainment and First Look Studios with new releases priced at US$14.99 and most catalogue titles at US$9.99
02-Apr-08 Germany TV programming from Germany’s top networks, including ProSieben, Sat.1, ZDF Enterprises, Brainpool and US broadcasters ABC Studios and MTV Networks, starting off with over 35 TV shows priced at €1.99 and €2.49 per episode
15-Jan-08 US iTunes Movie Rentals featuring movies from all major movie studios including 20th Century Fox, The Walt Disney Studios, Warner Bros, Paramount, Universal Studios Home Entertainment, Sony Pictures Entertainment, Metro-Goldwyn-Mayer (MGM), Lionsgate and New Line Cinema with pricing at $2.99 for library titles and $3.99 for new releases
15-Jan-08 US 20th Century Fox and Apple announced Digital Copy for iTunes providing customers who purchase a DVD with an additional Digital Copy of the movie
12-Dec-07 Canada TV programming from Canada’s US broadcasters and the National Hockey League (NHL) to become available 29-Aug-07 UK TV programming from ABC Studios, Disney Channel, MTV, Nickelodeon and Paramount Comedy to become available 20-Jun-07 Global iPhone users will be able to access YouTube on their iPhones 30-May-07 Global Apple to bring content from YouTube to Apple TV 30-May-07 US Apple announced the launch of iTunes U featuring free content such as course lectures, language lessons, lab
demonstrations, sports highlights and campus tours provided by top US colleges 11-Apr-07 US MGM and Apple announce that MGM is now offering titles from its catalogue of feature films for purchase and download
on the iTunes Store 12-Feb-07 US Lionsgate and Apple announce that movies will be available for purchase/download on iTunes Store 09-Aug-06 US Television programming from A&E Network to be available for purchase and download on the iTunes Store for US$1.99
per episode 01-Aug-06 US Turner Broadcasting System announce that programming from CNN, Adult Swim and Cartoon Network is now available
for purchase and download on the iTunes store 27-Jul-06 US E! Entertainment and Apple announce that programs from E! Entertainment Television are available on iTunes. 25-Jul-06 US Warner Bros Home Entertainment Group and Apple announce programming to be available for purchase and download on
the iTunes Music Store for US$1.99 per episode 29-Jun-06 US MTV Networks and Apple announce that television programming from Spike TV, Nick at Nite, TV Land, Logo, MTV and
The N is available on the iTunes Music Store 08-Jun-06 US CBS Corporation and Apple announce that programming is available on iTunes Music Store 09-May-06 US Fox Entertainment Group and Apple announce television programming from FOX, FX, SPEED, FUEL TV and 20th
Century Fox Television library is now available for purchase on the iTunes Music Store 07-Feb-06 US CBS Corporation’s Showtime Networks and Apple announce that SHOWTIME is available on iTunes music store 26-Jan-06 US MTV Networks and Apple announce that TV programming from MTV, MTV2, COMEDY CENTRAL, Nickelodeon and The
N is now available for purchase and download on the iTunes Music Store Source: Company data, Credit Suisse research

16 March 2011
IT Hardware 168
iBooks—official book reader. Apple’s full integration of iBookstore, with over 150,000 books, provides users with a continuous reading experience across devices based on its iOS platform. The company also offers functionalities like synchronization of pages, voice-over and bookmarks to other devices (where the user may have been reading the same book and stopped midway through). Apple recently noted that 100mn iBooks have been downloaded so far.
iAd service—looking for advertising revenue. With this service, Apple allows advertisers to effectively place ads that function as fully-functional apps within another app. Should a user click the ad, it then opens the app for the ad and a variety of features are available, including games, movies, or app purchases. Apple shares 60% of these revenues with developers, which we note is less than the 70% shared for purchase of apps.
Installed base still smaller compared with others. Given that Apple’s current suite of music, video, and application services is available on the iTunes store, we have assumed Apple’s installed base to be the number of iTunes users (around 200mn as per company’s estimates). Although this installed base is relatively small compared with other players, we believe this to remain quite sticky for Apple given the strong software platform, increasing apps content on the device, and high brand recognition.
Limited upside to the carrier from Apple’s App Store. One fundamental challenge we believe that Apple faces is the announcement made by RIM and Nokia of their intention to share revenues with mobile carriers; Apple, in contrast, has continued with its strategy of not sharing revenue with carriers. Furthermore, with the option of seamless synchronization with the PC, it is possible that at least part of the data traffic may avoid the networks of wireless carriers.
Google/Android (7.8/10)—Strong Offering, But Carrier Friendliness Disappearing?
Looking at the breadth of offerings from Google/Android, the vendor has been successful in building a strong presence here. But after the initial excitement during the launch of Android, we believe the carrier friendliness has taken a back seat recently. Given HTC, Samsung and Motorola Mobility have already rolled out a number of devices on the Android platform, we have used these vendors as a proxy to rank Google/Android with a score of 7.8/10.
Applications store—strong competitor to Apple. Since the launch of its apps store, Android Market, Android has already seen a huge surge in the number of applications. The number of applications has risen from 16K in December 2009 to 76K in June 2010 ending the year 2010 with over 200K. (See Figure 195.) In the first two months of 2011, Android has added another 60K apps to its store. In addition, total number of downloads have also exceeded the 3.5bn mark, which makes it the second most successful apps store both in terms of number of apps and downloads after Apple. Games, a highly popular area within Apps, comprise 20% of total apps. (See Figure 196.)

16 March 2011
IT Hardware 169
Figure 195: Android Fast Catching Up with Apple on Apps Figure 196: Games Are Nearly 20% of Total Apps on Android
0
50,000
100,000
150,000
200,000
250,000
300,000
Jul-0
9
Aug
-09
Sep-
09
Oct
-09
Nov
-09
Dec
-09
Jan-
10
Feb-
10
Mar
-10
Apr
-10
May
-10
Jun-
10
Jul-1
0
Aug
-10
Sep-
10
Oct
-10
Nov
-10
Dec
-10
Jan-
11
Feb-
11
Tota
l num
ber o
f app
s
Applications, 82.3%
Games, 17.7%
Source: Androlib, Credit Suisse research Source: Androlib, Credit Suisse research
Still lacking its own music store, but maybe coming in 2011? Surprisingly, Android does not have its own music store yet but instead relies on Amazon’s online store for music content. Although we believe the Amazon music store, with some 13mn songs and partnership with music labels like EMI, Sony and Universal, is on par with Apple’s music store, we still think it means that Android has to rely on others to succeed. This is a disadvantage when compared with competition like Apple or Nokia. There has been much talk recently suggesting that Google is planning its own music store, which might be ready for the next version of Android OS (v2.4), and a summer of 2011 launch.
Wider Google services. Apart from offering typical mobile services like an apps store, music, and messaging, one of the strengths of the Android platform has been its tight integration with a wide range of services offered by Google. This synergy can already be seen in areas of mobile advertising, social networking, blogging, and search through a number of services being launched by Google (either specifically designed or customized to work on mobile devices) over the last 2-3 years. AdMob, Buzz, and Blogger are a few examples.
Figure 197: List of Other Mobile Services Offered by Google / Android Mobile services Date of launch Details Gmail Mar 2004 Free webmail offering a search-oriented interface Google Talk Aug 2005 Free Windows and web-based application for instant messaging and VoIP Blogger Aug 2006 Blog publishing service that allows private or multi-user blogs with time-stamped entries YouTube Oct 2006 Video sharing website allowing users to upload and share videos Google Maps Nov 2007 Web mapping service application for mobile devices Google Voice Mar 2009 Available only to US residents, this service gives calling features like voicemail, call blocking/screening, call
conferencing, international calls AdMob Nov 2009 One of the largest mobile advertising platforms which claims to have more than 40bn mobile banner and text
ads per month Goggles Dec 2009 Beta visual search app allowing users to take a picture and the app will bring up a description of the picture,
a list of businesses nearby etc. Buzz Feb 2010 Social networking and messaging tool to share links, photos, videos, status messages and conversations,
which is integrated with Gmail Source: Company data, Credit Suisse research
Installed base rapidly growing, could be a major advantage for services. We believe that Google’s strategy behind Android would be to create a large installed base of Android devices for ultimate access to the lucrative market for mobile advertising and search. In particular, we believe the most likely approach is that Google will want to target the opportunity as being the search engine of choice on mobile devices that are ‘Android enabled’, thereby driving its potential advertising revenues and business model. With a 60-65% market share in online search, this can be leveraged in what is still a nascent mobile advertising world; this represents considerable upside in additional Internet

16 March 2011
IT Hardware 170
advertising revenues. In fact, we estimate that Android based smartphone subscribers will grow from 70mn in 2010 to 340mn by 2012, and rising from a 15% of smartphone subs base to 35%.
Carrier friendliness missing in spite of carrier alliances. Although there are a number of global carriers which continue to be part of Android’s Open Handset Alliance (OHA) like Vodafone, Telecom Italia, Telefonica, Sprint, KDDI, NTT DoCoMo and China Mobile, we would highlight that Android does not directly share service revenues with carriers at this stage. This suggests that carrier friendliness remains limited at best for the Android platform especially when compared with RIM and Nokia’s strategy.
RIM (5.6/10)—Service Fee Monetizes the Advantage of the NOC
We believe RIM has one of the most effective services business models in the industry. In particular, whereas the true motivations of Nokia and Apple will involve taking an unknown share of potential carrier revenues, RIM has maintained almost a fixed rate structure with carriers and any additional enabling technologies could prove beneficial for carriers.
Unique service fee model. RIM currently has around 56mn BlackBerry subscribers, which are either enterprise (~35%) or consumer users (~65%). For every subscriber using services offered by RIM, the vendor receives a portion of monthly ARPU (paid by the subscriber to the mobile carrier) from the carrier. For enterprise subscriber, this service fee is around $6.50 to $7.00 per month, whereas for consumers, this fee is around $4.00 per month. With an expanding subs base as smartphone adoption continues to increase, we believe that RIM can generate as much as $4bn of revenues in FY12. (See Figure 198.)
Figure 198: RIM Has Been Successful in Monetizing Its Services Offering In US$ millions, unless otherwise stated RIM services business FY09 FY10 FY11E FY12E Subscribers (mn) 24.9 41.6 61.8 89.9 Consumer 11.9 23.7 40.4 64.1 % Consumer 48% 57% 65% 71% Enterprise 12.9 17.9 21.4 25.8 % Enterprise 52% 43% 35% 29% Blended ARPU ($ / month) 6.22 5.52 5.18 4.49 Consumer 4.68 4.06 4.09 3.53 Enterprise 7.36 7.12 6.93 6.59 Services revenue ($ mn) 1,403 2,160 3,184 3,993 Total group revenue ($ mn) 11,065 14,953 19,977 24,643 % of group total 13% 14% 16% 16%
Source: Company data, Credit Suisse estimates
Apps store lacking momentum. Although RIM has made inroads into the apps world, it has not been able to offer any differentiated value proposition versus the competition. Some of the improvements introduced by the company recently have been support for carrier billing, preloaded in all 5.0-plus handsets and expanding availability in terms of countries and language. RIM has around 18,000 applications on its BlackBerry App World currently, and the ecosystem is now averaging around 2mn downloads per day (compared with 1mn back in April 2010), which is an improvement but still does not match levels seen on Apple and Android application stores.
Music and video remains weak. RIM still does not have its own proprietary music or video delivery platform. In fact, it has a tie-up with 7Digital (a digital media delivery company in the UK) which has access to around 11mn music tracks given its tie-up with leading music labels globally. Both music and video, however, still remain an area where we are yet to see a clearly defined strategy from the smartphone vendor.

16 March 2011
IT Hardware 171
Core strength still lies in messaging and corporate segment. We believe that given the company’s strong presence in messaging and especially with an entrenched corporate user base (with potential for more sustainable revenue streams), RIM’s services strategies continue to gain traction. Note that RIM still has around 64% smartphone share in the enterprise segment. Its messaging service, BlackBerry Messenger (BBM), has also helped in driving strong adoption with the company noting that 40-50% of people surveyed in emerging markets acknowledging that BBM was very influential in their purchase decision, with 25% of BBM users accessing the service for around two hours every day.
Platform continues to drive savings for mobile operators. As smartphones are increasingly used to access the Web and email, RIM has consistently held a relative advantage in each of these categories to allow for conserved bandwidth (and hence cost) savings to mobile operators. As per a Rysavy Research report (dated Feb 16, 2010), which we note was sponsored and paid for by RIM, Rysavy estimates that RIM’s (NOC-based) email solution saves operators 32MB per user per month and the browser saves 25MB per user per month. We would note that the results of the analysis for mobile browsing are based on RIM’s new WebKit browser discussed above, and as shown in Figure 200, requires 3x less data transfer. Combining email and browsing, this would imply a total annual savings of over 650MB per user. Given a network of 50mn subs, of which 20% are using smartphones, and where RIM holds a 40% share, we calculate total savings of $115mn (ex-ARPU paid to RIM) as demonstrated in Figure 199. We note that this only takes into account the opex savings and does not consider the lower level of subsidy a RIM device may require versus say an iPhone (or lower capex levels).
Figure 199: RIM’s Overall Solution Drives Operator Savings
Figure 200: New BB Browser Is More Efficient than Peers
Total subscribers (mn) 50.0% using smartphones 20%% Smartphones that are Blackberry 40%Total Blackberry devices (mn) 4.0Monthly data saved (MB, medium user) 56.9Total monthly data volume saved (million MB) 227.6Operator cost per megabyte (HSPA) $0.042Monthly savings, (US$ mn) $9.6
Annual savings, (US$ mn) $114.7
0%
20%
40%
60%
80%
100%
120%
140%
Blackberry Browser 2 Browser 3 Browser 4 Browser 5 Browser 6 Browser 7 Browser 8
% B
ytes
Com
mun
icat
ed
Source: Rysavy Research – Sponsored and paid for by RIM Source: Rysavy Research – Sponsored and paid for by RIM
Maintaining strong carrier relationships. The company also highlights that both ARPU and LTV (life time value) of a typical BlackBerry user is higher than the average smartphone user as shown in Figure 201 and Figure 202. This combined with its NOC service, which provides savings for carriers, means that RIM continues to enjoy strong support from carriers across the world.

16 March 2011
IT Hardware 172
Figure 201: BlackBerry Devices Enjoy a Higher ARPU… Figure 202: ...and LTV than Average Smartphones
52
74
89
0
10
20
30
40
50
60
70
80
90
100
Basic Phone Smartphone BlackBerry
Mon
thly
AR
PU (U
S$)
580
1,030
1,500
0
200
400
600
800
1,000
1,200
1,400
1,600
Basic Phone Smartphone BlackBerry
Life
Tim
e Va
lue
(US$
)
Source: Research in Motion, Capital Markets Day 2009 Source: Research in Motion, Capital Markets Day 2009
Windows Phone 7 (5.6/10)—Still Early Days, Given Recent Launch
Given Windows Phone 7 operating system was only launched in late 2010, we believe its overall services offering is still a ‘work in progress’. Although we believe the company is taking steps in the right direction by looking to integrate its existing offerings, like Zune and Xbox, with devices running WP7. Following weaker than expected support from hardware OEMs in the first few months, Microsoft’s platform has now been embraced by Nokia, which in our view would result in much improved vendor support. We believe it is still early to objectively evaluate their service portfolio, as we must evaluate how much impact the Nokia partnership will have. Regarding Windows Phone 7, we note:
Decent initial momentum with apps. Since its launch, Windows Phone Marketplace has shown decent momentum in terms of adding applications, with the store recently having some 9,000 apps. Although this number is still small compared to Apple (>325K) and Android (~200K), we believe with strong developer support owing to its Microsoft platform, the apps momentum could continue going forward.
Zune offering both music and videos. Starting with only 2mn songs, Microsoft Zune currently has a portfolio of 11mn songs from all leading music labels along with a collection of smaller ones. In addition, with ease of search and DRM-free technology, we believe Zune along with Apple iTunes are amongst the best for music related service on mobile devices. The company also offers music videos, television shows, and movies for purchase and time-limited renting.
Xbox LIVE for gaming enthusiasts. With over 50 gaming titles launched initially, Microsoft is looking to attract gaming customers. Tight integration with the device means that Xbox LIVE users have access to features like ability to edit one’s avatar, check messages, and view any achievements related to games on the smartphone or console.
Nokia (4.4/10)—Ovi Progress Continues to Be Very Slow, Microsoft Could Help Here
Since the announcement of Ovi in August 2007, Nokia has continued to add a number of services on its Ovi Store, ranging from apps, to music, to games and navigation. However, we continue to be unimpressed by the quality of these offerings. In addition, with a weak integration strategy and a lack of a user-friendly interface, we believe that Nokia’s suite of services still remains quite weak compared with competition. With the company now having chosen Windows Phone 7 as its principal OS, we believe it is important to evaluate the services offerings of both Nokia’s Ovi Store and Microsoft’s Windows Marketplace to judge Nokia’s overall competitiveness here. Looking at the ramping apps momentum seen by Microsoft WP7, we believe that Nokia could benefit from a much improved and better integration of services, but this is likely to happen only in 2012 when the company ramps up its devices based on Microsoft’s software platform.

16 March 2011
IT Hardware 173
Applications on Ovi Store—lacking in quality and quantity. In terms of apps, Nokia’s store has over 30K apps, but more importantly, we believe that within this number, the company also includes simple applications like ringtones and wallpaper, which are really not mobile applications, in our view. Even including these, we believe that Nokia’s store lacks competition both in terms of quantity and quality. In addition, the company recently noted that it is seeing around 4mn downloads every day (compared with 3mn in November 2010), which translates to some 1.5bn downloads every year at an ongoing rate, which is still slower than both Apple and Android, which have crossed the 10bn and 3.5bn download mark at the beginning of 2011.
Only music and no video. Nokia Music Store has around 11mn tracks, with the company having partnerships with leading music labels, and it is comparable to music stores from other vendors. However, Nokia still does have a full-fledged video service that allows users to download movies or TV shows. In addition, Nokia recently has cut back on its unlimited music service, which allowed users to download an unlimited amount of music for a flat rate fee; the vendor is now offering these services only in China, India, and Indonesia (with 12-month subscription) and Brazil, Turkey, and South Africa (with 6-month subscription). Also, Nokia is still offering music content with DRM software, which ties the downloaded music to the device, whereas other vendors including Apple and Amazon have been offering DRM-free music.
Installed base is strong but will see rapid decline. We estimate that there are around 225mn Symbian smartphone users currently, which is nearly 50% of the smartphone subscriber base). But with Nokia having decided to move away from Symbian, we expect this number to decline rapidly. For example, we expect a Symbian user base of 110mn in 2013, accounting for less than 10% of global smartphone subs base. With Microsoft’s current version being designed to run on high-end devices, we have to wait and see how quickly the OS can support launch of lower-end smartphones; this will be especially crucial for Nokia in markets like APAC, CEEMEA, and LatAm. This, in our view, will decide how much monetary benefit Nokia will gain from its strong installed base. Markets where fixed-line and PC penetration is low will be decided in the next three to five years.
Figure 203: Symbian Still Has the Highest Installed Base of Smartphone Users, but Nokia’s Base to Migrate to Windows in millions, unless otherwise stated Smartphone subscribers (mn) Smartphone OS subscriber share (%) 2007 2008 2009 2010 2011E 2015E 2007 2008 2009 2010 2011E 2015E Blackberry OS 12.6 22.1 38.0 57.1 94.9 302.5 7.3% 9.6% 12.5% 12.4% 13.6% 15.7% Android 0.0 0.6 7.2 71.0 209.0 735.2 0.0% 0.3% 2.3% 15.4% 29.9% 38.2% iOS 3.3 13.2 32.5 64.1 119.2 355.1 1.9% 5.7% 10.6% 13.9% 17.0% 18.5% Windows (Mobile/ Phone) 19.6 24.9 26.9 21.6 30.6 430.2 11.4% 10.8% 8.8% 4.7% 4.4% 22.4% Symbian 111.6 141.6 173.9 223.4 225.0 33.7 64.7% 61.4% 57.0% 48.4% 32.1% 1.8% WebOS 0.0 0.0 1.2 2.0 2.9 8.6 0.0% 0.0% 0.4% 0.4% 0.4% 0.4% OtherOS 2.0 2.6 2.1 4.5 5.0 23.7 1.2% 1.1% 0.7% 1.0% 0.7% 1.2% Linux 20.6 21.5 20.5 16.5 13.3 34.7 11.9% 9.3% 6.7% 3.6% 1.9% 1.8% PalmOS 2.8 4.1 3.0 1.4 0.0 0.0 1.6% 1.7% 0.9% 0.3% 0.0% 0.0% Total (mn) 173 231 305 462 700 1,924 100.0% 100.0% 100.0% 100.0% 100.0% 100.0%
Source: Company data, Credit Suisse estimates.
Nokia has come a long way in terms of carrier friendliness. We believe that Nokia has made considerable improvements since the introduction of Ovi services, with the vendor signing a number of service agreements in the areas of messaging, navigation, and music, and with leading carriers like Vodafone, Telecom Italia, AT&T, Orange, and Telefonica.

16 March 2011
IT Hardware 174
Distribution—Key Driver as Volumes Grow Given our view that smartphone volumes will rise from 297mn units in 2010 to some 594mn/1.04bn units in 2012/2015, we believe that the ramp in volume will make distribution and supply chain critical success factors in the industry. We expect that vendors having an extensive reach and a well organized strategy can reap multiple benefits, including:
■ Improved time to market. While this seems obvious, taking too long in getting new products to the market is fraught with risks and could eventually lead to disappointing sales.
■ Shelf space. Trust earned with retailers over the long term ensures that products are promoted appropriately and that improved price protection is given, minimizing concerns about the volatility of channel inventory.
■ Penetration. Distribution channels through which mobile devices are sold currently vary between retail and operator channels. Of course, this will evolve over time. The issue is that in several emerging markets where retail is the preferred channel to reach consumers, building an independent distribution network can be a cumbersome and challenging undertaking.
■ Supply chain. Given all the changes that we expect in the structure of the mobile device industry, we maintain our view that it will remain an industry driven largely by product launches whereby strong relationships with the supply chain will help ensure that vendors are allocated appropriate volumes/capacity by a given supply chain partner.
In order to actually measure these factors, we have looked at a combination of carrier relationships, supply-chain execution, and points of presence in emerging markets.
Apple (9.0/10)—Strong Carrier Momentum Continues
Apple scores quite highly in our rankings for supply chain and distribution, with a score of 9.0/10 as the company continues to make significant progress. especially in distribution, while retaining its number one position in supply chain rankings. (See Figure 204).

16 March 2011
IT Hardware 175
Figure 204: Apple Has Topped the Global List of Companies in Supply Chain for Three Years Rank 2008 2009 2010 1 Apple Apple Apple 2 Nokia Dell Procter & Gamble 3 Dell Procter & Gamble Cisco Systems 4 Procter & Gamble IBM Wal-Mart Stores 5 IBM Cisco Systems Dell 6 Wal-Mart Stores Nokia PepsiCo 7 Toyota Motor Wal-Mart Stores Samsung Electronics 8 Cisco Systems Samsung Electronics IBM 9 Samsung Electronics PepsiCo Research In Motion 10 Anheuser-Busch Toyota Motor Amazon.com 11 PepsiCo Schlumberger McDonald’s 12 Tesco Johnson & Johnson Microsoft 13 The Coca-Cola Company The Coca-Cola Company The Coca-Cola Company 14 Best Buy Nike Johnson & Johnson 15 Nike Tesco Hewlett-Packard 16 Sony Ericsson Walt Disney Nike 17 Walt Disney Hewlett-Packard Colgate-Palmolive 18 Hewlett-Packard Texas Instruments Intel 19 Johnson & Johnson Lockheed Martin Nokia 20 Schlumberger Colgate-Palmolive Tesco
Source: Gartner.
#1 in AMR supply chain rankings. We believe the company’s supply chain is very efficient, as shown by the AMR research rankings, where it has been ranked #1 globally for the past three years in a row.

16 March 2011
IT Hardware 176
Figure 205: We Estimate that Carriers Supporting iPhone Already Have Over 2.4bn Subscribers on Their Networks carriers and country subscriber numbers where iPhone is sold currently
No. of carriers
Country Operator Mobile subscriptions of operator (ending 2010,
mn)
Mobile subscriptions in the country (ending
2010, mn)
% market share (2010)
Carrier exclusivity?
1 USA AT&T 95.4 303.5 31% no 2 USA Verizon 89.2 303.5 29% no 3 Germany T-Mobile (Deutsche Telekom) 34.2 111.0 31% no 4 Germany O2 (Telefonica) 17.1 111.0 15% no 5 Germany Vodafone 36.6 111.0 33% no 6 Italy Telecom Italia 30.7 87.3 35% no 7 Italy Vodafone 30.9 87.3 35% no 8 Italy 3 9.3 87.3 11% no 9 United Kingdom O2 (Telefonica) 22.2 85.5 26% no
10 United Kingdom 3 8.5 85.5 10% no 11 United Kingdom Vodafone 19.1 85.5 22% no 12 United Kingdom Orange / T-Mobile 33.8 85.5 40% no 13 France Orange 26.5 66.1 40% no 14 France SFR 20.7 66.1 31% no 15 France Buoygues Telecom 10.5 66.1 16% no 16 Spain Movistar (Telefonica) 24.2 58.5 41% no 17 Spain Orange 11.8 58.5 20% no 18 Spain Vodafone 17.3 58.5 30% no 19 Canada Rogers 8.9 24.6 36% no 20 Canada Bell 7.3 24.6 29% no 21 Canada Telus 7.0 24.6 28% no 22 Japan Softbank 24.6 111.4 22% yes 23 Russia Megafon 52.0 220.2 24% no 24 Russia MTS 70.0 220.2 32% no 25 Russia Vimpelcom 52.0 220.2 24% no 26 Brazil Vivo 2.9 6.2 46% no 27 Brazil Claro (America Movil) 2.5 6.2 40% no 28 Brazil TIM Brasil (Telecom Italia) 5.7 9.6 60% no 29 Brazil Oi 1.9 9.6 20% no 30 China China Unicom 167.8 843.2 20% yes 31 India Vodafone 130.3 730.7 18% no 32 India Bharti Airtel 156.0 730.7 21% no 33 Indonesia Telkomsel 95.3 195.3 49% yes 34 Australia Optus (SingTel) 8.5 27.5 31% no 35 Australia Telstra 11.1 27.5 40% no 36 Australia Vodafone / 3 7.4 27.5 27% no
126 Others NA 1,057.0 2,319.6 46% NA 162 91 2,406.2 4,347.3 55%
Global mobile subscriptions (mn) 5,188.9 5,188.9 % of subs on iPhone supporting carriers / countries 46% 84%
Source: Company data, Credit Suisse research.
Expanding distribution by adding carriers and countries. We think that distribution is one area in which Apple has shown marked improvement recently, especially as it continues to add more carriers and regions for iPhone. In fact, we estimate that carriers, which are supporting iPhone, have over 2.4bn subscribers (Figure 205) on their networks, which is some 46% of the global mobile subscription base. Note this number has increased from the 1.3bn (34% of subscriber base) we estimated in August 2009. Similarly, iPhone is now being sold in countries that account for some 84% of global mobile subscriptions, showing the expanding distribution network of the device.

16 March 2011
IT Hardware 177
iPhone—no longer contractual exclusivity in any market. Over the past 18 months, we have seen a number of key regions where iPhone has moved away from contractual exclusivity with one carrier to signing dual or multiple carriers. Examples of this are France (in Q209), the U.K. (in Q110), Spain (in Q210), Germany (in Q310), and most recently the U.S. (in Q111). This has resulted in Apple now having agreements with 185 carriers globally, which has increased from 154 carriers at the end of Q210. In addition, the company also noted that it does not have contractual exclusivity for the iPhone in any market post the launch of CDMA iPhone at Verizon in the U.S., which was the last market with any kind of exclusivity. (See Figure 206.)
Figure 206: iPhone Has Gained Share in All WE Markets After Becoming Nonexclusive in %, unless otherwise stated
6%
4%
5%
10%
11% 11%
12%12% 12%
2%1%
11%
15%
0% 0%
2%2%
2%
1%2%
2% 2%
2%
5%5%
1%1% 1%
4%4% 4%
3%3%
9%
11%
1%1%
12%
10%
7%
5%4%
4%4%4%
5%
3% 2%
0%
2%
4%
6%
8%
10%
12%
14%
16%
Q108 Q208 Q308 Q408 Q109 Q209 Q309 Q409 Q110 Q210 Q310 Q410
iPho
ne h
ands
et s
hare
(%)
France UK Spain Germany
In four key WE markets like France, UK, Spain and Germany, iPhone share of handset market saw a sharp increase from one quarter to another when the iPhone became non-exclusive in that particular country
Source: Gartner, Credit Suisse research.
Nokia (8.0/10)—Solid Distribution, Losing Out in Supply Chain
For global distribution and supply chain, we believe that Nokia scores 8.0/10 only because of some issues in supply chain, which is evident from its decline in AMR rankings. In fact, one major reason why Nokia’s smartphone share may stabilize longer term is that, while on a global basis players like RIM and Apple have improved their respective portfolios, it will still take time for them to catch up and replicate Nokia’s extensive distribution. We can see that this is still a work in progress for both Apple and RIM, although they are making some good progress over the past 12 months. We arrive at this score of 8.0 based on the following:
Strong distribution network in EMs. We believe that Nokia not only has grasped the volume opportunity in emerging markets earlier than most peers but also has understood the need to build out its own distribution instead of relying on carriers. This is principally owing to the fact that, in markets such as India and China, carriers do not distribute or subsidized mobile terminals on a large scale (because of economic, legal, and logistical reasons). This, in turn, means that owning distribution outlets or partnering with distributors is necessary, and effectively helps create a barrier to entry in several markets. Two regions where we believe Nokia has done this effectively are India and China. In fact, as depicted in Figure 207, the company had 100K, 64K, and 120K points of presence in India, China, and MEA, respectively (as of 2008), and we believe this is far more than any other handset vendor.

16 March 2011
IT Hardware 178
Figure 207: Nokia Has Deep Coverage of Points of Presence in Emerging Markets
0
20,000
40,000
60,000
80,000
100,000
120,000
140,000
China India MEA
Poin
ts o
f ret
ail p
rese
nce
Points of presence in the whole market Nokia points of presence in the market Source: Company data.
Continuing to drop in supply chain rankings. Although Nokia continues to have strong distribution in place, the company continues to drop places in the annual supply chain rankings done by AMR. We highlight that Nokia has dropped from #2 in global rankings for supply chain in 2008, to #6 in 2009, and now to #19 in 2010. Even among the list of technology companies, Nokia currently ranks #10, down from #5 in 2009.
RIM (7.8/10)—Strong Distribution Strategy Already Built Out
As RIM’s business model has evolved, the company has moved gradually toward direct revenue sharing agreements with carriers depending upon the type of subscriber (enterprise or consumer) as well as usage. This, in turn, means that RIM has built up a carrier-by-carrier relationship network that we believe conveys a global network for distribution of its products. This has taken the company some ten years, but now gives it a significant and competent distribution position within the smartphone industry.
Figure 208: RIM Has Been Partnering with Distributors/Retailers to Expand its Reach Beyond Carriers recent distribution agreements for RIM Date Partner Region Details 13-Dec-10 Brightstar Africa Expansion of distribution agreement to expand BlackBerry presence in sub-Saharan Africa including
Nigeria, Ghana and Kenya to name a few 07-Dec-09 Digital China China Agreement to distribute BlackBerry handsets in mainland China 05-Jun-09 Brightstar Europe Agreement to provide complete BlackBerry solution including devices to Brightstar's European
customer base 15-Jan-09 Redington India Collaboration to establish national retail distribution channel for RIM devices 09-Dec-08 The Phone House Spain BlackBerry devices to become available in 400 stores in Spain 30-Jun-08 Brightstar US Launch of dedicated program extending existing relationship to increase availability of BlackBerry
devices in Verizon Wireless indirect channels 01-May-08 Brightpoint Global Global master distribution agreement for RIM products for North America, Latin America, Europe,
Asia Pacific and Middle East & Africa 23-Oct-07 Alcatel-Lucent China Strategic agreement for distribution of BlackBerry devices in China similar to their agreement
covering Africa, Middle East and South East Asia Source: Company data, Credit Suisse research.
Distribution agreements expanding reach in indirect channel and consumer markets. RIM has continued to improve its distribution strength within the indirect retail channel, leveraging its partnerships with a number of retailers including Best Buy, Carphone Warehouse, Radio Shack, Costco, Future Shop, and Wal-Mart, to name a few. In addition,

16 March 2011
IT Hardware 179
the company also entered into a master agreement with Brightpoint for global distribution in May 2008, which was aimed at opening up more than 25,000 B2B channels globally. Over the past 24 months, RIM has announced its collaboration with a number of distributors and retailers (Figure 208) to expand its reach on the consumer side.
Expanding global reach. The company has recently noted that BlackBerry devices are shipping with approximately 475 carriers and distribution partners in over 160 countries globally. Another way to look at this expanding geographic rollout is that RIM has signed up with nearly 290 carriers globally over the past 12 years, which means that its cumulative addressable base of wireless subscribers has expanded to some 3.0bn (Figure 209), which in our estimates will be around 60% of the global subscriber base ending 2010.
Figure 209: Progression of RIM’s Carrier Deals and Cumulative Addressable Subs Base
0
50
100
150
200
250
300
350
2000 2001 2002 2003 2004 2005 2006 2007 2008 2009 2010
Num
ber o
f RIM
's c
arrie
r rel
atio
nshi
ps
0
500
1,000
1,500
2,000
2,500
3,000
3,500
Cum
ulat
ive
Subs
crib
er B
ase
(mili
ons)
Cumulative addressable subscriber base (mn) Cumulative carrier base Source: Company data, Credit Suisse research.
Rolling out in APAC markets like India and China. At the end of 2009, RIM signed an agreement with Digital China, which is the largest IT services provider in China, with regional centers in 19 major cities, to build its distribution network in the region. In addition, RIM has also partnered with China Mobile, the biggest carrier in China, and recently launched its BlackBerry Internet Service (BIS), which provides push email and Internet service to consumers. Similarly, RIM has been tying up with major carriers in India like Bharti Airtel, Reliance, Vodafone, and Idea Cellular to expand its distribution along with its collaboration with Redington, which is a leading IT distributor across the country.
Motorola (4.5/10)—Geographic Focus Confined to NA, China, and LatAm
One of the key issues for Motorola Mobility in its smartphone business is its confined geographic reach, which is realistically limited to NA, followed by China and LatAm. Outside of these regions, we have seen limited traction for Motorola Mobility smartphones, as can be seen by its low smartphone share (which is less than 1%) in each of the following geographies: WE, CEE and MEA.
U.S. to drive the bulk of smartphone volumes. We highlight that the company has historically had an average overall handset share of 15%+ in the U.S. (See Figure 210.) As such, it has been able to leverage its existing distribution along with strong brand presence and relationship with carriers (like Verizon) to garner around 13% smartphone share in the U.S. (in 2010). Although going forward, we believe its traction at Verizon may see a slowdown owing to the launch of CDMA iPhone, we still believe that Motorola

16 March 2011
IT Hardware 180
Mobility can hold on to 11-12% smartphone share in the U.S., as it sees increasing traction at other carriers like AT&T.
Figure 210: Motorola Mobility Has a History of Strong Relationships with Carriers in the U.S. Smartphone share (%) Handset share (%) 2007 2008 2009 2010 2011E 2012E Avg 2007-09 Verizon 16.7% 4.7% 8.6% 35.1% 18.2% 20.0% 18.0% AT&T 1.2% 1.8% 0.3% 2.2% 9.0% 9.5% 15.1% Sprint 14.2% 5.7% 0.3% 1.2% 2.8% 3.5% 16.2% T-Mobile 0.0% 0.0% 4.2% 10.6% 7.4% 8.0% 17.9% Other 6.5% 10.3% 1.4% 2.9% 5.6% 5.0% NM Total 7.0% 3.0% 3.4% 13.0% 10.9% 11.9% 16.8%
Source: Company data, NPD, Credit Suisse estimates.
China and LatAm seems to be other focus areas. In addition to the NA region, we believe that management is focusing on China and LatAm as the next two important regions for its smartphone business. In fact, China is the second largest smartphone market for Motorola Mobility, as it has become one of the leading suppliers of Android smartphones in the country. In addition, the company in January 2010 introduced SHOP4APPS, which is its own store for Android applications for users in China. The company has also introduced 13 new smartphones in China over the past 12 months. For LatAm, Motorola Mobility recently launched a midend smartphone called SPICE, which has been introduced initially in Brazil, with other countries to follow.
Expanding in Europe could prove challenging. Looking at the WE and CEE markets, Motorola Mobility has seen limited share traction over the past 12 months, as its smartphone share continues to be less than 1% in both these regions in 2010. Although the company is trying to rebuild its brand image in the region with product launches (MILESTONE 2 at Vodafone, DEFY at T-Mobile, CHARM at Orange, and recently launched ATRIX 4G with select carriers), we continue to believe that the vendor will see limited success, given the lack of carrier relationships in Europe. Even if the company tries to improve its positioning in Europe, we believe this will involve an investment of both time and resources (marketing spend, higher subsidies, etc.). As such, we assume Motorola Mobility will have a smartphone share of only around 1-2% in WE and CEE in 2012.
HTC (6.5/10)—Improving Sales Reach, Especially in WE and NA
HTC initially started as a manufacturer of operator-branded terminals for carriers in WE and NA. Given the vendor’s aim was to be a niche smartphone player, this distribution strategy worked to the company’s advantage in initial years. However, with increasing competition among vendors and carriers becoming more selective in allocating subsidies toward different smartphone models, HTC’s market share gains have been limited (note its smartphone share increased from 3% in 2007 to 6% in 2009). As such, the company took initiatives to improve its indirect channel network by tying up with distributors, and has now finally decided to move away from carrier-branded strategy to develop its own brand. Although we believe this is the right step in the long term, we believe HTC has to make long strides in order to build out the distribution network and compete, especially as emerging markets become important over time. Therefore, we give HTC a score of 6.5 out of 10 with regard to distribution and supply chain.
Air time in the U.S. and key WE markets. After being a relatively unknown smartphone vendor for a period of time until 2009, HTC has seen good traction with mobile carriers (Figure 211) in both NA and WE over the past few quarters, driven by its strong alignment to Android and strategy of using its own brand rather than being an ODM vendor. In fact, HTC’s WE/NA smartphone share has risen from 8%/1% in 2007 to 12%/15% in 2010. In the U.S. in particular, the vendor has benefitted from strong promotions around ‘hero’ products from leading carriers like Verizon (Droid Incredible and Eris), Sprint (EVO 4G),

16 March 2011
IT Hardware 181
and T-Mobile (G1 and G2), driving meaningful share gains. This expanding relationship with carriers in NA and WE, along with recent traction in China, means that HTC devices are now selling with carriers that account for 1.5bn mobile subscriptions globally, or 29% of the installed base of mobile users.
Figure 211: We Estimate that Carriers Supporting HTC Devices Already Have Some 1.5bn Subscribers on Their Networks carriers and country subscriber numbers where HTC devices are sold currently
No. of carriers
Country / Region Operator Mobile subscriptions of operator (ending 2010, mn)
Mobile subscriptions in the country (ending 2010, mn)
% market share (2010)
1 US AT&T 95.4 303.5 31.4% 2 US Verizon 89.2 303.5 29.4% 3 US T-Mobile 34.3 303.5 11.3% 4 US Sprint 49.6 303.5 16.3% 5 WE Vodafone 115.4 539.1 21.4% 6 WE T-Mobile (Deutsche Telekom) 58.7 539.1 10.9% 7 WE France Telecom (Orange) 72.1 539.1 13.4% 8 WE Telecom Italia 30.7 539.1 5.7% 9 WE Telefonica 41.0 539.1 7.6%
10 UK 3 8.5 85.5 9.9% 11 Japan NTT DoCoMo 55.4 111.4 49.8% 12 Japan KDDI 31.4 111.4 28.2% 13 Japan Softbank 24.6 111.4 22.1% 14 China China Mobile 578.2 843.2 68.6% 15 China China Unicom 167.8 843.2 19.9% 16 Taiwan Chunghwa Telecom 9.0 19.3 46.8% 17 Australia Optus 8.5 27.5 30.9% 18 Singapore SingTel 3.2 7.2 44.2% 19 Canada Telus 7.0 24.6 28.3% 19 1,480.0 1,875.8 78.9%
Global mobile subscriptions (mn) 5,188.9 5,188.9 % of subscriptions in HTC supporting carriers / countries 29% 36%
Source: Company data, Credit Suisse research.
Partnering with distribution companies. Following a strategy that is somewhat similar to RIM, HTC has also been looking to sign agreements with major handset and IT distributors to expand its distribution network globally. (See Figure 212.) We highlight its global partnership with Brightpoint and with Brightstar, which is focused on European markets.
Figure 212: Similar to RIM, HTC Also Has Been Tying Up with Distribution Companies to Expand Presence list of partnerships signed by HTC over time Date Partner Region Details 18-Aug-10 Synnex New Zealand Agreement with one of the largest distribution companies in New Zealand 27-Jul-10 GOME Electrical
Appliances Holding China Partnership signed with China's largest electronics distributor as HTC launched its own
branded devices in China 16-Jun-10 Synnex Australia Agreement with one of the largest distribution companies in Australia 12-Jan-10 Brightstar Europe Pan-European partnership to develop distribution channel for HTC's official accessories line 24-Jul-09 JMB Distribution Australia / Asia Agreement to supply accessories for HTC devices 15-Jul-09 STRAX Global Arrangement to distribute HTC accessories through all of STRAX's channels 31-Oct-07 Brightpoint Global Partnership for distribution and logistics services to HTC globally
Source: Company data, Credit Suisse research.
Other Vendors—Distribution Already in Place
The other traditional handset vendors, such as Samsung, Sony Ericsson, and LG, already have a distribution network in place covering both direct and indirect channels. (See Figure 213.) Given that these vendors combined have accounted for nearly 30% of global handset volumes in 2005-2010, it suggests that they already have a strong distribution

16 March 2011
IT Hardware 182
network in all key geographic regions. However, to further improve their distribution relationship with carriers, these vendors would have to offer a strong smartphone portfolio. Recent examples of this include relationships between Apple-AT&T, RIM-Verizon, and Motorola-Verizon. In fact, Motorola is an example of a vendor leveraging its existing relationship in the handset space with U.S. carriers to push its new smartphone portfolio based on Android over the past 12 months.
Figure 213: Other Traditional Vendors Already Have the Distribution Network in Place in millions, unless otherwise stated Handset shipments (mn) 2005 2006 2007 2008 2009 2010 2005-2010 % of industry volumesSamsung 102.9 118.0 161.1 196.6 227.9 278.7 1,085.2 14.8% LG 54.9 63.6 80.5 100.7 117.9 116.6 534.2 7.3% Sony Ericsson 51.2 74.8 103.4 96.6 57.0 43.1 426.1 5.8% Sub-total 208.9 256.4 345.0 394.0 402.8 438.4 2,045.5 27.9% Total industry (sell-in) 820.6 1,000.1 1,209.1 1,317.7 1,356.7 1,625.9 7,330.1
Source: Company data, Credit Suisse research.

16 March 2011
IT Hardware 183
Product Portfolio—Apple Still Leads, but Gap Closing Smartphone devices are optimized in terms of specifications to support a combination of primary functions including music, video, gaming, photos, Web browsing, mobile TV, navigation, and messaging. Compared with entry-level smartphones, higher-end smartphones usually have larger displays, more powerful processors, and increased embedded memory. We remain of the view that, when it comes to addressing the smartphone segment, the approach of one size fits all will not work, especially as the market gravitates toward lower price points. As such, based upon our proprietary smartphone product portfolio database, we have looked at the number of currently selling devices and those expected to be launched in terms of price points and functionalities among the major vendors. Based on our extensive proprietary analysis and our smartphone database, which includes over 270 existing or soon to be launched smartphones (as seen in Figure 221), we would score vendor’s product portfolio as follows:
Apple (8.0/10)—Slow Evolution from iPhone
While Apple gradually continues to evolve the hardware, the company in essence still only offers one style of device. However, more importantly, even after three years of launch, it still remains the best smartphone device in the market, in our view. In addition, the company is also filling some technology gaps in its portfolio by recently launching a CDMA version of iPhone with Verizon in the U.S. However, as volume growth in the ultra-high end of the smartphone market slows down over the next 18-24 months, we believe Apple could potentially introduce a lower-end version of iPhone by replicating its ‘iPod’ strategy, whereby it successfully penetrated lower price points after establishing itself in the high end of portable music players (as shown in Figure 214). For details on the lower end iPhone, please refer to our Apple initiation note (published concurrently). Hence, we believe that Apple deserves a score of 8/10 for its product portfolio.
RIM (6.0/10)—Making Strides in Low End, Could Experiment with QNX in High End?
RIM has been successful in making the transition from being an enterprise-focused vendor to a consumer-focused company by integrating features like GPS, Wi-Fi, and a higher-resolution camera. In addition, the company has also been focusing on the lower end of the smartphone market, in which it has benefitted from the absence of Apple and a weak product portfolio at Nokia.
QWERTY keyboard—key for messaging. We believe that the QWERTY keyboard feature is important for consumers who are heavy users of e-mail functionality. RIM’s smartphone portfolio has a high proportion of terminals with this feature (86% of its devices support a QWERTY keyboard, with the remainder supporting either ‘SureType’ keyboard or virtual keyboard on touchscreen).
Still lacking consumer edge and appeal, especially in the high end. Though we believe that RIM has been trying to make an inroad into the high-end consumer segment with full touchscreen devices (first Storm and then Torch 9800), we would highlight that it has seen limited success in this area, given both Apple and Android still lead the way in the high end.
Making inroads in the lower end with its Curve range. However, we would note that RIM is continuously making inroads in the mid and low end of the smartphone market with its Curve range of products (Curve 8520/8530 and Curve 3G 9300/9330). In fact, 29% of its smartphones are selling at a price point of less than $250, and another 50% are selling in the price band $250-400, which highlights its increasing focus in the midend of the market.

16 March 2011
IT Hardw
are 184
Figure 214: Apple Benefitting from a Strong Platform for iPod by Penetrating to Lower Price Points Over Time, Could It Replicate Similar Strategy for iPhone?
0
100
200
300
400
500
600
700
Sep-
01
Jan-
02
May
-02
Sep-
02
Jan-
03
May
-03
Sep-
03
Jan-
04
May
-04
Sep-
04
Jan-
05
May
-05
Sep-
05
Jan-
06
May
-06
Sep-
06
Jan-
07
May
-07
Sep-
07
Jan-
08
May
-08
Sep-
08
Jan-
09
May
-09
Sep-
09
Jan-
10
May
-10
Sep-
10
Pric
e po
int (
$)
0
10000
20000
30000
40000
50000
60000
70000
Cum
ulat
ive
12-m
onth
vol
umes
('00
0s)
64GB
32GB
160GB
iPod Classic iPod Mini iPod Shuffle iPod Nano iPod Touch
5GB
10GB
10GB
20GB 30GB
15GB
10GB
40GB
20GB
4GB
40GB
20GB
40GB
60GB
20GB 30GB
6GB4GB
1GB
512MB
30GB
30GB
60GB
2GB
1GB
6GB
4GB
2GB
1GB
80GB
16GB
8GB
80GB
160GB
4GB
8GB
1GB
2GB
8GB
8GB
16GB
120GB
32GB
16GB
4GB
2GB
16GB
8GB
2GB
16GB
8GB
Source: Company data, Credit Suisse research.

16 March 2011
IT Hardware 185
Could QNX-based smartphones revive its position in the high end? After launching its first tablet device (PlayBook) based on QNX operating system in September 2010, we believe RIM could potentially introduce this new platform on its smartphones, especially at the high end, sometime in the latter half of 2011, while maintaining its existing BlackBerry 6 for the low-end to midend range.
Figure 215: RIM Has Been More Focused Toward the Midend and Lower End of the Smartphone Market detailed specifications of key BlackBerry devices RIM Bold 9780 Style 9670 Curve 3G 9330 Curve 3G 9300 Torch 9800 Pearl 3G 9105 Pearl 3G 9100 Bold 9650 Curve 8520 / 8530
ImageTechnology GSM / UMTS / HSPA CDMA 1x EVDO CDMA 1x EVDO GSM / UMTS / HSPA GSM / UMTS / HSPA GSM / UMTS / HSPA GSM / UMTS / HSPA HSPA / CDMA-EVDO GSM / CDMAAnnouncement date Oct-10 Oct-10 Sep-10 Aug-10 Aug-10 Apr-10 Apr-10 Apr-10 Jul-09Shipping date Nov-10 Nov-10 Sep-10 Aug-10 Aug-10 Apr-10 May-10 Jul-10 Dec-09Operating System BlackBerry OS 6.0 BlackBerry OS 6.0 BlackBerry OS 5.0 BlackBerry OS 5.0 BlackBerry OS 6.0 BlackBerry OS 5.0 BlackBerry OS BlackBerry OS BlackBerry OSProcessor 624 MHz 624 MHz 624 MHz 624 MHz 624 MHz 624 MHz 624 MHz 624 MHz 512 MHzRAM 512 MB 512 MB 512 MB 256 MB 512 MB 256 MB 256 MB 512 MB 256 MBMemory 256 MB 8 GB NA NA 4 GB 2 GB 2 GB 2 GB NAPixels 480 x 360 360 x 400 320 x 240 320 x 240 360 x 480 360 x 400 360 x 400 480 x 360 320 x 240QWERTY yes yes yes yes yes yes no yes yesTouchscreen no no no no yes no no no noDimensions (wxhxd) (mm) 109 x 60 x 14 96 x 60 x 18.5 109 x 60 x 13.9 109 x 60 x 13.9 111 x 62 x 14.6 108 x 50 x 13.3 108 x 50 x 13.3 112 x 62 x 14 109 x 60 x 13.9Weight (g) 122 131 104 104 161 94 94 136 106Volume (cc) 92 107 91 91 100 72 72 97 91Screen (inches) 2.4 NA 2.5 2.5 3.2 2.3 2.3 2.4 2.5Camera Megapixel 5.0 5.0 2.0 2.0 5.0 3.2 3.2 3.2 2.0Wi-Fi yes yes yes yes yes yes yes yes yesGPS yes yes yes yes yes yes yes yes noTalk time (hrs) 6.0 4.5 4.5 4.5 5.5 5.5 5.5 5.0 4.5Standby time (hrs) 528 264 252 456 432 432 432 312 408
Source: Company data, Credit Suisse estimates.
Nokia (4.5/10)—Product Gaps to Emerge with Significant Disruptions Ahead
We believe Nokia’s broad range of devices allowed the company to maintain a high global share in smartphones, as high as 49%/44% in 2007/2008. However, with the increasing importance of touchscreen and operating system, Nokia’s smartphone share has declined to 31% currently (as of Q410), as the company focused on launching a newer version of Symbian (v3) to deal with its weakness in these areas. However, this approach resulted in limited success, and with the company now planning to transition from its Symbian platform to Windows Phone 7 OS, we believe that product launches could see significant slowdown, especially in 2011. Given already existing gaps in portfolio along with further disruption ahead, we believe Nokia’s portfolio will continue to remain weak, and as such we give it a score of 4.5 out of 10.
Significant slowdown in product launches. Looking at our smartphone database, we can see that Nokia currently has around 22 smartphone models selling in the market, but has an average portfolio age of around 14 months (Figure 216), which is the highest among all vendors. This shows that product momentum has been slow over the past few months. In fact, recent Symbian 3 launches like N8, C6, and C7 have also seen muted response from both consumers and carriers. This aging of portfolio and lack of high-end smartphones means that Nokia’s smartphone portfolio continues to be in a much weaker position compared with other vendors like Apple, Samsung, HTC, and Motorola.
All eyes on its first Windows Phone 7 smartphone. Based on the comments around Mobile World Congress this year, we believe the company could be targeting to introduce its first Windows Phone 7 device later in the year (which we expect could be Q411). This also means that there will be limited new high-end product introductions through 2011, which leaves a significant gap in its portfolio over the next six to nine months. In addition, one of the issues with WP7 is that the operating system is currently designed for high-end smartphones, and with Nokia catering to the lower-end market as well, we will have to wait and see how long it takes both these companies to come up with a solution that can be scaled down to lower price points.

16 March 2011
IT Hardware 186
Figure 216: Product Momentum at Nokia Has Already Seen Slowdown, and We Expect More Disruption Ahead detailed specifications of key Nokia smartphones Nokia C5-03 E7 C6-01 C7 X6 8GB
ImageTechnology GSM / UMTS / HSPA GSM / UMTS / HSPA GSM / UMTS / HSPA GSM / UMTS / HSPA GSM / UMTS / HSPAAnnouncement date Oct-10 Sep-10 Sep-10 Sep-10 Jun-10Shipping date Dec-10 Feb-11 Nov-10 Oct-10 Jul-10Operating System Symbian S60 Symbian 3 Symbian 3 Symbian 3 Symbian S60Processor 600 MHz 680 MHz 680 MHz 680 MHz 434 MHzRAM 128 MB 256 MB 256 MB 256 MB 128 MBMemory 2 GB 16 GB 2 GB 16 GB 8 GBPixels 360x640 360x640 360x640 360x640 360 x 640QWERTY no yes no no noTouchscreen Resistive Capacitive Capacitive Capacitive CapacitiveDimensions (wxhxd) (mm) 105.8 x 51 x 13.8 123.7 x 62.4 x 13.6 103.8 x 52.5 x 13.9 117.3 x 56.8 x 10.5 111 x 51 x 13.8Weight (g) 93 176 131 130 122Volume (cc) 74 105 76 70.0 78.1Screen (inches) 3.2 4.0 3.2 3.5 3.2Camera Megapixel 5.0 8.0 8.0 8.0 5.0Wi-Fi yes yes yes yes yesGPS yes yes yes yes yesTalk time (hrs) 11.5 9.0 11.5 9.5 11.5Standby time (hrs) 600 432 408 552 420
Nokia X5-01 E73 Mode C5 N8 E5
ImageTechnology GSM / UMTS / HSPA GSM / UMTS / HSPA GSM / UMTS / HSPA GSM / UMTS / HSPA GSM / UMTS / HSPAAnnouncement date Jun-10 Jun-10 Mar-10 Apr-10 Apr-10Shipping date Sep-10 Jun-10 Apr-10 Oct-10 Aug-10Operating System Symbian S60 Symbian S60 Symbian S60 Symbian 3 Symbian S60Processor 600 MHz NA 600MHz 680 MHz 600MHzRAM 200 MB 250 MB 128 MB 256 MB 256 MBMemory 2 GB 4 GB 2 GB 16 GB 2 GBPixels 320x240 320x240 320x240 360 x 640 320x240QWERTY yes yes no no yesTouchscreen Resistive NA NA Capacitive NADimensions (wxhxd) (mm) 74.3 x 66.4 x 16.8 113.8 x 58.4 x 10.2 112 x 46 x 12.3 113.5 x 59.1 x 12.9 115 x 58.9 x 12.8Weight (g) 129 128 89 135 126Volume (cc) 83 68 63 86.4 87Screen (inches) 2.4 2 2 3.5 2Camera Megapixel 5.0 5.0 3.2 12.0 5.0Wi-Fi yes yes no yes yesGPS no yes yes yes yesTalk time (hrs) 5.0 13.0 12.0 12.5 13.2Standby time (hrs) 384 384 630.0 390.0 635.0
Source: Company data, Credit Suisse estimates.
Motorola (7.0/10)—Experimenting with Some Hardware Differentiation
We believe Motorola is one vendor that has shown significant improvement in its product portfolio over the past 12 months, driven by its strong commitment to Android OS. In addition, it has been experimenting with device features by incorporating software elements like MOTOBLUR or hardware specifications like dual core processors and

16 March 2011
IT Hardware 187
docking station, which has helped it in creating some sort of differentiation when compared with a slew of other Android vendors. Combining this with the range of products across price points and technology means that we give Motorola a score of 7 out of 10 for its overall smartphone portfolio.
Over 30 Android devices launched in past 18 months. Motorola Mobility has launched over 30 smartphones, all based on Android OS, since its first Android product in September 2009. Some of these have been shown in Figure 217, which clearly shows the increasing focus on smartphones. In addition, it has also been trying to diversify its geographical presence by introducing models, specifically catering to markets like China (where the company has launched MT810 for China Mobile, XT806 for China Telecom, and A1680 for China Unicom) and Latam (with recently launched Spice smartphone).
Figure 217: Motorola Has Been Introducing a Number of Android Devices in the Market Over the Past 12-18 Months detailed specifications of Motorola smartphones Motorola PRO ATRIX 4G DROID X DROID BIONIC CLIQ 2 DROID PRO CITRUS XT301
ImageTechnology GSM / UMTS / HSPA GSM / UMTS / HSPA CDMA/EV-DO CDMA EV-DO / LTE GSM / UMTS / HSPA CDMA EV-DO/UMTS CDMA/EV-DO CDMA 1xEV-DOAnnouncement date Feb-11 Jan-11 Jan-11 Jan-11 Jan-11 Oct-10 Oct-10 Nov-10Shipping date Q1-2011 Feb-11 Jan-11 Q2-2011 Jan-11 Nov-10 Nov-10 Q1-2011Operating System Android 2.2 Android 2.2 Android 2.2 Android 2.2 Android 2.2 Android OS Android OS Android OS v2.1Processor 1 GHz 1 GHz (Dual Core) 1.2 GHz 1 GHz (Dual Core) 1 GHz 1 GHz 528 MHz 528 MHzRAM NA 1GB 512 MB 512 MB 512 MB 512 MB 256 MB 256 MBMemory 8 GB 16GB NA 16GB 1 GB 8 GB 2 GB 150 MBPixels 320x480 540 x 960 480x854 540 x 960 480 x 854 320x480 240x320 240x320QWERTY yes no no no yes yes no noTouchscreen Capacitive Capacitive Capacitive Capacitive Capacitive Capacitive Capacitive CapacitiveDimensions (wxhxd) (mm 119x61x11.7 118 x 63.5 x 11 127.5x65.5x9.9 126 x 67 x 13.3 116 x 59.6 x 14.5 119 x 60 x 11.7 104 x 59 x 15 104 x 59 x 15Weight (g) 134 135 155 158 175 134 110 110Volume (cc) 85 82 83 112 100 84 92 92Screen (inches) 3.1 4.0 4.3 4.3 3.7 3.1 3.0 3.0Camera Megapixel 5.0 5.0 8.0 8.0 5.0 5.0 3.0 3.2Wi-Fi yes yes yes yes yes yes yes yesGPS yes yes yes yes yes yes yes yesTalk time (hrs) 8.0 8.8 6.7 NA 7.9 7.2 6.3 7.7Standby time (hrs) 330 264 170 NA 312 320 300 240
Motorola SPICE FLIPSIDE BRAVO DEFY XT810 XT806 A1680 DROID 2
ImageTechnology GSM / UMTS / HSPA GSM / UMTS / HSPA GSM / UMTS / HSPA GSM / UMTS / HSPA TD-SCDMA/GSM CDMA EV-DO/GSM GSM / UMTS / HSPA CDMA EV-DOAnnouncement date Oct-10 Oct-10 Oct-10 Sep-10 Sep-10 Sep-10 Jul-10 Aug-10Shipping date Dec-10 Nov-10 Nov-10 Oct-10 Q4-2010 Q4-2010 Q3-2010 Aug-10Operating System Android OS Android OS Android OS Android OS Android OS Android OS v2.1 Android OS Android OSProcessor 528 MHz 720 MHz 800 MHz 800 MHz 600 MHz 600 MHz 624 MHz 1 GHzRAM 256 MB 512 MB 512 MB 512 MB 256 MB 512 MB 256 MB NAMemory 512 MB 2 GB 2 GB 2 GB 128 MB 250 MB 128 MB 8 GBPixels 240x320 320x480 480x854 480x854 480x854 480x854 480x800 480x854QWERTY yes yes no no no no no yesTouchscreen Capacitive Capacitive Capacitive Capacitive Capacitive & Resistive Resistive Resistive CapacitiveDimensions (wxhxd) (mm 97 x 61 x 16.8 109 x 56 x 15 109.5 x 63 x 13.3 107 x 59 x 13.4 109.9 x 57 x 18.6 109.9 x 57 x 18.6 106.9 x 54.5 x 17.3 116.3 x 60.5 x 13.7Weight (g) 145 145 128 118 165 165 120 169Volume (cc) 88 92 92 85 117 117 101 96Screen (inches) 3.0 3.1 3.7 3.7 3.2 3.2 3.1 3.7Camera Megapixel 3.0 3.0 3.0 5.0 5.0 5.0 5.0 5.0Wi-Fi yes yes yes yes yes yes yes yesGPS yes yes yes yes yes yes yes yesTalk time (hrs) 7.0 6.0 6.8 6.7 NA 5.7 5.8 10.0Standby time (hrs) 230 372 238 240 NA 100 200 200
Source: Company data, Credit Suisse research.
Some areas of hardware differentiation. Apart from the use of MOTOBLUR, Motorola Mobility is also focusing on offering the latest hardware functionalities in its smartphones to differentiate from the Android crowd. These hardware features include use of a higher-speed applications processor, high-end camera with HD video recording, support for DLNA (Digital Living Network Alliance standards), and HDMI out (High-Definition Multimedia Interface), with the latter two allowing users to share content across the entire

16 March 2011
IT Hardware 188
home entertainment network, including TVs, laptops, PCs, and other consumer electronic devices, in some of its high-end smartphone devices. In addition, along with its recent smartphone ATRIX 4G, Motorola Mobility also launched a docking station (to be separately sold) that will enable customers to interact with the device using a keyboard, large screen, and trackpad, offering a tablet like experience.
Samsung (7.0/10)—Aiming to Continue with Its Galaxy Momentum
Samsung, with 68 devices already selling in the market or expected to ship soon, has the highest number of smartphone terminals. This is significantly higher than LG (at 41), HTC (at 33), and Motorola (at 32). This higher number of terminals is also driven by the fact that Samsung introduces similar versions of other, successful smartphones.
Android significant momentum. Samsung has increased its focus on Android, and this can be seen from the high Android OS share within its portfolio (See Figure 218.) The Samsung Galaxy S2 uses Gingerbread (Android 2.3), the latest version of Android for smartphones that was released on Nexus S by Google, which was designed by Samsung. The Galaxy S2 is packed with loads of features like Google Maps, near field communication (NFC), and SIP VoIP protocol.

16 March 2011
IT Hardware 189
Figure 218: Samsung Aiming to continue with its Galaxy Momentum detailed specifications of smartphones at Samsung Samsung Galaxy S II Galaxy SL S5780 Wave 578 i997 Infuse 4G Galaxy S 4G Galaxy Ace Galaxy Fit Galaxy Gio
ImageTechnology GSM / UMTS / HSPA GSM / UMTS / HSPA GSM / UMTS / HSPA GSM / UMTS / HSPA GSM / UMTS / HSPA GSM / UMTS / HSPA GSM / UMTS / HSPA GSM / UMTS / HSPAAnnouncement date Feb-11 Feb-11 Feb-11 Jan-11 Jan-11 Jan-11 Jan-11 Jan-11Shipping date Q1-11 Q1-11 May-11 Q1-11 Q1-11 Feb-11 Q1-11 Q1-11Operating System Android 2.3 Android 2.2 Bada 2.0 Android Android 2.2 Android 2.2 Android 2.2 Android 2.2Processor 1.2 GHz (Dual Core) 1 GHz NA 1.2 GHz 1 GHz 800 MHz 600 MHz 800 MHzRAM 1 GB 478 MB 100 MB NA 512 MB 158 MB 160 MB 158 MBMemory NA NA NA NA 16 GB 2 GB 2 GB 2 GBPixels 480 x 800 480x800 240x400 480 x 800 480x800 320x480 240x320 320x480QWERTY no no no no no no no noTouchscreen Capacitive Capacitive Capacitive Capacitive Capacitive Capacitive Capacitive CapacitiveDimensions (wxhxd) (mm) 125.3 x 66.1 x 8.5 123.7 x 64.2 x 10.6 107.9 x 54.9 x 12.5 NA 122.4 x 64.5 x 9.9 112.4 x 59.9 x 11.5 110.2 x 61.2 x 12.6 110.5 x 57.5 x 12.2Weight (g) 116 131 100 130 118 113 NA NAVolume (cc) 70 84 74 NA 78 77 85 78Screen (inches) 4.3 4.0 3.2 4.5 4.0 3.5 3.3 3.2Camera Megapixel 8.0 5.0 3.2 8.0 5.0 5.0 5.0 3.2Wi-Fi yes yes yes yes yes yes yes yesGPS yes yes yes yes yes yes yes yesTalk time (hrs) NA 15.0 12.5 NA NA 11.0 NA NAStandby time (hrs) NA 610 700 NA NA 640 NA NA
Samsung Galaxy Mini Focus I8700 Omnia 7 Vibrant i897 Captivate I5500 Galaxy 5 I5801 Galaxy M110S Galaxy S
ImageTechnology GSM / UMTS / HSPA GSM / UMTS / HSPA GSM / UMTS / HSPA GSM / UMTS / HSPA GSM / UMTS / HSPA GSM / UMTS / HSPA GSM / UMTS / HSPA GSM / UMTS / HSPAAnnouncement date Jan-11 Oct-10 Oct-10 Jun-10 Jun-10 Jun-10 Jun-10 Jun-10Shipping date Q1-11 Nov-10 Oct-10 Aug-10 Jul-10 Aug-10 Jul-10 Jul-10Operating System Android 2.2 Windows Phone 7 Windows Phone 7 Android 2.1 Android 2.1 Android 2.1 Android 2.1 Android 2.1Processor 600 MHz 1 GHz 1 GHz 1 GHz 1 GHz 600 MHz 667 MHz 1 GHzRAM 160 MB 512 MB NA 512 MB 512 MB NA 256 MB NAMemory 2 GB 8 GB 8 GB 16 GB 16 GB 1 GB 1 GB 16 GBPixels 240x320 480x800 480x800 480x800 480x800 240x320 240x400 480x800QWERTY no no no no no no no noTouchscreen Capacitive Capacitive Capacitive Capacitive Capacitive Capacitive Capacitive CapacitiveDimensions (wxhxd) (mm) 110.4 x 60.8 x 12.1 124.7 x 64.3 x 9.9 122.4 x 64.2 x 11 122.4 x 64.5 x 9.9 122.4 x 64.2 x 9.9 108 x 56 x 12.3 113.5 x 55 x 12.6 122.4 x 64.2 x 9.9Weight (g) 105 119 138 118 118 102 113 121Volume (cc) 81 79 86 78 78 74 79 78Screen (inches) 3.1 4.0 4.0 4.0 4.0 2.8 3.2 4.0Camera Megapixel 3.2 5.0 5.0 5.0 5.0 2.0 3.0 5.0Wi-Fi yes yes yes yes yes yes yes yesGPS yes yes yes yes yes yes yes yesTalk time (hrs) NA 6.5 5.7 6.5 13.5 9.5 15.5 15.5Standby time (hrs) NA 300 390 432 750 521 620 590
Source: Company data, Credit Suisse research.
Sony Ericsson (6.0/10)—Partnering with Sony for Gaming
After having a weak portfolio. especially in 2H10, Sony Ericsson has started 2011 on a strong footing with the launch of three new devices. In addition, after experimenting with multiple OS in 2010 (Symbian, Android, and Windows Mobile), the vendor is now focusing completely on Android, which in our view could result in increased momentum in terms of product launches this year. As such, we rate its product portfolio 6 points out of 10.
First in launching Android 2.3 devices. SEMC has launched four new smartphones this year, all of which are based on Android, all under its XPERIA range. In fact, the vendor was the first to launch a smartphone on Android 2.3, after having missed the Android 2.2 cycle completely in 2H10, which suggests that SEMC has now been working more closely with Google.

16 March 2011
IT Hardware 190
Figure 219: SEMC Focusing on Its XPERIA Range to Improve Its Smartphone Positioning detailed specifications of smartphones at SEMC SEMC XPERIA PLAY XPERIA Pro XPERIA Neo XPERIA Arc XPERIA X8 XPERIA X10 mini pro XPERIA X10 mini Vivaz pro
ImageTechnology GSM / UMTS / HSPA GSM / UMTS / HSPA GSM / UMTS / HSPA GSM / UMTS / HSPA GSM / UMTS / HSPA GSM / UMTS / HSPA GSM / UMTS / HSPA GSM / UMTS / HSPAAnnouncement date Feb-11 Feb-11 Feb-11 Jan-11 Jun-10 Feb-10 Feb-10 Feb-10Shipping date Mar-11 2Q-11 Mar-11 Mar-11 Sep-11 Jun-10 May-10 May-10Operating System Android 2.3 Android 2.3 Android 2.3 Android 2.3 Android 2.1 Android 2.1 Android 2.1 Symbian S60Processor 1 GHz 1 GHz 1 GHz 1 GHz 600 MHz 600 MHz 600 MHz 720 MHzRAM 380 MB 320 MB 320 MB 512 MB 168 MB 128 MB 128 MB 75 MBMemory 8 GB 8 GB 8 GB NA 2 GB 2 GB 2 GB 8 GBPixels 480 x 854 480 x 854 480 x 854 480 x 854 320x480 240x320 240x320 360x640QWERTY gaming buttons yes no no no yes no yesTouchscreen Capacitive Capacitive Capacitive Capacitive Capacitive Capacitive Capacitive ResistiveDimensions (wxhxd) (mm) 119 x 62 x 16 120 x 57 x 13.5 116 x 57 x 13 125 x 63 x 8.7 99 x 54 x 15 90 x 52 x 17 83 x 50 x 16 109 x 52 x 15Weight (g) 175 140 126 117 104 120 88 117Volume (cc) 118 92 86 69 80 80 66 85.0Screen (inches) 4.0 3.7 3.7 4.2 3.0 3 3 3.2Camera Megapixel 5.0 8.0 8.0 8.0 3.2 5.0 5.0 5Wi-Fi yes yes yes yes yes yes yes yesGPS yes yes yes yes yes yes yes yesTalk time (hrs) 8.4 7.0 7.0 7.0 4.8 4.0 4.0 12.5Standby time (hrs) 425 430 430 430 446 285 285 430
Source: Company data, Credit Suisse research.
Sony partnership finally bearing fruit. After long speculations on the Internet blogs, SEMC also announced a new smartphone called XPERIA Play, which is the first certified Playstation gaming smartphone. Equipped with an embedded GPU processor (Adreno) delivering 60fps mobile gaming display and supporting multiplayer gaming, the company is also targeting to make an impression in the CDMA market with support from Verizon for this device.
Palm/Hewlett-Packard (4.0/10)—New Life Just Beginning
With the introduction of the Palm Pre and webOS in January of this year, we believe HP will refresh the current legacy portfolio quickly and leverage the new platform. We believe new verticals in addition to smartphones may also be an option longer term for Palm. At HP’s recent announcement, it introduced several new products from the Palm acquisition. The products seem promising and include a slimmed down smartphone (HP Veer), a Pre 2 successor (Pre 3), and an iPad-like WebOS tablet (HP Touchpad). Notably, HP did not really mention of the Palm brand, but focused on the WebOS asset.

16 March 2011
IT Hardware 191
Figure 220: Palm Making a New Beginning with webOS 2.2 Products detailed specifications of smartphones at Palm / Hewlett-Packard Palm / HP Pre 3 Veer Pre 2 Pre Plus Pixi Plus
ImageTechnology GSM / HSPA/CDMA/EV-DO GSM / UMTS / HSPA GSM / HSPA/CDMA-EV-DO GSM / HSPA/CDMA-EV-DO GSM / HSPA/CDMA-EV-DOAnnouncement date Feb-11 Feb-11 Oct-10 Mar-10 Mar-10Shipping date Q2-11 Q3-11 Nov-10 May-10 Jun-10Operating System WebOS 2.2 WebOS 2.2 WebOS 2.0 WebOS 1.3.5 WebOSProcessor 1.4 GHz 800 MHz 1 GHz 600 MHz 600 MHzRAM 512 MB NA 512 MB 512 MB NAMemory 8 GB 8 GB 16 GB 16 GB 8 GBPixels 480x800 320x400 320x480 320x480 320x400QWERTY yes yes yes yes yesTouchscreen Capacitive Capacitive Capacitive Capacitive CapacitiveDimensions (wxhxd) (mm) 111 x 64 x 16 84 x 54.5 x 15.1 100.7 x 59.6 x 16.9 100.5 x 59.6 x 17.0 111 x 55 x 10.9Weight (g) 156 103 145 138 93Volume (cc) 114 69 101 102 67Screen (inches) 3.6 2.6 3.1 3.1 2.6Camera Megapixel 5.0 5.0 5.0 3.2 2.0Wi-Fi yes yes yes yes yesGPS yes yes yes yes yesTalk time (hrs) NA 5.0 5.5 4.0 5.5Standby time (hrs) NA 300 350 350 350
Source: Company data, Credit Suisse research.

16 March 2011
IT Hardw
are 192
Figure 221: Smartphone Portfolio Summary for the Top Handset Vendors
Vendor Total s/p Available Expected GSM UMTS/GSM CDMA TD-SCDMA Symbian iOS Microsoft WP7 BlackBerry OS Android Linux webOS OthersNokia 22 100% 0% 9% 91% 0% 0% 95% 0% 0% 0% 0% 0% 5% 0% 0%RIMM 14 100% 0% 7% 57% 36% 0% 0% 0% 0% 0% 100% 0% 0% 0% 0%HTC 33 73% 27% 0% 82% 18% 0% 0% 0% 9% 18% 0% 67% 0% 0% 6%Apple 3 100% 0% 0% 67% 33% 0% 0% 100% 0% 0% 0% 0% 0% 0% 0%Palm 6 67% 33% 0% 50% 50% 0% 0% 0% 0% 0% 0% 0% 0% 100% 0%Motorola 32 88% 13% 3% 56% 31% 9% 0% 0% 0% 0% 0% 97% 0% 0% 3%Samsung 68 94% 6% 18% 69% 12% 1% 0% 0% 3% 3% 0% 41% 3% 0% 50%SEMC 13 62% 38% 0% 92% 0% 8% 15% 0% 15% 0% 0% 69% 0% 0% 0%LG 41 85% 15% 12% 66% 17% 5% 0% 0% 10% 7% 0% 56% 0% 0% 27%Acer 19 79% 21% 5% 89% 0% 5% 0% 0% 32% 0% 0% 68% 0% 0% 0%Huawei 10 80% 20% 10% 90% 0% 0% 0% 0% 0% 0% 0% 100% 0% 0% 0%ZTE 12 75% 25% 25% 67% 8% 0% 0% 0% 33% 0% 0% 58% 0% 0% 8%Total/ Average 273 86% 14% 10% 73% 15% 3% 8% 1% 8% 4% 5% 52% 1% 2% 18%
Samsung with 68 devices already selling in the market or expected to ship soon, has the highest number of smartphone terminals. This is significantly higher than LG (at 41), HTC (at 33) and Motorola (at 32). This higher number of terminals is also driven by the fact that Samsung introduces knock-off versions of successful smartphone range. On the other hand, RIM and SEMC have much lower number of terminals
Smartphone portfolio breakdown by technology and operating system (available and expected handsets)
Apple has filled a gap in its existing portfolio with the launch of CDMA version of iPhone, something which is still missing with Nokia. Other vendors like HTC, Motorola and Samsung have introduced a number of CDMA smartphones specifically to cater to the US market
Samsung, SEMC and LG have increased their focus on Android as can be seen from high Android OS share within their portfolio. This combined with Motorola and smaller vendors like Huawei and ZTE means that over 50% of available smartphone models are running Android OS significantly higher than any other software platform
Smartphone portfolio breakdown by functionality (available and expected handsets)Vendor Camera MP Screen (in) Weight (g) QWERTY Touchscreen Talk time (hrs) MP3 GPS Wi-Fi 16M Color 256K Color 65K Color High Mid LowNokia 4.7 3.0 126.5 45% 73% 8.3 100% 91% 73% 91% 9% 0% 23% 32% 45%RIMM 3.2 2.7 126.9 86% 21% 5.2 100% 100% 93% 7% 14% 79% 21% 50% 29%HTC 5.4 3.5 138.0 15% 100% 6.8 100% 97% 94% 45% 24% 30% 61% 24% 15%Apple 4.4 3.5 136.3 0% 100% 6.3 100% 100% 100% 100% 0% 0% 100% 0% 0%Palm 3.7 2.9 123.1 100% 100% 5.1 100% 100% 67% 67% 33% 0% 17% 83% 0%Motorola 4.9 3.4 141.4 47% 97% 6.4 100% 97% 97% 59% 34% 6% 47% 25% 28%Samsung 3.9 3.2 114.8 24% 94% 7.3 100% 74% 68% 56% 41% 3% 31% 47% 22%SEMC 6.3 3.4 125.8 46% 100% 7.9 100% 100% 100% 62% 23% 15% 62% 23% 15%LG 4.3 3.3 128.9 32% 98% 5.3 100% 83% 85% 32% 66% 2% 32% 49% 20%Acer 3.9 3.3 125.5 16% 100% 5.9 100% 100% 79% 16% 47% 37% 26% 37% 37%Huawei 3.7 3.2 128.1 10% 100% 4.4 100% 40% 80% 20% 80% 0% 0% 0% 100%ZTE 3.3 3.1 116.6 33% 92% 4.6 100% 33% 25% 8% 33% 58% 0% 0% 100%Total/ Average 4.4 3.3 126.6 33% 91% 6.4 100% 84% 80% 47% 38% 15% 34% 36% 30%
Functionalities like touchscreen, MP3, GPS, Wi-Fi are almost integral features for any smartphone as can be seen from the fact that 91% of smartphone models support touchscreen, 84% support GPS and 80% embrace Wi-Fi . For MP3, all smartphones support this functionality
Given the increasing adoption of touchscreen feature, screen size is becoming a key consideration. On an average, smartphones currently have 3.3” screen, with Apple and HTC leading the way with an average of 3.5”. Nokia and RIMM still remain behind competition in this area
In the low-end, Asian vendors like Huawei and ZTE have introduced a number of smartphone devices based on Android OS, which presents a risk to Nokia and Samsung who earlier dominated the low-end smartphone space. In fact, 30% of devices are selling at an ASP of <$250
Source: Company data, Credit Suisse research.

16 March 2011
IT Hardware 193
IPR—Important at Lower Margins If anything, we believe that the sheer number of IPR-related litigation cases (examples in Figure 222) in the wireless industry over the past 24 months shows that it is high on the corporate agenda and remains a clear obstacle and barrier to entry into the industry. If anything, we believe the conflicts of IPR will become more significant in coming years, and we arrive at the following main conclusions:
Slower growth within wireless. We would argue that the potential for slower industry revenue growth in the coming years is likely to increase the focus on earning returns on every dollar of R&D investment. Indeed, even with our optimistic expectations related to industry demand for infrastructure and handsets, we at best expect revenue growth for the handset market to be flat over the midterm. What this means is that wireless pioneers, such as Nokia, Motorola, Ericsson, and Qualcomm, will need to generate returns on every aspect of their investment. In particular, we believe that a successful and robust IPR position can convey benefits of incremental revenues and a stronger bargaining position in negotiations, as well as a cost advantage. We highlight that all these advantages provide long-term benefits.
Convergence with computing raises the prospect for conflicts. Ultimately, the smartphone and tablet market create the complete convergence of computing and mobile telephony. This has meant that, for the first time, both PC players and mobile device companies each have a significant hand to play in such markets, each of them also bring a different field of expertise and IPR. The best example of this are the disputes between Nokia and Apple, whereas Nokia has alleged violation of patents related to wireless standards, to which Apple has responded with suits in the area of touchscreen technology.
Figure 222: Ongoing Litigation in the Smartphone Space Between Major Vendors Plaintiff Defendant Date Jurisdiction Rational of Litigation Nokia Apple 22-Oct-09 Delaware, US Nokia alleging that Apple infringes on ten of its patent relating to related to GSM,
UMTS, and WLAN standards Apple Nokia 12-Dec-09 NA Apple alleging that Nokia violated patents related to the iPhone's user interface Nokia Apple 29-Dec-09 ITC,US Nokia alleging that Apple infringes patents involved with the camera, battery life, touch
screen technology, speaker and technology-related message Apple HTC 02-Mar-10 Delaware, US Apple alleging that HTC is infringing 20 patents related to the iPhone's user interface,
underlying architecture, and hardware Nokia Apple 07-May-10 Wisconsin, US Nokia alleging that Apple infringes upon the patents relate to enhanced speech and
data transmission Apple Nokia 27-Sep-10 UK Ongoing case Microsoft Motorola 01-Oct-10 Seattle/ITC, US Microsoft alleging that Motorola infringes upon nine patents relate to synchronizing e-
mail, calendars and contacts, scheduling meetings, and notifying applications of changes in signal strength and battery power
Motorola Apple 07-Oct-10 Northern Illinois & Southern Florida
Motorola alleging that Apple violated patents3G, GPRS and WiFi technologies, as well as antenna design, proximity sensing, device synchronization, MobileMe and more
Apple Motorola 30-Oct-10 Wisconsin, US Apple alleging that Motorola violated patents related to the touchscreen software, as well as other display technologies
Nokia Apple 16-Dec-10 UK Nokia alleging that Apple infringes patents involved with the user interface, on-device app stores, signal noise suppression and modulator structures
Nokia Apple 16-Dec-10 Mannheim, Germany
Nokia alleging that Apple infringes patents involved with the on-device app stores, caller ID, display illumination and the integration of multiple radios
Nokia Apple 16-Dec-10 Dusseldorf, Germany
Nokia alleging that Apple infringes patents involved with the touch user interface, antenna structures, messaging functionality and chipsets
Nokia Apple 16-Dec-10 Hague, Netherlands
Nokia alleging that Apple infringes patents involved with the signal noise suppression and data card functionality
Source: Company data, Credit Suisse research.
IPR will eat a larger share of relative profits. In a market for smartphones that will move down the price points going forward, we believe that risks of margin pressure will continue. In this context, paying IPR royalty rates as high as 4-5% can eat into a significant portion of gross margins. In Figure 223, we illustrate a hypothetical scenario for the smartphone segment to demonstrate the relative share of margins, which we believe that IPR may

16 March 2011
IT Hardware 194
consume going forward. In fact, our analysis shows that IPR will account for 16-17% of the gross profit per smartphone unit by 2015 increasing from a level of 13-14%, currently as industry GMs continue to come under pressure.
Figure 223: 3G Royalty on a per-Unit Basis to Increase as % of Gross Profit for the Smartphone Industry in the Long Term 2009 2010 2011E 2012E 2013E 2014E 2015E Smartphone units (mn) 172.4 296.6 451.2 593.8 740.3 888.1 1,041.3 Smartphone ASP ($) 328 304 274 246 217 191 168 Smartphone revenues ($ bn) 56.5 90.2 123.4 146.2 160.4 169.3 174.7 Gross margin (%) 33.2% 32.2% 31.2% 30.2% 29.2% 28.2% 27.2% Gross profit per unit ($) 108.9 97.9 85.4 74.4 63.3 53.8 45.7 3G royalty rate (%) 4.5% 4.5% 4.5% 4.5% 4.5% 4.5% 4.5% 3G royalty per unit ($) 14.8 13.7 12.3 11.1 9.7 8.6 7.5 3G royalty per unit as % of gross profit 13.5% 14.0% 14.4% 14.9% 15.4% 16.0% 16.5%
Source: Company data, Credit Suisse estimates.
Nokia has an IPR advantage. Post Nokia’s IPR settlement with Qualcomm, we believe that Nokia is paying Qualcomm an ongoing royalty rate of 1.3%, which is materially lower than other vendors at around 3.2%. This is owing to the strong patent portfolio Nokia holds in 3G technology. We estimate that, based on IPR alone, Nokia enjoys a cost advantage of some 300bps of margin compared with competition if we take into account royalty payments it receives from other smaller vendors with limited patent portfolio.
Other vendors will have to pay full rates. Most of the vendors other than Nokia are likely to suffer an asymmetric disadvantage on the cost side. It also means that such companies are most at risk from the disruptive influence that can come from having a weak IPR position. We believe that RIM is an example of a company that is already aware of this threat and has been actively licensing and purchasing patents, as we show in Figure 224.
Figure 224: RIM Has Spent Some $1.7bn for IPR Purchases Over the Past Four Years in US$ millions, unless otherwise stated
0
100
200
300
400
500
600
700
800
F2005 F2006 F2007 F2008 F2009 F2010 F2011 (YTD)0%
1%
2%
3%
4%
5%
6%
7%
Intangible asset acquisitions Intangible assets acquisition as % of Sales Source: Company data, Credit Suisse research.

16 March 2011
IT Hardware 195
Wireless IPR Is Concentrated in the Hands of a Few
We acknowledge that measuring the value of the 3G IPR portfolio of a given vendor is a difficult and complex process. The crux of the matter surrounding WCDMA patents is how essential IPR is held across various technology providers.
Many companies own 3G IPR. One of the striking observations when looking at Figure 225 is that 18 companies claim to own or do own essential IPR. While many of these claims may not be very strong, we believe it does serve to highlight that to the extent to which all companies enforce their IPR position, the risk of the cumulative royalty rate becoming too large remains a risk.
However, it is highly concentrated in the hands of a few vendors. Again as per Figure 226, although there are indeed 18 companies that have been judged to hold essential IPR for WCDMA, over 70% of these are held by four companies, namely Nokia, Ericsson, Qualcomm, and Motorola, which highlights our belief that core WCDMA patents are concentrated in the hands of few major vendors.
Figure 225: Qualcomm Leads on Declared Patents. . . % of declared WCDMA patents
Figure 226: . . .But Nokia Leads on Essential Patents % of essential patents
Qualcomm46%
Matsushita1%
NEC2%
Other4%Nokia
3%Interdigital Tech
4%
AirTouch5%
Philips5%
Motorola9%
Ericsson21%
Interdigital2%
Nokia25%
Hitachi3%
Fujitsu3%NTT DoCoMo
3%
Philips3%
Others4%
Matsushita4%
Siemens5%
Motorola7%
Qualcomm19%
Ericsson22%
Source: “Patent Counting, A Misleading Index of Patent Value: A Critique of Goodman & Myers” – Martin & De Meyer, 2006.
Source: Cellular Standards and Patents, Goodman & Myers, 2005.
Nokia is paying structurally lower royalty rates. Based upon the disclosure given at the time of the Nokia-Qualcomm settlement, we believe that deal had two major financial components. First, as has been publicly disclosed, Nokia paid Qualcomm an upfront fee of around $2.5bn. Second, the settlement implied that Nokia agreed to pay Qualcomm an ongoing royalty rate of 1.3%. However, in addition to this, we believe Nokia receives net royalties from other vendors at a rate of 0.5%. Hence, we conclude that the company’s net royalty rate should be an outflow of around 0.3%, as shown in Figure 227, which is significantly lower than peers.
Figure 227: We Estimate Cumulative Royalty Rate for Nokia to Be Around 0.3% 2010 WCDMA market
share (%) WCDMA Volumes
(mn) WCDMA ASP ($) Cumulative Royalty
Rate (%) Nokia 33.6% 117.0 222.5 0.3% Motorola 1.9% 6.5 222.5 4.5% Samsung 17.1% 59.6 222.5 3.2% SEMC 5.8% 20.4 222.5 4.0% LG 9.3% 32.4 222.5 4.5% Apple 13.7% 47.6 600.0 1.6% RIM 5.6% 19.4 308.2 4.5% Others 13.0% 45.3 222.5 4.5% Total 100.0% 348.2 278.9 2.3% Nokia margin premium through IPR 2.0%
Source: Company data, Credit Suisse estimates.

16 March 2011
IT Hardware 196
Overall Patent Portfolio Will Also Matter as Technologies Converge
Up until now, most of the IPR advantages for mobile devices have been linked to wireless standards; however, we believe that the overall patent portfolio increasingly will also become important, especially as technologies linked to operating system, computing, user interfaces, and cloud synchronization are used in smartphones and tablet devices. As seen in Figure 228, in 2005-07, the number of patents filed by Apple ranged between 100 to 160 per year, which was less than even 20% of the number of patents filed by Nokia over the period. However, since then, Apple has ramped up its IPR portfolio, with the company being assigned over 700 patents in 2010, more than 4x the number in 2007, and almost 0.8x that of Nokia. This suggests that Apple has been significantly narrowing the gap over the past couple of years, as it considers IPR to be a key asset in the future, especially with the convergence of mobile technologies.
Figure 228: Number of Patents Assigned to Apple Have Rapidly Increased in 2008–2010 Number of patents granted per year 2005 2006 2007 2008 2009 2010 Nokia 542 810 805 822 1,004 934 % change -24% 49% -1% 2% 22% -7% Apple 103 133 157 254 399 722 % change -17% 29% 18% 62% 57% 81% Microsoft 787 1,614 1,958 2,310 3,160 3,305 % change 19% 105% 21% 18% 37% 5% Google 7 22 35 60 147 282 % change 133% 214% 59% 71% 145% 92% Apple to Nokia patent ratio (%) 19% 16% 20% 31% 40% 77%
Source: U.S. Patent Office, Credit Suisse research.

16 March 2011
IT Hardware 197
IT Services—2011 Shows a Gradual Recovery While the companies within our sector are often characterized as IT hardware vendors, the actual end market for IT services relatively dwarfs the hardware opportunity. As shown in our estimates, this market was over $780B and some 2x the actual hardware procured. Furthermore, software and services businesses for the multinational enterprise-orientated vendors remain significant, representing anywhere between 15% and 57% of sales. (See Figure 233.) Indeed, the services focus seems to be increasing on the part of company management, as there can be benefits of having a successful services business:
Increased ability to bundle solutions and customer stickiness. At the basic level, the sale of a storage unit or server unit can increasingly be seen as a one-time transaction of an increasingly commoditized segment of the IT industry; however, the ability to wrap around an outsourced services contract, which may involve maintenance, support, and elements of consulting, is fundamentally far more sustainable.
Figure 229: IT Services Attach to Hardware to Remain Steady 2005 2006 2007 2008 2009 2010 2011 2012 2013 2014 2015 2005 -
2015 2010 - 2015
IT Spending ($m) CAGR CAGR Computing Hardware 345 349 370 382 335 364 391 418 439 462 491 1.1% 6.2% Software 143 171 209 228 222 236 254 271 289 307 328 10.5% 6.8% IT Services 629 671 743 804 763 782 815 856 899 944 992 4.5% 4.9% Telecom 1,531 1,665 1,854 1,979 1,908 2,020 2,113 2,190 2,278 2,367 2,463 5.7% 4.1% Overall IT 2,648 2,856 3,177 3,393 3,228 3,402 3,573 3,735 3,905 4,081 4,274 5.1% 4.7% IT Spending Mix Computing Hardware 13.0% 12.2% 11.7% 11.2% 10.4% 10.7% 11.0% 11.2% 11.2% 11.3% 11.5% 11.5% 11.2% Software 5.4% 6.0% 6.6% 6.7% 6.9% 6.9% 7.1% 7.3% 7.4% 7.5% 7.7% 6.5% 7.3% IT Services 23.7% 23.5% 23.4% 23.7% 23.6% 23.0% 22.8% 22.9% 23.0% 23.1% 23.2% 23.5% 23.0% Telecom 57.8% 58.3% 58.4% 58.3% 59.1% 59.4% 59.1% 58.6% 58.3% 58.0% 57.6% 58.6% 58.5% Overall IT 100% 100% 100% 100% 100% 100% 100% 100% 100% 100% 100% 100% 100% Services Attach to Hardware
1.9x 1.9x 2.0x 2.1x 2.3x 2.1x 2.1x 2.0x 2.0x 2.0x 2.0x 2.05x 2.06x
Source: Company data, Credit Suisse estimates.
Improved financial importance, following the IBM blueprint. The pioneer of the vertically integrated hardware, software, and services business model is consistently seen as IBM. Through a combination of divestitures, acquisitions, and internal management focus, the core business mix of IBM has evolved (See Figure 230.) This had led to a better operating line than that of the company’s peers over time.

16 March 2011
IT Hardware 198
Figure 230: IBM Operating Performance as Services Increases
% of Rev
% of Profit
IBM Op Margin
Services PTI %
0%
10%
20%
30%
40%
50%
60%
70%
2003 2004 2005 2006 2007 2008 2009 2010 2011E 2012E
Source: Company data, Credit Suisse estimates.
Our analysis of the IT services market is based upon several macro models and leads to several important conclusions:
The macro backdrop for IT services is a long-term positive. Over the next five years, whether we look at IT spending relative to GDP levels, relative to hardware software attach rates, or against revenue growth for corporate (based upon S&P), we find that IT services is being underconsumed by the global economy, and this points to accelerating growth. For example, IT services as a percentage of global GDP is at 1.3%, but in 2000-09, it rose consistently from 1.07% to 1.32% and hit a high water mark of 1.37% in 2008. If this trend resumes, then the CAGR in the $780bn services market would run 5.8% per annum. We are forecasting slightly lower annual growth of 4.9% during the same time period. Within this context, we see faster growth in segments such as process management and slower growth in hardware maintenance and support.
2011 recovery will be sluggish. Near term, after limited revenue growth in IT services in 2010, we believe that 2011 will continue to show late cycle characteristics. In the near term, we believe that growth over IT service spend will be relatively muted at 4.3%; the rate of growth is supported by several factors. First, we note that our proprietary Credit Suisse IT Survey points to only 4.5% growth in 2011. Growth will be faster in infrastructure outsourcing and slower in BPO. Second, our analysis, based upon contract data over the past five years, shows continued sluggishness in IT outsourcing. Total deal value was down 11% in 2010, and average deal activity remains lackluster, despite the recovery in 2H10. Third, we look at the book–to-bill ratios for leading services companies such as IBM and HP. Here, signings have strengthened to a ratio slightly over 1x on average, which hardly inspires for the near term.
Deal characteristics are deteriorating for some vendors. After analyzing data from both TPI and Datamonitor, we believe that several headwinds are developing for multinational companies. First, we see a shift to smaller deal sizes; for example, deal sizes of $25-50mn now account for 47% of the volumes and 12% of TCV, the highest level in a decade. Second, the restructuring of deals during the macroeconomic downturn seems to have picked up even beyond cyclical levels, with $26bn of deals being restructured, or 33% of those announced. Third, Indian heritage companies are benefitting from smaller deal sizes and improvements in offerings. We see Indian heritage companies gathering market share momentum, and they accounted for 20% of twelve-month contact value, despite having only a collective 3% share of the market. Offshore providers can pose a challenge within specific offerings (such as application maintenance and development) to large multinationals, especially as deal sizes and durations are reduced.

16 March 2011
IT Hardware 199
Survey says IT services spending to rise in 2011, yet lag overall IT spending. Based on our proprietary IT survey of 60 CIOs and IT managers, IT services is expected to grow 4.5% in CY11, up from 1.4% in CY10 and near our annual 4.3% forecast. While the accelerated growth is a positive for IT services, it remains a laggard to overall IT spending, which is expected to accelerate from 2.5% growth in CY10 to 5.0% in CY11.
A fragmented market likely to persist, with M&A on the rise. In IT services, market leader IBM with a fully fledged offering, is present in almost all verticals and geographies, and yet only has a 7% of global share. The top 20 vendors only control a 39% share. In other words, IT services remains quite fragmented from a market structure perspective. Further, market share tends to evolve very gradually. Consequently, this means if major multinational companies have the need to access specific verticals, service offerings, or geographies, growth is most likely be inorganic. We estimate over $40bn of M&A has been completed in the past three years within software and services by our companies in order to expand offerings or geographies; services firms will continue their M&A strategy.
IBM leading the market with a fully fledged offering. IBM’s 7% market share is very defendable within IT services (57% of revenues and 40% of PTI), with the segment being geographically diversified and employing an estimated 200,000 services and IT professionals. Importantly, share is actually above 10% in markets such as Eastern Europe and Asia-Pacific. From an offering perspective, IBM holds a share of almost 12% in IT management (i.e., application management, operation management) and of 4% on software support. We note in Figure 265 that IBM services is showing tepid signs of revenue recovery as it moves back in to positive territory in Q410, with growth in both the backlog and signings. In addition, when we look at both the transactional and the outsourcing signings, both of these are showing y/y improvement.
HP—now for the revenue growth. HP effectively doubled its position within the services market post the acquisition of EDS in Q408 and now holds a 4.5% market share. This acquisition brought critical global scale to HP offerings in the IT services business and made it a critical part of operations and strategy. (This segment now represents some 28% of revenues and 39% of operating profits.) Within Asia-Pacific, its share is 6.4%, and in LatAm it has an 8.2% share, so the company is well exposed to faster-growing emerging markets. So far, focus restructuring has been the key focus. As shown in Figure 280, on a pro forma basis, HP’s OMs were actually approximately 9-10%, given lower profitability of EDS. Through a series of restructurings and a refocus to segment growth, operating margins have expanded to 16%. While revenue growth has been soft, we see signs of improvement; with a book to bill over 1x and contract momentum, we see a pick-up in deals within North America as well as increase winnings as an incumbent.
Dell struggling for scale. With the $3.6B acquisition of Perot systems in 2009, Dell expanded its hardware-centric services line and expanded managed services, application services, BPO, and business consulting. While this brought additional scale for Dell in the services business, it is still a ways away from reaching critical or relevant scale, with only 1% share of the services market. In terms of exposure, Dell generates some 45% of services revenues form hardware maintenance and support and a further 25% from IT management. We believe that this makes it much more difficult to argue that the current entity is based on core, high-value add service offerings that typically center on consulting and applications. By vertical, we note that given Perot strength, service business is well positioned in healthcare, in which it has a leadership position. By region, some 72% of IT service sales come from North America, with very low exposures on average to most emerging markets. We conclude that, within the context of a slow-growth recovery in the IT services market, emerging markets and certain niches within services such as applications and software support will be faster-growth segments and not directly benefit Dell.
Xerox—services synergies coming through. While mainly known for its enterprise printing business, Xerox’s $6.6B acquisition of ACS in February 2010 has placed it firmly into the services market. Xerox doubled its services revenues to nearly $10B (about 45% of total

16 March 2011
IT Hardware 200
revenues) and accounted for 1.6% of the overall services market. Nevertheless, the company had over a 5% share in process management and BPO. Xerox reports its services as business process outsourcing (52% of revenues) and document outsourcing (legacy XRX and about 35% of revenues), with the remainder in ITO. Xerox generates about 60% of its services revenues from commercial segments (such as HR, F&A, education, financial services, healthcare payers, customer care, and healthcare providers). With the acquisition of ACS, Xerox has set lofty goals of revenue and cost synergies. Within the first year of acquiring ACS, the company has identified a $5B pipeline of deals that is either new to ACS or Xerox or an expansion of scope resulting from the acquisition. So far, the signings announcements have been relatively impressive, with signings of $14.7B (+13% y/y) and synergy pipeline of $5B and 2H10 revenue growth outperforming the wider services market. The execution is key to the overall company, as it expects to generate an incremental $750M in revenues and cost saves of $375M by 2012, with upside potential of $1,200M in revenues and $400M in cost saves.

16 March 2011
IT Hardw
are 201
Figure 231: Credit Suisse IT Services Model 2000-2010 2010-2015
2005 2006 2007 2008 2009 2010 2011E 2012E 2013E 2014E 2015E CAGR CAGRWorld Wide IT Services 628,713 670,876 742,961 804,476 763,091 781,956 815,269 856,449 899,156 944,097 991,509 4.7% 4.9%Y/Y Growth 6.6% 6.7% 10.7% 8.3% -5.1% 2.5% 4.3% 5.1% 5.0% 5.0% 5.0%
Hardware M aintenance & S uportClient Comput ing Hardware Services 11,800 12,197 12,920 13,503 12,504 12,162 12,179 12,581 12,972 13,373 13,783 3.3% 2.5%Document Management Hardware Serv ices 12,064 11,649 12,349 13,088 12,099 11,804 11,869 12,171 12,505 12,846 13,189 -1.0% 2.2%Enterprise Comput ing Hardware Serv ices 20,461 20,708 21,469 22,795 21,212 22,169 22,019 22,503 22,968 23,432 23,893 1.0% 1.5%Telecom Equipm ent Support 26,691 27,973 30,369 32,679 30,601 31,137 32,600 33,874 35,175 36,513 37,895 3.5% 4.0%Storage Support Services 8,267 8,318 9,030 9,041 8,477 8,567 8,835 9,166 9,507 9,859 10,224 1.5% 3.6%Total 79,283 80,845 86,138 91,106 84,892 85,838 87,502 90,296 93,126 96,022 98,985 1.8% 2.9%Y/Y Growth 3.6% 2.0% 6.5% 5.8% -6.8% 1.1% 1.9% 3.2% 3.1% 3.1% 3.1%
Software SupportAppli cations Software Services 15,651 16,619 19,013 21,470 21,424 22,351 23,865 25,366 26,973 28,676 30,485 7.1% 6.4%Infrastructure Software Serv ices 23,937 25,576 28,612 32,585 33,165 35,031 37,352 39,903 42,563 45,390 48,412 6.8% 6.7%Total 39,588 42,195 47,626 54,055 54,590 57,382 61,217 65,269 69,537 74,066 78,897 6.9% 6.6%Y/Y Growth 7.2% 6.6% 12.9% 13.5% 1.0% 5.1% 6.7% 6.6% 6.5% 6.5% 6.5%
ConsultingBusiness Consult ing 19,804 20,995 23,148 24,993 22,182 22,567 23,234 24,096 24,972 25,899 26,859 1.6% 3.5%IT Consulting 38,302 41,437 46,912 51,244 47,405 48,891 50,952 53,247 55,630 58,161 60,819 3.3% 4.5%Total 58,106 62,432 70,060 76,238 69,587 71,458 74,186 77,344 80,602 84,060 87,678 2.7% 4.2%Y/Y Growth 7.2% 7.4% 12.2% 8.8% -8.7% 2.7% 3.8% 4.3% 4.2% 4.3% 4.3%
Development and IntegrationAppli cation Development 78,975 83,923 92,227 101,644 94,171 95,501 99,097 103,316 107,716 112,637 117,776 3.0% 4.3%Deployment 38,550 41,672 47,771 51,991 47,877 48,626 51,447 53,869 56,332 58,871 61,527 4.2% 4.8%Integration 62,886 67,956 77,205 84,487 78,468 81,144 85,703 90,129 94,585 99,218 103,881 5.1% 5.1%Total 180,411 193,551 217,202 238,122 220,516 225,271 236,246 247,315 258,633 270,726 283,184 4.0% 4.7%Y/Y Growth 6.6% 7.3% 12.2% 9.6% -7.4% 2.2% 4.9% 4.7% 4.6% 4.7% 4.6%
IT M anagementAppli cations Management 30,262 32,485 35,846 38,741 37,960 38,986 40,819 43,011 45,431 47,955 50,739 7.1% 5.4%Help Desk Management 13,527 14,385 15,553 16,240 15,680 16,113 16,619 17,473 18,280 19,057 19,858 4.4% 4.3%Operat ions Managem ent 129,310 138,266 152,431 163,883 158,391 161,390 168,889 177,767 186,786 196,203 206,389 6.1% 5.0%Total 173,099 185,137 203,830 218,863 212,031 216,489 226,327 238,250 250,497 263,215 276,986 6.2% 5.1%Y/Y Growth 5.8% 7.0% 10.1% 7.4% -3.1% 2.1% 4.5% 5.3% 5.1% 5.1% 5.2%
Process Management 98,226 106,717 118,106 126,093 121,476 125,519 129,791 137,976 146,762 156,008 165,780 6.8% 5.7%Y/Y Growth 9.9% 8.6% 10.7% 6.8% -3.7% 3.3% 3.4% 6.3% 6.4% 6.3% 6.3%
2000-2009 2010-2015Regions 2005 2006 2007 2008 2009 2010 2011E 2012E 2013E 2014E 2015E CAGR CAGRNorth America 266,599 284,887 305,742 323,102 312,773 321,611 332,527 348,708 366,510 385,190 404,884 3.7% 4.7%Lati n Ameri ca 17,124 20,209 24,273 27,920 26,626 29,033 31,619 34,261 36,649 39,209 41,985 6.9% 7.7%Eastern Europe 8,572 9,235 11,377 13,308 11,665 11,369 11,755 12,539 13,388 14,298 15,272 5.8% 6.1%Western Europe 201,353 215,029 246,036 265,590 236,607 230,294 236,076 244,834 253,187 261,828 270,552 5.1% 3.3%Middle East & A frica 10,314 11,358 13,711 15,767 14,804 14,495 15,221 16,094 17,109 18,211 19,413 6.2% 6.0%Asi a Pacif ic 40,003 44,357 52,061 55,797 53,732 62,553 69,146 75,217 81,840 89,128 97,139 8.8% 9.2%Japan 84,748 85,801 89,761 102,993 106,883 112,601 118,924 124,795 130,472 136,234 142,265 4.5% 4.8%Total 628,713 670,876 742,961 804,476 763,091 781,956 815,269 856,449 899,156 944,097 991,509 4.7% 4.9%Y/Y Growth 6.6% 6.7% 10.7% 8.3% -5.1% 2.5% 4.3% 5.1% 5.0% 5.0% 5.0%
% of GDP 2005 2006 2007 2008 2009 2010 2011E 2012E 2013E 2014E 2015E Avg '00-'10 Avg '10-'15North America 1.8% 1.8% 1.9% 2.0% 2.0% 2.0% 2.0% 2.1% 2.1% 2.2% 2.2% 1.9% 2.1%Lati n Ameri ca 0.5% 0.6% 0.6% 0.7% 0.7% 0.7% 0.7% 0.8% 0.8% 0.8% 0.8% 0.6% 0.7%Eastern Europe 0.4% 0.4% 0.5% 0.5% 0.5% 0.5% 0.5% 0.5% 0.5% 0.5% 0.5% 0.4% 0.5%Western Europe 1.3% 1.3% 1.5% 1.6% 1.5% 1.4% 1.4% 1.4% 1.5% 1.5% 1.5% 1.4% 1.4%Middle East & A frica 0.3% 0.3% 0.4% 0.4% 0.4% 0.4% 0.4% 0.4% 0.4% 0.4% 0.4% 0.4% 0.4%Asi a Pacif ic 0.5% 0.5% 0.5% 0.5% 0.5% 0.5% 0.5% 0.5% 0.6% 0.6% 0.6% 0.5% 0.5%Japan 1.6% 1.6% 1.7% 1.9% 2.1% 2.2% 2.2% 2.3% 2.4% 2.4% 2.5% 1.9% 2.3%CS esti mate 1.2% 1.2% 1.3% 1.4% 1.3% 1.3% 1.31% 1.33% 1.35% 1.36% 1.38% 1.3% 1.3%Histori c Growth rate 1.2% 1.2% 1.3% 1.4% 1.3% 1.3% 1.33% 1.35% 1.38% 1.41% 1.44% 1.3% 1.4%
We are estimating continued IT Service growth just north of 5% till 2015 based on global GDP growth, hardware attach rates, and technology cycles :
1) Macro backdrop positive for IT Services. IT services as a percent of GDP has increased from 1.07% to 1.32% between 2000-2009 with a high point of 1.37% in 2008. Should the trend continue, our CAGR would be 5.8% per annum, higher than our current estimate of 4.9%.
2) 2011 recovery to be sluggish. While improving from 2010 levels, we expect a 2011 recovery to lag overall tech recovery and expand 4.3%. Our view on 2011 is shaped by softer deal trends, which declined 11% in 2010 despite a stronger 2H recovery.
3) Muted Maintenance & Support growth. While we expect hardware maintenance & support to grow faster than its historic CAGR, it remains the slowest growing segment within services.
4) NA led growth. As companies look to improve operations and remain globally competitive, we estimate the NA market will grow at a 5% CAGR to 2015.
5) Hardware attach. Historically, service sales have been gradually growing as an attach to hardware sales. Looking forward we maintained a 2x level of services spend to our hardware sales estimates.
2005 2 006 2007 200 8 2009 2010 2011 2012 20 13 2014 2015Services Attach to Ha rdware 1.8x 1 .9x 2.0x 2.1 x 2.3x 2.1x 2.1x 2.1x 2. 1x 2.1x 2.0xHardware Maintenance & Support 0.2 3x 0.23x 0.23x 0.24x 0.25x 0. 24x 0.22x 0.22 x 0.21x 0.21x 0. 20xSoftware Support 0.1 1x 0.12x 0.13x 0.14x 0.16x 0. 16x 0.16x 0.16 x 0.16x 0.16x 0. 16xConsulting 0.1 7x 0.18x 0.19x 0.20x 0.21x 0. 20x 0.19x 0.19 x 0.19x 0.19x 0. 18xDevelopment and Integration 0.5 2x 0.55x 0.59x 0.62x 0.66x 0. 62x 0.61x 0.60 x 0.60x 0.59x 0. 58xIT Manageme nt 0.5 0x 0.53x 0.55x 0.57x 0.63x 0. 59x 0.57x 0.57 x 0.57x 0.57x 0. 56xProcess Managem ent 0.2 8x 0.31x 0.32x 0.33x 0.36x 0. 34x 0.34x 0.34 x 0.34x 0.35x 0. 35x
33
44
11
55
22
Source: Company data, Credit Suisse estimates.

16 March 2011
IT Hardware 202
Lay of the IT Service Land Amounting for $780bn and some 1.3% of global GDP, the IT services industry remains highly fragmented and complex. To add to the confusion, the terminology for IT services may change to highlight new offerings or changes in technology overtime. In order to cut through this, we have highlighted a number of key services segments and characteristics. Given the level of historical data available, we have built our model and analysis based on a number of major services segments, including consulting, development and integration, hardware maintenance and support, IT management, process management, and software and support.
While no two deals are alike, we wanted to show a typical IT services project cycle over time. Typically arising from a business need, either an outside consultant or internal consultant will assess the task at hand and the required technology and planning needed. Once a solution has been identified, a provider will work to develop a solution and integrate it with the existing infrastructure. The process management and IT management is more typically IT outsourcing, in which tasks are handed over to third-party providers either to run the client’s technology or to offer the services on their own platform. Once a process or technology is in place, the company spends a great deal on servicing and maintaining the product on an ongoing basis.
Figure 232: IT Services Project Cycle Software SupportHardware Maintenance & Support
Process ManagementIT Management
Development and Integration
ConsultingProject Start –––––––––––––––-> On going support
Source: Credit Suisse estimates.

16 March 2011
IT Hardw
are 203
Figure 233: A Quick Glance at IT Services
11 22 33
IBM HP DELL XRXCAGR 2010- 57% of revenues 28% of revenues 1 5% of revenues 45% of revenues
IT Services 2010 ($mn) Mix 2015 Share Rank Mix Share Rank Mix Sha re Rank Mix Share Rank MixConsulti ng $71 ,458 9% 4.2% 6% 2 7% 2% 8 4% 0% 31 4% 0% 183 0% Business Consulting $22 ,567 3% 3.5%
IT Consulting $48 ,891 6% 4.5%Development and Integration $225 ,271 29% 4.7% 7% 1 27% 3% 7 18% 1% 27 19% 0% 71 3% App lication Development $95 ,501 12% 4.3% Help Desk Manag ement $48 ,626 6% 4.8%
Operation s Manage ment $81 ,144 10% 5.1%Software Support $57 ,382 7% 6.6% 4% 4 4% 4% 3 6% 0% 84 1% 0% 0 0% App lications Software Services $22 ,351 3% 6.4% Infrastructure Software Services $35 ,031 4% 6.7%Hardware Maintenance & Support $85 ,838 11% 2.9% 9% 1 13% 8% 2 20% 4% 4 45% 3% 7 20% Client Computing Hardware Services -PCs $12 ,162 2% 2.5% Ent erprise Comput ing Hardware - Server $11 ,804 2% 2.2% Document Managemen t - Copier and Printer Services $22 ,169 3% 1.5% St orage Support $31 ,137 4% 4.0%
Telecom Equipm ent Support $8, 567 1% 3.6%IT Management $216 ,489 28% 5.1% 12% 1 45% 7% 2 44% 1% 16 25% 1% 11 24% App lication Man agement $38 ,986 5% 5.4% Help Desk Manag ement $16 ,113 2% 4.3% Operation s Manage ment $161 ,390 21% 5.0%Process Management $125 ,519 16% 5.7% 2% 9 4% 2% 6 8% 0% 36 6% 5% 2 53% Process Managem ent- BPO $125 ,519 16% 5.7%Total $781 ,956 100% 4.9% 7% 1 100.0% 5% 2 100.0% 1% 18 100.0% 2% 8 1 00.0%
44
2. HP (28% of total revenues). A close second, HP Services account for 5% of the IT Services market following the acquisition of EDS in 2008. Given its hardware exposure, it accounts for about 8% of the hardware maintenance & support market. The company generated $36B in services revenues with over 210K services employees.
3. DELL (15% of total revenues). Despite the acquisition of Perot systems in 2009, DELL remains a lager in the over all IT Service market with 1% share. Perot expanded its services in IT Management as well as Consulting and Integration. Dell currently has about 43K services employees out of 96K total.
1. IBM Global Services (57% of total revenues). Power player, IBM has number one position in IT Servicers with 7% share. While IBM plays in a number of fields, it has strong share within IT Management, Maintenance & Support, as well as Development & Integration. The company has over 399K employees with the majority within Services and generated $56B in segment revenues in 2010. Its strong positioning within Consulting is also an advantage as it enters early in the project cycle.
4. XRX (45% of total revenues).Market leader in Process Management- BPO following the acquisition of ACS in 2010. XRX accounts for 5% of the Process Management segment and 2% of overall IT Services. The company has a strong US focus in Government, Healthcare, and Transportation as well as Managed Print Services. XRX has about 74K services employees out of a total of 137K.
Source: Company data, Credit Suisse estimates.

16 March 2011
IT Hardware 204
Overall, clients have turned to outsource services as a means to manage costs, maintain support, and quickly respond to business demand. As clients look to do more with fewer resources, we expect in-house investments to continue to shift toward outsourced services. This shift should be aided by increased vendor offerings, improved cost savings, access to new technologies, and improving global talent. While the benefits of outsourcing continue to develop, according to IDC, about 8 of the Global 10 outsource some aspect of IT/BPO, yet only 53 of the Global 100 and even fewer of the Global 1,000 outsource some aspects of IT/BPO. This leaves greater opportunity for penetration, in our view.
Consulting Services (9% of IT Services). Consulting services is currently a $71B market and makes up about 9% of the overall IT services spend. After falling 9% Y/Y in 2009 as discretionary projects were delayed or canceled, 2010 has started to show signs of a rebound, with 3% Y/Y growth. Consulting services include advisory services aimed at helping clients improve business processes and gain efficacies as well as evaluate new technologies. Consulting services are typically early in a deal cycle, as companies bring in consultants to evaluate new technologies or processes and then plan or architect deployment. As the initial step in a new project, controlling the consulting services can lead to better deal management and improved cross-selling. Consulting services are also employed to advise with technology upgrade cycles, M&A integration or systems consolidation, and performance improvements. Consulting typically requires onsite services and specialized talent and can be billed as time and material or on a fixed-price basis. Hardware vendors often offer consulting services at discounts to drum up hardware sales and promote their products. While most multinational service providers offer some type of consulting services, IBM and Accenture (covered by Credit Suisse Computer Services & IT Consulting analyst Bryan Keane) have some of the largest consulting forces and account for about 6% and 4% of the consulting market. They also focus on business consulting rather than just IT consulting, which typically yields higher margins, since it addresses more discretionary, higher-value projects that target business users rather than budget-constrained IT managers.
Development and Integration (29% of IT Services). Once a project has been developed and tested by consultants, it moves on to the development and integration stage. Development and integration is a $225M market and accounts for 29% of total IT services spend. Given the upfront costs sometimes related to development and integration work, many projects saw deals canceled or pushed out, resulting in a 7% revenue decline in 2009. As projects started to flow back to market, we saw a 2% rise in 2010 and look for 5% growth in 2011. Development and integration includes application development, deployment, and integration.
■ Application development accounts for about 42% of development and integration and provides clients with the ability to create new applications or customize packaged applications. Customized products are often required to ensure compatibility with different systems platforms and architectures. With in application development, testing has been an area of focus for many companies, as proper application testing in the early stages reduces the chance for costly re-engineering further down the line. While IBM, HP, and other multinational providers have extensive application development offerings, many of the offshore providers have been able to gain traction in the segment by offering comparable services at attractive price points with their offshore model.
■ Deployment and integration account for about 22% and 36% of the development and integration segment. Deployment services include services such as software and hardware purchases, installation, configuration, tuning, and training. Integration services enable a company to link applications together with its IT infrastructure. Many of the key players typically have a local presence, with onsite support and an attachment with hardware systems (IBM, HP, and Dell). Service providers such as CSC and ACN also compete in this area.

16 March 2011
IT Hardware 205
Infrastructure Outsourcing/IT Management (28% of IT Services). IT management is currently a $216B segment and accounts for 28% of the overall IT services market. The segment comprises application management (18% of the segments), help desk management (7% of the segment), and operations management (the bulk of the segment at 75%). Following 10% and 7% growth in 2007-08, the segment bottomed out in 2009 with a 3% decline. The segment should continue to gain traction, as companies look to cut costs and manage operations with outsourcing. According to Gartner, the top three players are IBM at about 12% market share, followed by HP at 7%, and CSC at 5%.
■ Application management provides companies with application services that support and manage custom applications as well as packaged software applications. Major global vendors include IBM, Accenture, HP, and CSC, grabbing top share in 2009, (according to IDC) followed by Tata Consulting, Fujitsu, and Cognizant. Given the remote capability of application management, many offshore providers compete within this segment.
■ Help desk management provides companies with centralized support for IT requests and problem resolution. While a majority of requests are handled by a staff member, there has been a drive to automate help desk functions in an attempt to lower costs
■ Operations management accounts for the majority of IT management and is the segment that most identify with IT outsourcing. Operations management involves taking over part or all of the day–to-day IT systems management responsibility from the clients. This can include taking over client assets and personnel. The vendor’s responsibility can include systems support, administration, security, monitoring, troubleshooting, and parts/repair management. While IBM is a large player in the segment, HP gained share in the segment with its acquisition of EDS, which similar to CSC is weighed toward operations management. The segment typically requires onsite support services, which limits the impact of offshore providers.
Process Management (16% of Services). Process Management represents a $126B market and accounts for 16% of the overall IT service market. Process management is mainly the IT-enabled components of a business process outsourcing (BPO) engagement. While the overall BPO market is greater and fragmented by function (i.e., HR, F&A, procurement, customer services) and industry vertical (i.e., healthcare, travel, telecom), we will mainly focus on transaction process and business management segments of BPO that are IT enabled. Process management deals are typical longer term in nature, thus providing greater level of visibility. Xerox’s acquisition of BPO provider ACS has given it leading share within the segment at 5%, followed by HP and ACN at 2.4% each.
Hardware maintenance and support services (11% of services). Hardware maintenance and support services is an $86B segment, or about 11% of the overall IT services segment. Hardware maintenance and support includes services such as physical repair (onsite and at centralized locations) and hardware optimization, basic installations, maintenance, and troubleshooting. Hardware maintenance and support services can be employed for client computing, document management (copier and printer services), server hardware, storage support, and telecom equipment support. Segment players include the hardware OEMs like IBM, HP, Dell, and EMC and software providers such as Microsoft, Oracle, and SAP (covered by Credit Suisse Software analyst Phil Winslow), as well as services providers such as ACS (now part of Xerox).
Software Support Services (7% of Services). The software support services market is about $57B and accounts for 7% of the overall IT services market. The segment provides technical support for specific software products. Some of the services include troubleshooting, installation assistants, and other basic support functions. Major providers typically include the software vendor (Microsoft, Oracle, SAP) as well as third party providers. Within the typical hardware vendors, IBM and HP each represent about 4% of the market.

16 March 2011
IT Hardware 206
Services Is Still U.S. Heavy Given the various advantages of services and the growing product offerings, adoption on a global level is expected to continue. Developed and mature markets such as North America, U.K., and Japan maintained spending in services during the downturn, given the long-term nature and the high level of integration with services. The developed markets continue to look toward services for cost containment and system modernization, whereas emerging markets seek to develop their infrastructure and become globally competitive.
Figure 234: Growth in North America Taking Charge 2000-2009 2010-2015
Regions 2005 2006 2007 2008 2009 2010 2011E 2012E 2013E 2014E 2015E CAGR CAGRNorth America 266,599 284,887 305,742 323,102 312,773 321,611 332,527 348,708 366,510 385,190 404,884 3.7% 4.7%Latin America 17,124 20,209 24,273 27,920 26,626 29,033 31,619 34,261 36,649 39,209 41,985 6.9% 7.7%Eastern Europe 8,572 9,235 11,377 13,308 11,665 11,369 11,755 12,539 13,388 14,298 15,272 5.8% 6.1%Western Europe 201,353 215,029 246,036 265,590 236,607 230,294 236,076 244,834 253,187 261,828 270,552 5.1% 3.3%Middle East & Africa 10,314 11,358 13,711 15,767 14,804 14,495 15,221 16,094 17,109 18,211 19,413 6.2% 6.0%Asia Pacific 40,003 44,357 52,061 55,797 53,732 62,553 69,146 75,217 81,840 89,128 97,139 8.8% 9.2%Japan 84,748 85,801 89,761 102,993 106,883 112,601 118,924 124,795 130,472 136,234 142,265 4.5% 4.8%Total 628,713 670,876 742,961 804,476 763,091 781,956 815,269 856,449 899,156 944,097 991,509 4.7% 4.9%Y/Y Growth 6.6% 6.7% 10.7% 8.3% -5.1% 2.5% 4.3% 5.1% 5.0% 5.0% 5.0%
Source: Company data, Credit Suisse estimates.
Old Timers: U.S., U.K., and Japan
Services has closely followed technology into the commercial market, as the adoption of complex infrastructure in the work place typically requires greater support, maintenance, and management. As such, regions such as North America, United Kingdom, and Japan comprise of nearly 65% of the services market and receive great attention from service providers.
■ North America (41% of Revenues). The largest region within services at 41%, North America is a large and highly competitive market with the United States generating revenues of $301B and Canada at $20B in 2010. Having invested early on in technology, there exists an ever changing rate of upgrades, legacy maintenance, and a need to stay competitive and leverage new technologies, providing great opportunity for service providers. Given its high cost of labor, North America also becomes a great benefactor of global scouring. Large market players typically include enterprise hardware vendors as well as government providers. Leading market share holders include: IBM, HP, Accenture, CSC, Lockheed, Xerox (following the acquisition of ACS), and Dell. The public sector’s investment in services is the largest in any region and accounts for 27% of North American services spending, compared with 21% of the global average. Recent deal signings continue to show resilience within IT management, given the mature segment, with cost controls as an area of focus.
■ United Kingdom (9% of Revenues). The U.K. market typically acts more in-line with the North American market, given its mature technology investments. The market currently generates about $71B in services spend and grew 1% Y/Y in 2010 following a 14% decline in 2009. Service providers tend to be a mix of large multinationals such as IBM, HP, and CSC, as well as European player such as Atos Origin, Capgemini, and BT. Along with the commercial investments in the region, there is also great services investment from the government as it upgrades its systems and services, such as its National Health Services.
■ Japan (14% of Revenues). Japan currently represents about 14% of the services market and generates about $113B in annual spend. The market maintained positive growth throughout the downturn, growing at 4% in 2009 and 5% in 2010. Within IT management, the majority of deals have been staff augmentation focused, but going forward, demand is expected to be driven by an increased level of services. Cloud and virtualization have helped spark demand from service providers such as Fujitsu, NEC, and IBM.
Growth Markets

16 March 2011
IT Hardware 207
Typically seen as a source of resources rather than an area of demand, emerging market demand has been driven by increased investment from the technology segment, telecom, and natural resources companies.
■ Asia-Pacific (8% of Rvenues). Asia-Pacific generated about $63B in services spending in 2010, reaching 16% Y/Y growth following a 4% Y/Y decline in 2009. The region saw strong demand for consulting (+19% Y/Y), processing management (+22% Y/Y), and development and integration (+16% Y/Y). The region has healthy GDP growth in the high single digits, with companies catching up in IT spending. Services as a percentage of GDP has typically been less than one-half a percentage point and should gradually increase. Many providers are also seeing healthy demand, backlog, and book to bill. The region is less focused on cost-cutting more on strategic positioning and growth. the top three areas of investment are application management, datacenter transformation, and hosted services. The market is also highly competitive between large players such as IBM, HP, Accenture, and Fujitsu
■ Latin America (4% of Revenues). While relatively a smaller market for services at 4%, Latin America has benefited from increased investment by financial servicer, telecom, and the government segment. While the services are typically provided by local players, many multinational companies have started to focus on the region. It not only serves as a region for demand but also as a lower-cost area of delivery. Both IBM and HP generate over $2B in annual revenues from Latin America and collectively account for over 17% of the market, mainly within the IT management segment as well as development and integration.
■ EMEA (24% of Revenues). EMEA (with U.K.) represents about 33% of services spending, comprising mainly Western Europe at 90%, with Eastern Europe and Middle East & Africa accounting for 4% and 5%, respectively. EMEA is a highly localized and fragmented market, given local regulations, language, and services penetration. Within Europe, cost reduction and contract renegotiation remain an area of focus as they deal with macro headwinds. Market players include larger players such as IBM, HP, Fujitsu, and Accenture as well as regional players such as Atos Origin and Capgemini. Many offshore players are taking a targeted approach to building out EMEA services by making local acquisitions or building local service locations.
IT Services and Macro Drivers Appear Positive With IT services representing some $780bn per annum, it is hard to argue that over both the near and long term that macro factors will not affect such a market. Our analysis has looked at a combination of macroeconomic factors and long-term trends relative to IT services levels and provided several useful insights:

16 March 2011
IT Hardware 208
Figure 235: IT Services as a % of GDP Expected to Rise, yet Still Below Prior Growth Rate
CS estimate
Historic Growth Rate
1.00%
1.05%
1.10%
1.15%
1.20%
1.25%
1.30%
1.35%
1.40%
1.45%
1.50%
2000
2001
2002
2003
2004
2005
2006
2007
2008
2009
2010
2011
E20
12E
2013
E20
14E
2015
E
% o
f Glo
bal G
DP
Source: Company data, Credit Suisse estimates.
IT services to GDP upward trend likely to continue. At the global level, IT services represents about 1.3% of global GDP, as shown in Figure 235 there has been a consistent trend of rising over time, from 1.07% in 2000; we expect the trend to continue toward 1.38% in 2015. The result of this at the global level is that we are biased to believe that IT services growth will lag GDP growth in the recovery, and then outpace it starting in 2011. It is even possible when looking through this framework that, over the longer term, the market could be stronger than we currently project. Looking geographically, we see that IT services relative levels of intensity vary quite significantly with, North America now at 2% and emerging markets as low as 0.4%. We increasingly believe that North America will lead the recovery as an early IT services adaptor more based upon recent company disclosures.
Figure 236: IT Services as a % of GDP by Region
North America
Latin America
Eastern Europe
Western Europe
Middle East & Africa
Asia Pacific
Japan
0.0%
0.5%
1.0%
1.5%
2.0%
2.5%
3.0%
2000
2001
2002
2003
2004
2005
2006
2007
2008
2009
2010
2011
E20
12E
2013
E20
14E
2015
E
Source: Gartner, Credit Suisse estimates.
Where are we in the IT services cycle. On major sourcing contracts, a critical component is the involvement of C-Level executives. While the decision should be technical in nature, inherently, we would argue, factors such as business confidence, revenue outlook, and growth opportunities will affect the fundamental demand for IT services. In Figure 238, we note that during the recent macroeconomic downturn, IT services demand did not experience the same level of downturn as revenue drop showing relative levels of

16 March 2011
IT Hardware 209
macroeconomic immunity. Partly, we believe that as a typical downturn takes effect, regarding offshoring of activities, increased outsourcing can be a means of lowering costs, which offset the more rapid cyclicality that we see in services segments such IT hardware and support or consulting. At the aggregate level, the lower level of cyclicality and delayed effect would also point to a more lagging effect in terms of sales recovery. Indeed, for the major services companies that report quarterly earnings, we have only just recently resumed positive growth in revenues. This change in mindset of services is also well characterized by the recent survey conducted by IBM of 2,100 SMBs, which points to the fact that in 2009-2010, there has been a clear move away from lowering costs and more toward growth planning, which would explain the return of consulting growth as shown in Figure 237 and with 2% and 5% annual growth over the next two years.
Figure 237: Services Segments and SPX Revenue Growth Y/Y
S&P 500 Revenue Growth
Consulting
Hardware Maintenance &
Support
Process ManagementSoftware Support
-15%
-10%
-5%
0%
5%
10%
15%
2000 2001 2002 2003 2004 2005 2006 2007 2008 2009 2010E 2011E
Source: Company data, Credit Suisse estimates.
Figure 238: IT Services and SPX Revenue Growth Y/Y
S&P 500 Revenue Growth
IT Services
-15%
-10%
-5%
0%
5%
10%
15%
2000 2001 2002 2003 2004 2005 2006 2007 2008 2009 2010E 2011E
Source: Company data, Credit Suisse estimates.
IT services attach to hardware/software spend. A final driver at the global level of services that is worth discussion is that the actual hardware and software integration will normally prove to be a driver for IT services spending, as shown previously in the IT services supply chain diagram. On the hardware side, driven by server, PC and storage refresh, virtualization, and cloud computing, we believe that the hardware cycle may remain relatively robust through 2010-11; this would suggest, given the long-term rising nature of IT services to hardware software spend ratio, that the market would be robust for services in 2011 and 2012.

16 March 2011
IT Hardware 210
Figure 239: Services Spend as a % of Hardware Spend 2000 2001 2002 2003 2004 2005 2006 2007 2008 2009 2010 2011 2012 2013 2014 2015
Services Attach to Hardware 1.3x 1.6x 1.6x 1.7x 1.7x 1.8x 1.9x 2.0x 2.1x 2.3x 2.1x 2.1x 2.1x 2.1x 2.1x 2.0xHardware Maintenance & Support 0.19x 0.22x 0.22x 0.22x 0.22x 0.23x 0.23x 0.23x 0.24x 0.25x 0.24x 0.22x 0.22x 0.21x 0.21x 0.20xSoftware Support 0.08x 0.10x 0.10x 0.10x 0.11x 0.11x 0.12x 0.13x 0.14x 0.16x 0.16x 0.16x 0.16x 0.16x 0.16x 0.16xConsulting 0.15x 0.17x 0.16x 0.16x 0.16x 0.17x 0.18x 0.19x 0.20x 0.21x 0.20x 0.19x 0.19x 0.19x 0.19x 0.19xDevelopment and Integration 0.41x 0.48x 0.48x 0.48x 0.50x 0.52x 0.55x 0.59x 0.62x 0.66x 0.62x 0.61x 0.60x 0.60x 0.59x 0.58xIT Management 0.32x 0.40x 0.43x 0.46x 0.48x 0.50x 0.53x 0.55x 0.57x 0.63x 0.59x 0.57x 0.57x 0.56x 0.56x 0.56xProcess Management 0.17x 0.22x 0.24x 0.25x 0.26x 0.28x 0.31x 0.32x 0.33x 0.36x 0.34x 0.34x 0.34x 0.34x 0.34x 0.35x
Source: Gartner, Credit Suisse estimates.
Survey Says—Demand is Ramping Back Following our 60 respondent Credit Suisse IT Survey, we noticed that a strong rebound in IT services growth is expected in 2011, yet remains below overall IT spending at 4.5%. Looking more closely at areas of spending expected in 2011, infrastructure outsourcing, systems integration, and application maintenance are expected to be the greatest area of growth, with BPO and maintenance and support as the areas of least growth expectations.
Figure 240: Return of Services Demand question: what is your expected Y/Y spending growth?
1.4%
4.5%
2.5%
5.0%
0.0%
1.0%
2.0%
3.0%
4.0%
5.0%
6.0%
2010 2011IT Services IT Spending
Source: Credit Suisse IT Survey.
Outsourced IT services remains underpenetrated. When asked about IT Services penetration, the outsourced model and to a greater extent offshore outsourcing model remains low, with strong adoption expected by 2015. Outsourced IT services accounts for about 14.7% of spending, and is expected to increase to 15.5% in 2011 and up to 22% by 2015. While outsourcing has strong outlook, the offshore model is expected to see penetration increase from 5.8% in 2010 to 10.7% in 2015. We would expect continued cost pressures and services demand to help drive increased outsourcing adoption.

16 March 2011
IT Hardware 211
Figure 241: Outsourced IT Services to Increase Adoption question: what % of your IT services budget is to be outsourced?
Figure 242: Offshore Outsourcing to Raise by 2015 question: what % of your IT services budget is to be offshore outsourced?
14% 15%15%
19%
22%
10%
15%
20%
25%
2009 2010 2011 2013 2015
5%6%
7%
9%
11%
2%
4%
6%
8%
10%
12%
2009 2010 2011 2013 2015
Source: Credit Suisse IT Survey. Source: Credit Suisse IT Survey.
IT staffing growth slightly up, with pricing increases in 2011. While headcount is expected to increase at similar levels across internal, offshore, and with third-party onsite hiring, it still represents an overall positive for services as companies are expanding. Following a depressed pricing environment in CY10, companies expect a 2.4% increase in like-for-like services. During the downturn, many providers were able to lower overall spend and cost by utilizing low-cost locations. The pricing increase also signals a healthy demand environment.
Figure 243: IT Staffing to Increase in 2011 question: what are your IT staffing expectations for 2011? Figure 244: Price Increases to Return to Services
question: what are your Y/Y pricing expectations for like to like services?
1.7%1.6%
1.4%
0.0%
1.0%
2.0%
Internal Offshore Third party onsitehiring
0.4%
2.4%
0.0% 0.5% 1.0% 1.5% 2.0% 2.5% 3.0%
2010 (vs. 2009)
2011 (vs. 2010)
Source: Credit Suisse IT Survey. Source: Credit Suisse IT Survey.
IBM and HP scored well as services vendors. Asked to rate a handful of vendors on services such as ITO, consulting, AMD, BPO and attributes such as quality of services, industry knowledge, flexibility, geographic reach, price, end–to-end offerings, cross-selling, and bundling, IBM and HP came out on top with a score of 59/80 and 58/80, respectively. IBM received high praise for its quality, industry knowledge, and geographic reach, while scoring below average on price. HP scored closely with IBM in most areas, expect price, where it received a 3.5/5 (versus IBM at 2.9/5) and industry knowledge where it scored a 3.8/5 (versus IBM at 4.2). A further review of the ranking can be seen in Figure 264.

16 March 2011
IT Hardware 212
Figure 245: Well Rounded Offerings from HP and IBM IT services vendor rating based on Services offering (out of 40) Figure 246: While Closer in Score, IBM and HP Still Lead
IT services vendor rating based on quality, industry knowledge, flexibility, geo, price, end-to end, cross selling, & bundling (out of 40)
20
22
24
26
28
30
32
IBM HPDell
Infos
ysACN
TCS
Cogniz
ant
Xerox
AVG
20
22
24
26
28
30
32
IBM HPDell
Infos
ysACN
TCS
Cogniz
ant
Xerox
AVG
Source: Credit Suisse IT Survey. Source: Credit Suisse IT Survey.
IT Services a Highly Fragmented Market While the IT industry is very significant in size, the market structure remains highly fragmented. Indeed, as illustrated, the market leader in services is IBM, with a 7% market share; furthermore, over the past five years, we see consistent trends within share:
IBM leads a highly fragmented and specialized market. As shown in Figure 247, we note that even the top 20 IT service vendors only account for some 39% of revenues of the market; in other words, it remains highly fragmented. IBM revenues in 2010 for overall IT services amounted to some $56bn, accounting for some 7% of the market. Interestingly, despite being accredited widely for having one of the most successful service offerings, the company has had a fairly steady share of the entire market over the past decade. We would note that the company has been somewhat more successful in expanding the value of this business, as shown by the slow but steady expansion of margins over time. Despite the more stable share structure of the industry, IBM positioning remains robust versus peers, given its wide offerings and geographic reach.

16 March 2011
IT Hardware 213
Figure 247: Top 20 IT Service Vendors Revenues ($m) Share Top 20 Players 2007 2008 2009 2007 2008 2009 IBM 54,146 58,892 55,000 7.3% 7.3% 7.2% HP (+ EDS) 37,866 38,584 34,585 5.1% 4.8% 4.5% Fujitsu 18,652 23,444 23,304 2.5% 2.9% 3.1% Accenture 20,616 23,732 20,939 2.8% 3.0% 2.7% CSC 16,059 17,112 16,004 2.2% 2.1% 2.1% Lockheed Martin 11,957 13,404 13,826 1.6% 1.7% 1.8% Atos Origin (+ Siemens IT) 14,442 15,508 13,276 1.9% 1.9% 1.7% Xerox (+ ACS) 11,784 12,542 12,332 1.6% 1.6% 1.6% Capgemini 11,355 12,746 11,634 1.5% 1.6% 1.5% NEC 9,336 11,028 11,372 1.3% 1.4% 1.5% NTT Data 8,510 10,322 11,111 1.1% 1.3% 1.5% SAIC 9,146 10,070 10,845 1.2% 1.3% 1.4% Hitachi 9,640 10,877 10,545 1.3% 1.4% 1.4% Northrop Grumman 9,820 8,813 9,277 1.3% 1.1% 1.2% Automatic Data Processing 8,313 9,019 8,789 1.1% 1.1% 1.2% Oracle 6,863 7,968 7,728 0.9% 1.0% 1.0% T-Systems 8,419 8,221 7,546 1.1% 1.0% 1.0% Dell (+Perot) 7,931 8,130 7,500 1.1% 1.0% 1.0% Deloitte 5,120 7,249 7,202 0.7% 0.9% 0.9% Ericsson 6,350 7,429 7,072 0.9% 0.9% 0.9% Total Top 20 Players 286,324 315,090 299,888 38.5% 39.2% 39.3% Total Services 742,961 804,476 763,091 100.0% 100.0% 100.0% Source: Gartner, Credit Suisse estimates.
The top 20 vendors are not gaining, even if CIO demand some consolidation. In Figure 248, we note that that even the top 20 IT service companies combined account for only 39% of the market, and market share over time has not significantly changed. Despite the steady market shares of the top 20 providers, an IDC survey highlighted that vendor consolidation should drive the number of vendors from 13 to 9. While the downturn has pushed vendors to a more consolidated model, we believe it will likely be at the expense of Tier 2 providers.
Figure 248: Reduced Number of Providers
Average number of existing provider/outsourcers
Optimal Number of Providers/Outsourcers
Overall Average 13.2 8.8BFSI 12.5 8.6Manufacturing 15.1 8.2Retail/wholesale 15.9 9.9Professional Services 13.8 9.6
Source: IDC, Credit Suisse estimates.
Growth by acquisition could remain critical. With the services proving highly specialized and fragmented by vertical, organically building scale in this lucrative market is challenging and would take time, especially given the long-term nature of contracts. We note that HP and Dell improved their competitive positioning and scale through acquisitions. Figure 249 demonstrates that our IT services companies invested over $40B in announced acquisitions over the past three years to bolster their position; we would expect, given the inherent fragmentation within this market, that acquisitions will remain a means to market entry.

16 March 2011
IT Hardware 214
Figure 249: M&A History HP
Target Date Price ($m) Service Region/HQArcSight Sep-10 1,500 Security software Cupertino, CaliforniaStratavia Aug-10 IT Automation software & solutions Denver, Colorado3PAR Aug-10 2,100 Storage Solutions Fremont, CaliforniaFortify Software Aug-10 Security software San Mateo, CaliforniaMotionbox Jul-10 Photo and Video Sharing New YorkMelodeo Jun-10 30 Mobile Audio and Video Seattle, WashingtonHP Asset Sold Jun-09 125 BPO (HRO focused) bought by XRX Plano, TexasPalm Apr-10 962 Mobile Handset Sunnyvale, California3Com Nov-09 3,145 Voice & Data Networking Marlborough, MassachusettsCXG Gestion Operativa Nov-09 12 Assets of Mortgage, financial & securitization management operations SpainHP Asset Sold Aug-09 Manufactures message passing interface software Bough by Platform of CanadaIBRIX Jul-09 Data storage and software Billerica, MassachusettsHP Asset Sold Mar-09 EDS Itellium Gmbh- IT Consulting & SI Bought by Arcandor of GermanyHP Asset Sold Nov-08 EDS France- ITO/BPO Societe Generale of FranceLeftHand Networks Oct-08 360 IP disk arrays and management software (storage and server consolidation) Boulder, ColoradoEDS May-08 12,600 ITO BPO Plano, Texas Colubris Aug-08 WLAN management (for its ProCurve Network) Waltham, MassachusettsTower Software Mar-08 Enterprise content management- Government & Regulated industries Braddon, AustraliaExstream Software Jan-08 Enterprise software on document creation processes Lexington KentuckyNUR Macroprinters Dec-07 118 Wide format inkjet Lod, IllinoisIBMClarity Systems Oct-10 FS Software Toronto, CanadaPSS Systems Oct-10 Software Mountain View, CaliforniaBlade Network Technologies Sep-10 Route Data Software provider Santa Clara, CaliforniaNetezza Corp Sep-10 1,695 Data Enterprise data warehouse applications Marlborough, MassachusettsOpenPages Sep-10 Security software Waltham, MassachusettsUnica Corp Aug-10 452 Business analytics software Waltham, MassachusettsDatacap Aug-10 Business analytics software Tarrytown, New YorkStorwize Jul-10 140 Storage data management software Marlborough, MassachusettsBigFix Jul-10 IT infrastructure management software Emeryville, CaliforniaCoremetrics Jun-10 Marketing SaaS Tools San Mateo, CaliforniaSterling Commerce May-10 1,400 Business integration and services (from AT&T) Dublin, OhioCast Iron Systems May-10 Integration solutions & cloud applications Mountain View, CaliforniaIntelliden Feb-10 Network software (Tivio) Menlo Park, CaliforniaInitiate Systems Feb-10 Business analytics software Chicago, IllinoisNational Interest Security Jan-10 Government software solutions Fairfax, VirginiaLombardi Software Dec-09 BPO Austin, TexasGuardium Nov-09 Security software Waltham, MassachusettsIBM Asset Sold Oct-09 600 Dassault Systems purchased its sales and client support from IBM FranceWilshire Credit Corp Oct-09 Lender Business Process Charlotte, North CarolinaRedPill Solutions Sep-09 Consulting SingaporeIBM Asset Sold Sep-09 Rocket Software buys IBMs U2 line up of internet data server tools Newton, MassachusettsOunce Labs Jul-09 Security software Waltham, MassachusettsSPSS Jul-09 923 Predictive business analytics software Chicago, IllinoisInternational Systems Tech Jul-09 4 20% stake in Chinese hardware producer and distributor Honk Kong, ChinaExeros May-09 Data analytics Santa Clara, CaliforniaOutbalze Apr-09 Message delivery via SaaS Hong Kong, ChinaTransitive Nov-08 Application software Los Gatos, CaliforniaQinqdao Hisense Transtech Oct-08 20% stake in IT traffic management, telecom infrastructure, & BPO Shandong, ChinaILOG SA Jul-08 301 Enterprise software solutions Gentilly, FrancePlatform Solutions Jul-08 Mainframe Manufacturing Sunnyvale, CaliforniaInfoDyne Corp Apr-08 FS software Park Ridge, IllinoisDiligent Technologies Apr-08 Data security and recovery Framingham, MassachusettsFilesX Apr-08 Data security and recovery Newton, MassachusettsEncentuate Mar-08 Identity and access management software (Tivoli Systems) Redwood City, CaliforniaAptSoft Corp Jan-08 Business Analytics software Burlington, MassachusettsNet Integration technologies Jan-08 SMB operating system solutions Markham, CanadaXIV Jan-08 Storage solutions Tel Aviv, IsraelCameo Information Systems Dec-07 Minority stake in Chinese IT and Application services company Beijing, ChinaDELLSecureWorks Jan-11 IT Security - Mainly in FS Atlanta, GeorgiaInSite Dec-10 IT Security, archive, storage, and recovery solutions Wallingford, ConnecticutCompellent Technologies Dec-10 879 Network storage solutions Eden Prairie, MinnesotaBoomi Nov-10 SaaS Berwyn, PennsylvaniaOcarina Networks Jul-10 Storage software San Jose, CaliforniaDell Asset Sold Jul-10 Merge & Fulfillment CEVE investments of LondonScalent System Jul-10 Infrastructure management solution Palo Alto, CaliforniaKACE Networks Feb-10 123 Systems Management Mountain View, CaliforniaExanet Feb-10 Network attached storage software IsraelDell/Polish manufacturing Dec-09 Polish Manufacturing Sale to Foxconn PolandBearingPoint Manag Consulting Oct-09 Management and IT Consulting (bought by Perot) Shanghai, ChinaPerot Systems Sep-09 3,628 IT Services Plano, TaxesAllin Corp asset Jan-09 12 MSFT IT consulting and solutions USMessageOne Feb-08 174 Email software solution Austin, TaxesThe Networked Storage Dec-07 Networking IT Consultancy UKXRXWaterWare Internet Services Jan-11 Web Application San Jose, CaliforniaSpur Information Solutions Nov-10 ACS- Parking and Traffic software Hampshire, UKTMS Health Oct-10 48 ACS- Healthcare BPO Boca Raton, FloridaGeorgia Duplication Products Sep-10 21 GIS- Office printing distributor Macon, GeorgiaExcelleratHRO (HPQ asset) May-10 125 HRO Plano, TexasIrish Business Systems Jan-10 31 Managed print services Cork, IrelandACS Sep-09 6,465 BPO Dallas, TexasPharm/DUR Jul-09 ACS- Healthcare software Philadelphia, PennsylvaniaAnix Group May-09 52 ACS- ITO Bristol, UKe-Services Group International May-09 85 ACS- BPO (4,000 employees in Jamaica and St Lucia) JamaicaComDoc Jan-09 145 GIS- Office printing distributor Akron, OhioGrupo Multivoice Dec-08 ACS- BPO (6,000 employees in Latam) Cordoba, ArgentinaPrecision Copier Services Jul-08 GIS- Office printing repair & maintenance Reno, NevadaSaxon Business System May-08 69 GIS- Managed print services Miami Lakes, FloridaComplQ Apr-08 20 ACS- Healthcare software Irvine, CaliforniaOrbital Sciences Corp Apr-08 45 ACS- Transportation software Columbia, MDVeenman BV Apr-08 69 SMB office printing distributor Capelle, NetherlandsCommunications Development Mar-08 ACS- Marketing and Consulting Maumelle, ArkansasBowers & Associates Feb-08 8 ACS- Healthcare software Franklin, Wisconsinsds business services Feb-08 63 ACS- IT/BPO Muelhem, GermanyBetter Quality Business Jan-08 GIS- Office supplier New Albany, IndianaSyan Holdings Jan-08 60 ACS- ITO Telford, UKimageQuest Nov-07 GIS- office printing distributor Wichita, Kansas––––––Global Imaging Systems Apr-07 1,457 SMB office printing distributor Tampa, FloridaACS Mar-07 5,600 LBO-Cancelled Dallas, Texas
Source: FactSet, Company data, Credit Suisse estimates.

16 March 2011
IT Hardware 215
Contracts Are Changing . . .Competitive Intensity Rises? IT services as an industry has evolved as enterprises have become increasingly comfortable with the outsourcing of key functions and infrastructure, and the design of contract can have significant implications for both the service provider and client. As a result, investors and industry observers alike place an increasing focus on contract wins, deal flows, and duration, as it is believed to be a leading indicator of revenues and overall health of the segment in terms of margin. In order to look at this at the global level, we have analyzed data from Datamonitor and TPI that track some $700bn of TCV (total contract value) deals in IT services over the past three years to gauge the changing deal characteristics and competitive outlook for the industry. As a result of our analysis, we arrive at a number of key conclusions:
Overall deal activity is lackluster. As clients remained uncertain about the economic outlook, the number of deals and the value declined in 2010. Looking at TPI 4Q review of contracts over $25M in TCV, we saw an 11% annual decline in contract TCV. Weakness was primarily seen in Asia-Pacific and EMEA, which declined 24% and 14%, with the Americas declining 3% Y/Y. By technology, BPO saw greater levels of decline at 31%, compared with ITO at 4%, as BPO contracts tend to require greater levels of investment with longer-term cost saves.
Figure 250: A Decline in TCV US$ in billions, unless otherwise stated
Figure 251: TTM Deal Flow US$ in billions, unless otherwise stated
$74
$76
$78
$80
$82
$84
$86
$88
$90
$92
2006 2007 2008 2009 2010
Tota
l Con
trac
t Val
ue ($
bn)
100,000110,000120,000130,000140,000150,000160,000170,000180,000190,000200,000
Oct-08Jan-09Apr-09 Jul-09 Oct-09Jan-10Apr-10 Jul-10 Oct-10
TCV
TTM
($M
)
1500
1600
1700
1800
1900
2000
2100
2200
TTM
# o
f Dea
ls
TTM TCV # of Deals TTM
Source: TPI 4Q10, Credit Suisse estimates. Source: Datamonitor, Credit Suisse estimates.
Megadeals shrinking, a long term trend, smaller deals sizes rising. IT services contracts were typically large long-term contracts; however, given the need for increased flexibility, contract sizes and durations has been coming down. A look at the past ten years of deal activity from TPI shows that 9% of deal volumes, or 24 deals, were megadeals ($1B+), compared with only 2%, or 14 deals in 2010. In terms of total contract value of deals in the market, about 60% of total contact values came from megadeals in 2000, compared with only 29% in 2010.

16 March 2011
IT Hardware 216
Figure 252: Few Large Deals Figure 253: More TCV at Lower Levels
0%
10%
20%
30%
40%
50%
60%
70%
80%
90%
100%
2000 2005 2010
$25-$49M $50-$199M $200-$999M $1,000M+
0%10%20%30%40%50%60%70%80%90%
100%
2000 2005 2010
$25-$49M $50-$199M $200-$999M $1,000M+
Source: TPI 4Q10, Credit Suisse estimates. Source: TPI 4Q10, Credit Suisse estimates.
Increasing number of overall vendor. As contract sizes decline, a greater number of players have been able to compete for deals. Of the Global 2000 that spend over $50mn annually, 38% used only one IT services provider in 2000, compared with 25% in 2010. It is also very common to see large clients use one large multinational provider alongside an offshore player. As a result, we believe large IT services providers should continue to see added pressure from smaller vendors with specific offerings.
Figure 254: G-2000 IT Service Spends with $50M+ Annual Spend Gave Turned to More Vendors
38% 33%25%
30%29%
27%
16%17%
16%
9%8%
13%
7% 13% 19%
0%
20%
40%
60%
80%
100%
2000 2005 2010
5+ Providers4 Providers3 Providers2 Providers1 Provider
Source: TPI 4Q10, Credit Suisse estimates.
Application development and management see growth. While the overall number of deals has declined 5% Y/Y, the number of application development and management deals in 2010 has increased 14% Y/Y and accounted for 35% deal volume, up from 29% in 2009.
1-12 month deals and 61-120 month deals declined in 2010. Deals ranging 1 to 12 months and 13 to 36 months declined 25% and 5% Y/Y, while deals ranging 37 to 60 months increased 3% Y/Y, according to a Datamonitor review of deals in the past 24 months. Long-term deals of 61-120 months also saw a decline of 12% Y/Y.

16 March 2011
IT Hardware 217
Figure 255: Increase in the # of AD&M Deals Figure 256: Deals in the 37-60 Month Range Show Growth
0%
10%
20%
30%
40%
50%
60%
70%
80%
90%
100%
1Q09 2Q09 3Q09 4Q09 1Q10 2Q10 3Q10 4Q10
OthersSystems IntegrationNetwork MangMaintenance/SupportInfrastructure MangConsultingBPOApp ManagementApp Development
0%
10%
20%
30%
40%
50%
60%
70%
80%
90%
100%
1Q09 2Q09 3Q09 4Q09 1Q10 2Q10 3Q10 4Q10
+120 months61-120 months37-60 months13-36 months1-12 months
Source: Datamonitor, Credit Suisse estimates. Source: Datamonitor , Credit Suisse estimates.
More deals coming up for restructuring: 2010 saw a great deal of contracts being bought up for renegotiation, either before the contract due date or at its conclusion as clients reviewed spending commitments. According to TPI, 2010 had $26B of TCV restructured, well above the $17B average. As part of the restructuring, clients were looking at price discounts or overall lower spending, as well as greater per-unit pricing (which would allow them to adjust spending with the market). In return, clients were willing to leverage a more global model as well as lock in longer contracts.
Figure 257: Uptick in Restructured Deals in 2010 to 44% Above Ten-Year Avg ($B)
$9
$12
$16 $17$18
$25$23
$15
$21$19
$26
$-
$5
$10
$15
$20
$25
$30
2000 2001 2002 2003 2004 2005 2006 2007 2008 2009 2010
Res
truc
ture
d D
eal T
CV
($bn
)
Source: TPI 4Q10, Credit Suisse estimates.
Indian heritage companies winning share. Indian heritage companies have been gaining share mainly at the expense of the Other category. In terms of aggregate market share, we would note Indian heritage players only account for some 2.5% of the IT services market, with the major players being Infosys, Wipro, Cognizant, and Tata Consulting Services. However both in terms of growth profile and profitability, they have gained significant share of services value. Indeed, the clear advantage that such players have is in terms of cost and labor while maintaining a high level of service. Just in terms the force within the industry, we show that the Indian heritage IT vendors collectively account for over 500,000 employees. While revenue per employee tends to be lower, they also tend to operate with robust margins. So far, market share gains have come from the other category within IT services; however, we believe the impact will become more severe for major multinational companies such as IBM, HP, and Dell, given several factors:

16 March 2011
IT Hardware 218
Figure 258: Revenue per Employee Services
Revenues ($TTM)
Total Employees
Services & IT Professionals
Op Margin Rev per employee
TCS 6,340 174,417 174,417 22.9% $36,350 CTSH 4,185 100,000 100,000 19.0% $41,845 INFY 5,382 122,468 122,468 30.2% $43,946 Wipro 6,340 115,900 115,900 23.6% $54,702 Capgemini 10,882 90,000 90,000 7.1% $120,911 XRX/ACS 9,637 136,500 74,000 11.7% $130,230 Atos Origin 6,710 49,036 49,036 5.7% $136,838 HP 34,693 304,000 210,000 14.5% $165,205 CSC 16,133 94,000 94,000 8.8% $171,628 Dell 7,652 96,000 43,000 DD $177,953 ACN 21,551 204,000 116,000 13.5% $185,784 IBM 55,000 399,409 190,000 14.7% $289,474
Source: Company data, Credit Suisse estimates.
Full- fledged offerings. While initially the focus from companies such as Infosys was in areas of lift and shift (simply transfer of headcount to low-cost location), now the IT services offering is now much more fully fledged, with key revenue exposure in higher-value categories such as development and integration (primarily on the applications side) as well as IT management. Similar to large multinational companies, offshore players have been acquiring IP and geographic reach.
Figure 259: Offshore Outsourcing Players Continue to Grow
$0$500
$1,000$1,500$2,000$2,500$3,000$3,500$4,000$4,500
3Q06
4Q06
1Q07
2Q07
3Q07
4Q07
1Q08
2Q08
3Q08
4Q08
1Q09
2Q09
3Q09
4Q09
1Q10
2Q10
3Q10
-10%-5%0%5%10%15%20%25%30%35%
Rev ($mn) Y/Y % Growth
Source: WIT, INFY, CTSH quarterly revenues, Credit Suisse estimates.
North American focus. A review of the offshore provider market presents shows a mainly North American and development and integration focus. The maturity of the North American market, as well as its limited language and regulatory environment, makes it a prime target for offshore players like Tata Consulting, Infosys, Wipro, and Cognizant. Application management (within IT management) and application development (within development and integration) tend to be a strong focus area for offshore players as they can leverage their offshore model.

16 March 2011
IT Hardware 219
Figure 260: North American Focus Figure 261: Mainly in the Apps Development & Maintenance
North America62%
Eastern Europe0%
Western Europe24%
Japan1%
Latin America2%
Middle East & Africa2%
Consulting
6%
Development and Integration
50%
IT Management33%
Hardware Maintenance &
Support0%
Software Support
5%Process Management
6%
Source: Gartner market share (WIT, INFY, TCS, CTSH), Credit Suisse estimates.
Source: Gartner (WIT, INFY, TCS, CTSH), Credit Suisse estimates.
The move toward smaller deal sizes probably helps. A key conclusion when looking at recent IT services deal activity seems to be the consistent move toward smaller deals in terms of contract flows. This naturally allows the opportunity for companies such as Indian vendors to compete. Interestingly. as noted by TPI in Figure 252 and Figure 253. this has contributed to improved deal activity, which should prove a decent indicator of future demand.
MNC (multinational) continue loss of momentum and the rise of offshore players. Improved offerings and smaller deal sizes have allowed offshore players to gain a better grip on the market and find their niche. A look at contract deals and TCV over the past ten years shows MNCs going from 65% of the volume and 87% of the TCV in 2000 to 42% of the volume and 58% of the TCV in 2010, benefitting offshore providers.
Figure 262: Indian Heritage Gaining Greater TCV Figure 263: Indian Heritage Capturing Greater Number of Contracts
MNC
Indian Heritage
Rest of market
0%10%20%30%40%50%60%70%80%90%
100%
2000 2001 2002 2003 2004 2005 2006 2007 2008 2009 9M10
MNC
Indian Heritage
Rest of market
0%10%20%30%40%50%60%70%80%90%
100%
2000 2001 2002 2003 2004 2005 2006 2007 2008 2009 9M10
Source: TPI 3Q10, Credit Suisse estimates. Source: TPI 3Q10, Credit Suisse estimates.

16 March 2011
IT Hardw
are 220
Figure 264: Services Vendor Rating
Please rate the following IT Service vendors across the Services below, using the scale of 1 as very poor and 5 as execellent performance
0
5
10
15
20
25
30
35
IBM HP Dell Xerox
Business Process Outsourcing (BPO)
Hardware Maintenance and Support
Managed print
Managed PC
IT Consulting
Systems Integration
App Maintenance/Development
Infrastructure Outsourcing
Please rate the following IT Service vendors across the attributes below, using the scale of 1 as very poor and 5 as excellent performance
0
5
10
15
20
25
30
35
IBM HP Dell Xerox
Bundling
Cross Sell
End-to-end offering
Price
Geographical reach
F lex ibility
Indus try Knowledge
Quality
Our Credit Suisse Survey shows wider gab between services rather than attributes, with IBM leading the response in both:
1) IBM scoring a 30/40 in level of services and attributes. With an average score of 3.7 out of five, IBM is viewed as solid end-to-end performer. It scored an average of 3.9 in ITO, 3.8 in AMD, a3.9 in SI and 4.0 in IT Consulting. Its lowest score came in at 3.3 in managed print, and 3.5 in managed PCs. Within attributes, IBM averaged 3.7 with high scores in geographic reach, quality, and industry knowledge. Price and flexibility were not apart of IBM’s strong points averaging 2.9 and 3.3 respectively. Dell had the highest scores in those attributes at 3.5 and 3.8.
2) HP a close second with 29/40 in both. While justly slightly below IBM, HP averaged a 3.6 out of five with strong scores in managed PCs and Print as well as Hardware maintenance and support. The greatest gaps were in AMD and BPO, where HP averaged 3.1 (vs. IBM at 3.8 and 3.6 respectively). While a close second to IBM in terms of quality and end to end offerings, HP showed better rating in price, at 3.5 (vs IBM at 2.9) and flexibility. HP was also rated well in terms of geographic reach and industryknowledge.
3) Dell lacking services yet tighter gap in attributes, especially price. Dell scored a 2.9 our of five in services, with ADM, IT Consulting, and BPO well below its average. Dell did score higher in areas such as Hardware Maintenance and Support, Managed PCs, and infrastructure outsourcing. In terms of positive attributes, Dell scored highest in price and flexibility with 3.8 and 3.5 averages. Dell’s end to end and cross selling abilities were both below average at 3.0 and 3.1
4) Xerox highs and lows. While now a year into the ACS acquisition, XRX averaged a 2.8 out of five from our respondents. XRX scored well in managed print with a 3.4 average, yet still below HP at 3.9. XRX BPO also scored above average with a 2.9, yet well below IBM and ACN at 3.6 and 3.5. In terms of attributes, XRX’s 3.0 score was slightly below the 3.3 group average mainly as it scored a 2.9 in Price and end to end, as well as 2.8 in cross selling and flexibility.
11
11
22
22
33
33
44
44
Source: Company data, Credit Suisse estimates.

16 March 2011
IT Hardware 221
IBM—Leading and Executing Well IBM remains the world leader in IT services and was among the first companies almost two decades ago to recognize the importance of moving away from the hardware business, while simultaneously demonstrating an effective ability to bundle services and software. We estimate that the company has a 7% market share, and the segment delivers some 57% of group revenues and 40% of PTI, so this tends to be a meaningful contributor to the group. The company reports its services business along two major business lines: global Business services and global technology services; we break this down further according to our definition within Figure 267 and Gartner’s market numbers:
Figure 265: Healthy Portion of Revenues and PTI IBM 2005 2006 2007 2008 2009 2010 2011 2012 Total Global Services Revenues 47,407 48,291 54,144 58,891 55,000 56,424 58,851 61,949 Y/Y growth 2.4% 1.9% 12.1% 8.8% -6.6% 2.6% 4.3% 5.3% % of overall revenues 52% 53% 55% 57% 57% 57% 56% 56% Global Technology Services 31,501 32,322 36,104 39,264 37,347 38,208 39,740 41,799 Y/Y growth 4.7% 2.6% 11.7% 8.8% -4.9% 2.3% 4.0% 5.2% Strategic outsourcing 16,522 17,044 18,701 20,183 19,340 19,816 20,563 21,696 BTO 1,573 1,845 2,294 2,550 2,280 2,312 2,431 2,600 Outsourcing 18,095 18,889 20,995 22,733 21,620 22,127 22,994 24,295 Integrated technology services 7,538 7,448 8,438 9,283 8,771 8,944 9,466 9,989 Maintenance 5,868 5,986 6,670 7,250 6,956 7,137 7,280 7,515 Global Business Services 15,906 15,969 18,040 19,627 17,653 18,216 19,111 20,150 Y/Y growth -2% 0% 13% 9% -10% 3% 5% 5% Services Gross Margins 26% 28% 28% 30% 33% 32% 33% 33% Global Technology Services 29% 30% 30% 32% 35% 35% 35% 35% Global Business Services 19% 23% 24% 26% 28% 28% 29% 29% Services Pre Tax Income 7% 10% 10% 11% 14% 14% 15% 15% Global Technology Services 8% 10% 9% 11% 14% 14% 15% 16% Global Business Services 5% 10% 10% 13% 13% 13% 14% 14% % of PTI 28% 37% 42.5% 44.0% 40.5% 42.3% 43.1% Signings 47,081 49,173 56,293 57,182 57,094 57,703 Book to Bill 1.0x 1.0x 1.0x 1.0x 1.0x 1.0x Backlog 111,000 116,000 118,000 130,000 137,000 141,000 Backlog to Bill 2.3x 2.4x 2.2x 2.2x 2.5x 2.5x
Source: Company data, Credit Suisse estimates.

16 March 2011
IT Hardware 222
Figure 266: Services Continues to Increase as a % of Revenues, Profit, with Improving Margins
% of Rev
% of Profit
IBM Op Margin
Services PTI %
0%
10%
20%
30%
40%
50%
60%
70%
2003 2004 2005 2006 2007 2008 2009 2010 2011E 2012E
Source: Company data, Credit Suisse estimates.
IT service breakdown. Within the overall services business, the largest segment for IBM remains IT management at around 45% of revenues, which equates to a 12% share in this segment, reflecting a strong presence in terms of the outsourcing segment. Development and integration comes next at 27% of services sales, a segment in which IBM is delivering a services offering from server architecture to applications. We believe that a core strength for IBM is the company’s effective scale, as previously discussed, and a complete end-to-end offering ideal for large undertakings.
Figure 267: IBM Focused on IT Management, Development and Integration, as Well as Maintenance andSupport
Figure 268: A True Global Player, Closely Mirrors the Industry
Consulting7%
Development and Integration
27%
Hardware Maintenance &
Support13%
IT Management45%
Software Support
4%Process
Management4%
Japan, 14%
Latin America, 4%
North America, 35%
Western Europe, 31%
Middle East & Africa, 2%
Eastern Europe, 2%
Asia/Pacific, 10%
Source: Gartner, Credit Suisse estimates. Source: Gartner, Credit Suisse estimates.
Geographically diversified. Employing some 399,000 employees, IBM remains truly a diversified global player in IT services; it is of note that IBM’s market share is actually above 10% in faster-growth emerging markets such as Eastern Europe and Asia-Pacific.
Over-represented in IT management, less so in software support. According to Gartner, IBM holds a share of almost 12% in IT management (i.e., application management, operation management), whereas its share is 4% on software support. As we discuss in the Lay of the IT Services Land section, the value proposition for vendor, duration of contract, and inherent margin can vary significantly.

16 March 2011
IT Hardware 223
Figure 269: IBM Has Solid Market Share in IT Management Figure 270: IBM’s Global Market Share Evenly Mixed
0.0%
2.0%
4.0%
6.0%8.0%
10.0%
12.0%
14.0%C
onsu
lting
Dev
elop
men
tan
dIn
tegr
atio
n
Mai
nten
ance
& S
uppo
rt
ITM
anag
emen
t
Pro
cess
Man
agem
ent
Softw
are
Sup
port
Tot
al
0.0%
2.0%
4.0%
6.0%
8.0%
10.0%
12.0%
Asia
Pac
E. E
urop
e
Japa
n
LatA
m
MEA
N.
Am
eric
a
W.
Eur
ope
Tota
l
Source: Gartner, Credit Suisse estimates. Source: Gartner, Credit Suisse estimates.
Given its size and reach, IBM Global Services accounts for over 7% of the IT services market. Its offerings are not only technology focused but also vertically geared, providing specialized solutions for industry-specific problems. As a result of its offerings and wide scope, IBM has large market share presence within a number of verticals, including financial services, education, transpiration, utilities, process manufacturing, and wholesale trade.
Figure 271: IBM’s Vertical Market Share
Ret
ail T
rade
Who
lesa
le T
rade
Edu
catio
n
Agric
ultu
re, M
inin
g, a
nd
Con
stru
ctio
n
Com
mun
icat
ions
Dis
cret
e M
anuf
actu
ring
Fina
ncia
l Ser
vice
s
Hea
lthca
re
Loca
l Gov
ernm
ent
Nat
iona
l Gov
ernm
ent
Proc
ess
Man
ufac
turin
g
Serv
ices
Tran
spor
tatio
n
Util
ities
Tota
l
0.0%
2.0%
4.0%
6.0%
8.0%
10.0%
12.0%
14.0%
Source: Gartner, Credit Suisse estimates.
Recent IT services trends have showed a gradual recovery. We note in Figure 265 that IBM services is showing tepid signs of revenue recovery, moving back into positive territory in Q410, with growth in both backlog and signings. In addition, when we look at both the overall backlog and the outsourcing backlog, both of these currently are showing Y/Y improvement.

16 March 2011
IT Hardware 224
Figure 272: IBM: North America and EMEA Remain a Strong Area
Figure 273: IBM: Majority of the Deal Wins Are Competitive
0%
20%
40%
60%
80%
100%
2007 2008 2009 2010
Latin AmericaJapanAsia PacificEMEANorth America
0%10%20%30%40%50%60%70%80%90%
100%
2007 2008 2009 2010
Sole-sourcedIncumbentCompetitive
Source: Datamonitor, Credit Suisse estimates.. Source: Datamonitor, Credit Suisse estimates.
HP—Efficiency Drive Has Paid Off . . .Now for Growth HP effectively doubled its position within the services market post the acquisition of EDS in Q408 and now holds a 4.5% market share. On a global basis, we believe this acquisition brought critical scale to HP’s offering in the IT services business and made it a critical part of operations and strategy. Indeed, we note that this segment now represents some 28% of revenues and over 30% of profits for the group.
Figure 274: HP Gaining Scale while Managing Cost with EDS HP 2005 2006 2007 2008 2009 2010 2011 2012 Infrastructure technology outsourcing 4,393 7,315 14,563 14,942 14,793 15,448 Technology services 10,307 10,925 10,665 10,627 10,733 11,267 Application services 1,220 2,670 6,926 6,792 6,860 7,273 Business process outsourcing 115 723 2,977 2,872 2,872 3,063 Eliminations/ other 0 58 249 296 299 313 Total revenue 16,264 16,308 16,035 21,690 35,380 35,529 35,557 37,364 Y/Y growth 12% 0% -2% 35% 63% 0% 0% 5% % of overall revenues 19% 18% 15% 18% 31% 28% 28% 28% Services Gross Margins 24% 26% 26% 24% 20% 22% 22% 22% Services Op Margin 7% 9% 11% 12% 14% 16% 16% 15%
Source: Company data, Credit Suisse estimates.
Services mix, more geared toward IT management and outsourcing. According to Gartner as shown in Figure 275, the services business for HP splits so that approximately 44% comes from IT management, 18% development and integration, 20% maintenance and support, and 9% process management. From a share perspective, we believe that the lower share in development and integration means that HP is less exposed to lower-category products.

16 March 2011
IT Hardware 225
Figure 275: HP: IT Management and Hardware Support Figure 276: HP—Staying Within Large Market
Consulting4% Development
and Integration18%
Hardware Maintenance &
Support20%
IT Management44%
Software Support
6%Process Management
8%
Japan, 5%
Latin America, 6%
North America, 41%
Western Europe, 35%
Middle East & Africa, 1%
Eastern Europe, 2%
Asia/Pacific, 10%
Source: Gartner, Credit Suisse estimates. Source: Gartner, Credit Suisse estimates.
Geographic share very developed market biased. We estimate that that some 40% of revenues from HP services comes from North America, in-line with the market; however, the company has a strong exposure within Western Europe and Asia-Pacific and is weaker in terms exposure to Eastern Europe and MEA.
Figure 277: HP High on Maintenance and Support Figure 278: HP’s Global Market Share
0.0%1.0%2.0%3.0%4.0%5.0%6.0%7.0%8.0%9.0%
Con
sulti
ng
Dev
elop
men
tan
dIn
tegr
atio
n
Mai
nten
ance
& S
uppo
rt
ITM
anag
emen
t
Pro
cess
Man
agem
ent
Softw
are
Sup
port
Tota
l
0.0%1.0%2.0%3.0%4.0%5.0%6.0%7.0%8.0%9.0%
Asia
Pac
E. E
urop
e
Japa
n
LatA
m
MEA
N.
Am
eric
a
W.
Eur
ope
Tota
l
Source: Company data, Credit Suisse estimates. Source: Company data, Credit Suisse estimates.
With over 4% IT services market share, HP has a balanced share in hardware maintenance of 8% and IT management of 7%. HP also has strong share in emerging markets, such as Asia-Pacific, Eastern Europe, and LatAm.
Figure 279: HP’s Vertical Market Share
Reta
il T
rade
Who
lesa
le T
rade
Edu
catio
n
Agr
icul
ture
, Min
ing,
and
C
onst
ruct
ion
Com
mun
icat
ions
Dis
cret
e M
anuf
actu
ring
Fin
anci
al S
ervi
ces
Hea
lthca
re
Loca
l Gov
ernm
ent
Nat
iona
l Gov
ernm
ent
Pro
cess
Man
ufac
turin
g
Serv
ices
Tran
spor
tatio
n
Utili
ties
Tota
l
0.0%
1.0%
2.0%
3.0%
4.0%
5.0%
6.0%
7.0%
8.0%
Source: Company data, Credit Suisse estimates.

16 March 2011
IT Hardware 226
So far, restructuring has been the key focus. As shown in Figure 280, on a pro forma basis, OMs were actually around 9-10%, given the lower profitability at EDS. Since the acquisition, HP has been successful in expanding margins, given the clear focus in restructuring services. Following the close of the acquisition, HP targeted $1.8B of net cost saves starting in FY11 as a result of headcount reductions and operational improvements such as closing 200 sites and retiring over 400 applications. As a result of its cost saves, HP reported FY10 segment operating margins of 16%, well above its initial targeted range of 13-15%. Over this time period, we believe the pro forma revenues have failed to grow, which is partly owing to the downturn in 2009, but also owing to the lack of sales synergies, in our view.
Figure 280: HP—EDS Cost Savings Targets Savings FY09 FY10 Run RateEDS related Savings $0.7 $1.9 $2.5 24,600 headcount reduction w/ ~50% replacement $1.6 IT, real estate, procurement, etc $0.9Reinvestment $0.2 $0.6 $0.7 Market competitiveness, sales force hiring, etcNet savings $0.5 $1.3 $1.8
Op Margins FY09 FY10 Run RateHP Services 13-14%EDS 6-7%Combined Services Op Margin 9-10% 11-13% 13-15%
Source: Company data 9/15/2008, Credit Suisse estimates.
More cost improvements than just EDS. Following the EDS net savings of $1.8B, HP continued to seek further savings to drive margin expansion. In June of 2010, HP announced a further efficiency drive, which would involve a further headcount reduction of 9,000 and drive $1bn in gross savings, of which $0.5-0.7bn would be retained. Given this we believe that the bias will be that OM could continue to expand
Still looking for more signs of sales synergies. While HP talks often regarding sales synergies and extending client relationship, so far we have yet to see material synergy come through. The scope here should be substantial, given how extensive HP’s distribution and broad technology platform is. In fact, when looking at contract data, we see a pickup in deals within North America, as well as increase winnings as an incumbent.
Figure 281: HP—North America Growth an Area of Strength
Figure 282: HP—Slight Improvement as Incumbent in 2010
0%10%
20%
30%40%
50%60%
70%80%
90%
100%
2007 2008 2009 2010
Latin AmericaJapanAsia PacificEMEANorth America
0%10%20%30%40%50%60%70%80%90%
100%
2007 2008 2009 2010
Sole-sourcedIncumbentCompetitive
Source: Datamonitor, Credit Suisse estimates. Source: Datamontior, Credit Suisse estimates.
Dell—Growth Could Prove a Struggle in Services Dell, similar to HP, has embarked upon growth by acquisition in services and completed the Perot acquisition in 2009. This brought additional scale for Dell in the services business; however, this is still a long ways away from critical or relevant scale, with only a

16 March 2011
IT Hardware 227
1% share of the services market. Dell’s services are mainly related to hardware deployment and support, as well as outsourced services. Dell also has a strong holding with the public sector and healthcare. While Dell has taken a renewed interest in services, its current services offerings limit its growth ability.
Figure 283: DELL Still Mainly Hardware Maintenance and Support DELL (FY) 2006 2007 2008 2009 2010 2011 2012 2013 Projects 9% Outsourcing 36% Hardware Deployment & Support 55% Total Services 4207 4739 4980 5351 5622 7673 7822 8100 % of revenues 7% 6% 8% 9% 9% 10% 12% 14% Y/Y % change 13% 5% 7% 5% 36% 2% 4% Gross Margins (Software & Services) 44% 42% 38% 34% 30% 30% 30%
Source: Company data, Credit Suisse estimates.
Services a significant bias toward hardware and maintenance. In terms of exposure, Dell’s Hardware and Maintenance Support related services account for some 45% of the business, with a further 25% from IT management, which is mainly outsourcing based. We believe that this makes it much more difficult to argue the current entity is based around the core high value added service offering around consulting and applications. By vertical, we note that, given Perot strength, Dell’s service business is well positioned in healthcare, in which it has a leadership position
Figure 284: DELL—Mainly in Maintenance and Support Figure 285: DELL—Almost All Local Presence Consulting
4%Development
and Integration19%
IT Management25%
Hardware Maintenance &
Support45%
Software Support
1%Process
Management6%
North America73%
Western Europe16%
Asia/Pacific7%
Japan2%
Latin America1%
Middle East & Africa
1%
Source: Gartner, Credit Suisse estimates. Source: Gartner, Credit Suisse estimates.
Geographically, very U.S. focused. By region ,some 73% of IT service sales come from NA, with very low exposures on average to most emerging markets. For example, its exposure to Asia Pac is 7%, LatAm at 1%, and even Western Europe is only 16%.

16 March 2011
IT Hardware 228
Figure 286: DELL—All Maintenance & Support Market Share
Figure 287: DELL—Not So Global Market Share
0.0%0.5%1.0%1.5%2.0%2.5%3.0%3.5%4.0%4.5%
Con
sulti
ng
Dev
elop
men
tan
dIn
tegr
atio
n
Mai
nten
ance
& S
uppo
rt
ITM
anag
emen
t
Pro
cess
Man
agem
ent
Softw
are
Sup
port
Tota
l
0.0%0.2%0.4%0.6%0.8%1.0%1.2%1.4%1.6%1.8%2.0%
Asia
Pac
E. E
urop
e
Japa
n
LatA
m
MEA
N.
Am
eric
a
W.
Eur
ope
Tota
l
Source: Company data, Credit Suisse estimates. Source: Company data, Credit Suisse estimates.
While overall IT services share is low at 1%, Dell has a strong showing in hardware maintenance and support, given its server and enterprise offerings. Following the Perot acquisition, Dell increased its share of the NA market as well as its share in the healthcare and education segments.
Figure 288: Dell’s Vertical Market Share Points to Healthcare and Public R
etai
l Tra
de
Who
lesa
le T
rade
Educ
atio
n
Agric
ultu
re, M
inin
g, a
nd
Con
stru
ctio
n
Com
mun
icat
ions
Dis
cret
e M
anuf
actu
ring
Fina
ncia
l Ser
vice
s
Hea
lthca
re
Loca
l Gov
ernm
ent
Nat
iona
l Gov
ernm
ent
Proc
ess
Man
ufac
turin
g
Serv
ices
Tran
spor
tatio
n
Util
ities
Tota
l
0.0%
0.5%
1.0%
1.5%
2.0%
2.5%
3.0%
3.5%
4.0%
4.5%
5.0%
Source: Company data, Credit Suisse estimates.
Positioning over the long term does not lend itself to faster-growth segments. As discussed earlier, we believe that within the context of a slow growth recovery in the IT services market, emerging markets and certain nichesa within services such as applications and software support will be faster-growth segments. When looking at Dell’s exposure, we find without successful penetration of new areas that its services is likely to see slower growth in the IT services market both from a geographic and segment perspective.

16 March 2011
IT Hardware 229
Figure 289: Dell's Position Sets It Up for Subpar Growth
Avg Growth
2.0%
2.5%
3.0%
3.5%
4.0%
4.5%
5.0%
5.5%
IBM HPFu
jitsu
ACNCSC
Lock
heed
Oracle/
SUN
XRX/ACS
Capge
mini Dell
Atos O
rigin
TCS
INFY
Wipro
Cogniz
antEMC
Other
2.0%
2.5%
3.0%
3.5%
4.0%
4.5%
5.0%
5.5%
Source: Company data, Credit Suisse estimates.
Cost reductions coming through, we believe, sales synergies less so. At the time of the Perot acquisition, Dell sought significant sales synergies, as shown in Figure 290, both in terms of quick start opportunities and vertical growth; however, as seen in FY4Q11 the pro forma services line of revenues has not shown significant growth (+1% Y/Y). While there has been a market downturn and at the macroeconomic level IT service deals are seeing some challenges, we believe equally that the focus so far has been on delivering cost synergies. Indeed, while Dell does not disclose margins, the company claims that it enjoys a double-digit margin in its respective services business currently.
Dell’s strategy with Perot included short-term, mid-term, and long-term growth expectations. Dell sought to increase cross-selling of existing solutions in the near term, grow its vertical offering in the medium term with, a focus on healthcare and government, and in the longer term to expand its geographic reach. In all, Dell expects $650M in sales synergies by FY2013, with the majority derived from vertical growth.
Figure 290: DELL—Perot Targets FY11 FY12 FY13
Revenue Synergies $150 $370 $650Cost Redutions $100 $225 +300
Source: Company data, Credit Suisse estimates.

16 March 2011
IT Hardware 230
Figure 291: DELL—Deals Would Show Continued U.S. Focus
Figure 292: DELL—a Number of Sole-Sourced Contracts Awards
0%10%
20%30%
40%50%60%70%80%90%
100%
2007 2008 2009 2010
Latin AmericaJapanAsia PacificEMEANorth America
0%10%20%30%40%50%60%70%80%90%
100%
2007 2008 2009 2010
Sole-sourcedIncumbentCompetitive
Source: Datamonitor, Credit Suisse estimates Source: Datamonitor, Credit Suisse estimates
Xerox—Looking for Growth in BPO While mainly known for its enterprise printing business, Xerox’s $6.6B acquisition of ACS in Feb 2010 has placed it well into the services market. Xerox doubled its services revenues to nearly $10B (about 45% of revenues) and accounted for 1.6% of the overall services market, yet over a 5% share in process management.
Figure 293: Xerox Shows Healthy Signings that Should Help Drive Segment Growth of 7–9% XRX 2008 2009 2010 2011 2012 Document Outsourcing 3,428 3,353 3,521 3,697 Business Processing Outsourcing 4,705 5,056 5,562 6,229 Information Technology Outsourcing 1,246 1,249 1,311 1,390Total Services Revenue 9,379 9,637 10,394 11,316Y/Y growth 2.8% 7.9% 8.9%% of overall revenues 44.5% 44.5% 45.7% 47.6% Services Op Margin 10.7% 11.7% 12.5% 13.2% Document Outsourcing 3.3Business Processing Outsourcing 10Information Technology Outsourcing 1.4Total Signings ($B) 14.7Y/Y growth 0.13
Source: Company data, Credit Suisse estimates.
Mainly BPO focused. Within Xerox’s services business of $9.6B, about 13% of revenues come from IT outsourcing (IT management), 52% from business process outsourcing, and 35% from document outsourcing (legacy Xerox). The company has nearly 74,000 employees in its services division, with less then half in offshore locations. ACS has a strong offering focused on the public sector (mainly state and local as well as transportation services) and 60% from commercial segments (such as HR, F&A, education, financial services, healthcare payers, customer care, and healthcare providers). In addition to BPO servicers, Xerox also offers a strong managed print solution with a high touch client model.

16 March 2011
IT Hardware 231
Figure 294: XRX’s Service Market Share Figure 295: XRX’s Global Market Share
0.0%
1.0%
2.0%
3.0%
4.0%
5.0%
6.0%C
onsu
lting
Dev
elop
men
tan
dIn
tegr
atio
n
Mai
nten
ance
& S
uppo
rt
ITM
anag
emen
t
Pro
cess
Man
agem
ent
Softw
are
Sup
port
Tota
l
0.0%
0.5%
1.0%
1.5%
2.0%
2.5%
3.0%
3.5%
Asia
Pac
E. E
urop
e
Japa
n
LatA
m
MEA
N.
Am
eric
a
W.
Eur
ope
Tota
l
Source: Company data, Credit Suisse estimates. Source: Company data, Credit Suisse estimates.
Slicing ACS/Xerox by service, geography, and vertical, you see a clear picture of its strengths and positioning. Process management and BPO type functions generate over one-half of its services segment revenues and give XRX over a 5% share of the market. XRX does well within NA, accounting for 3% of the market, with strengths in state and local governments, as well as healthcare.
Figure 296: Xerox’s Vertical Market Share Heavy on Local Government and Healthcare Re
tail
Trad
e
Who
lesa
le T
rade
Edu
catio
n
Agr
icul
ture
, Min
ing,
and
C
onst
ruct
ion
Com
mun
icat
ions
Dis
cret
e M
anuf
actu
ring
Fin
anci
al S
ervi
ces
Hea
lthca
re
Loca
l Gov
ernm
ent
Natio
nal G
over
nmen
t
Proc
ess
Man
ufac
turin
g
Serv
ices
Tran
spor
tatio
n
Util
ities
Tota
l
0.0%
1.0%
2.0%
3.0%
4.0%
5.0%
6.0%
7.0%
8.0%
Source: Company data, Credit Suisse estimates.
U.S. focused services market. While legacy Xerox had a fairly balanced global footprint, with 47% of sales outside of the U.S., ACS was the almost entirely focused on the U.S. market (92% of sales). Given Accenture’s exposure in public, we expect a U.S. bias to remain; however, as it leverage Xerox’s sales network, global brand, and account relationships, there should be a gradual mix shift. Recently, ACS has announced deals with Atos Origin and Zurich transportation, as it expands into new geographies.

16 March 2011
IT Hardware 232
Figure 297: XRX—BPO Focused Figure 298: XRX—ACS Was Over 90% U.S. based Development
and Integration3%
Hardware Maintenance &
Support20%
Process Management
53% IT Management24%
North America76%
Eastern Europe1%
Western Europe15%
Japan5%
Latin America2%
Middle East & Africa1%
Source: Gartner, Credit Suisse estimates. Source: Gartner, Credit Suisse estimates
With the acquisition of ACS, Xerox has set up lofty goals of revenue and cost synergies. Within the first year of acquiring new deals, it has identified a $5B pipeline of deals that is either new to ACS or Xerox or an expansion of scope resulting from the acquisition. Over the next two years, Xerox expects to generate an incremental $750B in revenues with cost saves of $375m. While the company has achieved $100m in pretax profits in FY10 , it continues to expect cost reductions in the form of real estate consolidation and headcount reorganization.
Figure 299: ACS/Xerox Synergy Targets US$ in millions, unless otherwise stated
Annual Revenue Pre Tax ProfitSynergy Areas 2010 2012 2014 2010 2012 2014
Sales 690 1760 60 210Innovation 75 150 5 30 40Corporate Governance 55 55 55Delivery & Infrastrucutre 40 255 295Total Base Case +750 1,900 100 +375 +575Upside 1,200 2,900 150 +500 +800
Source: Company data, Credit Suisse estimates.
Signing in FY10 improved 13% Y/Y to $14.7B, with a healthy synergy pipeline of $5B (up from $3.5B in the quarter prior). While the signing and pipeline signal positive growth, a look at announced deals in 2010 shows a mainly U.S.-focused signings.
Figure 300: Xerox—North American Focused Figure 301: Xerox—Winning new deals
0%
25%
50%
75%
100%
2007 2008 2009 2010
Latin AmericaJapanAsia PacificEMEANorth America
0%
25%
50%
75%
100%
2007 2008 2009 2010
Sole-sourcedIncumbentCompetitive
Source: Company data, Credit Suisse estimates. Source: Company data, Credit Suisse estimates.

16 March 2011
IT Hardw
are 233
Figure 302: Credit Suisse - IT Services Market Forecast (2010-2015) 2000-2010 2010-2015
2005 2006 2007 2008 2009 2010 2011E 2012E 2013E 2014E 2015E CAGR CAGRWorld Wide IT Services 628,713 670,876 742,961 804,476 763,091 781,956 815,269 856,449 899,156 944,097 991,509 4.7% 4.9%Y/Y Growth 6.6% 6.7% 10.7% 8.3% -5.1% 2.5% 4.3% 5.1% 5.0% 5.0% 5.0%
Hardware Maintenance & SuportClient Computing Hardware Services 11,800 12,197 12,920 13,503 12,504 12,162 12,179 12,581 12,972 13,373 13,783 3.3% 2.5%Document Management Hardware Services 12,064 11,649 12,349 13,088 12,099 11,804 11,869 12,171 12,505 12,846 13,189 -1.0% 2.2%Enterprise Computing Hardware Services 20,461 20,708 21,469 22,795 21,212 22,169 22,019 22,503 22,968 23,432 23,893 1.0% 1.5%Telecom Equipment Support 26,691 27,973 30,369 32,679 30,601 31,137 32,600 33,874 35,175 36,513 37,895 3.5% 4.0%Storage Support Services 8,267 8,318 9,030 9,041 8,477 8,567 8,835 9,166 9,507 9,859 10,224 1.5% 3.6%Total 79,283 80,845 86,138 91,106 84,892 85,838 87,502 90,296 93,126 96,022 98,985 1.8% 2.9%Y/Y Growth 3.6% 2.0% 6.5% 5.8% -6.8% 1.1% 1.9% 3.2% 3.1% 3.1% 3.1%
Software SupportApplications Software Services 15,651 16,619 19,013 21,470 21,424 22,351 23,865 25,366 26,973 28,676 30,485 7.1% 6.4%Infrastructure Software Services 23,937 25,576 28,612 32,585 33,165 35,031 37,352 39,903 42,563 45,390 48,412 6.8% 6.7%Total 39,588 42,195 47,626 54,055 54,590 57,382 61,217 65,269 69,537 74,066 78,897 6.9% 6.6%Y/Y Growth 7.2% 6.6% 12.9% 13.5% 1.0% 5.1% 6.7% 6.6% 6.5% 6.5% 6.5%
ConsultingBusiness Consulting 19,804 20,995 23,148 24,993 22,182 22,567 23,234 24,096 24,972 25,899 26,859 1.6% 3.5%IT Consulting 38,302 41,437 46,912 51,244 47,405 48,891 50,952 53,247 55,630 58,161 60,819 3.3% 4.5%Total 58,106 62,432 70,060 76,238 69,587 71,458 74,186 77,344 80,602 84,060 87,678 2.7% 4.2%Y/Y Growth 7.2% 7.4% 12.2% 8.8% -8.7% 2.7% 3.8% 4.3% 4.2% 4.3% 4.3%
Development and IntegrationApplication Development 78,975 83,923 92,227 101,644 94,171 95,501 99,097 103,316 107,716 112,637 117,776 3.0% 4.3%Deployment 38,550 41,672 47,771 51,991 47,877 48,626 51,447 53,869 56,332 58,871 61,527 4.2% 4.8%Integration 62,886 67,956 77,205 84,487 78,468 81,144 85,703 90,129 94,585 99,218 103,881 5.1% 5.1%Total 180,411 193,551 217,202 238,122 220,516 225,271 236,246 247,315 258,633 270,726 283,184 4.0% 4.7%Y/Y Growth 6.6% 7.3% 12.2% 9.6% -7.4% 2.2% 4.9% 4.7% 4.6% 4.7% 4.6%
IT ManagementApplications Management 30,262 32,485 35,846 38,741 37,960 38,986 40,819 43,011 45,431 47,955 50,739 7.1% 5.4%Help Desk Management 13,527 14,385 15,553 16,240 15,680 16,113 16,619 17,473 18,280 19,057 19,858 4.4% 4.3%Operations Management 129,310 138,266 152,431 163,883 158,391 161,390 168,889 177,767 186,786 196,203 206,389 6.1% 5.0%Total 173,099 185,137 203,830 218,863 212,031 216,489 226,327 238,250 250,497 263,215 276,986 6.2% 5.1%Y/Y Growth 5.8% 7.0% 10.1% 7.4% -3.1% 2.1% 4.5% 5.3% 5.1% 5.1% 5.2%
Process Management 98,226 106,717 118,106 126,093 121,476 125,519 129,791 137,976 146,762 156,008 165,780 6.8% 5.7%Y/Y Growth 9.9% 8.6% 10.7% 6.8% -3.7% 3.3% 3.4% 6.3% 6.4% 6.3% 6.3%
2000-2009 2010-2015Regions 2005 2006 2007 2008 2009 2010 2011E 2012E 2013E 2014E 2015E CAGR CAGRNorth America 266,599 284,887 305,742 323,102 312,773 321,611 332,527 348,708 366,510 385,190 404,884 3.7% 4.7%Latin America 17,124 20,209 24,273 27,920 26,626 29,033 31,619 34,261 36,649 39,209 41,985 6.9% 7.7%Eastern Europe 8,572 9,235 11,377 13,308 11,665 11,369 11,755 12,539 13,388 14,298 15,272 5.8% 6.1%Western Europe 201,353 215,029 246,036 265,590 236,607 230,294 236,076 244,834 253,187 261,828 270,552 5.1% 3.3%Middle East & Africa 10,314 11,358 13,711 15,767 14,804 14,495 15,221 16,094 17,109 18,211 19,413 6.2% 6.0%Asia Pacific 40,003 44,357 52,061 55,797 53,732 62,553 69,146 75,217 81,840 89,128 97,139 8.8% 9.2%Japan 84,748 85,801 89,761 102,993 106,883 112,601 118,924 124,795 130,472 136,234 142,265 4.5% 4.8%Total 628,713 670,876 742,961 804,476 763,091 781,956 815,269 856,449 899,156 944,097 991,509 4.7% 4.9%Y/Y Growth 6.6% 6.7% 10.7% 8.3% -5.1% 2.5% 4.3% 5.1% 5.0% 5.0% 5.0%
% of GDP 2005 2006 2007 2008 2009 2010 2011E 2012E 2013E 2014E 2015E Avg '00-'10 Avg '10-'15North America 1.8% 1.8% 1.9% 2.0% 2.0% 2.0% 2.0% 2.1% 2.1% 2.2% 2.2% 1.9% 2.1%Latin America 0.5% 0.6% 0.6% 0.7% 0.7% 0.7% 0.7% 0.8% 0.8% 0.8% 0.8% 0.6% 0.7%Eastern Europe 0.4% 0.4% 0.5% 0.5% 0.5% 0.5% 0.5% 0.5% 0.5% 0.5% 0.5% 0.4% 0.5%Western Europe 1.3% 1.3% 1.5% 1.6% 1.5% 1.4% 1.4% 1.4% 1.5% 1.5% 1.5% 1.4% 1.4%Middle East & Africa 0.3% 0.3% 0.4% 0.4% 0.4% 0.4% 0.4% 0.4% 0.4% 0.4% 0.4% 0.4% 0.4%Asia Pacific 0.5% 0.5% 0.5% 0.5% 0.5% 0.5% 0.5% 0.5% 0.6% 0.6% 0.6% 0.5% 0.5%Japan 1.6% 1.6% 1.7% 1.9% 2.1% 2.2% 2.2% 2.3% 2.4% 2.4% 2.5% 1.9% 2.3%CS estimate 1.2% 1.2% 1.3% 1.4% 1.3% 1.3% 1.31% 1.33% 1.35% 1.36% 1.38% 1.3% 1.3%Historic Growth rate 1.2% 1.2% 1.3% 1.4% 1.3% 1.3% 1.33% 1.35% 1.38% 1.41% 1.44% 1.3% 1.4%
Source: Company data, Credit Suisse estimates.

16 March 2011
IT Hardw
are 234
Figure 303: Vendor Market Share Services CAGR 2009 - 2015 % mix Market IBM HP Fujitsu ACN CSC Lockheed Oracle/SUN XRX/ACS Capgemini Dell Atos Origin TCS INFY Wipro Cognizant EMC OtherConsulting 4.2% 9.1% $69,587 $3,967 $1,313 $1,424 $2,590 $1,298 $175 $1,452 $1 $1,291 $318 $346 $307 $305 $79 $306 $567 $53,848Development and Integration 4.7% 28.9% $220,516 $14,877 $6,215 $7,973 $9,415 $3,985 $8,865 $2,275 $340 $5,674 $1,416 $2,633 $2,902 $2,524 $1,934 $1,417 $569 $147,503Hardware Maintenance & Support 2.9% 11.1% $84,892 $7,245 $6,841 $2,957 $0 $52 $740 $2,924 $2,497 $0 $3,378 $1 $0 $0 $41 $0 $1,096 $57,120IT Management 5.1% 27.8% $212,031 $24,543 $15,240 $9,753 $5,370 $10,199 $1,482 $876 $2,954 $4,224 $1,852 $2,706 $1,876 $1,263 $1,464 $1,137 $0 $127,091Process Management 5.7% 15.9% $121,476 $2,355 $2,937 $212 $2,893 $406 $1,082 $0 $6,540 $427 $476 $1,437 $367 $270 $317 $33 $0 $101,724Software Support 6.6% 7.2% $54,590 $2,013 $2,039 $985 $672 $64 $1,480 $4,563 $0 $17 $59 $3 $273 $82 $249 $253 $869 $40,969Grand Total 4.9% 100.0% $763,091 $55,000 $34,585 $23,304 $20,939 $16,004 $13,826 $12,090 $12,332 $11,634 $7,500 $7,125 $5,725 $4,444 $4,084 $3,146 $3,100 $528,255
2015Consulting 0.4% 8.8% $85,383 $4,868 $1,612 $1,747 $3,178 $1,592 $215 $1,782 $1 $1,583 $390 $424 $377 $375 $97 $375 $695 $66,071Development and Integration 1.4% 28.7% $277,207 $18,702 $7,812 $10,022 $11,835 $5,009 $11,144 $2,860 $428 $7,133 $1,780 $3,309 $3,648 $3,173 $2,431 $1,782 $715 $185,424Hardware Maintenance & Support 0.3% 10.1% $97,894 $8,355 $7,889 $3,410 $0 $60 $854 $3,371 $2,879 $0 $3,896 $1 $0 $0 $47 $0 $1,264 $65,869IT Management 1.4% 28.0% $271,282 $31,401 $19,498 $12,478 $6,870 $13,050 $1,897 $1,121 $3,780 $5,405 $2,370 $3,462 $2,400 $1,615 $1,873 $1,455 $0 $162,606Process Management 0.9% 16.6% $160,439 $3,110 $3,879 $280 $3,821 $537 $1,430 $0 $8,637 $564 $629 $1,898 $484 $356 $418 $44 $0 $134,352Software Support 0.5% 7.8% $75,058 $2,768 $2,803 $1,355 $924 $87 $2,036 $6,273 $0 $24 $81 $4 $375 $113 $343 $347 $1,194 $56,330Grand Total 4.8% 100.0% $967,263 $69,203 $43,493 $29,293 $26,628 $20,335 $17,575 $15,408 $15,725 $14,709 $9,146 $9,099 $7,285 $5,632 $5,209 $4,003 $3,868 $670,6512009-2015 CAGR 4.9% 4.7% 4.7% 4.7% 4.9% 4.9% 4.9% 5.0% 5.0% 4.8% 4.0% 5.0% 4.9% 4.9% 5.0% 4.9% 4.5% 4.9%
Geography CAGR 2010 - 2015 % mix Market IBM HP Fujitsu ACN CSC Lockheed Oracle/SUN XRX/ACS Capgemini Dell Atos Origin TCS INFY Wipro Cognizant EMC OtherAsia/Pacific 9.2% 7.0% $53,732 $5,660 $3,457 $1,144 $1,595 $1,147 $283 $1,072 $31 $188 $525 $222 $767 $324 $412 $57 $113 $36,734Eastern Europe 6.1% 1.5% $11,665 $1,205 $558 $20 $498 $22 $44 $230 $103 $65 $22 $0 $6 $0 $41 $0 $4 $8,846Japan 4.8% 14.0% $106,883 $7,910 $1,901 $14,255 $708 $56 $103 $535 $668 $0 $150 $14 $52 $62 $82 $6 $274 $80,108Latin America 7.7% 3.5% $26,626 $2,301 $2,178 $0 $838 $106 $0 $656 $236 $29 $112 $125 $269 $0 $12 $0 $88 $19,676Middle East & Africa 6.0% 1.9% $14,804 $1,370 $373 $20 $408 $116 $27 $280 $108 $7 $90 $61 $97 $107 $98 $0 $18 $11,623North America 4.7% 41.0% $312,773 $19,348 $14,101 $761 $8,217 $10,163 $12,979 $5,452 $9,288 $2,210 $5,362 $125 $2,977 $2,908 $2,365 $2,495 $1,804 $212,220Western Europe 3.3% 31.0% $236,607 $17,205 $12,016 $7,104 $8,675 $4,395 $390 $3,865 $1,898 $9,134 $1,237 $6,578 $1,557 $1,043 $1,074 $588 $798 $159,049Grand Total 4.9% 100.0% $763,091 $55,000 $34,585 $23,304 $20,939 $16,004 $13,826 $12,090 $12,332 $11,634 $7,500 $7,125 $5,725 $4,444 $4,084 $3,146 $3,100 $528,255
Asia/Pacific 0.6% 8.6% $83,442 $8,789 $5,369 $1,776 $2,477 $1,781 $440 $1,665 $49 $291 $815 $345 $1,191 $503 $641 $88 $175 $57,045Eastern Europe 0.1% 1.6% $15,670 $1,619 $750 $27 $669 $30 $59 $309 $138 $88 $30 $0 $8 $0 $55 $0 $6 $11,882Japan 0.7% 14.0% $135,041 $9,994 $2,402 $18,010 $895 $71 $130 $676 $844 $0 $190 $18 $65 $79 $103 $8 $346 $101,211Latin America 0.3% 4.0% $38,503 $3,328 $3,150 $0 $1,211 $153 $0 $948 $341 $42 $163 $181 $389 $0 $18 $0 $127 $28,453Middle East & Africa 0.1% 2.0% $19,827 $1,835 $499 $27 $547 $155 $36 $375 $145 $10 $121 $82 $130 $143 $131 $0 $25 $15,566North America 1.9% 40.7% $393,757 $24,358 $17,752 $958 $10,344 $12,794 $16,339 $6,864 $11,693 $2,782 $6,751 $157 $3,748 $3,661 $2,977 $3,141 $2,271 $267,168Western Europe 1.0% 28.7% $277,970 $20,213 $14,117 $8,346 $10,191 $5,163 $459 $4,540 $2,230 $10,731 $1,454 $7,727 $1,829 $1,226 $1,262 $691 $937 $186,853Grand Total 4.9% 100.0% $967,589 $70,135 $44,038 $29,144 $26,335 $20,146 $17,463 $15,377 $15,439 $13,944 $9,523 $8,511 $7,361 $5,611 $5,186 $3,927 $3,888 $668,1792009-2015 CAGR 4.9% 5.0% 5.0% 4.6% 4.7% 4.7% 4.8% 4.9% 4.6% 3.7% 4.9% 3.6% 5.2% 4.8% 4.9% 4.5% 4.6% 4.8%
Source: Company data, Credit Suisse estimates.

16 March 2011
IT Hardware 235
Storage—Secular Growth Rapid demand for storage capacity, driven by the accelerating need to store various forms of digital content is the underlying driver for storage hardware, software, and services, which collectively was a $47bn market in 2010E. While overall storage market revenue was down 7% in 2009, the market enjoyed a sharp cyclical rebound in 2010E, where year-over-year growth was 9%, as seen in Figure 304.
Figure 304: Overview of the Storage Market Opportunity, a $47 Billion Market in 2010 US$ in millions, unless otherwise stated 2009A 2010E 2011E 2012E 2013E 2014E 2015E CAGR '10E-'15E Hardware 17,426 20,685 22,070 23,496 25,289 27,554 30,327 8.0% Software 11,242 11,676 12,358 13,145 14,010 14,960 15,960 6.5% Services 15,043 15,043 15,695 16,565 17,423 18,305 19,138 4.9%
Total 43,397 47,404 50,124 53,206 56,722 60,819 65,425 6.7% Growth YoY -7% 9% 6% 6% 7% 7% 8%
Source: Gartner, Credit Suisse estimates.
Going forward, while cyclical tailwinds moderate, we believe the consumable nature of storage will continue to drive healthy market growth for several years to come. In addition, several secular trends will add to market growth dynamics, in our view. These include unstructured data growth, driven by the explosion of digital content, server virtualization, and regulatory and compliance requirements. In addition to storage hardware, we note that there is a significant revenue opportunity associated with higher-margin software and services, which collectively account for 56% of the overall storage market opportunity. As such, we believe storage represents one of the more attractive subsegments within IT hardware from both a growth and profitability perspective. The section that follows provides an overview of our outlook for the storage market, and we would highlight the following key points:
■ Capacity growth driven by rapid data growth, virtualization. Demand for storage capacity is being driven by accelerating needs for enterprises and consumers to store various forms of information and content. Rapid growth in unstructured data (57% CAGR between 2009-2014 per IDC, is being driven by growth in file-based data, which includes Web pages, images, audio, and video files, and virtual machine images. As such, we expect storage will become increasingly important, not only as enterprises cope with rapid data growth but also as they look to optimize their virtualization implementations.
■ Storage hardware—shift to networked storage architectures (SAN, NAS) continues. We expect storage hardware, which was a $21bn market opportunity in 2010E to grow at an 8% CAGR in 2010E-2015E. Within the storage hardware market, there continues to be an ongoing secular shift from direct attached (to the server) architectures toward networked storage architectures. This shift is being driven by the need for improved resource utilization, high availability, and manageability. The rearchitecting of data centers and the move to virtualized platforms is another key driver for networked storage, where shared storage has almost become a necessity to leverage fully the benefits of virtualization. Networked storage (SAN and NAS) accounted for 83% of storage hardware spending in 2010E, up from 62% in 2005, and we estimate this will rise to 92% of storage hardware spending by 2015E.

16 March 2011
IT Hardware 236
■ NAS and iSCSI SAN—key drivers of storage hardware growth. Within networked storage hardware, we expect growth to be driven by iSCSI SAN (we expect an 18.9% CAGR between 2010E-2015E) and NAS (we expect an 18.6% CAGR in 2010E-2015E). Conversely, we expect more expensive FC SAN systems to see only tepid growth, for which we forecast revenue growing at a 4.3% CAGR in 2010E-2015E.
■ Lower-price band segments will see the strongest growth. An analysis of the market by price band shows that low and midrange systems will continue to enjoy the most robust growth, driven by requirements that lay outside the realm of high-end, high-performance storage, increasingly capable low-range and midrange systems, and an increased focus on indirect channels from the major storage vendors, including EMC, NetApp, and Dell. Collectively, we estimate that the low-rand and midrange (sub-$300k price band) segment will grow at a CAGR of 9.7%, versus 8.0% for overall storage hardware.
■ From a geographic standpoint, North America and Latin America will see the strongest growth. NA, which comprises the largest geographic segment at 45% of the storage hardware market, is forecast to grow at a 10.3% CAGR in 2010-15. EMEA, the second largest geography representing 30% of 2010 revenue, is expected to grow at a slower 7.6% CAGR. Our forecast calls for Asia-Pacific, the third largest geographic segment, to grow at a slower 4.0% CAGR as a result of a bias toward less expensive storage.

16 March 2011
IT Hardw
are 237
Figure 305: Credit Suisse Worldwide Storage Hardware Forecast—Expect an 8% Revenue CAGR (2010–15) US$ in millions, unless otherwise stated
2005 2006 2007 2008 2009 2010E 2011E 2012E 2013E 2014E 2015E CAGR '05-'10E CAGR '10E- '15EWorldwide storage market revenue by technologySAN 8,168 8,868 10,762 12,632 11,726 13,684 14,631 15,656 16,767 18,104 19,661 10.9% 7.5%Fibre Channel - - 8,798 9,634 8,689 9,991 10,360 10,756 11,166 11,686 12,324 NM 4.3%iSCSI - - 975 1,418 1,585 2,022 2,426 2,848 3,376 4,025 4,798 NM 18.9%Other - - 989 1,580 1,453 1,671 1,845 2,052 2,225 2,393 2,539 NM 8.7%NAS 1,626 2,038 2,114 2,697 2,735 3,511 4,255 4,983 5,876 6,951 8,252 16.6% 18.6%DAS 4,598 3,968 3,021 2,434 1,821 2,033 1,793 1,564 1,372 1,214 1,117 -15.1% -11.3%Other 1,293 1,337 1,328 1,423 1,144 1,457 1,391 1,293 1,273 1,285 1,297 2.4% -2.3%Global storage market revenue 15,685 16,210 17,225 19,186 17,426 20,685 22,070 23,496 25,289 27,554 30,327 5.7% 8.0% Growth YoY 3.3% 6.3% 11.4% -9.2% 18.7% 6.7% 6.5% 7.6% 9.0% 10.1%Total networked storage (SAN+NAS) 9,794 10,905 12,876 15,329 14,461 17,195 18,886 20,639 22,643 25,055 27,913 16.1% 10.2%
Worldwide storage market capacity by technologySAN 639 910 1,859 2,882 4,001 6,508 9,810 14,786 22,368 34,158 52,535 59.1% 51.8%Fibre Channel - - 1,432 2,121 2,872 4,548 6,583 9,550 13,824 20,122 29,438 NM 45.3%iSCSI - - 328 595 933 1,671 2,819 4,655 7,736 12,906 21,536 NM 66.7%Other - - 99 166 196 288 408 581 809 1,130 1,561 NM 40.2%NAS 269 511 780 1,569 2,591 4,609 8,001 13,564 22,620 37,732 63,011 76.5% 68.7%DAS 366 425 530 749 683 1,049 1,263 1,502 1,792 2,148 2,593 23.4% 19.9%Other 175 220 448 564 626 1,198 1,667 2,228 2,980 3,995 5,312 47.0% 34.7%Global storage market capacity 1,449 2,066 3,618 5,764 7,901 13,363 20,741 32,080 49,760 78,032 123,451 55.9% 56.0% Growth YoY 42.6% 75.1% 59.3% 37.1% 69.1% 55.2% 54.7% 55.1% 56.8% 58.2%
Worldwide Storage Market Pric ing by technologySAN 12.78 9.74 5.79 4.38 2.93 2 .10 1.49 1.06 0.75 0.53 0.37 -30.3% -29.2%Fibre Channel - - 6.15 4.54 3.02 2 .20 1.57 1.13 0.81 0.58 0.42 NM -28.2%iSCSI - - 2.97 2.38 1.70 1 .21 0.86 0.61 0.44 0.31 0.22 NM -28.7%Other - - 9.96 9.52 7.41 5 .79 4.53 3.53 2.75 2.12 1.63 NM -22.4%NAS 6.05 3.99 2.71 1.72 1.06 0 .76 0.53 0.37 0.26 0.18 0.13 -33.9% -29.7%DAS 12.55 9.34 5.70 3.25 2.67 1 .94 1.42 1.04 0.77 0.57 0.43 -31.2% -26.0%Other 7.41 6.08 2.97 2.52 1.83 1 .22 0.83 0.58 0.43 0.32 0.24 -30.3% -27.5%Overall ASP 10.83 7.85 4.76 3.33 2.21 1 .55 1.06 0.73 0.51 0.35 0.25 -32.2% -30.8% Growth YoY -27.5% -39.3% -30.1% -33.7% -29.8% -31.3% -31.2% -30.6% -30.5% -30.4%
NAS revenue to grow >2x overall storage. We expect NAS revenue as a portion of overall revenue will rise to 27% in 2015 from 17% in 2010E. Strong NAS revenue growth (19% CAGR) will be driven by virtualization, unstructured data growth, and more generally the move to networked storage architectures.
Strong capacity growth, stable pricing outlook. We expect strong data growth, driven by the proliferation of unstructured and structured data to drive growth in storage capacity. Between 2010E-2015E, we estimate capacity will grow at a 56.0% CAGR versus the 55.9% CAGR seen between 2005-2010. From a pricing standpoint, we expect the price/GB of storage capacity to continue to decline at a 31% CAGR (2010E-2015E) versus a -32% CAGR between 2005-2010.
SAN market to be driven by iSCSI as FC SAN stagnates. We expect SAN as a portion of overall storage HW revenue will decline slightly to 65% in 2015E from 66% in 2010E. We note that the in line growth of the overall SAN market will be largely driven by iSCSI SAN (19% CAGR, 2010E-2015E) as FC SAN grows more slowly (4% CAGR). iSCSI SAN growth drivers include demand for cheaper systems from non-enterprise customers, more capable arrays and rapid growth in the indirect distribution channels.
3
2
1
1
Shift to networked storage architectures and secular decline in DAS to continue. The overall storage hardware market is forecast to grow at a CAGR of 8% (2010E-2015E). We expect the shift toward networked storage (from DAS) to continue as the SAN+NAS market grows at a 10% CAGR while the combined DAS/Other market declines at a 7% CAGR. In terms of revenue mix, we believe networked storage will comprise 92% of storage hardware revenue in 2015 (from 83% in 2010E).
4
1 2 3 4
2005 2006 2007 2008 2009 2010E 2011E 2012E 2013E 2014E 2015E CAGR '05-'10E CAGR '10E- '15EWorldwide storage market revenue by technologySAN 8,168 8,868 10,762 12,632 11,726 13,684 14,631 15,656 16,767 18,104 19,661 10.9% 7.5%Fibre Channel - - 8,798 9,634 8,689 9,991 10,360 10,756 11,166 11,686 12,324 NM 4.3%iSCSI - - 975 1,418 1,585 2,022 2,426 2,848 3,376 4,025 4,798 NM 18.9%Other - - 989 1,580 1,453 1,671 1,845 2,052 2,225 2,393 2,539 NM 8.7%NAS 1,626 2,038 2,114 2,697 2,735 3,511 4,255 4,983 5,876 6,951 8,252 16.6% 18.6%DAS 4,598 3,968 3,021 2,434 1,821 2,033 1,793 1,564 1,372 1,214 1,117 -15.1% -11.3%Other 1,293 1,337 1,328 1,423 1,144 1,457 1,391 1,293 1,273 1,285 1,297 2.4% -2.3%Global storage market revenue 15,685 16,210 17,225 19,186 17,426 20,685 22,070 23,496 25,289 27,554 30,327 5.7% 8.0% Growth YoY 3.3% 6.3% 11.4% -9.2% 18.7% 6.7% 6.5% 7.6% 9.0% 10.1%Total networked storage (SAN+NAS) 9,794 10,905 12,876 15,329 14,461 17,195 18,886 20,639 22,643 25,055 27,913 16.1% 10.2%
Worldwide storage market capacity by technologySAN 639 910 1,859 2,882 4,001 6,508 9,810 14,786 22,368 34,158 52,535 59.1% 51.8%Fibre Channel - - 1,432 2,121 2,872 4,548 6,583 9,550 13,824 20,122 29,438 NM 45.3%iSCSI - - 328 595 933 1,671 2,819 4,655 7,736 12,906 21,536 NM 66.7%Other - - 99 166 196 288 408 581 809 1,130 1,561 NM 40.2%NAS 269 511 780 1,569 2,591 4,609 8,001 13,564 22,620 37,732 63,011 76.5% 68.7%DAS 366 425 530 749 683 1,049 1,263 1,502 1,792 2,148 2,593 23.4% 19.9%Other 175 220 448 564 626 1,198 1,667 2,228 2,980 3,995 5,312 47.0% 34.7%Global storage market capacity 1,449 2,066 3,618 5,764 7,901 13,363 20,741 32,080 49,760 78,032 123,451 55.9% 56.0% Growth YoY 42.6% 75.1% 59.3% 37.1% 69.1% 55.2% 54.7% 55.1% 56.8% 58.2%
Worldwide Storage Market Pric ing by technologySAN 12.78 9.74 5.79 4.38 2.93 2 .10 1.49 1.06 0.75 0.53 0.37 -30.3% -29.2%Fibre Channel - - 6.15 4.54 3.02 2 .20 1.57 1.13 0.81 0.58 0.42 NM -28.2%iSCSI - - 2.97 2.38 1.70 1 .21 0.86 0.61 0.44 0.31 0.22 NM -28.7%Other - - 9.96 9.52 7.41 5 .79 4.53 3.53 2.75 2.12 1.63 NM -22.4%NAS 6.05 3.99 2.71 1.72 1.06 0 .76 0.53 0.37 0.26 0.18 0.13 -33.9% -29.7%DAS 12.55 9.34 5.70 3.25 2.67 1 .94 1.42 1.04 0.77 0.57 0.43 -31.2% -26.0%Other 7.41 6.08 2.97 2.52 1.83 1 .22 0.83 0.58 0.43 0.32 0.24 -30.3% -27.5%Overall ASP 10.83 7.85 4.76 3.33 2.21 1 .55 1.06 0.73 0.51 0.35 0.25 -32.2% -30.8% Growth YoY -27.5% -39.3% -30.1% -33.7% -29.8% -31.3% -31.2% -30.6% -30.5% -30.4%
NAS revenue to grow >2x overall storage. We expect NAS revenue as a portion of overall revenue will rise to 27% in 2015 from 17% in 2010E. Strong NAS revenue growth (19% CAGR) will be driven by virtualization, unstructured data growth, and more generally the move to networked storage architectures.
Strong capacity growth, stable pricing outlook. We expect strong data growth, driven by the proliferation of unstructured and structured data to drive growth in storage capacity. Between 2010E-2015E, we estimate capacity will grow at a 56.0% CAGR versus the 55.9% CAGR seen between 2005-2010. From a pricing standpoint, we expect the price/GB of storage capacity to continue to decline at a 31% CAGR (2010E-2015E) versus a -32% CAGR between 2005-2010.
SAN market to be driven by iSCSI as FC SAN stagnates. We expect SAN as a portion of overall storage HW revenue will decline slightly to 65% in 2015E from 66% in 2010E. We note that the in line growth of the overall SAN market will be largely driven by iSCSI SAN (19% CAGR, 2010E-2015E) as FC SAN grows more slowly (4% CAGR). iSCSI SAN growth drivers include demand for cheaper systems from non-enterprise customers, more capable arrays and rapid growth in the indirect distribution channels.
33
22
11
11
Shift to networked storage architectures and secular decline in DAS to continue. The overall storage hardware market is forecast to grow at a CAGR of 8% (2010E-2015E). We expect the shift toward networked storage (from DAS) to continue as the SAN+NAS market grows at a 10% CAGR while the combined DAS/Other market declines at a 7% CAGR. In terms of revenue mix, we believe networked storage will comprise 92% of storage hardware revenue in 2015 (from 83% in 2010E).
44
11 22 33 44
Source: Gartner, Credit Suisse estimates.

16 March 2011
IT Hardware 238
Capacity Growth, a Key Driver of Storage Hardware In 2005-10, demand for storage capacity has grown at a CAGR of 56%, with growth being driven by the need for enterprises and consumers to store various forms of information and content, both in the form of structured and unstructured data. The following is a brief description of structured and unstructured data:
■ Structured data. Structured data has a set data structure. Common examples of structured data include relational databases such as IBM’s DB2 or Oracle Database. From an enterprise storage perspective, structured data historically was the primary driver of capacity growth until the past year.
■ Unstructured data. Unstructured data has no set internal data structure and is typically in a file or object. Examples of this type of data include Word documents, pictures, audio, and video files as well CAD documents and virtual machine images. Over the past few years, unstructured data has become a growing concern for IT administrators in traditional datacenters owing to the digitization of records and corporate assets, particularly in fields such as healthcare and media/entertainment.
As seen in Figure 306, IDC forecasts structured data to grow at a CAGR of 26% from 2009-2014, while unstructured data capacity is expected to grow at a 57% CAGR over the same period.
Figure 306: Unstructured Data Growth Driving Overall Storage Capacity Growth in PB
-
5,000
10,000
15,000
20,000
25,000
2005 2006 2007 2008 2009 2010 2011 2012 2013 2014
Traditional structured data Traditional unstructured data
Unstructured data growth CAGR: 57%Structured data growth CAGR: 26%
Source: IDC.
While structured data (mainly database data) has been the primary driver of enterprise storage capacity growth in the past, unstructured data growth is poised to accelerate, given expected growth in file-based data such as Web pages, images, audio, and video files, as well as virtual machine images. Indeed, according to EMC and IDC data, virtual machines are expected to increasingly create incremental growth in unstructured enterprise data. (See Figure 307.)

16 March 2011
IT Hardware 239
Figure 307: Virtual Machines Will Increasingly Contribute to Unstructured Data Growth
0
2,500,000
5,000,000
7,500,000
10,000,000
12,500,000
15,000,000
17,500,000
2005 2006 2007 2008 2009 2010 2011 2012 2013
Physical Hosts Virtual Machines
VM Cross Over
Source: EMC company presentation based on IDC data.
Pricing Declines to Remain Steady The price of storage has declined by an average of 32% per year in 2005-2010E. Going forward, as seen in Figure 308, we expect this rate of annual decline to continue, resulting in storage revenue growth that is significantly more muted than growth in storage capacity. On the other hand, given the consumable nature of storage, we believe that demand for additional storage capacity is price elastic to an extent, and as such, even in a “normal” pricing environment in which the price/GB of storage declines 30-35% per year, capacity growth could surprise to the upside. Looking at pricing dynamics within each segment of storage, price declines across various categories are fairly consistent.

16 March 2011
IT Hardware 240
Figure 308: Price Declines Expected to Be 30-35% per Annum Going Forward
-
1.00
2.00
3.00
4.00
5.00
6.00
7.00
8.00
2006 2007 2008 2009 2010E 2011E 2012E 2013E 2014E 2015E
Pric
e / G
B ($
)
-45%
-40%
-35%
-30%
-25%
-20%
-15%
-10%
Y/Y Price Decline
Source: Gartner, Credit Suisse estimates.

16 March 2011
IT Hardware 241
A Quick Primer on Storage Technologies Before discussing our market outlook for storage, we provide a quick overview of the key storage technologies. Storage hardware can be broadly broken down into two primary groups: networked storage and direct attached (DAS and JBOD). The key differences between the two are essentially resource utilization, scalability, and manageability. While networked is the primary storage architecture for most enterprise networks, as it is better suited for scalability, reliability, and manageability, direct attached storage has historically been used by small businesses, in which managing data across disparate servers is less of an issue. Direct attached essentially serves as a repository extending internal server storage and is not well suited for the needs of large enterprises, owing to limited management functionality, lower asset utilization, and no data mobility. According to Gartner data, direct attached currently accounts for nearly 17% of the external-disk storage market, and we expect this segment to decline while networked storage will continue to expand. Within the networked storage market, there are two primary categories of storage: NAS (networked attached storage) and SAN (storage area network). Directed attached (DAS and JBOD) and networked storage (NAS and SAN) are depicted in Figure 309.
Figure 309: An Overview of Storage Configurations—DAS, SAN, and NAS
Server
Array
DAS
Array
SAN
Server Server Server
Switch
Array
NAS
Server Server Server
NAS Head
Server
Array
DAS
Server
Array
DAS
Array
SAN
Server Server Server
Switch
Array
SAN
Server Server Server
Switch
Array
SAN
Server Server Server
Switch
Array
NAS
Server Server Server
NAS Head
Array
NAS
Server Server Server
NAS Head
Array
NAS
Server Server Server
NAS Head
Source: Credit Suisse.
Direct attached storage (DAS)—17% of the Storage Hardware Market
DAS storage is typically found in legacy and SMB environments and consists of a storage system that is directly connected to a server, as shown in Figure 309. While this configuration works well in smaller environments, it is impaired by the fact that server failure will lead to loss of access to all data since only a specific server is directly attached to the storage array. While the DAS benefits from its simplicity in being connected to one server and not requiring a network, the disadvantages are becoming increasingly pronounced. Since direct attached only connects to a specific server, DAS arrays can proliferate in an environment. This proliferation can create a multitude of arrays that are difficult to manage on an individual basis. Another disadvantage is that the array utilization is difficult to optimize since the storage is tied to a specific server. One server may have a DAS array that is underutilized while another server may have an array that is significantly oversubscribed. Since the array is not shared, capacity cannot be appropriately allocated to take advantage of underutilized arrays and offload from over utilized ones. Because the arrays are decentralized, they must be managed independently. While this is not an issue for a few machines, it becomes increasingly burdensome as the number of machines increases. Lastly, one of the key advantages of server virtualization is virtualized machines moving across servers, in order to get more compute capacity and build in redundancy. In a DAS environment, however, the data cannot follow the virtual machines across different servers since the array is only connected to a specific server.

16 March 2011
IT Hardware 242
Storage Area Networks (SAN)—66% of the Storage Hardware Market
SAN-based architectures, which are currently the most commonly used form of networked storage, consist of storage arrays that use fibre channel or Ethernet networks to connect to multiple servers, as highlighted in Figure 309. Historically, a SAN was built on a dedicated fibre channel network. This requires committed fibre channel switches, cabling, and management. Despite the expense of a running a dedicated storage network, SAN grew quickly owing to several important benefits over direct attached storage, including improved availability, scalability, and centralized management. Because a SAN is connected to multiple servers, if one server fails, other servers can access the data, unlike direct attached architectures. The fact that the data are centralized on a fewer number of arrays relative to DAS brings significant advantages. Since the data is centralized, it is more easily managed. Furthermore, capacity is centralized, so a SAN is less likely to have significant pools of under- and over-utilization.
SAN technology continues to evolve in several ways. While traditional SANs were combined with high-performance disks, the price performance metric is being improved with the implementation of SSDs. SSDs allow rapid access to frequently used data. Mixed with lower-performance hard drives, a blended SSD/hard disk can deliver better performance at a lower price than one using an aggregate of high-performance disks. On the connectivity side, iSCSI SANs continue to see rapid adoption. iSCSI SANs operate on general purpose Ethernet networks and, as a result, obviate the need for expensive storage-specific fibre channel networks. iSCSI SAN eliminates the most commonly cited drawback of traditional SAN (at least higher performance fibre channel based systems) in the form of the cost of a specialized network and more complex installations.
Network Attached Storage (NAS)—17% of the Storage Hardware Market
Designed for better manageability, a NAS system has an operating system that contains logic that can view data as files and this functionality resides on the NAS head. This is opposed to SAN systems that view data as blocks of data. Because the file logic resides within the NAS system, not the server operating system, a data file becomes server operating system agnostic. As a result, different types of operating systems, including UNIX and Windows, can read the same file off a NAS array. More importantly, the fact that NAS systems can see data as files allows storage administrators to have a more granular approach to manipulating data, including back-up and recovery. This allows more effective management of unstructured data, including virtual machine images.
Similar to SAN, NAS continues to evolve. While the NAS head provides important functionality in terms of presenting data in blocks, it also creates a bottleneck for data. While this is not a significant constraint in systems dealing with traditional departmental data like Word files, it does become a constraint when trying to pass significant data volumes. As a result, vendors are increasingly focusing on scale-out NAS technologies that allow for multiple NAS heads to connect to arrays, increasing system throughput. (See Figure 310.)
Figure 310: Scale-Out NAS Increases Data Throughput
A rra y
T ra d i tio n a l N A S
S e rv e r S e rv er S erv e r
N A S H e ad
A rra y
S c a le -O u t N A S
S erv e r S e rv er S erv e r
A rra y A rra y
N A S H e a d N A S H ea d
A rra y
T ra d i tio n a l N A S
S e rv e r S e rv er S erv e r
N A S H e ad
A rra y
S c a le -O u t N A S
S erv e r S e rv er S erv e r
A rra y A rra y
N A S H e a d N A S H ea d
A rra y
T ra d i tio n a l N A S
S e rv e r S e rv er S erv e r
N A S H e ad
A rra y
S c a le -O u t N A S
S erv e r S e rv er S erv e r
A rra y A rra y
N A S H e a d N A S H ea d
Source: Credit Suisse.

16 March 2011
IT Hardware 243
Key Technologies in Storage Despite steady improvements in performance (higher) and pricing (lower), in recent years, innovation in the storage market continues apace, as customers demand more efficiency and lower cost and as vendors attempt to monetize new features and functionality. Some of the key storage technologies that are targeted toward improving storage utilization, reducing the amount of data to be stored, and lowering the cost of ownership of storage include:
Thin Provisioning. Eliminates the waste associated with the allocated but unwritten storage capacity assigned to individual applications that is not accessible by others. Without thin provisioning, storage capacity is consumed as soon as it is allocated to an application, whether or not data are written to that capacity. With thin provisioning, storage utilization is increased as the storage array delays the consumption of capacity until an application actually writes data to that capacity. As such, with thin provisioning it is possible to allocate more storage capacity that is available on the disk array at the time. The key benefits associated with thin provisioning include higher storage utilization, a smaller datacenter footprint, a more gradual increase in purchase spend versus a large step function, reduced time and complexity in provisioning and therefore lower storage management and administration costs. According to Gartner, the use of thin provisioning recaptures 30-60% of storage capacity.
Figure 311: Thin Provisioning Improves the Efficiency of Storage Allocation
Array without Thin Provisioning
Free: 20%
Allocated but not used: 40%
Allocated and used: 40%
Array withThin Provisioning
Free: 60%
Allocated and used: 40%
Array without Thin Provisioning
Free: 20%
Allocated but not used: 40%
Allocated and used: 40%
Array withThin Provisioning
Free: 60%
Allocated and used: 40%
Source: Credit Suisse.
Deduplication. Uses data identification and comparison algorithms to reduce the space requirements of individual objects. This is done by comparing data to be stored to previously stored data and then storing only unique pieces of data, thereby eliminating redundancy. For example, in an enterprise when attachments (documents, pictures, etc.) are forwarded to multiple e-mail recipients, identical copies of the attachment are created. When the email platform is backed up or archived, all copies of the attachments are saved, creating unnecessary copies and eating up incremental storage capacity. With deduplication, only one copy of the attachment is backed up or archived while the remaining copies on the e-mail platform are mapped or “pointed” to the original copy, reducing back-up and archiving time and saving on incremental storage capacity. (See Figure 312.) Data deduplication for secondary storage has now become mainstream over the past couple years.

16 March 2011
IT Hardware 244
Meanwhile, data deduplication for primary storage continues to gain traction. Interest in data reduction for primary storage picked up significantly last year owing to a number of factors, including NetApp’s evangelizing the technology, IBM’s acquisition of Storwize, Dell’s acquisition of Ocarina, and the entry of startups such as BridgeSTOR.
Figure 312: Deduplication Saves Space by Creating Pointers to Replicate Data
Data A:1GB
Data D:1GB
File 1
Data B:1GB
Data D:1GB
File 2
Data C:1GB
Data D:1GB
File 3
Files with duplicate data
Data A:1GB
Data D:1GB
File 1
Data B:1GB
Pointer:0GB
File 2
Data C:1GB
Pointer:0GB
File 3
Files without duplicate data (deduped)
Data A:1GB
Data D:1GB
File 1
Data B:1GB
Data D:1GB
File 2
Data C:1GB
Data D:1GB
File 3
Files with duplicate data
Data A:1GB
Data D:1GB
File 1
Data B:1GB
Data D:1GB
File 2
Data C:1GB
Data D:1GB
File 3
Files with duplicate data
Data A:1GB
Data D:1GB
File 1
Data B:1GB
Pointer:0GB
File 2
Data C:1GB
Pointer:0GB
File 3
Files without duplicate data (deduped)
Source: Credit Suisse.
Compression. Around since the days of tape based storage, compression uses algorithms to encode data so it can be represented by a fewer bits.
Figure 313: Storage Tiering Prioritizes More Frequently-Used Data on Higher-Performance Drives and Vice Versa
Array without Tiering
Frequently accessed data
Array with Tiering
Back-up data
Infrequently accessed data
Frequently accessed data
Back-up data
Infrequently accessed data
Hig
h Pe
rform
ance
Dis
k
Incr
easi
ng D
isk P
erfo
rman
ce/C
ost
Frequently accessed data
Back-up data
Infrequently accessed data
Frequently accessed data
Back-up data
Infrequently accessed data
Source: Credit Suisse.
Tiering. Allows IT managers to lower the cost of storage by migrating data from higher cost, high-performance disks to lower-cost, high-capacity disks. This allows appropriate data files to be moved between pools of storage, prioritized as performance, cost, and protection needs dictate. This results in more frequently used data being placed on higher performing storage and less accessed, bulk data being placed on slower drivers. (See

16 March 2011
IT Hardware 245
Figure 313.) Historically, managers needed to allocate data within tiers but tiering software from vendors such as Compellent and EMC can now automate the process by detecting which data is most frequently accessed.
Solid State Drives (SSDs). Another recent development in storage is the use of SSDs, given higher performance and lower peripheral data center costs (power, cooling). The proliferation of SSDs is being driven by rapidly declining prices as volumes increase and as the technology itself matures (reliability was a gating factor in the past). According to IDC, the total enterprise-class SSD market will grow at a 83% CAGR in unit shipments and a 52% CAGR in revenue terms between 2009 and 2014. Although SSD pricing continues to rapidly decline, on a price per gigabyte basis, SSDs continue to be more expensive (although annual pricing declines are steep). There are two common ways to implement SSDs: through the traditional hard drive form factor or through PCIe cards.
■ Traditional hard drive form factor. This approach replaces the mechanical components with a solid state disk. These use relatively slower, traditional hard drive connectivity. What this approach enables is the use of SSDs in storage arrays and is used in conjunction with software that determines which data are accessed the most often, placing that data on the faster SSDs (i.e., storage tiering software). The less frequently accessed data are stored on mechanical drives. This optimizes the cost of the array and provides better price/performance on a blended basis.
■ PCIe card. The PCIe has a faster connection to the CPU than other interfaces, and this type of connection can only exist on a server. The advantage of this approach is that it places less reliance on the network, which can often be a bottleneck. The disadvantage is that it is effectively akin to direct attached storage (DAS).

16 March 2011
IT Hardware 246
Secular Shift Toward Networked Storage Continues As noted earlier, there continues to be an ongoing secular shift toward networked storage architectures within the enterprise storage market. The key drivers of this shift include:
■ Virtualization and the re-architecting of data centers. Virtualization has emerged as a key driver for networked storage. Simply put, a shared storage resource is almost a necessity in order to leverage fully the benefits of server virtualization. Since server virtualization severs the tie between a server’s operating system and its underlying hardware, applications in a virtualized server environment are no longer bound to a specific server and can move around readily. This makes networked storage a requirement for an enterprise truly to benefit from server virtualization. As such, we believe growth in networked storage will see tailwinds from the adoption of server virtualization.
■ Management capabilities. Exponential data growth, in addition to driving storage capacity, requires efficient management capabilities, ones that are scalable and not forced to grow along the same curve as the data.
■ Need for high availability and preventing data loss. Networked storage makes data broadly accessible across the enterprise. The increased focus on disaster recovery capabilities is also driving demand toward networked storage, as a networked architecture eliminates single points of failure and efficiently aggregates data for targeted back-up.
■ Ability to scale and provide higher capacity utilization. In addition to being scalable, networked architectures help with higher storage utilization when compared with DAS architectures. This is because networked storage reduces the amount of data and capacity isolated DAS “islands”.
We estimate that networked storage (SAN and NAS) accounted for 83% of storage hardware spending in 2010E, up from just 62% in 2005. As seen in Figure 314, we expect that networked storage will comprise 92% of storage hardware spending by 2015E, as older architectures (DAS/JBOD/Other) continue to fade in importance.
Figure 314: Secular Shift Toward Networked Storage Architectures Continues
0%
10%
20%
30%
40%
50%
60%
70%
80%
90%
100%
2005 2006 2007 2008 2009 2010 2011E 2012E 2013E 2014E 2015E
Legacy storage (DAS) Networked Storage (SAN+NAS)
Source: Gartner, Credit Suisse estimates.

16 March 2011
IT Hardware 247
Our Approach to Modeling the Storage Market While we highlight the importance of software and services in the storage market (particularly given the implications for vendor margins and profitability), we focus on forecasting the storage hardware market, as it is often the hardware sale that typically pulls through software and services. As such, while we do discuss the storage market opportunity holistically (including software and services) in later sections of this report, the following discussion is geared toward the approach we take to model storage hardware. Here, we note that while we use the typical capacity and price per GB by technology approach used by most industry observers, we augment this with a detailed analysis of storage systems by price point and by geography. In looking at the market by price point, we examine the trends within the following price bands: less than $50, $50-300k, $300k and above. From a technology standpoint, we examine the growth drivers for SAN (FC, iSCSI, ESCON/FICON), NAS, DAS, Other (JBOD/CAS), and lastly, from a geographic perspective, we look at growth drivers by price point, by technology for the following regions: U.S./Canada, EMEA, Japan, Asia Pacific, and Latin America. We believe that this deep segmentation approach will allow us to capture inflections and penetrations in technologies as and when they start to occur, resulting in a more accurate forecast. Last, we factor in responses from the Credit Suisse IT Survey into our model assumptions.
Storage Hardware—44% of the Market Opportunity In 2010E, the storage hardware market represented a $20.7bn opportunity, with the market growing at a 5.7% CAGR between 2005-2010. Going forward, while we expect the storage hardware market to grow at a 8.0% CAGR between 2010E-2015E, we note that server virtualization and significant growth in unstructured data are key drivers of certain segments of the market, primarily NAS, iSCSI, and unified storage.
Figure 315: Storage Hardware—Expecting an 8% CAGR (2010–2015) US$ in billions, unless otherwise stated
-
5.0
10.0
15.0
20.0
25.0
30.0
2005 2006 2007 2008 2009 2010E 2011E 2012E 2013E 2014E 2015E
$ (b
illio
ns)
DAS/Other NAS SAN
2005-2010E 2010E-2015E CAGR CAGRSAN 10.9% 7.5%NAS 16.6% 18.6% DAS/Other -9.9% -7.1% Total 5.7% 8.0%
Source: Gartner, Credit Suisse estimates.
Storage hardware can be broadly broken down into two primary groups: networked storage (over fibre channel or Ethernet networks) and direct attached storage. The key difference between the two is essentially scalability, manageability and a network requirement. While networked storage is the primary storage architecture for most enterprise networks, given the propensity toward a higher number of servers and the need

16 March 2011
IT Hardware 248
for scalability, reliability, and manageability, DAS has historically been used by small businesses, where managing data is less of an issue, the number of distributed servers is significantly lower, the absolute amount data is less and there is less propensity to build specialized storage networks. DAS essentially serves as a server-specific storage repository and is not well suited for the needs of large enterprises where data needs to be shared by a variety of users and distributed servers. Based on Gartner estimates, networked storage currently accounts for nearly 83% of the external-disk storage market we expect the market to continue to grow while DAS continues to be in secular decline. For purposes of this discussion, we will focus primarily on the networked storage market going forward since it is the most dynamic market, both in terms of growth and competition. Within this market, there are two primary categories of storage: SAN (storage area network), both Ethernet and fibre channel and NAS (network attached storage).
DAS—In Secular Decline As seen in Figure 315, while we expect overall storage hardware revenue to grow at a CAGR of 8.0% between 2010E-2015E, we expect the shift toward networked storage architectures to continue. As such, we forecast DAS storage hardware will decline at a CAGR of 7.1% between 2010E-2015E, and represent 8% of overall storage hardware revenue in 2015E (down from 17% in 2010E). Owing to the limitations in DAS discussed above, we believe DAS will continue to be in secular decline as enterprises and SMBs continue to move toward SAN and NAS (networked) storage architectures.
Networked Storage—SAN and NAS As previously discussed, the rapid growth in data, the need for scalable, efficient, always available, and easily manageable storage, coupled with the secular trend of virtualization, are all drivers of networked storage architectures. As shown in Figure 305, we estimate that networked storage (i.e., SAN and NAS combined) accounted for 83% of storage hardware revenue in 2010E, and we expect this to grow to 92% by 2015E, as networked architectures continue to win over direct attached architectures. Notwithstanding the secular shift toward networked storage architectures, we think it is important to examine in detail the underlying dynamics and drivers of both the SAN and NAS subsegments of the networked storage market.
SAN—Modest Overall Growth, Strength in iSCSI We estimate that SAN storage hardware will grow at a CAGR of 7.5% in 2010E-2015E, and represent 65% of overall storage hardware revenue in 2015E (down from 66% in 2010E). The key drivers of the SAN market, in addition to the drivers of networked storage discussed in the above intro to A Quick Primer on Storage Technologies.
■ Improved scalability. SAN-based architectures are easily scalable, as storage capacity can be increased just by adding more storage systems to a network.
■ High availability. Since a SAN allows any server to access any storage array, this builds in redundancies that are invaluable in the case of server failure. This also increases the availability of data as access to it is no longer dependent on any one server.
Within the SAN market, we would the note two important trends that contribute to overall market growth dynamics.
■ Rapid growth in iSCSI SAN. Between 2007-2010E, we estimate that iSCSI SAN revenue grew at a CAGR of 27.5%. Rapid growth in this segment of the SAN market is being driven by rapid growth in the sub-$50k category. iSCSI SAN now accounts for almost 45% of the SAN segment under $50k and, and we estimate that growth in this subsegment of SAN market will continue. In aggregate, we expect the segment will grow at a CAGR of 18.9% between 2010E-2015E driven by non-enterprise customer

16 March 2011
IT Hardware 249
storage needs, increasingly capable low/midrange systems, the need for less expensive storage to contain data growth, and an increased focus on the segment from Dell (with its EqualLogic offering). Based on this outlook for growth, iSCSI will comprise 16% of the overall hardware revenue market in 2015E versus 10% in 2010E.
■ Traditional FC SAN growth a headwind to overall SAN growth. Relative to the high-growth iSCSI sub-segment, we believe traditional FC SAN, which grew at a CAGR of 4.3% between 2007-2010E, represents a headwind for the overall SAN segment. While high-end FC SAN (above $300k) will continue to see limited growth, we estimate that FC SAN’s midrange presence should allow the technology to generate low single-digit revenue growth going forward. We estimate that going forward FC SAN revenue growth will grow at a 4.3% CAGR between 2010E-2015E, similar to what it has historically been, but significantly lower than iSCSI.
Figure 316: SAN—66% of Storage Hardware in 2010E; iSCSI Seeing Solid Growth US$ in billions, unless otherwise stated
0.0
5.0
10.0
15.0
20.0
25.0
2005 2006 2007 2008 2009 2010E 2011E 2012E 2013E 2014E 2015E
$ (b
illio
ns)
Other iSCSI Fibre Channel
2007-2010 2010E-2015E CAGR CAGRFibre Channel 4.3% 4.3%iSCSI 27.5% 18.9% Other 19.1% 8.7% Total SAN 10.9% 7.5%
Source: Gartner, Credit Suisse estimates.
NAS—Growing 2x the Storage Hardware Market The NAS subsegment of networked storage was a $3.5bn market in 2010E and represented 17% of the total storage hardware market in 2010E. While SAN-based systems have made up the larger portion of the storage hardware market (66% in 2010E), we note that most NAS systems play in the low/midrange (<$300K) segments, resulting in better growth dynamics for the segment. We expect the NAS market to grow at an 19% CAGR between 2010E-2015E, rising to 27% of overall storage hardware revenue by 2015E. We would highlight the following as the key drivers of the NAS segment.
■ Ethernet network as the core. The relative cost of Ethernet connectivity relative to fibre channel (which requires a dedicated network) is a key advantage of NAS for many implementations. The fact that a unique fibre channel network does not need to be maintained in an advantage relative to fibre channel SANs and drives down the cost per terabyte.
■ Unstructured data growth. In addition, increased demand for file-based storage is being driven by growing digital content, including growth in large scale digital content.
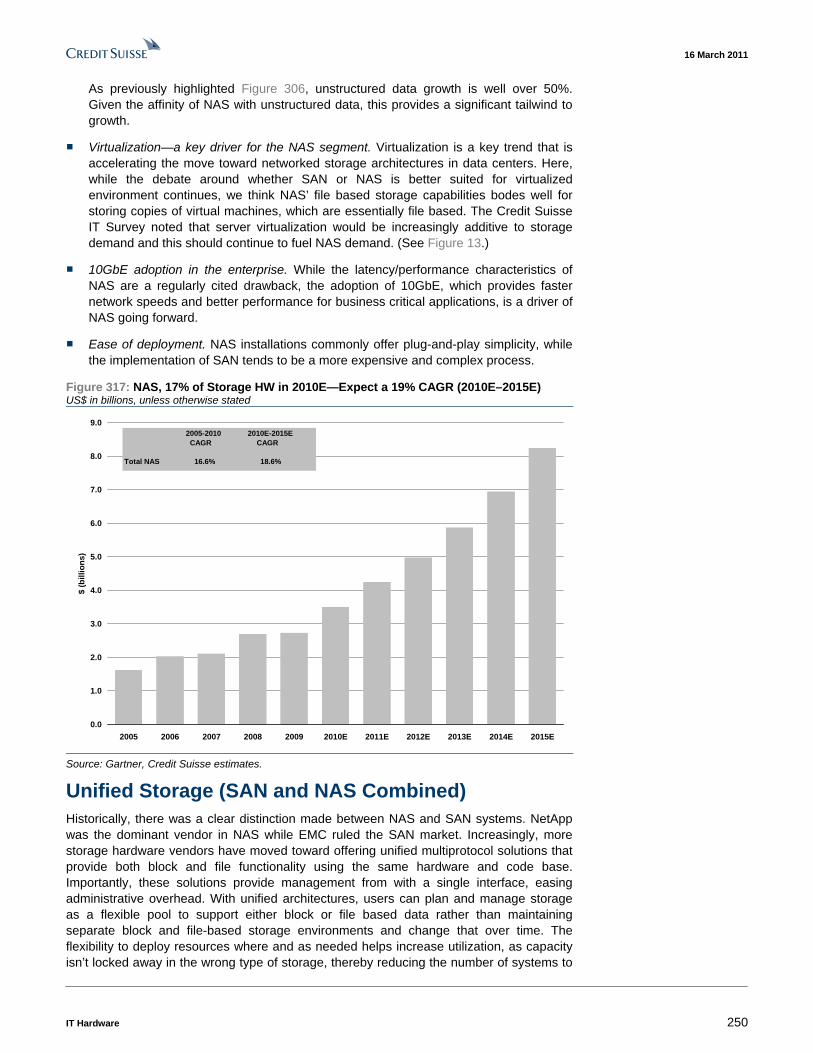
16 March 2011
IT Hardware 250
As previously highlighted Figure 306, unstructured data growth is well over 50%. Given the affinity of NAS with unstructured data, this provides a significant tailwind to growth.
■ Virtualization—a key driver for the NAS segment. Virtualization is a key trend that is accelerating the move toward networked storage architectures in data centers. Here, while the debate around whether SAN or NAS is better suited for virtualized environment continues, we think NAS’ file based storage capabilities bodes well for storing copies of virtual machines, which are essentially file based. The Credit Suisse IT Survey noted that server virtualization would be increasingly additive to storage demand and this should continue to fuel NAS demand. (See Figure 13.)
■ 10GbE adoption in the enterprise. While the latency/performance characteristics of NAS are a regularly cited drawback, the adoption of 10GbE, which provides faster network speeds and better performance for business critical applications, is a driver of NAS going forward.
■ Ease of deployment. NAS installations commonly offer plug-and-play simplicity, while the implementation of SAN tends to be a more expensive and complex process.
Figure 317: NAS, 17% of Storage HW in 2010E—Expect a 19% CAGR (2010E–2015E) US$ in billions, unless otherwise stated
0.0
1.0
2.0
3.0
4.0
5.0
6.0
7.0
8.0
9.0
2005 2006 2007 2008 2009 2010E 2011E 2012E 2013E 2014E 2015E
$ (b
illio
ns)
2005-2010 2010E-2015E CAGR CAGR
Total NAS 16.6% 18.6%
Source: Gartner, Credit Suisse estimates.
Unified Storage (SAN and NAS Combined) Historically, there was a clear distinction made between NAS and SAN systems. NetApp was the dominant vendor in NAS while EMC ruled the SAN market. Increasingly, more storage hardware vendors have moved toward offering unified multiprotocol solutions that provide both block and file functionality using the same hardware and code base. Importantly, these solutions provide management from with a single interface, easing administrative overhead. With unified architectures, users can plan and manage storage as a flexible pool to support either block or file based data rather than maintaining separate block and file-based storage environments and change that over time. The flexibility to deploy resources where and as needed helps increase utilization, as capacity isn’t locked away in the wrong type of storage, thereby reducing the number of systems to

16 March 2011
IT Hardware 251
be deployed. For modeling purposes, effectively, what this means is that the lines are blurring between SAN and NAS when it comes to discussing market growth dynamics since an array sold has both sets of functionality. As a result, market metrics and share are a point of allocation, i.e., what percent of an array is used for a specific purpose, block or file. As a result, it makes sense to examine vendor share of networked storage as a single category. Nevertheless, given the strong growth impetus for NAS and iSCSI, it is critical to examine sub-segment dynamics to determine a vendor positioning relative to key market trends. Critically, to offer a unified solution, a vendor must have a NAS offering and market leadership here is concentrated. Over the longer term, the affinity of unified storage with virtualization should provide a tailiwind to demand (Figure 318):
Figure 318: Unified Storage Is Increasingly Seen as the Best Storage Technology to Pair with Virtualization Question: Which storage technology is/ will be best paired with virtualized environments at the following points in time?
0%
5%
10%
15%
20%
25%
30%
35%
40%
45%
Now 1 year from now 2 years from now 5 years from now
FC SAN iSCSI SAN NAS DAS Unified (NAS/SAN)
Source: Credit Suisse IT Survey, February 2011.
Lower Price Bands Have Better Growth Dynamics In addition to analyzing the storage hardware market by technology type, we believe looking at the market by price band reveals several important trends. As seen in Figure 320, the low-range price band (price bands of <$50k) of the storage hardware market, driven by the fast-growing iSCSI SAN segment has been particularly strong, outgrowing the overall storage hardware market (7.4% CAGR between 2005-2010 versus a 5.7% CAGR for overall storage hardware). Going forward, we expect that the midrange of the market (price bands of $50-$300k), driven by NAS (which predominantly falls into this

16 March 2011
IT Hardware 252
price band) will grow the fastest, at a CAGR of 13.1% (2010E-2015E) versus the overall market CAGR of 8.0%. We expect at least a portion of this growth to come from the high end (price band of >$300k) market. Based on our estimates, we forecast the high-end storage hardware market to grow only 1.5% between 2010E-2015E
Storage Hardware by Geography A glance at Figure 319 shows that on a geographic basis, between 2005-2008, storage hardware revenue was stronger in Asia Pacific, EMEA, and Latin America, with these regions growing at a CAGR of 13.8%/8.3%/8.2%, respectively (versus global growth of 6.9%). Looking ahead, we expect this trend to change direction somewhat as a result of mix dynamics. The U.S., EMEA, and LatAm should have the among the best revenue growth owing to solid mixes of fibre channel SANs. Meanwhile, Asia Pacific could see revenue growth flatten as a result of bias toward less expensive storage, despite solid capacity growth.
Figure 319: Storage Hardware Revenue by Geography
2005 2006 2007 2008 2009 CAGR '05-'08Worldwide Storage MarketNorth America 7,031 7,357 7,628 8,292 7,701 5.7%EMEA 4,823 5,011 5,396 6,128 5,403 8.3%Asia Pacific 1,582 1,713 2,117 2,331 2,234 13.8%Latin America 365 443 389 461 431 8.2%Japan 1,884 1,687 1,696 1,974 1,657 1.6%Global 15,685 16,210 17,225 19,186 17,426 6.9% Growth YoY 3% 6% 11% -9%
2005 2006 2007 2008 2009Worldwide storage market by geographyNorth America 45% 45% 44% 43% 44%EMEA 31% 31% 31% 32% 31%Asia Pacific 10% 11% 12% 12% 13%Latin America 2% 3% 2% 2% 2%Japan 12% 10% 10% 10% 10%Total storage revenue 100% 100% 100% 100% 100%
Faster growth expected from AP, EMEA and LatAm. Between 2005-2008, Asia Pacific, EMEA and LatAm storage hardware revenue grew at a CAGR of 13.8%/8.3%/8.2% respectively relative to global growth of 6.9%. We expect this trend to change as a result of mix shift with the U.S., EMEA and LatAm seeing the highest growth and Asia Pacific slowing as a result of mix.
NA/ EMEA comprised 75% of the storage hardware revenue market in 2009. This is partly a result of a richer mix, notably fibre channel SANs and this should in part sustain revenue growth.
2
1
1
2
2005 2006 2007 2008 2009 CAGR '05-'08Worldwide Storage MarketNorth America 7,031 7,357 7,628 8,292 7,701 5.7%EMEA 4,823 5,011 5,396 6,128 5,403 8.3%Asia Pacific 1,582 1,713 2,117 2,331 2,234 13.8%Latin America 365 443 389 461 431 8.2%Japan 1,884 1,687 1,696 1,974 1,657 1.6%Global 15,685 16,210 17,225 19,186 17,426 6.9% Growth YoY 3% 6% 11% -9%
2005 2006 2007 2008 2009Worldwide storage market by geographyNorth America 45% 45% 44% 43% 44%EMEA 31% 31% 31% 32% 31%Asia Pacific 10% 11% 12% 12% 13%Latin America 2% 3% 2% 2% 2%Japan 12% 10% 10% 10% 10%Total storage revenue 100% 100% 100% 100% 100%
Faster growth expected from AP, EMEA and LatAm. Between 2005-2008, Asia Pacific, EMEA and LatAm storage hardware revenue grew at a CAGR of 13.8%/8.3%/8.2% respectively relative to global growth of 6.9%. We expect this trend to change as a result of mix shift with the U.S., EMEA and LatAm seeing the highest growth and Asia Pacific slowing as a result of mix.
NA/ EMEA comprised 75% of the storage hardware revenue market in 2009. This is partly a result of a richer mix, notably fibre channel SANs and this should in part sustain revenue growth.
22
11
11
22
Source: Company data, Credit Suisse estimates.

16 March 2011
IT Hardw
are 253
Figure 320: Storage Hardware Market Revenue by Price Band—Suggests Better Growth Dynamics for the Midrange and Low End US$ in millions, unless otherwise stated
Mid-range storage hardware market ($50-$300k) is the sweet spot. Going forward, while we expect the overall storage hardware market to grow at a CAGR of 8% (2010E-2015E), we expect the mid-range of the market to experience the strongest growth dynamics, and enjoy a CAGR of 13% over the same period, while the high-end of the market (>$300k price point) remains roughly flat, growing at a CAGR of 2%. We expect the low-end of storage hardware to grow at a 5% CAGR between 2010E-2015E.
2
1
1
3
2
1
1
1 NAS and iSCSI systems to drive growth in the low/mid-range. At the low/mid-range (sub $300k), we expect growth to be largely driven by less expensive, Ethernet-based iSCSI SAN & NAS systems, which we expect will enjoy a double digit growth CAGR between 2010E-2015E. We expect iSCSI SAN to be strong (18% CAGR) at the low-end (sub $50k), while NAS systems enjoy faster mid-range ($50-$300K) growth (+24% CAGR).
Fibre channel SAN growth to be flattish. We expect fibre channel SAN, which is typically best suited for block data (as opposed to file-based, unstructured data which we expect will enjoy faster growth), to continue to grow at a modest 4% CAGR between 2010E-2015E. Within FC SAN, we estimate stronger growth in the mid-range (10% CAGR) and a decline (-2% CAGR) in the high-end (>$300k), as mid-range systems become increasingly capable.
2
2 3
3
2005 2006 2007 2008 2009 2010E 2011E 2012E 2013E 2014E 2015E CAGR '05-'10E CAGR '10E-'15EWorldwide Networked Storage by Price Point (<$50K)SAN 1,389 1,573 2,369 2,734 2,792 3,212 3,474 3,719 3,967 4,303 4,746 18.3% 8.1%Fibre Channel 0 0 1,739 1,835 1,667 1,777 1,762 1,711 1,598 1,495 1,399 NM -4.7%iSCSI 0 0 560 898 1,126 1,434 1,712 2,009 2,369 2,809 3,347 NM 18.5%Other 0 0 70 1 0 1 0 0 0 0 0 NM NMNAS 804 966 1,010 1,349 1,260 1,417 1,560 1,680 1,828 1,986 2,163 12.0% 8.8%DAS/Other 2,741 2,279 2,183 2,455 1,911 2,433 2,323 2,162 2,091 2,054 2,025 -2.4% -3.6%Total 4,934 4,819 5,561 6,537 5,963 7,063 7,357 7,562 7,886 8,344 8,934 7.4% 4.8% Growth YoY -2.3% 15.4% 17.5% -8.8% 18.4% 4.2% 2.8% 4.3% 5.8% 7.1%
Worldwide Storage Hardware. by Price Point ($50-$300K)SAN 3,763 3,976 4,505 5,031 4,886 5,768 6,276 6,950 7,721 8,613 9,622 8.9% 10.8%Fibre Channel 0 0 3,926 4,336 4,308 5,031 5,422 5,976 6,585 7,273 8,050 NM 9.9%iSCSI 0 0 383 497 428 577 704 830 997 1,206 1,440 NM 20.1%Other 0 0 196 198 150 159 151 144 139 134 131 NM -3.8%NAS 821 1,071 1,104 1,347 1,475 2,093 2,695 3,303 4,049 4,965 6,089 20.6% 23.8%DAS/Other 1,464 1,490 1,146 996 795 804 669 551 449 367 332 -11.3% -16.2%Total 6,049 6,537 6,755 7,374 7,156 8,666 9,640 10,804 12,219 13,945 16,043 7.5% 13.1% Growth YoY 8.1% 3.3% 9.2% -3.0% 21.1% 11.2% 12.1% 13.1% 14.1% 15.0%
Worldwide Storage Hardware by Price Point (>$300K)SAN 3,016 3,319 3,888 4,866 4,048 4,704 4,881 4,987 5,079 5,187 5,293 9.3% 2.4%Fibre Channel 0 0 3,132 3,462 2,714 3,182 3,177 3,069 2,983 2,918 2,874 NM -2.0%iSCSI 0 0 32 23 31 11 10 9 10 10 11 NM -0.1%Other 0 0 723 1,381 1,302 1,511 1,694 1,908 2,087 2,259 2,408 NM 9.8%NAS 1 0 1 1 0 0 0 0 0 0 0 NM NMDAS/Other 1,685 1,536 1,021 407 259 252 193 143 105 78 58 -31.6% -25.6%Total 4,702 4,855 4,909 5,274 4,307 4,957 5,073 5,130 5,184 5,265 5,351 1.1% 1.5% Growth YoY 3.2% 1.1% 7.4% -18.3% 15.1% 2.4% 1.1% 1.1% 1.5% 1.6%
Worldwide Storage Hardware by Price Point (all price points)SAN 8,168 8,868 10,762 12,632 11,726 13,684 14,631 15,656 16,767 18,104 19,661 10.9% 7.5%Fibre Channel 0 0 8,798 9,634 8,689 9,991 10,360 10,756 11,166 11,686 12,324 NM 4.3%iSCSI 0 0 975 1,418 1,585 2,022 2,426 2,848 3,376 4,025 4,798 NM 18.9%Other 0 0 989 1,580 1,453 1,671 1,845 2,052 2,225 2,393 2,539 NM 8.7%NAS 1,626 2,038 2,114 2,697 2,735 3,511 4,255 4,983 5,876 6,951 8,252 16.6% 18.6%DAS/Other 5,890 5,305 4,349 3,857 2,965 3,490 3,185 2,857 2,645 2,499 2,414 -9.9% -7.1%Total 15,685 16,210 17,225 19,186 17,426 20,685 22,070 23,496 25,289 27,554 30,327 5.7% 8.0% Growth YoY 3.3% 6.3% 11.4% -9.2% 18.7% 6.7% 6.5% 7.6% 9.0% 10.1%
Mid-range storage hardware market ($50-$300k) is the sweet spot. Going forward, while we expect the overall storage hardware market to grow at a CAGR of 8% (2010E-2015E), we expect the mid-range of the market to experience the strongest growth dynamics, and enjoy a CAGR of 13% over the same period, while the high-end of the market (>$300k price point) remains roughly flat, growing at a CAGR of 2%. We expect the low-end of storage hardware to grow at a 5% CAGR between 2010E-2015E.
22
11
11
33
22
11
11
11 NAS and iSCSI systems to drive growth in the low/mid-range. At the low/mid-range (sub $300k), we expect growth to be largely driven by less expensive, Ethernet-based iSCSI SAN & NAS systems, which we expect will enjoy a double digit growth CAGR between 2010E-2015E. We expect iSCSI SAN to be strong (18% CAGR) at the low-end (sub $50k), while NAS systems enjoy faster mid-range ($50-$300K) growth (+24% CAGR).
Fibre channel SAN growth to be flattish. We expect fibre channel SAN, which is typically best suited for block data (as opposed to file-based, unstructured data which we expect will enjoy faster growth), to continue to grow at a modest 4% CAGR between 2010E-2015E. Within FC SAN, we estimate stronger growth in the mid-range (10% CAGR) and a decline (-2% CAGR) in the high-end (>$300k), as mid-range systems become increasingly capable.
22
22 33
33
2005 2006 2007 2008 2009 2010E 2011E 2012E 2013E 2014E 2015E CAGR '05-'10E CAGR '10E-'15EWorldwide Networked Storage by Price Point (<$50K)SAN 1,389 1,573 2,369 2,734 2,792 3,212 3,474 3,719 3,967 4,303 4,746 18.3% 8.1%Fibre Channel 0 0 1,739 1,835 1,667 1,777 1,762 1,711 1,598 1,495 1,399 NM -4.7%iSCSI 0 0 560 898 1,126 1,434 1,712 2,009 2,369 2,809 3,347 NM 18.5%Other 0 0 70 1 0 1 0 0 0 0 0 NM NMNAS 804 966 1,010 1,349 1,260 1,417 1,560 1,680 1,828 1,986 2,163 12.0% 8.8%DAS/Other 2,741 2,279 2,183 2,455 1,911 2,433 2,323 2,162 2,091 2,054 2,025 -2.4% -3.6%Total 4,934 4,819 5,561 6,537 5,963 7,063 7,357 7,562 7,886 8,344 8,934 7.4% 4.8% Growth YoY -2.3% 15.4% 17.5% -8.8% 18.4% 4.2% 2.8% 4.3% 5.8% 7.1%
Worldwide Storage Hardware. by Price Point ($50-$300K)SAN 3,763 3,976 4,505 5,031 4,886 5,768 6,276 6,950 7,721 8,613 9,622 8.9% 10.8%Fibre Channel 0 0 3,926 4,336 4,308 5,031 5,422 5,976 6,585 7,273 8,050 NM 9.9%iSCSI 0 0 383 497 428 577 704 830 997 1,206 1,440 NM 20.1%Other 0 0 196 198 150 159 151 144 139 134 131 NM -3.8%NAS 821 1,071 1,104 1,347 1,475 2,093 2,695 3,303 4,049 4,965 6,089 20.6% 23.8%DAS/Other 1,464 1,490 1,146 996 795 804 669 551 449 367 332 -11.3% -16.2%Total 6,049 6,537 6,755 7,374 7,156 8,666 9,640 10,804 12,219 13,945 16,043 7.5% 13.1% Growth YoY 8.1% 3.3% 9.2% -3.0% 21.1% 11.2% 12.1% 13.1% 14.1% 15.0%
Worldwide Storage Hardware by Price Point (>$300K)SAN 3,016 3,319 3,888 4,866 4,048 4,704 4,881 4,987 5,079 5,187 5,293 9.3% 2.4%Fibre Channel 0 0 3,132 3,462 2,714 3,182 3,177 3,069 2,983 2,918 2,874 NM -2.0%iSCSI 0 0 32 23 31 11 10 9 10 10 11 NM -0.1%Other 0 0 723 1,381 1,302 1,511 1,694 1,908 2,087 2,259 2,408 NM 9.8%NAS 1 0 1 1 0 0 0 0 0 0 0 NM NMDAS/Other 1,685 1,536 1,021 407 259 252 193 143 105 78 58 -31.6% -25.6%Total 4,702 4,855 4,909 5,274 4,307 4,957 5,073 5,130 5,184 5,265 5,351 1.1% 1.5% Growth YoY 3.2% 1.1% 7.4% -18.3% 15.1% 2.4% 1.1% 1.1% 1.5% 1.6%
Worldwide Storage Hardware by Price Point (all price points)SAN 8,168 8,868 10,762 12,632 11,726 13,684 14,631 15,656 16,767 18,104 19,661 10.9% 7.5%Fibre Channel 0 0 8,798 9,634 8,689 9,991 10,360 10,756 11,166 11,686 12,324 NM 4.3%iSCSI 0 0 975 1,418 1,585 2,022 2,426 2,848 3,376 4,025 4,798 NM 18.9%Other 0 0 989 1,580 1,453 1,671 1,845 2,052 2,225 2,393 2,539 NM 8.7%NAS 1,626 2,038 2,114 2,697 2,735 3,511 4,255 4,983 5,876 6,951 8,252 16.6% 18.6%DAS/Other 5,890 5,305 4,349 3,857 2,965 3,490 3,185 2,857 2,645 2,499 2,414 -9.9% -7.1%Total 15,685 16,210 17,225 19,186 17,426 20,685 22,070 23,496 25,289 27,554 30,327 5.7% 8.0% Growth YoY 3.3% 6.3% 11.4% -9.2% 18.7% 6.7% 6.5% 7.6% 9.0% 10.1%
Source: Company data, Credit Suisse estimates.

16 March 2011
IT Hardware 254
Storage Software—25% of the Market and Growing in Importance Compared with the purchase of a server where the user can typically mix and match hardware and software, storage is different in that storage hardware and software are often bundled together by the vendor, although we note some storage software vendors pursue a host-based strategy quite successfully. Depending on the system, there is an opportunity for a vendor to sell management software beyond what is bundled with the storage array. Given that storage vendors are increasingly shifting to industry standard architectures, software will increasingly play a focal role in the storage market. From a profitability standpoint, the higher operating margins that storage vendors enjoy is in large part owing to the software component of a typical hardware sale plus the opportunity to sell additional array and data management software. We expect the storage software market to grow at a 6.5% CAGR between 2010E-2015E, reaching a market opportunity of $16bn by 2015E.
Figure 321: Storage Management Software (Distributed and Mainframe)—A $16bn Market Opportunity by 2015 US$ in millions, unless otherwise stated 2007 2008 2009 2010 2011 2012 2013 2014 2015 CAGR ‘10-‘15Backup and Recovery Software 3,238 3,650 3,571 3,669 3,813 3,991 4,165 4,341 4,449 3.9% Core Storage Management 1,750 1,812 1,623 1,563 1,563 1,566 1,568 1,571 1,516 -0.6% Data Replication 2,519 2,618 2,379 2,457 2,600 2,760 2,918 3,068 3,160 5.2% Device Resource Management 1,232 1,379 1,217 1,228 1,256 1,283 1,307 1,331 1,344 1.8% HSM and Archive Software 788 1,026 1,062 1,358 1,701 2,100 2,587 3,170 3,995 24.1% Storage Resource Management 885 921 914 922 934 944 954 961 976 1.1% Other Storage Mgmt. Software 487 560 476 479 490 501 511 518 521 1.7%
Total 10,900 11,965 11,242 11,676 12,358 13,145 14,010 14,960 15,960 6.5% Y/Y % change 10% -6% 4% 6% 6% 7% 7% 7%
Source: Gartner, Credit Suisse estimates.
While we expect storage software in aggregate to grow roughly in-line with the storage hardware market, there are pockets of stronger growth. Looking at each subsegment within storage software, we expect HSM/Archiving software to see the strongest growth as companies focus on data retention functionality. We forecast HSM/Archiving software to grow at a CAGR of 24% between 2010E-2015E. Other subsegments that will continue to see growth are data replication (5.2% CAGR) and backup and recovery (3.9% CAGR). Below, we provide a brief overview of the six key segments of storage software.
■ Backup and recovery. This software provides backup of storage to tape, disk or optical devices and includes functionality to specifically support data recovery.
■ Core storage management. This provides data organization functionality, including file system and volume management and disk utilities.
■ Data replication. This category includes data replication functions that reside in the disk array controller, in a device in the storage network or on a server, and in remote application products, migration tools, and disk imaging solutions. While there are multiple forms of replication, host-based or array-based based, for now, this segment is likely to be a key area of competition between EMC and NetApp. EMC’s offering in the segment is SRDF and competes with NetApp’s SyncMirror. With the ramp-up of EMC’s VPLEX, we expect the competitive environment to only become more intense over time as the product evolves.
■ Device resource management software (DRM). DRM includes storage and SAN infrastructure software that provides configuration and monitoring functionality to collect capacity, performance, and array information.

16 March 2011
IT Hardware 255
■ Hierarchical storage management (HSM) and archiving. HSM provides for automatic migration of infrequently used files to secondary storage, active archiving functions for e-mail and database archiving to provide specific functionality for linking archived data back to the application, as well as ways to actively access recovery information.
■ Storage resource management (SRM). Provides data collection and automation functionality that consolidate and operate on information from multiple platforms supporting storage management tools on multiple operating systems, storage devices and storage area network (SAN) devices.
Storage Services—32% of the Market Opportunity Similar to trends in the storage software market, as enterprise customers continue to look for ways to plan, maintain, and integrate their storage infrastructures more efficiently, and as vendors attempt to provide storage solutions (as opposed to point products), services take on an increasingly important role. Smaller businesses with limited headcount, IT budgets, and storage expertise are likely to look to third parties (OEMs, VARS, service companies) to assist in planning and executing solutions related to data protection, archiving, virtualization, content resource management and improving overall storage infrastructure utilization. Following investments in new, more complex networked architectures as well as solutions such as virtualization, many large enterprises find themselves in need of assistance to integrate and implement these solutions. Overall, the storage services market is expected grow at a 4.9% CAGR between 2010E-2015E, with the market reaching $19.1bn in revenue by 2015E.
Figure 322: Storage-Related Services—A $19bn Market Opportunity by 2015E US$ in millions, unless otherwise stated 2010 2011 2012 2013 2014 2015 CAGR ‘10-‘15 Consulting 3,702 3,919 4,173 4,389 4,727 5,011 6.2% Implementation 3,615 3,852 4,179 4,517 4,741 5,025 6.8% Management 7,726 7,924 8,213 8,517 8,837 9,102 3.3%
Total 15,043 15,695 16,565 17,423 18,305 19,138 4.9% Source: Gartner, Credit Suisse estimates.

16 March 2011
IT Hardware 256
Storage – Winners and Losers Given the inherent attractiveness of the enterprise storage market both in terms of growth and profitability, together with secular pressures on the core server businesses of some of the traditional systems vendors, it is no surprise that the competitive landscape in the storage segment is intense. The frenzy of M&A activity in the enterprise storage space (Compellent, 3PAR, Isilon, among others recently) highlights the strategic efforts of vendors to bolster their storage offerings. While historical trends suggest that organic shifts in enterprise storage market share tend to occur rather slowly, there are several factors, in our view, that are likely to shape longer-term market share dynamics in the storage market. As such, we have developed a proprietary scorecard to evaluate key storage vendors across eight metrics that we think are important for success in the storage market. We score each of the key storage vendors across these eight metrics and use the aggregate scores for each vendor to develop a ranking of storage vendor positioning. This allows us to both determine which vendors are well-positioned today, and also develop a bias on how market shares in the storage segment are likely to evolve going forward. Based on our analysis, we arrive at the following conclusions.
■ EMC with 26% market share in 2010E ranks first on our scorecard. While EMC lags peers on the critical price/performance metric (owing to its high-end/FC SAN exposure), as seen in Figure 323, the company ranks highly on the important maintenance/support and management functionality categories. The company’s strong storage software positioning (leading 24% share) is a key strength in our view. Overall, despite 10% revenue exposure to legacy (i.e., non-networked) storage environments, we believe EMC’s leading share is sustainable and well positioned to expand modestly going forward.
■ NetApp with 10% market share in 2010E, ranks second on our scorecard. As seen in Figure 323, NetApp scores highly on the price performance and product positioning metrics. On price performance, NetApp’s lower cost/TB relative to peers suggests that the company is well positioned to benefit from the market’s bias toward lower priced storage capacity. From a positioning standpoint, the company’s lack of exposure to legacy storage technologies, and a strong position in the faster growing NAS and midrange markets (which we expect will grow at a CAGR of 19%/13%, respectively between 2010-2015 versus our expectation for 8% overall storage hardware growth), suggest that NetApp will gain overall storage hardware share purely based on the subsegments in which the company participates. While NetApp gets low scores on distribution reach and sales relationships, we believe these are areas that can and are being remedied. We also believe holes in the company’s software portfolio, particularly in back-up and recovery and HSM / archiving are likely to be addressed through acquisition, although the trend toward using replication features for back-up should help for now. Overall, a second position ranking on our scorecard relative to the company’s current fifth place share suggests to us that NetApp will be a meaningful share gainer in storage going forward.
■ IBM with 13% market share in 2010E ranks third on our scorecard. IBM’s high scores in most scorecard metrics are offset by low scores for price/performance, management functionality and product positioning. This is driven by the company’s SAN market exposure and the lack of any meaningful organic traction in the faster growing NAS market, given only limited success so far with its own SONAS offering and the company’s reliance on reselling NetApp’s NAS offering. While the company is reasonably well positioned in storage software (with ~10% share) and has strong global distribution, legacy exposure (13% of storage revenue) will remain a drag on overall storage share gains. As such, we expect IBM’s storage share to remain stagnant going forward.

16 March 2011
IT Hardware 257
■ HP with 11% market share in 2010E ranks fourth on our scorecard. While HP scores well on existing sales relationships, the ability to bundle, and distribution, this is offset by low scores in product positioning and roadmap, as well as management functionality. On software, while HP participates in all major storage software categories, it does not have a meaningful position in any. In addition, legacy exposure (28% of storage revenue) and lack of momentum for the company’s NAS offering (IBRIX) present a headwind to share gains. As such, even assuming the company has traction with the recent 3PAR acquisition, we expect HP’s overall storage market share to continue to decline modestly going forward.
■ Dell with 10% market share in 2010E ranks fifth on our scorecard. While Dell gets a leading score in price/performance and scores well on product positioning on our scorecard, this is offset by mediocre scores in most other categories. Despite an attractive iSCSI SAN offering (EqualLogic), meaningful legacy revenue exposure (24% of storage revenue) will continue to be a drag on the company’s growth prospects in storage. Last, the company’s limited storage software offerings is also a negative in our view. As such, we see scope for Dell’s storage share to be flat to only modestly up going forward.
■ Sun/Oracle with 3% market share in 2010E ranks sixth on our scorecard as a reasonable score for existing sales relationships is offset by low scores for price performance, product positioning, roadmap, and maintenance and support. Given meaningful legacy exposure, we believe the company’s storage share remains vulnerable going forward. The Credit Suisse Software Team expects Oracle to increasingly promote the company's ZFS Storage Appliance product line, which combines a Flash Hybrid Storage Pool architecture for file and block workloads with DTrace Analytics for storage and Web-based management. As per the company's press release on September 20, 2010, Oracle has integrated the hybrid storage pool architecture with Oracle Applications, Oracle Fusion Middleware, Oracle Database, Oracle Solaris, Oracle Linux and Oracle VM.

16 March 2011
IT Hardw
are 258
Figure 323: Storage Hardware Vendor Rankings Based on the Proprietary Credit Suisse Scorecard
Vendor Metric Weight EMC NetApp IBM HP Dell Sun/Oracle
Rank (weighted) 1 2 3 4 5 6Score (weighted) 7.4 6.5 6.2 5.8 5.6 3.8
Rank storage HW market share, % 1 5 2 3 4 6Global storage HW revenue share (2010) 26.2% 9.8% 13.1% 11.4% 10.5% 2.8%
Key metrics:Price / Performance 26% 5 8 4 7 9 3Maintenance / Support 23% 9 6 8 7 5 4Management Functionality / Software Stack 20% 8 6 5 3 2 4Product Positioning 8% 8 9 4 3 7 2Roadmap 8% 9 7 8 5 3 4Distribution 5% 8 4 9 7 6 5Sales / Existing Relationship 5% 7 3 9 8 5 6Ability to provide a complete solution 5% 6 4 9 8 7 5
EMC ranks first in our scorecard owing to high scores in almost all metrics, particularly in the important maintenance/support and , managementcategories. The company gets a low score on price / performance, owing to a historical focus on higher-end systems. Overall, we believe EMC’s leading share is not only sustainable but biased to grow modestly going forward.
NetApp ranks second in our scorecard owing to high scores for price performance and product positioning. While the company gets low scores on distribution reach and sales relationships, we believe these are areas that can be remedied over time. Overall, we believe NetApp is best positioned to gain share going forward.
IBM ranks third in our scorecard with high scores in most scorecard metrics being offset by low scores for price/performance, management and product positioning. Overall, we believe IBM’s share will be stagnant going forward
HP ranks fourth in our scorecard with high scores in sales relationships and the ability to bundle being offset by low scores in management functionality, product positioning and roadmap. Overall, we believe HP’s share will decline modestly going forward.
Dell ranks fifth in our scorecard with a leading score in price/performance being offset by mediocre scores in most other categories. While product positioning (iSCSI SAN) is a positive, we expect flat to slightly higher shares going forward.
Sun/Oracle ranks six on our scorecard as sales relationships are offset by low scores in price performance, product positioning and maintenance and support. Overall we think Sun’s storage share remains vulnerable going forward. While Exadata could be a disruptive integrated appliance offering, we believe the system will see gradual adoption.
1
3
4
5
1
2
2
3 4
4
5
6
6
Vendor Metric Weight EMC NetApp IBM HP Dell Sun/Oracle
Rank (weighted) 1 2 3 4 5 6Score (weighted) 7.4 6.5 6.2 5.8 5.6 3.8
Rank storage HW market share, % 1 5 2 3 4 6Global storage HW revenue share (2010) 26.2% 9.8% 13.1% 11.4% 10.5% 2.8%
Key metrics:Price / Performance 26% 5 8 4 7 9 3Maintenance / Support 23% 9 6 8 7 5 4Management Functionality / Software Stack 20% 8 6 5 3 2 4Product Positioning 8% 8 9 4 3 7 2Roadmap 8% 9 7 8 5 3 4Distribution 5% 8 4 9 7 6 5Sales / Existing Relationship 5% 7 3 9 8 5 6Ability to provide a complete solution 5% 6 4 9 8 7 5
EMC ranks first in our scorecard owing to high scores in almost all metrics, particularly in the important maintenance/support and , managementcategories. The company gets a low score on price / performance, owing to a historical focus on higher-end systems. Overall, we believe EMC’s leading share is not only sustainable but biased to grow modestly going forward.
NetApp ranks second in our scorecard owing to high scores for price performance and product positioning. While the company gets low scores on distribution reach and sales relationships, we believe these are areas that can be remedied over time. Overall, we believe NetApp is best positioned to gain share going forward.
IBM ranks third in our scorecard with high scores in most scorecard metrics being offset by low scores for price/performance, management and product positioning. Overall, we believe IBM’s share will be stagnant going forward
HP ranks fourth in our scorecard with high scores in sales relationships and the ability to bundle being offset by low scores in management functionality, product positioning and roadmap. Overall, we believe HP’s share will decline modestly going forward.
Dell ranks fifth in our scorecard with a leading score in price/performance being offset by mediocre scores in most other categories. While product positioning (iSCSI SAN) is a positive, we expect flat to slightly higher shares going forward.
Sun/Oracle ranks six on our scorecard as sales relationships are offset by low scores in price performance, product positioning and maintenance and support. Overall we think Sun’s storage share remains vulnerable going forward. While Exadata could be a disruptive integrated appliance offering, we believe the system will see gradual adoption.
11
33
44
55
11
22
22
33 44
44
55
66
66
Source: Gartner, Company data, Credit Suisse IT Survey, Credit Suisse estimates.

16 March 2011
IT Hardware 259
Nuances within Storage Market Share Worth Noting Before examining vendor market shares across various dimensions, we think it is important to note the following nuances related to storage vendor market shares.
Incumbency provides a competitive edge, market share shifts take time. Given that storage hardware plays a critical role within the enterprise data center, and given typical investments in storage software and services that accompany storage hardware investments, incumbency is an inherent advantage from a vendor perspective. There tends to be a lot of inertia when it comes to swapping out systems that store, backup, and manage business critical data, especially when the investments made are significant. As such, storage market shares tend to be less volatile relative to other end markets within IT hardware, such as PCs and servers. We believe this is the case even around product cycles.
Figure 324: Storage Market Shares (Organic) Tend to Move Rather Slowly
0%
5%
10%
15%
20%
25%
30%
35%
40%
45%
50%
2006 2007 2008 2009 2010E
Vend
or s
tora
ge re
venu
e sh
are,
%
Dell EMC HP IBM NetApp
Source: Gartner, Credit Suisse estimates.
Market share for the industry leader structurally lower. As seen in Figure 354, market shares within the storage market are highly fragmented, with the share leader EMC securing just 26% of the storage hardware market. This is in contrast to other hardware segments within enterprise such as x86 servers where the share leader HP has 31% share, enterprise routing where Cisco has 75%-plus. We believe this is reflective of two things: first, the point made above that market shares evolve very gradually, owing to the inherent conservatism around data and concerns about loss. Second, across organizations, there tends to be a bias around acquiring products from certain vendors and historically, server vendors have had the inside track owing to their ability to sell direct attached storage systems with their server platforms.

16 March 2011
IT Hardware 260
Our Outlook for Storage Hardware Vendor Shares While eight vendors hold over 84% share of the external storage hardware market, the key vendors within our coverage hold 71% market share as shown in Figure 325. EMC is the current market share leader with over 26% revenue share in 2010E, followed by IBM with 13% share, HP and Dell with 11% share each, and NetApp with 10% share. Here is a summary of our outlook on how we think storage hardware market shares will evolve.
Figure 325: Global Storage Hardware Revenue Share by Vendor 2005 2006 2007 2008 2009 2010E 2011E 2012E 2013E 2014E 2015E EMC 21.7% 23.1% 23.2% 23.4% 23.6% 26.2% 26.8% 27.0% 27.2% 27.6% 28.1% IBM 14.2% 15.2% 15.0% 13.2% 14.4% 13.1% 13.1% 13.1% 13.0% 12.9% 12.7% HP 16.5% 15.3% 14.0% 13.3% 12.0% 11.4% 11.2% 10.9% 10.7% 10.5% 10.2% Dell 8.7% 8.6% 9.6% 9.7% 9.4% 10.5% 10.6% 10.7% 10.8% 10.9% 11.0% NetApp 5.7% 6.8% 7.1% 7.3% 7.9% 9.8% 11.3% 12.8% 14.3% 15.8% 17.2% Other 33.3% 31.0% 31.3% 33.2% 32.7% 29.0% 27.0% 25.5% 23.9% 22.3% 20.8%
Total 100.0% 100.0% 100.0% 100.0% 100.0% 100.0% 100.0% 100.0% 100.0% 100.0% 100.0% Source: Company data, Credit Suisse estimates.
As detailed in Figure 326, our view on the evolution of storage vendor shares going forward are driven by our granular approach to modeling vendor shares by technology and price band.

16 March 2011
IT Hardw
are 261
Figure 326: Key Vendor’s Storage Market Share Evolution by Technology and Price Point 2005 2006 2007 2008 2009 2010E 2011E 2012E 2013E 2014E 2015E CAGR '05-'10E CAGR '10E-'15E
SAN
<$50kDell 9% 10% 5% 17% 21% 29% 30% 31% 32% 33% 33% 49% 11%EMC 12% 20% 16% 17% 15% 13% 17% 18% 19% 20% 22% 20% 20%HP 18% 22% 22% 18% 18% 18% 17% 16% 16% 15% 14% 18% 4%IBM 16% 16% 12% 9% 5% 3% 3% 3% 3% 4% 4% -14% 10%NetApp 0% 0% 5% 4% 3% 5% 7% 9% 10% 12% 14% NM 31%
$50-300kDell 18% 19% 19% 16% 11% 11% 11% 12% 12% 13% 13% -2% 15%EMC 20% 20% 20% 22% 20% 24% 23% 23% 23% 23% 23% 12% 11%HP 26% 20% 17% 17% 16% 13% 13% 13% 13% 12% 12% -5% 9%IBM 12% 15% 14% 13% 17% 15% 15% 15% 15% 15% 15% 14% 10%NetApp 0% 0% 4% 6% 8% 11% 13% 15% 17% 19% 21% NM 26%
>$300kDell 0% 0% 0% 0% 3% 0% 0% 0% 0% 0% 0% NM -2%EMC 43% 45% 43% 42% 40% 47% 46% 45% 44% 43% 42% 5% -1%HP 17% 13% 11% 8% 6% 5% 6% 6% 7% 7% 7% -14% 9%IBM 17% 18% 24% 22% 24% 24% 25% 26% 27% 28% 28% 17% 5%NetApp 0% 0% 0% 0% 0% 0% 0% 0% 0% 0% 0% NM NM
NAS
<$50kDell 10% 6% 6% 5% 4% 4% 4% 4% 4% 4% 4% -6% 9%EMC 12% 9% 10% 14% 19% 22% 24% 26% 28% 30% 32% 26% 17%HP 17% 14% 13% 9% 6% 4% 4% 3% 3% 3% 3% -16% 3%IBM 1% 4% 4% 2% 4% 3% 3% 3% 3% 3% 3% 50% 9%NetApp 29% 39% 30% 20% 17% 26% 24% 23% 23% 23% 23% 9% 7%
$50-300kDell 0% 0% 0% 0% 0% 0% 0% 0% 0% 0% 0% NM NMEMC 13% 13% 10% 7% 20% 29% 30% 31% 32% 33% 34% 41% 28%HP 0% 0% 1% 1% 0% 1% 1% 1% 1% 1% 1% NM 24%IBM 0% 7% 10% 13% 10% 9% 9% 9% 9% 9% 9% 193% 24%NetApp 81% 67% 55% 53% 45% 41% 40% 38% 37% 35% 34% 5% 19%
Dell: Dell sub-$50k share gains should stabilize as EqualLogic matures and the segment gets increasingly targeted by other storage vendors.The company’s changing relationship with EMC has reset share in the $50-300k category and static share is a likely outcome as Dell mixes its portfolio with internal IP. Compellent should help offset some of the declines associated with EMC products. Nevertheless, Dell’s lack of a strong unified offering is a drag in both the SAN and NAS categories.
HP: The acquisition of 3PAR should allow the company to update legacy products and overlay existing partners, as a result, the company is unlikely to gain meaningful share. The lack of a solid NAS/unified offering results in the lack of exposure to key growth segments, similar to Dell.
3
11
1
2
EMC: The company’s refresh of its unified storage offering should allow for continued share gains in NAS and improved performance in the sub-$50k SAN category.
2
2
2
3
3
IBM: IBM’s focus on the high-end could allow for gradual share gains in the high-end SAN (above $300k. Solid offerings in the competitive SAN mid-range are offset by an intensely competitive field and the emergence of unified storage as a driver of growth. The fact that SONAS is still maturing places focus on the NetApp partnership as a source of share in NAS.
4 NetApp: Despite share losses in core NAS, NetApp’s unified offerings allows for share gains in the larger, albeit slower growing SAN category. Despite share losses in NAS, the rapidly growing category supports a strong revenue CAGR for NetApp as SAN share gains are additive.
5
4
4
4
5
5
2005 2006 2007 2008 2009 2010E 2011E 2012E 2013E 2014E 2015E CAGR '05-'10E CAGR '10E-'15E
SAN
<$50kDell 9% 10% 5% 17% 21% 29% 30% 31% 32% 33% 33% 49% 11%EMC 12% 20% 16% 17% 15% 13% 17% 18% 19% 20% 22% 20% 20%HP 18% 22% 22% 18% 18% 18% 17% 16% 16% 15% 14% 18% 4%IBM 16% 16% 12% 9% 5% 3% 3% 3% 3% 4% 4% -14% 10%NetApp 0% 0% 5% 4% 3% 5% 7% 9% 10% 12% 14% NM 31%
$50-300kDell 18% 19% 19% 16% 11% 11% 11% 12% 12% 13% 13% -2% 15%EMC 20% 20% 20% 22% 20% 24% 23% 23% 23% 23% 23% 12% 11%HP 26% 20% 17% 17% 16% 13% 13% 13% 13% 12% 12% -5% 9%IBM 12% 15% 14% 13% 17% 15% 15% 15% 15% 15% 15% 14% 10%NetApp 0% 0% 4% 6% 8% 11% 13% 15% 17% 19% 21% NM 26%
>$300kDell 0% 0% 0% 0% 3% 0% 0% 0% 0% 0% 0% NM -2%EMC 43% 45% 43% 42% 40% 47% 46% 45% 44% 43% 42% 5% -1%HP 17% 13% 11% 8% 6% 5% 6% 6% 7% 7% 7% -14% 9%IBM 17% 18% 24% 22% 24% 24% 25% 26% 27% 28% 28% 17% 5%NetApp 0% 0% 0% 0% 0% 0% 0% 0% 0% 0% 0% NM NM
NAS
<$50kDell 10% 6% 6% 5% 4% 4% 4% 4% 4% 4% 4% -6% 9%EMC 12% 9% 10% 14% 19% 22% 24% 26% 28% 30% 32% 26% 17%HP 17% 14% 13% 9% 6% 4% 4% 3% 3% 3% 3% -16% 3%IBM 1% 4% 4% 2% 4% 3% 3% 3% 3% 3% 3% 50% 9%NetApp 29% 39% 30% 20% 17% 26% 24% 23% 23% 23% 23% 9% 7%
$50-300kDell 0% 0% 0% 0% 0% 0% 0% 0% 0% 0% 0% NM NMEMC 13% 13% 10% 7% 20% 29% 30% 31% 32% 33% 34% 41% 28%HP 0% 0% 1% 1% 0% 1% 1% 1% 1% 1% 1% NM 24%IBM 0% 7% 10% 13% 10% 9% 9% 9% 9% 9% 9% 193% 24%NetApp 81% 67% 55% 53% 45% 41% 40% 38% 37% 35% 34% 5% 19%
Dell: Dell sub-$50k share gains should stabilize as EqualLogic matures and the segment gets increasingly targeted by other storage vendors.The company’s changing relationship with EMC has reset share in the $50-300k category and static share is a likely outcome as Dell mixes its portfolio with internal IP. Compellent should help offset some of the declines associated with EMC products. Nevertheless, Dell’s lack of a strong unified offering is a drag in both the SAN and NAS categories.
HP: The acquisition of 3PAR should allow the company to update legacy products and overlay existing partners, as a result, the company is unlikely to gain meaningful share. The lack of a solid NAS/unified offering results in the lack of exposure to key growth segments, similar to Dell.
3 HP: The acquisition of 3PAR should allow the company to update legacy products and overlay existing partners, as a result, the company is unlikely to gain meaningful share. The lack of a solid NAS/unified offering results in the lack of exposure to key growth segments, similar to Dell.
33
1111
11
22
EMC: The company’s refresh of its unified storage offering should allow for continued share gains in NAS and improved performance in the sub-$50k SAN category.
22
22
222
33
33
IBM: IBM’s focus on the high-end could allow for gradual share gains in the high-end SAN (above $300k. Solid offerings in the competitive SAN mid-range are offset by an intensely competitive field and the emergence of unified storage as a driver of growth. The fact that SONAS is still maturing places focus on the NetApp partnership as a source of share in NAS.
4 IBM: IBM’s focus on the high-end could allow for gradual share gains in the high-end SAN (above $300k. Solid offerings in the competitive SAN mid-range are offset by an intensely competitive field and the emergence of unified storage as a driver of growth. The fact that SONAS is still maturing places focus on the NetApp partnership as a source of share in NAS.
44 NetApp: Despite share losses in core NAS, NetApp’s unified offerings allows for share gains in the larger, albeit slower growing SAN category. Despite share losses in NAS, the rapidly growing category supports a strong revenue CAGR for NetApp as SAN share gains are additive.
5 NetApp: Despite share losses in core NAS, NetApp’s unified offerings allows for share gains in the larger, albeit slower growing SAN category. Despite share losses in NAS, the rapidly growing category supports a strong revenue CAGR for NetApp as SAN share gains are additive.
55
444
44
44
55
555
Source: Gartner, Credit Suisse estimates.

16 March 2011
IT Hardware 262
Credit Suisse Enterprise Storage Scorecard Recognizing that market shares within the storage segment evolve gradually, we present herein our way of thinking about how vendor shares are likely to evolve in the storage hardware market. In order to do this, we have developed a scorecard to evaluate the key storage vendors across several metrics. Based on the Credit Suisse IT Survey, Figure 327 highlights the eight most important attributes for a storage hardware vendor. For purposes of our scorecard, we assess the competitiveness of storage vendors along these attributes.
Figure 327: Key Determinants of Success for Storage Vendors Question: What makes a competitive storage vendor? Please rank in order.
0 1 2 3 4 5 6 7 8
Other
Distribution
Sales/Existing Relationship
Ability to provide a completesolution (servers, networking)
Roadmap (historical/futures)
Management/ Software stack
Maintenance/Support
Price/Performance
Source: Credit Suisse IT Survey, February 2011.
Price/Performance Based on the Credit Suisse IT Survey, over 58% of respondents cited price performance as the key driver for selecting a given storage vendor. Based on our analysis, we believe Dell and NetApp are best positioned from a price performance standpoint while Sun/Oracle and IBM are poorly positioned. To evaluate the price/performance of storage systems, we evaluate two metrics: comparative array performance and the cost per TB of storage capacity.

16 March 2011
IT Hardware 263
Array Performance
For array performance, we analyze four different storage industry benchmarks using regression analyses. We regress the storage performance metric across the number of disks a system has and conclude that system performance is generally driven by the number of disks within that system. As seen in Figure 328, the R-squared, when regressing performance (SPC1-IOPs) across the number of disks, is high at 0.82. Similarly, we seen in Figure 329, for NAS (UNIX), regressing throughput (as measured by SPEC) across the number of disks shows a similar relationship with an R-squared of 0.70.
Figure 328: Broad Storage Industry Benchmark Figure 329: NAS Benchmark
y = 0.0043x + 34.776R2 = 0.8222
-
200
400
600
800
1,000
1,200
1,400
1,600
1,800
- 50,000 100,000 150,000 200,000 250,000 300,000 350,000 400,000SPC-1 IOPs
Num
ber o
f dis
ks
y = 0.0037x - 35.688
R2 = 0.7025
-
200
400
600
800
1,000
1,200
1,400
1,600
- 50,000 100,000 150,000 200,000 250,000 300,000 350,000 400,000Throughput
Num
ber o
f dis
ks
Source: www.storageperformance.org, Credit Suisse estimates. Source: www.spec.org, Credit Suisse estimates.
As seen in Figure 330, there are some exceptions to this. For NAS systems operating with InfiniBand and SSDs and accessing Windows files, regressing performance across disks results in an R-squared of just 0.50. However, adjusting the data for InfiniBand and SSDs, results in the R-squared going back up to 0.69 as seen in Figure 331.
Figure 330: NAS Benchmark With InfiniBand, SSDs Figure 331: NAS Benchmark Without InfiniBand, SSDs
y = 0.0016x + 25.525R2 = 0.5069
0
50
100
150
200
250
300
350
0 20,000 40,000 60,000 80,000 100,000 120,000 140,000 160,000Throughput
Num
ber o
f dis
ks
y = 0.0017x + 11.764
R2 = 0.6935
0
50
100
150
200
250
300
350
0 20,000 40,000 60,000 80,000 100,000 120,000 140,000 160,000Throughput
Num
ber o
f dis
ks
Source: www.spec.org, Credit Suisse estimates. Source: www.spec.org, Credit Suisse estimates.
In everyday parlance, what this essentially means is that a storage vendor can improve storage performance or throughput (IOPs) simply by adding more disks. In other words, the level of performance differentiation across vendors is indeed minimal. This in our view, underscores the need for cost per TB of storage and the need for differentiation in the software stack.

16 March 2011
IT Hardware 264
Cost per Unit of Capacity
As discussed earlier, the rapid data growth in unstructured data is shifting the bias toward lower cost storage. As such, vendors offering solutions having a lower cost per unit of storage stand to benefit. Figure 332 highlights the cost per TB of storage capacity and this is typically lowest for NetApp and highest for IBM, with all other vendors falling somewhere in between. We believe NetApp’s greater use of cheaper SATA disks in its arrays enables this benefit. As such, while other vendors can emulate this tactic, we do note this is a positive for the company at least in the near term, as it is already well positioned to benefit from the market’s bias for a lower price/TB. Also, based on the price/TB for other vendors being largely clustered, this highlights the notion that software is an important source of differentiation. That is, the software elements of a solution can drive down storage cost, both through efficient backup and efficient array management, which reduces administrative overhead.
Figure 332: Comparison of Storage Vendors Price per TB
2005 2006 2007 2008 2009 YTD Q3 10CAGR 2005-2009/2007-
2009
Premium / (Discount) to
average
Under $50kFC SANDell - - 4,939 4,740 2,096 1,264 -19% -10%EMC - - 4,297 2,977 2,049 1,475 -17% 5%HP - - 3,722 3,206 1,956 1,694 -15% 20%IBM - - 7,674 6,497 5,398 1,834 -8% 30%NetApp - - 2,180 1,280 876 783 -20% -44%
iSCSI SANDell - - 3,715 2,384 1,541 1,126 -20% -15%EMC - - 3,760 2,910 2,048 1,215 -14% -8%HP - - 3,554 2,645 1,823 1,420 -15% 8%IBM - - 4,175 2,910 2,772 2,115 -10% 60%NetApp - - 2,244 1,282 850 722 -22% -45%
NASDell 6,078 4,177 2,660 1,659 1,426 1,275 -30% -8%EMC 86,714 26,995 12,813 3,414 1,670 1,286 -63% -8%HP 9,799 6,553 4,698 3,494 1,945 1,069 -33% -23%IBM 11,435 4,404 2,712 1,734 2,328 2,616 -33% 88%NetApp 6,608 3,509 2,185 1,287 860 720 -40% -48%
$50k-$300kFC SANDell - - 7,063 5,442 4,183 3,224 -12% 47%EMC - - 5,106 4,009 2,950 2,408 -13% 9%HP - - 4,173 3,525 2,195 1,712 -15% -22%IBM - - 8,887 6,940 3,234 1,984 -22% -10%NetApp - - 3,256 2,304 1,777 1,673 -14% -24%
iSCSI SANDell - - 6,833 5,344 4,181 1,970 -12% -3%EMC - - 4,996 3,753 2,795 2,280 -14% 13%HP - - 4,055 3,376 2,181 1,972 -14% -3%IBM - - 4,482 3,070 2,696 2,387 -12% 18%NetApp - - 2,931 2,085 1,648 1,522 -13% -25%
NASDell NA NA NA NA NA NA NM NMEMC 26,667 21,589 17,560 9,843 4,480 2,900 -29% 23%HP NA NA NA NA NA 1,321 NM NMIBM 28,122 6,360 6,057 3,470 4,227 3,395 -9% 44%NetApp 6,407 4,357 3,326 2,638 1,972 1,813 -12% -23%
NetApp’s use of SATA disk drives (the same used in desktop PCs) enabled the company to offer a lower price per TB relative to peers. We believe this will benefit the company as the rapid growth in unstructured data will favor vendors with lower cost offerings.
Dell’s price per TB is the second lowest after NetApp, with this largely driven by the company’s product positioning in the lower end of the market.
HP – while the company’s price/TB is lower than that of IBM and EMC, we believe the company has historically been handicapped by an uncompetitive portfolio (hardware and software).
11
11
11
1111
11
22
33
22
22
33
33
Source: Gartner, Credit Suisse estimates.
Last, as seen in Figure 333, a ranking of vendors on price performance, based on the results of the Credit Suisse IT Survey shows that Dell, HP, and NetApp lead, while Sun/Oracle, Hitachi, and IBM lag.

16 March 2011
IT Hardware 265
Figure 333: Price Performance—Dell, HP, and NetApp Lead Question: Please rate the following storage vendors by price/performance/reliability/compatibility, using the following scale: 1 = Very poor performance 5 = Excellent performance
2 2.2 2.4 2.6 2.8 3 3.2 3.4 3.6 3.8 4
Sun/Oracle
Hitachi
IBM
EMC
NetApp
HP
Dell
Source: Credit Suisse IT Survey, February 2011.
Maintenance and Support A strong maintenance and support offering is a critical attribute for storage vendors, as seen in Figure 327. Maintenance and support encompasses both the quality of support and how satisfied or confident IT managers are with a given vendor’s support quality and global support footprint, which enables that vendor to provide support to the dispersed locations of multinational companies. While having a global footprint is less important for small businesses, it is important for larger enterprise clients. Generally, vendors with more history in the enterprise segment rank well on quality of support. Based on the results of the Credit Suisse IT Survey, EMC is best positioned to provide maintenance and support, followed by HP and IBM. (See Figure 334.) Conversely, Sun/Oracle, Dell, Hitachi and NetApp score lower on this metric.
Figure 334: Maintenance/Support—EMC, IBM, HP Lead Question: Please rate the following storage vendors by maintenance/support, using the following scale: 1 = Very poor performance 5 = Excellent performance
2 2.2 2.4 2.6 2.8 3 3.2 3.4 3.6 3.8 4
Sun/Oracle
Dell
Hitachi
NetApp
HP
IBM
EMC
Source: Credit Suisse IT Survey, February 2011.

16 March 2011
IT Hardware 266
Software Stack and Management Functionality Software plays a critical role as it manages the accessibility, availability, and management of data stored on arrays and physical disks. The storage software market for the purposes of this discussion excludes the operating system since this is generally included with the core array. Rather, it represents software that enables incremental management functionality for the array, data archiving, replication, and back-up. As noted earlier, while storage hardware is a $21bn market, storage software is a $12bn market. From a vendor standpoint, given the commodity nature of the hardware itself (most arrays now use industry standard components rather than application specific integrated circuits or ASICs), the value provided to customers at the end of day is essentially through software. We believe storage vendors with broad storage software offerings are well positioned to capture incremental storage spending wallet share and extract value by attaching software sales to their hardware footprint. Also, from a financial perspective, given significantly higher incremental margins for software, vendors with meaningful software revenue are better positioned to sustain or expand operating margins.
Figure 335: Overall Storage Software (Distributed) Market Shares by Vendor US$ in millions, unless otherwise stated 2007 2008 2009 EMC 27% 25% 24% Symantec 21% 21% 21% NetApp 12% 12% 12% IBM 8% 9% 10% HP 7% 7% 6% Hitachi Data Systems 4% 4% 4% CA 2% 2% 2% CommVault 2% 2% 2% Oracle/Sun 1% 1% 1% BMC 1% 0% 0% Dell 0% 0% 0% Other vendors 16% 17% 18%
Total 100% 100% 100% Source: Gartner
As seen in Figure 335, of the key vendors, EMC and NetApp have strong storage software market shares that are largely in-line with their overall storage hardware market shares. While system vendors IBM and HP’s storage software share lags their storage hardware share, Dell is conspicuously absent in recent share rankings. Figure 338 details storage software positioning by vendor. IBM has a reasonably strong position in certain segments (particularly back up and recovery, archiving and storage resource management software). Meanwhile, HP has broad-based presence across segments but does not participate meaningfully within any specific segment. This suggests to us that storage software will be a key area for acquisitions by all system vendors, especially HP and Dell, in the coming years. EMC has a strong presence in most storage software segments, but NetApp’s presence is less broad based. The company has a noticeably weak position in back-up and recovery and archiving software. While this is a hole in NetApp’s software offering, the trend toward using replication functionality to augment or replace back-up should provide an offset. (See Figure 336.)

16 March 2011
IT Hardware 267
Figure 336: Replication Software to Augment to Increasingly Augment Backup Question: Does your organization plan to augment or replace some of its back-up activities with replication technologies in the next 12 months?
0% 10% 20% 30% 40% 50% 60% 70% 80% 90% 100%
Replace
Augment
Yes No
Source: Gartner.
The Credit Suisse IT Survey results (as shown in Figure 337) point to a similar perception of storage software vendors. A ranking of vendors on management functionality/software stack, based on our Credit Suisse IT Survey shows that EMC, IBM and NetApp lead, while Dell, Sun/Oracle and HP lag.
Figure 337: Management Functionality/Software—EMC, IBM, and NetApp Lead Question: Please rate the following storage vendors by management functionality/software stack, using the following scale: 1 = Very poor performance 5 = Excellent performance
2 2.2 2.4 2.6 2.8 3 3.2 3.4 3.6 3.8 4
Hitachi
Dell
Sun/Oracle
HP
NetApp
IBM
EMC
Source: Credit Suisse IT Survey, February 2011.

16 March 2011
IT Hardw
are 268
Figure 338: Key Vendors’ Storage Software Positioning by Segment Backup and Recovery Software (Distributed)
2007 2008 2009Symantec 42% 41% 38%IBM 14% 15% 17%EMC 12% 12% 13%CommVault Systems 5% 5% 6%Hewlett-Packard 5% 6% 5%Other Vendors 21% 21% 21%Total Market 2,747 3,148 3,100
Device Resource Management (Distributed)2007 2008 2009
EMC 56% 53% 53%Hitachi Data Systems 19% 21% 22%Hewlett-Packard 9% 10% 9%Brocade 9% 9% 9%NetApp 2% 2% 3%Other Vendors 5% 5% 5%Total Market 1,097 1,242 1,097
Storage Resource Management (Distributed)2007 2008 2009
EMC 73% 66% 61%IBM 11% 12% 15%Hewlett-Packard 5% 8% 7%NetApp 0% 3% 7%Symantec 3% 3% 4%Other vendors 3% 3% 2%Total Market 670 703 695
Data Replication (Distributed)2007 2008 2009
EMC 40% 38% 34%NetApp 25% 26% 30%IBM 6% 7% 8%Hitachi Data Systems 4% 4% 4%Hewlett-Packard 6% 5% 4%Other Vendors 18% 20% 20%Total Market 2,240 2,346 2,137
Core Storage Management (Distributed)2007 2008 2009
Symantec 36% 39% 41%NetApp 37% 35% 33%EMC 12% 11% 11%IBM 6% 6% 7%Hewlett-Packard 2% 1% 1%Other Vendors 7% 7% 7%Total Market 1,606 1,673 1,494
HSM and Archive Software (Distributed)2007 2008 2009
Symantec 27% 24% 22%Autonomy 5% 19% 21%IBM 16% 15% 12%EMC 14% 9% 8%Hewlett-Packard 4% 3% 2%Other Vendors 34% 31% 36%Total Market 607 834 914
EMC’s leading storage hardware market share is also reflected in the company’s overall software share (24% in 2009 per Gartner). Here we would highlight the company’s dominant share in Device Resource Management, Storage Resource Management and Data Replication Software. While the company’s share in the fast growing HSM archive software market was only 8% in 2009, the company’s Data Domain acquisition in 2009 helps the company’s offering in this important area.
NetApp ‘s overall software market share (12% in 2009) leads the company’s overall storage hardware market share owing to the company’s strong positioning in the Data Replication, and Core Storage Management segments. Noticeably, the company’s positioning in the Backup and Recovery Software and HSM/Archiving Software segment is weak, suggesting that this may be an area where the company may pursue acquisitions.
IBM participates in almost all storage software segments with a reasonable position in the Backup and Recovery Software. HSM and Storage Resource Management Software areas. Similar to HP, we expect the company will look to expand its storage software footprint over time, largely through acquisition.
HP while having a presence in each of the software segments, does not participate meaningfully in any. This is in part likely due to the company’s weak overall storage positioning. As such, we believe storage software will remain an area where HP is likely to aggressively bolster its offerings through acquisition.
Dell’s storage software position is weak as the company is conspicuously absent from any of the segments shown above. The company’s recent Compellent acquisition does enable Dell to offer compelling in-array software and Ocarina contributes as well but overall, the company storage software footprint remains relatively limited.
1
1
5
4
3
2
1
1
2 23
4 4 4
Backup and Recovery Software (Distributed)2007 2008 2009
Symantec 42% 41% 38%IBM 14% 15% 17%EMC 12% 12% 13%CommVault Systems 5% 5% 6%Hewlett-Packard 5% 6% 5%Other Vendors 21% 21% 21%Total Market 2,747 3,148 3,100
Device Resource Management (Distributed)2007 2008 2009
EMC 56% 53% 53%Hitachi Data Systems 19% 21% 22%Hewlett-Packard 9% 10% 9%Brocade 9% 9% 9%NetApp 2% 2% 3%Other Vendors 5% 5% 5%Total Market 1,097 1,242 1,097
Storage Resource Management (Distributed)2007 2008 2009
EMC 73% 66% 61%IBM 11% 12% 15%Hewlett-Packard 5% 8% 7%NetApp 0% 3% 7%Symantec 3% 3% 4%Other vendors 3% 3% 2%Total Market 670 703 695
Data Replication (Distributed)2007 2008 2009
EMC 40% 38% 34%NetApp 25% 26% 30%IBM 6% 7% 8%Hitachi Data Systems 4% 4% 4%Hewlett-Packard 6% 5% 4%Other Vendors 18% 20% 20%Total Market 2,240 2,346 2,137
Core Storage Management (Distributed)2007 2008 2009
Symantec 36% 39% 41%NetApp 37% 35% 33%EMC 12% 11% 11%IBM 6% 6% 7%Hewlett-Packard 2% 1% 1%Other Vendors 7% 7% 7%Total Market 1,606 1,673 1,494
HSM and Archive Software (Distributed)2007 2008 2009
Symantec 27% 24% 22%Autonomy 5% 19% 21%IBM 16% 15% 12%EMC 14% 9% 8%Hewlett-Packard 4% 3% 2%Other Vendors 34% 31% 36%Total Market 607 834 914
EMC’s leading storage hardware market share is also reflected in the company’s overall software share (24% in 2009 per Gartner). Here we would highlight the company’s dominant share in Device Resource Management, Storage Resource Management and Data Replication Software. While the company’s share in the fast growing HSM archive software market was only 8% in 2009, the company’s Data Domain acquisition in 2009 helps the company’s offering in this important area.
NetApp ‘s overall software market share (12% in 2009) leads the company’s overall storage hardware market share owing to the company’s strong positioning in the Data Replication, and Core Storage Management segments. Noticeably, the company’s positioning in the Backup and Recovery Software and HSM/Archiving Software segment is weak, suggesting that this may be an area where the company may pursue acquisitions.
IBM participates in almost all storage software segments with a reasonable position in the Backup and Recovery Software. HSM and Storage Resource Management Software areas. Similar to HP, we expect the company will look to expand its storage software footprint over time, largely through acquisition.
HP while having a presence in each of the software segments, does not participate meaningfully in any. This is in part likely due to the company’s weak overall storage positioning. As such, we believe storage software will remain an area where HP is likely to aggressively bolster its offerings through acquisition.
Dell’s storage software position is weak as the company is conspicuously absent from any of the segments shown above. The company’s recent Compellent acquisition does enable Dell to offer compelling in-array software and Ocarina contributes as well but overall, the company storage software footprint remains relatively limited.
11
11
55
44
33
22
11
11
22 2233
44 44 44
Source: Gartner, Credit Suisse estimates.

16 March 2011
IT Hardware 269
Product Portfolio Positioning Current Positioning
To evaluate each vendor’s product positioning, we examine the technology segment and price band in which the vendor is currently positioned. Here, as seen in Figure 339, NetApp, appears to be best positioned with 73% of revenue being derived from NAS and iSCSI SAN segments, which we expect will grow at a 19% CAGR between 2010-2015E. Conversely, we note that for IBM and HP, only 13% and 18% of storage revenue is derived from these fast-growing markets with both vendors having meaningful exposure to FC SAN (51%/53%, respectively) and DAS/Other (13%/28% exposure). We would also note that 46% of Dell’s storage revenue is derived from the iSCSI SAN market.
Figure 339: Storage Vendor Revenue Mix by Technology Dell EMC HP IBM NetApp Other CAGR (‘10-‘15) SAN 73% 72% 68% 78% 39% 60% 8% Fibre Channel 27% 60% 53% 51% 27% 52% 4% iSCSI 46% 3% 14% 4% 12% 3% 19% Other 0% 10% 1% 23% 0% 5% 9% NAS 3% 18% 4% 9% 61% 18% 19% DAS 5% 8% 10% 10% 0% 18% -11% Other 19% 2% 18% 4% 0% 4% -2.3%
Total 100% 100% 100% 100% 100% 100% 8% Source: Gartner, Company data, Credit Suisse estimates.
HP and Dell’s exposure to legacy technologies will continue to be a drag on overall storage hardware share gains while NetApp’s lack of any legacy exposure bodes well for continued growth.
From a price band standpoint, Figure 340 shows the main product offerings from each of the key vendors by price band. While EMC, HP, and IBM have offerings in all price bands, the revenue exposure for EMC and IBM are concentrated in the high end with revenue share being 41%/42%, respectively. While HP’s high-end portfolio mainly consists of Hitachi OEM systems, the recent addition of 3PAR fits into this segment as well. NetApp is primarily positioned in the midrange with 73% exposure but Dell is geared more on the low end with 68% revenue exposure. As such, both these vendors are well positioned to benefit from strong hardware growth in these segments relative to the high end of the market.

16 March 2011
IT Hardw
are 270
Figure 340: Storage Vendor Revenue Mix by Technology by Price Point
Vendor mix by product YTD 2010 (through Q310)Less than $50k Dell EMC HP IBM NetApp OtherSAN 41% 7% 24% 4% 8% 16%
Fibre Channel 2% 6% 16% 2% 4% 14%iSCSI 38% 1% 8% 2% 4% 2%Other 0% 0% 0% 0% 0% 0%
NAS 3% 6% 3% 2% 18% 10%DAS 5% 2% 9% 4% 0% 10%Other 19% 0% 18% 4% 0% 4%Total 68% 15% 54% 13% 27% 40%
$50k-$300k Dell EMC HP IBM NetApp OtherSAN 32% 25% 34% 34% 31% 26%
Fibre Channel 24% 23% 27% 31% 23% 25%iSCSI 8% 1% 7% 2% 8% 1%Other 0% 1% 0% 1% 0% 0%
NAS 0% 12% 1% 7% 43% 7%DAS 0% 4% 0% 6% 0% 6%Other 0% 2% 0% 0% 0% 0%Total 32% 43% 35% 47% 73% 40%
$300k and above Dell EMC HP IBM NetApp OtherSAN 1% 40% 11% 40% 0% 17%
Fibre Channel 1% 31% 10% 18% 0% 13%iSCSI 0% 0% 0% 0% 0% 0%Other 0% 9% 1% 22% 0% 4%
NAS 0% 0% 0% 0% 0% 0%DAS 0% 2% 0% 0% 0% 3%Other 0% 0% 0% 0% 0% 0%Total 1% 42% 11% 41% 0% 20%
1
Vendor revenue mix by region for YTD 2010 (through Q310) Vendor Revenue Mix Dell EMC HP IBM NetApp OtherUS/Canada 54% 55% 32% 37% 54% 40%EMEA 28% 27% 44% 34% 34% 24%Japan 3% 3% 6% 6% 3% 22%LatAm 4% 2% 4% 5% 1% 2%APAC 12% 13% 14% 19% 8% 13%Total 100% 100% 100% 100% 100% 100%
Dell – revenue mix is focused on low-end (sub-$50k price band) driven by its EqualLogic offering. The company’s storage revenue is primarily (82%) derived from NA and EMEA.
EMC – revenue mix is focused on the mid-range (43%) and high-end (42%) driven by strong FC SAN offerings. The company’s storage revenue is also primarily (82%) derived from NA and EMEA.
HP – revenue mix is focused on the low-end (54%) given challenges in getting high-end/mid-range traction (one of the reasons for the 3PAR acquisition). While 76% of revenue is derived from NA and EMEA, the company has 14% exposure to APAC owing to a strong distribution presence in the region.
IBM – revenue mix is focused on the mid-range (47%) and high-end (41%) given the company is yet to make meaningful in-roads in the SAN or iSCSI markets. Similar to HP, while 71% of revenue is derived from NA and EMEA, the company has more global exposure with 19% of revenue coming from APAC.
NetApp – revenue mix is focused on the mid-range (73%) with a successful unified offering. The company’s storage revenue is also primarily (88%) derived from NA and EMEA.
1
52
3
4
1 2
3
5
4
2
3
4
5
Vendor mix by product YTD 2010 (through Q310)Less than $50k Dell EMC HP IBM NetApp OtherSAN 41% 7% 24% 4% 8% 16%
Fibre Channel 2% 6% 16% 2% 4% 14%iSCSI 38% 1% 8% 2% 4% 2%Other 0% 0% 0% 0% 0% 0%
NAS 3% 6% 3% 2% 18% 10%DAS 5% 2% 9% 4% 0% 10%Other 19% 0% 18% 4% 0% 4%Total 68% 15% 54% 13% 27% 40%
$50k-$300k Dell EMC HP IBM NetApp OtherSAN 32% 25% 34% 34% 31% 26%
Fibre Channel 24% 23% 27% 31% 23% 25%iSCSI 8% 1% 7% 2% 8% 1%Other 0% 1% 0% 1% 0% 0%
NAS 0% 12% 1% 7% 43% 7%DAS 0% 4% 0% 6% 0% 6%Other 0% 2% 0% 0% 0% 0%Total 32% 43% 35% 47% 73% 40%
$300k and above Dell EMC HP IBM NetApp OtherSAN 1% 40% 11% 40% 0% 17%
Fibre Channel 1% 31% 10% 18% 0% 13%iSCSI 0% 0% 0% 0% 0% 0%Other 0% 9% 1% 22% 0% 4%
NAS 0% 0% 0% 0% 0% 0%DAS 0% 2% 0% 0% 0% 3%Other 0% 0% 0% 0% 0% 0%Total 1% 42% 11% 41% 0% 20%
11
Vendor revenue mix by region for YTD 2010 (through Q310) Vendor Revenue Mix Dell EMC HP IBM NetApp OtherUS/Canada 54% 55% 32% 37% 54% 40%EMEA 28% 27% 44% 34% 34% 24%Japan 3% 3% 6% 6% 3% 22%LatAm 4% 2% 4% 5% 1% 2%APAC 12% 13% 14% 19% 8% 13%Total 100% 100% 100% 100% 100% 100%
Dell – revenue mix is focused on low-end (sub-$50k price band) driven by its EqualLogic offering. The company’s storage revenue is primarily (82%) derived from NA and EMEA.
EMC – revenue mix is focused on the mid-range (43%) and high-end (42%) driven by strong FC SAN offerings. The company’s storage revenue is also primarily (82%) derived from NA and EMEA.
HP – revenue mix is focused on the low-end (54%) given challenges in getting high-end/mid-range traction (one of the reasons for the 3PAR acquisition). While 76% of revenue is derived from NA and EMEA, the company has 14% exposure to APAC owing to a strong distribution presence in the region.
IBM – revenue mix is focused on the mid-range (47%) and high-end (41%) given the company is yet to make meaningful in-roads in the SAN or iSCSI markets. Similar to HP, while 71% of revenue is derived from NA and EMEA, the company has more global exposure with 19% of revenue coming from APAC.
NetApp – revenue mix is focused on the mid-range (73%) with a successful unified offering. The company’s storage revenue is also primarily (88%) derived from NA and EMEA.
11
5522
33
44
11 22
33
55
44
22
33
44
55
Source: Gartner, Credit Suisse estimates.

16 March 2011
IT Hardware 271
Figure 341: Storage Vendors’ Legacy Revenue Exposure—NetApp Is Best Positioned
28.1%23.9% 22.5%
13.5%9.8%
0.0%0%
10%
20%
30%
40%
50%
60%
70%
80%
90%
100%
HP Dell Other IBM EMC NetApp
Perc
ent o
f ven
dor Y
TD 2
010
lega
cy re
venu
e (D
AS
+ O
ther
), %
Source: Gartner, Credit Suisse estimates.
Last, based on the results of the Credit Suisse IT Survey, on product roadmap, EMC, IBM, and NetApp lead, while Dell and Sun/Oracle lag. (See Figure 342.)
Figure 342: Product Roadmap—EMC, IBM, and NetApp Lead Question: Please rate the following storage vendors by the quality of their roadmap, using the following scale: 1 = Very poor performance 5 = Excellent performance
2 2.2 2.4 2.6 2.8 3 3.2 3.4 3.6 3.8 4
Dell
Sun/Oracle
Hitachi
HP
NetApp
IBM
EMC
Source: Credit Suisse IT Survey, February 2011.

16 March 2011
IT Hardw
are 272
Figure 343: Snapshot of Vendor Product Offerings by Price Band and Technology
Low-End (less than $50k)
Mid-Range ($50-$300k)
High-End ($300k+)
EqualLogicCLARiiON/EMC
Compellent
CLARiiONSymmetrix (V-Max)
Exanet
Celerra
EVALeftHandIBRIX
3PAR
DS-series
DS-series DS-seriesXIV
SONASN-series (NetApp)
XP (Hitachi/HDS)
FAS FAS
Sun StorageSun Storage
ExadataSun Storage (ZFS)
VNX/VNXeVNX
Focused on the low-to-mid end with EqualLogic. Relationship with EMC to resell CLARiiON in the mid-range is in question.
Arguably now has the most complete portfolio with low/ mid/ high end offerings. The recently introduced VNX (unified storage) systems augment an improving NAS position.
Weak NAS offering. Plans to make 3PAR its high/mid-range offering over time. Partnered with HDS on the high end historically but this is likely to fade with the acquisition of 3PAR.
NetApp reseller arrangement in question as IBM tries to get its own NAS offering (SONAS) into the market. Looking to expand mid/high end offering with XIV.
Focus on the low and mid-range with it’s NAS/ unified offering.
Exadata is focused on the high end of the market as an integrated database server/storage appliance, while legacy Sun storage systems address the low and mid-range.
Notes: (1) SAN in black, NAS in blue italics; (2) EMC and HP are shifting Symmetrix and 3PAR down market.
Source: Credit Suisse.

16 March 2011
IT Hardware 273
Distribution Storage systems, depending on their cost and the extent to which they need to be explained, are sold either by a vendor’s direct sales force or through reseller channels. One of the key success factors is the storage segment is a company’s breadth of distribution. Consequently, we expect that vendors that have an extensive reach and well executed distribution strategy will reap multiple benefits including, stronger sales growth over time. We evaluate a vendor’s distribution for storage by looking at the mix of direct versus indirect distribution. As seen in Figure 344, NetApp and HP are more focused on the indirect channel while Dell, EMC, and IBM are focused on the direct channel. While this is mostly consistent with each vendor’s product strategy, it also highlights the need for a vendor like EMC to quickly build out indirect distribution in order to drive sales of its recently launched unified products (VNX family).
Figure 344: Direct versus Indirect Mix for Each Storage Vendor 2005 2006 2007 2008 2009 2010 YTD
DellDirect 100% 99% 93% 88% 85% 78%Indirect 0% 1% 7% 12% 15% 22%
EMCDirect 62% 63% 57% 64% 63% 62%Indirect 38% 37% 43% 36% 37% 38%
HPDirect 33% 33% 33% 36% 36% 27%Indirect 67% 67% 67% 64% 64% 73%
IBMDirect 46% 45% 46% 47% 43% 43%Indirect 54% 55% 54% 53% 57% 57%
NetAppDirect 50% 45% 39% 34% 29% 29%Indirect 50% 55% 61% 66% 71% 71%
OtherDirect 52% 52% 52% 53% 50% 46%Indirect 48% 48% 48% 47% 50% 54%
TotalDirect 54% 54% 53% 55% 52% 49%Indirect 46% 46% 47% 45% 48% 51%
Dell – surprisingly, in spite of a portfolio geared toward the low-end, Dells distribution has been mainly direct although this has been changing over the last few years.
EMC – while the has historically been focused on the direct channel (for high-end systems), we believe the recent unified product (VNX) launch suggests an increasing focus on the indirect reseller channel going forward.
HPs – strong indirect presence has likely aided the company’s storage hardware position, despite a sub-optimal product portfolio. This underscores the importance of distribution in our view.
IBM – direct distribution focus is based on the company’s product portfolio and focus on bundling solutions.
NetApp – geared toward indirect distribution. We believe this distribution strategy, together with a portfolio geared to the mid-range of the market (which lends itself to this distribution model) positions the company well for sales growth in excess of the broader market.
11
11
22
33
44
22
33
44
55
55
Source: Gartner, Credit Suisse estimates.
The results of the Credit Suisse IT Survey show that IBM, EMC, and HP lead on the distribution metric while NetApp, Hitachi, and Sun/Oracle lag (see Figure 345).

16 March 2011
IT Hardware 274
Figure 345: Distribution—IBM, EMC, and HP Lead Question: Please rate the following storage vendors by the quality of their distribution, using the following scale: 1 = Very poor performance 5 = Excellent performance
2 2.2 2.4 2.6 2.8 3 3.2 3.4 3.6 3.8 4
Hitachi
NetApp
Sun/Oracle
Dell
HP
EMC
IBM
Source: Credit Suisse IT Survey, February 2011.
Sales/Existing Relationships With this metric, we ascertain which vendors have the best sales relationships into accounts. Similar to other scorecard metrics, we asked respondents of the Credit Suisse IT survey to rank the importance of this metric and rank the vendors. As seen in Figure 346, not surprisingly, IBM, HP, and EMC lead the pack, while NetApp, with its focus on indirect distribution lags.
Figure 346: Sales Relationships—IBM, HP, and EMC LeadQuestion: Please rate the following storage vendors by sales and existing relationship, using the following scale: 1 = Very poor performance 5 = Excellent performance
Figure 347: Ability to Bundle—IBM, HP, Sun/Oracle Lead Question: Please rate the following storage vendors by their ability to provide a complete hardware solution, using the following scale: 1 = Very poor performance 5 = Excellent performance
2 2.2 2.4 2.6 2.8 3 3.2 3.4 3.6 3.8 4
Hitachi
NetApp
Dell
Sun/Oracle
EMC
HP
IBM
2 2.2 2.4 2.6 2.8 3 3.2 3.4 3.6 3.8 4
Hitachi
NetApp
EMC
Dell
Sun/Oracle
HP
IBM
Source: Credit Suisse IT Survey, February 2011. Source: Credit Suisse IT Survey, February 2011.
Ability to Bundle, Provide Complete Solutions While the ability to bundle is probably less important for storage versus other types of IT hardware, i.e., servers, it is nonetheless an attribute that certain enterprise customers consider important in their purchasing decisions. Indeed, if converged infrastructure emerges as a more powerful trend over time, this metric could gain in importance. For now, however, it remains a lower order attribute. Bundling can take two forms: it can include products bundled by a single vendor (such as HP servers and storage or Oracle’s Exadata and Exalogic systems) or best-of-breed products bundled through a partnership initiative between vendors such as VCE (EMC storage, servers and networking from Cisco and

16 March 2011
IT Hardware 275
virtualization software from VMware) or FlexPod (NetApp storage with servers and networking from Cisco and virtualization software from VMware). To evaluate vendors on this metric, we in part turn to the results from the Credit Suisse IT Survey. Unsurprisingly, IBM and HP are seen as being advantaged. EMC ranks third on this metric, likely owing to early traction that the company is seeing with its VCE/Acadia initiative. Indeed, at its recent investor event in February 2011, EMC management noted a $1bn annual sales run rate for VCE.
What About Exadata? As noted by Credit Suisse Software Analyst Phil Winslow (noted in the reports Dr. Exalove, Part I: Or How I Learned to Stop Worrying (about Sun) and Love Exadata, dated 12 October 2010 and Dr. Exalove, Part II: Or How I Learned to Stop Worrying (about Sun) and Love Exalogic Too, dated November 23, 2010), due to Oracle’s strength in both database and middleware software and, a growing market share in enterprise applications, the Credit Suisse Software Team believes that Oracle continues to build a robust and growing pipeline for the Oracle Exadata Database Machine and that Oracle’s appliance strategy—from Exadata to Exalogic—positions Oracle to be a disruptive force in the server, networking, and storage hardware markets. As a result of Oracle’s strength in the database layer, the Credit Suisse Software Team believes that Oracle is uniquely positioned to increase server performance and lower storage hardware costs through innovation in the software stack – this will put pressure on competing hardware vendors.
Oracle’s Exadata product is often thought of as the Oracle Sun Database Machine, as it combines Sun database and storage servers, storage disks, and Oracle database software into an integrated system that is optimized for running Oracle’s market-leading database software. High-performance technologies like SSDs, Flash Cache, and InfiniBand are leveraged in the system for high-performance I/O and data processing speeds. Further, Exadata leverages advanced compression technology for reducing data footprint and employs management software built into the storage servers for optimizing I/O transfer/efficiency and increased performance. Theoretically, these advantages make Exadata well suited for OLTP applications and Data Warehousing, and especially where Oracle database software is the preferred solution.
There is significant awareness of the Exadata solution, as demonstrated by nearly 33% of survey respondents having already evaluated the product (Figure 348), but the majority of respondents on average do not intend to purchase the product in the near term (Figure 349). Oracle clearly targets Exadata at the company's database software installed base. Therefore, because the results detailed in Figure 348 include both customers and non-customers of the Oracle Database, they likely understate the potential demand within the Oracle Database installed base for Exadata. While the appliance is on the high end in terms of price, it is important to note that it does include a bundle of software, storage, and servers. Oracle, however, touts the Exadata architecture as reducing total cost of ownership, and has publicly referred to it as a cloud-in-a-box.

16 March 2011
IT Hardware 276
Figure 348: % of Respondents Who Have Evaluated Exadata Question: Have you evaluated Oracle’s Exadata appliance?
Figure 349: Likelihood of Purchasing Exadata Question: How likely are you to purchase Oracle's Exadata appliance in the future (1=unlikely, 10= very likely)?
Yes38%
No62%
0.00% 5.00% 10.00% 15.00% 20.00% 25.00% 30.00%
10
9
8
7
6
5
4
3
2
1
% of respondents
Source: Credit Suisse IT Survey, February 2011. Source: Credit Suisse IT Survey, February 2011.
Snapshot of Key Storage Vendor Market Shares In the following section, we examine current vendor market shares by technology, geography and price band, given the different market growth dynamics discussed previously. As such, we examine vendor market share across multiple dimensions. Based on Figure 350, which details storage market share for each vendor by technology, price point and geography, we would highlight the following.
■ EMC’s leading 26% share is driven in large part by its FC SAN solution, particularly in the high-end (53% share, >$300k price band). From a geo perspective, EMC’s high-end share is concentrated in North America (60% share), Asia Pacific (52% share) and EMEA (47% share).
■ IBM’s 13% market share is concentrated in SAN at the high end (>$300k price band) of the market (24% share). From a geographic perspective, IBM’s high-end share (22%) is concentrated in EMEA (27% share) and Latin America (37% share).
■ HP’s 11% market share is concentrated in SAN and DAS at the low-end (sub-$50k price band) of the market (18% share and 19% share respectively). From a geographic perspective, HP’s low-end share is concentrated in EMEA (26% share) and Latin America (24% share).
■ Dell’s 10% share is largely driven by success of its iSCSI SAN solution, particularly in the low end (61% share, sub-$50k price band). From a geographic perspective, Dell’s low-end share is concentrated in North America (25% share) and Latin America (24% share) in the sub-$50k price band.
■ NetApp’s 10% market share has been driven by the success of its FAS solutions, particularly in the midrange (18% share, $50-$300k price band). From a geographic perspective, NetApp’s midrange share is concentrated in North America and EMEA, with the vendor having 20% share in each region as seen in Figure 350.

16 March 2011
IT Hardw
are 277
Figure 350: Snapshot of Key Storage Vendor Market Shares by Technology, Price Point, and Geography
Vendor share by region for YTD 2010 (through Q310)Less than $50k Dell EMC HP IBM NetApp Other CAGR 2010-15EUS/Canada 25% 14% 14% 4% 10% 33% 1%EMEA 18% 11% 26% 6% 9% 30% 8%Japan 8% 3% 15% 7% 5% 62% -5%LatAm 24% 10% 24% 6% 9% 27% 12%APAC 17% 14% 16% 6% 5% 42% 7%Total 21% 12% 18% 5% 8% 36% 5%
$50k-$300k Dell EMC HP IBM NetApp Other CAGR 2010-15EUS/Canada 8% 31% 6% 10% 20% 25% 17%EMEA 7% 22% 14% 15% 20% 22% 11%Japan 1% 10% 6% 7% 5% 71% 3%LatAm 12% 25% 15% 25% 8% 16% 15%APAC 7% 26% 11% 24% 10% 21% 4%Total 7% 26% 9% 14% 18% 26% 13%
$300k and above Dell EMC HP IBM NetApp Other CAGR 2010-15EUS/Canada 0% 60% 4% 20% 0% 16% 5%EMEA 0% 47% 8% 27% 0% 17% -3%Japan 0% 12% 3% 12% 0% 73% -5%LatAm 8% 31% 8% 37% 0% 15% 16%APAC 0% 52% 5% 26% 0% 17% -4%Total 0% 47% 5% 22% 0% 25% 2%
Vendor share by product YTD 2010 (through Q310)Less than $50k Dell EMC HP IBM NetApp Other CAGR 2010-15ESAN 28% 13% 18% 3% 6% 32% 8%
Fibre Channel 3% 19% 21% 3% 5% 49% -5%iSCSI 61% 5% 14% 4% 7% 9% 18%Other 0% 0% 100% 0% 0% 0% 0%
NAS 4% 22% 4% 3% 26% 41% 9%DAS 9% 9% 19% 9% 0% 54% -7%Other 33% 1% 36% 8% 0% 22% -1%Total 21% 12% 18% 5% 8% 36% 5%
$50k-$300k Dell EMC HP IBM NetApp Other CAGR 2010-15ESAN 11% 23% 13% 15% 11% 27% 11%
Fibre Channel 10% 24% 12% 16% 10% 29% 10%iSCSI 24% 11% 23% 7% 25% 10% 20%Other 0% 63% 7% 24% 0% 6% -4%
NAS 0% 29% 1% 9% 41% 20% 24%DAS 0% 29% 1% 22% 0% 48% -15%Other 0% 88% 0% 1% 0% 11% -28%Total 7% 26% 9% 14% 18% 26% 13%
$300k and above Dell EMC HP IBM NetApp Other CAGR 2010-15ESAN 0% 48% 5% 24% 0% 23% 2%
Fibre Channel 0% 53% 7% 15% 0% 24% -2%iSCSI 38% 0% 0% 21% 0% 41% 0%Other 0% 34% 2% 44% 0% 20% 10%
NAS 0% 0% 0% 100% 0% 0% 0%DAS 0% 42% 2% 2% 0% 55% -26%Other NM NM NM NM NM NM 0%Total 0% 47% 5% 22% 0% 25% 2%
Dell – successful with its EqualLogic iSCSI SAN solution, particularly in the low-end (61% share, sub-$50k price band). From a geo perspective, Dell’s low-end share is concentrated in NA (25% share) and LA (24% share) in the sub-$50k price band.
EMC – successful with its FC SAN solution, particularly in the high-end (53% share, >$300k price band). From a geo perspective, EMC’s high-end share is concentrated in NA (60% share), AP (52% share) and EMEA (47% share).
HP – market share is concentrated in SAN and DAS at the low-end (sub-$50k price band) of the market (18% share and 19% share respectively). From a geo perspective, HP’s low-end share is concentrated in EMEA (26% share) and LA (24% share).
IBM – market share is concentrated in SAN at the high-end (>$300k price band) of the market (24% share). From a geo perspective, IBM’s high-end share (22%) is concentrated in EMEA (27% share) and LA (37% share).
NetApp – successful with its FAS solutions, particularly in the mid-range (18% share, $50-$300k price band). From a geo perspective, NetApp’s mid-range share is concentrated in NA and EMEA (20% share in each region).
1
1
4
5
1
1
2
2
2
2
3
3
3
3
3
3
4
4
4
4
5
5
5
1
2
3
4
5
Vendor share by region for YTD 2010 (through Q310)Less than $50k Dell EMC HP IBM NetApp Other CAGR 2010-15EUS/Canada 25% 14% 14% 4% 10% 33% 1%EMEA 18% 11% 26% 6% 9% 30% 8%Japan 8% 3% 15% 7% 5% 62% -5%LatAm 24% 10% 24% 6% 9% 27% 12%APAC 17% 14% 16% 6% 5% 42% 7%Total 21% 12% 18% 5% 8% 36% 5%
$50k-$300k Dell EMC HP IBM NetApp Other CAGR 2010-15EUS/Canada 8% 31% 6% 10% 20% 25% 17%EMEA 7% 22% 14% 15% 20% 22% 11%Japan 1% 10% 6% 7% 5% 71% 3%LatAm 12% 25% 15% 25% 8% 16% 15%APAC 7% 26% 11% 24% 10% 21% 4%Total 7% 26% 9% 14% 18% 26% 13%
$300k and above Dell EMC HP IBM NetApp Other CAGR 2010-15EUS/Canada 0% 60% 4% 20% 0% 16% 5%EMEA 0% 47% 8% 27% 0% 17% -3%Japan 0% 12% 3% 12% 0% 73% -5%LatAm 8% 31% 8% 37% 0% 15% 16%APAC 0% 52% 5% 26% 0% 17% -4%Total 0% 47% 5% 22% 0% 25% 2%
Vendor share by product YTD 2010 (through Q310)Less than $50k Dell EMC HP IBM NetApp Other CAGR 2010-15ESAN 28% 13% 18% 3% 6% 32% 8%
Fibre Channel 3% 19% 21% 3% 5% 49% -5%iSCSI 61% 5% 14% 4% 7% 9% 18%Other 0% 0% 100% 0% 0% 0% 0%
NAS 4% 22% 4% 3% 26% 41% 9%DAS 9% 9% 19% 9% 0% 54% -7%Other 33% 1% 36% 8% 0% 22% -1%Total 21% 12% 18% 5% 8% 36% 5%
$50k-$300k Dell EMC HP IBM NetApp Other CAGR 2010-15ESAN 11% 23% 13% 15% 11% 27% 11%
Fibre Channel 10% 24% 12% 16% 10% 29% 10%iSCSI 24% 11% 23% 7% 25% 10% 20%Other 0% 63% 7% 24% 0% 6% -4%
NAS 0% 29% 1% 9% 41% 20% 24%DAS 0% 29% 1% 22% 0% 48% -15%Other 0% 88% 0% 1% 0% 11% -28%Total 7% 26% 9% 14% 18% 26% 13%
$300k and above Dell EMC HP IBM NetApp Other CAGR 2010-15ESAN 0% 48% 5% 24% 0% 23% 2%
Fibre Channel 0% 53% 7% 15% 0% 24% -2%iSCSI 38% 0% 0% 21% 0% 41% 0%Other 0% 34% 2% 44% 0% 20% 10%
NAS 0% 0% 0% 100% 0% 0% 0%DAS 0% 42% 2% 2% 0% 55% -26%Other NM NM NM NM NM NM 0%Total 0% 47% 5% 22% 0% 25% 2%
Dell – successful with its EqualLogic iSCSI SAN solution, particularly in the low-end (61% share, sub-$50k price band). From a geo perspective, Dell’s low-end share is concentrated in NA (25% share) and LA (24% share) in the sub-$50k price band.
EMC – successful with its FC SAN solution, particularly in the high-end (53% share, >$300k price band). From a geo perspective, EMC’s high-end share is concentrated in NA (60% share), AP (52% share) and EMEA (47% share).
HP – market share is concentrated in SAN and DAS at the low-end (sub-$50k price band) of the market (18% share and 19% share respectively). From a geo perspective, HP’s low-end share is concentrated in EMEA (26% share) and LA (24% share).
IBM – market share is concentrated in SAN at the high-end (>$300k price band) of the market (24% share). From a geo perspective, IBM’s high-end share (22%) is concentrated in EMEA (27% share) and LA (37% share).
NetApp – successful with its FAS solutions, particularly in the mid-range (18% share, $50-$300k price band). From a geo perspective, NetApp’s mid-range share is concentrated in NA and EMEA (20% share in each region).
111
111
444
555
111
111
222
222
22
222
333
333
333
333
333
333
44
44
444
44
555
555
555
11
22
33
44
55
Source: Gartner, Credit Suisse estimates.

16 March 2011
IT Hardware 278
Market Share by Technology The key storage vendors are leveraged differently to each subsegment of the storage hardware market. EMC leads in SAN with a 29% share, followed by IBM with 16% share. Despite having only a 10% overall share in storage hardware, NetApp dominates the NAS market with 35% share compared with EMC’s 26% share. In the legacy DAS segment, vendors with meaningful exposure include EMC with 19% share and IBM with 13% share.
SAN—Market Share Detail by Segment
Within the SAN market, given our outlook for disparate growth within the subsegments of SAN, we highlight market shares for fibre channel and iSCSI, the two main subsegments of SAN which have very different market growth dynamics. (See Figure 351.) EMC holds a leading 32% share of fibre channel SAN (2010E) followed by IBM (13%) and HP (12%).
Figure 351: FC SAN Market Share by Vendor (2010E) Figure 352: iSCSI SAN Market Share by Vendor (2010E)
HP12%
IBM13%
NetApp6%
Dell5%
Other 31%
EMC 32%
Dell51%
HP16%
IBM5%
Other 10%
EMC 7%
NetApp11%
Source: Gartner, Credit Suisse estimates. Source: Gartner, Credit Suisse estimates.
Within the iSCSI segment, Dell leads with 51% share (2010E), followed by HP (16%) and NetApp (11%). (See Figure 352.) Here we would note that although NetApp is shown as having 11% market share of this segment, NetApp does not offer any standalone iSCSI SAN products. Rather, their unified FAS family of products support both NAS and SAN (FC and iSCSI) protocols.
NAS—Pure Play Vendors Have a Lead
In the NAS segment of the storage market, NetApp leads with 35% share (2010E), followed by EMC (26%). System vendor’s market share in the segment are as follows: IBM (6%), HP (2%), Dell (2%). This reinforces the idea that generally, NAS represents a hole in storage portfolios of the system vendors, despite their recent efforts to reinforce their product portfolios. Figure 354 shows vendor share for the networked storage market as a whole. As discussed, we believe it increasingly makes sense to look at networked storage in aggregate (versus looking at SAN and NAS separately), given the secular trend toward networked storage and unified storage systems (that offer both NAS/SAN protocols), which makes it less clear as to which segment revenues are captured in or allocated to by firms like Gartner and IDC. As seen in Figure 354, EMC and IBM have leading networked storage share of 28% and 14%, respectively, followed NetApp and HP.

16 March 2011
IT Hardware 279
Figure 353: NAS Market Share by Vendor 2010E Figure 354: Total Networked Storage Vendor Share 2010E
HP2%
IBM6%
Other 29%
Dell2%
EMC 26%
NetApp35%
HP10%
Other 27%
IBM14%
NetApp12%
EMC 28%
Dell9%
Source: Gartner, Credit Suisse estimates. Source: Gartner, Credit Suisse estimates.
DAS—A Headwind for Vendors With Meaningful Exposure
In the DAS segment of the storage market, which is largely a legacy technology that will continue to gradually fade over time, of the key vendors, EMC, HP, IBM participate in this market in a meaningful way. (See Figure 355.) For these vendors, we believe meaningful exposure to this segment will present a headwind to outgrowing the overall storage market. We believe this is particularly of concern for systems vendors, including IBM ad HP.
Figure 355: DAS Market Share by Vendor (2010E) Figure 356: Market Share—<$50K Price Band
HP11%
IBM13%NetApp
0%
Dell5%
EMC 19%
Other 52%
Dell21%
HP18%
Other36%
IBM5%
EMC 12%
NetApp8%
Source: Gartner, Credit Suisse estimates. Source: Gartner, Credit Suisse estimates.
Market Share by Price Point The rapid growth of data discussed previously necessitates lower-cost storage, and hence we think it makes sense to examine vendor market share trends by price band, given a bias towards vendors are well positioned in this part of the market. Here, as seen in Figure 356, while Dell and HP dominate the low end of the market with 21% and 18% share, respectively, EMC and IBM dominate the high end with 48% share and 22% share, respectively, as shown in Figure 358. In the midrange of the market, which as noted earlier we expect will grow 13% between 2010-2015, and which represents 42% of the overall storage hardware market, EMC leads with 26% share, followed by NetApp (18% share) and IBM (14%). Here we would note that NetApp’s true share is likely understated given IBM is a reseller for NetApp (N series).

16 March 2011
IT Hardware 280
Figure 357: Market Share—$50k-300k Price Band Figure 358: Market Share—>$300K Price Band
HP9%
Other26%
Dell7%
IBM14%
EMC 26%
NetApp18%
IBM22%
Other25%
HP5%
Dell0%
EMC 48%NetApp
0%
Source: Gartner, Credit Suisse estimates. Source: Gartner, Credit Suisse estimates.
Market Share by Region A look at Figure 359 shows vendor share by region. What is apparent is that the two large system vendors, HP and IBM enjoy higher market shares in developing regions (APAC and LA) both versus their overall global share and versus peers. While this is likely owing to their broad distribution, it is also interesting to note lower share in North America (again, relative to global share and versus peers). This we believe is attributable to more fierce competition in North America where peers have better positioned portfolios in the most relevant technology segments and an international storage distribution presence systems vendors built over time in parallel with their server businesses.
Figure 359: Key Storage Vendor Revenue Shares by Geography Dell EMC HP IBM NetApp Other CAGR (‘10-‘15)North America 12% 32% 8% 10% 13% 26% 10% EMEA 9% 24% 17% 15% 12% 24% 8% Asia Pacific 9% 27% 12% 18% 6% 28% 4% Latin America 14% 22% 15% 23% 6% 19% 14% Japan 3% 9% 7% 9% 3% 69% -2%
Total 10% 26% 11% 13% 10% 29% 8% Source: Gartner, Credit Suisse estimates.

16 March 2011
IT Hardware 281
Servers—Anemic Growth Ahead In 2010, servers represented a $49bn market opportunity as demand rebounded from an 18% decline the year prior. Despite the improvement, 2010 market revenues were significantly below the 2007 peak of $55bn. Over the longer term, between 2000 and 2010, server market revenues declined at 1% CAGR as the shift toward lower priced x86 servers sapped growth. Indeed, as a result of the technology shift, it took seven years for the server market to return to 2000 peak revenue levels of $56bn, despite a 104% unit growth over this period. In 2010, server market revenue grew 13%, the best showing in a decade, but the outlook for growth is more somber in our long-term forecast, which runs through 2015, and where we expect a -2.1% CAGR between 2010-2015.
We have developed what we think is a unique approach to modeling the server market, where we attempt to forecast the market by focusing on underlying segment dynamics, within x86 servers, UNIX and mainframes. For x86, we use our proprietary model to assess the effect of virtualization on server demand, using key inputs from the Credit Suisse IT Survey. Our detailed analysis results in four important conclusions:
Anemic server market revenue growth ahead. Based on our proprietary server market forecast, which is discussed in detail in the following section, we believe that overall server market revenue will decline at a 2% CAGR between 2010-2015 to $44bn by 2015. (See Figure 360.) This is slightly above recent recession levels of 2009. As a result, actual server sales will be a drag on a vendor’s growth and as such vendors will increasingly focus on add-on products and bundles to be included with servers. Rather than a direct lever of sales, vendors are likely to increasingly see servers for their strategic importance in improving their datacenter footprint. Companies that are unable to execute on this approach could increasingly be exposed to increasing levels of margin pressure.
x86 servers—secular dynamics come into focus as the cyclical recovery fades. While the x86 market has enjoyed strong growth in 2010 (sales were up some 29% in 2010) owing to both a cyclical recovery, as well as owing to very substantive x86 processor refresh in the form of Intel’s Nehalem, we believe there are two key secular trends within this subsegment to keep in mind.
■ Increased Internet traffic, Web-based applications, and high-performance computing (HPC) workloads are resulting in rapid growth of less richly configured systems. This drives demand and volumes for x86 servers which are optimized for such workloads, both for corporate web-tier and for Internet-based companies, including Yahoo, Amazon and Facebook.
■ To understand the impact of server virtualization we have developed a model that takes into account several factors including the rising percentage of servers that are virtualized, the number of virtual machines per server, and critically, the percent of virtual servers coming from legacy physical servers. These inputs are derived from the Credit Suisse IT Survey. The end conclusion is that for servers that are appropriate for virtualization, i.e., 2-way x86 servers above $2,000, units will decline, but at a fairly significant 7% per annum. The increasing adoption of virtualization is, however, boosting demand of more richly configured systems, specifically with regard to memory footprint. This boost in overall ASPs mitigates the revenue decline for virtualization-focused systems. Despite the negative impact of virtualization, x86, volumes will be supported by low-end systems as demand for Internet, Web and HPC workloads grow.
■ Vast improvements in x86 server performance and OS alternatives continue to erode the UNIX market, particularly at the low end. Using industry performance metrics (SPEC), we demonstrate that x86 servers are actually superior to certain low-end UNIX systems. Unfortunately, the already high unit mix (~98%) of x86 systems dilutes the opportunity for growth.

16 March 2011
IT Hardware 282
Last, we would highlight that we expect the less richly configured, low-end (x86 2-way server below $2,000) server market revenue to grow at a revenue CAGR of 8% between 2010-2015E, as shown in Figure 360.
UNIX—accelerating declines ahead, driven by pressures on low-end UNIX servers. The key trend for UNIX servers, in our view, is the shift of workloads from UNIX to x86 environments. We believe that this trend will be particularly conspicuous at the low-end of the UNIX market (under $50,000 price band) and will drive accelerating declines in UNIX server units. Indeed, the Credit Suisse IT Survey corroborates this outcome. As a result of the erosion in low-end UNIX, ASPs should shift upward. We estimate that UNIX market revenue will decline at a 3% CAGR between 2010-2015E.
Mainframe—expected to remain resilient. While we expect mainframe market revenue to remain cyclical around product launches, these systems will continue to play a important role in enterprise datacenters, given to market demand for with mission critical, enterprise-class application platforms, where significant compute power, transactional integrity, and the need for high reliability are important requirements. The key issue to forecasting the market revolves around product introductions. For example, the recent System z launch from IBM (which controls more than 85% of the mainframe market) is resulting in a product driven upswing in mainframe market revenue. We estimate that the mainframe market revenue will essentially be flat between 2010-2015E.

16 March 2011
IT Hardw
are 283
Figure 360: Credit Suisse Worldwide Server Forecast Revenue (in $mn) 2005 2006 2007 2008 2009 2010 2011E 2012E 2013E 2014E 2015E CAGR '05- '10 CAGR '10-'15
x86 25,657 27,106 30,301 28,512 24 ,728 31 ,851 30,938 31,810 30,682 29,861 28,741 4 .4% -2.0% x86 1-way 2,678 3 ,098 3 ,673 3,568 2 ,961 3 ,279 3,307 3 ,299 3 ,325 3,387 3 ,485 4 .1% 1.2% x86 2-way 18,107 19,101 21,541 20,156 17 ,995 24 ,025 24,112 25,267 24,988 24,341 23,639 5 .8% -0.3% x86 2-way <$2,000 864 1 ,168 1 ,360 1,986 1 ,878 1 ,932 2,066 2 ,233 2 ,414 2,610 2 ,821 17.5% 7.9% x86 2-way >$2,000 17,243 17,933 20,182 18,169 16 ,117 22 ,093 22,046 23,034 22,574 21,732 20,818 5 .1% -1.2% x86 4-way and above 4,872 4 ,908 5 ,087 4,788 3 ,772 4 ,547 3,519 3 ,244 2 ,368 2,132 1 ,617 -1 .4% -18.7%UNIX 19,447 18,914 19,101 17,682 13 ,293 11 ,495 11,039 10,657 10,518 10,081 9 ,815 -10.0% -3.1%Mainframe 6,530 6 ,782 5 ,981 6,524 5 ,064 5 ,448 5,745 5 ,487 5 ,758 5,587 5 ,365 -3 .6% -0.3%Total 51,634 52,803 55,383 52,717 43 ,086 48 ,793 47,722 47,954 46,958 45,528 43,921 -1 .1% -2.1%
S eq. c hange (%) 4 .4% 2.3% 4.9% -4.8% -18.3% 13.2% -2.2% 0.5% -2.1% -3.0% -3.5%
Units ( in thousands) 2005 2006 2007 2008 2009 2010E 2011E 2012E 2013E 2014E 2015E CAGR '05- '10 CAGR '10-'15
x86 7,004 7 ,697 8 ,366 8,660 7 ,299 8 ,617 8,528 8 ,749 8 ,736 8,777 8 ,877 4 .2% 0.6% x86 1-way 1,386 1 ,552 1 ,835 1,901 1 ,599 1 ,855 1,970 2 ,069 2 ,172 2,281 2 ,395 6 .0% 5.2% x86 2-way 5,245 5 ,707 6 ,059 6,291 5 ,369 6 ,404 6,292 6 ,447 6 ,401 6,357 6 ,382 4 .1% -0.1% x86 2-way <$2,000 548 767 893 1,332 1 ,390 1 ,494 1,700 1 ,955 2 ,248 2,585 2 ,973 22.2% 14.8% x86 2-way >$2,000 4,697 4 ,940 5 ,166 4,958 3 ,980 4 ,910 4,592 4 ,492 4 ,154 3,772 3 ,409 0 .9% -7.0% x86 4-way and above 372 438 473 468 330 357 265 234 162 139 101 -0 .8% -22.4%UNIX 552 532 472 405 262 215 185 161 140 119 104 -17.2% -13.5%Mainframe 5 5 4 5 4 4 4 4 4 4 4 -4 .7% -0.3%Total 7,560 8 ,234 8 ,843 9,070 7 ,564 8 ,836 8,716 8 ,914 8 ,880 8,900 8 ,985 3 .2% 0.3%
S eq. c hange (%) 12.6% 8.9% 7.4% 2.6% -16.6% 16.8% -1.4% 2.3% -0.4% 0.2% 1.0%
ASP s (in $) 2005 2006 2007 2008 2009 2010E 2011E 2012E 2013E 2014E 2015E CAGR '05- '10 CAGR '10-'15
x86 3,663 3 ,522 3 ,622 3,293 3 ,388 3 ,696 3,628 3 ,636 3 ,512 3,402 3 ,238 0 .2% -2.6% x86 1-way 1,932 1 ,997 2 ,002 1,877 1 ,852 1 ,768 1,678 1 ,595 1 ,531 1,485 1 ,455 -1 .8% -3.8% x86 2-way 3,452 3 ,347 3 ,555 3,204 3 ,351 3 ,751 3,832 3 ,919 3 ,904 3,829 3 ,704 1 .7% -0.3% x86 2-way <$2,000 1,577 1 ,523 1 ,523 1,491 1 ,351 1 ,293 1,215 1 ,143 1 ,074 1,010 949 -3 .9% -6.0% x86 2-way >$2,000 3,671 3 ,630 3 ,906 3,664 4 ,050 4 ,499 4,801 5 ,127 5 ,435 5,761 6 ,106 4 .2% 6.3% x86 4-way and above 13,084 11,200 10,765 10,234 11 ,437 12 ,726 13,259 13,890 14,584 15,314 16,079 -0 .6% 4.8%UNIX 35,250 35,541 40,450 43,626 50 ,733 53 ,409 59,794 66,234 75,057 84,990 94,274 8 .7% 12.0%Mainframe 1,370,762 1,394,445 1 ,463,183 1 ,392,423 1,341,006 1 ,457,963 1 ,498,492 1,498,304 1 ,483,321 1 ,468,488 1,453,803 1 .2% -0.1%Total 6,830 6 ,413 6 ,263 5,813 5 ,696 5 ,522 5,475 5 ,380 5 ,288 5,116 4 ,888 -4 .2% -2.4%
S eq. c hange (%) -7 .3% -6.1% - 2.3% -7.2% -2.0% -3.0% -0.9% -1.7% -1.7% -3.3% -4.4%
x86:
1) 2011 – secular factors start to come into play. The cyclical rebound of 2010 fades and secular trends, driven by internet and HPC workloads, will start to assert themselves. Over our forecast period, 2010-2015, x86 revenues will decline 2%.
2) Demand to remain solid. Despite calls for an sharp deceleration in x86 market, virtualization will only result in a modest fade. This, coupled with Internet traffic, web-appl ication and HPC-driven demand, should result in 1% unit growth between 2010-2015.
3) ASPs decline. Simply configured systems geared to Internet traffic, web application, and HPC workloads force average ASPs downward, offsetting richer configurations of machines geared for virtualization.
UNIX:
4) Continued market pressure. The UNIX market will continue to see declines, driven by low-end erosion. Continued standardization around x86 will continue turn UNIX systems into a niche market.
5) Low-end faces increasing challenges. x86 performance compares favorably to low-end UNIX in most instances. This, combined with the a significant price differential, is likely to pressure low-end volumes, which make up 79% of UNIX shipments. As a result of this trend, we expect UNIX shipments to decline 14% annually through 2015.
6) Contrary to intuition, UNIX ASPs rise. While the UNIX market is in decline, ASPs increase due to fewer low-end units being sold.
Mainframe:
7) Mainframe, tales of demise exaggerated. Despite continued expectations for mainframe decline, we expect the segment to remain relatively stable, accounting for product cycles.
8) Mainframes meet unique market requirements.
Mainframes continue to meet enterprise-class market requirements, albeit at a price. Despite the fact that the technology is viewed a legacy, it is being implemented in greenfield infrastructure due to its unique ability to provide a high degree of enterprise class compute power, transactional integrity and high reliability. As a result, we expect unit shipments to remain essentially flat through the 2015 forecast period.
74
1
2
5
3
86
Revenue (in $mn) 2005 2006 2007 2008 2009 2010 2011E 2012E 2013E 2014E 2015E CAGR '05- '10 CAGR '10-'15
x86 25,657 27,106 30,301 28,512 24 ,728 31 ,851 30,938 31,810 30,682 29,861 28,741 4 .4% -2.0% x86 1-way 2,678 3 ,098 3 ,673 3,568 2 ,961 3 ,279 3,307 3 ,299 3 ,325 3,387 3 ,485 4 .1% 1.2% x86 2-way 18,107 19,101 21,541 20,156 17 ,995 24 ,025 24,112 25,267 24,988 24,341 23,639 5 .8% -0.3% x86 2-way <$2,000 864 1 ,168 1 ,360 1,986 1 ,878 1 ,932 2,066 2 ,233 2 ,414 2,610 2 ,821 17.5% 7.9% x86 2-way >$2,000 17,243 17,933 20,182 18,169 16 ,117 22 ,093 22,046 23,034 22,574 21,732 20,818 5 .1% -1.2% x86 4-way and above 4,872 4 ,908 5 ,087 4,788 3 ,772 4 ,547 3,519 3 ,244 2 ,368 2,132 1 ,617 -1 .4% -18.7%UNIX 19,447 18,914 19,101 17,682 13 ,293 11 ,495 11,039 10,657 10,518 10,081 9 ,815 -10.0% -3.1%Mainframe 6,530 6 ,782 5 ,981 6,524 5 ,064 5 ,448 5,745 5 ,487 5 ,758 5,587 5 ,365 -3 .6% -0.3%Total 51,634 52,803 55,383 52,717 43 ,086 48 ,793 47,722 47,954 46,958 45,528 43,921 -1 .1% -2.1%
S eq. c hange (%) 4 .4% 2.3% 4.9% -4.8% -18.3% 13.2% -2.2% 0.5% -2.1% -3.0% -3.5%
Units ( in thousands) 2005 2006 2007 2008 2009 2010E 2011E 2012E 2013E 2014E 2015E CAGR '05- '10 CAGR '10-'15
x86 7,004 7 ,697 8 ,366 8,660 7 ,299 8 ,617 8,528 8 ,749 8 ,736 8,777 8 ,877 4 .2% 0.6% x86 1-way 1,386 1 ,552 1 ,835 1,901 1 ,599 1 ,855 1,970 2 ,069 2 ,172 2,281 2 ,395 6 .0% 5.2% x86 2-way 5,245 5 ,707 6 ,059 6,291 5 ,369 6 ,404 6,292 6 ,447 6 ,401 6,357 6 ,382 4 .1% -0.1% x86 2-way <$2,000 548 767 893 1,332 1 ,390 1 ,494 1,700 1 ,955 2 ,248 2,585 2 ,973 22.2% 14.8% x86 2-way >$2,000 4,697 4 ,940 5 ,166 4,958 3 ,980 4 ,910 4,592 4 ,492 4 ,154 3,772 3 ,409 0 .9% -7.0% x86 4-way and above 372 438 473 468 330 357 265 234 162 139 101 -0 .8% -22.4%UNIX 552 532 472 405 262 215 185 161 140 119 104 -17.2% -13.5%Mainframe 5 5 4 5 4 4 4 4 4 4 4 -4 .7% -0.3%Total 7,560 8 ,234 8 ,843 9,070 7 ,564 8 ,836 8,716 8 ,914 8 ,880 8,900 8 ,985 3 .2% 0.3%
S eq. c hange (%) 12.6% 8.9% 7.4% 2.6% -16.6% 16.8% -1.4% 2.3% -0.4% 0.2% 1.0%
ASP s (in $) 2005 2006 2007 2008 2009 2010E 2011E 2012E 2013E 2014E 2015E CAGR '05- '10 CAGR '10-'15
x86 3,663 3 ,522 3 ,622 3,293 3 ,388 3 ,696 3,628 3 ,636 3 ,512 3,402 3 ,238 0 .2% -2.6% x86 1-way 1,932 1 ,997 2 ,002 1,877 1 ,852 1 ,768 1,678 1 ,595 1 ,531 1,485 1 ,455 -1 .8% -3.8% x86 2-way 3,452 3 ,347 3 ,555 3,204 3 ,351 3 ,751 3,832 3 ,919 3 ,904 3,829 3 ,704 1 .7% -0.3% x86 2-way <$2,000 1,577 1 ,523 1 ,523 1,491 1 ,351 1 ,293 1,215 1 ,143 1 ,074 1,010 949 -3 .9% -6.0% x86 2-way >$2,000 3,671 3 ,630 3 ,906 3,664 4 ,050 4 ,499 4,801 5 ,127 5 ,435 5,761 6 ,106 4 .2% 6.3% x86 4-way and above 13,084 11,200 10,765 10,234 11 ,437 12 ,726 13,259 13,890 14,584 15,314 16,079 -0 .6% 4.8%UNIX 35,250 35,541 40,450 43,626 50 ,733 53 ,409 59,794 66,234 75,057 84,990 94,274 8 .7% 12.0%Mainframe 1,370,762 1,394,445 1 ,463,183 1 ,392,423 1,341,006 1 ,457,963 1 ,498,492 1,498,304 1 ,483,321 1 ,468,488 1,453,803 1 .2% -0.1%Total 6,830 6 ,413 6 ,263 5,813 5 ,696 5 ,522 5,475 5 ,380 5 ,288 5,116 4 ,888 -4 .2% -2.4%
S eq. c hange (%) -7 .3% -6.1% - 2.3% -7.2% -2.0% -3.0% -0.9% -1.7% -1.7% -3.3% -4.4%
x86:
1) 2011 – secular factors start to come into play. The cyclical rebound of 2010 fades and secular trends, driven by internet and HPC workloads, will start to assert themselves. Over our forecast period, 2010-2015, x86 revenues will decline 2%.
2) Demand to remain solid. Despite calls for an sharp deceleration in x86 market, virtualization will only result in a modest fade. This, coupled with Internet traffic, web-appl ication and HPC-driven demand, should result in 1% unit growth between 2010-2015.
3) ASPs decline. Simply configured systems geared to Internet traffic, web application, and HPC workloads force average ASPs downward, offsetting richer configurations of machines geared for virtualization.
UNIX:
4) Continued market pressure. The UNIX market will continue to see declines, driven by low-end erosion. Continued standardization around x86 will continue turn UNIX systems into a niche market.
5) Low-end faces increasing challenges. x86 performance compares favorably to low-end UNIX in most instances. This, combined with the a significant price differential, is likely to pressure low-end volumes, which make up 79% of UNIX shipments. As a result of this trend, we expect UNIX shipments to decline 14% annually through 2015.
6) Contrary to intuition, UNIX ASPs rise. While the UNIX market is in decline, ASPs increase due to fewer low-end units being sold.
Mainframe:
7) Mainframe, tales of demise exaggerated. Despite continued expectations for mainframe decline, we expect the segment to remain relatively stable, accounting for product cycles.
8) Mainframes meet unique market requirements.
Mainframes continue to meet enterprise-class market requirements, albeit at a price. Despite the fact that the technology is viewed a legacy, it is being implemented in greenfield infrastructure due to its unique ability to provide a high degree of enterprise class compute power, transactional integrity and high reliability. As a result, we expect unit shipments to remain essentially flat through the 2015 forecast period.
7744
11
22
55
33
8866
Source: Gartner Servers Quarterly Statistics Worldwide Database, February 2011. Credit Suisse estimates for 2011-2015.

16 March 2011
IT Hardware 284
Server Overview As a point of context, we evaluate the server market on effectively two axes. The first is the demand driven by the underlying application market, with compute intensive, high-reliability, and mission-critical workloads on one end of the spectrum and less compute intensive, less demanding applications on the other end. Since compute intensive, mission critical workloads tend to reside on the inside of the datacenter, so do more expensive servers, along with their higher software and services attach. Alternatively, less compute intensive, less mission critical workloads tend to reside on the outside of the data center. (See Figure 361.)
Figure 361: Data Centers—Value with More Complex Workloads
Source: IDC, Credit Suisse
On the second axis, we assess which technologies are legacy and have fallen behind the technology curve (i.e., certain segments of UNIX). While some legacy server technologies continue to produce revenue streams even after less expensive alternatives come to market, the revenue fades over time as customers transition off platforms. Alternatively, some platforms that are perceived as legacy have fundamental value and are irreplaceable in given environments and this is common with some UNIX platforms and
Heavier apps (ERP, CRM, data
warehouses) ~42% of Revenues ~21% of Shipments
Apps, Infrastructure(Email, Security) ~38% of Revenues ~57% of Shipments
Web Tier (Web Serving) ~9% of Revenues ~13% of Shipments

16 March 2011
IT Hardware 285
mainframes. As such, absolute commentary about the death of mainframes or some UNIX platforms can distort reality.
A walk back through time and technology can illuminate how we got to the world of multivendor, heterogeneous IT that continues to plague IT managers and advantage certain vendors with key enterprise footprints and account relationships.
Mainframes—At the Core
Mainframes came to popularity in the 1960s as enterprises first implemented compute environments. At the time, only large companies could afford to acquire and operate these expensive systems. Given their high cost, resource allocation and utilization became a fundamental feature, allowing costs to be spread among different users and departments. These systems were designed to run large and often mission critical workloads. As a result, mainframes developed extensive processing power and high levels of resiliency. In other words, a mainframe is designed not to fail and this can be a critical advantage when running tens of thousand of payroll or financial transactions. By some, mainframes are viewed as the ultimate, albeit expensive computer, that cloud seeks to replicate. Given their affinity to mission critical workloads, mainframes are often reinforced with services headcount to ensure proper operation. As a result, a hardware mainframe footprint can result in lucrative software and services revenue streams. Important, despite claims for the demise of mainframes, this has not borne out in data.
While at one time the mainframe market was relatively fragmented, IBM has consolidated the segment and now holds 85% share. The company has attempted to draw incremental workloads to the system, absorbing Linux and Java workloads and with the latest release of the System zEnterprise, using the system as a management platform for UNIX and x86 servers.
UNIX—Enterprise Wide
Given the high cost of mainframe computing, UNIX emerged as a viable replacement for many workloads. The core operating system was developed at AT&T’s Bell Labs in the late 1960s and then fragmented by Hewlett-Packard, IBM and Sun Microsystems, among others, as they created their own variants. In addition to a unique operating system, these vendors developed their own lines of microprocessors to pair with it, typically RISC-based (Reduced Instruction Set Computing). This formed the core of the infrastructure stack, to which they attracted independent software vendors (ISV’s) and built application ecosystems around their environments. Indeed, the software ecosystems proved sticky since an application written for the respective stack was incompatible with a competitive offering.
Similar to mainframes, UNIX systems where able to efficiently run one operating system on top of multiple processors (8/16/32/64/128/256) to create a powerful and stable processing environment, although not as reliable as mainframe. Unlike mainframes, UNIX systems were able to be scaled down to allow computing at the departmental level. While this enabled increasing adoption by corporations, it was all the beginning of the morass of disparate incompatible systems. Indeed, while the vision of an IBM shop or an HP shop was idealized, the reality was that departmental-level infrastructure choices created deep seated heterogeneous environments, increasing incapability and management cost.
With the dawn of the dot-com era, smaller UNIX computers were implemented at the Web tier, running Internet traffic and dishing out web pages. Being able to run one type of a UNIX operating system, from the core through the Web tier, was considered a key advantage but with the dot-com bust and constrained budgets, x86 servers started their rise to dominance.
x86—Moving from the Outside In
As Intel improved their desktop processors, they were able to convert them to server processors. Initially, x86-based servers were implemented in menial, noncritical roles such

16 March 2011
IT Hardware 286
as printing and file serving. With time, they started being implemented at the Web tier. Running the Windows operating system was a significant advantage for x86 servers, since many users were already familiar with the environment given their PC use. Similarly, Linux benefited given its likeness to the core UNIX OS. As Windows and Linux operating systems became more mature and x86 processing power rapidly expanded, x86 servers, given their relatively low prices, started moving toward the interior of the data center to running increasingly more demanding and critical applications. The lower acquisition costs and capability of x86 resulted in their rapid proliferation. This rapid proliferation started to spiral out of control, creating the term server sprawl. Over time, this server sprawl strained data center capacity, both in the space x86 servers occupied and the massive amounts of heat their processors dispersed. Despite the massive amount of physical servers, they were quite underutilized at 10-15%, and for stability purposes, only ran one application per machine. Fortunately, virtualization technology has come to the forefront, enabling multiple applications to be stacked on a physical machine, encapsulated with it’s own operating system for stability. Since multiple machines could be encapsulated or virtualized on a physical server, increasingly powerful servers could be more fully utilized (Figure 362). While virtualization improved the dynamics of IT infrastructure, some believe they have significantly pressured x86 unit volumes. We discuss the analysis of the impact.
Figure 362: Multiple Virtual Servers Consolidated on a Single Physical Machine
Physical Server
App
OS
App
OS
App
OS
App
OS
App
OS
App
OS
Physical Server
App
OS
App
OS
App
OS
App
OS
App
OS
App
OS
Physical Server
App
OS
App
OS
App
OS
App
OS
App
OS
App
OS
App
OS
App
OS
App
OS
App
OS
App
OS
App
OS
Source: Credit Suisse
With the next phase of virtualization being pooled physical server resources, x86 remains the platform of choice, giving IT managers ability to add capacity in a modular fashion. These pooled internal resources, or internal clouds, have the vision of creating an aggregated, uniform pool of compute (based on x86) and could continue to expand the reach of x86 into the core of the datacenter with a generic workload platform. Nevertheless, vendors like Sun/Oracle and IBM stand fast with database-centric, workload-specific offerings. We detail this further in our Cloud Computing section.
x86 Server Outlook—Pockets of Strength Over time, x86 servers have become key building blocks of various types of IT infrastructures, ranging from printing to internal cloud to high-end appliances like Oracle’s Exadata and Exalogic. The segment comprises 65%/98% of server industry revenue/unit and represents the only growth subsegment of the broader server market, on a unit basis. While total x86 revenue has grown at a CAGR of 4% between 2000-2010 as seen in Figure 363, there are certain subsegments of the market, specifically, 2-way servers under $2,000, that are enjoying very healthy revenue growth (26% CAGR 2000-2010). This underscores the changing dynamics within the broader x86 market and warrants a closer look at market trends based on use cases and price points. As such, we forecast the server market along the following categories:

16 March 2011
IT Hardware 287
■ One-way: This category represents generic infrastructure servers largely used for file and print, networking, security and systems management.
■ Two-way under $2,000 The 2-way category is bifurcating based on workloads. This category represents servers used for Web and high-performance computing workloads, where having cheap compute power is critical. Strong volume growth in 2-way under $2,000 and below servers driven by growth of Web-centric and high-performance computing workloads.
■ Two-way over $2,000. This category represents more richly configured 2-way servers that are being used as server virtualization platforms. Specifically, these machines tend to have a bigger memory footprint to support higher numbers of virtual machines.
■ Four-way and above. This category represents more powerful servers which are increasingly used in virtualization environments where IT managers look to increase virtual machine densities. In addition, given the increasing mission critical nature of x86, these system increasingly being used to absorb database workloads housed on UNIX.

16 March 2011
IT Hardw
are 288
Figure 363: Credit Suisse Worldwide Server Forecast—x86 Market Summary Reve nue (i n $mn) 2005 200 6 200 7 20 08 2 009 2010 201 1E 20 12E 2 013E 2 014E 2015E CAGR '0 0-'10 CAGR '05-'10 CAGR '1 0-'15
x86 x86 1-way 2 ,678 3,098 3,673 3,568 2,961 3,279 3,30 7 3,2 99 3,3 25 3, 387 3 ,485 1.3% 4.1% 1.2% x86 2-way 18 ,107 1 9,101 21,541 20,156 17,995 24,025 24,11 2 25,2 67 24,9 88 24, 341 23 ,639 8.2% 5.8% -0.3% x86 2-wa y <$2,000 864 1,168 1,360 1,986 1,878 1,932 2,06 6 2,2 33 2,4 14 2, 610 2 ,821 2 5.6% 17.5% 7.9% x86 2-wa y >$2,000 17 ,243 1 7,933 20,182 18,169 16,117 22,093 22,04 6 23,0 34 22,5 74 21, 732 20 ,818 7.5% 5.1% -1.2% x86 4-way and above 4 ,872 4,908 5,087 4,788 3,772 4,547 3,51 9 3,2 44 2,3 68 2, 132 1 ,617 -3.9% -1.4% -18.7%Total 25 ,657 2 7,106 30,301 28,512 24,728 31,851 30,93 8 31,8 10 30,6 82 29, 861 28 ,741 4.5% 4.4% -2.0%
Seq. change (%) 10 .8% 5.6% 11.8% -5.9% -13.3% 28.8% -2.9% 2.8 % -3. 5% -2. 7% -3 .7%
Units (in thousands ) 2005 200 6 200 7 20 08 2 009 2010 2011E 2012E 2013E 2014E 2015 E CAGR '0 0-'10 CAGR '05-'10 CAGR '1 0-'15
x86 x86 1-way 1 ,386 1,552 1,835 1,901 1,599 1,855 1,97 0 2,0 69 2,1 72 2, 281 2 ,395 7.7% 6.0% 5.2% x86 2-way 5 ,245 5,707 6,059 6,291 5,369 6,404 6,29 2 6,4 47 6,4 01 6, 357 6 ,382 1 0.2% 4.1% -0.1% x86 2-wa y <$2,000 548 767 893 1,332 1,390 1,494 1,70 0 1,9 55 2,2 48 2, 585 2 ,973 28.0% 22.2 % 1 4.8% x86 2-wa y >$2,000 4 ,697 4,940 5,166 4,958 3,980 4,910 4,59 2 4,4 92 4,1 54 3, 772 3 ,409 7.9% 0.9% -7.0% x86 4-way and above 372 438 473 468 330 357 26 5 2 34 1 62 139 101 -0.7% -0.8% -22.4%Total 7 ,004 7,697 8,366 8,660 7,299 8,617 8,52 8 8,7 49 8,7 36 8, 777 8 ,877 8.9% 4.2% 0.6%
Seq. change (%) 14 .1% 9.9% 8.7% 3.5% -15.7% 18.1% -1.0% 2.6 % -0. 2% 0. 5% 1 .1%
ASP (i n $) 2005 200 6 200 7 20 08 2 009 2010 2011E 2012E 2013E 2014E 2015 E CAGR '0 0-'10 CAGR '05-'10 CAGR '1 0-'15
x86 x86 1-way 1 ,932 1,997 2,002 1,877 1,852 1,768 1,67 8 1,5 95 1,5 31 1, 485 1 ,455 -5.9% -1.8% -3.8% x86 2-way 3 ,452 3,347 3,555 3,204 3,351 3,751 3,83 2 3,9 19 3,9 04 3, 829 3 ,704 -1.8% 1.7% -0.3% x86 2-wa y <$2,000 1 ,577 1,523 1,523 1,491 1,351 1,293 1,21 5 1,1 43 1,0 74 1, 010 949 -1.9 % -3. 9% -6.0% x86 2-wa y >$2,000 3 ,671 3,630 3,906 3,664 4,050 4,499 4,80 1 5,1 27 5,4 35 5, 761 6 ,106 -0.4 % 4.2% 6.3% x86 4-way and above 13 ,084 1 1,200 10,765 10,234 11,437 12,726 13,25 9 13,8 90 14,5 84 15, 314 16 ,079 -3.2% -0.6% 4.8%Total 3 ,663 3,522 3,622 3,293 3,388 3,696 3,62 8 3,6 36 3,5 12 3, 402 3 ,238 -4.0% 0.2% -2.6%
Seq. change (%) -2 .9% -3.9% 2.8% -9.1% 2.9% 9.1% -1.9% 0.2 % -3. 4% -3. 1% -4 .8%
1-way:
1) Market should see slower growth. The 1-way market should see headwinds to growth as they lack a growth impetus and are challenged relative to 2-way servers on price/performance metrics. 1-way servers, unlike 2-way servers and web and HPC specific workloads, lack a substantive growth driver.
2-way/below $2,000:
2) The growth side of a bifurcating segment. Strong unit demand should propel unit demand for sub-$2,000 2-way servers. These servers are more stripped down relative to x86 servers geared toward virtualization but meet satisfy the demands of the most rapidly growing workloads, web-centric and HPC.
3) ASPs face non-traditional declines. Unlike other segments in the x86 market, these servers are not richly configured to support increasing numbers of virtual machines and are relatively more simple in design. As such, commodity pressures increasingly factor.
2-way/above $2,000:
4) Virtualization increasingly pressures units. We calculate that the 2-way servers geared toward virtualization will see increasing unit pressure, despite workload growth.
5) ASPs should see a marked benefit from richer configurations. Machines that support multiple virtual machines benefit from a higher memory footprint and management functionality. Memory remains a key constrain in virtualization and as virtualization adoption increases and virtualization density continues to increase, configuration should improve.
4-way and above:
6) Unit decline accelerates. Similar to the virtualization geared machines in the 2-way, $2,000 and above category, 4-way and above faced pressures from vi rtualization, but to a greater extent since more to these machines are virtualized and can hold more virtual machines. As a result, units should see significant pressure, something rising ASPs will be unable to offset.
2
1
4
3
5
6
Reve nue (i n $mn) 2005 200 6 200 7 20 08 2 009 2010 201 1E 20 12E 2 013E 2 014E 2015E CAGR '0 0-'10 CAGR '05-'10 CAGR '1 0-'15
x86 x86 1-way 2 ,678 3,098 3,673 3,568 2,961 3,279 3,30 7 3,2 99 3,3 25 3, 387 3 ,485 1.3% 4.1% 1.2% x86 2-way 18 ,107 1 9,101 21,541 20,156 17,995 24,025 24,11 2 25,2 67 24,9 88 24, 341 23 ,639 8.2% 5.8% -0.3% x86 2-wa y <$2,000 864 1,168 1,360 1,986 1,878 1,932 2,06 6 2,2 33 2,4 14 2, 610 2 ,821 2 5.6% 17.5% 7.9% x86 2-wa y >$2,000 17 ,243 1 7,933 20,182 18,169 16,117 22,093 22,04 6 23,0 34 22,5 74 21, 732 20 ,818 7.5% 5.1% -1.2% x86 4-way and above 4 ,872 4,908 5,087 4,788 3,772 4,547 3,51 9 3,2 44 2,3 68 2, 132 1 ,617 -3.9% -1.4% -18.7%Total 25 ,657 2 7,106 30,301 28,512 24,728 31,851 30,93 8 31,8 10 30,6 82 29, 861 28 ,741 4.5% 4.4% -2.0%
Seq. change (%) 10 .8% 5.6% 11.8% -5.9% -13.3% 28.8% -2.9% 2.8 % -3. 5% -2. 7% -3 .7%
Units (in thousands ) 2005 200 6 200 7 20 08 2 009 2010 2011E 2012E 2013E 2014E 2015 E CAGR '0 0-'10 CAGR '05-'10 CAGR '1 0-'15
x86 x86 1-way 1 ,386 1,552 1,835 1,901 1,599 1,855 1,97 0 2,0 69 2,1 72 2, 281 2 ,395 7.7% 6.0% 5.2% x86 2-way 5 ,245 5,707 6,059 6,291 5,369 6,404 6,29 2 6,4 47 6,4 01 6, 357 6 ,382 1 0.2% 4.1% -0.1% x86 2-wa y <$2,000 548 767 893 1,332 1,390 1,494 1,70 0 1,9 55 2,2 48 2, 585 2 ,973 28.0% 22.2 % 1 4.8% x86 2-wa y >$2,000 4 ,697 4,940 5,166 4,958 3,980 4,910 4,59 2 4,4 92 4,1 54 3, 772 3 ,409 7.9% 0.9% -7.0% x86 4-way and above 372 438 473 468 330 357 26 5 2 34 1 62 139 101 -0.7% -0.8% -22.4%Total 7 ,004 7,697 8,366 8,660 7,299 8,617 8,52 8 8,7 49 8,7 36 8, 777 8 ,877 8.9% 4.2% 0.6%
Seq. change (%) 14 .1% 9.9% 8.7% 3.5% -15.7% 18.1% -1.0% 2.6 % -0. 2% 0. 5% 1 .1%
ASP (i n $) 2005 200 6 200 7 20 08 2 009 2010 2011E 2012E 2013E 2014E 2015 E CAGR '0 0-'10 CAGR '05-'10 CAGR '1 0-'15
x86 x86 1-way 1 ,932 1,997 2,002 1,877 1,852 1,768 1,67 8 1,5 95 1,5 31 1, 485 1 ,455 -5.9% -1.8% -3.8% x86 2-way 3 ,452 3,347 3,555 3,204 3,351 3,751 3,83 2 3,9 19 3,9 04 3, 829 3 ,704 -1.8% 1.7% -0.3% x86 2-wa y <$2,000 1 ,577 1,523 1,523 1,491 1,351 1,293 1,21 5 1,1 43 1,0 74 1, 010 949 -1.9 % -3. 9% -6.0% x86 2-wa y >$2,000 3 ,671 3,630 3,906 3,664 4,050 4,499 4,80 1 5,1 27 5,4 35 5, 761 6 ,106 -0.4 % 4.2% 6.3% x86 4-way and above 13 ,084 1 1,200 10,765 10,234 11,437 12,726 13,25 9 13,8 90 14,5 84 15, 314 16 ,079 -3.2% -0.6% 4.8%Total 3 ,663 3,522 3,622 3,293 3,388 3,696 3,62 8 3,6 36 3,5 12 3, 402 3 ,238 -4.0% 0.2% -2.6%
Seq. change (%) -2 .9% -3.9% 2.8% -9.1% 2.9% 9.1% -1.9% 0.2 % -3. 4% -3. 1% -4 .8%
1-way:
1) Market should see slower growth. The 1-way market should see headwinds to growth as they lack a growth impetus and are challenged relative to 2-way servers on price/performance metrics. 1-way servers, unlike 2-way servers and web and HPC specific workloads, lack a substantive growth driver.
2-way/below $2,000:
2) The growth side of a bifurcating segment. Strong unit demand should propel unit demand for sub-$2,000 2-way servers. These servers are more stripped down relative to x86 servers geared toward virtualization but meet satisfy the demands of the most rapidly growing workloads, web-centric and HPC.
3) ASPs face non-traditional declines. Unlike other segments in the x86 market, these servers are not richly configured to support increasing numbers of virtual machines and are relatively more simple in design. As such, commodity pressures increasingly factor.
2-way/above $2,000:
4) Virtualization increasingly pressures units. We calculate that the 2-way servers geared toward virtualization will see increasing unit pressure, despite workload growth.
5) ASPs should see a marked benefit from richer configurations. Machines that support multiple virtual machines benefit from a higher memory footprint and management functionality. Memory remains a key constrain in virtualization and as virtualization adoption increases and virtualization density continues to increase, configuration should improve.
4-way and above:
6) Unit decline accelerates. Similar to the virtualization geared machines in the 2-way, $2,000 and above category, 4-way and above faced pressures from vi rtualization, but to a greater extent since more to these machines are virtualized and can hold more virtual machines. As a result, units should see significant pressure, something rising ASPs will be unable to offset.
22
11
44
33
55
66
Source: Gartner Servers Quarterly Statistics Worldwide Database, February 2011. Credit Suisse estimates for 2011-2015.

16 March 2011
IT Hardware 289
Three Core Drivers for the x86 Server Market We highlight the following key drivers of the x86 server market over the next several years, outside of core compute demand. First, internet traffic (Web tier), Web application and high-performance computing (HPC) workloads are generating strong demand for low-end volume servers. Second, compelling x86 price performance relative to UNIX, driven by a strong roadmap and a steady cadence of chip releases from Intel, provides incremental growth. Last, we see strong and continued developer and enterprise customer support for the x86 platform. This is accentuated by the rising adoption of x86 virtualization.
1) x86 Volumes Being Driven by Web/High-Performance Computing Workloads
There are discernable trends within the low end of the x86 server market that are worth highlighting. While we expect commodity x86 1-way servers to continue to enjoy midsingle digit type volume growth driven by the need of generic infrastructure workloads, the 2-way under $2,000 market should enjoy robust volume growth. Here, we expect this subsegment of the x86 market to grow volumes/revenue by a CAGR of 15%/8% between 2010-2015 owing to strong underlying demand for in Web/HPC workloads for which these servers are best suited. As seen in Figure 364, Gartner estimates that Web application/front-end/HPC workload growth of 8%/8%/9% between 2009-2012 or 8% in aggregate. This compares with relatively anemic 2% growth for other types of workloads. Indeed, as shown in Figure 365/Figure 366 there is a clear correlation between workload demand the migration towards Web/HPC workloads and the growth in server units allocated for such workloads.
Figure 364: Gartner—Proportion of Server Shipments by Workload 2007 2008 2009 2010 2011 2012 CAGR '09-'12E
Front-End 20% 21% 21% 22% 22% 23% 8%Web Applications 12% 12% 12% 13% 13% 13% 8%Email/Messaging 10% 11% 11% 11% 12% 12% 8%HPC 7% 7% 8% 8% 8% 9% 9%OLTP DBMS 9% 9% 9% 9% 9% 9% 5%Streaming Media 5% 5% 6% 6% 7% 7% 10%Collaboration 5% 5% 6% 7% 7% 7% 10%Infrastructure 14% 13% 10% 9% 8% 7% -7%Data Warehouse 4% 4% 5% 5% 5% 5% 5%Other 12% 11% 10% 7% 6% 5% -17%Virtual Desktop 2% 2% 2% 3% 3% 3% 20%Total 100% 100% 100% 100% 100% 100% 5%
Web/Front-End/HPC% of total workloads 39% 40% 41% 43% 43% 45%Seq. change (%) 5% -19% 7% 6% 11% 8%
Other% of total workloads 61% 60% 59% 57% 57% 55%Seq. change (%) 1% -22% -2% 6% 2% 2%
1) Front-end (web-tier/Internet traffic), Web application and high performance computing (HPC) workloads. These workloads are among the biggest and fastest growing. In aggregate, Gartner expects these workloads to grow at an 8% CAGR are among the fastest growing. These fast growing workloads do not require highly configured servers with a significant memory footprint.
2) These three workloads account for a good portion of x86 growth. Excluding these relatively high growing workloads, all other servers are expected to grow at a more anemic 2% CAGR 2009-12.
2
1
1
1
2
1
2007 2008 2009 2010 2011 2012 CAGR '09-'12EFront-End 20% 21% 21% 22% 22% 23% 8%Web Applications 12% 12% 12% 13% 13% 13% 8%Email/Messaging 10% 11% 11% 11% 12% 12% 8%HPC 7% 7% 8% 8% 8% 9% 9%OLTP DBMS 9% 9% 9% 9% 9% 9% 5%Streaming Media 5% 5% 6% 6% 7% 7% 10%Collaboration 5% 5% 6% 7% 7% 7% 10%Infrastructure 14% 13% 10% 9% 8% 7% -7%Data Warehouse 4% 4% 5% 5% 5% 5% 5%Other 12% 11% 10% 7% 6% 5% -17%Virtual Desktop 2% 2% 2% 3% 3% 3% 20%Total 100% 100% 100% 100% 100% 100% 5%
Web/Front-End/HPC% of total workloads 39% 40% 41% 43% 43% 45%Seq. change (%) 5% -19% 7% 6% 11% 8%
Other% of total workloads 61% 60% 59% 57% 57% 55%Seq. change (%) 1% -22% -2% 6% 2% 2%
1) Front-end (web-tier/Internet traffic), Web application and high performance computing (HPC) workloads. These workloads are among the biggest and fastest growing. In aggregate, Gartner expects these workloads to grow at an 8% CAGR are among the fastest growing. These fast growing workloads do not require highly configured servers with a significant memory footprint.
2) These three workloads account for a good portion of x86 growth. Excluding these relatively high growing workloads, all other servers are expected to grow at a more anemic 2% CAGR 2009-12.
2
1
11
11
22
11
Source: Gartner
Looked at another way, increasing time spent online is driving demand for servers dedicated to serving up Internet traffic, content and applications. Herein we highlight the persistent and relatively high level growth in the amount of minutes users spend online, which is likely causing strains on back-end servers and providing an impetus to build out more capacity.

16 March 2011
IT Hardware 290
Figure 365: Growth in Minutes Spent Online in the U.S. Figure 366: Growth in Minutes Spent Online Worldwide
-5%
0%
5%
10%
15%
20%
1Q04 2Q05 3Q06 4Q07 1Q09 2Q10
0%
5%
10%
15%
20%
25%
30%
4Q07 3Q08 2Q09 1Q10
Source: comScore Source: comScore
Interestingly, growth in the x86 market segment is a function of strong secular demand within the U.S., as opposed to growth in traditionally lower ASP geographies like Asia Pacific. This points to an underlying technology shift rather than geographic bias toward lower priced x86 servers.
Figure 367: x86 2-Way Under $2,000 Geographic Mix x86 Mix by Geo - 2-Way $2k and under% of shipments, revenues
2005 2006 2007 2008 2009 2010Asia/Pacific shipments 29% 22% 16% 13% 16% 17%
revenues 28% 20% 14% 12% 17% 18%Canada shipments 2% 3% 4% 5% 5% 5%
revenues 2% 3% 4% 5% 5% 5%Eastern Europe shipments 18% 13% 14% 9% 7% 6%
revenues 17% 11% 12% 9% 6% 6%Japan shipments 3% 3% 2% 1% 0% 0%
revenues 3% 3% 2% 1% 0% 0%Latin America shipments 0% 2% 3% 2% 3% 3%
revenues 0% 2% 3% 2% 3% 3%Middle East & Africa shipments 7% 4% 4% 3% 2% 2%
revenues 6% 3% 4% 3% 2% 2%USA shipments 13% 29% 32% 48% 53% 54%
revenues 15% 33% 35% 51% 52% 54%Western Europe shipments 28% 25% 25% 19% 15% 12%
revenues 29% 24% 24% 18% 15% 12%
1) The U.S. has bias toward low-end 2-way servers, pointing the fact that this is a technology trend, rather than a geographical one.
1
x86 Mix by Geo - 2-Way $2k and under% of shipments, revenues
2005 2006 2007 2008 2009 2010Asia/Pacific shipments 29% 22% 16% 13% 16% 17%
revenues 28% 20% 14% 12% 17% 18%Canada shipments 2% 3% 4% 5% 5% 5%
revenues 2% 3% 4% 5% 5% 5%Eastern Europe shipments 18% 13% 14% 9% 7% 6%
revenues 17% 11% 12% 9% 6% 6%Japan shipments 3% 3% 2% 1% 0% 0%
revenues 3% 3% 2% 1% 0% 0%Latin America shipments 0% 2% 3% 2% 3% 3%
revenues 0% 2% 3% 2% 3% 3%Middle East & Africa shipments 7% 4% 4% 3% 2% 2%
revenues 6% 3% 4% 3% 2% 2%USA shipments 13% 29% 32% 48% 53% 54%
revenues 15% 33% 35% 51% 52% 54%Western Europe shipments 28% 25% 25% 19% 15% 12%
revenues 29% 24% 24% 18% 15% 12%
1) The U.S. has bias toward low-end 2-way servers, pointing the fact that this is a technology trend, rather than a geographical one.
11
Source: Gartner
Compelling Price Performance for x86 versus UNIX
Historically, x86 servers have been relegated to less performance-intensive and less mission-critical workloads. The major issue historically has been weaker computing performance relative to UNIX servers, i.e., ineffectiveness at scaling up and less stable operating systems. On the OS front, Linux continues to mature and Microsoft continuously improves its datacenter OS. For microprocessors, we believe that several trends are allowing x86 to attain enough critical mass to increasingly encroach on the UNIX market.
Comparable performance at much lower prices. As shown in Figure 368, between 2003-2010, x86 servers have consistently enjoyed a higher improvement factor. As we demonstrate, performance (as measured by the SPECint2000/2006 rate) of a 2-way Xeon-based x86 chip (performance measure of 373) is superior to not only to a 2-way

16 March 2011
IT Hardware 291
Itanium-based UNIX processor (performance measure of 134) but also to a 4-way Itanium-based processor (performance measure of 269). We believe these data are particularly meaningful when viewed in conjunction with the price points of UNIX versus x86 servers. As seen in Figure 368, a 2-way Itanium based UNIX server enjoyed a price premium of 6.5x the price of a 2-way x86 server while having only 0.36 times the performance. A 4-way Itanium based UNIX server enjoyed a price premium of 3.8x the price of a 4-way x86 server while having only 0.35 times the performance. In Figure 368, x86 performance and price serves as the benchmark for other systems (denominator).
Figure 368: Benchmarking UNIX Vendors Against x86
-
1.00
2.00
3.00
4.00
5.00
6.00
IBM Sun Itanium x 86
Benc
hmar
k (v
s. x
86)
Performance Price
-
1.00
2.00
3.00
4.00
5.00
6.00
7.00
IBM Sun Itanium x86
Benc
hmar
k (v
s. x
86)
Performance Price
2
1) Benchmarking UNIX against x86. Using absolute server performance metrics from an industry standards body (SPEC) and price data from Gartner, we compared UNIX price andperformance against similar processor x86 servers.
2) Only IBM was competitive versus x86. We divided every vendor’s price and performance by our x86 metrics and ASPs, so effectively x86 became the benchmark. When the data is compared in this relative form, it highlights that only IBM exceeds x86, albeit at a higher price.
1
22
1
SPECint2006* ASP*IBM 580 15,688Sun 183 22,760Itanium 134 24,379x86 373 3,751
SPECint2006* ASP*IBM 1,440 63,713Sun 152 40,714Itanium 269 46,120x86 759 12,090
-
1.00
2.00
3.00
4.00
5.00
6.00
IBM Sun Itanium x 86
Benc
hmar
k (v
s. x
86)
Performance Price
-
1.00
2.00
3.00
4.00
5.00
6.00
7.00
IBM Sun Itanium x86
Benc
hmar
k (v
s. x
86)
Performance Price
2
1) Benchmarking UNIX against x86. Using absolute server performance metrics from an industry standards body (SPEC) and price data from Gartner, we compared UNIX price andperformance against similar processor x86 servers.
2) Only IBM was competitive versus x86. We divided every vendor’s price and performance by our x86 metrics and ASPs, so effectively x86 became the benchmark. When the data is compared in this relative form, it highlights that only IBM exceeds x86, albeit at a higher price.
11
2222
11
SPECint2006* ASP*IBM 580 15,688Sun 183 22,760Itanium 134 24,379x86 373 3,751
SPECint2006* ASP*IBM 1,440 63,713Sun 152 40,714Itanium 269 46,120x86 759 12,090
Source: Gartner, SPEC, Credit Suisse
Consistency of the Intel roadmap and major improvements. Digging into the performance trend discussed above shows one of the reasons for the performance gains of the x86 chip architecture relative to some UNIX processor lines. Intel’s significantly faster cadence of processor releases allows x86 to evolve at a much more rapid rate than processors refreshed at longer time intervals. The difference between processor release cycles is illustrated in Figure 370. While UNIX servers are launched some two to three years apart, the x86 based systems come out about once a year.
Evaluating data from SPEC, specifically the SPECint2000 metric, used before 2007 and SPECin2006, used after 2006 shows that x86’s rapid product introductions caused the among the best performance improvements relative to UNIX vendors (with the exception of IBM) as seen in Figure 369.

16 March 2011
IT Hardware 292
Figure 369: Leaps in Performance for 2-Way/4-Way UNIX and x86 Servers
Improvement Improvement Improvement ImprovementFact or Factor Factor Factor
2-Way 2- Way 2-Way 2-WayApr- 03 31 Apr-03 24 Jul-03 31 Aug-03 27Oct-06 87 2.8 Feb-06 31 1.3 Nov-05 33 1.1 Jul -06 106 3.9Jun-07 122 Apr-08 157 Oct-06 54 Feb-07 82Aug-10 580 4.8 Aug-09 183 1.2 Mar-10 134 2.5 Oct-10 373 4.5
4-way 4- way 4-way 4-wayMay- 03 78 Jun-03 41 Jul-03 60 Sep-03 47Oct-06 136 1.8 Mar-05 87 2.1 Jun- 06 134 2.2 Sep-06 163 3.5Jun-07 240 Apr-07 78 Oct-06 102 Nov-07 142Aug-10 1,440 6.0 Oct-09 152 1.9 May-10 269 2.6 Aug-10 759 5.3
Date PerformancePerformance Date PerformanceDate Performance Date IBM P OWER S un SP ARC Intel Itanium Intel X eon
1
2-Way
0.0
1.0
2.0
3.0
4.0
5.0
IBM Sun Itanium x 86
SPECint2000Rate SPECin2006Rate
4-Way
0.0
1.02.0
3.04.0
5.06.0
7.0
IBM Sun Itanium x 86
SPECint2000Rate SPECint2006Rate
1
2
1) 2-Way: Over the past decade, Intel and IBM have improved processor performance the most when comparing on SPECint2000/2006 metrics.
2) 4-Way: Similar to 2-Way, Intel and IBM have registered the biggest improvements on a SPECint2000/2006 basis.
1
2
Improvement Improvement Improvement ImprovementFact or Factor Factor Factor
2-Way 2- Way 2-Way 2-WayApr- 03 31 Apr-03 24 Jul-03 31 Aug-03 27Oct-06 87 2.8 Feb-06 31 1.3 Nov-05 33 1.1 Jul -06 106 3.9Jun-07 122 Apr-08 157 Oct-06 54 Feb-07 82Aug-10 580 4.8 Aug-09 183 1.2 Mar-10 134 2.5 Oct-10 373 4.5
4-way 4- way 4-way 4-wayMay- 03 78 Jun-03 41 Jul-03 60 Sep-03 47Oct-06 136 1.8 Mar-05 87 2.1 Jun- 06 134 2.2 Sep-06 163 3.5Jun-07 240 Apr-07 78 Oct-06 102 Nov-07 142Aug-10 1,440 6.0 Oct-09 152 1.9 May-10 269 2.6 Aug-10 759 5.3
Date PerformancePerformance Date PerformanceDate Performance Date IBM P OWER S un SP ARC Intel Itanium Intel X eon
1
2-Way
0.0
1.0
2.0
3.0
4.0
5.0
IBM Sun Itanium x 86
SPECint2000Rate SPECin2006Rate
4-Way
0.0
1.02.0
3.04.0
5.06.0
7.0
IBM Sun Itanium x 86
SPECint2000Rate SPECint2006Rate
11
22
1) 2-Way: Over the past decade, Intel and IBM have improved processor performance the most when comparing on SPECint2000/2006 metrics.
2) 4-Way: Similar to 2-Way, Intel and IBM have registered the biggest improvements on a SPECint2000/2006 basis.
11
22
Source: Company data, Credit Suisse estimates

16 March 2011
IT Hardw
are 293
Figure 370: Intel’s Roadmap Cycles More Rapidly than That of UNIX Vendors
2001 2002 2003 2004 2005 2006 2007 2008 2009 2010 2011 2012 2013 2014
Intel Xeon DP
Intel Xeon MP
Intel Itanium
IBM POWER
Sun/Oracle SPARC
Mid-Range & High-End
Low-End
(1) (3) (4) (5) (6) (7) (8) (9) (10) (11)
(1) (2) (3) (4) (5) (6) (7) (8)
(1) (2) (3) (4) (5) (6) (7 ) (8)
(1) (2) (3) (4) (5)
(1) (1)(2) (3) (4) (5) (6)
(4)(3)(2)(1)
1) x86: Intel released 10 2-way server processors (DP) since 2001 and 8 4-way and above processors (MP)2) Itanium: Intel, compared to its x86 prowess, is much slower with Itanium processor releases, providing only 6 new ones for HP this decade.
3) IBM POWER: While IBM only released 4 new POWER processors this decade, they have made significant improvements in performance.4) Sun/Oracle SPARC: Sun released 7 new processors this decade but was troubled in developing its own high-end processor and had to turn to a partnership with Fujitsu.
(2)
< Historical Anticipated >
1
2
3
4
(9)
Expect similar Xeon cadence going forward…
2001 2002 2003 2004 2005 2006 2007 2008 2009 2010 2011 2012 2013 20142001 2002 2003 2004 2005 2006 2007 2008 2009 2010 2011 2012 2013 2014
Intel Xeon DP
Intel Xeon MP
Intel Itanium
IBM POWER
Sun/Oracle SPARC
Mid-Range & High-End
Low-End
(1) (3) (4) (5) (6) (7) (8) (9) (10) (11)
(1) (2) (3) (4) (5) (6) (7) (8)
(1) (2) (3) (4) (5) (6) (7 ) (8)
(1) (2) (3) (4) (5)
(1) (1)(2) (3) (4) (5) (6)
(4)(3)(2)(1)
1) x86: Intel released 10 2-way server processors (DP) since 2001 and 8 4-way and above processors (MP)2) Itanium: Intel, compared to its x86 prowess, is much slower with Itanium processor releases, providing only 6 new ones for HP this decade.
3) IBM POWER: While IBM only released 4 new POWER processors this decade, they have made significant improvements in performance.4) Sun/Oracle SPARC: Sun released 7 new processors this decade but was troubled in developing its own high-end processor and had to turn to a partnership with Fujitsu.
(2)
< Historical Anticipated >
11
22
33
44
(9)
Expect similar Xeon cadence going forward…
Source: Company data, Credit Suisse estimates Notes: Intel Dual Processor (2-way): (1) Foster, (2) Prestonia, (3) Nocona, (4) Irwindale, (5) Paxville, (6) Woodcrest/Dempsey, (7) Clovertown, (8) Wolfdale/Harpertown, (9) Nehalem-EP, (10) Westmere-EP, (11) projected Sandy Bridge. Intel Multi-Processor
(4-way and above): (1) Foster, (2) Gallatin, (3) Cranford/Potomac, (4) Paxville, (5) Tulsa, (6) Tigerton, (7) Dunnington, (8) Nehalem-EX, (9) projected Westmere-EX. Intel Itanium: (1) Merced, (2) McKinley, (3) Madison, (4) Montecito, (5) Montvale, (6)
Tukwila, (7) Poulson, (8) Kittson. IBM POWER: (1) POWER4, (2) POWER5, (3) POWER6, (4) POWER7, (5) projected POWER8. Sun/Oracle SPARC: Low-end: (1) UltraSPARC III/Cheetah, (2) T1/Niagara, (3), T2/Niagara 2, (4) T3/Rainbow Falls, (5)
projected Yosemite Falls, (6) projected Cascade Falls. High-end (1) UltraSPARC IV Jaguar, (2) Fujitsu SPARC64 VI/Olympus, (3) Fujitsu SPARC64 VII/Jupiter, (4) projected Fujitsu SPARC64 VIIIfx/Venus.

16 March 2011
IT Hardware 294
Strong Developer Momentum for x86
Developer enthusiasm is another driver of platform success, as organizations tend to choose platforms based on the strength of application ecosystems. Put differently, applications available on a platform generate demand which in turn attracts more developer support. As seen in Figure 371, Gartner has charted the relative size of a software portfolio against the enthusiasm and popularity among the ISV community. The popularity among developers represents a high rate of new applications or new versions that will be made available; this demonstrates relative momentum for Windows, Novell and Red Hat on x86 versus other platforms over time. Furthermore, in addition to simply looking at the number of ISVs, Gartner goes one step further in order to assess whether the right ISVs (whose products are useful and actually used in the industry) are in the portfolio. Here Figure 371 shows that OS’s supporting the x86 platform tend to have a diverse, balanced portfolio that suits multiple types of applications and workloads.
Figure 371: Developer Support for Preferences for Different OS’s Show x86 Platform Momentum
Workload Relevance:
Portfolio and use skewed
toward application Web and
infrastructure serving.
Portfolio and use skewed
toward DBMS and
verticalized workloads
Broad variety of workloads
Architecture:
Red Hat(x86)
Windows(x86)
Novell SUSE(x86)
Solaris(x86)
Linux(System z)
Solaris(SPARC)
IBM i5/OS
Linux(Itanium)
IBM z/OS
Oracle Linux(x86)
NP NonStop(Itanium)
Windows(Itanium)
OpenVMS(Alpha)
HP-UX(PA-RISC)
OpenVMS(Itanium)
HP-UX(Itanium)
Linux(Power)
IBM AIX
Appr
opria
te N
ew B
usin
ess
Sof
twar
e Po
rtfo
lio
Independent Software Vendor Momentum
RISC Itaniumx86 Mainframe
Source: Gartner
How We Expect Virtualization to Affect Server Units As discussed in an earlier section, virtualization is a key industry trend facing the server market. To summarize, the key drivers of virtualization include the need to improve utilization, reduce TCO, and support of new use cases. The concern, simply put, is that virtualization is a negative for server market growth, as virtualization and associated consolidation put downward pressure on physical server volumes. In our forecast, we attempt to model the impact that server virtualization will have on server volumes going forward, and we do so as follows. (See Figure 374.)
1) First, we start with the installed base of x86 servers that are likely to be used in virtualization environments (2-way over $2,000 in this instance). Then, using a replacement rate of 4.2 years, which we believe is reasonable based on the results of the Credit Suisse IT Survey as well as recent data from Gartner on the useful life of a server, we estimate the number of units that effectively fall out of the installed base every quarter and the amount of units that need to be shipped to replace them.
2) Second, we model growth in new server shipments using historical shipment rates that are in excess of the replacement rate. The outlook for server shipment growth here is

16 March 2011
IT Hardware 295
largely driven by workload growth. We conservatively assume these shipments are at prerecession highs, prior to the mass adoption of virtualization.
3) We estimate the percentage of new physical servers that are being virtualized, with the model inputs being driven by the Credit Suisse IT Survey and corroborated by IDC studies.
4) Next, we estimate the number of virtual machines per physical server, with our estimates again based on industry data and inputs from the Credit Suisse IT Survey. We adjust this by the number of virtual machines coming from legacy servers versus newly created ones. According to the Credit Suisse IT Survey, the number of physical servers being consolidated through virtualization is approximately one-third, and this ratio is expected to hold through time. (See Figure 372.) Looked at another way, consolidation of legacy physical servers is not the driver of virtual growth, as this looks to be organic in nature. (See Figure 373.)
Figure 372: Legacy Physical Servers Make Up Only a Third of Virtualized Machines what percent of your virtual machines did/do/might come from existing physical servers (vs. a newly created virtual machine) at the following points in time?
30.5%
31.0%
31.5%
32.0%
32.5%
33.0%
33.5%
1 y ear ago Now 1 y ear from now 2 y ears from now 5 y ears from now
Source: Credit Suisse IT Survey, February 2011.

16 March 2011
IT Hardware 296
Figure 373: Organic Workload Growth Reduces Pressure on the x86 Market how do you expect the number of total x86 workloads to grow per year over the next one year, two years, and five years?
0.0%
5.0%
10.0%
15.0%
20.0%
25.0%
30.0%
35.0%
40.0%
1 y ear 2 y ears 5 y ears
Source: Credit Suisse IT Survey, February 2011.
5) We calculate the number of physical servers necessary to support the newly created virtual machines.
Combining the nonvirtualized servers with the virtual machines gives us the 2-way servers over $2,000 shipment forecast. As shown, the end conclusion is that unit demand will decline at a rate of 7% per annum. This is a fairly significant unit decline that only 5% ASP increases can temper. We the expect important 2-way over $2,000 segment (69% of x86 revenues) to decline at a 1% CAGR in 2010-15.

16 March 2011
IT Hardw
are 297
Figure 374: 5 Steps to Working Out the Impact of Virtualization
1) Installed base. We start with the installed base of x86 servers that are likely to be used in virtualization environments (2-way over $2,000 in this instance). Then using a replacement rate of 4.2 years, which we believe is reasonable based on the results of the Credit Suisse IT Survey as well as recent data from Gartner on the useful life of a server, we estimate the number of units that effectively fall out of the installed base every quarter and the amount of units that need to be shipped to replace them.
2) Gross additions. We model growth in new server shipments using historical shipment rates that are in excess of the replacement rate. The outlook for server shipment growth here is largely driven by workload growth. We conservatively assume these shipments are at pre-recession highs, prior to the mass adoption of virtualization.
3) New servers virtualized. We estimate the percentage of new physical servers that are being virtualized, with the model input being driven by the Credit Suisse IT Survey and corroborated by IDC studies. According to our proprietary survey, 40% of new servers are being virtualized. This compares to IDC findings that 13% of all servers are virtualized, which implies a higher amount of new shipments being virtualized. We conservatively assumed 29% of all new shipments are being virtualized with that number stepping up in the future. IDC expects 22.3% of all machines being virtualized by 2013 while our Survey respondents expect 61% of their new machines will be virtualized.
4) VMs per server. Next we estimate the number of virtual machines per physical server, with our estimates again based on industry data and inputs from the Credit Suisse IT Survey. We adjust this by the number of virtual machines coming from legacy servers vs. newly created ones. Our survey results point to 13 VMs per machine now and 21 in two years. IDC’s estimate of 6 VMs per server in 2009 and 8.4 in 2013. Our data indicates that 33% of virtual machines are coming from legacy physical servers. This is a critical finding since it points to the fact that only one-third of virtual machines are a result of consolidation with two-thirds a organic workload growth as a result of virtualization. This mitigates the full effect of the consolidation element of virtualization.
5) Physical servers needed to support virtual machines. We calculate the number of physical servers necessary to support the newly created virtual machines, replacing physical servers. Because the consolidation effect is somewhat mitigated by organic VM growth, compression is not as significant as it potentially as it might be otherwise. Nevertheless, there is a significant number of servers annual lost to virtualization, approximately 1.3 million this year and running to 3.2 million units by 2015.
2011E 2012E 2013E 2014E 2015E
2-way over $2,000 server units
Servers needed to maintain installed base 4,595,917 4,498,177 4,501,050 4,755,255 4,612,140 Incremental units in excess of refreshing installed base 1,279,379 1,669,729 1,786,611 1,875,941 1,950,979 Total theortical server demand 5,875,296 6,167,907 6,287,661 6,631,196 6,563,119
% of servers virtualized 29% 33% 40% 50% 55%
Virtualized phys ical servers 1,688,600 2,062,424 2,515,064 3,315,598 3,609,716
Virtual machines per server 12.6 16.1 20.0 22.0 24.0 % of virtual servers coming from legacy physical servers 33% 33% 33% 33% 33%% of virtual servers coming from workload growth 67% 67% 67% 67% 67%Virtual machines per server coming from legacy servers 4.2 5.3 6.6 7.3 7.9 Virtual machines per server coming from organic workload growth 8.5 10.8 13.4 14.7 16.1
Physical virtualized servers meeting demand 405,665 386,996 381,070 456,694 455,772 Non-virtualized servers 4,186,696 4,105,482 3,772,596 3,315,598 2,953,404
Total servers 4,592,361 4,492,478 4,153,667 3,772,292 3,409,176 YoY growth -6.5% -2.2% -7.5% -9.2% -9.6%
Physical servers lost to virtualization 1,282,935 1,675,429 2,133,994 2,858,904 3,153,943
1
3
4
5
2
1) Installed base. We start with the installed base of x86 servers that are likely to be used in virtualization environments (2-way over $2,000 in this instance). Then using a replacement rate of 4.2 years, which we believe is reasonable based on the results of the Credit Suisse IT Survey as well as recent data from Gartner on the useful life of a server, we estimate the number of units that effectively fall out of the installed base every quarter and the amount of units that need to be shipped to replace them.
2) Gross additions. We model growth in new server shipments using historical shipment rates that are in excess of the replacement rate. The outlook for server shipment growth here is largely driven by workload growth. We conservatively assume these shipments are at pre-recession highs, prior to the mass adoption of virtualization.
3) New servers virtualized. We estimate the percentage of new physical servers that are being virtualized, with the model input being driven by the Credit Suisse IT Survey and corroborated by IDC studies. According to our proprietary survey, 40% of new servers are being virtualized. This compares to IDC findings that 13% of all servers are virtualized, which implies a higher amount of new shipments being virtualized. We conservatively assumed 29% of all new shipments are being virtualized with that number stepping up in the future. IDC expects 22.3% of all machines being virtualized by 2013 while our Survey respondents expect 61% of their new machines will be virtualized.
4) VMs per server. Next we estimate the number of virtual machines per physical server, with our estimates again based on industry data and inputs from the Credit Suisse IT Survey. We adjust this by the number of virtual machines coming from legacy servers vs. newly created ones. Our survey results point to 13 VMs per machine now and 21 in two years. IDC’s estimate of 6 VMs per server in 2009 and 8.4 in 2013. Our data indicates that 33% of virtual machines are coming from legacy physical servers. This is a critical finding since it points to the fact that only one-third of virtual machines are a result of consolidation with two-thirds a organic workload growth as a result of virtualization. This mitigates the full effect of the consolidation element of virtualization.
5) Physical servers needed to support virtual machines. We calculate the number of physical servers necessary to support the newly created virtual machines, replacing physical servers. Because the consolidation effect is somewhat mitigated by organic VM growth, compression is not as significant as it potentially as it might be otherwise. Nevertheless, there is a significant number of servers annual lost to virtualization, approximately 1.3 million this year and running to 3.2 million units by 2015.
2011E 2012E 2013E 2014E 2015E
2-way over $2,000 server units
Servers needed to maintain installed base 4,595,917 4,498,177 4,501,050 4,755,255 4,612,140 Incremental units in excess of refreshing installed base 1,279,379 1,669,729 1,786,611 1,875,941 1,950,979 Total theortical server demand 5,875,296 6,167,907 6,287,661 6,631,196 6,563,119
% of servers virtualized 29% 33% 40% 50% 55%
Virtualized phys ical servers 1,688,600 2,062,424 2,515,064 3,315,598 3,609,716
Virtual machines per server 12.6 16.1 20.0 22.0 24.0 % of virtual servers coming from legacy physical servers 33% 33% 33% 33% 33%% of virtual servers coming from workload growth 67% 67% 67% 67% 67%Virtual machines per server coming from legacy servers 4.2 5.3 6.6 7.3 7.9 Virtual machines per server coming from organic workload growth 8.5 10.8 13.4 14.7 16.1
Physical virtualized servers meeting demand 405,665 386,996 381,070 456,694 455,772 Non-virtualized servers 4,186,696 4,105,482 3,772,596 3,315,598 2,953,404
Total servers 4,592,361 4,492,478 4,153,667 3,772,292 3,409,176 YoY growth -6.5% -2.2% -7.5% -9.2% -9.6%
Physical servers lost to virtualization 1,282,935 1,675,429 2,133,994 2,858,904 3,153,943
11
33
44
55
22
Source: Gartner, IDC, Credit Suisse estimates.

16 March 2011
IT Hardware 298
UNIX Outlook—in Secular Decline The UNIX market has been in a state of secular decline, with revenue declining at a CAGR of 8% in 2000-2010, as seen in Figure 375. While UNIX servers had long been regarded as eventual mainframe replacements owing to their symmetric multiprocessing capability, scalability and reliability, and ability to extend the platform to the low end of the market, this trend has not quite played out. Mainframes have been resilient to UNIX’s push into the high end. Furthermore, as discussed earlier, x86 servers (particular 2-way over $2,000 and 4-way and above) are becoming increasingly more capable, in large part as result of Intel’s strong processor roadmap. Consequently, we believe the low end of the UNIX market (under $50,000) will erode, as workloads either migrate to x86 or are migrated to bigger UNIX machines. While the low-end UNIX erosion will drive a richer mix within the segment, and as such bolster ASPs, we believe that after declining 14% in revenue terms in 2010, notwithstanding near-term cyclical tailwinds, the UNIX market revenue decline will moderate to 4% in 2011. Through 2015, we expect low-single digit revenue declines for the UNIX market, or a CAGR of 3%.
Figure 375: Credit Suisse Worldwide Server Forecast—UNIX Market Summary Revenue (in $mn) 2005 2006 2007 2008 2009 2010E 2011E 2012E 2013E 2014E 2015E CAGR '05-'10 CAGR '10-'15
UNIX Low-end $0-50k 5,614 5 ,980 5,303 4,685 3,560 3,329 3,162 2 ,970 2,833 2,514 2,376 -9.9% -6.5% Mid-range $50-250k 6,941 6 ,007 6,279 5,443 3,957 3,411 3,106 2 ,873 2,703 2,512 2,343 -13.2% -7.2% High-end >$250k 6,892 6 ,927 7,518 7,553 5,777 4,755 4,771 4 ,814 4,983 5,054 5,096 -7.2% 1.4%Total 19,447 18 ,914 19,101 17,682 13,293 11,495 11,039 10 ,657 10,518 10,081 9,815 -10.0% -3.1%
Seq. change (%) 1.8% -2.7% 1.0% -7.4% -24.8% -13.5% -4.0% -3.5% -1.3% -4.2% -2.6%
Units (in thousands) 2005 2006 2007 2008 2009 2010E 2011E 2012E 2013E 2014E 2015E CAGR '05-'10 CAGR '10-'15
UNIX Low-end $0-50k 459 451 392 335 210 171 145 125 107 88 76 -17.9% -15.0% Mid-range $50-250k 81 69 68 57 42 35 31 28 25 22 20 -15.3% -11.1% High-end >$250k 12 13 12 13 9 9 9 9 9 9 9 -5.9% -0.3%Total 552 532 472 405 262 215 185 161 140 119 104 -17.2% -13.5%
Seq. change (%) -3.7% -3.5% -11.3% -14.2% -35.4% -17.9% -14.2% -12.8% -12.9% -15.4% -12.2%
ASP (in $) 2005 2006 2007 2008 2009 2010E 2011E 2012E 2013E 2014E 2015E CAGR '05-'10 CAGR '10-'15
UNIX Low-end $0-50k 12,244 13 ,273 13,534 13,973 16,915 19,479 21,824 23 ,825 26,536 28,648 31,390 9.7% 10.0% Mid-range $50-250k 85,559 87 ,205 92,389 95,392 93,822 96,349 100,390 104,268 109,886 114,151 119,468 2.4% 4.4% High-end >$250k 572,336 543,371 606,262 583,799 614,162 533,865 543,150 554,401 566,249 571,969 579,512 -1.4% 1.7%Total 35,250 35 ,541 40,450 43,626 50,733 53,409 59,794 66 ,234 75,057 84,990 94,274 8.7% 12.0%
Seq. change (%) 5.7% 0.8% 13.8% 7.9% 16.3% 5.3% 12.0% 10.8% 13.3% 13.2% 10.9%
1) UNIX market revenues continue to decline. High end UNIX should provide some stability to the market, offsetting some of the declines in low-end and mid-range UNIX.
2) Low-end erosion. Low-end UNIX should pace the decline in the market as x86 encroaches on price performance and workloads transition to larger systems.
3) High-end relatively stable. High end systems UNIX systems cannot be yet replicated by x86 on a mass market basis and continue to be a viable mainframe alternative and legacy UNIX consolidation platform. As a result, the segment should see a relative stability.
4) ASPs lurch upward. As a result of significant unit declines in the low-end/mid-range, segment ASPs improve as mix shifts upward.
1
2
3
4
Revenue (in $mn) 2005 2006 2007 2008 2009 2010E 2011E 2012E 2013E 2014E 2015E CAGR '05-'10 CAGR '10-'15
UNIX Low-end $0-50k 5,614 5 ,980 5,303 4,685 3,560 3,329 3,162 2 ,970 2,833 2,514 2,376 -9.9% -6.5% Mid-range $50-250k 6,941 6 ,007 6,279 5,443 3,957 3,411 3,106 2 ,873 2,703 2,512 2,343 -13.2% -7.2% High-end >$250k 6,892 6 ,927 7,518 7,553 5,777 4,755 4,771 4 ,814 4,983 5,054 5,096 -7.2% 1.4%Total 19,447 18 ,914 19,101 17,682 13,293 11,495 11,039 10 ,657 10,518 10,081 9,815 -10.0% -3.1%
Seq. change (%) 1.8% -2.7% 1.0% -7.4% -24.8% -13.5% -4.0% -3.5% -1.3% -4.2% -2.6%
Units (in thousands) 2005 2006 2007 2008 2009 2010E 2011E 2012E 2013E 2014E 2015E CAGR '05-'10 CAGR '10-'15
UNIX Low-end $0-50k 459 451 392 335 210 171 145 125 107 88 76 -17.9% -15.0% Mid-range $50-250k 81 69 68 57 42 35 31 28 25 22 20 -15.3% -11.1% High-end >$250k 12 13 12 13 9 9 9 9 9 9 9 -5.9% -0.3%Total 552 532 472 405 262 215 185 161 140 119 104 -17.2% -13.5%
Seq. change (%) -3.7% -3.5% -11.3% -14.2% -35.4% -17.9% -14.2% -12.8% -12.9% -15.4% -12.2%
ASP (in $) 2005 2006 2007 2008 2009 2010E 2011E 2012E 2013E 2014E 2015E CAGR '05-'10 CAGR '10-'15
UNIX Low-end $0-50k 12,244 13 ,273 13,534 13,973 16,915 19,479 21,824 23 ,825 26,536 28,648 31,390 9.7% 10.0% Mid-range $50-250k 85,559 87 ,205 92,389 95,392 93,822 96,349 100,390 104,268 109,886 114,151 119,468 2.4% 4.4% High-end >$250k 572,336 543,371 606,262 583,799 614,162 533,865 543,150 554,401 566,249 571,969 579,512 -1.4% 1.7%Total 35,250 35 ,541 40,450 43,626 50,733 53,409 59,794 66 ,234 75,057 84,990 94,274 8.7% 12.0%
Seq. change (%) 5.7% 0.8% 13.8% 7.9% 16.3% 5.3% 12.0% 10.8% 13.3% 13.2% 10.9%
1) UNIX market revenues continue to decline. High end UNIX should provide some stability to the market, offsetting some of the declines in low-end and mid-range UNIX.
2) Low-end erosion. Low-end UNIX should pace the decline in the market as x86 encroaches on price performance and workloads transition to larger systems.
3) High-end relatively stable. High end systems UNIX systems cannot be yet replicated by x86 on a mass market basis and continue to be a viable mainframe alternative and legacy UNIX consolidation platform. As a result, the segment should see a relative stability.
4) ASPs lurch upward. As a result of significant unit declines in the low-end/mid-range, segment ASPs improve as mix shifts upward.
11
22
33
44
Source: Gartner Servers Quarterly Statistics Worldwide Database, February 2011. Credit Suisse estimates for 2011-15.
We would highlight the following as the key drivers of the UNIX server market over the next several years:
x86 Unit Growth Eating into UNIX Volumes
As discussed in an earlier section, titled Compelling Price Performance for x86 versus UNIX, we believe that the reasons for UNIX erosion, particularly at sub-$50,000 price points, is that x86 servers now offer compelling price performance relative to low-end UNIX. This is being driven by performance improvements in x86 platform chipsets and a steady chip roadmap from Intel. In addition, higher levels of developer support for x86 is another reason that the platform increases the growth opportunity for the platform. Since developers are creating a broader swath of applications than exist on UNIX platforms, x86 servers address a larger portion of the market. Lastly, since x86 servers make up more than 98% of server shipments, they benefit from significant scale economics.

16 March 2011
IT Hardware 299
UNIX Consolidation Toward Higher-End Machines
As UNIX servers age and come to end of life, IT managers have several options. The first is to migrate the application to x86 servers. This option is attractive because it reduces the lock-in associated with high-priced UNIX systems once and for all, at least for that specific application. While this effort may appear attractive, the migration process can be costly and time consuming, with some estimating a three-year UNIX migration cycle. This can also create bugs in once stable applications. A far simpler approach is to take a number of legacy applications from standalone servers and consolidate them on a bigger server. While this maintains the dependency on higher priced UNIX platforms, it obviates the need to migrate the application, reducing upfront costs and risks. The fact that multiple applications reside on a larger machine reduces overhead costs as well. Indeed, the Credit Suisse IT Survey implies that consolidation is factored into IT purchasing decisions. Low-end and midrange UNIX spending expectations are in decline, while higher-end UNIX sees a moderate increase. (See Figure 376.) We believe this trend will continue, as only 55% of IT managers noted that their UNIX consolidation efforts were complete.
Figure 376: Low-End and Midrange UNIX Spending Expected to Erode what portion of your UNIX spending will go to low-end, midrange and high-end systems?
0.00%
5.00%
10.00%
15.00%
20.00%
25.00%
30.00%
35.00%
1 y ear from now 2 y ears from now 3 y ears from now
Low -end (less than $50k) Mid-range ($50-250k ) High-end (abov e $250k )
Source: Credit Suisse IT Survey, February 2011.
Mainframes—Steadier than Expected The mainframe market has been in gradual decline, with revenue declining at a CAGR of 3.4% in 2000-2010, as seen in Figure 377. We believe the demise of the mainframe market, which has been a topic of discussion for several years, is overstated, as we believe mainframe systems will continue to play an important role in enterprise datacenters for years to come, owing to the need to deal with enterprise-class applications, in which significant compute power, transactional integrity, and the need for high reliability are key requirements. Nevertheless, after having gained 8% in revenue terms in 2010, we believe cyclical and product cycle tailwinds will ebb in mainframe market revenue growth of 5% in 2011 and a 4% decline in 2012. Our survey points to only slight mainframe declines ahead. (See Figure 378.)

16 March 2011
IT Hardware 300
Figure 377: Credit Suisse Worldwide Server Forecast—Mainframe Summary
1) Mainframe market not going away. Despite fears that the mainframe market will see massive declines as firms transition to lower cost systems, we anticipate that the market will remain relatively stable, if not growing.
2) Stable demand. Increasing demand from emerging markets and increasing capacity requirements should mitigate mainframe migrations, which are likely at the late stages. Nevertheless, major mainframe cycles are likely to create bumps in demand along the way.
3) Competitive dynamic supports ASPs. IBM now has accounts for the preponderance of mainframe share and new installations. This mitigates the need for aggressive price competition.
Revenue (in $mn) 2005 2006 2007 2008 2009 2010 2011E 2012E 2013E 2014E 2015E CAGR '05-'10 CAGR '10-'15
Mainframe 6,530 6,782 5,981 6,524 5,064 5,448 5,745 5,487 5,758 5,587 5,365 -3.6% -0.3%Seq. change (%) -9.5% 3.9% -11.8% 9.1% -22.4% 7.6% 5.5% -4.5% 4.9% -3.0% -4.0%
Units (in thousands) 2005 2006 2007 2008 2009 2010 2011E 2012E 2013E 2014E 2015E CAGR '05-'10 CAGR '10-'15
Mainframe 5 5 4 5 4 4 4 4 4 4 4 -4.7% -0.3%Seq. change (%) -13.3% 2.1% -16.0% 14.6% -19.4% -1.1% 2.6% -4.5% 6.0% -2.0% -3.0%
ASP (in $) 2005 2006 2007 2008 2009 2010 2011E 2012E 2013E 2014E 2015E CAGR '05-'10 CAGR '10-'15
Mainframe 1,370,762 1,394,445 1,463,183 1,392,423 1,341,006 1,457,963 1,498,492 1,498,304 1,483,321 1,468,488 1,453,803 1.2% -0.1%Seq. change (%) 4.3% 1.7% 4.9% -4.8% -3.7% 8.7% 2.8% 0.0% -1.0% -1.0% -1.0%
1
2
3
1) Mainframe market not going away. Despite fears that the mainframe market will see massive declines as firms transition to lower cost systems, we anticipate that the market will remain relatively stable, if not growing.
2) Stable demand. Increasing demand from emerging markets and increasing capacity requirements should mitigate mainframe migrations, which are likely at the late stages. Nevertheless, major mainframe cycles are likely to create bumps in demand along the way.
3) Competitive dynamic supports ASPs. IBM now has accounts for the preponderance of mainframe share and new installations. This mitigates the need for aggressive price competition.
Revenue (in $mn) 2005 2006 2007 2008 2009 2010 2011E 2012E 2013E 2014E 2015E CAGR '05-'10 CAGR '10-'15
Mainframe 6,530 6,782 5,981 6,524 5,064 5,448 5,745 5,487 5,758 5,587 5,365 -3.6% -0.3%Seq. change (%) -9.5% 3.9% -11.8% 9.1% -22.4% 7.6% 5.5% -4.5% 4.9% -3.0% -4.0%
Units (in thousands) 2005 2006 2007 2008 2009 2010 2011E 2012E 2013E 2014E 2015E CAGR '05-'10 CAGR '10-'15
Mainframe 5 5 4 5 4 4 4 4 4 4 4 -4.7% -0.3%Seq. change (%) -13.3% 2.1% -16.0% 14.6% -19.4% -1.1% 2.6% -4.5% 6.0% -2.0% -3.0%
ASP (in $) 2005 2006 2007 2008 2009 2010 2011E 2012E 2013E 2014E 2015E CAGR '05-'10 CAGR '10-'15
Mainframe 1,370,762 1,394,445 1,463,183 1,392,423 1,341,006 1,457,963 1,498,492 1,498,304 1,483,321 1,468,488 1,453,803 1.2% -0.1%Seq. change (%) 4.3% 1.7% 4.9% -4.8% -3.7% 8.7% 2.8% 0.0% -1.0% -1.0% -1.0%
11
22
33
Source: Gartner Servers Quarterly Statistics Worldwide Database, February 2011. Credit Suisse estimates for 2011-15.
We believe the following are the key drivers of mainframe server revenue over the next several years:
Workload Migration Already in Late Stages
While there has always been a fear that workloads would migrate from mainframe environments to lower-cost UNIX environments, we believe that the majority of the shift in workloads from a mainframe environment toward UNIX has already occurred. As such, we do not expect the migration of workloads to result in an accelerated decline in mainframe units and revenues. Indeed, respondents to the Credit Suisse IT Survey pointed to slight declines in mainframe spending in the out years. (See Figure 378.)
Figure 378: Our Survey Indicates Only Minor Declines for Mainframe Spending how do you expect your spending on mainframe hardware to change over the following periods of time?
-6.0%
-4.0%
-2.0%
0.0%
2.0%
4.0%
6.0%
In the nex t y ear In the nex t 3 y ears In the nex t 5 y ears
Source: Credit Suisse IT Survey, February 2011.
Emerging Markets Still a Driver of Mainframe Growth
Another driver of mainframe growth, highlighted by IBM management, is emerging markets, where companies are deploying mainframe architectures for mission critical infrastructure. In a recent eWEEK interview (November 2010), the general manager for power and z system technologies in IBM’s systems and technology group Tom Rosamilla noted that over the past year, customers including the First National Bank of Namibia,

16 March 2011
IT Hardware 301
Comepay in Russia, and BC Card, and Dongbu Insurance in Korea were all moving to the mainframe for the first time. Furthermore, at the Credit Suisse technology conference in December 2010, the global head of IBM research Dr. John Kelly highlighted IBM’s mainframe success in the Chinese banking sector. Growth in emerging markets, particularly in Asia-Pacific and Latin America, is detailed in Figure 379.

16 March 2011
IT Hardw
are 302
Figure 379: IBM Mainframes Are a Growth Business in Emerging Markets
2002 2003 2004 2005 2006 2007 2008 2009 2010 CAGR '02-'10
Developed market 3,718 3,556 3,898 3,528 4,235 3,596 4,031 2,712 3,144 -2.1%% of market 83% 80% 79% 78% 81% 77% 79% 73% 73%YoY growth -4% 10% -9% 20% -15% 12% -33% 16%
USA/Canada 1,620 1,506 1,827 1,905 2,447 1,911 2,159 1,543 1,910 2.1%% of market 36% 34% 37% 42% 47% 41% 42% 41% 44%YoY growth -7% 21% 4% 28% -22% 13% -29% 24%
Western Europe 1,607 1,680 1,657 1,341 1,510 1,408 1,588 909 979 -6.0%% of market 36% 38% 34% 30% 29% 30% 31% 24% 23%YoY growth 5% -1% -19% 13% -7% 13% -43% 8%
Japan 491 370 414 282 277 277 284 260 255 -7.9%% of market 11% 8% 8% 6% 5% 6% 6% 7% 6%YoY growth -25% 12% -32% -2% 0% 3% -8% -2%
Emerging Market 755 912 1,025 1,001 1,001 1,045 1,079 1,015 1,158 5.5%% of market 17% 20% 21% 22% 19% 23% 21% 27% 27%YoY growth 21% 12% -2% 0% 4% 3% -6% 14%
Asia/Pacific 400 388 466 344 326 501 420 483 620 5.7%% of market 9% 9% 9% 8% 6% 11% 8% 13% 14%YoY growth -3% 20% -26% -5% 54% -16% 15% 28%
Eastern Europe 59 69 83 46 69 76 81 42 28 -9.1%% of market 1% 2% 2% 1% 1% 2% 2% 1% 1%YoY growth 17% 20% -44% 49% 10% 7% -48% -35%
Lat in America 237 359 386 465 508 394 501 423 440 8.1%% of market 5% 8% 8% 10% 10% 8% 10% 11% 10%YoY growth 52% 7% 20% 9% -23% 27% -16% 4%
Middle Eas t & Africa 60 95 89 146 98 75 77 66 70 2.0%% of market 1% 2% 2% 3% 2% 2% 2% 2% 2%YoY growth 58% -6% 63% -33% -24% 3% -13% 6%
Total 4,474 4,468 4,922 4,529 5,236 4,641 5,110 3,727 4,302 -0.5%YoY growth 0% 10% -8% 16% -11% 10% -27% 15%
1) Mainframe declines in mature market. The transition away from legacy mainframe environments in mature markets is understandable given the increased availability of less expensive compute options.
2) …but this overlooks mainframe’s viability as a key component of core infrastructure. Mainframes are being implemented as part of core infrastructure in greenfield sites (non-legacy environments). This highlights mainframe’s longer term viability.
3) Emerging markets offset developed market declines. Emerging markets are an increasing portion of mainframe market, accounting for approximately ~30%. This could reduce downward pressure on market with time.
1
2
3
2002 2003 2004 2005 2006 2007 2008 2009 2010 CAGR '02-'10
Developed market 3,718 3,556 3,898 3,528 4,235 3,596 4,031 2,712 3,144 -2.1%% of market 83% 80% 79% 78% 81% 77% 79% 73% 73%YoY growth -4% 10% -9% 20% -15% 12% -33% 16%
USA/Canada 1,620 1,506 1,827 1,905 2,447 1,911 2,159 1,543 1,910 2.1%% of market 36% 34% 37% 42% 47% 41% 42% 41% 44%YoY growth -7% 21% 4% 28% -22% 13% -29% 24%
Western Europe 1,607 1,680 1,657 1,341 1,510 1,408 1,588 909 979 -6.0%% of market 36% 38% 34% 30% 29% 30% 31% 24% 23%YoY growth 5% -1% -19% 13% -7% 13% -43% 8%
Japan 491 370 414 282 277 277 284 260 255 -7.9%% of market 11% 8% 8% 6% 5% 6% 6% 7% 6%YoY growth -25% 12% -32% -2% 0% 3% -8% -2%
Emerging Market 755 912 1,025 1,001 1,001 1,045 1,079 1,015 1,158 5.5%% of market 17% 20% 21% 22% 19% 23% 21% 27% 27%YoY growth 21% 12% -2% 0% 4% 3% -6% 14%
Asia/Pacific 400 388 466 344 326 501 420 483 620 5.7%% of market 9% 9% 9% 8% 6% 11% 8% 13% 14%YoY growth -3% 20% -26% -5% 54% -16% 15% 28%
Eastern Europe 59 69 83 46 69 76 81 42 28 -9.1%% of market 1% 2% 2% 1% 1% 2% 2% 1% 1%YoY growth 17% 20% -44% 49% 10% 7% -48% -35%
Lat in America 237 359 386 465 508 394 501 423 440 8.1%% of market 5% 8% 8% 10% 10% 8% 10% 11% 10%YoY growth 52% 7% 20% 9% -23% 27% -16% 4%
Middle Eas t & Africa 60 95 89 146 98 75 77 66 70 2.0%% of market 1% 2% 2% 3% 2% 2% 2% 2% 2%YoY growth 58% -6% 63% -33% -24% 3% -13% 6%
Total 4,474 4,468 4,922 4,529 5,236 4,641 5,110 3,727 4,302 -0.5%YoY growth 0% 10% -8% 16% -11% 10% -27% 15%
1) Mainframe declines in mature market. The transition away from legacy mainframe environments in mature markets is understandable given the increased availability of less expensive compute options.
2) …but this overlooks mainframe’s viability as a key component of core infrastructure. Mainframes are being implemented as part of core infrastructure in greenfield sites (non-legacy environments). This highlights mainframe’s longer term viability.
3) Emerging markets offset developed market declines. Emerging markets are an increasing portion of mainframe market, accounting for approximately ~30%. This could reduce downward pressure on market with time.
11
22
33
Source: Gartner.

16 March 2011
IT Hardware 303
Product Cycles to Dictate Growth Trajectory
Notwithstanding growth in emerging markets, we believe mainframe market revenue growth will largely be driven by product cycles. We think it is reasonable to look at the relationship between IBM’s mainframe product releases and corresponding revenue growth, as IBM now holds an 85% share in mainframes, and, as such, is a good proxy for the mainframe market. Figure 380 highlights the strong correlation between IBM’s mainframe revenue growth and new product introductions.

16 March 2011
IT Hardw
are 304
Figure 380: IBM Mainframe MIPS and Revenues Correlate Strongly with New Product Introductions
-60.0%
-40.0%
-20.0%
0.0%
20.0%
40.0%
60.0%
80.0%
100.0%
120.0%
1Q00 4Q00 3Q01 2Q02 1Q03 4Q03 3Q04 2Q05 1Q06 4Q06 3Q07 2Q08 1Q09 4Q09 3Q10
MIPS Rev enue
2
z9 BC: 4/27/2006 z10 BC : 10/21/2008
z900: 12/14/2000 z990: 5/13/2003 z9 EC: 9/16/2005 z10 EC: 2/26/2008 zEnterprise: 9/23/2010
z800: 2/18/2002 z890: 4/7/2004
1
2
Mainframe refresh cycles result in a significant revenue boost:
1) High end. High end mainframes (enterprise class) refresh cycles come first and result in the most significant boost.
2) Lower end. Lower end mainframes (business class) provide an incremental boost in the cycle.
-60.0%
-40.0%
-20.0%
0.0%
20.0%
40.0%
60.0%
80.0%
100.0%
120.0%
1Q00 4Q00 3Q01 2Q02 1Q03 4Q03 3Q04 2Q05 1Q06 4Q06 3Q07 2Q08 1Q09 4Q09 3Q10
MIPS Rev enue
2
z9 BC: 4/27/2006z9 BC: 4/27/2006 z10 BC : 10/21/2008z10 BC : 10/21/2008
z900: 12/14/2000z900: 12/14/2000z900: 12/14/2000 z990: 5/13/2003z990: 5/13/2003z990: 5/13/2003 z9 EC: 9/16/2005z9 EC: 9/16/2005z9 EC: 9/16/2005 z10 EC: 2/26/2008z10 EC: 2/26/2008z10 EC: 2/26/2008 zEnterprise: 9/23/2010zEnterprise: 9/23/2010zEnterprise: 9/23/2010
z800: 2/18/2002z800: 2/18/2002 z890: 4/7/2004z890: 4/7/2004
11
22
Mainframe refresh cycles result in a significant revenue boost:
1) High end. High end mainframes (enterprise class) refresh cycles come first and result in the most significant boost.
2) Lower end. Lower end mainframes (business class) provide an incremental boost in the cycle.
Source: Company data, Credit Suisse.

16 March 2011
IT Hardware 305
Servers – Winners and Losers Given our relatively negative outlook for overall server market growth, we believe a system vendor’s server revenue growth needs to largely be driven by share gains. To assess which vendors are best positioned to gain share, we have developed a proprietary scorecard to evaluate key server vendors across seven metrics that we think are important for success in the server market. We then score each of the key vendors across each metric and use the aggregate score for each vendor to develop a ranking. This allows us to develop a bias on how server market shares are likely to evolve going forward. Overall, based on the results of our scorecard, we would highlight the following:
■ IBM, with slightly under 31% server market share in 2010, ranks first on our scorecard. IBM remains focused on the high end across systems. In the mainframe market, IBM is the dominant vendor, with 85% market share. Mainframe revenues are likely to be stable by emerging markets, and this should help IBM gain share as the broader server market erodes. The company has made significant investments in its POWER (UNIX) processor and as a result, is well positioned to at least maintain its UNIX market share (43% in 2010), albeit in a secularly pressured market. With the high end of UNIX expected to be relatively more stable than the rest of the segment, IBM should benefit in relative terms. IBM’s high-end focus continues through to x86 systems, in which market share was about 17% in 2010. While the company lags both Dell and HP in the important price performance metric, the company is well positioned on virtually every other metric that we deem essential for success in the server market, including maintenance/support, management functionality, roadmap, ability to bundle, broad distribution, and strong existing relationships in the enterprise. Nevertheless, high-end x86 encroachment by converged vendor Cisco and lack of exposure to the low end could limit the company’s x86 share gains over time.
■ HP, with more than 31% share in 2010, ranks second on our overall scorecard. HP has a mixed portfolio of x86 and Itanium-based servers, with a leading position in x86, supported by strong enterprise-class support and management capabilities. While Dell edges out HP on the critical price/performance metric, and while IBM leads on product portfolio/roadmap, HP ranks highly on all the other key metrics essential for success in the server market, including maintenance/support, management functionality, ability to bundle, broad distribution, and strong existing relationships in the enterprise. HP’s Itanium/UNIX platform (in which HP has 29% UNIX share) is susceptible to secular declines in the UNIX market, but the company is well positioned to benefit from workloads shifting from UNIX to x86 systems, given its dominant 38% x86 share, although admittedly the economics are not an ideal trade-off. We believe HP is likely to see its share position decline as a result of the shrinking UNIX market, low exposure to growing x86 segments, and increased competition from IBM, Cisco, and Dell in core segments, (i.e., those focused on virtualized x86 systems.)
■ Dell, with 15% server market share in 2010, ranks third on our scorecard. Dell is the only Tier 1 server vendor that has a portfolio composed solely of x86. As such, the company has no exposure to secular pressures affecting the UNIX and mainframe markets. Further, while Dell scores highly on price performance, which is a critical metric in the server market, the company falls short on maintenance/support, management functionality, and roadmap relative to peers HP and IBM. As such, despite the lack of legacy exposure being a positive, the unique advantage of being viewed as a price performance leader puts Dell in a precarious position in terms of pricing. This is potentially an issue going forward, given increasing share of low-end servers and ever rising share of white-box vendors in that segment. Furthermore, increasing competition in larger, virtualization-geared systems is likely to be a headwind. These factors, coupled with the company’s focus on profitable growth, are likely to cause, Dell’s x86 server market share of 23% to be vulnerable over time.

16 March 2011
IT Hardware 306
■ Sun/Oracle, with 6% server market share in 2010, ranks fourth on our scorecard. We believe Sun/Oracle’s UNIX exposure (21% share) will continue to be a headwind, as the company is most exposed to low-end UNIX, which faces the most severe headwinds, and where workloads are likely to migrate to cheaper, high-performing x86 systems.
■ Cisco, with <1% server market share in 2010, ranks fifth on our scorecard, but is one to watch. Despite poor price performance and low to mediocre rankings across all metrics, we believe that a focus on high-end x86 systems, strong management functionality, a product geared toward solving the management challenges virtualization presents, and Cisco’s existing distribution suggest that Cisco could make inroads in the market, although this will likely take time. While Cisco’s server business was only on a $650mn annual run rate in the most recent quarter, we believe the company’s existing enterprise footprint suggests the opportunity for longer-term share gains.

16 March 2011
IT Hardw
are 307
Figure 381: Credit Suisse Server Vendor Scorecard—IBM Ranks First, Followed by HP and Dell
MetricWeight
Rank (weighted) 1 2 3 4 5Score (weighted) 7.8 7.7 6.8 5.8 5.2
Rank server market share, % 2 1 3 4 5Global server revenue share (2010) 30.8% 31.4% 14.7% 6.3% 0.7%
Key metrics: Price/ Performance 26% 6 7 9 5 4 Maintenance/ Support 24% 8 9 7 6 4 Management Functionality 20% 8 9 4 6 7 Portfolio and Roadmap (historical/futures) 15% 9 5 8 6 7 Ability to bundle 5% 9 8 3 7 6 Distribution 5% 9 9 7 6 4 Sales / Existing relationships 5% 8 9 5 6 5
Sun/Oracle CiscoIBMVendor HP Dell
IBM ranks first in our scorecard with high scores in most scorecard metrics being offset by a mediocre scores for price/ performance, which is largely a function of the company’s UNIX and mainframe exposure. Overall, we believe IBM is well positioned to maintain share going forward.
HP ranks second in our scorecard with good scores on most metrics being offset by lower scores on price performance (UNIX exposure) and product portfolio/roadmap. Overall, we believe HP’s leading share will decline as a result of the shrinking UNIX market, low exposure to growing x86 segments and increased competition in core segments, i.e., those focused on virtualized x86 systems.
Dell ranks third in our scorecard with a leading score in price/ performance being offset by low scores in management functionality, bundling ability and existing sales relationships. Increasing competition in virtualization-geared systems coupled with the company’s focus on profitable growth, makes Dell’s x86 server market share vulnerable over time.
Sun/Oracle ranks fourth on our scorecard as lower price/performance and a UNIX focused portfolio offset the company’s ability to offer a bundled solution. However, due to the company’s strength in both database and middleware software and growing market share in enterprise applications, the Credit Suisse Software Team believes that Oracle continues to build a robust and growing pipeline for the Oracle Exadata Database Machine and that the recently introduced Oracle Exalogic Elastic Cloud has generated strong initial interest.
Cisco ranks fifth on our scorecard. While the company is a relative new entrant to the server market with under 1% market share currently, Cisco’s strong management capability and roadmap targeting virtualized architectures suggests the potential for share gains longer term.
1
3
4
5
2
3
3
4
21 4
2
5
MetricWeight
Rank (weighted) 1 2 3 4 5Score (weighted) 7.8 7.7 6.8 5.8 5.2
Rank server market share, % 2 1 3 4 5Global server revenue share (2010) 30.8% 31.4% 14.7% 6.3% 0.7%
Key metrics: Price/ Performance 26% 6 7 9 5 4 Maintenance/ Support 24% 8 9 7 6 4 Management Functionality 20% 8 9 4 6 7 Portfolio and Roadmap (historical/futures) 15% 9 5 8 6 7 Ability to bundle 5% 9 8 3 7 6 Distribution 5% 9 9 7 6 4 Sales / Existing relationships 5% 8 9 5 6 5
Sun/Oracle CiscoIBMVendor HP Dell
IBM ranks first in our scorecard with high scores in most scorecard metrics being offset by a mediocre scores for price/ performance, which is largely a function of the company’s UNIX and mainframe exposure. Overall, we believe IBM is well positioned to maintain share going forward.
HP ranks second in our scorecard with good scores on most metrics being offset by lower scores on price performance (UNIX exposure) and product portfolio/roadmap. Overall, we believe HP’s leading share will decline as a result of the shrinking UNIX market, low exposure to growing x86 segments and increased competition in core segments, i.e., those focused on virtualized x86 systems.
Dell ranks third in our scorecard with a leading score in price/ performance being offset by low scores in management functionality, bundling ability and existing sales relationships. Increasing competition in virtualization-geared systems coupled with the company’s focus on profitable growth, makes Dell’s x86 server market share vulnerable over time.
Sun/Oracle ranks fourth on our scorecard as lower price/performance and a UNIX focused portfolio offset the company’s ability to offer a bundled solution. However, due to the company’s strength in both database and middleware software and growing market share in enterprise applications, the Credit Suisse Software Team believes that Oracle continues to build a robust and growing pipeline for the Oracle Exadata Database Machine and that the recently introduced Oracle Exalogic Elastic Cloud has generated strong initial interest.
Cisco ranks fifth on our scorecard. While the company is a relative new entrant to the server market with under 1% market share currently, Cisco’s strong management capability and roadmap targeting virtualized architectures suggests the potential for share gains longer term.
11
33
44
55
22
33
33
44
2211 44
22
55
Source: Company data, Credit Suisse estimates.

16 March 2011
IT Hardware 308
What Makes a Server Vendor Competitive? Based on the Credit Suisse IT Survey, as seen in Figure 382, the most important attributes for a server vendor are price/performance and maintenance/support, followed by management tools, a strong roadmap, and the ability to provide a complete solution. The “speeds and feeds” discussion and the associated price is only a part of the server purchasing decision. This is especially important when considering x86 servers, where a system can be integrated using off-the-shelf components. Indeed, looking at factors cumulatively explains not only current market share but helps understand the competitive dynamic and as a result, its durability. With this in mind, we rank order and assess the competitiveness of server vendors along these attributes on our server scorecard.
Figure 382: Price Performance Is the Most Important Factor When Considering a Server Purchase what makes a competitive server vendor? please rank in order.
0 1 2 3 4 5 6 7 8
Other
Sales/Ex isting Relationship
Distribution
Ability to prov ide a complete solution (storage, netw orking)
Roadmap (historical/futures)
Management/Env ironmental
Maintenance/Support
Price/Performance
Source: Credit Suisse IT Survey, February 2011.
Price Performance Based on the Credit Suisse IT Survey (Figure 382), over 60% of respondents cited price/performance as a key driver for selecting a given server vendor. This is intuitive, given that users generally want to derive the greatest amount of compute per dollar, especially on relatively interchangeable and for the most part, standardized x86 systems. Based on our analysis of the survey results depicted in Figure 383, Dell is best positioned from a price/performance standpoint, while Cisco is worst positioned.

16 March 2011
IT Hardware 309
Figure 383: Dell Leads All Vendors in the Critical Price Performance Metric please rate the following server vendors across price/performance, using the following scale: 1 = Very poor performance 5 = Excellent performance
2 2.5 3 3.5 4 4.5
Cisco UCS
Fujitsu
Sun/Oracle
IBM
HP
Dell
Source: Credit Suisse IT Survey, February 2011.
Gartner data too shows that Dell has the least expensive x86 systems by the amount of processors, with HP closely following and IBM, Sun/Oracle, and Cisco being more expensive, on average. While we acknowledge that this is an advantage in a market that seeks the best performance per dollar, it can also be a detriment from the perspective that customers expect the lowest-cost server from Dell. Being the low-cost distributor of servers potentially could constrict the company’s ability to boost margins, one of its longer-term objectives.
Figure 384: Dell Is the Lowest-Cost Server Provider Across Categories
-
5,000
10,000
15,000
20,000
25,000
Dell HP IBM Sun/Oracle Cisco
1-w ay 2-w ay 4-w ay and abov e
Source: Gartner.
While most x86 servers use similar processors, there is differentiation on how vendors integrate the system, building IP around the processor. To see if a particular vendor delivered higher virtualization performance per dollar, we examined the various server vendors’ price performance by looking at dollars per VMmark score for both 2-way and 4-way servers. Purely on a performance metric, we found that vendors cannot differentiate based on performance, and the advantage comes down to pure price. Indeed, across all systems, both 2-way and 4-way, system performance deviated only 2% on average. As

16 March 2011
IT Hardware 310
seen in Figure 385, for 2-way servers, Dell scores well owing to a lower system cost, with IBM coming in a strong number two. HP appears to be weak across the board, given a more expensive x86 offering submitted for test as do Cisco and Sun/Oracle. This is purely a raw performance metric and vendors differentiate on other points (i.e., management, support, etc.,), but on pure performance, expensive systems do not outperform less expensive ones.
Figure 385: More Expensive Systems Do Not Outperform Less Expensive Ones on the VMware Virtualization Metric 2 Way Virtualization Benchmark
$5 0
$ 10 0
$ 15 0
$ 20 0
$ 25 0
$ 30 0
$ 35 0
$ 40 0
Sun Fir eX4 27 0
Cisco UC SB20 0 M1
SG I XE2 70 HP ProL ian tBL 49 0c G 6
IBMBla de cen ter
H S22
HP Pro Lia ntDL3 80 G6
Fujits uR X2 00 S5
IBM Sys temx 36 50 M2
De llPo we rEd ge
R71 0
De llPo wer Edg e
M 61 0
L en ovoR52 5 G 2
In spu rNF5 28 0
$ Pe
r VM
mar
k Sc
ore
4 Way Vir tualization Benc hmark
$100
$150
$200
$250
$300
Cisco UCS C460 M1 Fujitsu RX600 S5 Dell PowerEdge R910
$ per
VMma
rk sc
ore
Source: Gartner, VMmark, Credit Suisse.
As discussed in the server demand section above, x86 is increasingly eroding the performance advantage against UNIX-based systems. As highlighted earlier, Intel’s frequency of processor updates provide a significant advantage in increasing performance over time. Indeed, as detailed in the server demand section, x86 servers are significantly less expensive than UNIX systems while offering more performance. IBM’s POWER processor outperforms x86, but this comes at a higher price.
Maintenance and Support Similar to management functionality, a strong maintenance and support offering is a key factor of server market share. Maintenance and support is a category that encompasses both the quality of support and how satisfied or confident IT managers are with a given vendor’s support quality as well as a vendors global footprint. The quality element of support, if poor, can inhibit a vendor’s ability to penetrate the margin-rich datacenter core. Generally, vendors with more history in the enterprise segment rank well on quality of support. The breadth of maintenance and support allows vendor to provide these services on a global basis. While having a global footprint is less important for small businesses, it is quite important for larger enterprise clients. This is because the larger a business is, the more likely it is to have an extended international presence and with that, dispersed hardware that will require maintenance and support. The globally dispersed hardware of a multinational is most likely to be serviced by a Tier 1 server vendor with a global support presence. Based on the results of the Credit Suisse IT Survey, and as shown in Figure 386, HP is best positioned to provide maintenance and support, followed by IBM and Dell. We suspect that Cisco’s low score on this metric is likely owing to the company’s UCS offering being in the early stages of adoption. Indeed, this maintenance and support element is in part responsible for Tier 1 server vendors holding a relatively consistent share in what is deemed a “commodity” market. (See Figure 387.) Over time, we believe this paradigm can weaken in part, as the growth of low-end 2-way servers under $2,000 ramps up.

16 March 2011
IT Hardware 311
Figure 386: HP Leads the Pack in Maintenance and Support please rate the following server vendors across maintenance/support, using the following scale: 1 = Very poor performance 5 = Excellent performance
Figure 387: Tier 1 Servers Continue to Maintain Share in the x86 Server Market in Part as a Result of Support % of total x86 revenues and units
2 2.5 3 3.5 4 4.5
Cisco UCS
Fujitsu
Sun/Oracle
Dell
IBM
HP
60%62%64%66%68%70%72%74%76%78%80%82%
2006 2007 2008 2009 2010
Rev enue Unit
Source: Credit Suisse IT Survey, February 2011. Source: Gartner.
Management Functionality IT hardware vendors often invoke performance details in headlines, and “speeds and feeds”, but the details around management functionality remain murky. Nevertheless, we believe differences in system management are a key contributor to vendor market share and the basis of market entry for new vendors. Cisco in servers and HP in converged infrastructure are examples here. Management functionality includes key software required to manage and monitor a server environment, which can get rather complex in large enterprise environments, especially those that are virtualized and distributed across several geographies. Given the subjectivity involved in assessing a vendor’s management tools, we think this metric across vendors is best addressed by a survey, as it gives us feedback from actual users of the various vendors’ management tools. Based on the results of the Credit Suisse IT Survey (Figure 388), HP is best positioned to provide maintenance and support, followed by IBM and Sun/Oracle. We suspect that Cisco’s low score on this metric is a function of low penetration of UCS and the fact that it is a relatively new product.
Over time, systems management should remain quite important, as the increasing adoption of virtualization and the associated massive workload growth (the Credit Suisse IT Survey points to 36% workload growth over the next five years, and IDC points to 70% of all server workloads being virtualized) strains IT managers. The issue is that virtualized workloads can grow much more quickly than physical workloads owing to that fact that a physical machine can hold in excess of ten virtual servers. Indeed, EMC pointed to the number of virtual machines exceeding the number of virtual servers in 2009.
Given the rising tide of virtualization, associated management functionality is likely to remain a key factor for vendor positioning. With this, it is evident that vendors are looking to leverage this aspect with “converged” offerings, with one to key selling points being a single pane of glass management. Indeed, according to IDC’s June 2010 survey, entitled Considering All of IT: Converged Infrastructure Survey Findings, 46% of respondents interested in these types of offerings were most focused in the virtualization and automation aspects. Similarly, the higher the penetration of virtualization within a corporation, the more attuned IT departments are to converged infrastructure. (See Figure

16 March 2011
IT Hardware 312
389.) While cost savings were the primary rationale, simplified management was a strong second.
Figure 388: HP Rates Highest in Management Functionality please rate the following server vendors across management functionality, using the following scale: 1 = Very poor performance 5 = Excellent performance
2 2.5 3 3.5 4 4.5
Fujitsu
Dell
Cisco UCS
Sun/Oracle
IBM
HP
Source: Credit Suisse IT Survey, February 2011.
Figure 389: Virtualization Penetration Increases Converged Infrastructure Consideration rate how likely is it that your organization will utilize a converged computing environment over the next three years
Figure 390: Simplified Management Is a Key Driver what do you see as the top 2 major benefits to converged computing?
Source: Company data, Credit Suisse estimates. Source: Company data, Credit Suisse estimates.
HP is the leading beneficiary of the converged infrastructure trend, with 30% of respondents to IDC’s survey using or planning on using the company’s product offering. Interestingly, while HP leads in mindshare on converged infrastructure, Cisco and IBM are relatively close in second and third place. (See Figure 391.) The poll results are much

16 March 2011
IT Hardware 313
closer than one would consider, given what the market share positions of Cisco’s UCS and IBM’s BladeCenter (a core CloudBurst product) would indicate. (See Figure 393.) One of the key reasons for this could be what systems vendors prefer to converge. HP has a discernable lead when customers want to converge servers and storage, but the lead fades as networking factors in. (See Figure 392.) With converged infrastructure situated strategically, both in terms of allowing vendors to extend their management framework within datacenters and bundle additional products (storage, servers, networking, and software), there are several caveats to the opportunity that create pause. First, our Credit Suisse IT Survey pointed to a significant portion (43%) of IT decision makers not wanting to commit to a single vendor, although for those that want to, HP and IBM top the list, followed by UCS/EMC. (See Figure 396.) This effectively shrinks the market opportunity, in our view. Second, blade servers, a key component of converged infrastructure, appear to be slowing in growth, with the penetration rate of x86 blades to overall x86 servers decelerating as well. (See Figure 394.) In the fourth quarter of 2010, blades composed 24% of the x86 server market, versus 23% a year prior. Looking ahead, continued blade penetration could predict whether converged infrastructure is transitioning from a consideration to actually being purchased and whether HP and IBM can leverage their core management strengths further.
Figure 391: HP Takes Advantage of Management to Lead in Converged Infrastructure . . . which vendor’s converged computing solution are you considering/currently using?
Figure 392: . . .But This Lead Fades When Networking Is Factored In which vendor’s converged computing solution are you considering/currently using?
Source: IDC. Source: IDC.

16 March 2011
IT Hardware 314
Figure 393: HP Poses a Commanding Lead in Blades
0%
10%
20%
30%
40%
50%
60%
2006 Q1 2006 Q3 2007 Q1 2007 Q3 2008 Q1 2008 Q3 2009 Q1 2009 Q3 2010 Q1 2010 Q3
HP IBM Cisco Dell Sun/Oracle
Source: Company data, Credit Suisse estimates.
Figure 394: Blades Could Be Transitioning to Slower Growth
0%
5%
10%
15%
20%
25%
30%
35%
2006 Q1 2006 Q3 2007 Q1 2007 Q3 2008 Q1 2008 Q3 2009 Q1 2009 Q3 2010 Q1 2010 Q3
Source: Company data, Credit Suisse estimates.
Cisco’s UCS—Impressive Technology, but a Long Way from Mainstream Adoption
With its Unified Computing System (UCS) offering, Cisco entered the server market with a broad, flexible data center strategy that bundles servers, networking, and management software into a modular, cohesive architecture that can be managed as a single entity. This architecture is optimized for virtualization and cloud computing implementations, which, as we will detail, works for and against the adoption of Cisco’s UCS products. At the core of Cisco’s UCS architecture is the tight integration of internally developed networking and server building blocks that leverage Cisco’s significant IP and innovation in networking, memory, and I/O. To complete the offering, Cisco partners with EMC or NetApp for storage and VMware for virtualization software, and systems management software vendors like BMC and Microsoft. This combination of products is aimed at competing with IBM and HP, which both have comprehensive data center offerings, from underlying hardware through the management layer. In order to gain a greater datacenter

16 March 2011
IT Hardware 315
footprint, Cisco entered the server market, as it was losing leverage by not directly controlling the server IP. Nevertheless, while awareness of UCS is strong relative to the product’s time on the market, a substantive portion of IT decision makers still have not evaluated the product. (See Figure 395.)
Figure 395: Almost Half of Our Survey Respondents Have Not Evaluated Cisco’s UCS have you evaluated / are you evaluating Cisco's UCS offering?
Yes, ev aluating23%
Yes, w ill likely purchase in the nex t 12 months
10%Yes, y et w ill not likely purchase
in the nex t 12 months18%
No46%
Hav e nev er heard of it3%
Source: Credit Suisse IT Survey, February 2011.
A customer evaluating Cisco’s UCS products is generally not looking only to buy servers, but instead is looking for a comprehensive data center solution that includes servers, networking, management tools, and storage. Cisco’s UCS offering is typically more expensive relative to other server products on the market, as respondents to our survey noted previously. Where UCS attempts to compete, however, is on simplicity and TCO for large-scale deployments, as it offers management tools that are optimized for utilizing computing and networking resources as “pools.” With this paradigm, data center deployments would require less cabling (reducing failure rates) and less service provisioning time (leveraging IT headcount) for additional computing resources, and to that end improved overall management of the growing numbers of virtualized machines. As part of this framework, UCS attempts to increase virtual machine density (more virtualized computers per server) by adding more memory.
Cisco is experiencing early success with UCS, claiming over 4,000 customers and an annualized revenue run rate of $650mn (nearly 7x year-over-year growth) at the end of February 2011. With less than 1% of server market share, however, Cisco has a considerable way to go in order to catch up with HP, IBM, and Dell in the server market. Cisco has had the luxury of building high-performance data center architecture from the ground up (with little hindrance from legacy technology), and although UCS may enjoy a management advantage, HP and IBM could catch up on this front over time. Additionally, Cisco’s high-margin networking products are considered relatively expensive, and this appears to be translating to Cisco’s server portfolio. Although Cisco’s go-to-market plan will likely focus on IT departments that are already existing networking customers and greenfield opportunities, customers may hesitate to give Cisco wallet share owing to the fear of vendor lock-in. Furthermore, studies have consistently shown that IT decision makers favor best-of-breed architectures, and our survey further reinforced this with 43% of respondents against the “one IT supplier” notion. (See Figure 396.) Importantly, Cisco has relatively nonstandard product architecture, and these often face challenges since

16 March 2011
IT Hardware 316
data center environments are already complex and heterogeneous. An introduction of another product could add to complexity to some datacenters, resulting in barriers to adoption in some environments. Consequently, share gains could be measured.
Figure 396: The Converged Infrastructure Approach Faces Headwinds in the year 2014 , if you could choose to purchase the majority of your IT hardware/software/services from one vendor, who would it be?
I don't agree with the "converged
infrastructure" or "one IT supplier"
notion43%
HP18%
IBM13%
EMC/VMware12%
Microsoft7%
Oracle0%
Cisco0%
Dell3%
Apple2%
Other2%
Source: Credit Suisse IT Survey, February 2011.
Roadmap and Product Positioning Given the significant software investment associated with committing to a certain platform, the historical consistency and future promise of a platform become important considerations in an IT manager’s buying decisions. This facet of IT hardware buying is true across all types of servers. The improvements in performance, consistency of processor releases, and clarity on future releases are clearly tied to a vendor’s market share. In addition to the roadmap, we believe it is important to assess a vendor’s current product positioning. In evaluating product positioning, we analyze the vendor’s exposure by server classification and the revenue mix on a per product basis.
Current Positioning
To evaluate each vendor’s product positioning, we examine each vendor’s revenue exposure and note the following key trends by vendor, as seen in Figure 397:
■ IBM. IBM is the only vendor with exposure to all three sub segments of servers, including a commanding position in the mainframe server market, which accounts for 31% of server revenue and where the company has ~85% market share. While the company derives 37% server revenue from x86 servers, the company is focused on the higher end of the x86 market (predominantly 2-way >$2,000 and 4-way servers).
■ HP. HP derives 78% of server segment revenue from x86 (ProLiant servers), with the remaining revenue coming from Itanium-based UNIX servers. While the company participates in all the subsegments of x86, the focus is on 2-way over $2,000 and 4-way servers and on the blade form factor.

16 March 2011
IT Hardware 317
■ Dell. All of Dell’s server revenue is derived from x86 servers, with the company focusing primarily on 2-way over $2,000 servers.
■ Sun/Oracle. Traditionally, Sun has been focused on the UNIX segment of the market, with 79% of total server revenue coming from this segment. As such, given our view on UNIX (particularly low-end UNIX), we think Sun/Oracle will be challenged by its current positioning. However, As the Credit Suisse Software Team highlighted in their reports titled “Dr. Exalove, Part I or: How I Learned to Stop Worrying (about Sun) and Love Exadata” published on October 12, 2010 and “Dr. Exalove, Part II or: How I Learned to Stop Worrying (about Sun) and Love Exalogic Too” published on November 23, 2010, although most investors view Oracle as a “winner” in the consolidating data center sector, due to the company’s strength in both database and middleware software and growing market share in enterprise applications, the Credit Suisse Software Team believes that Oracle continues to build a robust and growing pipeline for the Oracle Exadata Database Machine and that the recently introduced Oracle Exalogic Elastic Cloud has generated strong initial interest."
■ Cisco. The company focused largely on the high-end of the x86 market with a heavy blade mix. The company is targeting converged systems as a source of growth, focusing on management of virtualized machines.

16 March 2011
IT Hardware 318
Figure 397: IBM Has the Broadest Portfolio While Dell and Cisco Have the Narrowest Dell IBM HP Cisco Sun/Oracle
x86 Intel Xeon Intel Xeon Intel Xeon Intel Xeon Intel XeonAMD Opteron AMD Opteron AMD Opteron AMD Opteron
% of Revenues 100% 37% 78% 100% 21%1-Way 9% 7% 7% 0% 13%2-Way 81% 76% 78% 97% 60%
2-Way <$2,000 0% 0% 3% 0% 0%2-Way >$2,000 81% 75% 76% 97% 60%
4-Way and above 10% 18% 15% 3% 26%
RAM2-Way 1GB - 512GB 1GB - 512GB 1GB - 1TB 1GB - 384GB 1GB - 256GB
Management Tools iDRAC IBM Integrated Management Module HP Integrated Lights-Out 3 UCS Manager Oracle Integrated Lights Out
UNIX (RISC) POWER Intel Itanium SPARC
% of Revenues 33% 22% 79%
RAM 1GB - 8TB 1GB - 191TB 1GB - 4TB
Mainframe z Processor
% of Revenues 31%
RAM 1GB - 3TB
Blade PowerEdge BladeCenter BladeSystem B-Series Sun Blade
% of Revenues 7% 12% 24% 94% 11%
Source: Gartner, Company reports, Credit Suisse.
Lastly, based on the results of the Credit Suisse IT Survey, as seen in Figure 398, HP ranks well on product roadmap; however, we have concerns over Itanium’s performance. IBM benefits from a positive perception among respondents, an impressive history of UNIX and mainframe introductions, and a broad portfolio across all server types.

16 March 2011
IT Hardware 319
Figure 398: HP Led Our Survey in Roadmap Perception, Trailed Closely by IBM please rate the following server vendors across roadmap (historical/futures), using the following scale: 1 = Very poor performance 5 = Excellent performance
2 2.2 2.4 2.6 2.8 3 3.2 3.4 3.6 3.8 4
Fujitsu
Cisco UCS
Dell
Sun/Oracle
IBM
HP
Source: Credit Suisse IT Survey, February 2011.
Distribution The greater a vendor’s footprint, both in terms of geographic distribution and indirect/direct presence, the better the vendor is positioned to drive sales growth. In terms of geographic distribution, we believe the exposure to developing markets is vital for above market growth. Indeed, this exposure can provide new growth drivers for technologies that are quite mature, as seen with IBM mainframes.
Geographic Footprint
As seen in Figure 399, Dell has significant exposure to the U.S./Canada market. While the company has worked this exposure down over time, the relative narrow geographic exposure (more than three-quarters of sales come from developed markets) is not ideal. Unlike Dell, HP has a balanced developed market exposure, with only 38% of sales coming from the U.S./Canada. Meanwhile, IBM has done quite well in building out its emerging market presence, and this could be an impetus for growth in the years ahead. Cisco’s heavy U.S./Canada presence is likely explained by the UCS being in the early stages of ramping, and this is likely to expand with time as the company funnels the product through its channel.

16 March 2011
IT Hardware 320
Figure 399: IBM Has the Most Evenly Distributed Geographic Breadth, with HP following
1
% of Revenue 2002 2003 2004 2005 2006 2007 2008 2009 2010
DellUS/Canada 62% 62% 60% 58% 55% 54% 53% 54% 55%Japan 6% 6% 6% 5% 5% 4% 4% 4% 3%Western Europe 21% 20% 21% 21% 22% 22% 22% 19% 18%Eastern Europe 1% 1% 1% 1% 2% 2% 2% 1% 1%MEA 2% 2% 2% 2% 2% 2% 2% 2% 2%Latin America 3% 3% 3% 4% 4% 4% 5% 5% 5%Asia/Pacif ic 5% 6% 7% 9% 10% 12% 12% 15% 15%Total 100% 100% 100% 100% 100% 100% 100% 100% 100%
CiscoUS/Canada NM NM NM NM NM NM NM NM 60%Japan NM NM NM NM NM NM NM NM 3%Western Europe NM NM NM NM NM NM NM NM 23%Eastern Europe NM NM NM NM NM NM NM NM 1%MEA NM NM NM NM NM NM NM NM 2%Latin America NM NM NM NM NM NM NM NM 3%Asia Pacif ic NM NM NM NM NM NM NM NM 8%Total NM NM NM NM NM NM NM NM 100%
HPUS/Canada 41% 42% 40% 39% 38% 35% 34% 37% 38%Japan 7% 7% 7% 7% 7% 6% 6% 6% 5%Western Europe 32% 30% 31% 30% 31% 31% 31% 29% 27%Eastern Europe 3% 3% 3% 4% 4% 5% 5% 4% 5%MEA 2% 3% 3% 3% 3% 4% 4% 4% 4%Latin America 3% 4% 4% 3% 3% 4% 4% 4% 4%Asia Pacif ic 12% 12% 13% 13% 14% 15% 16% 17% 17%Total 100% 100% 100% 100% 100% 100% 100% 100% 100%
IBMUS/Canada 40% 40% 41% 42% 40% 38% 37% 38% 38%Japan 9% 8% 8% 7% 6% 6% 6% 5% 5%Western Europe 29% 30% 28% 26% 27% 26% 25% 22% 20%Eastern Europe 2% 2% 2% 3% 3% 3% 4% 3% 3%MEA 2% 2% 2% 3% 3% 3% 2% 3% 3%Latin America 5% 6% 5% 6% 7% 7% 8% 8% 9%Asia Pacif ic 13% 13% 13% 13% 14% 17% 18% 21% 23%Total 100% 100% 100% 100% 100% 100% 100% 100% 100%
Oracle/Sun MicrosystemsUS/Canada 50% 47% 46% 45% 45% 43% 40% 41% 46%Japan 8% 7% 5% 6% 5% 4% 4% 3% 3%Western Europe 26% 28% 29% 29% 29% 30% 32% 31% 26%Eastern Europe 1% 2% 2% 3% 3% 3% 3% 3% 2%MEA 1% 1% 2% 2% 3% 3% 4% 4% 3%Latin America 2% 2% 2% 2% 2% 2% 3% 3% 4%Asia Pacif ic 11% 13% 14% 13% 14% 15% 14% 16% 16%Total 100% 100% 100% 100% 100% 100% 100% 100% 100%
Total (above vendors)US/Canada 44% 44% 43% 43% 42% 40% 39% 40% 42%Japan 8% 7% 7% 7% 6% 5% 5% 5% 5%Western Europe 29% 29% 28% 27% 28% 28% 27% 25% 23%Eastern Europe 2% 2% 2% 3% 3% 4% 4% 3% 3%MEA 2% 2% 2% 3% 3% 3% 3% 4% 3%Latin America 4% 4% 4% 4% 5% 5% 5% 6% 6%Asia Pacif ic 12% 12% 12% 13% 14% 15% 16% 18% 19%Total 100% 100% 100% 100% 100% 100% 100% 100% 100%
1) Dell is overly exposed to the U.S. market. The company derives more than half of its server revenues from the U.S./Canada market and more than three-quarters from developed economies, and this could weigh on growth.
2) Cisco has a high U.S./Canada mix. Cisco’s initial UCS sales have mostly been in North America but that is understandable given the product’s initial ramp.
3) HP is well diversified. The company is well diversified in terms of geographic server sales, with only 38% coming from the U.S/Canada.
4) IBM has built an impressive emerging market presence. More so than other server vendors, IBM has built an impressive emerging market presence and only 63% of server sales came from developed markets in 2010.
5) Sun’s reliance on the U.S/Canada has held constant. Sun/Oracle has been unable to diversify from the North American market and it is tied with Dell on its reliance on developed economies.
1
3
3
4
2
5
1
% of Revenue 2002 2003 2004 2005 2006 2007 2008 2009 2010
DellUS/Canada 62% 62% 60% 58% 55% 54% 53% 54% 55%Japan 6% 6% 6% 5% 5% 4% 4% 4% 3%Western Europe 21% 20% 21% 21% 22% 22% 22% 19% 18%Eastern Europe 1% 1% 1% 1% 2% 2% 2% 1% 1%MEA 2% 2% 2% 2% 2% 2% 2% 2% 2%Latin America 3% 3% 3% 4% 4% 4% 5% 5% 5%Asia/Pacif ic 5% 6% 7% 9% 10% 12% 12% 15% 15%Total 100% 100% 100% 100% 100% 100% 100% 100% 100%
CiscoUS/Canada NM NM NM NM NM NM NM NM 60%Japan NM NM NM NM NM NM NM NM 3%Western Europe NM NM NM NM NM NM NM NM 23%Eastern Europe NM NM NM NM NM NM NM NM 1%MEA NM NM NM NM NM NM NM NM 2%Latin America NM NM NM NM NM NM NM NM 3%Asia Pacif ic NM NM NM NM NM NM NM NM 8%Total NM NM NM NM NM NM NM NM 100%
HPUS/Canada 41% 42% 40% 39% 38% 35% 34% 37% 38%Japan 7% 7% 7% 7% 7% 6% 6% 6% 5%Western Europe 32% 30% 31% 30% 31% 31% 31% 29% 27%Eastern Europe 3% 3% 3% 4% 4% 5% 5% 4% 5%MEA 2% 3% 3% 3% 3% 4% 4% 4% 4%Latin America 3% 4% 4% 3% 3% 4% 4% 4% 4%Asia Pacif ic 12% 12% 13% 13% 14% 15% 16% 17% 17%Total 100% 100% 100% 100% 100% 100% 100% 100% 100%
IBMUS/Canada 40% 40% 41% 42% 40% 38% 37% 38% 38%Japan 9% 8% 8% 7% 6% 6% 6% 5% 5%Western Europe 29% 30% 28% 26% 27% 26% 25% 22% 20%Eastern Europe 2% 2% 2% 3% 3% 3% 4% 3% 3%MEA 2% 2% 2% 3% 3% 3% 2% 3% 3%Latin America 5% 6% 5% 6% 7% 7% 8% 8% 9%Asia Pacif ic 13% 13% 13% 13% 14% 17% 18% 21% 23%Total 100% 100% 100% 100% 100% 100% 100% 100% 100%
Oracle/Sun MicrosystemsUS/Canada 50% 47% 46% 45% 45% 43% 40% 41% 46%Japan 8% 7% 5% 6% 5% 4% 4% 3% 3%Western Europe 26% 28% 29% 29% 29% 30% 32% 31% 26%Eastern Europe 1% 2% 2% 3% 3% 3% 3% 3% 2%MEA 1% 1% 2% 2% 3% 3% 4% 4% 3%Latin America 2% 2% 2% 2% 2% 2% 3% 3% 4%Asia Pacif ic 11% 13% 14% 13% 14% 15% 14% 16% 16%Total 100% 100% 100% 100% 100% 100% 100% 100% 100%
Total (above vendors)US/Canada 44% 44% 43% 43% 42% 40% 39% 40% 42%Japan 8% 7% 7% 7% 6% 5% 5% 5% 5%Western Europe 29% 29% 28% 27% 28% 28% 27% 25% 23%Eastern Europe 2% 2% 2% 3% 3% 4% 4% 3% 3%MEA 2% 2% 2% 3% 3% 3% 3% 4% 3%Latin America 4% 4% 4% 4% 5% 5% 5% 6% 6%Asia Pacif ic 12% 12% 12% 13% 14% 15% 16% 18% 19%Total 100% 100% 100% 100% 100% 100% 100% 100% 100%
1) Dell is overly exposed to the U.S. market. The company derives more than half of its server revenues from the U.S./Canada market and more than three-quarters from developed economies, and this could weigh on growth.
2) Cisco has a high U.S./Canada mix. Cisco’s initial UCS sales have mostly been in North America but that is understandable given the product’s initial ramp.
3) HP is well diversified. The company is well diversified in terms of geographic server sales, with only 38% coming from the U.S/Canada.
4) IBM has built an impressive emerging market presence. More so than other server vendors, IBM has built an impressive emerging market presence and only 63% of server sales came from developed markets in 2010.
5) Sun’s reliance on the U.S/Canada has held constant. Sun/Oracle has been unable to diversify from the North American market and it is tied with Dell on its reliance on developed economies.
11
33
33
44
22
55
Source: Gartner, Credit Suisse.

16 March 2011
IT Hardware 321
As with geographic presence, channel strength can be a valuable asset for market positioning and share. Servers, depending on their configuration and customer profile, are sold either by a vendor’s direct salesforce or through reseller channels. Vendors that have an extensive reach and well-executed distribution strategy will reap stronger sales growth over time. We evaluate a vendor’s distribution for servers primarily by looking at the mix of direct versus indirect distribution. As seen in Figure 400, HP and IBM and Sun/Oracle are more focused on the indirect channel, while Dell and Cisco are focused on the direct channel. Dell’s direct focus is a function of the company’s Web-based direct channel, rather than what one would otherwise typically consider a direct strategy.
Figure 400: HP Has a Discernible Lead in the Indirect Channel, with IBM Following % of Revenue 2002 2003 2004 2005 2006 2007 2008 2009 2010
DellDirect 95% 95% 96% 95% 94% 94% 93% 91% 91%Indirect 5% 5% 4% 5% 6% 6% 7% 9% 9%Total 100% 100% 100% 100% 100% 100% 100% 100% 100%
CiscoDirect NM NM NM NM NM NM NM NM 100%Indirect NM NM NM NM NM NM NM NM 0%Total 0% 0% 0% 0% 0% 0% 0% 0% 100%
HPDirect 39% 40% 38% 38% 36% 33% 35% 35% 33%Indirect 61% 60% 62% 62% 64% 67% 65% 65% 67%Total 100% 100% 100% 100% 100% 100% 100% 100% 100%
IBMDirect 62% 60% 59% 54% 54% 52% 54% 52% 51%Indirect 38% 40% 41% 46% 46% 48% 46% 48% 49%Total 100% 100% 100% 100% 100% 100% 100% 100% 100%
Oracle/Sun MicrosystemsDirect 28% 33% 29% 27% 29% 30% 40% 44% 37%Indirect 72% 67% 71% 73% 71% 70% 60% 56% 63%Total 100% 100% 100% 100% 100% 100% 100% 100% 100%
Total (above vendors)Direct 51% 53% 53% 50% 50% 48% 51% 51% 51%Indirect 49% 47% 47% 50% 50% 52% 49% 49% 49%Total 100% 100% 100% 100% 100% 100% 100% 100% 100%
1
1) Dell has shown only mild expansion of indirect. Despite the company’s attempts to increase its indirect footprint, gains have been slow in coming. Post the acquisition of indirect channel storage provider EqualLogic, indirect server sales as a percentage of total increased by only 2% in the mix.
2) Cisco has a high direct. Similar to geo, Cisco’s product is new so evangelizing through a direct sales force initially makes sense.
3) HP has a powerful indirect presence. HP continues to expand its indirect footprint, making channel building for the competitors a challenge. The channel remains a key competitive advantage for the company.
4) IBM slowly moves away from indirect. Over the past decade, IBM has made a definable shift towards indirect, which now represents slightly less than half of server sales.
5) Sun bucks the trend of other vendors. Unlike other vendors which are attempting to increase their sales footprint by boosting indirect, Sun’s direct proportion is increasing.
1
2
3
4
5
% of Revenue 2002 2003 2004 2005 2006 2007 2008 2009 2010
DellDirect 95% 95% 96% 95% 94% 94% 93% 91% 91%Indirect 5% 5% 4% 5% 6% 6% 7% 9% 9%Total 100% 100% 100% 100% 100% 100% 100% 100% 100%
CiscoDirect NM NM NM NM NM NM NM NM 100%Indirect NM NM NM NM NM NM NM NM 0%Total 0% 0% 0% 0% 0% 0% 0% 0% 100%
HPDirect 39% 40% 38% 38% 36% 33% 35% 35% 33%Indirect 61% 60% 62% 62% 64% 67% 65% 65% 67%Total 100% 100% 100% 100% 100% 100% 100% 100% 100%
IBMDirect 62% 60% 59% 54% 54% 52% 54% 52% 51%Indirect 38% 40% 41% 46% 46% 48% 46% 48% 49%Total 100% 100% 100% 100% 100% 100% 100% 100% 100%
Oracle/Sun MicrosystemsDirect 28% 33% 29% 27% 29% 30% 40% 44% 37%Indirect 72% 67% 71% 73% 71% 70% 60% 56% 63%Total 100% 100% 100% 100% 100% 100% 100% 100% 100%
Total (above vendors)Direct 51% 53% 53% 50% 50% 48% 51% 51% 51%Indirect 49% 47% 47% 50% 50% 52% 49% 49% 49%Total 100% 100% 100% 100% 100% 100% 100% 100% 100%
1
1) Dell has shown only mild expansion of indirect. Despite the company’s attempts to increase its indirect footprint, gains have been slow in coming. Post the acquisition of indirect channel storage provider EqualLogic, indirect server sales as a percentage of total increased by only 2% in the mix.
2) Cisco has a high direct. Similar to geo, Cisco’s product is new so evangelizing through a direct sales force initially makes sense.
3) HP has a powerful indirect presence. HP continues to expand its indirect footprint, making channel building for the competitors a challenge. The channel remains a key competitive advantage for the company.
4) IBM slowly moves away from indirect. Over the past decade, IBM has made a definable shift towards indirect, which now represents slightly less than half of server sales.
5) Sun bucks the trend of other vendors. Unlike other vendors which are attempting to increase their sales footprint by boosting indirect, Sun’s direct proportion is increasing.
11
22
33
44
55
Source: Gartner, Credit Suisse.
Lastly, based on the results of the Credit Suisse IT Survey, as seen in Figure 401, HP is best positioned in the distribution category, followed by Dell, IBM, and Sun/Oracle.

16 March 2011
IT Hardware 322
Figure 401: HP, Dell, and IBM Seen as Having the Most Developed Distribution please rate the following server vendors across distribution, using the following scale: 1 = Very poor performance 5 = Excellent performance
2 2.5 3 3.5 4 4.5
Fujitsu
Cisco UCS
Sun/Oracle
IBM
Dell
HP
Source: Credit Suisse IT Survey, February 2011.
Sales/Existing Relationship For this metric, we try to determine which vendors have the best sales relationships in accounts. Similar to other scorecard metrics, we asked respondents of the Credit Suisse IT Survey to rank the importance of this metric and rank the vendors. We would expect the largest and most mature vendors in this area to have a leg up owing to their large salesforces and many years of experience in customer accounts in this particular product line. As seen in Figure 402, not surprisingly, IBM and HP lead the pack, while Cisco and Sun/Oracle lag. Although we would expect Cisco and Oracle to rank highly in other product categories (networking and software, respectively) for this particular metric, they are disadvantaged owing to the significant head start enjoyed by HP and IBM.
Figure 402: HP and IBM Have the Strongest Sales Relationships Within Organizations please rate the following server vendors across sales/standing relationship, using the following scale: 1 = Very poor performance 5 = Excellent performance
2.00 2.50 3.00 3.50 4.00 4.50
Fujitsu
Cisco UCS
Sun/Oracle
Dell
IBM
HP
Source: Credit Suisse IT Survey, February 2011.

16 March 2011
IT Hardware 323
Ability to Bundle, Provide Complete Solutions In Figure 403, we rate the vendors on their ability to create a complete solution of which servers are only a component. Examples of this would be private clouds or the bundling of servers and storage. The ability to bundle servers with other hardware, software, and services is an important attribute for enterprise customers, as they typically seek to reduce the number of vendors they are dealing with to gain leverage in the purchasing process. The results from the Credit Suisse IT Survey intuitively favor the megavendors, HP and IBM, by a large margin, as they have a very broad range of technology solutions that they can offer.
Figure 403: HP and IBM are Ranked Highest in the Ability to Bundle please rate the following server vendors across their ability to provide a complete solution (bundle), using the following scale: 1 = Very poor performance 5 = Excellent performance
2.00 2.50 3.00 3.50 4.00 4.50
Dell
Cisco UCS
Fujitsu
Sun/Oracle
IBM
HP
Source: Credit Suisse IT Survey, February 2011.

16 March 2011
IT Hardware 324
Printing—Secular Challenges We expect the printer hardware to see flat growth while supplies improve at a 1% CAGR between 2010 and 2015. This outlook is driven by our expectation for a fading refresh cycle near term, with long-term growth mainly driven by developing markets. Within the printing market, the secular shift to Multi-Function Printers (MFPs) continues, driving a 2% unit CAGR through 2015 versus a decline of 1% for single-function devices, although given ASP dynamics, both are expected to see flat revenue growth. In addition, from a technology standpoint, we expect the laser segment to grow at a long-term revenue CAGR of 1% while we expect inkjet segment revenue to decline 6%. On supplies, we have a slightly less challenged outlook in which we expect industry revenue for supplies to grow at a 1% CAGR between 2010 and 2015. This is driven by our view on a shrinking installed base offset by more productive devices in the field. While the argument related to digital page growth as a driver for the printing industry is not likely to go away anytime soon, we believe offsets to this include fewer printed pages as content increasingly goes online (e-bills, social networking, and photo sharing Web sites) and alternative consumption devices, including smartphones and tablets. Consequently, we don’t expect page growth to be a meaningful revenue driver for the printing hardware and supplies market.
Printing Hardware — Flat Growth Longer Term Our approach to modeling the printer hardware market is based on our fundamental view that printer hardware shipments are closely tied to PC purchases. Through the early part of the past decade, the bundling of printers with a PC purchase was a popular marketing strategy. In many instances, the printers would be offered for free, or with a cash rebate. Dell and Lexmark evangelized this strategy, which at the peak afforded Lexmark the opportunity to drive about 15% of its annual revenue through Dell. Compounded by a prolonged IT spending refresh post bubble, annual hardware shipments peaked at 139mn million units in 2007. As shown in Figure 404, we believe that, after two years of significant declines and following a cyclical recovery demand in 2010, hardware shipments will only approach prerecession levels only toward 2013 and then fade therefafter. While we expect industry revenue to rebound somewhat, revenue will remain under pressure longer term. We expect units and revenues of 128mn and $51bn, respectively, in 2015, given the following factors:
Figure 404: Credit Suisse Printing HW Shipment Forecasts—2007–2015E shipments in thousands
Figure 405: Credit Suisse Printing HW Revenue Forecasts—2007–2015E revenues in US$ in millions
90,000
100,000
110,000
120,000
130,000
140,000
150,000
2007 2008 2009 2010 2011E 2012E 2013E 2014E 2015E
$45,000
$49,000
$53,000
$57,000
$61,000
$65,000
2007 2008 2009 2010 2011E 2012E 2013E 2014E 2015E
Source: Gartner, Credit Suisse estimates. Source: Gartner, Credit Suisse estimates.

16 March 2011
IT Hardware 325
Printer to PC Shipment Ratio Is Key to Our Forecasting Methodology
We have analyzed the relationship between printer hardware and PC shipments over the past decade. While we do not expect every PC shipped globally to ship with a printer, we expect the ratio of printer shipments to PC shipments to remain relatively stable. This was indeed the case in the earlier part of the decade. From 2002 through 2005, the ratio of printer shipments to PC shipments was above 60% and averaged 64%. Nevertheless, the period following this shows a remarkable decline in the ratio, with printer shipments to PC shipments falling to 35% in 2010. This decline has been driven by the consolidation of single-function printers, scanners, fax machines, and standalone copiers to multifunction devices that combine all this functionality into a single device. We also note an aggressive decline in the home market, owing to a shift toward multiple mobile PCs per household from one desktop per household. Going forward, and as seen in Figure 404, we assume that the printer shipments to PC shipment ratio will decline modestly through 2013 and stabilize through 2015 for the following reasons.
Figure 406: 2002–2015E Printer Hardware to PC Shipments Ratio by Region—Expect a Modest Decline Going Forward US$ in millions, unless otherwise stated 2002 2003 2004 2005 2006 2007 2008 2009 2010 2011E 2012E 2013E 2014E 2015ENorth America 65% 64% 66% 69% 63% 57% 50% 40% 39% 38% 41% 42% 42% 43%Asia-Pacific (including Japan) 51% 57% 58% 51% 47% 42% 37% 30% 27% 26% 24% 22% 21% 21%EMEA 69% 72% 71% 69% 65% 59% 47% 41% 38% 38% 38% 37% 37% 36% Western Europe 75% 76% 73% 70% 69% 59% 45% 40% 38% 39% 40% 40% 40% 40% Eastern Europe 56% 63% 67% 67% 60% 58% 46% 42% 36% 37% 37% 37% 37% 39% Middle East and Africa 54% 61% 62% 61% 57% 60% 54% 43% 41% 39% 36% 33% 30% 27%Latin America 67% 67% 65% 62% 61% 53% 50% 41% 41% 40% 40% 39% 40% 39%Global 62% 65% 65% 63% 59% 53% 45% 37% 35% 34% 34% 32% 31% 31%Developed markets 61% 63% 63% 62% 56% 49% 43% 35% 34% 33% 33% 32% 30% 36%Developing markets 60% 64% 65% 64% 60% 57% 49% 42% 39% 39% 38% 37% 36% 35%
Source: Gartner, Credit Suisse estimates. Note: Developed markets include North America, Canada, Asia-Pacific, and Western Europe. Note: Developing market includes Eastern Europe, Middle East & Africa, and Latin America.
Mix of multifunction printers is now significant enough to offset the decline in single-function segments. Over the past few years increasing device functionality has driven consolidation. Multifunction printers (MFPs) combine the functionality of a single-function printer, a standalone copier, fax machine, and scanner. Indeed, the MFP product category has been the only growing segment within the overall printer hardware market. Through the past decade, MFP share of the market has risen from 15% in 2002 to 66% in 2010, as a result of 25% per annum shipment growth. Meanwhile, single-function printers declined, owing to consolidation, with 8% per annum declines over this period. Single-function printer share fell from 82% in 2002 to 33% in 2010. Also, standalone copiers, while only 3% of the market in 2002, fell to less than 1% in 2010, a 17% compounded annual decline. This is seen in Figure 407. Going forward, with MFP representing such a significant portion of annual shipments, we believe the printer to PC shipment ratio will likely be more stable.

16 March 2011
IT Hardware 326
Figure 407: Printer Hardware Shipments by Function—2000–2010 shipments in thousands
0
20,000
40,000
60,000
80,000
100,000
120,000
140,000
160,000
2002 2003 2004 2005 2006 2007 2008 2009 2010
MFPs Printers Copiers standalone
Source: Gartner.
Stable PC Printing Ratio Equates to a Stable Outlook for Printing Hardware
We expect the ratio of printer to PC shipments will decline modestly to 34% in 2011/2012, from 35% in 2010. This is a modest slowdown from the declines experienced over the past four years, when the ratio fell from 53% in 2007 to 45% in 2008 and to 37% in 2009. Applying this ratio to our estimates for the PC market excluding tablets, we arrive at several important conclusions:
Modest growth over the next five years. The printing refresh cycle began in 2010, driving shipment growth of 8%, following two years of declining shipment growth (a 6% decline in 2008 and a 14% decline in 2009). Nevertheless, we believe this refresh in printing hardware will continue in 2011, and then moderate to 5% in 2012, as the refresh cycle gives way to the impact of rising PC penetration in developing markets, which we expect will drive a higher printer attach. Overall, we forecast 5% printer hardware unit growth in 2011 and 5% growth in 2012 to deliver 1% compounded growth through 2015.
Cyclical refresh in developed markets. We define the developed markets to include North America, Asia Pacific (including Japan), and Western Europe. Based on this grouping, we expect developed market printer shipments to rise 2% in 2011 and 3% in 2012, before declining through 2015. This compares with a 7% decline recorded in 2008, an 11% decline in 2009, and 6% growth in 2010. Our expectations for this cyclical recovery in printing in developed markets is based on our view that after two years of depressed spending on printing hardware, the useful life of these devices is reaching levels that warrant a refresh (Figure 408).

16 March 2011
IT Hardware 327
Figure 408: Average Life of Printer Hardware Install Base by Region—2008–2015E 2008 2009 2010 2011E 2012E 2013E 2014E 2015E Average life of install base North America 5.4 4.6 4.1 4.2 3.8 4.4 4.8 4.8 Asia-Pacific (including Japan) 5.7 4.9 4.0 4.3 4.4 4.4 4.2 4.3 EMEA 4.9 4.7 4.2 4.2 3.8 3.8 4.0 4.0 Western Europe 5.0 4.8 4.2 4.3 4.0 4.0 4.3 4.3 Eastern Europe 4.3 4.4 3.8 3.8 3.4 3.3 3.3 3.4 Middle East and Africa 4.7 4.7 4.0 4.0 3.6 3.6 3.6 3.6 Latin America 5.9 4.8 4.4 4.2 3.7 3.5 3.2 3.2 Global 5.3 4.7 4.1 4.2 4.0 4.1 4.1 4.2 Developed markets 5.3 4.7 4.1 4.2 4.1 4.3 4.4 4.5 Developing markets 5.3 4.7 4.1 4.0 3.6 3.5 3.3 3.4
Source: Gartner, Lyra Research, Credit Suisse estimates.
In the Credit Suisse IT Survey, we asked respondents to determine the average age of their installed base, as shown in Figure 409. The results of the survey show that 58% of respondent’s hardware’s useful life was between three and six years, 48% responded with less than three years and 2% said more than six years. Based on our proprietary analysis of the installed base and with the responses from the Credit Suisse IT Survey, we assume the average useful is between four and six years.
Figure 409: Average Age of Printer Install Base from Credit Suisse IT Survey what is the average age of your printer installed-base?
0.0%
10.0%
20.0%
30.0%
40.0%
50.0%
60.0%
70.0%
Less than 3 years 3-6 years More than 6 years
Source: Credit Suisse IT Survey, February 2011.
Printing demand in developing markets to grow through 2015. We define the developing markets to include Eastern Europe, Middle East and Africa, and Latin America. This market has contributed less than 19% to global shipments, on average, over the past decade. Nonetheless, contribution from developing markets rose to 22% in 2009. Furthermore, we believe from a mix perspective, the contribution from developing markets will continue to rise over the next five years, albeit at a modest place. We expect developing market printer hardware shipments to rise 6% in 2011 and accelerate to 12% in 2012, driving a 7% CAGR in 2010-15. This results in developing markets comprising nearly 31% of global shipments by 2015. This growth is in part driven by robust PC (ex tablets) demand in developing markets, and also by the low attach rates to PCs, which suggests an underpenetration of printers in emerging markets.
MFPs will drive the bulk of this recovery. Notwithstanding our muted outlook for hardware revenue growth, we expect the shift to MFPs from single-function printers and standalone

16 March 2011
IT Hardware 328
copiers to continue. Price/performance considerations of MFPs versus single function devices are a relevant consideration for buyers, which is why MFP purchases have typically been relegated to the enterprise market. However, with pricing for MFPs posting rapid declines in the past five years as hardware vendors bring MFPs down the cost curve, those savings have generally been passed on to customers. Overall, we expect MFP revenue to be flat in the long term as unit growth is offset by ASP declines. Meanwhile, single function devices are likely to be flat due the reverse dynamic, as upward ASP pressure offsets unit declines through 2015.
Figure 410: Credit Suisse Printer Hardware Shipment Growth by Function: 2007-15 Estimate Y/Y % change annual shipment change
-30%
-20%
-10%
0%
10%
20%
2007 2008 2009 2010 2011E 2012E 2013E 2014E 2015E
MFPs Single-function devices
Source: Gartner, Credit Suisse estimates.
Laser demand will continue to outpace Inkjet demand. The industry has been saturated with inkjet devices (printers and MFPs), owing to their affordability. Once again, we argue hardware OEMs will continue to work to remove cost from laser devices and this should narrow the price/performance gap with inkjets. We forecast laser units will increase 8% in 2011 and 10% in 2012, with ASPs declining 1% and 4%, respectively. This will result in laser hardware revenue growth of 7% in 2011 and 6% in 2012. For inkjets, we expect units to be flat in 2011 and grow 3% in 2012, and ASPs to decline 5% and 4%, respectively. This will result in an inkjet hardware revenue decline of 5% in 2011 and 1% in 2012. In the long term, we expect laser shipments to outpace inkjet units with 6% compounded annual growth through 2015, while inkjet will decline 2%. Our detailed estimates are highlighted in Figure 411.

16 March 2011
IT Hardware 329
Figure 411: CS Printer Hardware Shipment Growth by Output Technology—2007-15 Estimates Y/Y % change annual shipment change
-20%
-10%
0%
10%
20%
30%
2007 2008 2009 2010 2011E 2012E 2013E 2014E 2015E
Laser MFP and printers Inkjet MFP and printers
Source: Credit Suisse IT Survey, February 2011.

16 March 2011
IT Hardw
are 330
Figure 412: Credit Suisse Printer Hardware Shipment, ASP, and Revenue Forecasts by Region, Output Technology, and Function—2007-15 Estimates shipments in thousands, Revenues in US$ in millions, unless otherwise stated
2007 2008 2009 2010 2011E 2012E 2013E 2014E 2015E 05-10 10-15ECAGR CAGR
Shipments by RegionNorth America 38,403 34,435 29,752 31,049 32,185 36,175 34,352 31,196 28,596 -7% -2%Asia-Pacific (including Japan) 35,140 34,869 32,185 35,289 36,079 35,296 36,321 36,647 37,915 1% 1%EMEA 52,651 48,225 39,587 42,094 43,280 45,094 45,681 44,111 43,520 -3% 1%
Western Europe 32,946 29,284 25,869 26,581 26,293 26,018 25,268 23,269 21,812 -4% -4%Eastern Europe 12,162 11,253 7,584 8,652 9,363 10,753 11,054 11,250 11,340 -2% 6%Middle East and Africa 7,543 7,688 6,134 6,860 7,625 8,323 9,359 9,591 10,367 5% 9%
Latin America 12,622 13,105 11,193 13,153 13,531 15,072 16,076 17,128 17,728 8% 6%Global shipments 138,816 130,634 112,716 121,585 125,075 131,637 132,430 129,082 127,759 -2% 1%
Developed markets 106,490 98,588 87,805 92,919 94,557 97,489 95,941 91,112 88,323 -3% -1%Developing markets 32,327 32,046 24,911 28,665 30,518 34,148 36,489 37,970 39,436 4% 7%
Laser MFP and printers 36,917 36,619 30,310 37,831 41,015 45,248 47,927 49,567 51,860 6% 7%Inkjet MFP and printers 94,385 87,674 77,757 83,157 83,396 85,761 83,974 79,117 75,566 -2% -2%MFPs 74,121 75,814 70,672 80,615 82,731 88,679 90,429 88,984 89,233 9% 2%Printers 63,447 53,793 41,295 40,381 41,681 42,330 41,472 39,699 38,194 -13% -1%Copiers standalone 1,249 1,027 749 589 664 627 529 399 333 -20% -11%
YoY % ChangeNorth America -4% -10% -14% 4% 4% 12% -5% -9% -8% -7% -2%Asia-Pacific (including Japan) 4% -1% -8% 10% 2% -2% 3% 1% 3% 1% 1%EMEA 4% -8% -18% 6% 3% 4% 1% -3% -1% -3% 1%
Western Europe -3% -11% -12% 3% -1% -1% -3% -8% -6% -4% -4%Eastern Europe 19% -7% -33% 14% 8% 15% 3% 2% 1% -2% 6%Middle East and Africa 23% 2% -20% 12% 11% 9% 12% 2% 8% 5% 9%
Latin America 13% 4% -15% 18% 3% 11% 7% 7% 4% 8% 6%Global shipments 3% -6% -14% 8% 3% 5% 1% -3% -1% -2% 1%
Developed markets -1% -7% -11% 6% 2% 3% -2% -5% -3% -3% -1%Developing markets 18% -1% -22% 15% 6% 12% 7% 4% 4% 4% 7%
Laser MFP and printers 12% -1% -17% 25% 8% 10% 6% 3% 5% 6% 7%Inkjet MFP and printers 1% -7% -11% 7% 0% 3% -2% -6% -4% -2% -2%MFPs 17% 2% -7% 14% 3% 7% 2% -2% 0% 9% 2%Printers -10% -15% -23% -2% 3% 2% -2% -4% -4% -13% -1%Copiers standalone -16% -18% -27% -21% 13% -5% -16% -25% -16% -20% -11%
ASPsAverage ASP $430 $463 $435 $422 $426 $424 $418 $409 $401 -1% -1%
Developed markets $478 $510 $476 $471 $480 $485 $484 $482 $478 0% 0%Developing markets $274 $316 $291 $263 $259 $250 $243 $236 $230 -1% -3%
Laser MFP and printers $1,234 $1,276 $1,232 $1,089 $1,076 $1,033 $977 $911 $854 -5% -5%Inkjet MFP and printers $126 $131 $127 $116 $110 $106 $101 $97 $92 -4% -4%MFPs $490 $512 $464 $452 $458 $449 $441 $430 $415 -6% -2%Printers $299 $329 $333 $319 $325 $337 $336 $338 $344 4% 2%Copiers standalone $3,535 $3,881 $3,361 $3,270 $2,805 $2,827 $2,842 $2,930 $3,269 -1% 0%
RevenuesNorth America 21,359 20,309 16,254 17,160 18,346 20,085 19,013 17,145 15,796 -5% -2%Asia-Pacific (including Japan) 13,770 14,570 13,412 15,007 15,505 15,571 16,225 16,502 16,909 2% 2%EMEA 21,162 21,369 16,031 15,766 16,112 16,482 16,232 15,160 14,432 -6% -2%
Western Europe 15,740 15,448 12,096 11,572 11,550 11,584 11,182 10,230 9,486 -7% -4%Eastern Europe 3,225 3,317 1,997 2,112 2,166 2,357 2,262 2,136 1,988 -5% -1%Middle East and Africa 2,198 2,604 1,938 2,082 2,396 2,541 2,788 2,794 2,959 2% 7%
Latin America 3,428 4,215 3,325 3,350 3,328 3,656 3,834 4,012 4,126 10% 4%Global revenues $59,719 $60,463 $49,022 $51,282 $53,291 $55,794 $55,305 $52,819 $51,263 -3% 0%
Developed markets 50,868 50,328 41,761 43,738 45,401 47,241 46,420 43,877 42,190 -4% -1%Developing markets 8,850 10,136 7,260 7,544 7,889 8,554 8,885 8,942 9,072 2% 4%
Laser MFP and printers 45,560 46,726 37,341 41,190 44,119 46,745 46,818 45,170 44,298 1% 1%Inkjet MFP and printers 11,890 11,481 9,846 9,607 9,172 9,050 8,486 7,650 6,964 -6% -6%MFPs 36,324 38,805 32,771 36,466 37,892 39,775 39,849 38,221 37,022 3% 0%Printers 18,981 17,673 13,733 12,889 13,536 14,246 13,952 13,429 13,152 -9% 0%Copiers standalone 4,414 3,986 2,518 1,926 1,862 1,774 1,505 1,169 1,089 -21% -11%
1) We forecast global printer hardware shipments of 125mn/132mn units in 2011/12 and 128mn LT, representing 3%/5% growth in 2011/12 and a 1% CAGR LT. A continued hardware refresh in developed markets will drive shipment growth through 2012, at which point the growth baton will be passed to developing market growth, driven by increasing PC penetration.
MFPs demand will to outpace the industry, benefitting from further consolidation of single function printers and standalone copiers. We expect MFPs to rise 2% per annum through 2015, with single function printers to remain relatively flattish.
Demand for laser devices will outpace inkjets over the long-term, owing to our belief that laser ASPs will continue decline. We expect laser units to rise at 7% per annum through 2015 and for inkjets to see flattish growth.
2) We forecast average annual hardware ASP declines of 1% per annum through 2015, which is on par with the declines experienced over the prior five years. Our estimates reflect an increasing mix of higher ASP MFP and laser devices. However, on a like-for-like basis ASPs should decline as we expect hardware vendors to reduce laser printer costs and narrow the price/performance versus inkjets.
3) We forecast printer hardware revenue of $53bn/$56bn in 2011/12 and remaining flat through 2015.
1
1
2
3
2007 2008 2009 2010 2011E 2012E 2013E 2014E 2015E 05-10 10-15ECAGR CAGR
Shipments by RegionNorth America 38,403 34,435 29,752 31,049 32,185 36,175 34,352 31,196 28,596 -7% -2%Asia-Pacific (including Japan) 35,140 34,869 32,185 35,289 36,079 35,296 36,321 36,647 37,915 1% 1%EMEA 52,651 48,225 39,587 42,094 43,280 45,094 45,681 44,111 43,520 -3% 1%
Western Europe 32,946 29,284 25,869 26,581 26,293 26,018 25,268 23,269 21,812 -4% -4%Eastern Europe 12,162 11,253 7,584 8,652 9,363 10,753 11,054 11,250 11,340 -2% 6%Middle East and Africa 7,543 7,688 6,134 6,860 7,625 8,323 9,359 9,591 10,367 5% 9%
Latin America 12,622 13,105 11,193 13,153 13,531 15,072 16,076 17,128 17,728 8% 6%Global shipments 138,816 130,634 112,716 121,585 125,075 131,637 132,430 129,082 127,759 -2% 1%
Developed markets 106,490 98,588 87,805 92,919 94,557 97,489 95,941 91,112 88,323 -3% -1%Developing markets 32,327 32,046 24,911 28,665 30,518 34,148 36,489 37,970 39,436 4% 7%
Laser MFP and printers 36,917 36,619 30,310 37,831 41,015 45,248 47,927 49,567 51,860 6% 7%Inkjet MFP and printers 94,385 87,674 77,757 83,157 83,396 85,761 83,974 79,117 75,566 -2% -2%MFPs 74,121 75,814 70,672 80,615 82,731 88,679 90,429 88,984 89,233 9% 2%Printers 63,447 53,793 41,295 40,381 41,681 42,330 41,472 39,699 38,194 -13% -1%Copiers standalone 1,249 1,027 749 589 664 627 529 399 333 -20% -11%
YoY % ChangeNorth America -4% -10% -14% 4% 4% 12% -5% -9% -8% -7% -2%Asia-Pacific (including Japan) 4% -1% -8% 10% 2% -2% 3% 1% 3% 1% 1%EMEA 4% -8% -18% 6% 3% 4% 1% -3% -1% -3% 1%
Western Europe -3% -11% -12% 3% -1% -1% -3% -8% -6% -4% -4%Eastern Europe 19% -7% -33% 14% 8% 15% 3% 2% 1% -2% 6%Middle East and Africa 23% 2% -20% 12% 11% 9% 12% 2% 8% 5% 9%
Latin America 13% 4% -15% 18% 3% 11% 7% 7% 4% 8% 6%Global shipments 3% -6% -14% 8% 3% 5% 1% -3% -1% -2% 1%
Developed markets -1% -7% -11% 6% 2% 3% -2% -5% -3% -3% -1%Developing markets 18% -1% -22% 15% 6% 12% 7% 4% 4% 4% 7%
Laser MFP and printers 12% -1% -17% 25% 8% 10% 6% 3% 5% 6% 7%Inkjet MFP and printers 1% -7% -11% 7% 0% 3% -2% -6% -4% -2% -2%MFPs 17% 2% -7% 14% 3% 7% 2% -2% 0% 9% 2%Printers -10% -15% -23% -2% 3% 2% -2% -4% -4% -13% -1%Copiers standalone -16% -18% -27% -21% 13% -5% -16% -25% -16% -20% -11%
ASPsAverage ASP $430 $463 $435 $422 $426 $424 $418 $409 $401 -1% -1%
Developed markets $478 $510 $476 $471 $480 $485 $484 $482 $478 0% 0%Developing markets $274 $316 $291 $263 $259 $250 $243 $236 $230 -1% -3%
Laser MFP and printers $1,234 $1,276 $1,232 $1,089 $1,076 $1,033 $977 $911 $854 -5% -5%Inkjet MFP and printers $126 $131 $127 $116 $110 $106 $101 $97 $92 -4% -4%MFPs $490 $512 $464 $452 $458 $449 $441 $430 $415 -6% -2%Printers $299 $329 $333 $319 $325 $337 $336 $338 $344 4% 2%Copiers standalone $3,535 $3,881 $3,361 $3,270 $2,805 $2,827 $2,842 $2,930 $3,269 -1% 0%
RevenuesNorth America 21,359 20,309 16,254 17,160 18,346 20,085 19,013 17,145 15,796 -5% -2%Asia-Pacific (including Japan) 13,770 14,570 13,412 15,007 15,505 15,571 16,225 16,502 16,909 2% 2%EMEA 21,162 21,369 16,031 15,766 16,112 16,482 16,232 15,160 14,432 -6% -2%
Western Europe 15,740 15,448 12,096 11,572 11,550 11,584 11,182 10,230 9,486 -7% -4%Eastern Europe 3,225 3,317 1,997 2,112 2,166 2,357 2,262 2,136 1,988 -5% -1%Middle East and Africa 2,198 2,604 1,938 2,082 2,396 2,541 2,788 2,794 2,959 2% 7%
Latin America 3,428 4,215 3,325 3,350 3,328 3,656 3,834 4,012 4,126 10% 4%Global revenues $59,719 $60,463 $49,022 $51,282 $53,291 $55,794 $55,305 $52,819 $51,263 -3% 0%
Developed markets 50,868 50,328 41,761 43,738 45,401 47,241 46,420 43,877 42,190 -4% -1%Developing markets 8,850 10,136 7,260 7,544 7,889 8,554 8,885 8,942 9,072 2% 4%
Laser MFP and printers 45,560 46,726 37,341 41,190 44,119 46,745 46,818 45,170 44,298 1% 1%Inkjet MFP and printers 11,890 11,481 9,846 9,607 9,172 9,050 8,486 7,650 6,964 -6% -6%MFPs 36,324 38,805 32,771 36,466 37,892 39,775 39,849 38,221 37,022 3% 0%Printers 18,981 17,673 13,733 12,889 13,536 14,246 13,952 13,429 13,152 -9% 0%Copiers standalone 4,414 3,986 2,518 1,926 1,862 1,774 1,505 1,169 1,089 -21% -11%
1) We forecast global printer hardware shipments of 125mn/132mn units in 2011/12 and 128mn LT, representing 3%/5% growth in 2011/12 and a 1% CAGR LT. A continued hardware refresh in developed markets will drive shipment growth through 2012, at which point the growth baton will be passed to developing market growth, driven by increasing PC penetration.
MFPs demand will to outpace the industry, benefitting from further consolidation of single function printers and standalone copiers. We expect MFPs to rise 2% per annum through 2015, with single function printers to remain relatively flattish.
Demand for laser devices will outpace inkjets over the long-term, owing to our belief that laser ASPs will continue decline. We expect laser units to rise at 7% per annum through 2015 and for inkjets to see flattish growth.
2) We forecast average annual hardware ASP declines of 1% per annum through 2015, which is on par with the declines experienced over the prior five years. Our estimates reflect an increasing mix of higher ASP MFP and laser devices. However, on a like-for-like basis ASPs should decline as we expect hardware vendors to reduce laser printer costs and narrow the price/performance versus inkjets.
3) We forecast printer hardware revenue of $53bn/$56bn in 2011/12 and remaining flat through 2015.
11
11
22
33
Source: Company data, Credit Suisse estimates.

16 March 2011
IT Hardware 331
Printing Supplies—1% CAGR in the Long Term We believe that the overall health of the printing industry depends on the outlook for the supplies market, as this $73bn market in 2010 generated the bulk of the printing industry’s profits. We expect supplies revenue for the industry to grow at a 1% CAGR in 2010-15 (Figure 413).
Figure 413: Credit Suisse Supplies Revenues Forecasts—2007-15 Estimates revenues in US$ in millions, unless otherwise stated
$64,000
$66,000
$68,000
$70,000
$72,000
$74,000
$76,000
$78,000
$80,000
2007 2008 2009 2010 2011E 2012E 2013E 2014E 2015E
Source: Lyra Research, Credit Suisse estimates.
A shrinking installed base. A structural concern for the industry is a shrinking hardware installed base, driven by a combination of consolidation efforts in enterprises and homes, and by technologies that promote printer sharing, such as wirelessly connected printers. Our hardware shipment forecasts are based on our view that both enterprise and consumer users will continue to consolidate printing devices. As a result, we expect the global installed base of printers to contract by 1% in 2011 and 2012.
Figure 414: Printer Hardware Install Base Forecasts by Region: 2007-15 2007 2008 2009 2010 2011E 2012E 2013E 2014E 2015E 10-15E CAGR North America 173,914 175,874 167,203 157,527 152,089 148,681 148,871 149,074 146,914 -1% Asia-Pacific (including Japan) 130,989 142,969 145,887 144,730 146,894 148,720 150,984 151,939 154,425 1% EMEA 195,177 203,738 200,399 194,309 190,809 186,257 183,486 181,151 178,918 -2% Western Europe 175,473 169,516 160,021 148,875 140,210 130,944 123,869 118,073 112,353 -5% Eastern Europe 12,162 20,590 23,544 25,956 28,420 30,912 32,662 34,038 35,234 6% Middle East and Africa 7,543 13,632 16,835 19,478 22,179 24,401 26,955 29,040 31,330 10% Latin America 38,075 44,706 46,666 49,252 51,155 52,420 53,505 54,147 55,104 2% Global 538,155 567,287 560,155 545,818 540,947 536,078 536,846 536,310 535,361 -0.4% Developed markets 480,376 488,360 473,111 451,132 439,193 428,345 423,724 419,085 413,692 -2% Developing markets 57,779 78,927 87,045 94,686 101,754 107,733 113,122 117,225 121,669 5%
Source: Gartner, Lyra Research, Credit Suisse estimates.
Through 2015, our expectations translate into the global installed base declining at a CAGR of 0.4%. In developed markets, including North America and EMEA, and where the professional market accounts for a much larger portion of the installed base, we expect an even faster consolidation and replacement effort. To that end, we expect the developed market hardware installed base to decline by at 2% CAGR through 2015, while the developing market installed base will grow at a 5% CAGR. Over the long term, we expect

16 March 2011
IT Hardware 332
the printer hardware installed base to show some volatility, owing to the cyclical nature of hardware spending.
Cartridge usage to rise 4% per annum through 2015. Cartridge usage per device is another critical lever in forecasting supplies revenues. Vendors, including Hewlett-Packard and Lexmark, have argued that despite structural decline in hardware shipments and hardware install base, the cartridge supplies usage is increasing. For our printer hardware install base model, we have applied annual cartridge attach assumptions from Lyra Research. It is important to note that cartridge attach rates vary depending on the region, function of the printer, type of printer (MFP versus single-function), and even by output technologies (laser toner and inkjets). Globally, Lyra Research estimates the average annual cartridge used per hardware was 3.6 in 2010, rising slightly from 3.4 cartridges over the past three years. Looking ahead, we expect global cartridge usage, based on our belief that consolidation is driving a higher mix of devices in the installed base with greater supplies attach. We estimate cartridge supplies with rise to 3.8 in 2011, 4.0 in 2012, and reach 4.3 by 2015.
Figure 415: Average Annual Cartridge Usage per Device Is on the Rise Cartridges per device 2007 2008 2009 2010 2011E 2012E 2013E 2014E 2015E North America 3.5 3.5 3.6 3.9 4.2 4.5 4.5 4.6 4.8 Asia-Pacific 3.7 3.5 3.6 3.7 3.8 3.8 3.9 4.0 4.1 EMEA 3.4 3.3 3.3 3.4 3.6 3.8 4.0 4.2 4.4 Latin America 3.4 3.2 3.2 3.3 3.4 3.4 3.5 3.6 3.7 Total 3.5 3.4 3.4 3.6 3.8 4.0 4.1 4.2 4.3 Laser MFP and printers 2.4 2.4 2.3 2.4 2.4 2.5 2.5 2.6 2.7 Inkjet MFP and printers 3.8 3.7 3.8 4.1 4.3 4.5 4.7 4.8 4.9 MFPs 3.7 3.6 3.7 4.0 4.2 4.4 4.5 4.6 4.8 Printers 3.4 3.2 3.2 3.3 3.3 3.4 3.4 3.4 3.5 Copiers stand-alone 10.2 9.6 9.0 9.0 9.1 9.2 9.4 9.8 11.8
Source: Lyra Research, Credit Suisse IT Survey.
Average cartridge ASPs to erode moderately through 2015. To our hardware installed base, we apply our assumption for average annual cartridge use to arrive at our annual cartridge shipment estimates. From here, we apply the average cartridge ASP assumptions, for which we have relied on Lyra Research, and which are corroborated by results from the Credit Suisse IT Survey. Cartridge ASPs are sensitive to foreign exchange volatility, or company specific promotions. Going forward, we expect modest erosion on cartridge ASPs on a like-for-like basis. Nevertheless, we estimate global average cartridge ASPs will decline 2% per annum through 2015, owing to mix shifts within cartridge demand. (See Figure 416.)

16 March 2011
IT Hardw
are 333
Figure 416: Credit Suisse Supplies Revenues Forecasts by Region, Output Technology and Function—2007-15 US$ in millions, unless otherwise stated
1) We expect the global printer hardware installed base to decline by 1% in each 2011/12 to 541mn and 536mn respectively. Our unit forecasts are anchored by our belief that a ongoing hardware refresh will continue to drive consolidation and thus contract our hardware installed base over time. As such, over the next five years we think the global hardware installed base for printers will decline to 535mn (by 2015).
2) We forecast the average global cartridge usage per device will rise to 3.8 in 2011 and to 4.0 in 2012, representing 5% and 4% growth, respectively. Indeed, through the consolidation of single-function printers to MFPs (both laser MFPs and inkjet AIOs), we expect cartridge usage to rise per device. We forecast this attach rate can rise at 4% per annum to 4.3 cartridges in 2015.
3) Average cartridge retail ASPs to decline to $35.5 in 2011 and to $34.8 in 2012, representing a 3% and 2% decline respectively. We anticipate modest erosion on cartridge ASPs on a like-for-like basis. Longer term, we expect the global average cartridge ASP will erode 2% per annum through 2015 to $32.4, owing to mix shifts within cartridge demand.
4) Driving supplies revenues of $73bn in 2011 and $74bn in 2012, representing flat and 1% growth, respectively. Over the next five years, we believe supplies revenues should rise 1% per annum to $75bn in 2015.
1
2
3
4
2007 2008 2009 2010 2011E 2012E 2013E 2014E 2015E 10-15E CAGRPrinter Hardware Installed BaseNorth America 173,914 175,874 167,203 157,527 152,089 148,681 148,871 149,074 146,914 -1.4%Asia-Pacific 130,989 142,969 145,887 144,730 146,894 148,720 150,984 151,939 154,425 1.3%EMEA 195,177 203,738 200,399 194,309 190,809 186,257 183,486 181,151 178,918 -1.6%Latin America 38,075 44,706 46,666 49,252 51,155 52,420 53,505 54,147 55,104 2.3%Total 538,155 567,287 560,155 545,818 540,947 536,078 536,846 536,310 535,361 -0.4%
Annual Cartridges Per DeviceNorth America 3.5 3.5 3.6 3.9 4.2 4.5 4.5 4.6 4.8 4.0%Asia-Pacific 3.7 3.5 3.6 3.7 3.8 3.8 3.9 4.0 4.1 2.0%EMEA 3.4 3.3 3.3 3.4 3.6 3.8 4.0 4.2 4.4 4.8%Latin America 3.4 3.2 3.2 3.3 3.4 3.4 3.5 3.6 3.7 2.4%Average 3.5 3.4 3.4 3.6 3.8 4.0 4.1 4.2 4.3 3.5%
Total CartridgesNorth America 611,134 607,657 599,721 621,816 646,218 664,281 677,024 686,127 705,076 2.5%Asia-Pacific 480,013 505,533 520,831 534,316 551,516 568,733 589,378 608,823 628,185 3.3%EMEA 655,302 669,098 658,643 670,350 692,486 713,912 736,424 756,141 781,734 3.1%Latin America 130,418 144,310 151,167 162,456 171,484 179,965 188,550 196,390 204,761 4.7%Total 1,876,866 1,926,598 1,930,363 1,988,938 2,061,704 2,126,892 2,191,376 2,247,481 2,319,756 3.1%
$ ASPNorth America $38.97 $39.11 $38.34 $37.12 $36.13 $35.67 $35.28 $34.44 $33.49 -2.0%Asia-Pacific $33.88 $35.02 $35.51 $34.51 $33.42 $32.51 $31.38 $30.26 $29.76 -2.9%EMEA $42.95 $42.84 $41.75 $39.34 $37.96 $37.05 $36.41 $35.85 $35.15 -2.2%Latin America $31.10 $32.09 $32.17 $31.04 $30.30 $29.50 $28.56 $27.62 $26.81 -2.9%Average $38.51 $38.81 $38.26 $36.67 $35.53 $34.77 $34.03 $33.19 $32.45 -2.4%
RevenuesNorth America 23,813 23,767 22,992 23,081 23,348 23,695 23,886 23,628 23,616 0.5%Asia-Pacific 16,263 17,704 18,497 18,441 18,433 18,491 18,495 18,424 18,692 0.3%EMEA 28,144 28,663 27,497 26,372 26,285 26,447 26,813 27,108 27,477 0.8%Latin America 4,056 4,631 4,864 5,042 5,195 5,310 5,385 5,423 5,489 1.7%Total $72,276 $74,765 $73,849 $72,936 $73,260 $73,943 $74,579 $74,583 $75,274 0.6%
1) We expect the global printer hardware installed base to decline by 1% in each 2011/12 to 541mn and 536mn respectively. Our unit forecasts are anchored by our belief that a ongoing hardware refresh will continue to drive consolidation and thus contract our hardware installed base over time. As such, over the next five years we think the global hardware installed base for printers will decline to 535mn (by 2015).
2) We forecast the average global cartridge usage per device will rise to 3.8 in 2011 and to 4.0 in 2012, representing 5% and 4% growth, respectively. Indeed, through the consolidation of single-function printers to MFPs (both laser MFPs and inkjet AIOs), we expect cartridge usage to rise per device. We forecast this attach rate can rise at 4% per annum to 4.3 cartridges in 2015.
3) Average cartridge retail ASPs to decline to $35.5 in 2011 and to $34.8 in 2012, representing a 3% and 2% decline respectively. We anticipate modest erosion on cartridge ASPs on a like-for-like basis. Longer term, we expect the global average cartridge ASP will erode 2% per annum through 2015 to $32.4, owing to mix shifts within cartridge demand.
4) Driving supplies revenues of $73bn in 2011 and $74bn in 2012, representing flat and 1% growth, respectively. Over the next five years, we believe supplies revenues should rise 1% per annum to $75bn in 2015.
11
22
33
44
2007 2008 2009 2010 2011E 2012E 2013E 2014E 2015E 10-15E CAGRPrinter Hardware Installed BaseNorth America 173,914 175,874 167,203 157,527 152,089 148,681 148,871 149,074 146,914 -1.4%Asia-Pacific 130,989 142,969 145,887 144,730 146,894 148,720 150,984 151,939 154,425 1.3%EMEA 195,177 203,738 200,399 194,309 190,809 186,257 183,486 181,151 178,918 -1.6%Latin America 38,075 44,706 46,666 49,252 51,155 52,420 53,505 54,147 55,104 2.3%Total 538,155 567,287 560,155 545,818 540,947 536,078 536,846 536,310 535,361 -0.4%
Annual Cartridges Per DeviceNorth America 3.5 3.5 3.6 3.9 4.2 4.5 4.5 4.6 4.8 4.0%Asia-Pacific 3.7 3.5 3.6 3.7 3.8 3.8 3.9 4.0 4.1 2.0%EMEA 3.4 3.3 3.3 3.4 3.6 3.8 4.0 4.2 4.4 4.8%Latin America 3.4 3.2 3.2 3.3 3.4 3.4 3.5 3.6 3.7 2.4%Average 3.5 3.4 3.4 3.6 3.8 4.0 4.1 4.2 4.3 3.5%
Total CartridgesNorth America 611,134 607,657 599,721 621,816 646,218 664,281 677,024 686,127 705,076 2.5%Asia-Pacific 480,013 505,533 520,831 534,316 551,516 568,733 589,378 608,823 628,185 3.3%EMEA 655,302 669,098 658,643 670,350 692,486 713,912 736,424 756,141 781,734 3.1%Latin America 130,418 144,310 151,167 162,456 171,484 179,965 188,550 196,390 204,761 4.7%Total 1,876,866 1,926,598 1,930,363 1,988,938 2,061,704 2,126,892 2,191,376 2,247,481 2,319,756 3.1%
$ ASPNorth America $38.97 $39.11 $38.34 $37.12 $36.13 $35.67 $35.28 $34.44 $33.49 -2.0%Asia-Pacific $33.88 $35.02 $35.51 $34.51 $33.42 $32.51 $31.38 $30.26 $29.76 -2.9%EMEA $42.95 $42.84 $41.75 $39.34 $37.96 $37.05 $36.41 $35.85 $35.15 -2.2%Latin America $31.10 $32.09 $32.17 $31.04 $30.30 $29.50 $28.56 $27.62 $26.81 -2.9%Average $38.51 $38.81 $38.26 $36.67 $35.53 $34.77 $34.03 $33.19 $32.45 -2.4%
RevenuesNorth America 23,813 23,767 22,992 23,081 23,348 23,695 23,886 23,628 23,616 0.5%Asia-Pacific 16,263 17,704 18,497 18,441 18,433 18,491 18,495 18,424 18,692 0.3%EMEA 28,144 28,663 27,497 26,372 26,285 26,447 26,813 27,108 27,477 0.8%Latin America 4,056 4,631 4,864 5,042 5,195 5,310 5,385 5,423 5,489 1.7%Total $72,276 $74,765 $73,849 $72,936 $73,260 $73,943 $74,579 $74,583 $75,274 0.6%
Source: Company data, Credit Suisse estimates.

16 March 2011
IT Hardware 334
Offset by a more pages printed per device. The consolidation of printers, while driving a smaller installed base in the long term, will result in the installed base itself being more productive from a vendor’s standpoint. As such, even with a shrinking installed base, industry supplies revenue can remain flat in the long term. We forecast supplies revenue by applying a supplies attach to our printer hardware installed base model, using inputs from Lyra Research. Globally, Lyra Research estimates that the average number of cartridges used per device annually was 3.6 in 2010, rising slightly from 3.4 over the past three years. Looking ahead, acknowledging that supplies attach rates will vary by region, function of the printer, type of printer (MFP versus single-function), and even by output technologies (laser toner and inkjets), we estimate cartridge supplies will increase to 3.8 in 2011, 4.0 in 2012, and reach 4.3 by 2015. Furthermore, consistent with historical trends, we assume that global supplies ASPs will decline at a modest 2% CAGR in 2010-15.
Page growth—several trends in play, but net impact is neutral in our view. There are several puts and takes driving page growth in the long term. While the shift from offset presses to digital presses in production environments (given ease of mass customization) is a positive for printed pages, offsets to this include fewer printed pages as content increasingly goes online (e-bills, social networking, and photo sharing websites) and onto alternative consumption devices including smartphones and tablets. Overall, while the bias is for pages printed to grow rather than decline, we do not expect page growth to be a meaningful revenue driver for the printing hardware and supplies market.

16 March 2011
IT Hardware 335
Managed Print—The Bright Spot in Printing With an industry backdrop that is structurally pressured by hardware declines, near-flat hardware and supplies revenue growth, and a double-digit growth business with annuity-like qualities is indeed a relatively secular growth opportunity. The recent macroeconomic downturn created an opportunity to reduce printing costs and vendors including Xerox, Hewlett-Packard, Ricoh/IKON, and Canon have positioned their respective printing businesses to fill this increasing need.
The MPS market opportunity. The managed print services (MPS) market, which drove over $8.5bn in sales in 2010, is still evolving and is in the early stages of adoption. Initially, customers perceived MPS to be no different than basic print services (warranty for breaks and fixes, technical support, and minimal remote monitoring and billing)—with limited value. However, MPS vendors were drawn to the annuity-like business of services, and have worked to change the perception of MPS, to show that it can create incremental value for CIOs. MPS is essentially a form of outsourced print management to proactively manage (by installing, moving, adding, and replacing) devices in the field, optimizing print efficiencies through hardware consolidation, and minimizing page output to reduce printing costs. According to a survey performed by Gartner, MPS can yield a 10-30% reduction in overall printing cost. IDC expects the MPS market to grow at a 11% CAGR in the long term, becoming a $14bn-plus market by 2015.
Figure 417: Managed Print Services—11% CAGR Makes it the Place to be in Printing US$ in millions, unless otherwise stated
$0
$2,000
$4,000
$6,000
$8,000
$10,000
$12,000
$14,000
$16,000
2007 2008 2009 2010 2011E 2012E 2013E 2014E 2015E
Asia-Pacific incl. Japan Latin America North America Western Europe CEMA
Source: IDC, Worldwide and US Outsourced Print and Document Services 2010-2014 Forecast and Analysis Credit Suisse estimates.
As shown in Figure 417, North America is expected to drive the bulk of MPS growth. This should not be surprising given the size of the hardware installed base, which we estimate is roughly 30% of the global installed base. Western Europe will also offer a significant opportunity for MPS, with 27% of the global hardware install base. While the remaining regions currently appear to offer little opportunity, we are still in the early innings of the MPS adoption. More importantly, if we consider those vendors without services of their own, relationships with providers of managed print and document services will only be additive to their overall market.

16 March 2011
IT Hardware 336
MPS enables more stable customer relationships, provides visibility. In recent years, MPS has evolved from a source of expense, into a service that can deliver on reducing the overall print costs associated with printing and copying. To do this, MPS vendors help customers consolidate their installed base and centralize purchasing needs. For MPS vendors that also sell hardware, the consolidation of hardware was a solid move as it had compounding effects on the company’s own profits. First, as hardware is consolidated, often on MFP devices, the vendor can sell less hardware, which typically is a loss leader in the industry, carrying margins that are below that of supplies. Second, after consolidation, devices may tilt to one vendor, improving the opportunity for more supplies capture. Third, in managing the customer’s fleet of printers, vendors can better time sales insertions to replenish supplies, sales, and warranty related services. Last, these services contracts, typically signed over a three to five year period, offer visibility and provide stability compared with the typical hardware refresh cycles, which have historically been volatile. Based on IDC, Lexmark held an 8% share in MPS in 2009, behind Xerox at 49%, HP with 21%s and Canon with 13%. (See Figure 418.)
Figure 418: Vendor Market Shares in Managed Printer Services over 2008-09 US$ in millions, unless otherwise stated 2008 2009 change (bps) 2008 share, % 2009 share, % Xerox 3,650 3,800 4% 51% 49% Hewlett-Packard 1,300 1,600 23% 18% 21% Ricoh (incl. Ikon) 890 1,000 12% 12% 13% Lexmark 333 600 80% 5% 8% Canon 183 220 20% 3% 3% Pitney Bowes 214 200 -7% 3% 3% Other vendors 630 380 -40% 9% 5%
Total $7,200 $7,800 8% 100% 100% Source: IDC, Worldwide and US Outsourced Print and Document Services 2010-2014 Forecast and Analysis (September 2010).
MPS will evolve further, tailored to customers’ expertise and geographies. Traditionally, MPS services have been positioned for general enterprises and SMBs markets. Indeed, as the industry matures, we expect vendors will further tailor their offerings to specific verticals and to their respective geographies. As a result, we believe MPS vendors will continue to invest organically and inorganically to improve their solutions by vertical and to expand distribution of services globally. In addition, broader document services, e.g., electronic documents, workflow, and associated consulting, will likely factor.
Credit Suisse Printing Vendor Scorecard—HP Leads In order to develop a bias on how printing hardware market shares will evolve, we developed a proprietary scorecard to rank the key printing hardware vendors across seven metrics that we believe are important for success in the printing market. These include product portfolio, total cost of ownership, managed print services capability, reliability, maintenance and support, distribution, and sales channels. Based on our scorecard, we arrive at the following conclusions for the key vendors.
HP ranks first in our scorecard, owning to high scores in almost all key metrics, particularly in reliability, maintenance and support, and managed print services. The company gets relatively lower scores in total cost of ownership. Overall, we believe HP’s leading position is sustainable and the company is well positioned to modestly grow market share.
Xerox ranks second in our scorecard, owing to high scores in key metrics of reliability and maintenance and support. While the company gets relatively lower scores in distribution, and sales, recall Xerox is inherently limited by its joint-venture with Fuji-Xerox. Overall, we believe Xerox is best positioned to defend its leading position in managed print services, which could help drive market share in gains in hardware.

16 March 2011
IT Hardware 337
Canon ranks third in our scorecard, with high scores in product portfolio and reliability, offset by lower scores in total cost of ownership and managed print services. Overall, we believe Canon’s market share will be stable going forward.
Lexmark ranks fourth in our scorecard, as scores in total cost of ownership and reliability are offset by relatively lower scores in product portfolio and managed print services. Overall, we believe Lexmark’s market share will remain stagnant going forward, with a declining bias as the company continues to deemphasizes its inkjet business.

16 March 2011
IT Hardw
are 338
Figure 419: Hewlett-Packard Ranks First on our Proprietary Credit Suisse Printer Vendor Scorecard
Printer Scorecard Weighting HP Xerox Canon Lexmark Epson
Rank (weighted) 1 2 3 4 5Score (weighted) 6.1 5.9 5.0 5.0 4.0
Rank printer HW market share 1 5 2 4 3Global printer HW unit share (2010) % 43% 1% 18% 3% 14%
Rank printer HW revenue share 1 3 2 5 4Global printer revenue share (2010) % 18% 12% 14% 3% 5%
Rank supplies revenue share 1 5 2 3 4Global Supplies revenue share (2010) % 37% 5% 14% 9% 7%
Key metrics:Product portfolio (breadth) 12% 8 7 7 5 5Total Cost of Ownership 21% 6 6 6 6 6Managed print services 13% 8 10 4 5 0Reliability 21% 8 8 8 8 6Maintenance/Support 17% 8 8 6 6 6Distribution 10% 8 6 6 6 6Sales 6% 8 6 6 6 6
HP ranks first in our scorecard owning to high scores in almost all key metrics, particularly in reliability, maintenance/support and managed print services. The company gets relatively lower scores in total cost of ownership. Overall, we believe HP’s leading position is sustainable and the company is well positioned to grow share modestly.
Xerox ranks second in our scorecard owing to high scores in key metrics of reliability and maintenance/support. While the company gets relatively lower scores in distribution, and sales, recall Xerox is inherently limited by its joint-venture with Fuji-Xerox. Overall, we believe Xerox is best positioned to defend its leading position in managed print services, which could help drive share in gains in hardware.
Canon ranks third in our scorecard with high scores in product portfolio and reliability, offset by lower scores in total cost of ownership and managed print services. Overall, we believe Canon’s share will be stable going forward.
Lexmark ranks fourth in our scorecard as scores in total cost of ownership and reliability are offset by relatively lower scores in product portfolio and managed print services. Overall, we believe Lexmark’s market share will remain stagnant going forward with a declining bias as the company continues to deemphasizes its inkjet business.
Epson ranks fifth in our scorecard as scores in total cost of ownership and reliability are offset by lower scores in product portfolio and managed print services. Overall, we believe Epson’s share remain vulnerable going forward.
22
3311
44 55
11
22
33
44
55
Source: Gartner, Lyra Research, Credit Suisse IT Survey, Credit Suisse estimates.

16 March 2011
IT Hardware 339
HP—Positioned for Modest Market Share Gains As seen in Figure 420, HP ranks first in our printing vendor scorecard. This ranking leads us to believe HP’s hardware market share will continue to rise through 2015 to 45.0%, from 43.3% in 2010. Furthermore, while the profitability of the hardware business is low we believe that this continues to drive profitable supplies growth.
Figure 420: We Expect HP’s Market Share Will Rise Through 2015 to 45.0%, from 43.3% as of 2010 2006 2007 2008 2009 2010 2011E 2012E 2013E 2014E 2015E
Laser 13.5% 18.3% 20.0% 16.0% 18.4% 19.7% 20.8% 22.2% 23.2% 21.3%Inkjet 47.0% 46.5% 46.5% 45.3% 47.2% 48.2% 49.4% 51.4% 52.5% 53.7%
Total MFP 42.4% 42.4% 42.3% 40.7% 42.0% 42.6% 43.3% 44.7% 45.2% 45.0%Laser 51.3% 53.9% 50.6% 42.7% 43.4% 41.4% 37.6% 37.0% 34.3% 33.4%Inkjet 42.5% 42.5% 42.5% 42.5% 42.5% 42.5% 42.5% 42.5% 42.5% 42.5%
Total Printers 40.8% 44.6% 43.7% 39.9% 46.2% 45.6% 44.4% 45.8% 44.8% 46.5%Copier standalone NA NA NA NA NA NA NA NA NA NASheetfed MFP 49.9% 49.9% 55.7% 58.9% 48.1% 44.0% 40.9% 39.5% 39.6% 34.0%
Global HP % share 41.3% 43.2% 42.8% 40.5% 43.3% 43.3% 43.4% 44.7% 44.8% 45.0%
Source: Gartner, Credit Suisse estimates.
Product Portfolio (Breadth): (8/10)
On product portfolio, i.e. breadth, we give HP a score of 8/10, resulting in a first place ranking among its peers. We evaluate this metric by using two approaches, including the Credit Suisse IT Survey and our proprietary analysis of HP’s product portfolio. We then average the scores. As seen in Figure 421, per the Credit Suisse IT Survey, HP was ranked first ahead Xerox, Canon, Lexmark, and Epson.
Figure 421: HP Ranks First in Product Portfolio (Breadth) please rate the following printer vendors across the attributes below, using the following scale: 1 = Very poor performance 5 = Excellent performance NA = Not familiar with this vendor / attribute
Average
0.0
0.5
1.0
1.5
2.0
2.5
3.0
3.5
4.0
4.5
5.0
HP Xerox Lexmark Canon Epson
Source: Credit Suisse IT Survey, February 2011.
In addition, we reviewed HP’s entire printer product portfolio based on use (SMB and enterprise versus home and SOHO professional), function group (printer, MFP, and AIO), output technology (inkjet, laser, photo-capable, and large format), color (monochrome and color), and product features including print, copy, scan, fax, email, touch-screen, web-enabled, Ethernet, Wi-Fi, Bluetooth, or direct USB. This approach measures the breadth of the portfolio. As shown in Figure 422, HP’s portfolio includes over 92 models with an even balance across each of the categories discussed in this section. In terms of features, many of HP’s printers are touch-screen, Ethernet, and WiFi enabled.

16 March 2011
IT Hardware 340
Figure 422: CS Printer Portfolio Database Vendors # of Average
Devices Price Professional Home Color Mono Photo Inkjet Laser Large format Printer MFP AIOHewlett-Packard 92 $1,029 72 20 74 18 7 26 46 13 64 11 17
Canon 92 $452 70 22 75 17 24 10 28 30 43 27 22Epson 40 $273 4 36 40 0 20 20 0 0 22 0 18
Lexmark 18 $716 48 13 34 27 0 9 52 0 43 9 9Dell 32 $665 28 4 17 15 0 4 28 0 19 9 4
Xerox 38 $4,458 38 0 20 18 0 0 38 0 10 28 0
Vendors # of AverageDevices Price Print Copy Scan Fax Email Touchscreen Web-enable Ethernet Wi-Fi Bluetooth Direct USB
Hewlett-Packard 92 $1,029 92 28 28 18 2 11 4 57 25 3 92Canon 92 $452 92 44 59 28 0 7 0 19 14 21 90Epson 40 $273 40 18 18 11 0 3 0 22 17 1 40
Lexmark 18 $716 61 21 21 15 3 11 0 50 32 1 60Dell 32 $665 32 10 10 7 0 1 0 27 7 0 30
Xerox 38 $4,458 38 28 28 27 24 13 0 22 7 0 18
Features
Tone Output Technology FunctionUse
Source: Company data, Credit Suisse.
Total Cost of Ownership: HP (6/10)
On total cost of ownership, we give HP a score of 6/10. We evaluate this metric based on the results from the Credit Suisse IT Survey, in which respondents were asked to rank printing vendors’ total cost of ownership. As seen in Figure 423, per the Credit Suisse IT Survey, HP was ranked first by survey respondents, ahead of Canon, Lexmark, Xerox, and Epson.
Figure 423: Total Cost of Ownership—HP, Lexmark, and Canon Lead please rate the following printer vendors across the attributes below, using the following scale: 1 = Very poor performance 5 = Excellent performance NA = Not familiar with this vendor / attribute
Average
2.6
2.7
2.8
2.9
3.0
3.1
3.2
3.3
3.4
3.5
3.6
HP Xerox Lexmark Canon Epson
Source: Credit Suisse IT Survey, February 2011.
Managed Print Services (MPS): HP (8/10)
On managed print services, HP scores 8/10, resulting in a second place ranking among its peers. We evaluate this metric based on the results of Credit Suisse IT Survey, in which respondents were asked to choose their provider of managed print services. As seen in Figure 424, per the Credit Suisse IT Survey, HP ranks second by survey respondents, behind Xerox, but ahead of Canon, Lexmark, and Epson.

16 March 2011
IT Hardware 341
Figure 424: Nearly a Quarter of Respondents Chose HP for Managed Print Services % percentage of respondents purchasing managed print services from the following vendors:
0%
10%
20%
30%
40%
50%
60%
HP Xerox Lexmark Canon Epson Other
Source: Credit Suisse IT Survey, February 2011.
Furthermore, HP is gaining market share overall according to IDC’s marketing sizing of the managed print service market. According to IDC, HP’s MPS revenues grew 23% in 2009, well ahead of the industry growth of 8%, and gained 300 basis points in market share to 20%, from 18% in 2008.
Figure 425: HP Has 20% Market Share of the Managed Print Services Market in 2009 % of revenues
Xerox48%
Hewlett-Packard20%
Ricoh (incl. Ikon)13%
Lexmark8%
Canon3%
Pitney Bowes3%
5%
Source: Gartner.
Reliability: HP (8/10)
On reliability, we give HP a score of 8/10. We evaluate this metric based on the results of the Credit Suisse IT Survey, in which respondents were asked to rank printing vendors’ hardware reliability. As seen in Figure 426, per the Credit Suisse IT Survey, HP was ranked first by survey respondents, ahead of Xerox, Canon, Lexmark, and Epson. Of all the survey questions and results, reliability is the only area in which HP only modestly inches ahead of its peers.

16 March 2011
IT Hardware 342
Figure 426: Reliability—HP leads Xerox and Canon please rate the following printer vendors across the attributes below, using the following scale: 1 = Very poor performance 5 = Excellent performance NA = Not familiar with this vendor / attribute
Average
0.0
0.5
1.0
1.5
2.0
2.5
3.0
3.5
4.0
4.5
HP Xerox Lexmark Canon Epson
Source: Credit Suisse IT Survey, February 2011.
Maintenance and Support: HP (8/10)
On maintenance and support, we give HP a score of 8/10. We evaluate this metric based on the results of the Credit Suisse IT Survey, in which respondents were asked to rank printing vendors’ quality of maintenance and support. As seen in Figure 427, per the Credit Suisse IT Survey, HP was ranked first by survey respondents, ahead of Xerox, Canon, Lexmark, and Epson.
Figure 427: Maintenance and Support—HP Leads Xerox and Canon Please rate the following printer vendors across the attributes below, using the following scale: 1 = Very poor performance 5 = Excellent performance NA = Not familiar with this vendor / attribute
Average
0.0
0.5
1.0
1.5
2.0
2.5
3.0
3.5
4.0
HP Xerox Lexmark Canon Epson
Source: Credit Suisse IT Survey, February 2011.
Distribution: HP (8/10)
On distribution, we give HP a score of 8/10. We evaluate this metric based on the results of the Credit Suisse IT Survey, in which respondents were asked to rank printing vendors’ ability to distribute its products and services. As seen in Figure 428, per the Credit Suisse

16 March 2011
IT Hardware 343
IT Survey, HP was ranked first by survey respondents, ahead of Xerox, Canon, Lexmark, and Epson.
Figure 428: Distribution—HP Leads Xerox and Canon please rate the following printer vendors across the attributes below, using the following scale: 1 = Very poor performance 5 = Excellent performance NA = Not familiar with this vendor / attribute
Average
0.0
0.5
1.0
1.5
2.0
2.5
3.0
3.5
4.0
4.5
HP Xerox Lexmark Canon Epson
Source: Credit Suisse IT Survey, February 2011.
Also, we have reviewed HP revenue share of the distribution channel for printing. Based on our analysis in Figure 429, HP has the best representation across all the distribution channels, in addition to having significant penetration in the key major channels, including dealer chain, direct sales force, and local dealers. These channels account for 67% of global printing hardware revenues.

16 March 2011
IT Hardware 344
Figure 429: HP Has the Best Representation across All the Distribution Channels
2008 2009 2010 HP Canon Xerox Epson Lexmark OtherDealer Chain 15% 14% 14% -8% 14% 21% 12% 4% 6% 44%Direct Fax/Phone/Web 3% 3% 2% -11% 34% 11% 4% 8% 7% 36%Direct Retail 0% 0% 0% 11% 0% 10% 0% 0% 0% 89%Direct Salesforce 24% 25% 25% -2% 3% 9% 25% 0% 0% 62%General Merchandiser 5% 5% 5% -10% 36% 17% 2% 21% 5% 20%Indirect Fax/Phone/Web 3% 3% 3% -8% 51% 17% 1% 8% 4% 19%Local Dealer 28% 28% 28% -4% 18% 15% 8% 4% 3% 53%PC Store 5% 5% 5% -3% 32% 17% 1% 17% 2% 31%PC Superstore 4% 4% 4% -10% 31% 27% 3% 15% 5% 18%Value-Added Reseller 13% 13% 13% -3% 26% 11% 7% 4% 7% 45%Total 100% 100% 100% -5% 18% 14% 12% 5% 3% 48%
2008 2009 2010 HP Canon Xerox Epson Lexmark OtherDealer Chain 15% 14% 14% -8% 11% 20% 14% 10% 24% 13%Direct Fax/Phone/Web 3% 3% 2% -11% 4% 2% 1% 4% 5% 2%Direct Retail 0% 0% 0% 11% 0% 0% 0% 0% 0% 0%Direct Salesforce 24% 25% 25% -2% 5% 15% 55% 0% 2% 33%General Merchandiser 5% 5% 5% -10% 9% 5% 1% 20% 6% 2%Indirect Fax/Phone/Web 3% 3% 3% -8% 9% 4% 0% 5% 4% 1%Local Dealer 28% 28% 28% -4% 27% 29% 20% 21% 22% 31%PC Store 5% 5% 5% -3% 9% 6% 0% 17% 3% 3%PC Superstore 4% 4% 4% -10% 7% 7% 1% 12% 6% 2%Value-Added Reseller 13% 13% 13% -3% 19% 11% 8% 10% 28% 13%Total 100% 100% 100% -5% 100% 100% 100% 100% 100% 100%
Distibution % Share of CompanyDistribtion Channel $ Revenues CAGR 2007-10
CAGR 2007-10
2010 % Distribution Channel ShareDistribtion Channel $ Revenues
22
11 Direct Retail has been the fastest rising distribution channel. Nevertheless, the segment remains a small portion of overall industry revenues at less that 1%
Direct Salesforce is the second largest distribution channel in the printing industry at 25% and is relatively outperforming broader market growth.
Local dealer is the largest distribution channel in the printing industry at 28% and is relatively outperforming the overall market growth.
33
11
22
33
Hewlett-Packard has 18% global printer hardware revenue share with a solid footprint across many of the distribution channels. In particular, HP is strong in dealer chain, local dealer, and value-adder resellers, which transact over 55% of its global hardware revenues. Further, HP generates 57% of its revenues from dealer chains, local dealers, and value-added resellers and will need to maintain its market positioning here.
Canon has 14% global hardware revenue share with a solid print across many of the distribution channels. In particular, Canon is strong in dealer chain, direct sales force, and local dealers, which transact over 67% of its global hardware revenues. Canon has leading share in direct retail, the only growing distribution channel in printing. Further, Canon generates 65% of its revenues from dealer chains, direct sales force, and local dealer and will need to maintain its market positioning here.
Xerox has 12% global hardware revenue share and is strong in the direct sales force and dealer chain channels, which transact 39% of its global hardware revenues. To drive meaningful revenue share, Xerox needs to improve positioning in local dealer and value-added resellers. Xerox generates 55% of its revenues from its direct sales force
Epson has 5% global hardware revenue share and is strong in general merchandiser, PC store and PC superstore channels. However, these channels transact only 14% of its global hardware revenues. To drive meaningful revenue share, Epson will need to improve its position in direct sales force, dealer chain, and local dealer.
Lexmark has 3% global hardware revenue share and is relatively under-represented in all distribution channels. Direct Fax/Phone/Web and Valued-added reseller are the largest channel for Lexmark, each transacting 7% of its global hardware revenues.
Source: Gartner, Credit Suisse estimates.
Sales: HP (8/10)
On sales, we give HP a score of 8/10. We evaluate this metric based on the results of the Credit Suisse IT Survey, in which respondents were asked to rank printing vendors’ sales force quality in terms of service and delivery. As seen in Figure 430, per the Credit Suisse IT Survey, HP was ranked first by survey respondents, ahead of Xerox, Canon, Lexmark, and Epson.

16 March 2011
IT Hardware 345
Figure 430: Sales—HP, Xerox, and Canon Lead please rate the following printer vendors across the attributes below, using the following scale: 1 = Very poor performance 5 = Excellent performance NA = Not familiar with this vendor / attribute
Average
0.0
0.5
1.0
1.5
2.0
2.5
3.0
3.5
4.0
HP Xerox Lexmark Canon Epson
Source: Credit Suisse IT Survey, February 2011.

16 March 2011
IT Hardware 346
Xerox—Managed Print Services Leader As seen in Figure 419 and Figure 431, Xerox gets a second place ranking on our scorecard, and this leads us to believe that Xerox’s hardware market share will improve in the long term from only 1.2% in 2010. We highlight that while Xerox has only approximately 1% unit share, given exposure to laser and nonconsumer segments of the market, the company’s revenue share is over 12%.
Figure 431: We Expect Xerox to Rise Modestly in Share to 1.4% in 2015, from 1.2% in 2010 2006 2007 2008 2009 2010 2011E 2012E 2013E 2014E 2015E Laser 1.9% 1.7% 1.7% 2.3% 2.5% 2.4% 2.3% 2.2% 2.1% 2.1% Inkjet 17.9% 14.3% 9.0% 6.6% 4.8% 4.1% 3.5% 3.1% 2.8% 2.5% Total MFP 15.7% 12.5% 7.8% 5.9% 4.4% 3.8% 3.2% 2.9% 2.6% 2.4% Laser 7.9% 7.1% 6.8% 7.3% 5.5% 5.3% 4.9% 4.9% 5.0% 5.0% Inkjet 10.9% 8.1% 4.1% 2.0% 0.5% 0.5% 0.5% 0.5% 0.5% 0.6% Total Printers 8.9% 7.0% 5.0% 4.3% 3.3% 3.3% 3.3% 3.4% 3.6% 3.9% Copier standalone NA NA NA NA NA NA NA NA NA NA Sheetfed MFP 11.0% 12.6% 6.9% 4.5% 2.4% 0.0% 0.0% 0.0% 0.0% 0.0%
Global Lexmark % share 11.8% 9.9% 6.6% 5.3% 4.0% 3.5% 3.2% 3.0% 2.9% 2.8% Source: Company data, Credit Suisse estimates
Product Portfolio (Breadth): Xerox (7/10)
On product portfolio, i.e. breadth, we give Xerox a score of 7/10 resulting in a second place ranking among its peers. We evaluate this metric based on results from the Credit Suisse IT Survey as well as on our analysis of Xerox’s product portfolio. We take an average of the two scores. As seen in Figure 432, per the Credit Suisse IT Survey, Xerox was ranked second by survey respondents, behind HP, but ahead of Canon, Lexmark, and Epson.
Figure 432: Xerox Ranks Second in Product Portfolio (Breadth) please rate the following printer vendors across the attributes below, using the following scale: 1 = Very poor performance 5 = Excellent performance NA = Not familiar with this vendor / attribute
Average
0.0
0.5
1.0
1.5
2.0
2.5
3.0
3.5
4.0
4.5
5.0
HP Xerox Lexmark Canon Epson
Source: Credit Suisse IT Survey, February 2011.
In addition, we reviewed Xerox’s product portfolio based on use (SMB and enterprise versus home and SOHO professional), function group (printer, MFP, and AIO), output technology (inkjet, laser, photo-capable, and large format), color (monochrome and color), and product features including print, copy, scan, fax, email, touch-screen, web-enablement, Ethernet, Wi-Fi, Bluetooth, and direct USB. This approach was used to evaluate the breadth and functionalities of the product portfolio. As shown in Figure 433, Xerox’s

16 March 2011
IT Hardware 347
portfolio includes over 38 models for professional markets. Furthermore, all 38 models are based on laser technology, with tone balanced between color and monochrome. In terms of features, many of Xerox’s devices are Ethernet, email, and touchscreen enabled.
Figure 433: Credit Suisse Printer Portfolio Database—Xerox’s Broad Offering Is Focused on Laser, Enterprise Devices Vendors # of Average
Devices Price Professional Home Color Mono Photo Inkjet Laser Large format Printer MFP AIOHewlett-Packard 92 $1,029 72 20 74 18 7 26 46 13 64 11 17
Canon 92 $452 70 22 75 17 24 10 28 30 43 27 22Epson 40 $273 4 36 40 0 20 20 0 0 22 0 18
Lexmark 18 $716 17 1 9 9 0 1 17 0 8 10 0Dell 32 $665 28 4 17 15 0 4 28 0 19 9 4
Xerox 38 $4,458 38 0 20 18 0 0 38 0 10 28 0
Vendors # of AverageDevices Price Print Copy Scan Fax Email Touchscreen Web-enable Ethernet Wi-Fi Bluetooth Direct USB
Hewlett-Packard 92 $1,029 92 28 28 18 2 11 4 57 25 3 92Canon 92 $452 92 44 59 28 0 7 0 19 14 21 90Epson 40 $273 40 18 18 11 0 3 0 22 17 1 40
Lexmark 18 $716 18 10 10 6 0 8 0 12 1 1 17Dell 32 $665 32 10 10 7 0 1 0 27 7 0 30
Xerox 38 $4,458 38 28 28 27 24 13 0 22 7 0 18
Features
Tone Output Technology FunctionUse
Source: Company data, Credit Suisse.
Total Cost of Ownership: Xerox (6/10)
On the total cost of ownership metric, we give Xerox a score of 6/10. We evaluate this metric based on the results from the Credit Suisse IT Survey, in which respondents were asked to rank printing vendor’ total cost of ownership. As seen in Figure 434, per the Credit Suisse IT Survey, Xerox was ranked fourth by survey respondents, trailing HP, Canon, and Lexmark. This is Xerox’s poorest score among all of the printing-related survey questions.
Figure 434: Total Cost of Ownership—Xerox Lags Peers please rate the following printer vendors across the attributes below, using the following scale: 1 = Very poor performance 5 = Excellent performance NA = Not familiar with this vendor / attribute
Average
2.6
2.7
2.8
2.9
3.0
3.1
3.2
3.3
3.4
3.5
3.6
HP Xerox Lexmark Canon Epson
Source: Credit Suisse IT Survey, February 2011.
Managed Print Services (MPS): Xerox (10/10)
In managed print services, Xerox scores 10/10 and is in a solid first ranking among its peers. We evaluate this metric based on the results of the Credit Suisse IT Survey, in which respondents were asked to choose their provider of managed print services. As seen in Figure 435, per the Credit Suisse IT Survey, Xerox was ranked first by survey respondents, well ahead of HP, Canon, Lexmark, and Epson.

16 March 2011
IT Hardware 348
Figure 435: Xerox—Survey Supports Leading MPS Share % percentage of respondents purchasing managed print services from the following vendors:
0%
10%
20%
30%
40%
50%
60%
HP Xerox Lexmark Canon Epson Other
Source: Credit Suisse IT Survey, February 2011.
According to Gartner, Xerox is the clear leader in the managed print services market with over a 48% share. (See Figure 436.) In a distant second position is HP with a 20% share; however, HP grew faster than the overall market and gained nearly 200 basis points in share to 20% share in 2009, up from 18% in the prior year. Meanwhile, Xerox grew at a slower rate than the market and lost 300 basis points in share to 48% in 2009, down from 51% in 2009. Going forward, we believe Xerox’s MPS share is sustainable at current levels.

16 March 2011
IT Hardware 349
Figure 436: Xerox Has 48% Share of the Managed Print Services Market in 2009 % of revenues
Xerox48%
Lexmark8%
Ricoh (incl. Ikon)13%
Canon3%
Pitney Bowes3%Others
5%
Hewlett-Packard20%
Source: Gartner .
Reliability: Xerox (8/10)
On reliability, we give Xerox a score of 8/10. We evaluate this metric based on the results of the Credit Suisse IT Survey, in which respondents were asked to rank each printing vendor’s hardware reliability. As seen in Figure 437, per the Credit Suisse IT Survey, Xerox was ranked second by survey respondents, behind HP but ahead of Canon and Lexmark.

16 March 2011
IT Hardware 350
Figure 437: Reliability—Xerox Close Behind HP, Ahead of Other Peers please rate the following printer vendors across the attributes below, using the following scale: 1 = Very poor performance 5 = Excellent performance NA = Not familiar with this vendor / attribute
Average
0.0
0.5
1.0
1.5
2.0
2.5
3.0
3.5
4.0
4.5
HP Xerox Lexmark Canon Epson
Source: Credit Suisse IT Survey, February 2011.
Maintenance and Support: Xerox (8/10)
In maintenance and support category, we give Xerox a score of 8/10. We evaluate this metric based on the results of the Credit Suisse IT Survey, in which respondents were asked to rank each printing vendor’s quality of maintenance and support. As seen in Figure 438, per the Credit Suisse IT Survey, Xerox was ranked second by survey respondents, just behind HP and ahead of Canon.
Figure 438: Maintenance and Support—Xerox and HP Lead on this Metric please rate the following printer vendors across the attributes below, using the following scale: 1 = Very poor performance 5 = Excellent performance NA = Not familiar with this vendor / attribute
Average
0.0
0.5
1.0
1.5
2.0
2.5
3.0
3.5
4.0
HP Xerox Lexmark Canon Epson
Source: Credit Suisse IT Survey, February 2011.
Distribution: Xerox (6/10)
For the distribution category, we give Xerox a score of 6/10. We evaluate this metric based on the results of the Credit Suisse IT Survey, in which respondents were asked to rank each printing vendor’s ability to distribute its products and services. As seen in Figure 439,

16 March 2011
IT Hardware 351
per the Credit Suisse IT Survey, Xerox ranks second by survey respondents, behind HP but ahead of Canon.
Figure 439: Distribution—Xerox Lags HP but Leads Canon and Lexmark please rate the following printer vendors across the attributes below, using the following scale: 1 = Very poor performance 5 = Excellent performance NA = Not familiar with this vendor / attribute
Average
0.0
0.5
1.0
1.5
2.0
2.5
3.0
3.5
4.0
4.5
HP Xerox Lexmark Canon Epson
Source: Credit Suisse IT Survey, February 2011.
Additionally, we have reviewed Xerox’s revenue mix by distribution channels for printing. Based on our analysis in Figure 440, Xerox has a solid direct sales force and does well with dealer chains. To gain meaningful revenue share, Xerox needs to improve its positioning in the local dealer and value-adder reseller markets. Furthermore, Xerox is heavily dependent on its direct sales force (accounting for 55% of sales).

16 March 2011
IT Hardw
are 352
Figure 440: Xerox—Focused on the Direct Channel; Distribution is an Opportunity $ Revenues 2010 % Dis tribution channel share
2008 2009 2010 HP Canon Xerox Epson Lex mark OtherDealer Chain 15% 14% 14% -8% 14% 21% 12% 4% 6% 44%Direct Fax/Phone/Web 3% 3% 2% -11% 34% 11% 4% 8% 7% 36%Direct Retail 0% 0% 0% 11% 0% 10% 0% 0% 0% 89%Direct Salesforce 24% 25% 25% -2% 3% 9% 25% 0% 0% 62%General Merchandiser 5% 5% 5% -10% 36% 17% 2% 21% 5% 20%Indirect Fax/Phone/Web 3% 3% 3% -8% 51% 17% 1% 8% 4% 19%Local Dealer 28% 28% 28% -4% 18% 15% 8% 4% 3% 53%PC Store 5% 5% 5% -3% 32% 17% 1% 17% 2% 31%PC Su pers tore 4% 4% 4% -10% 31% 27% 3% 15% 5% 18%Value-Added Reseller 13% 13% 13% -3% 26% 11% 7% 4% 7% 45%Total 100% 100% 100% -5% 18% 14% 12% 5% 3% 48%
$ Revenues 2010 % Dis tribution channel share2008 2009 2010 HP Canon Xerox Epson Lex mark Other
Dealer Chain 15% 14% 14% -8% 11% 20% 14% 10% 24% 13%Direct Fax/Phone/Web 3% 3% 2% -11% 4% 2% 1% 4% 5% 2%Direct Retail 0% 0% 0% 11% 0% 0% 0% 0% 0% 0%Direct Salesforce 24% 25% 25% -2% 5% 15% 55% 0% 2% 33%General Merchandiser 5% 5% 5% -10% 9% 5% 1% 20% 6% 2%Indirect Fax/Phone/Web 3% 3% 3% -8% 9% 4% 0% 5% 4% 1%Local Dealer 28% 28% 28% -4% 27% 29% 20% 21% 22% 31%PC Store 5% 5% 5% -3% 9% 6% 0% 17% 3% 3%PC Su pers tore 4% 4% 4% -10% 7% 7% 1% 12% 6% 2%Value-Added Reseller 13% 13% 13% -3% 19% 11% 8% 10% 28% 13%Total 100% 100% 100% -5% 100% 100% 100% 100% 100% 100%
CAGR 2007-1 0
Distribution Channel
Distribution Channel CAGR 2007-1 0
22
11 Direct Retail has been the fastest rising distr ibution channel. Nevertheless, the segment remains a small portion of overall indus try revenues at less that 1%
Direct Sales force is the second largest distr ibution channel in the printing industry at 25% and is relatively outperforming broader market growth.
Local dealer is the largest distribution c hannel in the printing industry at 28% and is relatively outperforming the overall market growth.
33
11
22
33
Hew lett-Packard has 18% global printer hardware revenue share with a solid footprint acros s m any of the distribution channels. In particular, HP is strong in dealechain, local dealer, and value-adder resellers, which transact over 55% of its global hardware revenues. Further, HP generates 57% of its revenues from dealechains, local dealers, and value-added resellers and will need to maintain its m arket positioning here.
Canon has 14% global hardware revenue s hare with a solid print across many of the distribution channels. In particular, Canon is strong in dealer chain, direct saleforce, and local dealers, which transact over 67% of its global hardware revenues. Canon has leading share in direct retail, the only growing distribution channel printing. Further, Canon generates 65% of its revenues from dealer chains, direct sales force, and local dealer and will need to maintain its market positioning here.
Xerox has 12% global hardware revenue share and is strong in the direct sales force and dealer chain channels, which transact 39% of its global hardwarrevenues . To drive meaningful revenue share, Xerox needs to improve positioning in local dealer and value-added resellers. Xerox generates 55% of its revenuefrom its direct sales force
Epson has 5% global hardware revenue share and is strong in general merchandiser, PC store and PC superstore channels. However, these channels trans act on14% of its global hardware revenues. To drive meaningful revenue share, Epson will need to improve its position in direct sales force, dealer chain, and local dealer
Lexmark has 3% global hardware revenue share and is relatively under-represented in all distr ibution channels . Direc t Fax/Phone/Web and Valued-added reselleare the largest channel for Lexmark, each transacting 7% of its global hardware revenues.
Source: Company data, Credit Suisse estimates.

16 March 2011
IT Hardware 353
Sales: Xerox (6/10)
In the sales category, we give Xerox a score of 6/10. We evaluate this metric based on the results of the Credit Suisse IT Survey, in which respondents were asked to rank each printing vendor’s sales force quality in terms of customer service and delivery. As seen in Figure 441, per the Credit Suisse IT Survey, Xerox was ranked second by survey respondents, behind HP but ahead of Canon.
Figure 441: Sales—Xerox and HP Rank Highly Versus Peers please rate the following printer vendors across the attributes below, using the following scale: 1 = Very poor performance 5 = Excellent performance NA = Not familiar with this vendor / attribute
Average
0.0
0.5
1.0
1.5
2.0
2.5
3.0
3.5
4.0
HP Xerox Lexmark Canon Epson
Source: Credit Suisse IT Survey, February 2011.

16 March 2011
IT Hardware 354
Lexmark—Share Loss Likely As seen in Figure 442, owing to a second place ranking on our scorecard, which is based on the following scores, we believe Lexmark’s share will decline to 2.7% in 2015, from 4.0% in 2010.
Figure 442: We Expect Lexmark’s Share to Decline through 2015 to 2.8%, from 4.0% in 2010. 2006 2007 2008 2009 2010 2011E 2012E 2013E 2014E 2015E Laser 1.9% 1.7% 1.7% 2.3% 2.5% 2.4% 2.3% 2.2% 2.1% 2.1% Inkjet 17.9% 14.3% 9.0% 6.6% 4.8% 4.1% 3.5% 3.1% 2.8% 2.5% Total MFP 15.7% 12.5% 7.8% 5.9% 4.4% 3.8% 3.2% 2.9% 2.6% 2.4% Laser 7.9% 7.1% 6.8% 7.3% 5.5% 5.3% 4.9% 4.9% 5.0% 5.0% Inkjet 10.9% 8.1% 4.1% 2.0% 0.5% 0.5% 0.5% 0.5% 0.5% 0.6% Total Printers 8.9% 7.0% 5.0% 4.3% 3.3% 3.3% 3.3% 3.4% 3.6% 3.9% Copier standalone NA NA NA NA NA NA NA NA NA NA Sheetfed MFP 11.0% 12.6% 6.9% 4.5% 2.4% 0.0% 0.0% 0.0% 0.0% 0.0%
Global Lexmark % share 11.8% 9.9% 6.6% 5.3% 4.0% 3.5% 3.2% 3.0% 2.9% 2.8% Source: Company data, Credit Suisse estimates.
Product Portfolio (Breadth): Lexmark (5/10)
On product portfolio, i.e. breadth, we give Lexmark a score of 5/10 resulting in a fourth place ranking among peers. We evaluate this metric based on results from the Credit Suisse IT Survey as well as on and our analysis of Lexmark’s product portfolio. As seen in Figure 443, per the Credit Suisse IT Survey, Lexmark was ranked fourth by survey respondents, behind HP, Canon, and Xerox but ahead of Epson.
Figure 443: Lexmark Fourth in Product Portfolio (Breadth) please rate the following printer vendors across the attributes below, using the following scale: 1 = Very poor performance 5 = Excellent performance NA = Not familiar with this vendor / attribute
Average
0.0
0.5
1.0
1.5
2.0
2.5
3.0
3.5
4.0
4.5
5.0
HP Xerox Lexmark Canon Epson
Source: Credit Suisse IT Survey, February 2011.
In addition, we reviewed Lexmark’s product portfolio based on use (SMB and enterprise versus home and SOHO professional), function group (printer, MFP, and AIO), output technology (inkjet, laser, photo-capable, and large format), color (monochrome and color), and product features including print, copy, scan, fax, email, touch-screen, web-enabled, Ethernet, Wi-Fi, Bluetooth, or direct USB. This approach was used to evaluate the breadth and functionalities of the product portfolio. As shown in Figure 444, Lexmark’s portfolio includes 18 models, with a majority of the devices designed for professional markets and with predominantly laser output technology. In terms of features, Lexmark leads with WiFi

16 March 2011
IT Hardware 355
enabled printers, which we believe is a secular growth opportunity in terms of hardware models.
Figure 444: Credit Suisse Printer Portfolio Database—Lexmark’s Offerings Are Focused on the Professional Market Vendors # of Average
Devices Price Professional Home Color Mono Photo Inkjet Laser Large format Printer MFP AIOHewlett-Packard 92 $1,029 72 20 74 18 7 26 46 13 64 11 17
Canon 92 $452 70 22 75 17 24 10 28 30 43 27 22Epson 40 $273 4 36 40 0 20 20 0 0 22 0 18
Lexmark 18 $716 48 13 34 27 0 9 52 0 43 9 9Dell 32 $665 28 4 17 15 0 4 28 0 19 9 4
Xerox 38 $4,458 38 0 20 18 0 0 38 0 10 28 0
Vendors # of AverageDevices Price Print Copy Scan Fax Email Touchscreen Web-enable Ethernet Wi-Fi Bluetooth Direct USB
Hewlett-Packard 92 $1,029 92 28 28 18 2 11 4 57 25 3 92Canon 92 $452 92 44 59 28 0 7 0 19 14 21 90Epson 40 $273 40 18 18 11 0 3 0 22 17 1 40
Lexmark 18 $716 61 21 21 15 3 11 0 50 32 1 60Dell 32 $665 32 10 10 7 0 1 0 27 7 0 30
Xerox 38 $4,458 38 28 28 27 24 13 0 22 7 0 18
Features
Tone Output Technology FunctionUse
Source: Company data, Credit Suisse.
Total Cost of Ownership: Lexmark (6/10)
On the total cost of ownership metric, we give Lexmark a score of 6/10 based on the results from the Credit Suisse IT Survey. As seen in Figure 445, per the Credit Suisse IT Survey, Lexmark was ranked third by survey respondents, after HP and Canon.
Figure 445: Total Cost of Ownership—HP, Canon, and Lexmark lead please rate the following printer vendors across the attributes below, using the following scale: 1 = Very poor performance 5 = Excellent performance NA = Not familiar with this vendor / attribute
Average
2.6
2.7
2.8
2.9
3.0
3.1
3.2
3.3
3.4
3.5
3.6
HP Xerox Lexmark Canon Epson
Source: Credit Suisse IT Survey, February 2011.
Managed Print Services (MPS): Lexmark (5/10)
On managed print services, Lexmark scores 5/10 and is in fifth ranking among its peers. We evaluate this metric based on the results of Credit Suisse IT Survey (see Figure 446), in which respondents were asked to choose their provider of managed print services.

16 March 2011
IT Hardware 356
Figure 446: Nearly a Quarter of Respondents Chose HP for Managed Print Services % percentage of respondents purchasing managed print services from the following vendors:
0%
10%
20%
30%
40%
50%
60%
HP Xerox Lexmark Canon Epson Other
Source: Credit Suisse IT Survey, February 2011.
Despite indications from survey respondents, Lexmark outpaced the market in 2009 and gained 300 basis points of market share, to 8%. Nevertheless, Lexmark remains nearly 500 basis points from Ricoh with 13% and much further behind HP and Xerox with 20% and 48%, respectively. Lexmark has quite a bit of work to do to gain meaningful share in this market; however, the opportunity is there if it executes the opportunity.
Figure 447: Lexmark Has 48% Share of the Managed Print Services Market in 2009 % of revenues
Xerox48%
Lexmark8%
Ricoh (incl. Ikon)13%
Canon3%
Pitney Bowes3%Others
5%
Hewlett-Packard20%
Source: Gartner.

16 March 2011
IT Hardware 357
Reliability: Lexmark (8/10)
On reliability, we give Lexmark a score of 8/10 based on the results of the Credit Suisse IT Survey, in which respondents were asked to rank printing vendors’ hardware reliability. (See Figure 448.)
Figure 448: Reliability—Lexmark Lags HP, Xerox, and Canon please rate the following printer vendors across the attributes below, using the following scale: 1 = Very poor performance 5 = Excellent performance NA = Not familiar with this vendor / attribute
Average
0.0
0.5
1.0
1.5
2.0
2.5
3.0
3.5
4.0
4.5
HP Xerox Lexmark Canon Epson
Source: Credit Suisse IT Survey, February 2011.
Maintenance and Support: Lexmark (6/10)
On maintenance and support, we give Lexmark a score of 6/10 based on the results of the Credit Suisse IT Survey, in which respondents were asked to rank printing vendors’ quality of maintenance and support. (See Figure 449.)
Figure 449: Maintenance and Support—HP, Lexmark, and Canon Lead please rate the following printer vendors across the attributes below, using the following scale: 1 = Very poor performance 5 = Excellent performance NA = Not familiar with this vendor / attribute
Average
0.0
0.5
1.0
1.5
2.0
2.5
3.0
3.5
4.0
HP Xerox Lexmark Canon Epson
Source: Credit Suisse IT Survey, February 2011.

16 March 2011
IT Hardware 358
Distribution: Lexmark (6/10)
On distribution, we give Lexmark a score of 6/10 based on the results of the Credit Suisse IT Survey, in which respondents were asked to rank printing vendors’ ability to distribute its products and services. (See Figure 450.)
Figure 450: Distribution—Lexmark Lags HP and Xerox please rate the following printer vendors across the attributes below, using the following scale: 1 = Very poor performance 5 = Excellent performance NA = Not familiar with this vendor / attribute
Average
0.0
0.5
1.0
1.5
2.0
2.5
3.0
3.5
4.0
4.5
HP Xerox Lexmark Canon Epson
Source: Credit Suisse IT Survey, February 2011.
Another way we have looked at Lexmark’s score in printing is via the company’s revenue share in various distribution channels. Based on our analysis in Figure 451, Lexmark is relatively underrepresented in many of the distribution channels. Direct fax, phone, web, and valued-added resellers are the largest channels for Lexmark, but in order to gain meaningful revenue share, we note that Lexmark will need to improve its position in dealer chains and direct sales force channels.

16 March 2011
IT Hardw
are 359
Figure 451: Lexmark—Under Represented in Most Distribution Channels $ Revenues 2010 % Distribution channel share
2008 2009 2010 HP Canon Xerox Epson Lexmark OtherDealer Chain 15% 14% 14% -8% 14% 21% 12% 4% 6% 44%Direct Fax/Phone/Web 3% 3% 2% -11% 34% 11% 4% 8% 7% 36%Direct Retail 0% 0% 0% 11% 0% 10% 0% 0% 0% 89%Direct Salesforce 24% 25% 25% -2% 3% 9% 25% 0% 0% 62%General Merchandiser 5% 5% 5% -10% 36% 17% 2% 21% 5% 20%Indirect Fax/Phone/Web 3% 3% 3% -8% 51% 17% 1% 8% 4% 19%Local Dealer 28% 28% 28% -4% 18% 15% 8% 4% 3% 53%PC Store 5% 5% 5% -3% 32% 17% 1% 17% 2% 31%PC Superstore 4% 4% 4% -10% 31% 27% 3% 15% 5% 18%Value-Added Reseller 13% 13% 13% -3% 26% 11% 7% 4% 7% 45%Total 100% 100% 100% -5% 18% 14% 12% 5% 3% 48%
$ Revenues 2010 % Distribution channel share2008 2009 2010 HP Canon Xerox Epson Lexmark Other
Dealer Chain 15% 14% 14% -8% 11% 20% 14% 10% 24% 13%Direct Fax/Phone/Web 3% 3% 2% -11% 4% 2% 1% 4% 5% 2%Direct Retail 0% 0% 0% 11% 0% 0% 0% 0% 0% 0%Direct Salesforce 24% 25% 25% -2% 5% 15% 55% 0% 2% 33%General Merchandiser 5% 5% 5% -10% 9% 5% 1% 20% 6% 2%Indirect Fax/Phone/Web 3% 3% 3% -8% 9% 4% 0% 5% 4% 1%Local Dealer 28% 28% 28% -4% 27% 29% 20% 21% 22% 31%PC Store 5% 5% 5% -3% 9% 6% 0% 17% 3% 3%PC Superstore 4% 4% 4% -10% 7% 7% 1% 12% 6% 2%Value-Added Reseller 13% 13% 13% -3% 19% 11% 8% 10% 28% 13%Total 100% 100% 100% -5% 100% 100% 100% 100% 100% 100%
CAGR 2007-10Distribution Channel
Distribution Channel CAGR 2007-10
22
11 Direct Retail has been the fastest rising distribution channel. Nevertheless, the segment remains a small portion of overall industry revenues at less that 1%
Direct Sales force is the second largest distribution channel in the printing industry at 25% and is relatively outperforming broader market growth.
Local dealer is the largest distribution channel in the printing industry at 28% and is relatively outperforming the overall market growth.
33
11
22
33
Hewlett-Packard has 18% global printer hardware revenue share with a solid footprint across many of the distribution channels. In particular, HP is strong in dealer chain, local dealer, and value-adder resellers, which transact over 55% of its global hardware revenues. Further, HP generates 57% of its revenues from dealerchains, local dealers, and value-added resellers and will need to maintain its market positioning here.
Canon has 14% global hardware revenue share with a solid print across many of the distribution channels. In particular, Canon is strong in dealer chain, direct sales force, and local dealers, which transact over 67% of its global hardware revenues. Canon has leading share in direct retail, the only growing distribution channel in printing. Further, Canon generates 65% of its revenues from dealer chains, direct sales force, and local dealer and will need to maintain its market positioning here.
Xerox has 12% global hardware revenue share and is strong in the direct sales force and dealer chain channels, which transact 39% of its global hardware revenues. To drive meaningful revenue share, Xerox needs to improve positioning in local dealer and value-added resellers. Xerox generates 55% of its revenues from its direct sales force
Epson has 5% global hardware revenue share and is strong in general merchandiser, PC store and PC superstore channels. However, these channels transact only 14% of its global hardware revenues. To drive meaningful revenue share, Epson will need to improve its position in direct sales force, dealer chain, and local dealer.
Lexmark has 3% global hardware revenue share and is relatively under-represented in all distribution channels. Direct Fax/Phone/Web and Valued-added reseller are the largest channel for Lexmark, each transacting 7% of its global hardware revenues.
Source: Gartner, Credit Suisse estimates.

16 March 2011
IT Hardware 360
Sales: Lexmark (6/10)
On sales, we give Lexmark a score of 6/10 based on the results of the Credit Suisse IT Survey, in which respondents were asked to rank printing vendors’ sales force quality in terms of service and delivery. (Figure 452).
Figure 452: Sales—Lexmark Lags HP, Xerox, and Canon please rate the following printer vendors across the attributes below, using the following scale: 1 = Very poor performance 5 = Excellent performance NA = Not familiar with this vendor / attribute
Average
0.0
0.5
1.0
1.5
2.0
2.5
3.0
3.5
4.0
HP Xerox Lexmark Canon Epson
Source: Credit Suisse IT Survey, February 2011.

16 March 2011
IT Hardware 361
Companies Mentioned (Price as of 14 Mar 11) Accenture Plc (ACN, $51.45, OUTPERFORM, TP $67.00) ACCESS (4813, ¥93,300) Acer Inc. (2353.TW, NT$70.00, NEUTRAL, TP NT$78.00) Adobe Systems Inc. (ADBE, $34.08, NEUTRAL [V], TP $34.00) ADTRAN Inc. (ADTN, $43.86, NEUTRAL [V], TP $38.00) Affiliated Computer Services Inc. (ACS, $59.64) Alcatel-Lucent (ALU, $5.31, UNDERPERFORM [V], TP $4.06) Altria Group, Inc. (MO, $25.05) Amazon.com Inc. (AMZN, $166.73, NEUTRAL, TP $185.00) America Movil (AMX, $55.63, OUTPERFORM, TP $70.00) Anheuser-Busch Companies, Inc. (BUD, $68.58) Aplix Corp (3727, ¥72,000) Apple Inc. (AAPL, $353.56, OUTPERFORM, TP $500) Archer Daniels Midland Inc. (ADM, $35.80, OUTPERFORM, TP $40.00) Ariba Inc. (ARBA, $30.39, OUTPERFORM, TP $38.00) Asustek Computer (2357.TW, NT$251.50, OUTPERFORM, TP NT$299.00) Atos Origin (ATOS.PA, Eu40.38, OUTPERFORM, TP Eu50.00, OVERWEIGHT) Autodesk Inc. (ADSK, $40.38, NEUTRAL, TP $35.00) Automatic Data Processing, Inc. (ADP, $50.10, NEUTRAL, TP $45.00) Axiata Group Berhad (AXIA.KL, RM4.77, OUTPERFORM, TP RM6.10) Best Buy (BBY, $31.64, OUTPERFORM, TP $42.00) Bharti Airtel Ltd (BRTI.BO, Rs322.25, OUTPERFORM, TP Rs415.00) BMC Software Inc. (BMC, $48.94, OUTPERFORM, TP $55.00) Bouygues (BOUY.PA, Eu33.17) Broadcom Corp. (BRCM, $40.56, OUTPERFORM, TP $50.00) Brocade Communications (BRCD, $6.05) CA Inc. (CA, $22.97, NEUTRAL, TP $23.00) Canon (7751, ¥3,550, NEUTRAL, TP ¥4,100, MARKET WEIGHT) Capgemini (CAPP.PA, Eu40.16, OUTPERFORM, TP Eu51.00, OVERWEIGHT) Cardinal Health (CAH, $40.29, OUTPERFORM, TP $50.00) CBS Corporation (CBS, $23.61) Check Point Software Technologies Ltd. (CHKP, $48.94, OUTPERFORM, TP $50.00) China Mobile Limited (0941.HK, HK$72.25, OUTPERFORM, TP HK$116.00) China Unicom Hong Kong Ltd (0762.HK, HK$13.08, OUTPERFORM, TP HK$14.30) China United Telecommunications Corp (600050.SS, Rmb5.94) Cisco Systems Inc. (CSCO, $17.85, OUTPERFORM [V], TP $24.00) Citrix Systems Inc. (CTXS, $71.06, NEUTRAL [V], TP $52.50) Cognizant Technology Solutions Corp. (CTSH, $75.37, OUTPERFORM, TP $81.00) Colgate-Palmolive (CL, $78.27, NEUTRAL, TP $80.00) CommVault Systems Inc. (CVLT, $35.44, NEUTRAL, TP $24.00) Compal Communications Inc. (8078.TW, NT$27.90) Computer Sciences Corp. (CSC, $46.77, NEUTRAL, TP $50.00) CSR (CSR.AX, A$3.24, NEUTRAL, TP A$2.00) Cypress Semiconductor Corp. (CY, $18.88, NEUTRAL, TP $22.00) Dassault Systemes (DAST.PA, Eu54.38, NEUTRAL, TP Eu57.00, OVERWEIGHT) Dell Inc. (DELL, $14.97, UNDERPERFORM, TP $16) Deutsche Telekom (DTEGn.F, Eu10.02, UNDERPERFORM, TP Eu9.50, MARKET WEIGHT) D-Link (2332.TW, NT$25.75, OUTPERFORM [V], TP NT$35.00) eBay Inc. (EBAY, $30.77, OUTPERFORM, TP $40.00) EMC Corp. (EMC, $26.21, OUTPERFORM, TP $34) Ericsson (ERIC, $12.11, NEUTRAL, TP $12.21) Etisalat (ETEL.AD, Dhs11.15) ExxonMobil Corporation (XOM, $82.38, NEUTRAL, TP $84.00) Foxconn International Holdings (2038.HK, HK$5.30) France Telecom (FTE.PA, Eu15.20, UNDERPERFORM, TP Eu16.00, MARKET WEIGHT) Fuji (8278, ¥1,541) Fujitsu (6702, ¥428, NEUTRAL, TP ¥510, MARKET WEIGHT) Garmin Ltd (GRMN, $33.87) Gemalto (GTO.PA, Eu33.72) General Electric (GE, $19.92, OUTPERFORM, TP $23.00) Google, Inc. (GOOG, $569.99, OUTPERFORM, TP $750.00)

16 March 2011
IT Hardware 362
Hewlett-Packard (HPQ, $41.49, OUTPERFORM, TP $60) Hitachi (6501, ¥362, NEUTRAL, TP ¥530, MARKET WEIGHT) HTC Corp (2498.TW, NT$1025.00, OUTPERFORM, TP NT$1240.00) Hyatt Hotels (H, $43.30, OUTPERFORM, TP $54.00) Idea Cellular Ltd (IDEA.BO, Rs59.90, OUTPERFORM [V], TP Rs85.00) IKON Office Solutions (IKN, $17.23) Infosys Technologies Ltd. (INFY.BO, Rs3029.70, OUTPERFORM, TP Rs4050.00) ING Group (ING.AS, Eu8.88, OUTPERFORM [V], TP Eu10.44, MARKET WEIGHT) Intel Corp. (INTC, $20.84, OUTPERFORM [V], TP $28.00) International Business Machines (IBM, $161.39, NEUTRAL, TP $175) Intuit (INTU, $49.43, NEUTRAL, TP $43.00) Johnson & Johnson (JNJ, $59.13, NEUTRAL, TP $63.00) JPMorgan Chase & Co. (JPM, $45.30, OUTPERFORM, TP $58.00) Juniper Networks (JNPR, $43.05, NEUTRAL, TP $37.00) KDDI (9433, ¥535,000, OUTPERFORM, TP ¥650,000, OVERWEIGHT) Lenovo Group Ltd (0992.HK, HK$4.12, RESTRICTED [V]) Lexmark International (LXK, $36.01, UNDERPERFORM, TP $35) LG Electronics Inc (066570.KS, W101,500, UNDERPERFORM, TP W80,000) Lions Gate Entertainment Corp. (LGF, $5.99) Lloyds Banking Group (LLOY.L, 60.63 p, OUTPERFORM [V], TP 72.00 p, OVERWEIGHT) Lockheed Martin (LMT, $80.47, NEUTRAL, TP $77.00) Lowe's (LOW, $26.81, OUTPERFORM, TP $30.00) Manulife Financial Corporation (MFC.TO, C$16.74, OUTPERFORM, TP C$20.00) Marvell Technology Group Ltd. (MRVL, $15.63, OUTPERFORM, TP $22.00) McDonald's Corp (MCD, $75.67, OUTPERFORM, TP $89.00) MediaTek Inc. (2454.TW, NT$336.00, UNDERPERFORM, TP NT$315.00) MGM Resorts International (MGM, $12.81, NEUTRAL [V], TP $14.00) Microsoft Corp. (MSFT, $25.69, OUTPERFORM, TP $36.00) Microstrategy Inc (MSTR, $116.07) MIPS Technologies (MIPS, $10.97) Motorola Inc. (MOT, $39.77) MTN Group (MTNJ.J, R131.40, UNDERPERFORM, TP R117.00) Mts Systems Corp (MTSC, $42.86) NBC (3534, ¥1,383) NEC (6701, ¥162, RESTRICTED) NetApp Inc. (NTAP, $46.38, NEUTRAL, TP $54) Netgear Inc. (NTGR, $31.64) Nike Inc. (NKE, $86.21) Nokia Corporation (NOK, $8.30, UNDERPERFORM [V], TP $9.61) Nortel Networks Corp. (NT, $.03) Northrop Grumman Corporation (NOC, $66.32, RESTRICTED) Novartis (NOVN.VX, SFr49.95, OUTPERFORM, TP SFr63.00, MARKET WEIGHT) NTT Data (9613, ¥263,400, SUSPENDED) NTT DoCoMo (9437, ¥143,400, NEUTRAL, TP ¥150,000, OVERWEIGHT) Nuance Communications Inc. (NUAN, $17.50) Nvidia Corporation (NVDA, $18.20) Omron (6645, ¥2,116) Oracle Corporation (ORCL, $31.59, OUTPERFORM, TP $38.00) Orascom Telecom (ORTEq.L, $3.17, RESTRICTED [V]) Panasonic Corporation (6752, ¥866, NEUTRAL, TP ¥1,250, MARKET WEIGHT) PepsiCo, Inc. (PEP, $64.14, NEUTRAL, TP $69.00) Pfizer (PFE, $19.81, OUTPERFORM, TP $21.00) Pitney Bowes (PBI, $24.48) Procter & Gamble Co. (PG, $61.35, OUTPERFORM, TP $74.00) Qtel (QTEL.QA, QR165.60, OUTPERFORM, TP QR200.00) QUALCOMM Inc. (QCOM, $53.48, OUTPERFORM [V], TP $65.00) Quest Software, Inc. (QSFT, $25.67, NEUTRAL, TP $26.50) Rackspace Hosting Inc. (RAX, $36.27, OUTPERFORM [V], TP $42.00) Red Hat Inc. (RHT, $40.21) Rehabcare Group, Inc. (RHB, $37.20) Reliance Communication Ltd (RLCM.BO, Rs101.75, NEUTRAL [V], TP Rs120.00) Research In Motion Limited (RIMM, $62.35, OUTPERFORM [V], TP $85.00) Ricoh (7752, ¥873, OUTPERFORM, TP ¥1,300, MARKET WEIGHT) Rogers Communications (NVS) (RCIb.TO, C$33.68, OUTPERFORM, TP C$42.00) Sage Group (SGE.L, 264.20 p, UNDERPERFORM, TP 200.00 p, OVERWEIGHT)

16 March 2011
IT Hardware 363
SAIC (SAI, $16.57, OUTPERFORM, TP $18.00) Samsung Electronics (005930.KS, W860,000, OUTPERFORM, TP W1,100,000) SAP (SAPG.F, Eu41.76, OUTPERFORM, TP Eu47.50) SAS (SAS.ST, SKr21.70) Schlumberger (SLB, $85.36, OUTPERFORM, TP $100.00) Sears Holding Corp. (SHLD, $82.86, UNDERPERFORM [V], TP $50.00) Seven Network (SVW.AX, A$8.15, NEUTRAL, TP A$7.81) Sharp Corp. (6753, ¥675, NOT RATED) Siemens (SIEGn.DE, Eu89.83, OUTPERFORM, TP Eu113.00, MARKET WEIGHT) SMC (6273, ¥11,870, OUTPERFORM, TP ¥18,000, OVERWEIGHT) Softbank (9984, ¥3,115, OUTPERFORM, TP ¥4,000, OVERWEIGHT) Sony (6758, ¥2,324, OUTPERFORM, TP ¥3,600, MARKET WEIGHT) Sprint (S, $5.02, OUTPERFORM [V], TP $8.00) Sun Life Financial (SLF.TO, C$30.16, NEUTRAL, TP C$33.00) Sun Microsystems Inc. (JAVA, $9.49) Symantec Corporation (SYMC, $18.06, OUTPERFORM, TP $21.00) Synaptics, Inc. (SYNA, $27.73) Tata Communications Ltd (TATA.BO, Rs212.95, OUTPERFORM, TP Rs375.00) Tata Consultancy Services (TCS.BO, Rs1095.00, OUTPERFORM, TP Rs1325.00) Telecom Italia (TLIT.MI, Eu1.10, NEUTRAL, TP Eu1.10, MARKET WEIGHT) Telefonica (TEF.MC, Eu17.54, NEUTRAL, TP Eu17.00, MARKET WEIGHT) Telenor (TEL.OL, NKr90.25, OUTPERFORM, TP NKr105.00, MARKET WEIGHT) TeliaSonera (TLSN.ST, SKr53.25, NEUTRAL, TP SKr55.00, MARKET WEIGHT) Tellabs (TLAB, $5.12) Telstra Corporation (TLS.AX, A$2.61, OUTPERFORM, TP A$3.30) TELUS Corporation (T.TO, C$47.23, NEUTRAL, TP C$47.00) Tesco Corp (TESO, $18.15) Texas Instruments Inc. (TXN, $34.56, OUTPERFORM, TP $40.00) The Coca-Cola Company (KO, $63.94, OUTPERFORM, TP $70.00) Tibco Software, Inc. (TIBX, $23.93) Toshiba (6502, ¥331, OUTPERFORM, TP ¥540, MARKET WEIGHT) Toyota Motor Corp. (7203, ¥3,065, OUTPERFORM, TP ¥4,520, OVERWEIGHT) Turkcell (TCELL.IS, TRY9.06, UNDERPERFORM, TP TRY9.09) Verizon (VZ, $35.18, NEUTRAL, TP $35.00) Vivo Participacoes (VIVO4, R$60.30, RESTRICTED) VMware Inc. (VMW, $80.47, UNDERPERFORM [V], TP $60.00) Wal-Mart Stores, Inc. (WMT, $52.32, NEUTRAL, TP $58.00) Walt Disney Company (DIS, $42.24, OUTPERFORM, TP $48.00) Wells Fargo & Company (WFC, $32.10, NEUTRAL, TP $34.00) Wipro Ltd. (WIPR.BO, Rs455.35, OUTPERFORM, TP Rs575.00) Xerox Corporation (XRX, $10.33, NEUTRAL, TP $12) Yahoo Inc. (YHOO, $17.31, NEUTRAL, TP $20.00) ZTE (0763.HK, HK$34.35) Zte Corp (000063.SZ, Rmb33.45)
Disclosure Appendix Important Global Disclosures I, Kulbinder Garcha, certify that (1) the views expressed in this report accurately reflect my personal views about all of the subject companies and securities and (2) no part of my compensation was, is or will be directly or indirectly related to the specific recommendations or views expressed in this report. See the Companies Mentioned section for full company names.

16 March 2011
IT Hardware 364
3-Year Price, Target Price and Rating Change History Chart for AAPL AAPL Closing
Price Target
Price
Initiation/ Date (US$) (US$) Rating Assumption 8/7/08 163.57 200 O X 10/13/08 110.26 135 11/13/08 96.44 120 4/9/09 119.57 133 4/23/09 125.4 140 6/9/09 142.72 165 7/22/09 156.74 175 9/1/09 165.298 200 10/13/09 190.02 235 10/20/09 198.76 250 1/26/10 205.94 275 3/26/10 230.9 300 4/21/10 259.22 315 5/25/10 245.22 NC
200
135120
133140165 175
200
235250
275300
315
7-Aug-08
NC
O
78
128
178
228
278
328
3/16/08
5/16/08
7/16/08
9/16/08
1 1/16 /08
1/16/09
3 /16/09
5 /16 /09
7/16 /0 9
9 /16/09
11/16/09
1 /16 /10
3/16/1 0
5/16/10
7/16/10
9/16 /10
11/16/10
1/16/11
Closing Pr ice Target Price Initiation/Assumption Rating
US$
O=Outperform; N=Neutral; U=Underperform; R=Restricted; NR=Not Rated ; NC=Not Covered
3-Year Price, Target Price and Rating Change History Chart for DELL DELL Closing
Price Target
Price
Initiation/ Date (US$) (US$) Rating Assumption 8/7/08 24.99 30 O X 10/13/08 15.21 18 11/13/08 10.27 15 2/27/09 8.53 11 5/14/09 10.93 13 5/29/09 11.57 14 7/10/09 13.22 16 8/28/09 15.93 19 9/22/09 15.73 16 N 11/20/09 14.29 14 2/19/10 13.47 12.5 5/25/10 13.33 NC 8/16/10 11.96 R
30
18
15
111314
16
19
1614
13
7-Aug-08
RNC
N
O
7
12
17
22
27
3/15/08
5/15/08
7/15/08
9/15/08
11/15/0
81/15
/093/15
/095/1
5/09
7/15/0
99/15
/09
11/15/09
1/15/1
03/1
5/10
5/15/1
07/1
5/10
9/15/1
0
11/15/10
1/15/1
1
Closing Price Target Price Initiation/Assumption Rating
US$
O=Outperform; N=Neutral; U=Underperform; R=Restricted; NR=Not Rated; NC=Not Covered
3-Year Price, Target Price and Rating Change History Chart for EMC EMC Closing
Price Target
Price
Initiation/ Date (US$) (US$) Rating Assumption 8/7/08 14.36 18 O X 10/13/08 11.31 14 7/10/09 12.8 16 7/24/09 14.95 19 10/13/09 17.92 22 4/21/10 19.85 23 5/25/10 17.85 NC
18
1416
19
2223
7-Aug-08
NC
O
8
13
18
23
28
3/15/08
5/15/08
7/15/08
9/15/08
11/15/0
81/15
/093/15
/095/1
5/09
7/15/0
99/15
/09
11/15/09
1/15/1
03/1
5/10
5/15/1
07/1
5/10
9/15/1
0
11/15/10
1/15/1
1
Closing Price Target Price Initiation/Assumption Rating
US$
O=Outperform; N=Neutral; U=Underperform; R=Restricted; NR=Not Rated; NC=Not Covered

16 March 2011
IT Hardware 365
3-Year Price, Target Price and Rating Change History Chart for HPQ HPQ Closing
Price Target
Price
Initiation/ Date (US$) (US$) Rating Assumption 8/7/08 45.51 45 N X 10/13/08 41.4 40 11/13/08 31.71 35 2/19/09 31.39 30 5/14/09 34.93 35 7/30/09 42.71 37 8/19/09 43.83 44 9/22/09 47.01 55 O 11/9/09 49.99 60 2/18/10 50.81 65 5/25/10 45.85 NC
45
40
35
30
3537
44
55
60
65
7-Aug-08
NCON
25
30
35
40
45
50
55
60
65
3/15/08
5/15/08
7/15/08
9/15/08
11/15/0
81/15
/093/15
/095/1
5/09
7/15/0
99/15
/09
11/15/09
1/15/1
03/1
5/10
5/15/1
07/1
5/10
9/15/1
0
11/15/10
1/15/1
1
Closing Price Target Price Initiation/Assumption Rating
US$
O=Outperform; N=Neutral; U=Underperform; R=Restricted; NR=Not Rated; NC=Not Covered
3-Year Price, Target Price and Rating Change History Chart for IBM IBM Closing
Price Target
Price
Initiation/ Date (US$) (US$) Rating Assumption 8/7/08 129.05 120 N X 10/13/08 92.21 90 7/17/09 115.42 110 1/20/10 130.25 130 5/25/10 124.52 NC
120
90
110
130
7-Aug-08
NCN
71
8191
101111121131
141151161
3/15/08
5/15/08
7/15/08
9/15/08
11/15/0
81/15
/093/15
/095/1
5/09
7/15/0
99/15
/09
11/15/09
1/15/1
03/1
5/10
5/15/1
07/1
5/10
9/15/1
0
11/15/10
1/15/1
1
Closing Price Target Price Initiation/Assumption Rating
US$
O=Outperform; N=Neutral; U=Underperform; R=Restricted; NR=Not Rated; NC=Not Covered
3-Year Price, Target Price and Rating Change History Chart for LXK LXK Closing
Price Target
Price
Initiation/ Date (US$) (US$) Rating Assumption 8/7/08 35.87 25 U X 10/13/08 30.06 23 1/13/09 24.63 20 4/9/09 17.58 13 10/20/09 26.16 18 2/2/10 30.01 25 4/27/10 40.08 29 5/25/10 35.87 NC
2523
20
13
18
25
29
7-Aug-08
NCU
13
18
23
28
33
38
43
48
3/15/08
5/15/08
7/15/08
9/15/08
11/15/0
81/15
/093/15
/095/1
5/09
7/15/0
99/15
/09
11/15/09
1/15/1
03/1
5/10
5/15/1
07/1
5/10
9/15/1
0
11/15/10
1/15/1
1
Closing Price Target Price Initiation/Assumption Rating
US$
O=Outperform; N=Neutral; U=Underperform; R=Restricted; NR=Not Rated; NC=Not Covered

16 March 2011
IT Hardware 366
3-Year Price, Target Price and Rating Change History Chart for NTAP NTAP Closing
Price Target
Price
Initiation/ Date (US$) (US$) Rating Assumption 8/7/08 26.04 25 N X 10/13/08 14.92 15 11/13/08 12.14 13 5/21/09 17.88 16 7/30/09 23.05 21 10/9/09 28.84 25 11/19/09 30.83 27 2/18/10 31.68 29 5/25/10 33.09 NC
25
15 1316
2125 27 29
7-Aug-08
NC
N
10
20
30
40
50
60
3/15/08
5/15/08
7/15/08
9/15/08
11/15/0
81/15
/093/15
/095/1
5/09
7/15/0
99/15
/09
11/15/09
1/15/1
03/1
5/10
5/15/1
07/1
5/10
9/15/1
0
11/15/10
1/15/1
1
Closing Price Target Price Initiation/Assumption Rating
US$
O=Outperform; N=Neutral; U=Underperform; R=Restricted; NR=Not Rated; NC=Not Covered
3-Year Price, Target Price and Rating Change History Chart for XRX XRX Closing
Price Target
Price
Initiation/ Date (US$) (US$) Rating Assumption
0
2
4
6
8
10
12
14
16
3/15/08
5/15/08
7/15/08
9/15/08
11/15/0
81/15
/093/15
/095/1
5/09
7/15/0
99/15
/09
11/15/09
1/15/1
03/1
5/10
5/15/1
07/1
5/10
9/15/1
0
11/15/10
1/15/1
1
Closing Price Target Price Initiation/Assumption Rating
US$
O=Outperform; N=Neutral; U=Underperform; R=Restricted; NR=Not Rated; NC=Not Covered
The analyst(s) responsible for preparing this research report received compensation that is based upon various factors including Credit Suisse's total revenues, a portion of which are generated by Credit Suisse's investment banking activities. Analysts’ stock ratings are defined as follows: Outperform (O): The stock’s total return is expected to outperform the relevant benchmark* by at least 10-15% (or more, depending on perceived risk) over the next 12 months. Neutral (N): The stock’s total return is expected to be in line with the relevant benchmark* (range of ±10-15%) over the next 12 months. Underperform (U): The stock’s total return is expected to underperform the relevant benchmark* by 10-15% or more over the next 12 months. *Relevant benchmark by region: As of 29th May 2009, Australia, New Zealand, U.S. and Canadian ratings are based on (1) a stock’s absolute total return potential to its current share price and (2) the relative attractiveness of a stock’s total return potential within an analyst’s coverage universe**, with Outperforms representing the most attractive, Neutrals the less attractive, and Underperforms the least attractive investment opportunities. Some U.S. and Canadian ratings may fall outside the absolute total return ranges defined above, depending on market conditions and industry factors. For Latin American, Japanese, and non-Japan Asia stocks, ratings are based on a stock’s total return relative to the average total return of the relevant country or regional benchmark; for European stocks, ratings are based on a stock’s total return relative to the analyst's coverage universe**. For Australian and New Zealand stocks a 22% and a 12% threshold replace the 10-15% level in the Outperform and Underperform stock rating definitions, respectively, subject to analysts’ perceived risk. The 22% and 12% thresholds replace the +10-15% and -10-15% levels in the Neutral stock rating definition, respectively, subject to analysts’ perceived risk. **An analyst's coverage universe consists of all companies covered by the analyst within the relevant sector. Restricted (R): In certain circumstances, Credit Suisse policy and/or applicable law and regulations preclude certain types of communications, including an investment recommendation, during the course of Credit Suisse's engagement in an investment banking transaction and in certain other circumstances. Volatility Indicator [V]: A stock is defined as volatile if the stock price has moved up or down by 20% or more in a month in at least 8 of the past 24 months or the analyst expects significant volatility going forward.
Analysts’ coverage universe weightings are distinct from analysts’ stock ratings and are based on the expected performance of an analyst’s coverage universe* versus the relevant broad market benchmark**: Overweight: Industry expected to outperform the relevant broad market benchmark over the next 12 months. Market Weight: Industry expected to perform in-line with the relevant broad market benchmark over the next 12 months. Underweight: Industry expected to underperform the relevant broad market benchmark over the next 12 months.

16 March 2011
IT Hardware 367
*An analyst’s coverage universe consists of all companies covered by the analyst within the relevant sector. **The broad market benchmark is based on the expected return of the local market index (e.g., the S&P 500 in the U.S.) over the next 12 months. Credit Suisse’s distribution of stock ratings (and banking clients) is:
Global Ratings Distribution Outperform/Buy* 46% (62% banking clients) Neutral/Hold* 41% (58% banking clients) Underperform/Sell* 11% (50% banking clients) Restricted 2%
*For purposes of the NYSE and NASD ratings distribution disclosure requirements, our stock ratings of Outperform, Neutral, and Underperform most closely correspond to Buy, Hold, and Sell, respectively; however, the meanings are not the same, as our stock ratings are determined on a relative basis. (Please refer to definitions above.) An investor's decision to buy or sell a security should be based on investment objectives, current holdings, and other individual factors.
Credit Suisse’s policy is to update research reports as it deems appropriate, based on developments with the subject company, the sector or the market that may have a material impact on the research views or opinions stated herein. Credit Suisse's policy is only to publish investment research that is impartial, independent, clear, fair and not misleading. For more detail please refer to Credit Suisse's Policies for Managing Conflicts of Interest in connection with Investment Research: http://www.csfb.com/research-and-analytics/disclaimer/managing_conflicts_disclaimer.html Credit Suisse does not provide any tax advice. Any statement herein regarding any US federal tax is not intended or written to be used, and cannot be used, by any taxpayer for the purposes of avoiding any penalties. See the Companies Mentioned section for full company names. Price Target: (12 months) for (AAPL) Method: Our $500 target price for Apple Inc. is based on a blended average of Price per Earnings (P/E), Discounted Cash Flow (DCF), and HOLT analyses (See "Important Credit Suisse HOLT Disclosures" below). Risks: Risks to achievement of our $500 target price for Apple Inc. include competitive pressures from global consumer electronics companies, failure to launch innovative products, loss of key executive managers, failure to maintain key media distribution for iTunes, and regulatory risk Price Target: (12 months) for (DELL) Method: Our $16 target price for Dell is based on a blended average of Price per Earnings (P/E), Discounted Cash Flow (DCF), and HOLT analyses. (See "Important Credit Suisse HOLT Disclosures" below).Our P/E analysis assumes a 10 times multiple applied to our 2012 EPS of $1.63, resulting in a fair value estimate of $16.2. Our DCF analysis which assumes long-term revenue growth of 0%, long term EBIT margins of 3%, terminal growth of 0% and a weighted average cost of capital (WACC) of 7.7% results in a fair value estimate of $20.4. Lastly, Credit Suisse HOLT implies a fair value estimate of $12.54 based on the assumption that CFROI will fade toward 16% long term from 24% in 2010. Risks: Risks to achievement of our $16 target price for Dell Inc. include mix shift towards higher margin segments, increased Information Technology spending as a result of stronger than expected corporate refresh, increased share gains within PC, server, storage, and services, as well as merger and acquisition integration upside as Dell remains acquisitive. Price Target: (12 months) for (EMC) Method: Our $34 target price for EMC Corp. is based on a blended average of Price per Earnings (P/E), Discounted Cash Flow (DCF), and HOLT analyses. (See "Important Credit Suisse HOLT Disclosures" below).Our P/E analysis assumes a 14.7 times multiple applied to our 2012 EPS of $1.83 resulting in a fair value estimate of $26.4. Our DCF analysis which assumes long-term revenue growth of 5%, long term EBIT margins of 20.0%, terminal revenue growth of 3.0% and a weighted average cost of capital (WACC) of 9.0% results in a fair value estimate of $39. Lastly, Credit Suisse HOLT implies a fair value estimate of $38 based on the assumption that CFROI will fade toward 19% long term from 18.7% in 2010. Risks: Risks to achievement of our $34 target price for EMC Corp. include increased competitive pressures from storage vendors and server OEMs, development of disruptive storage technologies, decrease in Information Technology spending as a result of macroeconomic downturn, as well as merger and acquisition integration risks as EMC remains acquisitive. Price Target: (12 months) for (HPQ) Method: Our $60 target price for Hewlett-Packard Co. is based on a blended average of Price per Earnings ($56), Discounted Cash Flow ($71), and HOLT analysis ($53). (See "Important Credit Suisse HOLT Disclosures" below).Our P/E analysis assumes a 9.4times multiple applied to our 2012 EPS of $5.99 resulting in a fair value estimate of $56. Our DCF analysis which assumes long-term revenue growth of 2-3%, long term EBIT margins of 9-10%, terminal growth of 2% and a weighted average cost of capital (WACC) of 8.3% results in a fair value estimate of $71. Lastly, Credit Suisse HOLT implies a fair value estimate of $71 based on the assumption that CFROI will fade toward 19% long term from 24% in 2011. Risks: Risks to achievement of our $60 target price for Hewlett-Packard Co. include declining Information Technology spending as a result of macroeconomic downturn, increased competitive risks within client (PC and printers), server, storage, and services, as well as merger and acquisition integration risks as HPQ remains acquisitive. Price Target: (12 months) for (IBM) Method: Our $175 target price for International Business Machines Corp. is based on a blended average of Price per Earnings (P/E), Discounted Cash Flow (DCF), and HOLT analyses. (See "Important Credit Suisse HOLT Disclosures" below).Our P/E analysis assumes a 10.5x multiple applied to our 2012 EPS of $14.88, resulting in a fair value estimate of $156. Our DCF analysis which assumes long-term revenue growth of 2-3%, long term EBIT margins of 16%, terminal growth of 3% and a weighted average cost of capital (WACC) of 6.4% results in a fair value estimate of $198. Lastly, Credit Suisse HOLT implies a fair value estimate of $171 based on the assumption that CFROI will fade toward 20% long term from 26% in 2011. Risks: Risks to achievement of our $175 target price for International Business Machines Corp. include declining Information Technology spending as a result of macroeconomic downturn, increased competitive risks within server, storage, and services, as well as merger and acquisition integration risks as IBM remains acquisitive.

16 March 2011
IT Hardware 368
Price Target: (12 months) for (LXK) Method: Our $35 target price for Lexmark International Inc. is based on a blended average of Price per Earnings (P/E), Discounted Cash Flow (DCF), and HOLT analyses. (See "Important Credit Suisse HOLT Disclosures" below).Our P/E analysis assumes a 8 times multiple applied to our 2012 EPS of $4.16 resulting in a fair value estimate of $33. Our DCF analysis which assumes long-term revenue decline of 2%, long term EBIT margins of 4%, terminal revenue decline of 1.0% and a weighted average cost of capital (WACC) of 10.7% results in a fair value estimate of $33. Lastly, Credit Suisse HOLT implies a fair value estimate of $39 based on the assumption that CFROI will fade toward 2% long term from 9.8% in 2010. Risks: Risks to achievement of our $35 target price for Lexmark International Inc. include a robust corporate refresh of Information Technology spending, higher attach rate of supplies, as well as merger and acquisition integration upside as LXK remains acquisitive. Price Target: (12 months) for (NTAP) Method: Our $54 target price for NetApp Inc. is based on a blended average of Price per Earnings (P/E), Discounted Cash Flow (DCF), and HOLT analyses. (See "Important Credit Suisse HOLT Disclosures" below).Our P/E analysis assumes an 18 times multiple applied to our 2012 EPS of $2.70 resulting in a fair value estimate of $50. Our DCF analysis which assumes long-term revenue growth of 3%, long term EBIT margins of 13-14%, terminal growth of 3% and a weighted average cost of capital (WACC) of 10% results in a fair value estimate of $62. Lastly, Credit Suisse HOLT implies a fair value estimate of $50 based on the assumption that CFROI will fade toward 11% long term from 17.3% in 2010. Risks: Risks to achievement of our $54 target price for NetApp Inc. include increased competitive pressures from storage vendors and server OEMs, development of disruptive storage technologies, decrease in Information Technology spending as a result of macroeconomic downturn, as well as merger and acquisition integration risks as NTAP remains acquisitive. Price Target: (12 months) for (XRX) Method: Our $12 target price for Xerox Corp. is based on a blended average of Price per Earnings (P/E), Discounted Cash Flow (DCF), and HOLT analyses. (See "Important Credit Suisse HOLT Disclosures" below).Our $12 target price implies a P/E multiple of 9.2x on our CY12 EPS estimate of $1.30. Our P/E analysis assumes a 9.5 times multiple applied to our 2012 EPS of $1.30 resulting in a fair value estimate of $12. Our DCF analysis which assumes long-term revenue growth of 3%, long term EBIT margins of 8%, terminal growth of 3% and a weighted average cost of capital (WACC) of 11% results in a fair value estimate of $13. Lastly, Credit Suisse HOLT implies a fair value estimate of $13 based on the assumption that CFROI will fade toward 11% long term from 13.4% in 2011. Risks: Risks to achievement of our $12 target price for Xerox Corp. include a declining Information Technology spending as a result of macroeconomic downturn and/or declining State and Local government spending, increased competitive pressures from printing hardware, business process outsourcing, and IT services providers, as well as not realizing synergies from recent acquisition of Affiliated Computer Systems. Please refer to the firm's disclosure website at www.credit-suisse.com/researchdisclosures for the definitions of abbreviations typically used in the target price method and risk sections.
See the Companies Mentioned section for full company names. The subject company (AAPL, DELL, EMC, HPQ, IBM, LXK, NTAP, XRX) currently is, or was during the 12-month period preceding the date of distribution of this report, a client of Credit Suisse. Credit Suisse provided investment banking services to the subject company (DELL, EMC, HPQ, IBM, NTAP, XRX) within the past 12 months. Credit Suisse provided non-investment banking services, which may include Sales and Trading services, to the subject company (AAPL, DELL, EMC, HPQ, IBM, LXK) within the past 12 months. Credit Suisse has managed or co-managed a public offering of securities for the subject company (IBM) within the past 12 months. Credit Suisse has received investment banking related compensation from the subject company (EMC, HPQ, IBM) within the past 12 months. Credit Suisse expects to receive or intends to seek investment banking related compensation from the subject company (AAPL, DELL, EMC, HPQ, IBM, NTAP, XRX) within the next 3 months. Credit Suisse has received compensation for products and services other than investment banking services from the subject company (AAPL, DELL, EMC, HPQ, IBM) within the past 12 months. As of the date of this report, Credit Suisse Securities (USA) LLC makes a market in the securities of the subject company (AAPL, DELL, EMC, HPQ, IBM, LXK, NTAP, XRX). months. Important Regional Disclosures Singapore recipients should contact a Singapore financial adviser for any matters arising from this research report. The analyst(s) involved in the preparation of this report have not visited the material operations of the subject company (DELL, EMC, HPQ, IBM, LXK, NTAP, XRX) within the past 12 months. Restrictions on certain Canadian securities are indicated by the following abbreviations: NVS--Non-Voting shares; RVS--Restricted Voting Shares; SVS--Subordinate Voting Shares. Individuals receiving this report from a Canadian investment dealer that is not affiliated with Credit Suisse should be advised that this report may not contain regulatory disclosures the non-affiliated Canadian investment dealer would be required to make if this were its own report. For Credit Suisse Securities (Canada), Inc.'s policies and procedures regarding the dissemination of equity research, please visit http://www.csfb.com/legal_terms/canada_research_policy.shtml. Credit Suisse Securities (Europe) Limited acts as broker to BBY. The following disclosed European company/ies have estimates that comply with IFRS: ATOS.PA, BBY, BOUY.PA, CAPP.PA, CAH, DAST.PA, DTEGn.F, XOM, FTE.PA, GTO.PA, ING.AS, LLOY.L, MSFT, 6701, ORTEq.L, SGE.L, SAPG.F, SIEGn.DE, TLIT.MI, TEF.MC, TEL.OL, TLSN.ST.

16 March 2011
IT Hardware 369
As of the date of this report, Credit Suisse acts as a market maker or liquidity provider in the equities securities that are the subject of this report. Principal is not guaranteed in the case of equities because equity prices are variable. Commission is the commission rate or the amount agreed with a customer when setting up an account or at anytime after that. CS may have issued a Trade Alert regarding this security. Trade Alerts are short term trading opportunities identified by an analyst on the basis of market events and catalysts, while stock ratings reflect an analyst's investment recommendations based on expected total return over a 12-month period relative to the relevant coverage universe. Because Trade Alerts and stock ratings reflect different assumptions and analytical methods, Trade Alerts may differ directionally from the analyst's stock rating. The author(s) of this report maintains a CS Model Portfolio that he/she regularly adjusts. The security or securities discussed in this report may be a component of the CS Model Portfolio and subject to such adjustments (which, given the composition of the CS Model Portfolio as a whole, may differ from the recommendation in this report, as well as opportunities or strategies identified in Trading Alerts concerning the same security). The CS Model Portfolio and important disclosures about it are available at www.credit-suisse.com/ti. To the extent this is a report authored in whole or in part by a non-U.S. analyst and is made available in the U.S., the following are important disclosures regarding any non-U.S. analyst contributors: The non-U.S. research analysts listed below (if any) are not registered/qualified as research analysts with FINRA. The non-U.S. research analysts listed below may not be associated persons of CSSU and therefore may not be subject to the NASD Rule 2711 and NYSE Rule 472 restrictions on communications with a subject company, public appearances and trading securities held by a research analyst account. • Achal Sultania, non-U.S. analyst, is a research analyst employed by Credit Suisse Securities (Europe) Limited. • Arjun Gopinath, non-U.S. analyst, is a research analyst employed by Credit Suisse Securities (Europe) Limited. Where this research report is about a non-Taiwanese company, written by a Taiwan-based analyst, it is not a recommendation to buy or sell securities Important Credit Suisse HOLT Disclosures With respect to the analysis in this report based on the Credit Suisse HOLT methodology, Credit Suisse certifies that (1) the views expressed in this report accurately reflect the Credit Suisse HOLT methodology and (2) no part of the Firm’s compensation was, is, or will be directly related to the specific views disclosed in this report. The Credit Suisse HOLT methodology does not assign ratings to a security. It is an analytical tool that involves use of a set of proprietary quantitative algorithms and warranted value calculations, collectively called the Credit Suisse HOLT valuation model, that are consistently applied to all the companies included in its database. Third-party data (including consensus earnings estimates) are systematically translated into a number of default variables and incorporated into the algorithms available in the Credit Suisse HOLT valuation model. The source financial statement, pricing, and earnings data provided by outside data vendors are subject to quality control and may also be adjusted to more closely measure the underlying economics of firm performance. These adjustments provide consistency when analyzing a single company across time, or analyzing multiple companies across industries or national borders. The default scenario that is produced by the Credit Suisse HOLT valuation model establishes the baseline valuation for a security, and a user then may adjust the default variables to produce alternative scenarios, any of which could occur. Additional information about the Credit Suisse HOLT methodology is available on request. The Credit Suisse HOLT methodology does not assign a price target to a security. The default scenario that is produced by the Credit Suisse HOLT valuation model establishes a warranted price for a security, and as the third-party data are updated, the warranted price may also change. The default variables may also be adjusted to produce alternative warranted prices, any of which could occur. CFROI®, HOLT, HOLTfolio, HOLTSelect, ValueSearch, AggreGator, Signal Flag and “Powered by HOLT” are trademarks or service marks or registered trademarks or registered service marks of Credit Suisse or its affiliates in the United States and other countries. HOLT is a corporate performance and valuation advisory service of Credit Suisse. Additional information about the Credit Suisse HOLT methodology is available on request. For Credit Suisse disclosure information on other companies mentioned in this report, please visit the website at www.credit-suisse.com/researchdisclosures or call +1 (877) 291-2683. Disclaimers continue on next page.

16 March 2011Americas/United States
Equity Research
CS ITHW Sector Initiation_FINAL.doc
This report is not directed to, or intended for distribution to or use by, any person or entity who is a citizen or resident of or located in any locality, state, country or other jurisdiction where such distribution, publication, availability or use would be contrary to law or regulation or which would subject Credit Suisse AG, the Swiss bank, or its subsidiaries or its affiliates (“CS”) to any registration or licensing requirement within such jurisdiction. All material presented in this report, unless specifically indicated otherwise, is under copyright to CS. None of the material, nor its content, nor any copy of it, may be altered in any way, transmitted to, copied or distributed to any other party, without the prior express written permission of CS. All trademarks, service marks and logos used in this report are trademarks or service marks or registered trademarks or service marks of CS or its affiliates. The information, tools and material presented in this report are provided to you for information purposes only and are not to be used or considered as an offer or the solicitation of an offer to sell or to buy or subscribe for securities or other financial instruments. CS may not have taken any steps to ensure that the securities referred to in this report are suitable for any particular investor. CS will not treat recipients as its customers by virtue of their receiving the report. The investments or services contained or referred to in this report may not be suitable for you and it is recommended that you consult an independent investment advisor if you are in doubt about such investments or investment services. Nothing in this report constitutes investment, legal, accounting or tax advice or a representation that any investment or strategy is suitable or appropriate to your individual circumstances or otherwise constitutes a personal recommendation to you. CS does not offer advice on the tax consequences of investment and you are advised to contact an independent tax adviser. Please note in particular that the bases and levels of taxation may change. CS believes the information and opinions in the Disclosure Appendix of this report are accurate and complete. Information and opinions presented in the other sections of the report were obtained or derived from sources CS believes are reliable, but CS makes no representations as to their accuracy or completeness. Additional information is available upon request. CS accepts no liability for loss arising from the use of the material presented in this report, except that this exclusion of liability does not apply to the extent that liability arises under specific statutes or regulations applicable to CS. This report is not to be relied upon in substitution for the exercise of independent judgment. CS may have issued, and may in the future issue, a trading call regarding this security. Trading calls are short term trading opportunities based on market events and catalysts, while stock ratings reflect investment recommendations based on expected total return over a 12-month period as defined in the disclosure section. Because trading calls and stock ratings reflect different assumptions and analytical methods, trading calls may differ directionally from the stock rating. In addition, CS may have issued, and may in the future issue, other reports that are inconsistent with, and reach different conclusions from, the information presented in this report. Those reports reflect the different assumptions, views and analytical methods of the analysts who prepared them and CS is under no obligation to ensure that such other reports are brought to the attention of any recipient of this report. CS is involved in many businesses that relate to companies mentioned in this report. These businesses include specialized trading, risk arbitrage, market making, and other proprietary trading. Past performance should not be taken as an indication or guarantee of future performance, and no representation or warranty, express or implied, is made regarding future performance. Information, opinions and estimates contained in this report reflect a judgement at its original date of publication by CS and are subject to change without notice. The price, value of and income from any of the securities or financial instruments mentioned in this report can fall as well as rise. The value of securities and financial instruments is subject to exchange rate fluctuation that may have a positive or adverse effect on the price or income of such securities or financial instruments. Investors in securities such as ADR’s, the values of which are influenced by currency volatility, effectively assume this risk. Structured securities are complex instruments, typically involve a high degree of risk and are intended for sale only to sophisticated investors who are capable of understanding and assuming the risks involved. The market value of any structured security may be affected by changes in economic, financial and political factors (including, but not limited to, spot and forward interest and exchange rates), time to maturity, market conditions and volatility, and the credit quality of any issuer or reference issuer. Any investor interested in purchasing a structured product should conduct their own investigation and analysis of the product and consult with their own professional advisers as to the risks involved in making such a purchase. Some investments discussed in this report have a high level of volatility. High volatility investments may experience sudden and large falls in their value causing losses when that investment is realised. Those losses may equal your original investment. Indeed, in the case of some investments the potential losses may exceed the amount of initial investment, in such circumstances you may be required to pay more money to support those losses. Income yields from investments may fluctuate and, in consequence, initial capital paid to make the investment may be used as part of that income yield. Some investments may not be readily realisable and it may be difficult to sell or realise those investments, similarly it may prove difficult for you to obtain reliable information about the value, or risks, to which such an investment is exposed. This report may provide the addresses of, or contain hyperlinks to, websites. Except to the extent to which the report refers to website material of CS, CS has not reviewed the linked site and takes no responsibility for the content contained therein. Such address or hyperlink (including addresses or hyperlinks to CS’s own website material) is provided solely for your convenience and information and the content of the linked site does not in any way form part of this document. Accessing such website or following such link through this report or CS’s website shall be at your own risk. This report is issued and distributed in Europe (except Switzerland) by Credit Suisse Securities (Europe) Limited, One Cabot Square, London E14 4QJ, England, which is regulated in the United Kingdom by The Financial Services Authority (“FSA”). This report is being distributed in Germany by Credit Suisse Securities (Europe) Limited Niederlassung Frankfurt am Main regulated by the Bundesanstalt fuer Finanzdienstleistungsaufsicht ("BaFin"). This report is being distributed in the United States by Credit Suisse Securities (USA) LLC ; in Switzerland by Credit Suisse AG; in Canada by Credit Suisse Securities (Canada), Inc.; in Brazil by Banco de Investimentos Credit Suisse (Brasil) S.A. or its affiliates; in Mexico by Banco Credit Suisse (México), S.A. (transactions related to the securities mentioned in this report will only be effected in compliance with applicable regulation); in Japan by Credit Suisse Securities (Japan) Limited, Financial Instrument Firm, Director-General of Kanto Local Finance Bureau (Kinsho) No. 66, a member of Japan Securities Dealers Association, The Financial Futures Association of Japan, Japan Securities Investment Advisers Association; elsewhere in Asia/Pacific by whichever of the following is the appropriately authorised entity in the relevant jurisdiction: Credit Suisse (Hong Kong) Limited, Credit Suisse Equities (Australia) Limited , Credit Suisse Securities (Thailand) Limited, Credit Suisse Securities (Malaysia) Sdn Bhd, Credit Suisse AG, Singapore Branch, Credit Suisse Securities (India) Private Limited, Credit Suisse Securities (Europe) Limited, Seoul Branch, Credit Suisse AG, Taipei Securities Branch, PT Credit Suisse Securities Indonesia, and elsewhere in the world by the relevant authorised affiliate of the above. Research on Taiwanese securities produced by Credit Suisse AG, Taipei Securities Branch has been prepared by a registered Senior Business Person. Research provided to residents of Malaysia is authorised by the Head of Research for Credit Suisse Securities (Malaysia) Sdn. Bhd., to whom they should direct any queries on +603 2723 2020. In jurisdictions where CS is not already registered or licensed to trade in securities, transactions will only be effected in accordance with applicable securities legislation, which will vary from jurisdiction to jurisdiction and may require that the trade be made in accordance with applicable exemptions from registration or licensing requirements. Non-U.S. customers wishing to effect a transaction should contact a CS entity in their local jurisdiction unless governing law permits otherwise. U.S. customers wishing to effect a transaction should do so only by contacting a representative at Credit Suisse Securities (USA) LLC in the U.S. Please note that this report was originally prepared and issued by CS for distribution to their market professional and institutional investor customers. Recipients who are not market professional or institutional investor customers of CS should seek the advice of their independent financial advisor prior to taking any investment decision based on this report or for any necessary explanation of its contents. This research may relate to investments or services of a person outside of the UK or to other matters which are not regulated by the FSA or in respect of which the protections of the FSA for private customers and/or the UK compensation scheme may not be available, and further details as to where this may be the case are available upon request in respect of this report. Any Nielsen Media Research material contained in this report represents Nielsen Media Research's estimates and does not represent facts. NMR has neither reviewed nor approved this report and/or any of the statements made herein. If this report is being distributed by a financial institution other than Credit Suisse AG, or its affiliates, that financial institution is solely responsible for distribution. Clients of that institution should contact that institution to effect a transaction in the securities mentioned in this report or require further information. This report does not constitute investment advice by Credit Suisse to the clients of the distributing financial institution, and neither Credit Suisse AG, its affiliates, and their respective officers, directors and employees accept any liability whatsoever for any direct or consequential loss arising from their use of this report or its content. Copyright 2011 CREDIT SUISSE AG and/or its affiliates. All rights reserved.
CREDIT SUISSE SECURITIES (USA) LLC United States of America: +1 (212) 325-2000