Embed Size (px)
Citation preview
1
Issues in the Management of Diabetic
Patients with Cardiovascular Disease
Elliot Rapaport, MD
December 13, 2008
2
Hyperglycemia and Acute Coronary Syndromes
3
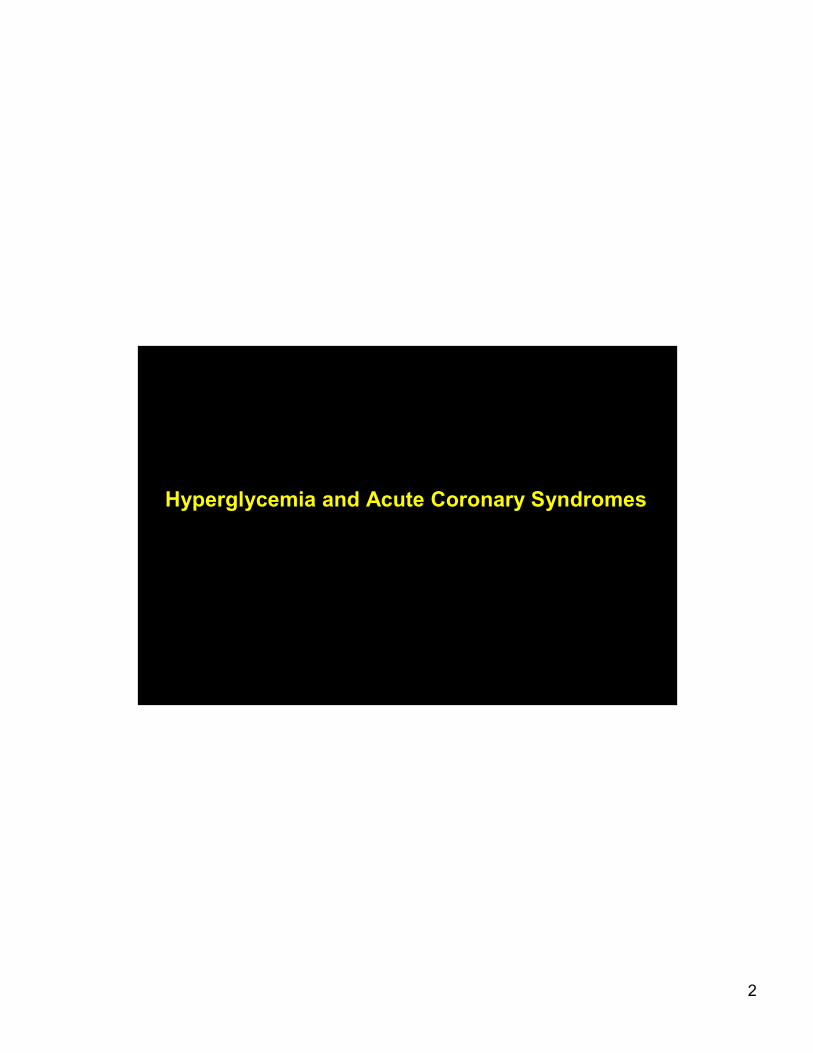
Effect of Hyperglycemia in STEMI
Impairs microvascular perfusion
Increases endothelial dysfunction
Decreases NO production
Increases oxidative stress
Promotes a pro-thrombotic state
Abolishes ischemic reconditioning experimentally
Increases inflammatory markers
Increases free fatty acid concentration
4
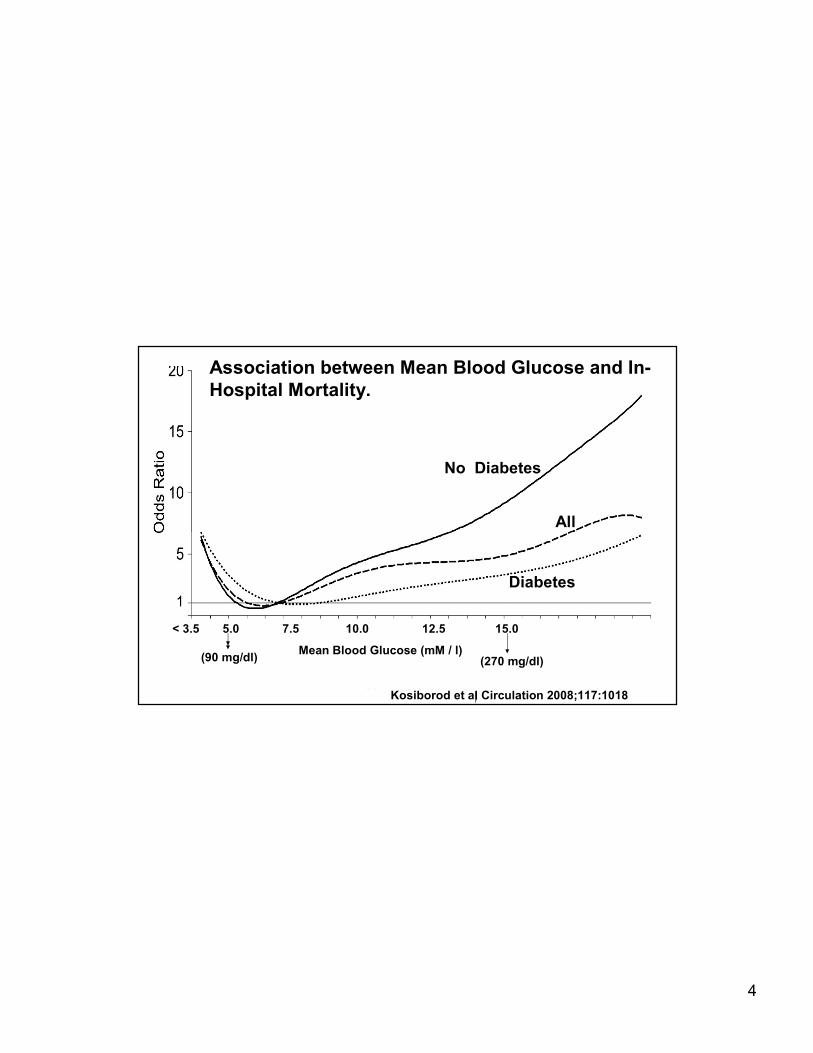
Kosiborod et al Circulation 2008;117:1018
Reference Mean BG 100-<110
No diabetes
Diabetes
All
< 3.5 5.0 7.5 10.0 12.5 15.0
Mean Blood Glucose (mM / l)
No Diabetes
Diabetes
All
Kosiborod et al Circulation 2008;117:1018
(90 mg/dl) (270 mg/dl)
Association between Mean Blood Glucose and In-
Hospital Mortality.
5
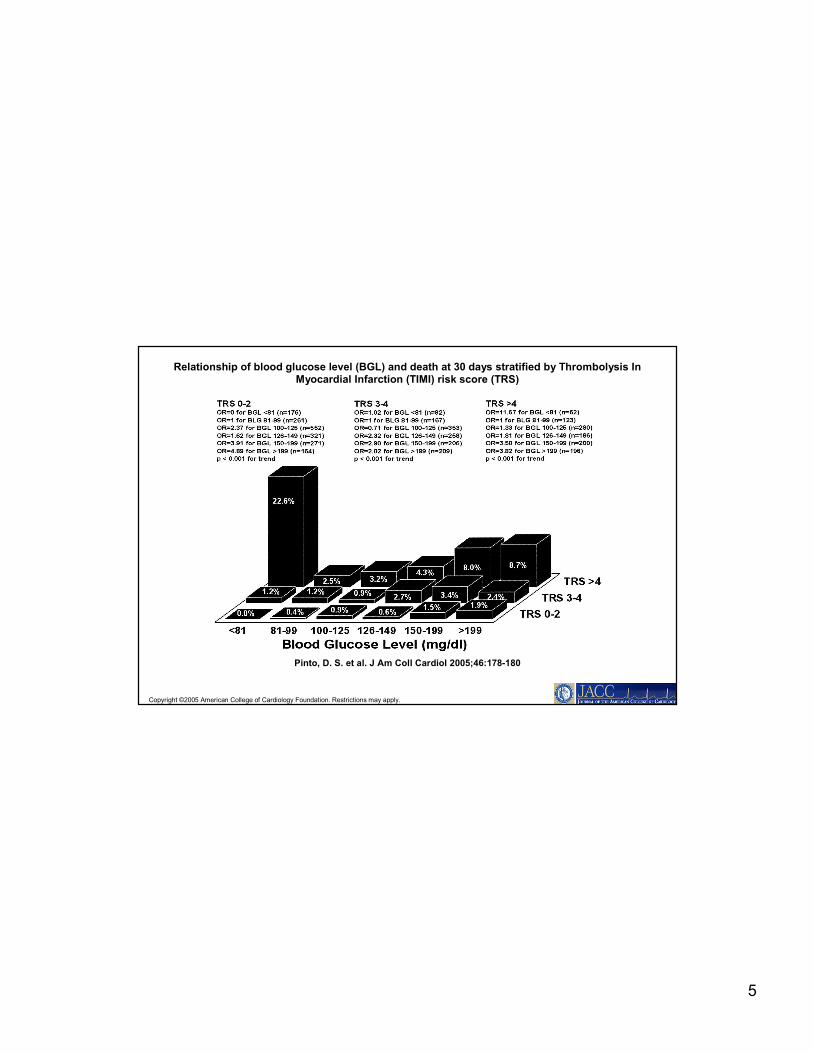
Copyright ©2005 American College of Cardiology Foundation. Restrictions may apply.
Pinto, D. S. et al. J Am Coll Cardiol 2005;46:178-180
Relationship of blood glucose level (BGL) and death at 30 days stratified by Thrombolysis In Myocardial Infarction (TIMI) risk score (TRS)
6
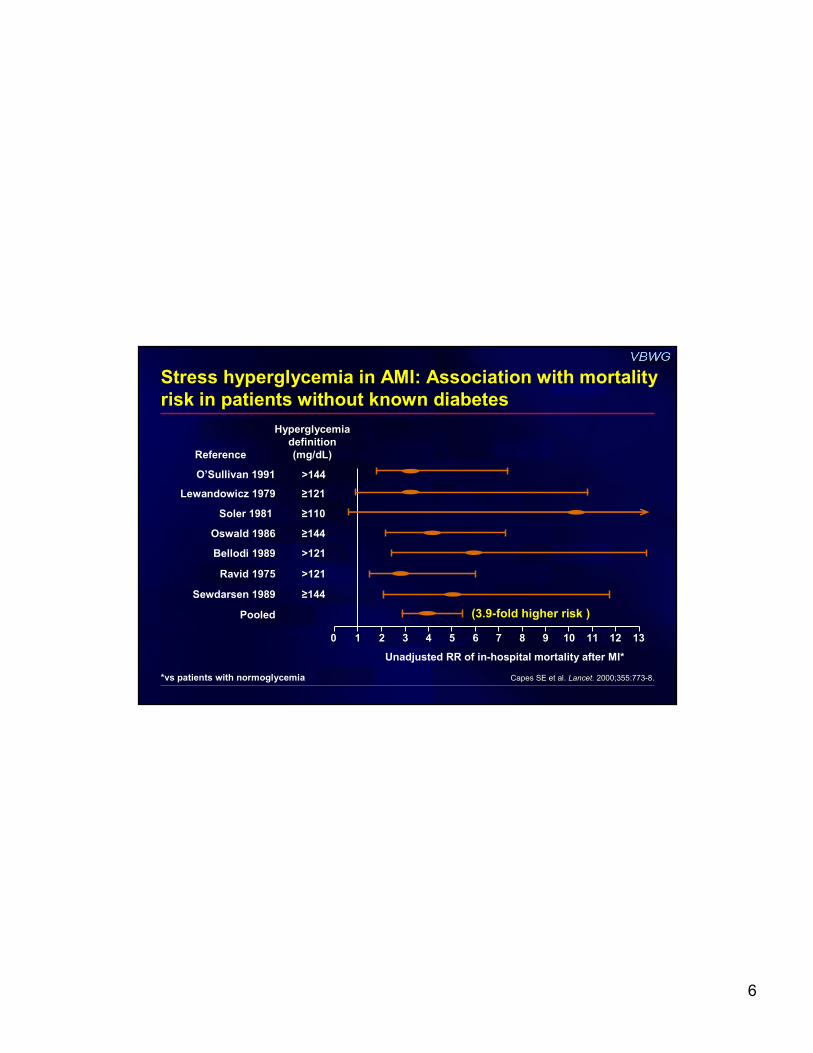
Stress hyperglycemia in AMI: Association with mortality
risk in patients without known diabetes
ReferenceReference
Hyperglycemia Hyperglycemia
definition definition
(mg/dL)(mg/dL)
00 1313
Unadjusted RR of in-hospital mortality after MI*
Capes SE et al. Capes SE et al. Lancet.Lancet. 2000;355:7732000;355:773--8.8.*vs patients with normoglycemia
O’Sullivan 19911991 >144>144
Lewandowicz 19791979 ≥≥121121
Soler 1981 1981 ≥≥110110
Oswald 19861986 ≥≥144144
Bellodi 19891989 >121>121
Ravid 19751975 >121>121
Sewdarsen 19891989 ≥≥144144
PooledPooled
11 22 33 44 55 66 77 88 99 1010 1111 1212
(3.9-fold higher risk )

7
*Multivariate analysis
∆∆∆∆Glucose (24 hr vs baseline)
≥30 mg/dL decrease No change to <30 mg/dL decrease Increase
Admission glucose and glucose change within 24
hours predict mortality risk
Goyal A et al. Eur Heart J. 2006;27:1289-97.
N = 1469 with AMI (n = 1219 without DM)
0
2
4
6
8
10
12
30-day
mortality
(%)
Baseline glucose (mg/dL)
<125 125–<140 140–<170 ≥170
0
↓↓↓↓9% in 30-day mortality per
↓↓↓↓11 mg/dL glucose in first
24 hr (P = 0.002)*
8
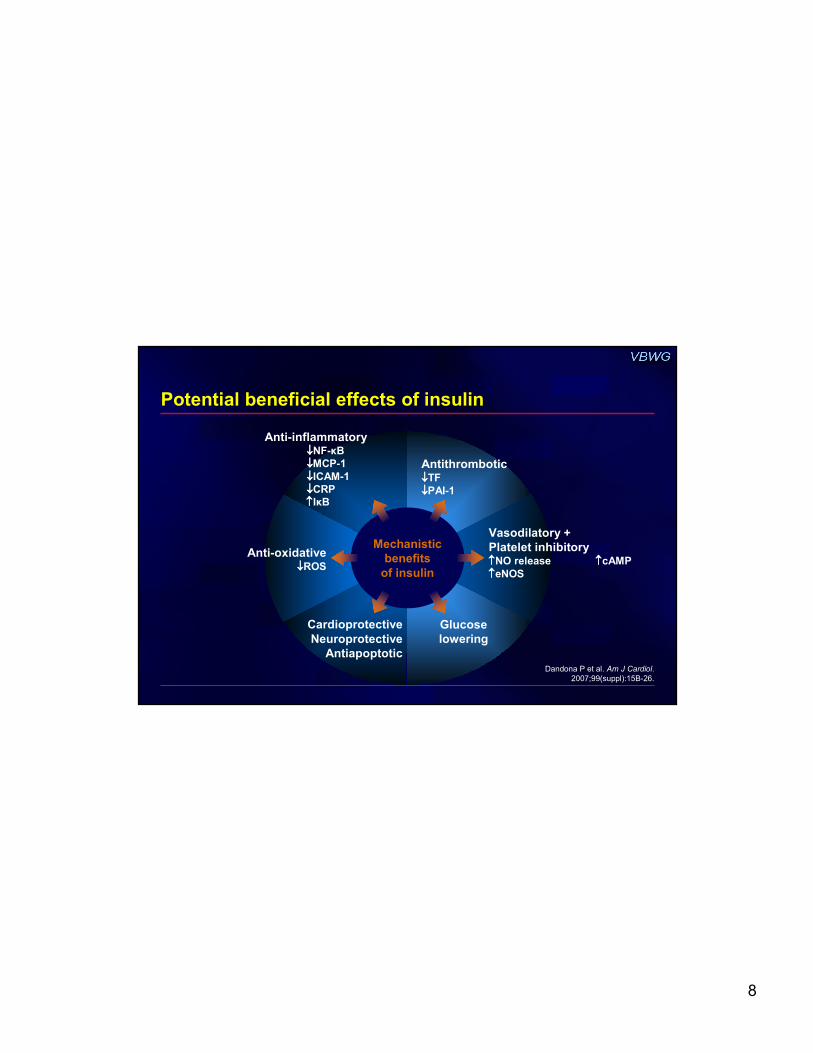
Potential beneficial effects of insulin
Dandona P et al. Am J Cardiol.
2007;99(suppl):15B-26.
Mechanistic
benefits
of insulin
Vasodilatory +
Platelet inhibitory↑↑↑↑NO release ↑↑↑↑cAMP
↑↑↑↑eNOS
Antithrombotic↓↓↓↓TF
↓↓↓↓PAI-1
Glucose
lowering
Anti-inflammatory↓↓↓↓NF-κB
↓↓↓↓MCP-1
↓↓↓↓ICAM-1
↓↓↓↓CRP
↑↑↑↑IκB
Anti-oxidative↓↓↓↓ROS
Cardioprotective
Neuroprotective
Antiapoptotic
9
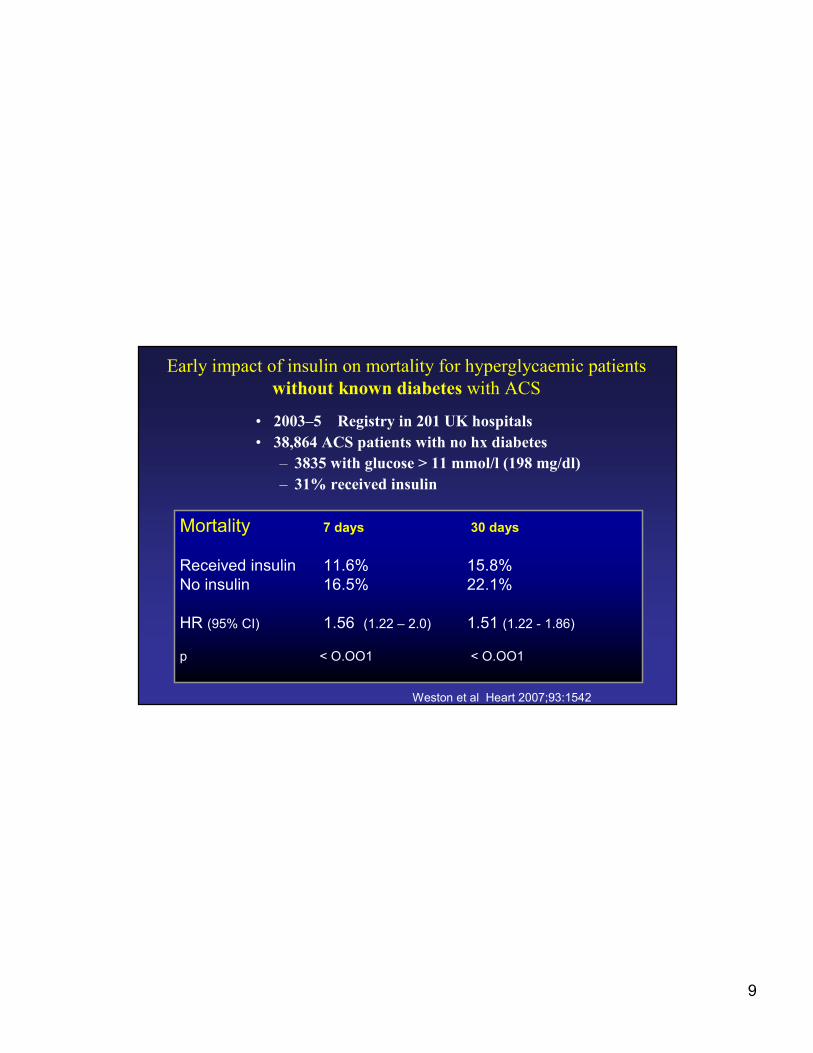
Early impact of insulin on mortality for hyperglycaemic patients
without known diabetes with ACS
• 2003–5 Registry in 201 UK hospitals
• 38,864 ACS patients with no hx diabetes
– 3835 with glucose > 11 mmol/l (198 mg/dl)
– 31% received insulin
Mortality 7 days 30 days
Received insulin 11.6% 15.8%
No insulin 16.5% 22.1%
HR (95% CI) 1.56 (1.22 – 2.0) 1.51 (1.22 - 1.86)
p < O.OO1 < O.OO1
Weston et al Heart 2007;93:1542
10
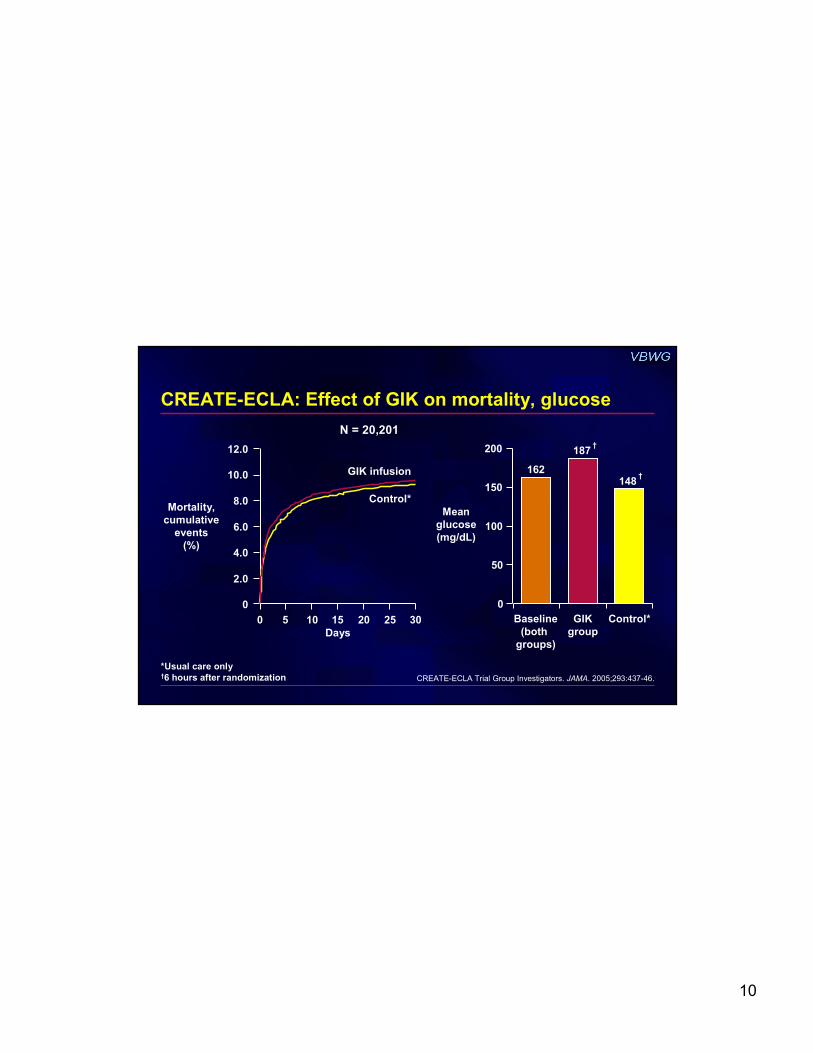
CREATE-ECLA: Effect of GIK on mortality, glucose
CREATE-ECLA Trial Group Investigators. JAMA. 2005;293:437-46.
Mean
glucose
(mg/dL)
Mortality,
cumulative
events
(%)
*Usual care only†6 hours after randomization
Days
0 5 10 15 20 25 30
0
12.0
GIK infusion
Control*
2.0
4.0
6.0
8.0
10.0
Baseline
(both
groups)
GIK
group
Control*
148†
162
187†200
150
100
50
0
N = 20,201

11
Insulin infusion to normalize BG recommended for
patients with STEMI + complicated courses
During acute management of STEMI in patients with
hyperglycemia, it is reasonable to administer insulin
infusion to normalize BG, even in those with an
uncomplicated course
After acute phase of STEMI, individualize diabetes
treatment; select combinations of agents that achieve
optimal glycemic control and are well tolerated
ACC/AHA STEMI guidelines:
Strict glucose control
Antman EM et al. J Am Coll Cardiol. 2004;44:671-719.
II IIaIIa IIbIIb IIIIII
BBBB
BBBB
CCCC
Class and level of evidence
12
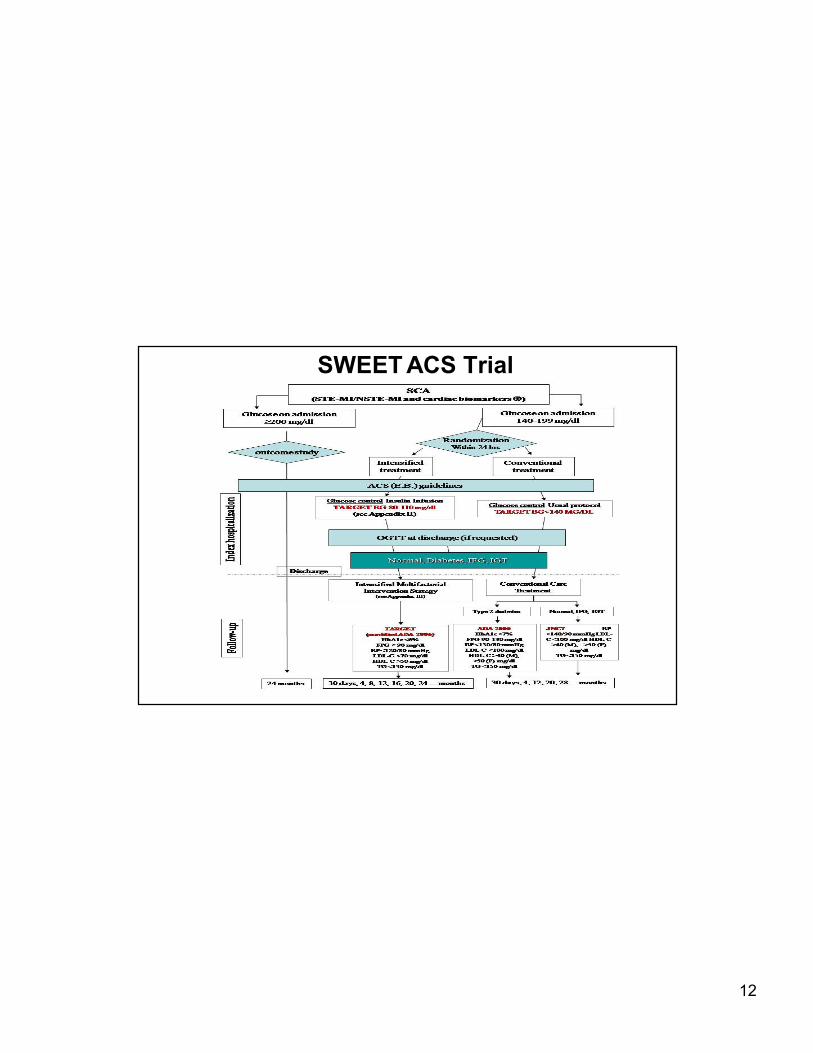
SWEET ACS trial SWEET ACS Trial
13
General Management of the Diabetic
Undergoing an ACS or STEMI
14
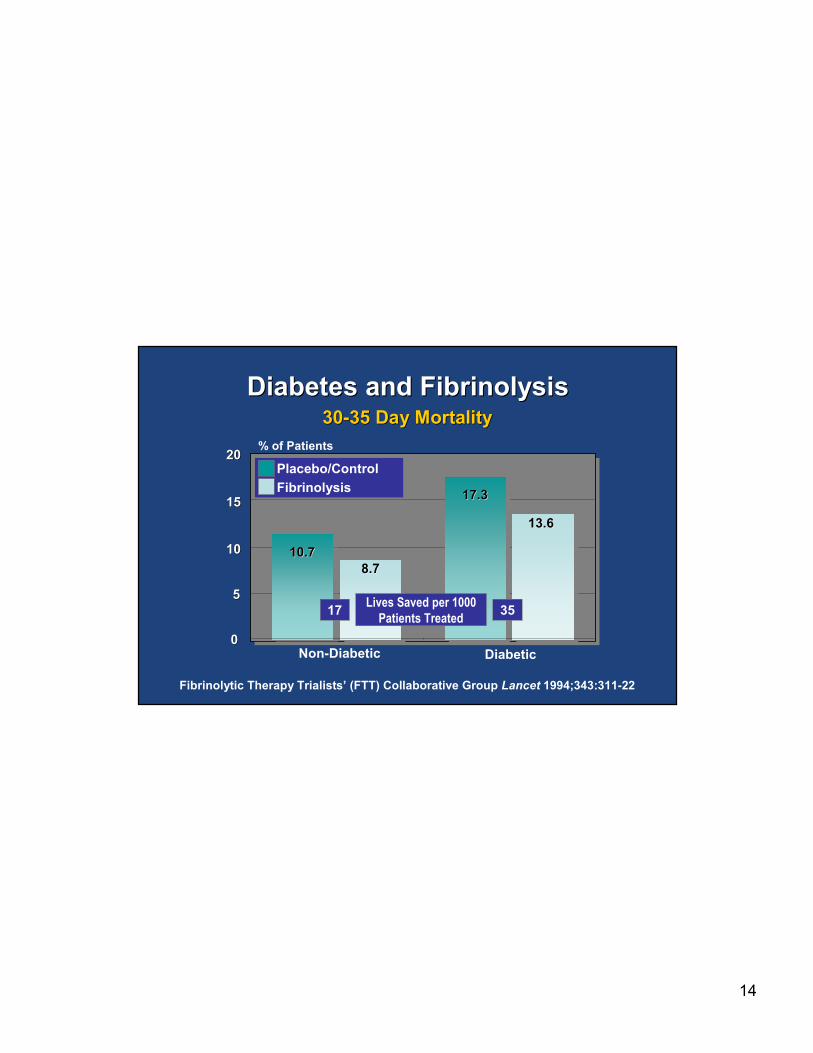
Diabetes and FibrinolysisDiabetes and Fibrinolysis
Fibrinolytic Therapy Trialists’ (FTT) Collaborative Group Lancet 1994;343:311-22
10.710.7
17.317.3
8.78.7
13.613.6
00
55
1010
1515
Placebo/Control
Fibrinolysis
Non-Diabetic
3030--35 Day Mortality35 Day Mortality
2020
Diabetic
% of Patients
Lives Saved per 1000
Patients Treated17 35
15
16
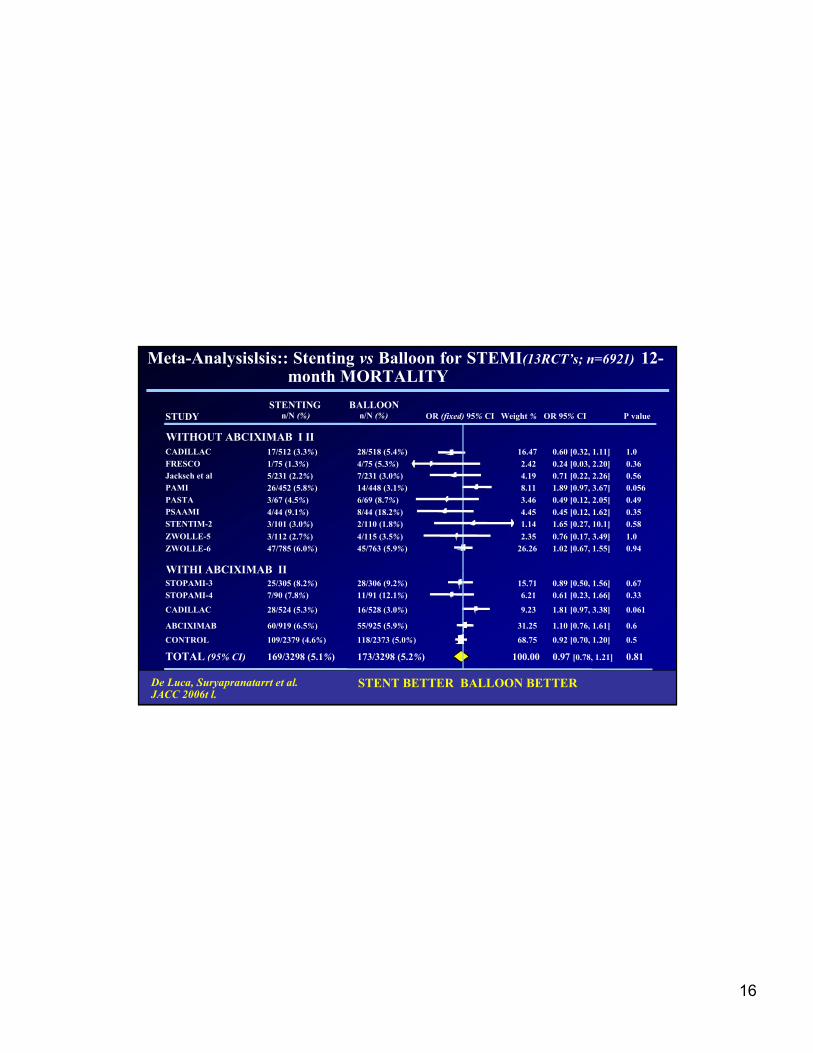
Meta-Analysislsis:: Stenting vs Balloon for STEMI(13RCT’s; n=6921) 12-month MORTALITY
STENTING BALLOON n/N (%) n/N (%) OR (fixed) 95% CI Weight% OR 95% CI P value STUDY
WITHOUT ABCIXIMAB I II
CADILLAC 17/512 (3.3%) 28/518 (5.4%) 16.47 0.60 [0.32, 1.11] 1.0
FRESCO 1/75 (1.3%) 4/75 (5.3%) 2.42 0.24 [0.03, 2.20] 0.36
Jacksch et al 5/231 (2.2%) 7/231 (3.0%) 4.19 0.71 [0.22, 2.26] 0.56
PAMI 26/452 (5.8%) 14/448 (3.1%) 8.11 1.89 [0.97, 3.67] 0.056
PASTA 3/67 (4.5%) 6/69 (8.7%) 3.46 0.49 [0.12, 2.05] 0.49
PSAAMI 4/44 (9.1%) 8/44 (18.2%) 4.45 0.45 [0.12, 1.62] 0.35
STENTIM-2 3/101 (3.0%) 2/110 (1.8%) 1.14 1.65 [0.27, 10.1] 0.58
ZWOLLE-5 3/112 (2.7%) 4/115 (3.5%) 2.35 0.76 [0.17, 3.49] 1.0
ZWOLLE-6 47/785 (6.0%) 45/763 (5.9%) 26.26 1.02 [0.67, 1.55] 0.94
WITHI ABCIXIMAB II
STOPAMI-3 25/305 (8.2%) 28/306 (9.2%) 15.71 0.89 [0.50, 1.56] 0.67
STOPAMI-4 7/90 (7.8%) 11/91 (12.1%) 6.21 0.61 [0.23, 1.66] 0.33
CADILLAC 28/524 (5.3%) 16/528 (3.0%) 9.23 1.81 [0.97, 3.38] 0.061
ABCIXIMAB 60/919 (6.5%) 55/925 (5.9%) 31.25 1.10 [0.76, 1.61] 0.6
CONTROL 109/2379 (4.6%) 118/2373 (5.0%) 68.75 0.92 [0.70, 1.20] 0.5
TOTAL (95% CI) 169/3298 (5.1%) 173/3298 (5.2%) 100.00 0.97 [0.78, 1.21] 0.81
De Luca, , Suryapranatarrt et al. JACC 2006t l. 0.1 0.2 0.5 1 2 5 10
I STENT BETTER BALLOON BETTER
De Luca, Suryapranatarrt et al. JACC 2006t l.
STENT BETTER BALLOON BETTER
17
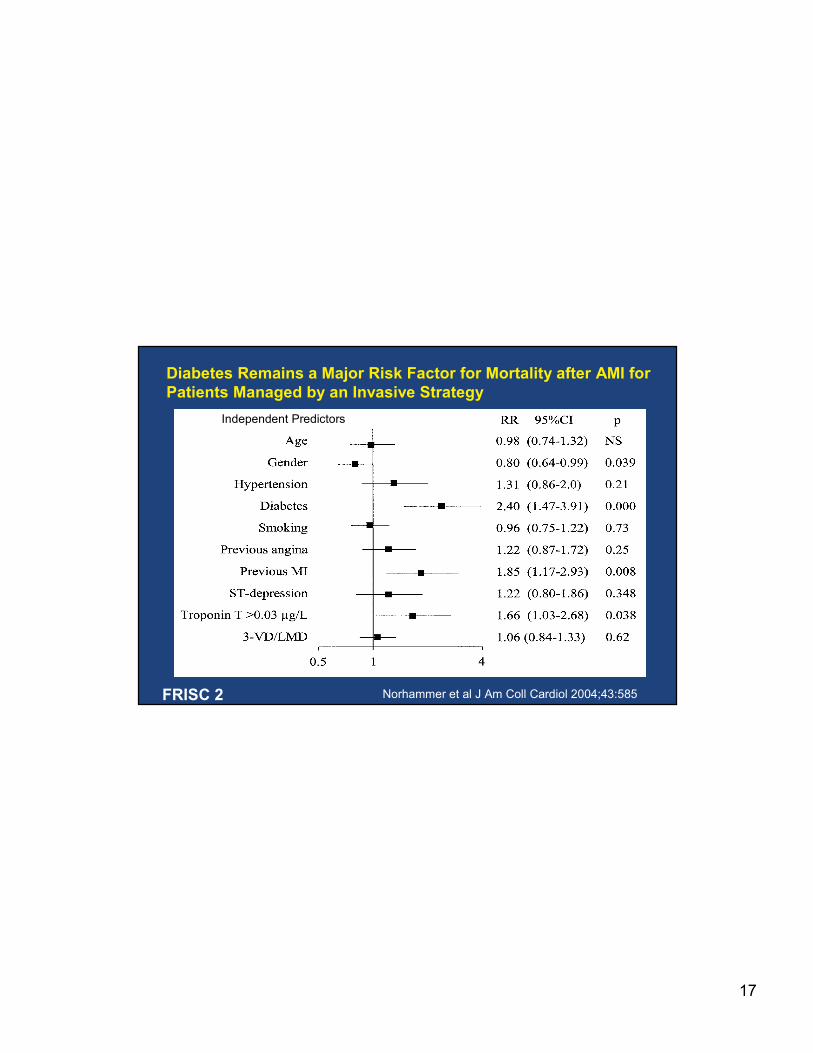
Diabetes Remains a Major Risk Factor for Mortality after AMI for
Patients Managed by an Invasive Strategy
Norhammer et al J Am Coll Cardiol 2004;43:585
Independent Predictors
FRISC 2
18
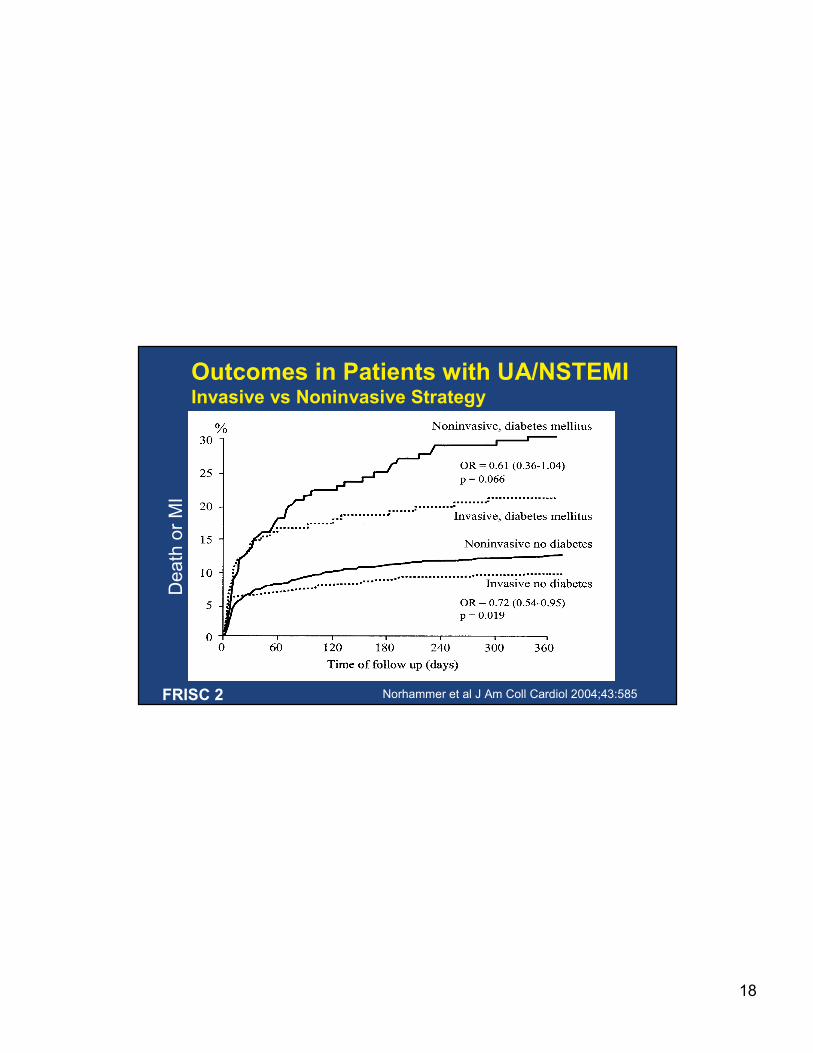
Outcomes in Patients with UA/NSTEMIInvasive vs Noninvasive Strategy
Death or MI
Norhammer et al J Am Coll Cardiol 2004;43:585FRISC 2
19
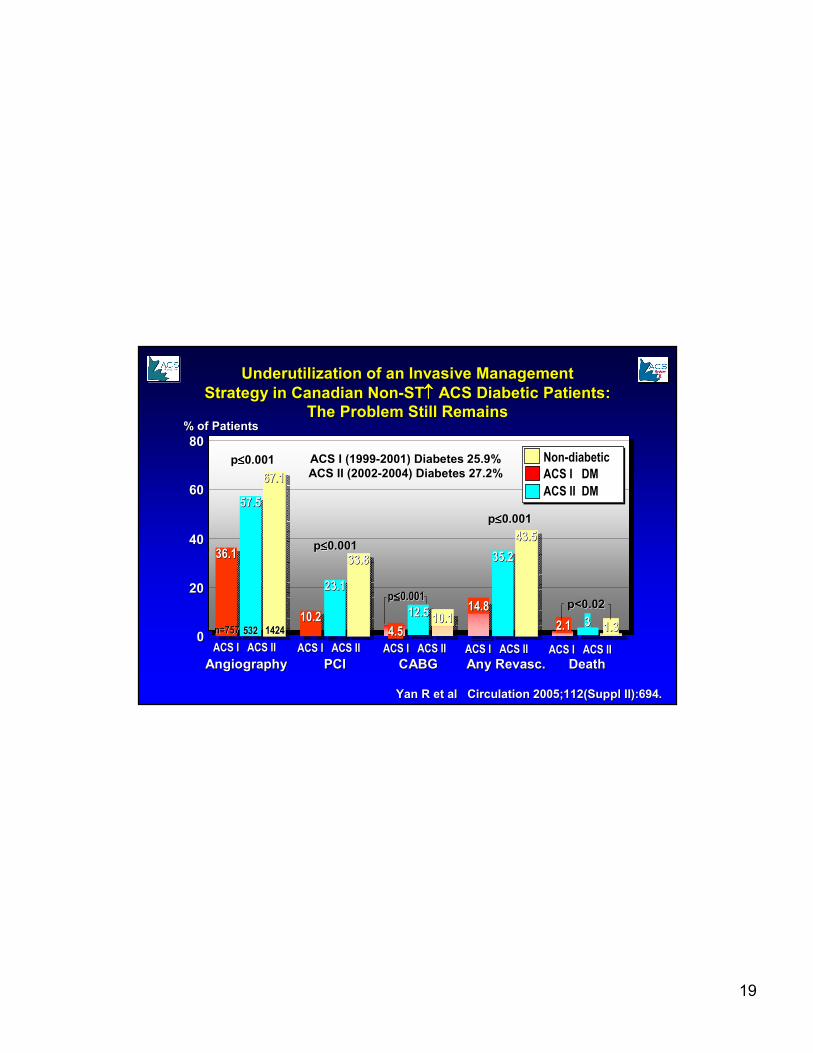
36.136.1
10.210.24.54.5
14.814.8
2.12.1
57.557.5
23.123.1
12.512.5
35.235.2
33
67.167.1
33.833.8
10.110.1
43.543.5
1.31.300
2020
4040
6060
8080
ACS IACS I ACS IIACS II
NonNon--diabeticdiabetic
ACS I DMACS I DM
ACS IACS I ACS IIACS II ACS IACS I ACS IIACS II ACS IACS I ACS IIACS II ACS IACS I ACS IIACS II
n=757 n=757 532 532 1424 1424
Underutilization of an Invasive ManagementUnderutilization of an Invasive Management
Strategy in Canadian NonStrategy in Canadian Non--STST↑↑↑↑↑↑↑↑ ACS Diabetic Patients:ACS Diabetic Patients:
The Problem Still RemainsThe Problem Still Remains
Yan R et al Circulation 2005;112(Suppl II):694.Yan R et al Circulation 2005;112(Suppl II):694.
DeathDeathAny Any RevascRevasc..CABGCABGPCIPCIAngiographyAngiography
% of Patients% of Patients
pp≤≤≤≤≤≤≤≤0.0010.001
pp≤≤≤≤≤≤≤≤0.0010.001
pp≤≤≤≤≤≤≤≤0.0010.001
pp≤≤≤≤≤≤≤≤0.0010.001
p<0.02p<0.02
ACS I (1999ACS I (1999--2001) Diabetes 25.9% 2001) Diabetes 25.9%
ACS II (2002ACS II (2002--2004) Diabetes 27.2% 2004) Diabetes 27.2%
ACS II DMACS II DM
20
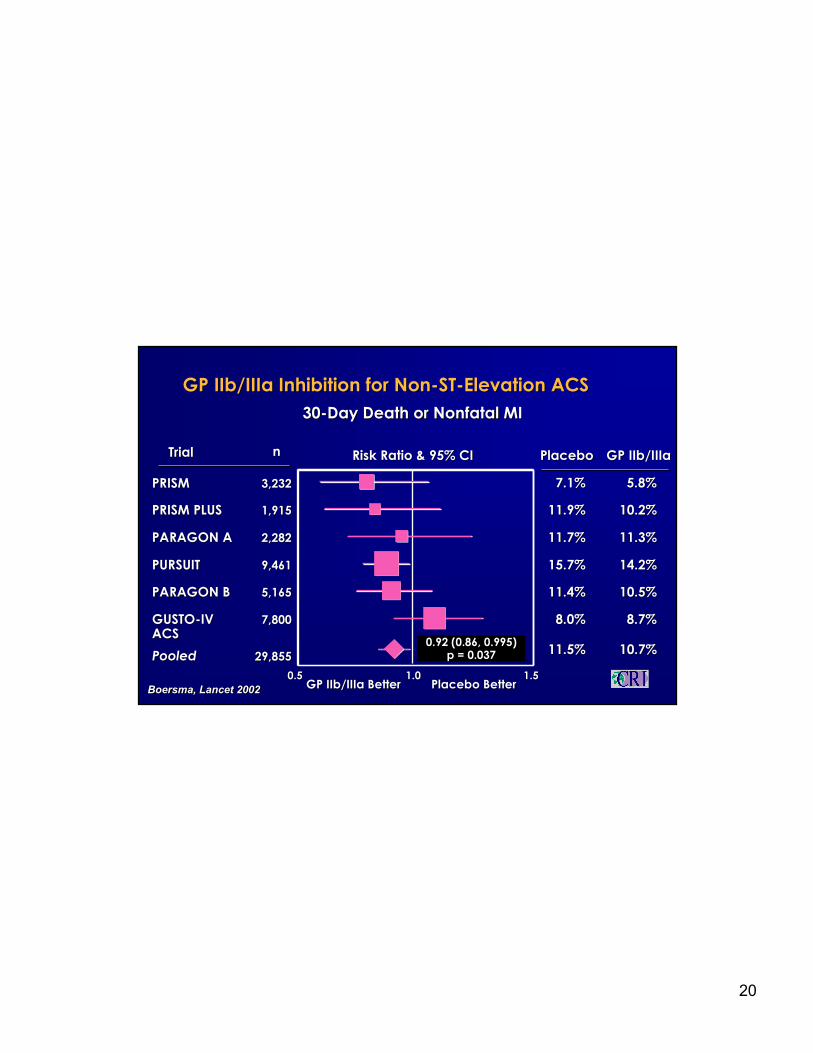
GP GP IIb/IIIaIIb/IIIa Inhibition for NonInhibition for Non--STST--Elevation ACSElevation ACS
3030--Day Death or Nonfatal MIDay Death or Nonfatal MI
Risk Ratio & 95% CIRisk Ratio & 95% CI
Placebo BetterPlacebo BetterGP GP IIb/IIIaIIb/IIIa BetterBetter
TrialTrial
PooledPooled11.5%11.5%
PlaceboPlacebo GP GP IIb/IIIaIIb/IIIa
10.7%10.7%29,85529,855
nn
0.92 (0.86, 0.995)0.92 (0.86, 0.995)p = 0.037p = 0.037
PRISM PLUSPRISM PLUS 11.9%11.9% 10.2%10.2%1,9151,915
PURSUITPURSUIT 15.7%15.7% 14.2%14.2%9,4619,461
PARAGON APARAGON A 11.7%11.7% 11.3%11.3%2,2822,282
7.1%7.1%PRISMPRISM 5.8%5.8%3,2323,232
0.50.5 1.01.0 1.51.5
PARAGON BPARAGON B 11.4%11.4% 10.5%10.5%5,1655,165
GUSTOGUSTO--IV IV ACSACS
8.0%8.0% 8.7%8.7%7,8007,800
Boersma, Lancet 2002BoersmaBoersma, Lancet 2002, Lancet 2002
21
IIIIbb/III/IIIa a BetterBetter Placebo BetterPlacebo Better00 11 22
0.74 (0.59, 0.92) p=0.0070.74 (0.59, 0.92) p=0.007
Odds Ratio & 95% CI PlaceboPlacebo IIIIbb/III/IIIa a NN
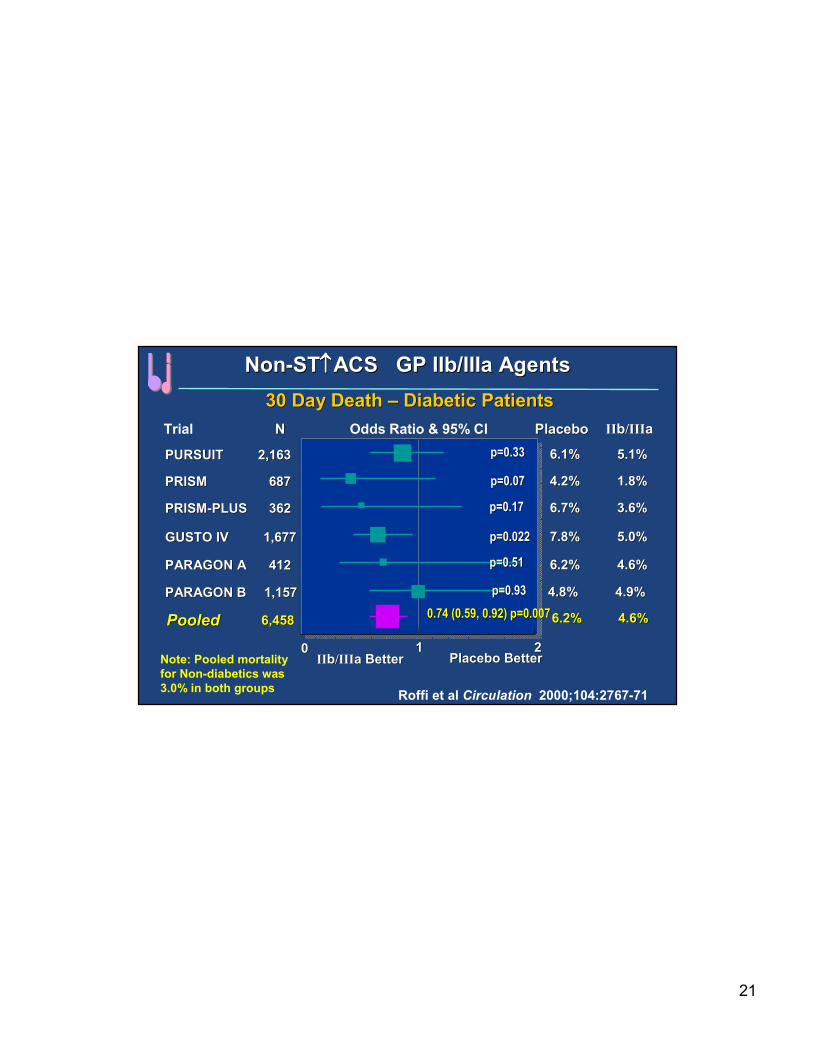
NonNon--STST↑↑↑↑↑↑↑↑ACS GP ACS GP IIb/IIIaIIb/IIIa AgentsAgents
PRISMPRISM 687687 4.2%4.2% 1.8%1.8%
PARAGON APARAGON A 412412 6.2%6.2% 4.6%4.6%
PARAGON BPARAGON B 1,1571,157 4.8%4.8% 4.9%4.9%
GUSTO IVGUSTO IV 1,6771,677 7.8%7.8% 5.0%5.0%
PRISMPRISM--PLUSPLUS 362362 6.7%6.7% 3.6%3.6%
6.1%6.1% 5.1%5.1%PURSUITPURSUIT 2,1632,163
30 Day Death 30 Day Death –– Diabetic PatientsDiabetic Patients
Trial
PooledPooled 6,4586,458 6.2%6.2% 4.6%4.6%
Roffi et al Circulation 2000;104:2767-71
p=0.33p=0.33
p=0.07p=0.07
p=0.17p=0.17
p=0.022p=0.022
p=0.51p=0.51
p=0.93p=0.93
Note: Pooled mortality
for Non-diabetics was
3.0% in both groups
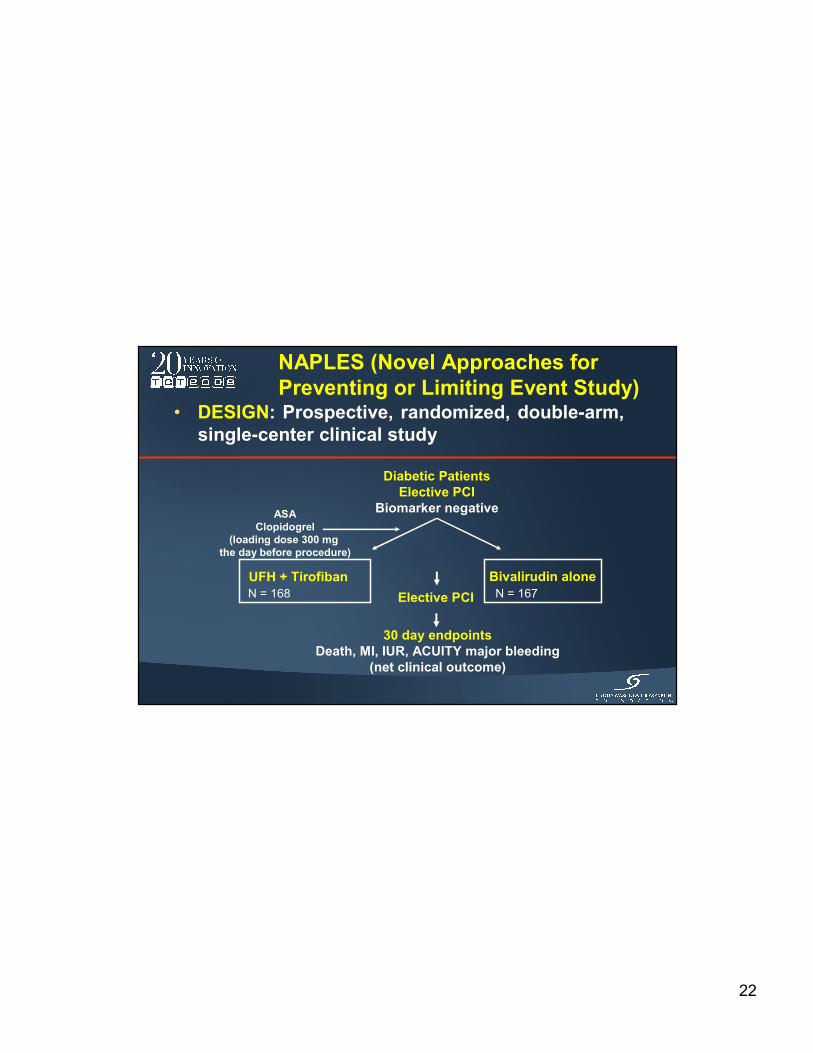
22
NAPLES (Novel Approaches for
Preventing or Limiting Event Study)• DESIGN: Prospective, randomized, double-arm,
single-center clinical study
Diabetic Patients
Elective PCI
Biomarker negative
UFH + Tirofiban Bivalirudin alone
ASA
Clopidogrel
(loading dose 300 mg
the day before procedure)
Elective PCI
30 day endpoints
Death, MI, IUR, ACUITY major bleeding
(net clinical outcome)
N = 168 N = 167
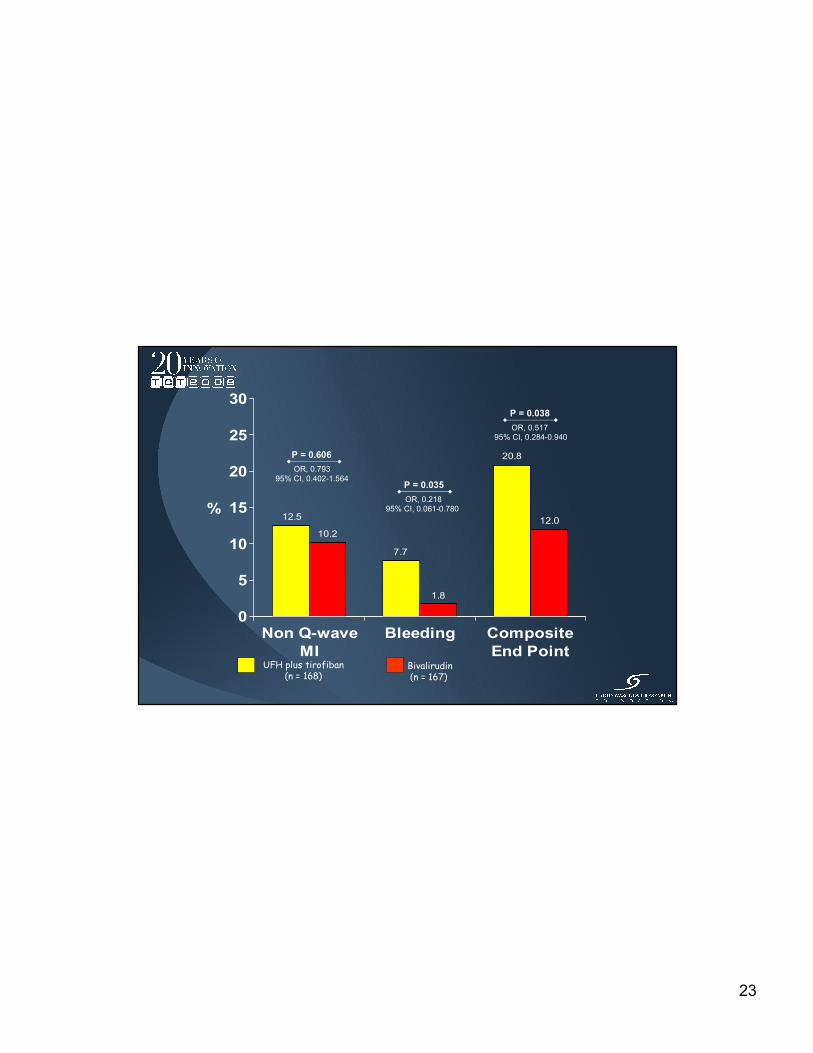
23
12.5
10.2
7.7
1.8
20.8
12.0
0
5
10
15
20
25
30
%
Non Q-wave
MI
Bleeding Composite
End Point
P = 0.038
P = 0.035
P = 0.606
UFH plus tirofiban(n = 168)
Bivalirudin(n = 167)
OR, 0.517
95% CI, 0.284-0.940
OR, 0.793
95% CI, 0.402-1.564
OR, 0.218
95% CI, 0.061-0.780

24
Adjunctive Pharmacologic Management of the
Diabetic Patient Undergoing an ACS
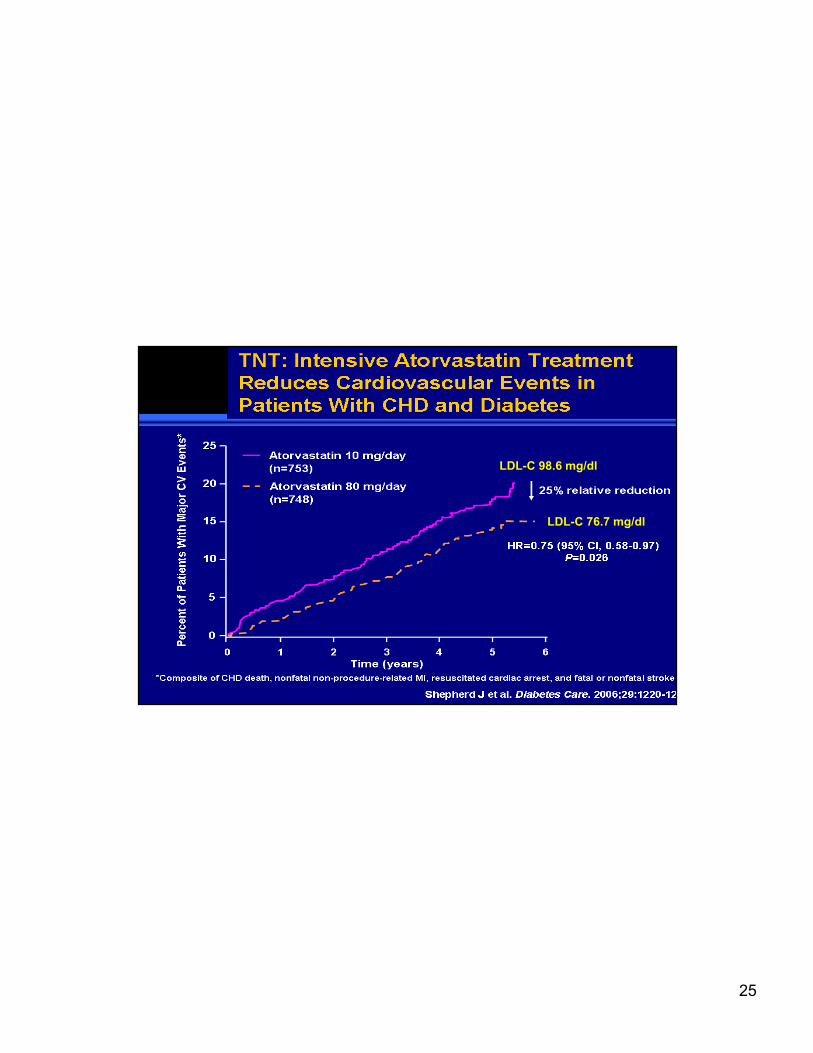
25
TNT: Intensive Atorvastatin Treatment
Reduces Cardiovascular Events in Patients
With CHD and DiabetesLDL-C 98.6 mg/dl
LDL-C 76.7 mg/dl
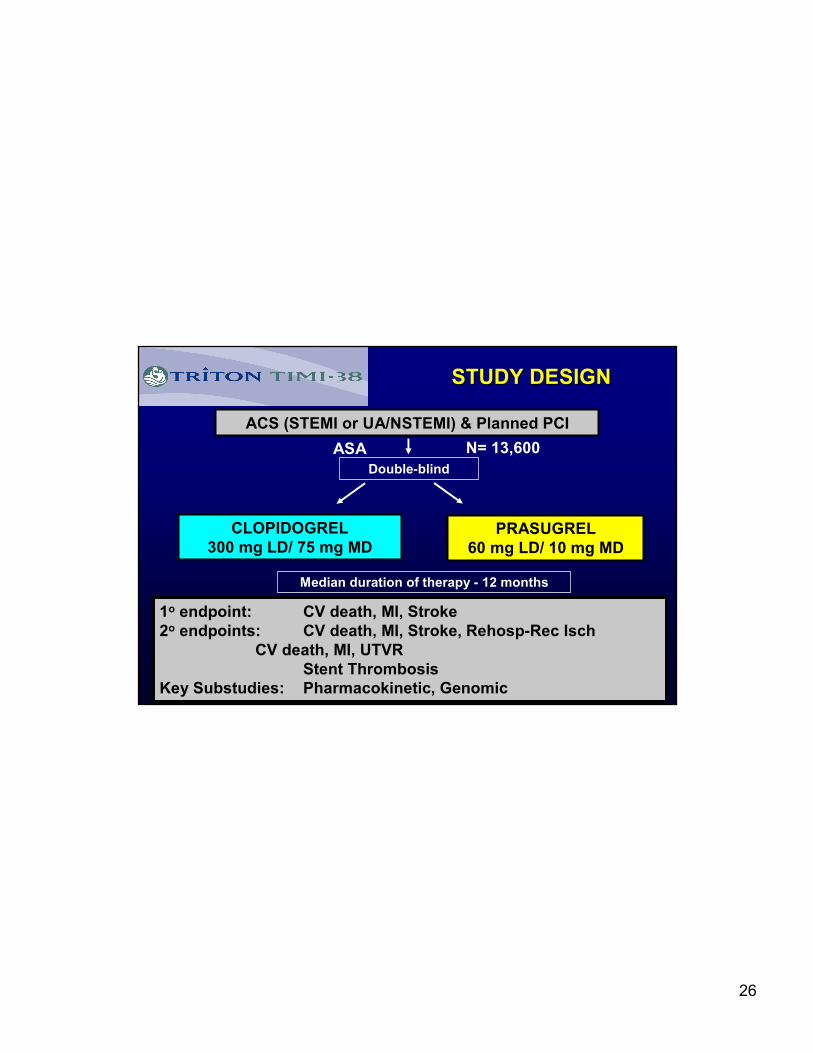
26
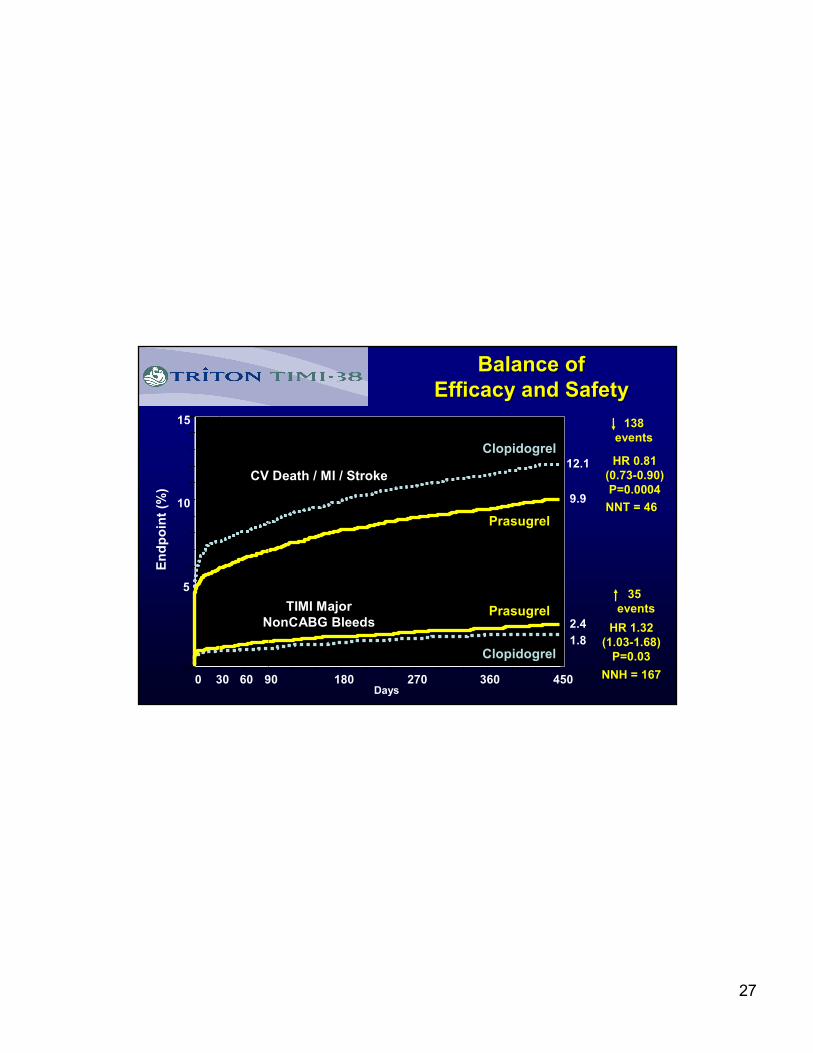
STUDY DESIGNSTUDY DESIGN
Double-blind
ACS (STEMI or UA/NSTEMI) & Planned PCI
ASA
PRASUGREL
60 mg LD/ 10 mg MD
CLOPIDOGREL
300 mg LD/ 75 mg MD
1o endpoint: CV death, MI, Stroke
2o endpoints: CV death, MI, Stroke, Rehosp-Rec Isch
CV death, MI, UTVR
Stent Thrombosis
Key Substudies: Pharmacokinetic, Genomic
Median duration of therapy - 12 months
N= 13,600
27
0
5
10
15
0 30 60 90 180 270 360 450
HR 0.81
(0.73-0.90)
P=0.0004
Prasugrel
Clopidogrel
Days
En
dp
oin
t (%
)
12.1
9.9
HR 1.32
(1.03-1.68)
P=0.03
Prasugrel
Clopidogrel1.8
2.4
138
events
35
events
Balance of Balance of
Efficacy and SafetyEfficacy and Safety
CV Death / MI / Stroke
TIMI Major
NonCABG Bleeds
NNT = 46
NNH = 167
28
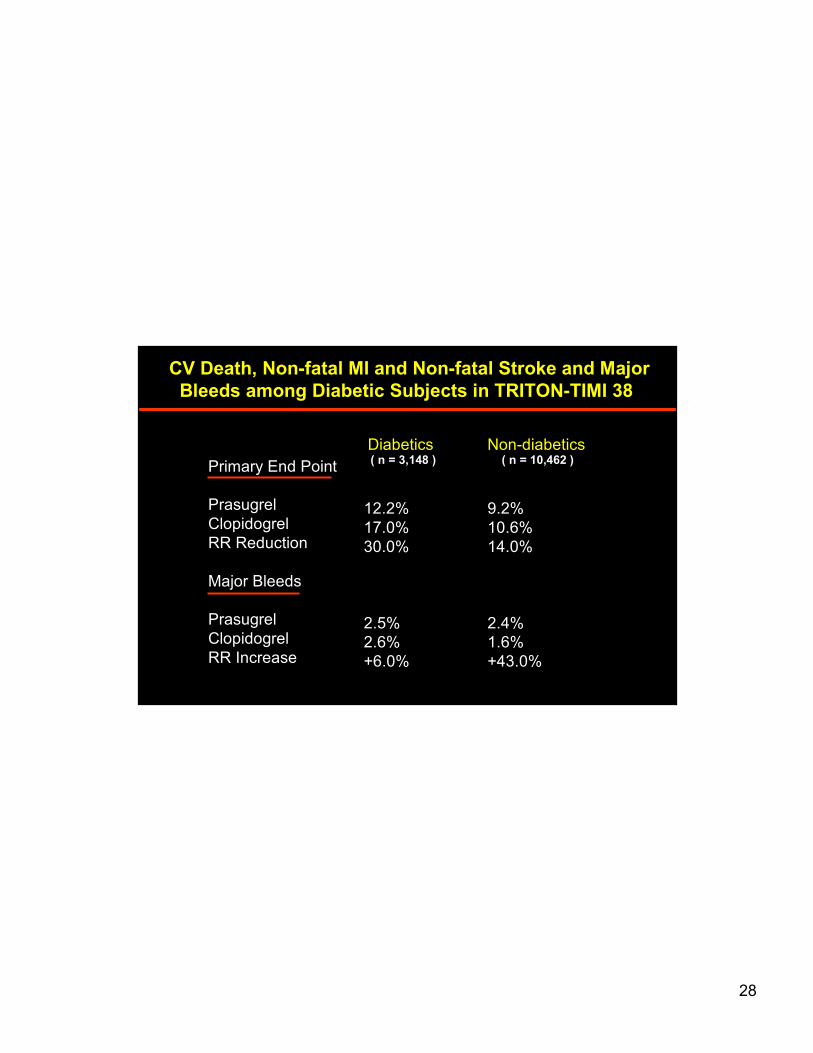
CV Death, Non-fatal MI and Non-fatal Stroke and Major
Bleeds among Diabetic Subjects in TRITON-TIMI 38
Diabetics Non-diabetics( n = 3,148 ) ( n = 10,462 )
Primary End Point
Prasugrel
Clopidogrel
RR Reduction
Major Bleeds
Prasugrel
Clopidogrel
RR Increase
12.2%
17.0%
30.0%
2.5%
2.6%
+6.0%
9.2%
10.6%
14.0%
2.4%
1.6%
+43.0%

29
PROactive: Ti me to Pri mar y
Composite End Point
(all-cause death, nonfatal MI [including silent MI], stroke, ACS,
leg amputation, coronary revascularization, leg revascularization)
30
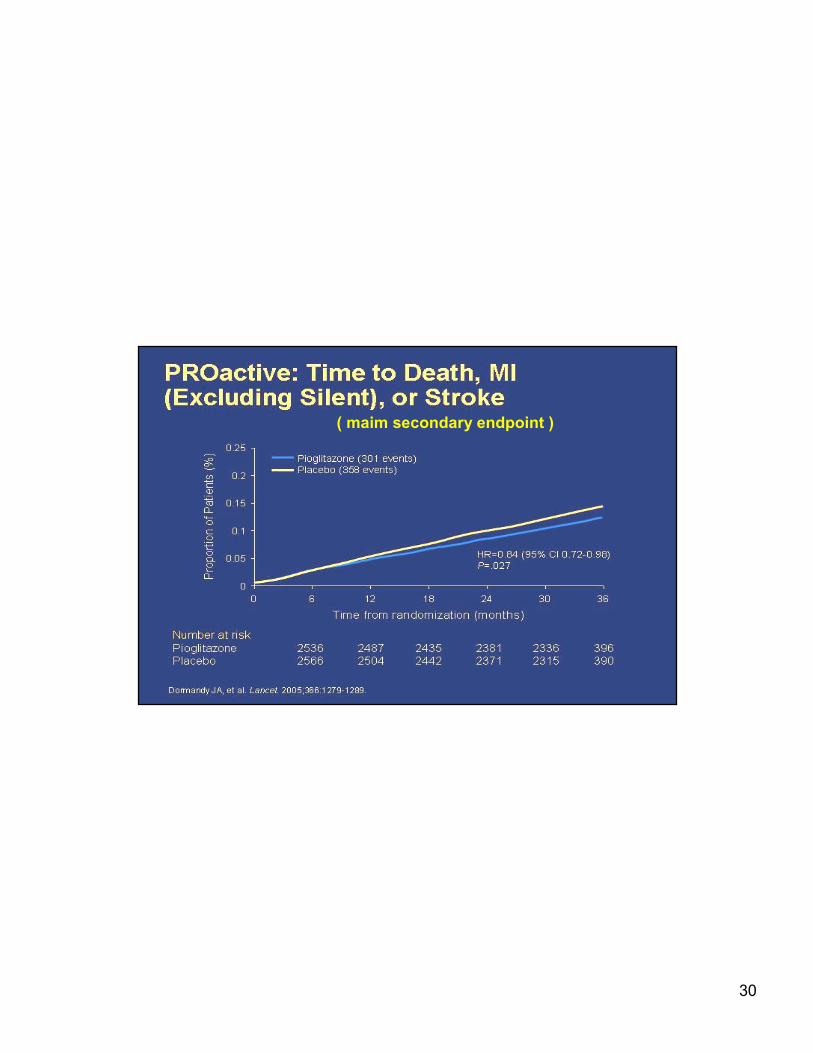
PROactive: Ti me to Death, MI (Excluding Silent), or Stro ke
( maim secondary endpoint )
31
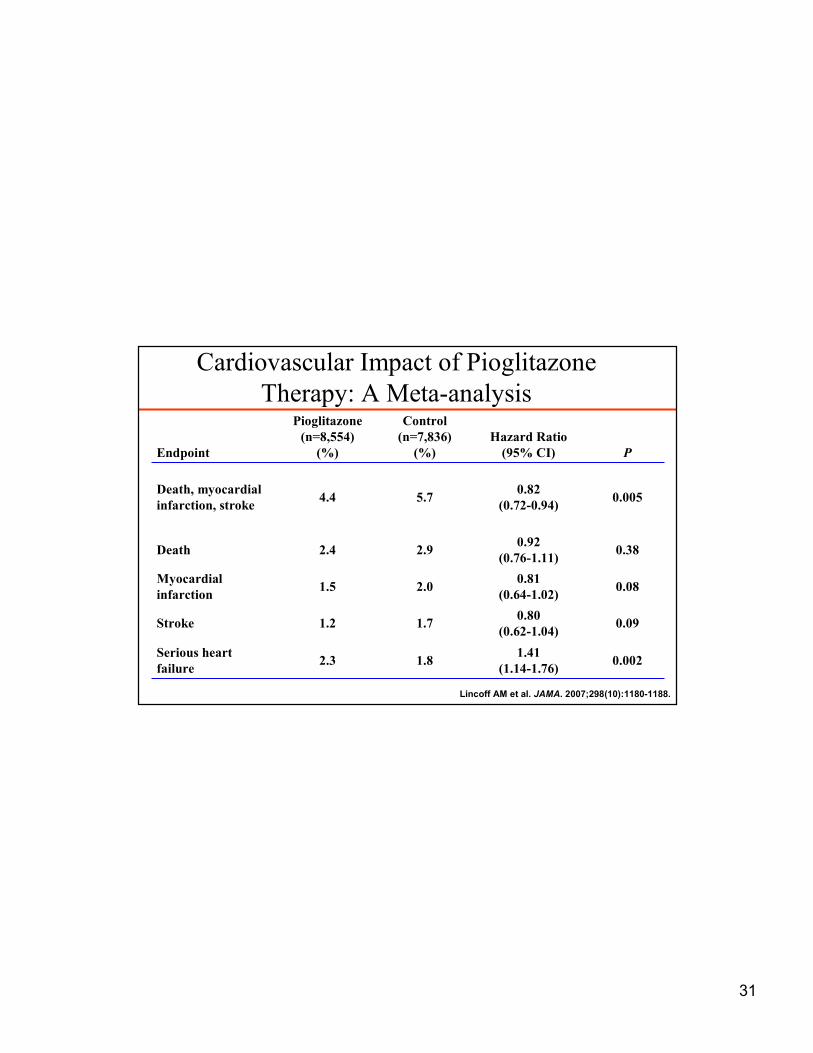
Cardiovascular Impact of Pioglitazone
Therapy: A Meta-analysis
Lincoff AM et al. JAMA. 2007;298(10):1180-1188.
Endpoint
Pioglitazone
(n=8,554)
(%)
Control
(n=7,836)
(%)
Hazard Ratio
(95% CI) P
Death, myocardial
infarction, stroke4.4 5.7
0.82
(0.72-0.94)0.005
Death 2.4 2.90.92
(0.76-1.11)0.38
Myocardial
infarction1.5 2.0
0.81
(0.64-1.02)0.08
Stroke 1.2 1.70.80
(0.62-1.04)0.09
Serious heart
failure2.3 1.8
1.41
(1.14-1.76)0.002

32
TM
© 1999 Professional Postgraduate Services®
DAIS: Final Results in CAD Patients WithType 2 Diabetes (200 mg/d Fenofibrate v plac.)
CAD
• Treatment with fenofibrate resulted in 40% reduction in rate
of progression of localized CAD (by prior angiography) versus
placebo
• 23% reduction in combined coronary events following
fenofibrate treatment (P=NS*)
Lipids
• Average reductions with fenofibrate: TC, 10%; LDL-C, 6%;
TG, 29%; average increase in HDL-C, 6%
Safety
• Very few serious adverse events; no significant differences in
tolerability between fenofibrate and placebo treatments;
95% compliance *Researchers report that results suggest benefit to patients.
Steiner G. XIIth International Symposium on Atherosclerosis;
June 27, 2000; Stockholm, Sweden.N = 418
33
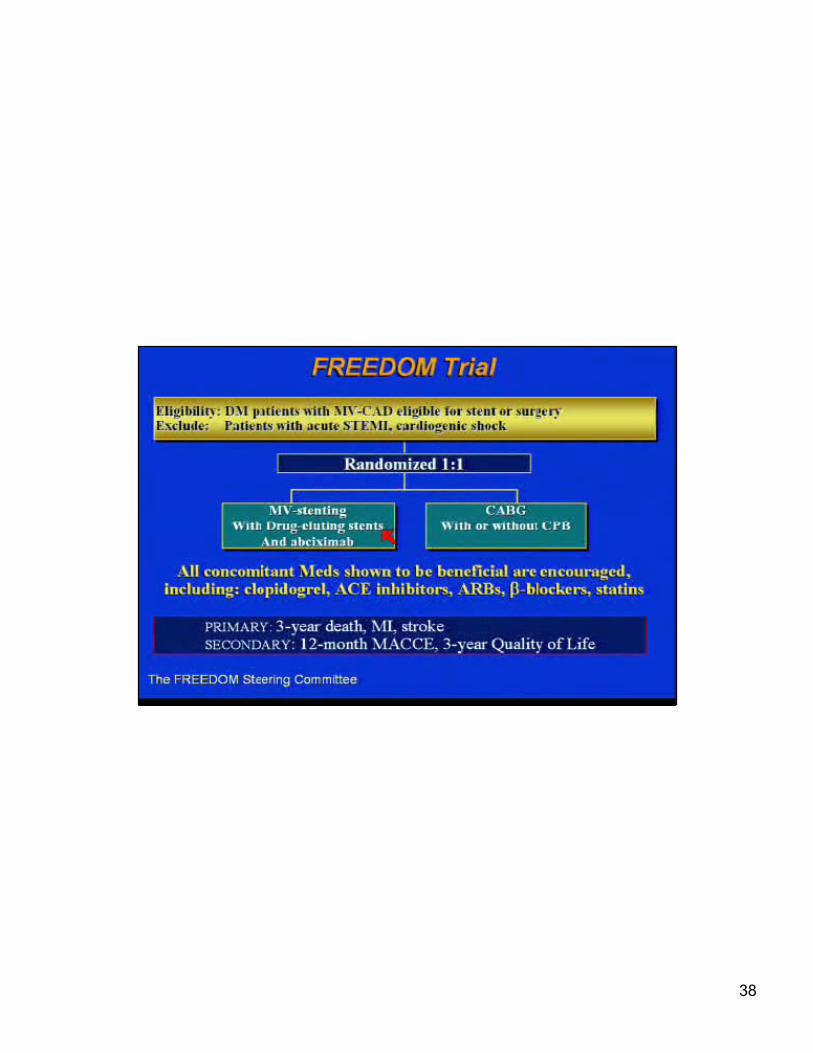
CABG or PCI in Diabetics with Multivessel CAD
34
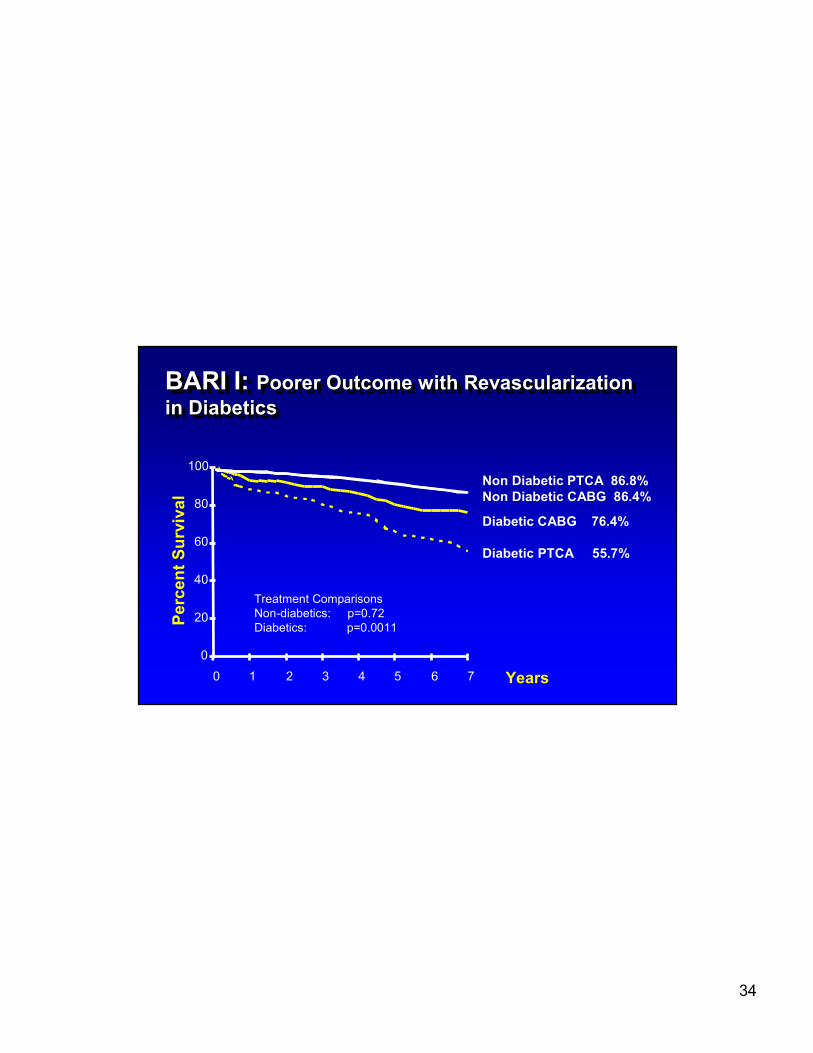
BARI I: Poorer Outcome with Revascularization
in Diabetics
BARI I: BARI I: Poorer Outcome with Revascularization Poorer Outcome with Revascularization
in Diabeticsin Diabetics
0
20
40
60
80
100
0 1 2 3 4 5 6 7
Pe
rce
nt
Su
rviv
al
Years
Non Diabetic PTCA 86.8%
Non Diabetic CABG 86.4%
Diabetic CABG 76.4%
Diabetic PTCA 55.7%
Treatment Comparisons
Non-diabetics: p=0.72
Diabetics: p=0.0011
35
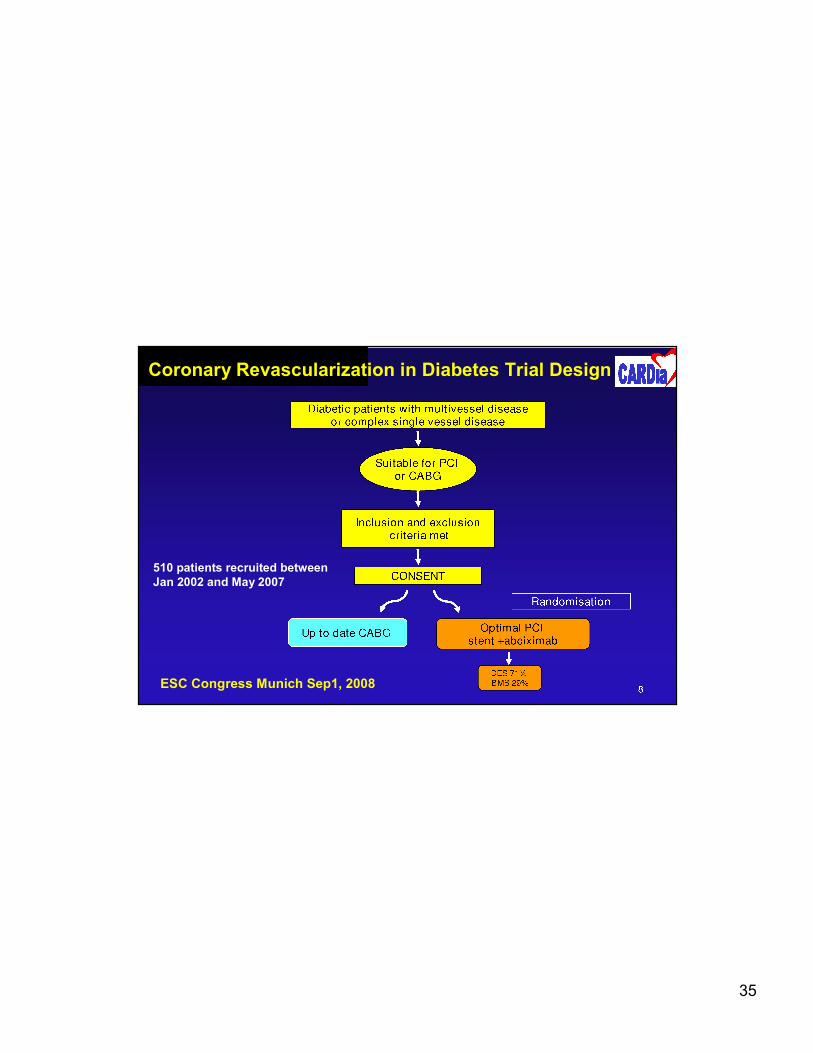
510 patients recruited between
Jan 2002 and May 2007
ESC Congress Munich Sep1, 2008
Coronary Revascularization in Diabetes Trial Design
36
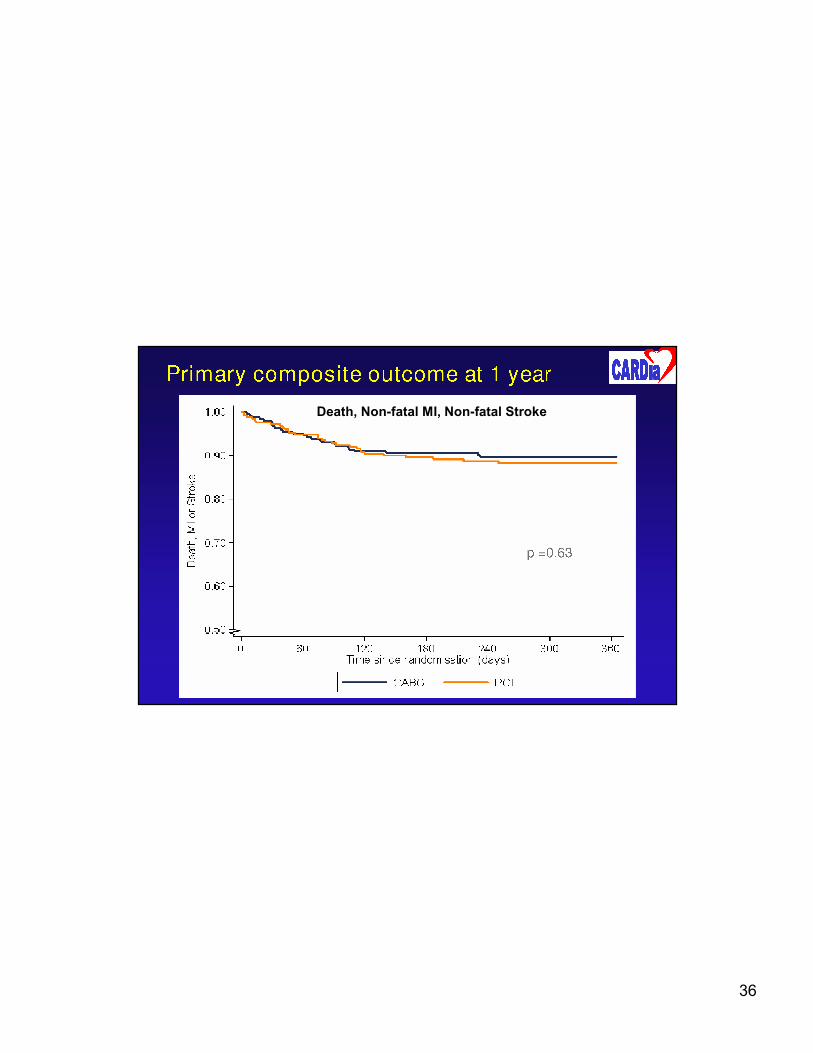
Death, Non-fatal MI, Non-fatal Stroke

37
38
39
40
41
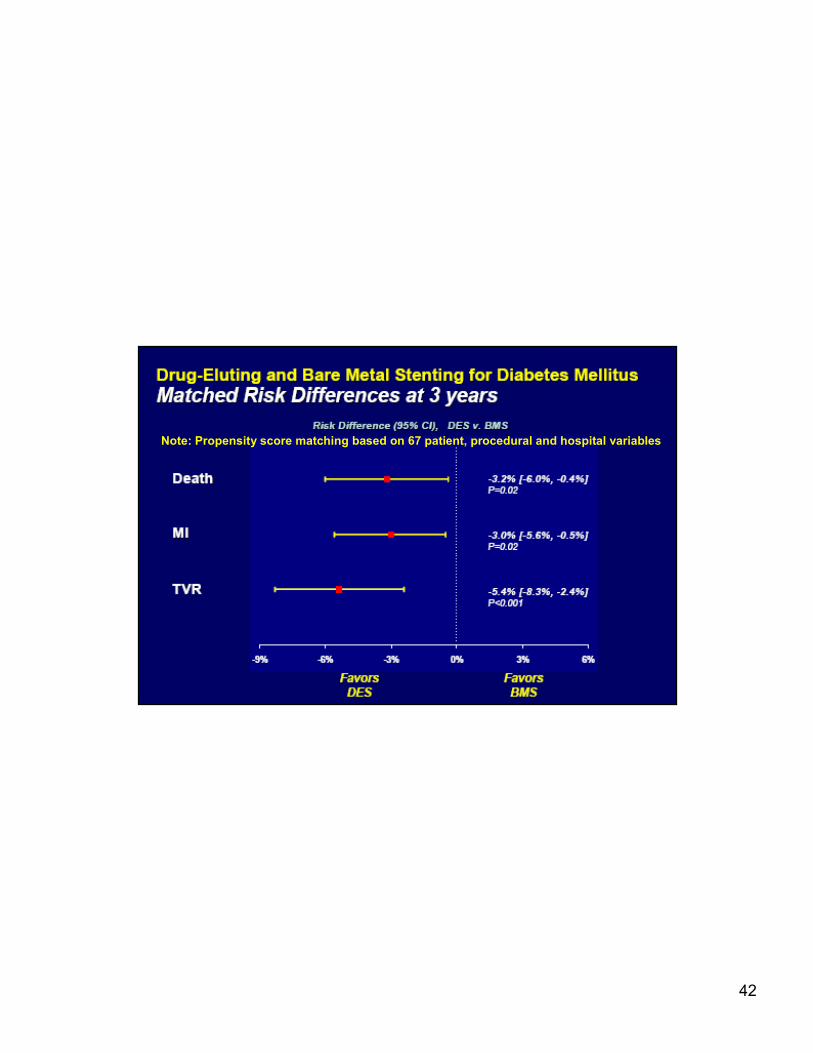
42
Note: Propensity score matching based on 67 patient, procedural and hospital variables
43

44
Long Term Therapy Following DES Use in AMI Patients with Diabetics
� High dose HMG Co-A Reductase Inhibitors with
LDL-C target < 70 mg/dl
� ACE Inhibitors or Angiotensin-Receptor Blockers
� Beta-Receptor Blockers
� Eplerenone if LV failure at onset and LVEF <40
� Low dose aspirin
� Extended Thienopyridine Therapy
� Diabetes Control