Embed Size (px)
Citation preview

MARKETREVIEW Issue 8, March 2014
Page | 1
Delivering in 2014 … and beyond
Issue 8
March 2014
MARKET REVIEW

MARKETREVIEW Issue 8, March 2014
Page | 2
Summary for executives … and those who don’t want to read detail
‘’…and every morning my moody neighbour is shouting
that he wants to buy my farm or sell his farm at a rate
that fluctuates daily depending on the mood he’s in…”
(Warren Buffett; Letter to Shareholders, 2014)
Markets are driven by moody neighbours continuously
changing their minds and focusing on the scoreboard
(price changes) rather than the field (what is
management doing with the business). If I can build on
Warren’s metaphor: The moody neighbours make their
decisions based on next week’s weather forecasts
rather than the previous 10 year’s crops.
I started writing this in Brazil where I was very
impressed with how the managements we met with
have reacted to the changed circumstances. It was
also instructive to delve into 2003 when Brazil needed
IMF help and how these businesses managed to keep
growing their shareholders capital AND pay dividends
to shareholders throughout.
But the moody neighbours are ignoring all that and
disregarding the historic and future productivity (or
yields) of those assets and are offering all the farms in
“Emerginglandia” for sale at discount prices.
Graph 1: Net% of fund managers saying they are
overweight GEM Equities
It reminds me a lot of those years when the
neighbourhood was buying farms in Technologica in
1998 and selling them in 2000 and 2001.
Warren’s farm example is all about thinking 10 years
and longer when making an investment. But when you
do think 10 years, buying the right farm is important. A
small difference in yield compounds to a large sum
over 10 years.
Whether it is farms or shares, they go through phases
where panic amongst leveraged holders set in and
everybody wants “out”. This is the time to ignore the
moody neighbours and the lousy macro to focus on the
historic productivity of the assets.
Does the selling wave of Emerging Markets by our
moody neighbours present a good investment
opportunity? A chance to buy quality long term growth
assets with superior yields?
For the Sanlam Global Best Ideas Fund Douw and his
team are finding enough disliked, mispriced value in
developed markets so they have scaled back their
direct investment in emerging markets. However, for
those who can stomach short-term volatility the Sanlam
Global Financial Fund’s team is excited about the long
term investment returns available in emerging markets.
But then, bear in mind, as Ukraine/Russia highlight this
month, emerging markets are often politically unstable
and unpredictable.
Please don’t forget our SIM Global Equity Income Fund
(a low risk fund which had an excellent 2013 and very
good start to 2014). It is 95% invested in developed
markets due to the availability of so many large
companies with long track records of consistently
growing their dividends. In addition, the shares are
trading on ±4% dividend yields.
I’ve expanded on the above themes in the rest of the
Market Review and added an addendum with more
detail using EM vs DM financial examples on the same
theme.

MARKETREVIEW Issue 8, March 2014
Page | 3
Warren Buffett’s Farm and Satisfactory Returns Fundamentals of investing…
In his most recent letter to shareholders Warren tells
the story of two investments he made around 25 years
ago that have done very well for him: a farm in
Nebraska and a property in New York. Looking back he
realises how the absence of daily price feeds meant he
never worried about them. He didn’t suffer “the moody
neighbour effect” (the constant barrage of offers to buy
his farm or the neighbour selling his). When you invest
in shares you should be thinking as if you are buying a
farm.
I’ve elaborated on this theme in this Market Review
and have attached the summary article from Fortune
Magazine as recommended reading. You can find the
entire letter to shareholders on
http://www.berkshirehathaway.com/letters/2013ltr.pdf
(or Nora will gladly mail you a copy).
Towards the end of his letter Warren concludes with
the following points “to illustrate certain fundamentals
of investing”.
You don’t need to be an expert in order to achieve
satisfactory investment returns.
Focus on the future productivity of an asset you
are considering
If you focus on the prospective price change of a
contemplated purchase, you are speculating.
There is nothing improper about that. I know,
however, that I am unable to speculate
successfully, and I am skeptical of those who claim
sustained success at doing so.
With my two small investments, I thought only of
what the properties would produce and cared not
at all about their daily valuations. Games are won
by players who focus on the playing field -- not by
those whose eyes are glued to the scoreboard.
Forming macro opinions or listening to the macro
or market predictions of others is a waste of time.
Indeed, it is dangerous because it may blur your
vision of the facts that are truly important.
My two purchases were made in 1986 and 1993.
What the economy, interest rates, or the stock
market might do in the years immediately following
-- 1987 and 1994 -- was of no importance to me in
determining the success of those investments. I
can't remember what the headlines or pundits were
saying at the time. Whatever the chatter, corn
would keep growing in Nebraska…”
Warren says that if you keep things simple (e.g. stay
within your circle of competence and not get affected
by the moody neighbours to invest/disinvest along with
them when they’re emotional) you’ll do well and
generate satisfactory returns. Indeed, he advocates
investing in an index (the S&P500) which he says will
do just that.
But, the S&P500's return over the past 14 years was
far from satisfactory, generating a compound return of
only 3.6%.
Table 1: S&P500 over 14 years.
S&P500 (incl divis)
Value invested
100
2000 -9.1% 91
2001 -11.9% 80
2002 -22.1% 62
2003 28.7% 80
2004 10.9% 89
2005 4.9% 93
2006 15.8% 108
2007 5.5% 114
2008 -37.0% 72
2009 26.5% 91
2010 15.1% 105
2011 2.1% 107
2012 16.0% 124
2013 32.0% 164
Continuing along the lines of Warren’s farming
metaphor, the S&P500’s 14 year return was poor
because:
the average American stock was quite expensive
in Jan 2000 (yields were poor), and
the average US company disappointed in terms of
growing shareholder value.
In other words: “US Farm Inc.” was not the best farm to
own.
MARKETREVIEW Issue 8, March 2014
Page | 4
Buy the right farm
Buying a Farm is good to help escape the noise, but
just not good enough. Buying the Right Farm is what
matters, and then if you can buy it when the price is
right, you’ve got a winner.
For 14 years investors ignored the wonderful yields
available in emerging markets because they focused
on short-term macro concerns.
A simple example: Many investors had Citigroup in
their portfolios simply because it was US and large and
seemingly successful. Few had Bank Rakyat Indonesia
(one of the largest banks in Indonesia). Yet, as Tables
2 and 3 show, measured over 14 years, buying a
“farm” in Indonesia versus a “farm” in the US made a
huge difference to your bank balance!
The combination of the ROE differential and the de-
rating/re-rating resulted in $1 million invested in
Citigroup shares leaving investors with $302,000 after
14 years versus $15,981,000 for your investment in
Bank Rakyat shares.
Table 2: Example: The value add of going off the
beaten track
Value of $ 1 million invested on
1 January 2000
As at 31 Dec 13 (Million)
Compound Growth Rate
Citigroup $0.302 -8.2%
Bank Rakyat Indonesia $15.981 21.9%
S&P 500 $1.636 3.6%
Footnote: BRI only listed in November 2003, hence I’ve used the multiple at time of IPO to approximate a January 2000 price. However, even if one does use the Nov 2003 IPO price as starting
point, BRI still outperforms by a very large margin.
What drove this outperformance?
Two factors
1. BRI management compounded shareholder value
at 21% (17% more than that of Citigroup – refer
Table 3). If you’re going to invest in a “farm” for the
long-term, that’s the type of yield you want.
2. But most importantly, emerging markets post the
1997 crisis were cheap whilst the US was
expensive. P/NAV of 2.0x for BRI vs 5.0x for Citi.
Not only did you invest in a very productive asset,
you bought it at a very attractive price.
(By the way, the fact that emerging market companies did
not destroy shareholders value via senseless acquisitions or
share buybacks at high prices also played a large role –
something very few analysts pick up on)
Table 3: Returns over the 14 years in US$ - two
drivers
CAGR
Shareholder
Value
(NAV + DPS)
CAGR
Investor
Return
(Share Price +
DPS)
P/NAV
Jan-00
P/NAV
Dec-13
Citigroup 4% -8% 5.40 0.94
Bank Rakyat
Indonesia 21% 22% 1.80 2.24
Our willingness to ignore the emotions of the
neighbourhood explains why the Sanlam Global
Financial Fund outperformed the S&P500 by such a
wide margin over the 14 years. We focused on the
yields of the “farms”, the farmer and the price (The
Sanlam Global Best Ideas Fund was only started in
2004, hence I’ve used the Sanlam Global Financial
Fund and financial shares as examples).
Graph 2: MSCI DM vs MSCI EM
Graph 2 shows that the BRI vs Citi example holds true
generally from 2000 to mid-2011. But a mistake we
made was that when it became apparent that the
probabilities that the US/Europe/UK would succeed in
preventing a banking and sovereign debt crisis, we
remained sceptical and concerned.
0
100
200
300
00
01
02
03
04
05
06
07
08
09
10
11
12
13
14
MSCI Emerging Market Index
MSCI World Index (DM)
Source: Bloomberg

MARKETREVIEW Issue 8, March 2014
Page | 5
Investing for a better than satisfactory return
Whilst Berkshire Hathaway’s net asset value per share
(NAV/share) outperformed the S&P500 handsomely
(grew at a compound rate of 9.4%) the Sanlam Global
Financial Fund (started whilst I was at Coronation in
1999) generated a compound return of 13.7% (Table 4)
Table 4: Berkshire and S&P500 compared to Sanlam
Global Financial Fund over 14 years.
Berkshire
Hathaway
NAV/share
S&P500
(incl. divis)
Sanlam
Global
Financial Fund
2000 6.5% -9.1% 25.3%
2001 -6.2% -11.9% -5.7%
2002 10.0% -22.1% 1.6%
2003 21.0% 28.7% 69.5%
2004 10.5% 10.9% 30.5%
2005 6.4% 4.9% 37.6%
2006 18.4% 15.8% 21.3%
2007 11.0% 5.5% 23.8%
2008 -9.6% -37.0% -63.3%
2009 19.8% 26.5% 96.1%
2010 12.0% 15.1% 31.5%
2011 4.6% 2.1% -14.4%
2012 14.4% 16.0% 29.7%
2013 18.2% 32.0% 4.8%
Note: Performance for the Sanlam Global Financial is calculated gross of fees. All figures in USD.
Graph 3: Value of $100 investment over 14 years (compound return noted at end of series)
Source: Bloomberg
This brings us to the important point I want to make in
this Market Review: Investors who invest with us do so
because they want a “better than satisfactory
return”.
To generate this return we search for companies that
are disliked by the market at the point we make the
investment, and where our research shows that, based
on their track record and forward yield, the market is
wrong. If I can expand on Warren’s metaphor, many
investors base their decision on whether to buy a farm
on next week’s weather forecasts, we focus on what
the farm produced over the past 10 years, and
whether it is likely to produce a similar return in the
future.
Many of our successes have been investments in
smaller companies (recent winners have been Bank of
Georgia, Panin Securitas) where our experience and
data base highlighted the potential and severe
undervaluation. But our bread-and-butter recipe is
simply recognising where the market ignores Einstein’s
8th wonder of the world: The value of compounding of
a high return on capital.
13.9%
9.4%
3.6%
0
100
200
300
400
500
600
700
99
00
01
02
03
04
05
06
07
08
09
10
11
12
13
Sanlam Global Fin Fund
Berkshire Hathaway
S&P500
MARKETREVIEW Issue 8, March 2014
Page | 6
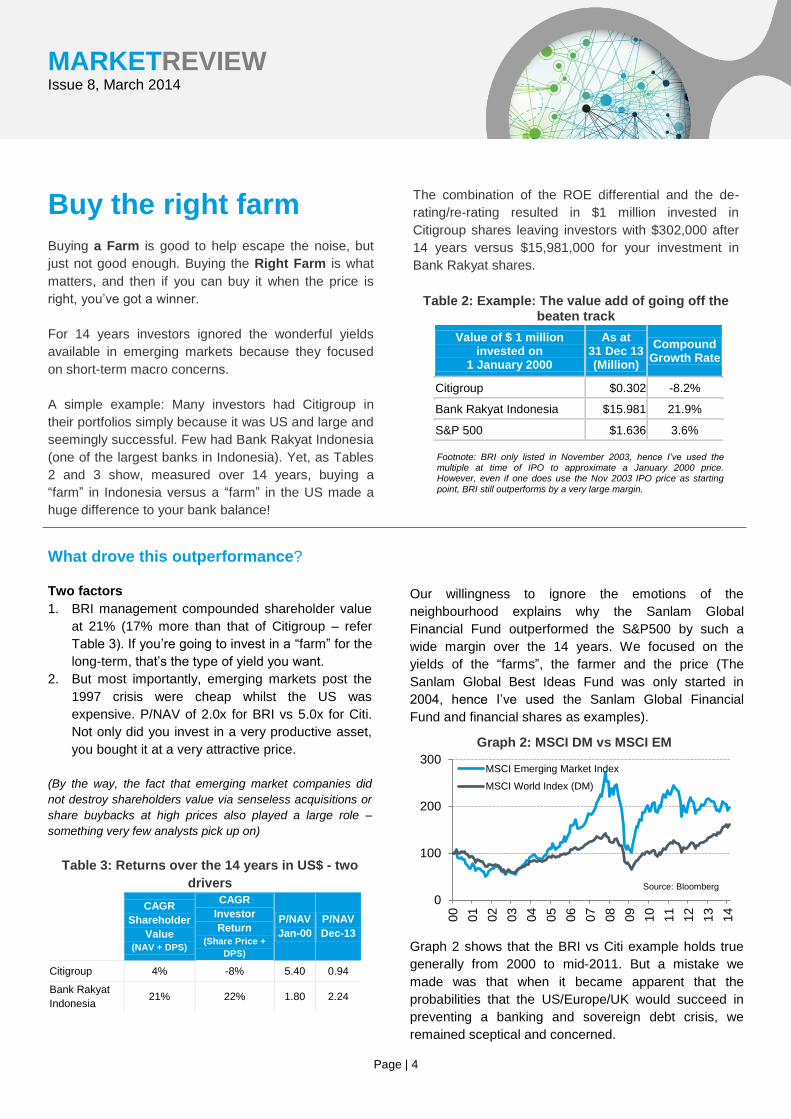
Bank Rakyat in 2013
% Change for 12 months ending Dec 2013
Net asset value growth (in rupiah) 22%
Share Price (Indonesia rupiah) 4%
Share Price (US dollar) -17%
S&P500 (US dollar) 32%
But what about 2011-2013
Our returns over the past three years are in stark
contrast with the previous 11 years. Why?
The most damaging was that we maintained a large
investment in emerging markets.
Bank Rakyat (BRI) is a good example to explain 2013
(see insert below). Result: compared to the S&P500, in
2013, the bank looks like a miserable failure.
Table 5: Bank Rakyat Indonesia NAV growth strong, currency declined 25%
2012 2013 2014
NAV+DPS per share (in Rupiah) 3,675 4,482 5,488
Growth in NAV/share 30% 22% 25%
PRICE in Rupiah 6,950 7,250 9,325
PRICE in US$ 0.721 0.596 0.819
ROE 32.7% 29.7% 27.6%
ROA 3.7% 3.6% 3.6%
P/NAV 2.62 2.24 2.31
Table 3 shows that BRI’s compound growth in
shareholders’ value was 22% (net asset value plus
dividends paid out measured in US$) over the past 14
years.
But Table 5 shows that whilst it grew its net asset
value per share at 22% in 2013 (higher than almost
any bank in the USA), it was the 25% decline in the
rupiah that did the damage. I cannot stress this
enough: The bank generated wonderful results in 2013
and will do that again in 2014 and again thereafter.
This is highlighted by the 2014 share price movement:
Graph 4: Bank Rakyat vs Citigoup (Since Jan 2012)
Graph 5 says it all: When it seemed that both the US
and European blocks were recovering, investors
switched capital out of emerging markets causing large
declines in the currencies and markets and led to inter
alia the Indonesian rupiah to decline 25% in 2013.
Measured on a one year basis, being invested in
emerging markets looks like a mistake, looking forward
another 10 years, I’m not so sure…
Graph 5: The best contrarian tactical trade: long
EM, short Eurozone
Source: BofA Merrill Lynch Global Fund Manager Survey
40
80
120
160
200
2012 2013 2014
Citigroup (USD)
Bank Rakyat (USD)

MARKETREVIEW Issue 8, March 2014
Page | 7
Shooting yourself in the foot
What made 2013 worse for the Sanlam Global Best
Ideas Fund was that besides the large emerging
market investment, we were walking around with a
loaded revolver. Despite our best efforts to reduce the
holdings, the fund still had an investment in two small
cap Chinese shares from prior years of which the
listings were suspended.
This makes it difficult for investors to judge the team.
We say we are good at finding good farms, but then
2013 seems to indicate the opposite.
It is always difficult to explain when you’ve just made a
mistake: “This was isolated” and, “Won’t be repeated”.
That message will only have credibility in 3 years’ time.
In the meantime we’ve done a lot of soul-searching,
learnt a lot and are moving forward with a considerably
more experienced and more balanced team.
Global Warming, Changing Growth Patterns? 1. Growth over the next 10 years:
Have global growth patterns
changed? Will emerging markets
grow at a lower rate than
developed markets? There
certainly are headwinds in terms
of higher interest rates which will
force growth rates lower. But in
my opinion, on a 10 year basis,
most emerging markets will grow
GDP/capita at a higher rate than
their developed market peers. I
can write (and have written) many
chapters on this, but today Graph
6 will suffice.
2. Valuation: Table 3 does show
that Citigroup now trades at a
discount to book value and BRI at
2.2x. Prices of the “farms” have
adjusted. So yes, emerging
market companies are not the
slam dunk they were in 2000
whilst many developed market
companies are considerably
cheaper than they were in 2000.
This is where it gets difficult. Will
the investment banking drought
persist? Will developed markets
surprise with higher growth rates?
3. Risk: Berlusconi (Italy’s ex-
president) was bad, but despite
his or Holland’s (unfortunately
France’s current president) best
efforts they haven’t got the same
power to wreak damage like
some emerging market
presidents like Erdogan
(Turkey), Putin, or Mursi (Egypt).
One of the definitions of a
developed market is whether the
state administration continues
unaffected when a new political
party comes to power. Recent
events highlight the fragility of
emerging markets and why
many of them should trade at a
discount to developed markets.
Yet, when one looks at CIB
(largest bank in Egypt), it
continued to grow shareholder
value right through the crisis, so
yes, the onset of a crisis brings
about a sharp downward
adjustment in valuations, but it is
surprising how life “on the
ground” did (and does) go on,
even in Egypt (Refer Appendix
C)
Graph 6: Population: Developed Countries vs Developing Countries

MARKETREVIEW Issue 8, March 2014
Page | 8
SIM Global
In terms of delivering to clients, 2013 was the worst of
the 25 years I’ve been in investments. As mentioned
earlier, we didn’t sit still and the team had a large
number of sessions to ensure we understand the
underlying reasons of what led to the disappointing
returns.
I also spent considerable time revisiting the past 10
years and thinking about each of our winners and
losers. The recent hand over of responsibility for
Sanlam Global Best Ideas Fund to Douw helped a lot
in freeing me up, allowing the time to do this.
Most important is that we again realised the
importance of knowing our circle of competence. As
said before, Chinese small caps are outside the
perimeter!
We’ve also thought a lot about client expectations
which made us adjust the risks in the different funds.
Sanlam Global Best
Ideas Fund
The fund, at the moment, is spoilt for choice in terms of
large, well managed, developed market companies
that remain mispriced such as Illinois Tool Works,
Lockheed Martin and Medtronic. In addition these
companies derive a considerable part of their income
from emerging markets. So, at the moment there is no
need to take the unnecessary risk of forecasting short-
term currency movements. Hence the fund’s direct
exposure to emerging markets has been significantly
reduced. The top 10 (Table 6) highlights however that
we continue to search for mispriced “farms” with good
yields away from the crowd.
Table 6: Top 10: Sanlam Global Best Ideas Fund (as at 28 Feb 2014)
Company Name Country Sector % Held Dec 2014
Mkt Cap (USD mill) ROE P/NAV PE
Div Yield
Microsoft USA IT 6.0% 27% 3.8 14.1 2.6% 317,973
Samsung Electronics South Korea
IT 4.6% 22% 1.5 6.8 1.1% 205,490
Imperial Tobacco Britain Consumer
Staples 4.5% 34% 3.9 11.6 4.9% 39,320
Lockheed Martin USA Industrials 4.0% 301% 51.5 15.1 2.9% 52,168
Esprit Hong Kong
Consumer Discretionary
4.0% -3% 1.7 -52.3 0.0% 3,674
IG Group Britain Financial Services
3.7% 25% 4.2 16.6 3.7% 3,880
Medtronic Inc USA Health Care 3.6% 20% 3.1 15.7 1.8% 59,162
Hewlett Packard USA IT 3.6% 29% 2.4 8.3 1.8% 56,845
Illinois Tool Works USA Industrials 3.5% 16% 3.6 18 2.0% 35,052
Total SA France Energy 3.3% 14% 1.4 9.8 5.0% 154,443

MARKETREVIEW Issue 8, March 2014
Page | 9
Sanlam Global
Financial Fund
The Sanlam Global Financial Fund has historically done
well by finding and investing in smaller financial
companies in both emerging and developed markets
(TSKB, Bank of Georgia, World Acceptance Corp,
Lancashire).
The same is true for the Nedgroup Investments
Financial Fund we manage (refer Appendix D). A large
part of the excess return over the past 10 years were
generated from investments in smaller companies like
Coronation, PSG, Sasfin, Capitec, etc.
We never start our discussion with a predetermined
idea of what percentage we do want in smaller/larger
and or developed market or emerging market shares.
We are driven by where we find the best value after
adjusting for various risk factors. At the moment the
fund has 50%+ of its capital invested in selected
emerging markets.
A few examples of past
small cap winners
We invested in World Acceptance Corp
(WAC) when the risk of regulatory
intervention was priced in and whilst its
excellent return on capital (ROE) was
ignored. Now the company has grown, the
valuation at 3.3x net asset value is
expensive and the risk of regulatory
intervention has increased substantially.
We “found” Panin Securitas in 2011. But
the team was still unproven and the
share’s illiquidity increased the risk.
As we got to know the management better
we gradually increased our investment
after each successive visit and in fact
recently increased it again late 2013 when
the price fell. Indonesia counts only
300,000 investors out of a population of
240 million whilst the middle-class
continues to grow rapidly.
As it grows its client base the business
becomes more sustainable. We think
Panin could become the Coronation of
Indonesia. The outperformance has only
started.
Graph 7 highlights how these long-term winners go through periods
of underperformance and volatility, but the continued high return on
equity (and hence above average growth in shareholder value)
eventually gets reflected in the share prices.
Graph 7: Something better than satisfactory
Source: Bloomberg
WAC
BRK
JPM
WFC
PAN
10
100
1,000
10,000
200
0
200
1
200
2
200
3
200
4
200
5
200
6
200
7
200
8
200
9
201
0
201
1
201
2
201
3
World Acceptance Corp Berkshire Hathaway
JPMorgan Wells Fargo
Panin Securitas
Log scale

MARKETREVIEW Issue 8, March 2014
Page | 10
Distributor Details If you would like to be added to the list to receive
this document electronically please contact:
Nora Geldenhuys
Tel: +27 21 950 2633
Fax: +27 21 950 2526
e-mail: [email protected]
OUR WEBSITE
http://www.simglobal.co.za
Conclusion
It seemed as if I was better at writing about investing in 2013
than investing itself. We were battered by two severe storms in
2013, but generally the companies we were (and are) invested
in continued to grow shareholders wealth. Our aim and DNA is
to generate better than satisfactory returns for investors.
Value Investing? I bumped into Lawrence Tedeschi at the BTG Pactual
conference in Sao Paolo at the end of February. He has been
“covering” Brazil, Mexico and South Africa for a large US
pension fund from Ohio and has been an analyst for more than
30 years covering many other sectors and countries within and
outside the US during his career. What struck me as we started
talking is that he is going through a period of self-doubt: “Value
investing doesn’t seem to work the way it used to”
So, does value investing still work? Off course it does, your horizon just has to be long enough. Both Lawrence and I
know: “It’s always good to question bad habits you might have gotten into or whether you’ve developed blind spots,
but don’t doubt value investing.”
Kokkie Kooyman
20 March 2014
DISCLAIMER Sanlam Investment Management (Pty) Ltd (“SIM”) is a licensed financial services provider and a wholly owned subsidiary of the Sanlam Life. Sanlam Investment Management Global is a division within SIM. This document is intended for information purposes only. No representation, warranty or undertaking is given and no responsibility or liability is accepted by any member of the Sanlam Group as to the accuracy of any information contained herein. No part of this documentation is to be construed as a solicitation to buy or sell any investment. The information contained herein does not constitute financial advice as contemplated in terms of the Financial Advisory and Intermediary Services Act 2002. The use of or reliance on this information by you or any third party shall be entirely at your or the third party’s own risk and discretion and any liability arising from the use thereof or reliance thereon is accordingly disclaimed by the Sanlam Group. A financial advisor must be consulted as far as the unique needs of the investor are concerned and therefore any parties relying on any view, opinion or model contained herein does so at own ri sk and Sanlam disclaims all responsibility and liability for positions taken based on such reliance. Please note that past performances are not necessarily an accurate determination of future performances, and that the value of investments / collective investment units may go down as well as up. Commission and incentives may be paid and if so, would be included with the brokerage charges, marketable securities tax, auditor's fees, bank charges, trustee fees and RSC levies in the overall costs which will be levied against the fund. A schedule of fees and charges and maximum commissions is
available from Sanlam Investment Management (SIM) Global.
Table 7: Sanlam Global Financial Fund as
example: Net asset value of portfolio grew
16.6% in 2013
NAV/share growth
P/NAV Unit price
US$
Growth in unit price
2002 20.8% 1.08
2003 31.1% 1.50 10.0
2004 19.8% 1.58 12.2 22%
2005 28.1% 2.01 16.7 36%
2006 33.5% 1.97 20.0 20%
2007 27.8% 1.61 24.3 21%
2008 11.8% 0.75 8.8 -64%
2009 31.4% 1.12 17.1 94%
2010 19.9% 1.41 22.2 30%
2011 20.3% 0.99 18.9 -15%
2012 21.4% 1.10 24.2 30%
2013 16.6% 1.16 25.2 5%
2014* 18.4% 1.05 24.8
* As at 28 Feb 2014
MARKETREVIEW Issue 8, March 2014
Page | 11
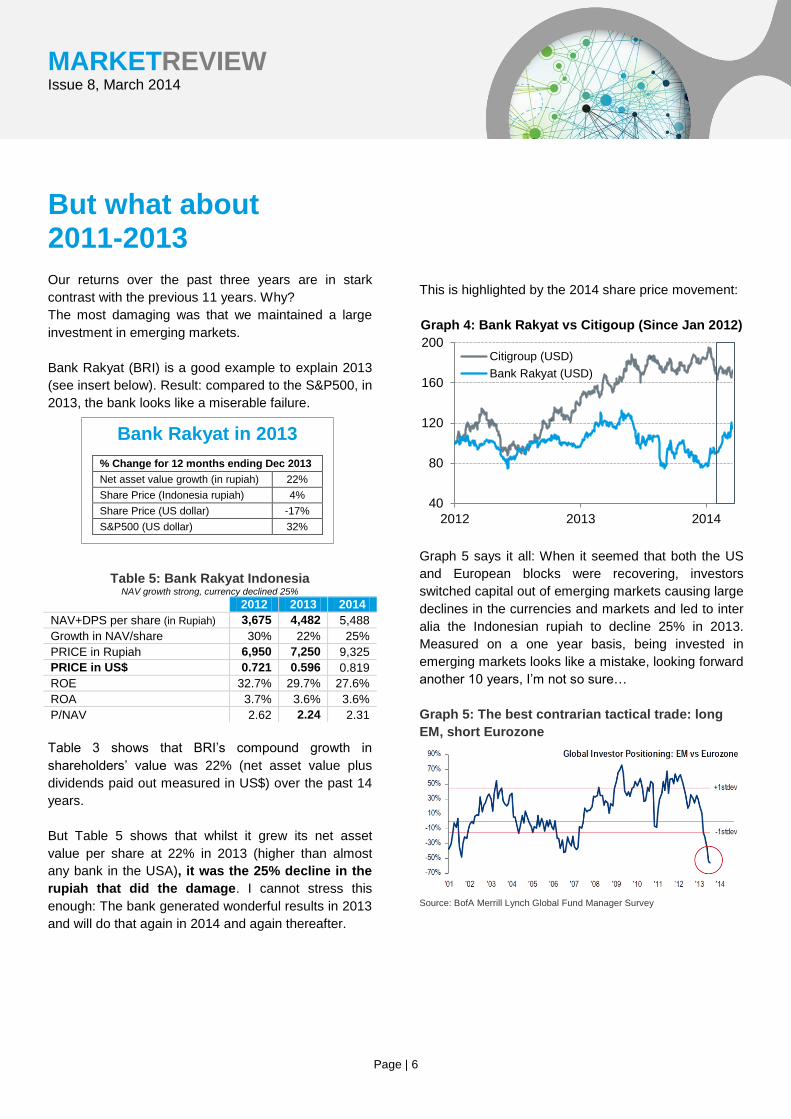
Table 8: Berkshire Hathaway vs S&P500
NAV/share
Berkshire
Hathaway S&P500
1972 100 100
1973 105 120
1974 110 158
1975 135 134
1976 214 181
1977 283 252
1978 352 297
1979 477 349
1980 569 303
Appendix A
Is Warren Right?
Berkshire Hathaway is different:
Firstly, Berkshire Hathaway is a listed investment trust. His “fund” is
not affected by outflows. In 1974 he underperformed dramatically
but could sit it out without being affected by the unhappiness of his
investors (with dramatic effect afterwards).
Similarly in 1999 he again underperformed refusing to invest in
tech shares during the tech bubble. A large number of value
funds had to close down due to clients withdrawing their money
to invest in tech funds (recommended reading: Kirk Kazanjian:
Investing with the Masters). Again, whilst Buffett was called
senile and “having lost it” and investors were pleading with him
to invest just a small % of Berkshire’s capital in tech shares at
shareholder meetings (read chapter 54, The Snowball by Alice
Schroeder), he could ignore them. Investors could sell down
Berkshire Hathaway shares, but it didn’t affect his decisions.
Secondly, he “buys USA”
Because Berkshire’s investments outside the USA are negligible
(approximately 12%), he does not have to think a lot about currencies
and macro risks of other countries. Investing outside the USA means
one believes that the asset will generate returns exceeding that
available in the USA measured in US$. But true to form, when Warren
makes the call he focuses on the productivity of the asset and not the
macro. His investment in Iscar (Israeli Toolmaking Company) is a
good example.
The Moody Neighbour “.. if a moody fellow with a farm bordering my
property yelled out a price every day to me at which
he would either buy my farm or sell me his -- and
those prices varied widely over short periods of time
depending on his mental state -- how in the world
could I be other than benefited by his erratic
behavior? If his daily shout-out was ridiculously
low, and I had some spare cash, I would buy his
farm. If the number he yelled was absurdly high, I
could either sell to him or just go on farming.”
The Distracting Macro “Owners of stocks too often let the capricious
and irrational behavior of their fellow owners
cause them to behave irrationally as well.
Because there is so much chatter about markets,
the economy, interest rates, price behavior of
stocks, etc., some investors believe it is important
to listen to pundits -- and, worse yet, important to
consider acting upon their comments. "For many
(these) investors, liquidity is transformed from
the unqualified benefit it should be to a curse.”

MARKETREVIEW Issue 8, March 2014
Page | 12
Appendix B The Brazilian Effect
High expectations in 2007 led to a
cheery and expensive consensus.
Now everybody dislikes them and
forgets that managements have
delivered.
Table 9: Brazilian Banks
2007 2013 Growth Compound
growth
Combined NAV and DPS
Itau 7.9 20.75 162% 17%
Bradesco 6.9 20.15 193% 20%
Combined Price and DPS
Itau 33.09 37.32 12.8% 2%
Bradesco 28.34 34.52 21.8% 3%
P/NAV
Itau 4.17 2.12
Bradesco 4.13 1.98
Appendix C Egypt An interesting case study
With Turkey/Thailand being plagued by political uncertainty I analysed CIB (largest bank in Egypt) during December
and this again proved how good businesses continue to generate good results even during terrible crises. In terms of
recent cases of political turmoil, only Syria and Libya was worse. Amazingly CIB grew its net asset value per share
every year.
It’s like there was no revolution; until you look at the share price.
Table 10: CIB: Shareholders capital (NAV/share) grew every year as if there was no revolution.
2005 2006 2007 2008 2009 2010 2011 2012 2013 2014
NAV/share 4.32 5.80 7.50 6.10 7.72 10.22 13.96 18.07 23.19 28.93
Growth 19% 34% 29% -19% 27% 32% 37% 29% 28% 25%
ROE 26.2% 28.8% 33.1% 34.5% 43.2% 38.3% 22.6% 23.4% 24.8% 22.0%
Share price 13.06 19.33 30.50 18.60 27.34 47.40 18.89 34.92 32.60 33.00
P/NAV 3.02 3.33 4.07 3.05 3.54 4.64 1.35 1.93 1.41 1.14
Appendix D Nedgroup Investment Financial Fund In case you needed it – more proof of our ability to pick
financial winning companies.
The Nedgroup Investments Financial Fund - for 10
years an outperformer and also won us quite a few
awards.
Graph 8: Nedgroup Investments Financial Fund vs
competitors
0
200
400
600Nedgroup Inv Financials Competitor 1
Competitor 2 Competitor 3
Competitor 4 Competitor 5