Embed Size (px)
Citation preview

Perspectives*Asia*Paci-ic*Business*&*Economics*
Journal*of*the*Asia*Paci-ic*Business*&*Economics*Research*Society*
Vol.*1*No.*1*Summer*2013*
ISSN$2187)249X$
Downtown$Hagatna$revitalization:$$Survey$results$and$relevant$economic$development$strategies$Maria*Claret*M.*Ruane,*University*of*Guam,*Guam,*USA*Fred*R.*Schumann,*University*of*Guam,*Guam,*USA**The$evolution$of$renewable$energy$technologies$in$India$Behrooz*Asgari,*Ritsumeikan*Asia*Paci-ic*University,*Japan*Harinatha*R.*Beeram,*Ritsumeikan*Asia*Paci-ic*University,*Japan**Response$of$the$Philippines’$Gross$Domestic$Product$to$the$Global$Financial$Crisis$Cynthia*P.*Cudia,*De*La*Salle*University,*Philippines*John*David*C.*Castillo,*De*La*Salle*University,*Philippines*$The$attributes$of$Thai$product$quality,$measurement,$and$validity$Pajaree*Ackaradejruangsri,*Ritsumeikan*Asia*Paci-ic*University,*Japan**Exploring$customer$needs$of$Huis$Ten$Bosch$per$customer$attribute:$$Market$segmentation$and$targeting$by$using$blog$text$mining$and$conjoint$analysis$Junichi*Kato,*Tsukuba*International*University,*Japan*Tetsuro*Hyodo,*Tokyo*University*of*Marine*Science*and*Technology,*Japan*Mamoru*Imanishi,*Fukuoka*University,*Japan*Saburo*Saito,*Fukuoka*University,*Japan**The$regional$movement$of$human$resources$in$East$Asia:$$A$facilitating$factor$of$economic$integration$John*Paolo*R.*Rivera,*Ateneo*De*Manila*University,*Philippines*

ISSN 2187-249X
Asia Pacific Business
& Economics Perspectives
Volume 1, Issue 1 Summer 2013
APUGSM Conferences
Asia Pacific Business & Economics Research Society

Asia Pacific Business & Economics Perspectives, 1(1), Summer 2013
2
Foreword
Our Maiden Issue We proudly release the maiden issue of Asia Pacific Business & Economics Perspectives, the journal of APUGSM Conferences and the Asia Pacific Business & Economics Research Society (APBERS). Over the past three years, APUGSM Conferences has invited young scholars to present their research on advancements in graduate business research. We have forged research partnerships and academic networks in pursuit of emerging themes important in the region.
Perspectives highlights the contribution of these scholars to business research literature after undergoing a double blind review peer review process. The authors and papers were chosen to comprise a mix of current research in Asia and the Pacific. Likewise, our peer reviewers and editorial consultants come from all over the world to validate and appreciate these research themes.
Perspectives publishes theoretical reviews, empirical studies, economic policy research, business case studies, and advanced research methodologies. In this maiden issue we present these variety to set our future research themes.
We envision Perspectives to be a bi-annual academic journal contributed in by young scholars, Ph.D. candidates, research faculty and their students. Our call for papers submission is on-going while our winter and summer conferences are held every year. Our turn around time is approximately one year to cover the peer review and the revisions and compliance processes. Thematic special issues may be release according to the composition of a significant research conference panel.
Perspectives is available via open access on APBERS webpage. Ultimately with consistent timely releases of our issues, we envisage inclusion and qualification for academic listings and indexing portals.
For publication opportunities, research collaboration, and other inquiries, send us your inquiry at [email protected]. Michael Angelo A. Cortez Editor-in-Chief, Perspectives President, APBERS

Asia Pacific Business & Economics Perspectives, 1(1), Summer 2013
3
Editor’s Note Business organizations’ overarching goal can be condensed as: to effectively and efficiently manage organizational affairs through conceptualizing valuable organizational plans, tactical plans, organizing resources, managing human resources, controlling operations, and realizing its prescribed mission. All of which are geared towards the fundamental goal of any organization – to maximize shareholder’s wealth. In a globalized business environment, the volatile state of economic health, stringent regulatory frameworks, the duties and responsibilities of business leaders have become more complex. With globalization, business organizations have been vulnerable to contagion effects as evidenced by the uneven volume of profits, investments, and capitalization brought about by the economic slowdown due to the recent global financial crisis. These circumstances created the need for experts to manage operations and conduct further research to mitigate the risks that is inherent in international commerce.
Perspectives highlights the value-added of these studies to the growing business research literature. A number of articles focused on the trend and behavior of macroeconomic agents in the advent of globalization. The study of Cynthia P. Cudia and John David C. Castillo (Response of the Philippines’ Gross Domestic Product to the Global Financial Crisis) analyzed the response of the Philippine economy to the economic stimulus associated with the recent global financial crisis. They were able to develop policy implications in ensuring the stability of the Philippine economy by diversifying its exports, supporting its agricultural sector, attracting investments, and supporting SMEs amidst the threats of external shocks. Meanwhile, the study of John Paolo R. Rivera (The regional movement of human resources in East Asia: A facilitating factor of economic integration) looked into how labor movement in the Philippines has been facilitated by labor agreements with receiving economies. The study found that labor agreements and the existing institutional supports provide technical assistance and mutual recognition that facilitated the temporary migration flows between places where there are labor surplus to destinations where there are shortages.
Perspectives also put emphasis on environmental and economic management in the Asia Pacific, the initial theme of APUGSM Conferences. The study of Behrooz Asgari and Harinatha R. Beeram (The evolution of renewable energy technologies in India) looked into the immense potential to energize rural and remote settlements via renewable energy technologies (RETs). Their study modeled the future growth pattern of RETs in India by employing the logistic and the Gompertz functions. Meanwhile, the study of Maria Claret M. Ruane and Fred R. Schumann (Downtown Hagåtña revitalization: Survey results and relevant economic development strategies) documented insights from Guam’s island community gained from recent surveys and use these insights and survey results to guide future strategies and efforts toward revitalizing downtown Hagåtña for the use of urban planners and policymakers.
Perspectives also highlights, in this issue, advancement in product development and customer attributes. The study of Pajaree Ackaradejruangsri

Asia Pacific Business & Economics Perspectives, 1(1), Summer 2013
4
(The attributes of Thai product quality, measurement, and validity) applied content analysis and statistics test by converting 86 of those three product categories reviewed from Thailand’s well-known public brands into a 5-point scale on overall product quality and 11-point scale on the proposed product attributes. These attributes are “Function”, “Ease of Use”, “Reliability”, “Durability”, “Design”, “Eco-Friendliness”, “Customer Satisfaction”, “Support Service”, “Value for Money”, and “Adaptability”. The results show high correlations and significant effects of attributes on overall Thai product quality, especially on automobile and electronics/IT products. Moreover, these proposed attributes also test the validity measurements of similar types of products. On the other hand, the study of Junichi Kato, Tetsuro Hyodo, Mamoru Imanishi, and Saburo Saito (Exploring customer needs of Huis Ten Bosch per customer attribute: Market segmentation and targeting by using blog text mining and conjoint analysis) determined customer needs per customer attribute through executing market segmentation and targeting by taking HTB (Huis Ten Bosch) as example. Results from the conjoint analysis and RFM analysis recommended that managers could focus only on important customers and attract them. They can execute targeting for important customers on the basis of blog text mining, conjoint analysis, and RFM analysis.
From the manuscripts included, it is evident that there is an increased diversity of issues that has brought a wide array of differing values, perspectives, and expectations among business leaders – who want to remain competitive in the face of increasingly tough global competition. It is also apparent that much of the developing economies in the Asia Pacific region have joined the global marketplace that create a broader arena for product development, technological development, and business competition.
The authors of the articles in this maiden issue of Perspectives laid emphasis on particular developments in the field of business and economics and how economic agents can adapt to these changes for sustainability vis-à-vis the huge role of the international sector and the inevitable consequences of globalization. John Paolo R. Rivera Managing Editor, Perspectives

Asia Pacific Business & Economics Perspectives, 1(1), Summer 2013
5
Editorial Board Michael Angelo A. Cortez Editor-in-chief Ritsumeikan Asia Pacific University Beppu, Oita, Japan John Paolo R. Rivera Managing Editor Ateneo De Manila University Manila, Philippines Abraham R. De Guzman Miguel Felipe L.C. Evangelista Editorial Assistants Ritsumeikan Asia Pacific University Beppu, Oita, Japan
Advisory Editorial Board
Lailani L. Alcantara Ritsumeikan Asia Pacific University Beppu, Oita, Japan Raymund B. Habaradas De La Salle University Manila, Philippines Ricardo A. Lim Asian Institute of Management Makati, Philippines Hitoshi Mitsuhashi Keio University Tokyo, Japan Maria Claret M. Ruane University of Guam Guam, United States
Joseph Sarkis Worcester Polytechnic Institute Massachusetts, United States Masachika Suzuki Kansai University Osaka, Japan Tereso S. Tullao, Jr. De La Salle University Manila, Philippines Diego Vazquez-Brust Royal Holloway University of London London, United Kingdom Kenji Yokoyama Ritsumeikan Asia Pacific University Beppu, Oita, Japan

Asia Pacific Business & Economics Perspectives, 1(1), Summer 2013
6
Downtown Hagåtña revitalization: Survey results and relevant economic
development strategies Maria Claret M. Ruane University of Guam Guam, United States of America [email protected] Fred R. Schumann University of Guam Guam, United States of America [email protected]
ABSTRACT Revitalizing downtown capital is an example of strategies that support a broader and more comprehensive approach to enhancing an economy’s development experience. For years now, a similar strategy has been discussed and pursued, at different levels, with regard to downtown Hagåtña, the capital of the island of Guam, a U.S. territory in the Western Pacific region. This study is designed to document insights from Guam’s island community gained from recent surveys and use these insights and survey results to guide future strategies and efforts toward revitalizing downtown Hagåtña. This study hopes to serve as a useful reference for urban planners and policymakers. JEL Classification: O1, O56 Keywords: economic development, Guam, downtown, revitalization, strategies
INTRODUCTION
In December 2009, the University of Guam-Pacific Center for Economic Initiatives (UOG-PCEI) sponsored a study that evaluated the prospects of living in Guam’s downtown, Hagåtña, as part of a larger attempt to identify means to enhance economic development in Guam by focusing on revitalizing its downtown area (see PCEI Technical Report, Issue 9 (March 2010); later published as Williams and Enriquez (2010)). Although there had been discussions about revitalizing Hagåtña, this idea received renewed interest from the current administration of Guam Governor Calvo and Lt. Governor Tenorio, who included it as part of their economic platform (Blueprint 2020). Interest has also come from island residents who have been asking the general question of how to develop the Guam economy

Asia Pacific Business & Economics Perspectives, 1(1), Summer 2013
7
to those whose questions might be more specific, for example, with regard to increasing local and tourist interests outside of the Tumon-Tamuning area.
The 2009 study provided an excellent summary of efforts through the late-2009 to revitalize downtown Hagåtña, which included primarily plans (the draft Land Use Plan 2006, for example) and laws. Since then, efforts have moved toward materializing ideas that have long been discussed, including the addition of new attractions such as the Latte of Freedom/Hall of Governors in Adelup, the Heritage Trail and the plan to construct a museum, for which funding was secured in March 2011 when the Government of Guam issued a USD 89 million bond backed by hotel occupancy taxes (aka “HOT bond”) (Office of the Governor, April 28, 2011). More recent efforts also included new appointments to the Hagåtña Restoration and Redevelopment Authority’s (HRRA) soon after the Calvo-Tenorio administration took office in January 2011, inclusion of projects that support Hagåtña revitalization efforts in the latest 2011 Guam Comprehensive Economic Development Strategy that was submitted to the U.S. Department of Commerce-Economic Development Administration and Guam Visitor’s Bureau’s latest Strategic Plan to expand the reach of tourism outside of the established tourism precinct of Tumon.
The present study, which is also based on a survey, improves upon the 2009 study in two ways. First, the present survey targeted a broader population that encompasses different age groups, unlike the 2009 survey which was designed to study two generations: the Millennial generation (those between the ages of 20 and 29 years) and the Baby Boomer generation (those between the ages of 50 and 59 years). Second, the focus of the present study is broader in scope than the 2009 study, which primarily looked at the attractiveness of living in downtown Hagåtña, although some survey questions explored the attractiveness of visiting downtown Hagåtña.
GUAM’S ECONOMY SINCE LAST SURVEY IN DECEMBER 2009
As expected, changes have occurred in and new information has become available on the Guam economy since the 2009 study. For one, the Census Bureau conducted its decennial population census, which provides a better understanding of the size of the overall Guam market and comparative growth/decline in residence by village. One piece of information that caught many by surprise was the total Guam population of under 160,000 individuals (Table 1). Until this information was released in 2011, many local and Federal analysts put their estimates at 180,000. Table 1 also shows the largest villages to be Dededo, where 28.2 percent of the island population resides, followed by Yigo at 12.89 percent and Tamuning at 12.35 percent. Table 1 provides us with population gains/losses by village between 2000 and 2010, which shows the fastest growth in central villages such as Mongmong-Toto-Maite (16.8% decennial growth), Chalan Pago-Ordot (15.2%), Mangilao (14.1%) and Tamuning (9.3%). The southern villages show the largest decline in population between 2000 and 2010, with Inarajan losing 25.5 percent of its population, Santa Rita (-18.9%), Merizo (-14.5%) and Agat (-13.1%). Hagatna, which was the smallest village in 2000 with 1,100 residents, saw a 4.5 percent decline in its population in 2010, making up only 0.66

Asia Pacific Business & Economics Perspectives, 1(1), Summer 2013
8
percent of the island population. Hence, for Hagatna, the tendency has been one of “moving out” of and not “moving in” to the village.
The broadest measure of the economy, the Gross Island Product (GIP), is often used as one of the benchmarks for assessing changes in the Guam economy. Until the U.S. Department of Commerce-Bureau of Economic Analysis, in partnership with the U.S. Department of the Interior, released the latest GIP estimates in mid-2010 and an extended series in mid-2011, we were stuck with using the 2002 GIP estimate. GIP estimates between 2002 to 2009 show a stagnant economy valued at $4 billion (in real terms, using 2005 prices) (U.S. Department of Commerce-Bureau of Economic Analysis, 2011). Using the latest population estimates in 2010, this translates to an average (per person) income of USD 25,000 per year. In effect, this was the economic background of the 2009 study. Since then, no GIP estimates are available but other economic indicators suggest that the Guam economy has experienced some ups-and-downs, which is most evident when one looks at the unemployment rates in Guam during the same period: 9.3 percent in September 2009, which increased to 13.3 percent in March 2011 and then declining to 11.8 percent in March 2012, the latest estimate as of this writing (Guam Bureau of Labor Statistics, 2012). Given the undiversified nature of the Guam economy, these ups-and-downs reflect developments in Guam’s main economic drivers: tourism and military.
The year 2010 was a strong year of tourism in Guam, which welcomed almost 1.2 million visitors. This was the first year of increase in visitor arrivals since the numbers had been declining yearly since 2005. This optimism rolled into the year 2011 until the earthquake-tsunami disaster in northeastern Japan on March 11, 2011, which expectedly slowed Japanese tourism in Guam in the months following the disaster in Japan (Ruane, 2011). Thanks to other tourist markets (Korea) and fast-growing ones (China, Hong Kong, Taiwan and Russia), which partially offset declines in Japanese tourism, the decline (3.2 percent) in overall tourism for the year 2011 was less than expected. Prospects improved in 2012 as Japanese tourism recover, several markets continue to grow and as Russian tourism increase significantly, thanks to the Waiver Visa Program which became effective in January 2012. Data for the January-May 2012 show that visitor arrivals were up almost 12 percent compared to the same period in 2011 (Guam Visitors Bureau, July 2012).
A similar up-and-down trend has characterized developments with regard to the military presence in Guam, especially the much anticipated move of Marines from Okinawa, Japan to Guam, referred to as the military build-up on Guam. Following the release of the Draft Environmental Impact Statement (DEIS) in November 2009 and the final version released in July 2010, expectations were optimistic that construction of military projects would soon begin and lead to new jobs, higher incomes and an increase in population and translate to increased purchasing power and demand for the economy. It must be noted that the 2009 study was conducted around this time and with this optimistic economic background.

Asia Pacific Business & Economics Perspectives, 1(1), Summer 2013
9
Table 1. Population of Guam and Villages: 2000 to 2010
Geographic area 2000 2010 Percent Change
2000 to 2010 Guam 154 805 159 358 2.9 %
BY VILLAGE Agana Heights 3 940 3 808 -3.4 2.39%
Agat 5 656 4 917 -13.1 3.09%
Asan 2 090 2 137 2.2 1.34%
Barrigada 8 652 8 875 2.6 5.57%
Chalan Pago-Ordot 5 923 6 822 15.2 4.28%
Dededo 42 980 44 943 4.6 28.20%
Hagåtña 1 100 1 051 -4.5 0.66%
Inarajan 3 052 2 273 -25.5 1.43%
Mangilao 13 313 15 191 14.1 9.53%
Merizo 2 163 1 850 -14.5 1.16%
Mongmong-Toto-Maite 5 845 6 825 16.8 4.28%
Piti 1 666 1 454 -12.7 0.91%
Santa Rita 7 500 6 084 -18.9 3.82%
Sinajana 2 853 2 592 -9.1 1.63%
Talofofo 3 215 3 050 -5.1 1.91%
Tamuning 18 012 19 685 9.3 12.35%
Umatac 887 782 -11.8 0.49%
Yigo 19 474 20 539 5.5 12.89%
Yona 6 484 6 480 -0.1 4.07% Source: U.S. Census Bureau, Census 2000 for Guam and the 2010 Census for Guam.
While some issues (such as Pagat) were being discussed, the fiscal pressures on the U.S. Federal Government and the Government of Japan, partly brought on by the lack of recovery of both economies, raised concerns to U.S. legislators regarding the cost and magnitude as well as timing and priority of the military build-up on Guam. These concerns led to additional studies (including that by the GAO in June 2011) and a rethinking of the 2006 U.S.-Japan Agreement, which initiated the discussion on the military build-up on Guam. This period created much uncertainty with regard to the Guam economy and some level of pessimism. The announcement of the revised and scaled-down version of the military build-up plan on Guam, now renamed “military realignment on Guam” in late-April 2012 (Buhain Carrera, 2012), followed by the submission of an independent study in late-July to U.S. legislators (Pacific News Center, 2012) suggested to top U.S policymakers and to many on Guam that the military realignment on Guam will take place or is back on track (Taitano, 2012). At the time of this writing, these recent developments have renewed positive prospects on the Guam economy, although stakeholders are taking a much more cautious

Asia Pacific Business & Economics Perspectives, 1(1), Summer 2013
10
stance until details (including military funding for Guam included in the National Defense Authorization Act) have been finalized and approved by the U.S. Senate.
SURVEY This current UOG-PCEI study is based on a survey1, which was developed under the leadership of Fred Schumann and Anita Borja Enriquez, D.B.A. in late-2011. The survey consisted of 27 questions designed to help determine what the preferences are for activities in Hagåtña by the military/dependent personnel, residents, and visitors. Results of the survey will be used to determine if there is a preference for location (Villages in South, Central, North, or Does not matter) to enjoy certain activities as well as to guide the direction for the economic revitalization of Hagåtña and assist in an overall effort to encourage the development of new or existing local businesses in Downtown Hagåtña.
The survey was conducted in both face-to-face2 and online3 formats during the period between early-March to early-June 2012. Prospective participants were reached through a variety of means, including announcements in the UOG main website, news coverage by the local media (for example, Pacific News Center (March 10, 2012), email to social networks and by word of mouth. Survey Respondents
A total of 400 individuals participated in the survey. Efforts were made to achieve a sample of respondents with diversified backgrounds, but because the survey is voluntary, this goal was not always achieved. Table 1 shows that all adult age groups are represented, although the youngest age group made up 42 percent of the respondents. Table 2 shows balanced representation of genders.
Tables 3 to 6 show the respondents’ residence profile. As expected, the overwhelming majority (91.65%) of respondents are local residents, among whom almost 80 percent have lived on Guam for more than ten years (and 26.69% for more than 25 years). Residence-by-village roughly resembles the population distribution according to the 2000 Census data, although there was no respondent from Umatac. Only 15.67 percent of respondents are/were stationed on Guam as military active duty or dependent. Table 1. Respondents’ Age Profile Age Category % Responses 18 to 25 42.00% 25 to 30 13.25% 31 to 35 7.50% 36 to 40 8.50% 41 to 45 6.00% 46 to 50 9.50% 51 to 55 3.50% 56 to 60 3.50% 61 to 65 4.25% 65 and Older 2.00% Total Respondents = 400 100.00%

Asia Pacific Business & Economics Perspectives, 1(1), Summer 2013
11
Table 2. Respondents’ Gender Profile Gender % Responses Male 49.24% Female 50.76% Total Respondents = 396 100.00% Table 3. Respondents’ Residence Profile Guam Resident % Responses Yes 91.65% No 8.35% Total Respondents = 395 100.00% Table 4. Respondents’ Length of Guam Residence Lived on Guam % Responses 0-5 years 13.17% 6-10 years 5.88% 11-15 years 7.56% 16-20 years 17.65% 21-25 years 19.05% 25+ years 26.69% Total Respondents = 357 100.00% Table 5. Respondents’ Residence by Village Village of Residence % Responses Agana Heights 3.61% Agat 2.22% Asan-Maina 0.83% Barrigada 6.94% Chalan Pago-Ordot 5.56% Dededo 24.72% Hagåtña 0.56% Inarajan 2.22% Mangilao 10.83% Mongmong-Toto-Maite 5.28% Piti 1.67% Santa Rita 4.72% Sinajana 2.78% Talofofo 4.17% Tamuning 8.89% Umatac 0.00% Yigo 10.28% Yona 4.44% Merizo 0.28% Total Respondents = 360 100.00%

Asia Pacific Business & Economics Perspectives, 1(1), Summer 2013
12
By employment status, 53.66 percent of respondents indicated that they hold full-time employment (Table 7). Approximately half of the respondents work in Hagåtña, mainly for the government, followed by employment in the service industry (Table 8). Table 6. Respondents who are military active duty or dependent Stationed on Guam (as military active duty or dependent) % Responses Yes 15.67% No 84.33% Total Respondents = 383 100.00% Table 7: Respondents’ Employment Status Employment status % Responses Work full-time 53.66% Work part-time 25.13% Not employed 15.97% Retired (Not employed) 2.36% Retired (Employed) 2.88% Total Responses = 382 100.00%
Majority of the respondents are either single or divorced (61.76% in Table 9) and have no children (50.79% in Table 10). About half of the respondents indicated that they live with their family members (Table 11). Table 8. Respondents Who Currently Work in Downtown Hagåtña Currently employed in downtown Hagåtña % Responses Government 41.18% Non-profit 11.27% Banking industry 12.25% Legal industry 4.90% Service industry 20.59% Other (please specify)=10 responses total x Self-employed (1 response) x Private company (2 responses) x Government contractor (1 response) x Did not specify (6 responses) 4.90% Total Responses = 194 100.00% Table 9. Respondents’ Marital Status Marital Status % Responses Single (or Divorced) 61.76% Married 38.24% Total Responses = 387 100.00%

Asia Pacific Business & Economics Perspectives, 1(1), Summer 2013
13
Table 10. Respondents’ Number of Children Children living with you % Responses None 50.79% 1 to 3 40.84% More than 3 8.38% Total Responses = 382 100.00% Table 11. Respondents’ Living Arrangement Living with parents/other family % Responses Yes 47.53% No 52.47% Total Responses = 385 100.00%
The 25.52 percent of the respondents completed high school or equivalent and 66.45 percent have post-high school education (Table 12). Respondents represented households of different income levels (Table 13): almost 23 percent have annual household incomes below USD 25,000, almost 29 percent between USD 25,000 and USD 50,000, almost 21 percent between USD 50,000 and USD 75,000 and almost 27 percent make above USD 75,000 per year.
Table 12. Respondents’ Education Profile Schooling completed % Responses Some high school 7.03% Completed high school/ GED 25.52% Some college 31.51% Completed college 19.53% Some graduate school 4.69% Completed graduate school 11.72% Total Responses = 384 100.00% Table 13. Respondents’ Income Profile Household income % Responses Under $15,000 12.27% $15,000 to $24,999 10.70% $25,000 to $34,999 12.79% $35,000 to $49,999 16.19% $50,000 to $74,999 20.89% $75,000 to $99,999 9.14% $100,000 to $149,999 9.14% $150,000 or more 8.88% Total Responses = 383 100.00%

Asia Pacific Business & Economics Perspectives, 1(1), Summer 2013
14
RECENT VISIT TO DOWNTOWN HAGÅTÑA Table 14. Days of Visit to Downtown Hagåtña Day of Most Frequent Visit to Downtown Hagåtña (multiple answers allowed) % Responses Monday 12.17% Tuesday 11.55% Wednesday #2 18.08% Thursday 11.55% Friday 15.70% Saturday #1 18.87% Sunday 12.08% Total Responses = 1134 100.00% The survey asked respondents about their visits to Hagåtña in the past 90 days or three months in order to benchmark their most recent experience. Table 14 shows Saturday and Wednesdays to have the most common days to visit downtown Hagåtña, each day receiving more than 18 percent of the total multiple responses. Table 15 shows the most popular time slots to be early evening (24.74%) followed by afternoon (2:00PM to 5:00PM). Table 16 shows that 38.71 percent of the respondents visited downtown Hagåtña at the frequency of 2 to 3 times per week while 32 percent visited once a week. Table 17 shows the main reasons for visiting downtown Hagåtña: shop at a store (16.36%), go to Chamorro Village (15.39%), and dine at a restaurant (15.13%). Table 15. Times of Visit to Downtown Hagåtña Time of Most Frequent Visit to Hagåtña % Responses Early morning (6 am to 9 am) 13.80% Mid morning (9 am to noon) 17.71% Mid day (noon to 2 pm) 17.97% Afternoon (2 pm to 5 pm) #2 21.88% Early evening (5 pm to 8 pm) #1 24.74% Late evening (8 pm to midnight) 3.91% Total Responses = 384 100.00% Table 16. Number of Visits to Downtown Hagåtña in Past 90 Days Number of Visits to Hagåtña in past 90 days % Responses None 9.41% Infrequent (less than once a week) 3.23% Once a week #2 31.99% Two to three times per week #1 38.71% Every day/a lot 16.67% Total Responses = 372 100.00%

Asia Pacific Business & Economics Perspectives, 1(1), Summer 2013
15
Table 17. Main Reason for Recent Visit Downtown Hagåtña Main Reason for Visiting Hagåtña in past 90 days (up to 3 answers allowed) % Responses Shop at a store #1 16.36% Chamorro Village #2 15.39% Dine at a restaurant #3 15.13% Just “hang out” 6.77% Work in Hagåtña 5.72% Go to an event 5.45% Go to the Cathedral/Basilica 4.31% Exercise (please specify) 3.96% Meetings 3.69% Go to a bar 3.52% Visit private business 3.43% Visit public office 2.55% Baseball event 2.46% Swimming pool 2.02% Tennis courts 1.32% Fishing 1.14% Community Center 0.53% Boating 0.44% Drum Circle 0.35% Others 5.45% Total Responses = 1137 100.00%
Table 18: Mode of Transportation to Visit to Downtown Hagåtña Mode of Transportation During Last Visit to downtown Hagåtña % Responses Drove own car 82.87% Rode as passenger in another car 12.85% Bus 2.02% Walked 0.25% Rode bicycle 0.25% Motorcycle/Moped 0.50% Other mode of transportation 1.26% Total Responses = 397 100.00%
As expected, the overwhelming majority (82.87%) of those who visited downtown Hagåtña in the past 90 days drove their own car while 12.85 percent rode as passenger in another car. Only 2.02 percent used the bus to get to downtown Hagåtña and even fewer used other modes of transportation (Table 18). Not surprisingly, several open-ended comments in Table 19 referred to the existence of traffic as the reason why they were infrequent visitors to downtown Hagåtña. However, Table 19 shows that the main reason for not visiting downtown Hagåtña frequently is that there is “nothing to do or no reason to go” (56%) followed by “too far away” (37%). This result is very interesting because it highlights, not only the lack of attractions to visit downtown Hagåtña, but the lack

Asia Pacific Business & Economics Perspectives, 1(1), Summer 2013
16
of attractions worthwhile enough to drive the distance and incur the gas expense to visit downtown Hagåtña, keeping in mind that the majority of the population lives in the north, although the most recent census have shown a strong growth of population in the central areas. Table 19. Reason for Infrequent Visit to Downtown Hagåtña If infrequent visitor, why? % Responses Nothing to do/no reason to go #1 56.00% Too far away #2 37.00% Parking 12.00% Beautification 10.00% Safety 9.00% Cleanliness 8.00% Lighting 5.00% Other 7.00% Total Responses = 376 100.00%
INSIGHTS TOWARD REVITALIZING DOWNTOWN HAGÅTÑA Table 20. Factors to Increase Visits to Downtown Hagåtña Factors to increase your visits to downtown Hagåtña % Responses More retail stores #1 9.20% More sit-down restaurants #2 7.80% Parks 7.60% More entertainment venues/theaters 7.20% Cultural facilities 6.00% Museum 5.45% Open air farmers’ market/fairs (produce, plants, cottage industry vendors) 5.45% Playgrounds 5.35% Book store 4.85% Adequate street and sidewalk lighting 4.65% Wireless Internet access coffee shop 4.60% Interactive and artistic landscaping - water features 4.60% Meeting venues 4.20% Art gallery 4.00% Friends who live downtown 3.65% More fast food restaurants 3.10% More bars 2.75% More visible security people 2.45% Business center 2.00% Face-to-face satellite college class offerings 2.00% Residential opportunities 1.95% Other (please specify) 1.10% Total Responses = 376 100.00%

Asia Pacific Business & Economics Perspectives, 1(1), Summer 2013
17
A number of survey questions were designed to gain insights from our island community to guide future strategies and efforts toward revitalizing downtown Hagåtña. Table 20 shows respondents’ visits to downtown Hagåtña would increase if there were more retail stores (9.2% of responses), followed by more sit-down restaurants, parks and entertainment venues/theaters (each receiving around 7% of responses). Except for having more parks, these top responses were the same as those in the 2009 survey (see Table 3 in Williams and Enriquez, 2010). The remaining responses suggest interest in a wide array of additional venues to attract visitors to downtown Hagåtña. The results suggest a very low interest to downtown living where “residential opportunities” received only 1.95 percent of responses and was ranked last among the alternative responses.
The interest in parks in Table 20 appears again in Table 21 as the receiving the top response (21.94%) when respondents were asked what they would like to see built or developed in Hagåtña. The second rank (16.41%) went to seeing a performing arts center built or developed, which is not clearly captured in the previous table and might have been subsumed in several categories: “more entertainment venues/theaters”, “cultural facilities”, “museum”, and “art gallery”. The need for basic facilities such as restrooms and parking (in this case, understandably so, given the predominant means of accessing downtown Hagåtña by car, Table 18) were expressed as well as interest in mixed-used buildings and a new marina and boat landing. Table 21. What would you like to see built or developed in Downtown Hagåtña?
Like to see built or developed in Hagåtña (multiple answers allowed) % Responses Parks and lighted walkways #1 21.94% Performing arts center #2 16.41% More restrooms #3 9.82% Parking structure 9.72% Mixed-use building – commercial, office and residential 9.51% New marina and boat landing 9.40% Business hotels 8.05% More UV resistant covering and shades 6.90% Cohesive building and design codes 5.75% Other 2.51% Total Responses = 957 100.00%
Assessing the stakeholders’ priority is crucial in forming any strategy,
especially because access to limited resources is the norm. For this reason, the survey asked respondents to rank the importance of four alternative developments in downtown Hagåtña (Table 22). Based on the average ranking, respondents ranked “developing cultural sites (to showcase the island culture)” at the top, followed by “developing economic centers (to stimulate economy)”. It is important to note that “developing residential centers” was ranked last, consistent with the result reported earlier in Table 20.

Asia Pacific Business & Economics Perspectives, 1(1), Summer 2013
18
Table 22. Ranking of Alternative Developments in Downtown Hagåtña Ranking by importance to respondents N 1 2 3 4 Ave Developing cultural sites (to showcase the island culture) 339 39.53% 22.42% 23.01% 15.04%
#1 2.1357
Developing economic centers (to stimulate economy) 331 28.40% 32.93% 25.98% 12.69%
#2 2.2296
Developing government buildings (to showcase civic center of government) 367 22.62% 24.52% 26.43% 26.43%
#3 2.5668
Developing residential centers (for alternative living options) 334 11.68% 19.16% 23.35% 45.81%
#4 3.0329
Table 23. Preferred Option in Downtown Hagåtña Preferred option in downtown Hagåtña % Responses A Hagåtña Riverwalk #1 44.51% A Hike and Bike Trail through the village of Hagåtña #2 32.42% A Promenade through downtown Hagåtña #3 23.08% Total Responses = 364 100.00% Table 24. Ranking of Perceived Desirability or Need Ranking by perceived desirability or need N 1 2 3 4 5 Ave
Museum 312 19.87%
22.76%
22.44%
26.60%
8.33%
#1 2.8077
Cultural Center 316 21.52%
25.63%
14.87%
22.47%
15.51%
#2 2.8481
Convention Center 372 29.03%
14.78%
19.09%
15.05%
22.04%
#2 2.8629
Library 310 16.13%
16.77%
27.42%
20.65%
19.03%
#4 3.0968
Major Sports Complex 313 18.21%
16.93%
15.34%
14.06%
35.46%
#5 3.3163

Asia Pacific Business & Economics Perspectives, 1(1), Summer 2013
19
Among the options presented, a Hagåtña Riverwalk was the most preferred by respondents, receiving 44.51 percent of the responses, followed by a Hike and Bike Trail through the village (32.42%). A Promenade through downtown Hagåtña was least preferred (Table 23). Combining the last two results, perhaps the riverwalk could be designed so that it surrounding structure could showcase the island culture and/or provide venues for businesses and their employees to earn a livelihood.
Among the five options presented, respondents saw having a museum as the most desirable or most needed, followed by a cultural center and a convention center as almost tied for the second place (Table 24). These responses are again consistent with those presented in Table 22, which highlight the island culture and economic need as most important issues to consider with regard to revitalizing downtown Hagåtña.
IS DOWNTOWN HAGÅTÑA THE PREFERRED LOCATION OF FUTURE GROWTH? This entire survey focused on downtown Hagåtña as the site for revitalization and future growth. After all, such strategy for economic development has led to successes in many other downtowns, so why would Guam be different?
Respondents were asked the question, “What is the primary location preference on Guam where you would like to see the growth of additional venues that offer products and services (stores, restaurants, bars, art galleries, cultural activities, theaters, etc.) for consumers?”, and the result was interesting. On the one hand, the result reflects some local opinion that the northern villages, including Tumon and Tamuning, have already grown sufficiently and that future growth should take place elsewhere. On the other hand, the preferred location appears not to be downtown Hagåtña, which received only 15.82 percent of the 392 respondents. Instead, respondents show the strongest preference for future growth in the central villages (32.40%), followed by the southern villages (21.17%). Table 25. Preferred area for future growth Preferred area for future growth % South (Agat, Inarajan, Merizo, Santa Rita, Talofofo, Umatac, Yona) 21.17% Central (Agana Heights, Asan-Maina, Barrigada, Chalan Pago-Ordot, Mangilao, Mongmong-Toto-Maite, Piti, Sinajana) 32.40% North (Dededo, Tamuning, Tumon, Yigo) 14.80% Downtown Hagåtña 15.82% Does not matter 15.82% Total Responses = 392 100.00%
PROSPECTS FOR DOWNTOWN HAGÅTÑA AS A RESIDENTIAL CENTER
Based on results already presented, respondents have not viewed downtown Hagåtña favorably as a residential center: Only 1.95 percent of respondents indicated that “more residential opportunities” would increase their likelihood to visit downtown Hagåtña (Table 20) and “Developing residential centers” was

Asia Pacific Business & Economics Perspectives, 1(1), Summer 2013
20
ranked last in importance among four development alternatives presented to respondents (Table 22). Table 26 supports the same observation, showing that almost 60 percent of the respondents would be somewhat or very unlikely to consider living in downtown Hagåtña in the next three years. It is interesting to note that the 2009 survey showed much higher percentages: 83 percent of early baby boomers, 68 percent of late baby boomers, 69 percent of early millenials and 70 percent of late millenials indicated being somewhat or very unlikely to consider living in downtown Hagåtña in the next 3 years (see Table 5 in Williams and Enriquez, 2010). Table 26. Likelihood of considering to live in downtown Hagåtña Considering to live in downtown Hagåtña in next 3 years % Responses Very Likely 7.49% Somewhat Likely 19.02% Somewhat Unlikely 24.21% Very Unlikely 35.16% Don’t know 14.12% Total Responses = 347 100.00% Table 27. Factors that increase likelihood of considering moving to downtown Hagåtña Factors that will make you more likely to move to downtown Hagåtña in the future (multiple answers allowed) %
Accessible, safe and well-lit sidewalks #1
7.93%
Safe and secure neighborhood #2
7.27%
Availability of affordable single-family dwellings #3
6.80% Nearby (walking-distance) convenience store 6.70% Nearby (walking-distance) restaurant(s) 6.61% Availability of energy-efficient homes 6.28% Accessible pedestrian crosswalks 6.28% Nearby (walking-distance) coffee shop with Internet access 5.90% Nearby (walking-distance) entertainment 5.52% Nearby (walking-distance) park 5.29% Available parking 5.10% Availability of ocean-view housing/condominium units 5.05% Availability of affordable condominium unit dwellings 4.39% Nearby (walking-distance) employment/jobs 4.25% Nearby (walking-distance) medical clinic 3.87% Availability of mass transit system 3.73% Nearby (walking-distance) historical sites 3.45% Nearby (walking-distance) museum or art gallery 3.07% Nearby (walking-distance) copying service/business center 2.03% Other (please specify) 0.47% Total Responses = 2118 100.00%

Asia Pacific Business & Economics Perspectives, 1(1), Summer 2013
21
Table 27 provides some guidelines with regard to factors/changes that will make respondents more likely to move to downtown Hagåtña in the future. The top two responses are telling in that respondents expressed concerns with safety and security: “Accessible, safe and well-lit sidewalks” ranked first and “safe and secure neighborhood” ranked second. This concern for safety and security was also found in the 2009 survey, except that the ranking was reverse: “safe and secure neighborhood” ranked first across all four categories of respondents (early baby boomers, late baby boomers, early millenials and late millenials) and “accessible, safe and well-lit sidewalks” ranked second for the first three categories of respondents and ranking third for the late millenials (see Table 6 in Williams and Enriquez, 2010).
Additional factors to consider are availability of affordable housing, which is approximately tied in the third place with access and proximity (walking-distance) to convenience stores and restaurants.
Interestingly, although respondents ranked the island culture as a top priority or as the most important consideration in revitalizing downtown Hagåtña, prospective downtown residents ranked having a “nearby (walking-distance) museum or art gallery” toward the bottom of the list of factors that will increase their likelihood to move to downtown Hagåtña. This suggests a difference in the perceived needs and priorities of downtown visitors and (prospective) downtown residents.
CONCLUSION
This survey helped to gain insights from Guam’s island community to guide future strategies and efforts toward revitalizing downtown Hagåtña. Efforts were made to achieve a sample of respondents with diversified backgrounds from a total of 400 individuals that participated in the survey.
Our results showed that the main reason for not visiting downtown Hagåtña frequently is that there is “nothing to do or no reason to go” and that it is “too far away”. Not only does this point to the lack of attractions in downtown Hagåtña, but that current attractions might not be worthwhile enough to drive the distance and incur the gas expense to visit. Our results show that visits to downtown Hagåtña would increase if there were more retail stores, sit-down restaurants, parks and entertainment venues/theaters. While the remaining responses suggest interest in a wide array of additional venues to attract visitors to downtown Hagåtña, our results suggest a very low interest to downtown living, receiving only 1.95 percent of responses and ranking last among the alternative attractions presented.
In assessing the stakeholders’ priority by ranking the importance of four alternative developments in downtown Hagåtña, our results show respondents ranked “developing cultural sites (to showcase the island culture)” at the top, followed by “developing economic centers (to stimulate economy)”. Among three options presented, a Hagåtña Riverwalk was the most preferred by respondents, followed by a Hike and Bike Trail through the village and, lastly, by a Promenade through downtown Hagåtña. Among the five options presented, respondents saw having a museum as the most desirable or most needed, followed by a cultural

Asia Pacific Business & Economics Perspectives, 1(1), Summer 2013
22
center and a convention center as almost tied for the second place. Results highlight the island culture and economic need as most important issues to consider with regard to revitalizing downtown Hagåtña.
Successful downtowns attract a wide range of individuals by affecting housing, work, shopping, culture, entertainment, government, and tourist attractions. Our survey data suggest a difference in the perceived needs and priorities of downtown visitors and (prospective) downtown residents. As with any downtown development strategy, our survey results show that there is a need to develop a broad strategy for revitalizing downtown Hagåtña to address the various perceived needs and priorities. The blueprints for improving downtown Hagåtña must address several areas at once, including commercial businesses, and also public access (parks and lighting) initiatives, arts, recreational opportunities, and public transit to assist with accessibility to downtown from the more populated villages in central and northern Guam.
The need to maintain and develop genuine public spaces is apparent in our survey results. The interest in parks received the top response when respondents were asked what they would like to see built or developed in Hagåtña. Approximately tied at second rank were building or developing a performing arts center built or developed, basic facilities such as restrooms and parking as well as mixed-used buildings and a new marina and boat landing. Careful planning through lighting sidewalks, improved mass transit and perception of safety can encourage “on-street” activities such as commerce and dining and widen the public sphere, promoting community.
Our results show the high ranking of seeing a performing arts center built or developed as well as a relatively high ranking of the categories for “more entertainment venues/theaters”, “cultural facilities”, “museum”, and “art gallery” . These suggest an interest in culture/entertainment and a focus on developing the unique qualities of downtown Hagåtña through Guam’s cultural offerings. Downtowns generally have an advantage over suburban developments in terms of their historical value and compact, walking-friendly size. Development should focus on these strengths by preserving historical architecture and promoting traditional architecture through zoning and adaptive reuse of existing structures. Downtown Hagåtña, like many other revitalized downtown areas in the United States, should also improve pedestrian walkways through installation of attractive lights, benches, and landscaping in order to draw shoppers and other traffic. Because downtown Hagåtña has a number of scenic waterfront sites, it has a distinct advantage to successfully develop these sites for tourists and residents.
Based on our survey results, downtown Hagåtña is not looked upon favorably as a residential center. The top two responses are telling in that respondents expressed concerns with safety and security. Additional factors to consider addressing in this section are availability of affordable housing, which is approximately tied in the third place with access and proximity (walking-distance) to convenience stores and restaurants. Although “Developing residential centers” was ranked last in importance among four development alternatives presented to respondents, this perception concerning Hagåtña as a residential center may change over time with strategies implemented to address safety and security concerns, as well as addressing several areas as described above.

Asia Pacific Business & Economics Perspectives, 1(1), Summer 2013
23
ENDNOTES
1. This survey is approved by the Committee on Human Research Subjects as CHRS#11-118,
effective through December 19, 2012. 2. Thanks to students from the University of Guam’s Business and Accounting courses (Spring
Semester 2012) who assisted in conducting this survey. 3. https://uguam.asia.qualtrics.com/SE/?SID=SV_e9AebcuNLqHp188
REFERENCES
Buhain Carrera, J. (April 30, 2012). 5000 Marines Coming to Guam. Retrieved
from http://mvguam.com/local/news/23419-5000-marines-coming-to-guam.html.
Calvo-Tenorio (2010). Blueprint 2020. Retrieved from http://www.calvotenorio.com/main/platform/, July 2012
Guam Bureau of Labor Statistics (2012). Current Employment Statistics History 1993-2012. Retrieved from http://dol.guam.gov
Guam Economic Development Authority, Guam Bureau of Statistics and Plans and University of Guam-Pacific Center for Economic Initiatives (2011). 2011 Guam Comprehensive Economic Development Strategy. Retrieved from http://www.bsp.guam.gov/index.php? option=com_content&view=article&id=123:guam-2011-comprehensive-economic-development-strategy-ceds&catid=37: socio-economic&Itemid=58, July 2012
Guam Visitors Bureau (February 2013). Visitor Arrival Statistics. Retrieved from http://www.visitguam.org/Runtime/GVBResearch.aspx.
Office of the Governor (April 28, 2011). Museum Funding Now Set: Governor signs HOT bond; tourism projects to begin.
Pacific News Center (2012, March 10). University of Guam’s Pacific Center for Economic Initiatives Conducting Downtown Hagåtña Survey. Retrieved from http://www.pacificnewscenter.com/index.php? option=com_content&view=article&id=21649:-university-of-guams-pacific-center-for-economic-initiatives-to-conduct-downtown-Hagåtña-survey&catid=45:guam-news&Itemid=156.
Pacific News Center (July 25, 2012). CSIS Report on Pacific Realignment Submitted to Congress. Retrieved from http://www.pacificnews center.com/index.php?option=com_content&view=article&id=25756:csis-report-on-pacific-realignment-submited-to-congress&catid=45: guam-news&Itemid=156, July 2012
Ruane, M.C. (2011). First Hawaiian Bank’s 2011 Economic Forecast: Guam-CNMI Edition.
Taitano, Z.V. (July 30, 2012). Guam Build-up in Now Back On Track. Retrieved from http://mvguam.com/local/news/25014-guam-buildup-is-now-back-on-track.html, July 2012
U.S. Census Bureau (2000). Census 2000 for Guam and the 2010 Census for Guam. Retrieved from http://www.bsp.guam.gov, July 2012

Asia Pacific Business & Economics Perspectives, 1(1), Summer 2013
24
U.S. Department of Commerce, Bureau of Economic Analysis (July 17, 2011). OIA-BEA Announce Release of Gross Domestic Product (GDP) Estimates for Guam for 2008 and 2009. Retrieved from http://www.bea.gov/ newsreleases/general/terr/2011/pdf/guam_071711.pdf.
Williams, V.L. & Enriquez, A.B. (2010). Factors for attracting baby boomers and millenials to downtown living: Implications for revitalizing Guam’s downtown Hagåtña. Journal of International Business Research, 9(2), 61-82.

Asia Pacific Business & Economics Perspectives, 1(1), Summer 2013
25
The evolution of renewable energy technologies in India
Behrooz Asgari Graduate School of Management Ritsumeikan Asia Pacific University [email protected] Harinatha R. Beeram Graduate School of Management Ritsumeikan Asia Pacific University [email protected]
ABSTRACT Renewable energy technologies (RETs) have immense potential to energize rural and remote settlements that are economically not viable and/or technologically not feasible to be connected by the grid. Such a noble agenda for RETs has been clearly demonstrated in rural India where many villages and hamlets could see lighting for the first time in the sixty decades of independent India. We model the future growth pattern of RETs in India as a whole and specifically wind, small hydro and biomass renewable energy technologies in top ten states (based on their maximum potential in each energy type) in India. The Logistic and the Gompertz functions have been used for this purpose. The time periods to achieve the potential from 10% to 90%, to achieve 99 percent of the potential, and the time when inflection point would be reached are determined and analysed. JEL Classification: N70, N75 Keywords: S-shaped curves, renewable energy technologies, India, technological forecasting
INTRODUCTION In India, only 66.3 percent of the population had access to electricity in 2009 (World Bank, 2010). More than 400 million people, including 47.5 percent of them living in India’s rural hinterland, have no access to electricity till date (MNRE, 2012). India has over 90,000 un-electrified villages and over 380,000 partially electrified villages (Engineering Review, 2012).
Recently, India has put a major emphasis on development and diffusion of Renewable Energy Technologies (RETs). RETs can help India to enhance its energy security, improve local environment, reduce its carbon footprint, usher in balanced regional development, and make it leader in high-technology industries (Gevorg, et. al, 2010). The total installed capacity by March, 2011 was more than 206,526 MW and the estimated potential of Renewable Energies was nearly

Asia Pacific Business & Economics Perspectives, 1(1), Summer 2013
26
89,760 MW (CSO, 2012). Ideally, RETs should have contributed more than 40 tercen6 of the energy needs, but in reality it was only 11 percent. Studies on Indian RETs
In far places, RETs can meet the energy needs. Solar PV is one of the lifeline programs for such areas catering to the needs such as village, lighting - home and street; water pumping, and rural telecommunication. NGOs have an important role in raising awareness among rural masses about the utility of RETs as well as training them in operation and maintenance. Four problems associated with RET diffusion are high costs, positive perception, will for saving environment and awareness of the people. According to Swaran Singh, these issues can be resolved by effective participation of Government, industry, research institutions, financial institutions, NGOs (Sayigh, 1999).
Figure 1. A chronology of literature survey
Demonstration programs are pertinent for testing new energy technology
manufacturing (for example, photovoltaics) and energy conversion facilities and evaluate their technical feasibility and economic viability. Prohibitive capital requirements, high required rates of return, high risk, and problems associated with appropriating the long-term benefits may not motivate the private sector to setup demonstration plants. As such, governmental support is crucial apparently when the technology has promising public benefits (Reddy & Painuly, 2004).
Solar energy in conjunction with hydrogen as an energy carrier has immense potential as future fuel. Tariq, Muhammad and Saima explored such feasibility for India by 2025. The solar electricity in excess of demand is stored in the form of hydrogen and used later. Using a modular approach, the study asserted that the solar-hydrogen duo is capable of meeting the energy needs of Chennai, Delhi, Jodhpur, Kolkata, Mumbai and Trivandrum by 2025. Cost comparison for supply of fossil fuel and solar electricity for the year 2025 has been proposed for the six cities indicating that solar photo-voltaic electricity will be cheaper than fossil fuel (Muneer, Asif, & Munawwar, 2005).
In India, wind power technologies have advanced well compared to other RETs leading to its wider diffusion till date. Carolin and Fernandez (2008) reviewed

Asia Pacific Business & Economics Perspectives, 1(1), Summer 2013
27
the development of wind energy technologies in India and in five Indian states - Tamilnadu, Maharashtra, Karnataka, Gujarat and Andhra Pradesh. They also forecasted the diffusion of wind energy technologies using the pearl or the logistic curve. The study predicts that the wind energy technology for power generation in India may reach 99% of the assessed total technical wind power potential by 2030, Maharashtra and Karnataka by 2020, Tamil Nadu by 2022 and Andhra Pradesh by 2025. Gujarat would achieve 86% of its technical potential by 2030 (Carolin & Fernandez, 2008).
Though renewable energy programmes were initiated early in India, it has been a laggard in certain RETs. The significance of RETs in meeting future energy needs was probably under-emphasized due to lack of reliable potential estimates. Despite housing the world’s largest small gasifier programme and the second largest biogas and ICS programs, many such plants are dysfunctional now. Of the 35 million ICSs installed so far, an estimate tells that, less than 6 million are functioning now. Factors that made wind energy technologies in India as the most successful among RETs: the involvement of the private sector, supporting environment provided by the government and lowered costs of wind technologies (Bhattacharya & Jana, 2009).
DIFFUSION AND TECHNOLOGICAL FORECASTING Typically, a diffusion process passes through an early adoption stage which is generally slow in nature, that is followed by a rapid adoption phase and thereafter reaching a phase of tapering rate of adoption. Dominance of the S-Shaped Curves
Marchetti C., Ausubel J.H., Mensch G., Modis and many other scholars have applied S-shaped curves on numerous technologies and social phenomena. The International Journal of Technological Forecasting and Social Change published more than 320 articles during the period May 2002 to May 2007 of which about 14 articles dealt with the application of the logistic S-curve of natural growth for forecasting purposes and many others mentioned S-curves on their pages (Kucharavy & De Guio, 2007).
The S-shaped curves have been used to explain the diffusion process of new technologies. Though there are a number of such functions that describe the S-shaped curves, the two often followed diffusion models of S-curve which represent various growth patterns or trends are the logistic and the Gompertz functions (Das, 2012). This paper chose the Logistic function for Indian States and uses the IIASA’s Logistic Substitution Model II tool for analysis.

Asia Pacific Business & Economics Perspectives, 1(1), Summer 2013
28
Figure 2. The S-curve
The Logistic function is given by:
𝑦 = 𝑓(𝑡) = 𝐾
1 + 𝑒−𝑎−𝑏𝑡
The Gompertz function is given by:
𝑦 = 𝑓(𝑡) = 𝐾𝑒−𝑎𝑒−𝑏𝑡 where, 𝐾 is the carrying capacity 𝑎 and 𝑏 are the location and shape parameters of the curve, respectively.
The logistic curve, when reaches half of the saturation level i.e., at 𝑦0 =K2
, called the point of inflection of the curve, attains its maximum growth rate. This
occurs at 𝑡 = −𝑎𝑏
. For Gompertz, 𝑦0 = Ke and 𝑡 = 𝑙𝑛 𝑎
𝑏. About the point of inflection,
both curves differ from each other. The logistic curve is symmetric while the Gompertz curve is not.
Technological Forecasting of IRETS
To model the future growth pattern of RETs in India, the renewable energy technologies in India as a whole and wind, small hydro and biomass renewable energy technologies in top ten states in India are chosen. These states are selected based on their maximum potential in each energy technology.
The estimated potential of total renewable power reserves (the carrying
capacity or saturation level K, in India as on 31.03.11 is 89,760 MW which was taken from the Energy Statistics, 2012 published by the Ministry of Statistics and Programme Implementation, Government of India. This potential is the aggregate of state wise and source wise potential of the renewable power reserves.

Asia Pacific Business & Economics Perspectives, 1(1), Summer 2013
29
Table 1. Renewable energy technologies and respective top ten states chosen
Wind Power Small Hydro Power Biomass Power
States
Potential in MW as on 31-03-2011
States
Potential in MW as on 31-03-2011
States
Potential in MW as on 31-03-2011
Gujarat 10609 Himachal Pradesh 2268 Punjab 3172
Karnataka 8591 Uttarakhand 1577 Maharashrta 1887
Maharashrta 5439 Jammu & Kashmir 1418 Uttar Pradesh 1617
Andhra Pradesh 5394 Arunachal Pradesh 1329
Madhya Pradesh 1364
Tamilnadu 5374 Chhattisgarh 993 Haryana 1333 Jammu & Kashmir 5311 Madhya Pradesh 804 Gujarat 1221
Rajasthan 5005 Karnataka 748 Karnataka 1131
Madhya Pradesh 920 Maharashrta 733 Tamilnadu 1070
Odisha 910 Kerala 704 Kerala 1044
Kerala 790 Tamilnadu 660 Rajasthan 1039 Source: MOSPI (2011). India - RET Projections
One can visually recognize the curve best fitting the data. However, the coefficient of determination value, the mean square error (MSE), the mean absolute deviation (MAD) and auxiliary regression are used to determine the better forecast between the two functions and use it to analyze the diffusion of RETs in India.
Franses (1994) proposed an alternative method for selecting between the logistic and the Gompertz functions, based on an auxiliary regression, and a significance test for one parameter (Franses, 1994).
Based on the aforementioned criteria, Gompertz function has been chosen for India, for forecasting where all the criteria are favouring the Gompertz. In the US, the logistic function is preferred.

Asia Pacific Business & Economics Perspectives, 1(1), Summer 2013
30
Figure 3. India - projected renewable energy installation capacity.
The projection of RETs installation in India along the time axis is shown in
Figure 3. The pattern of the curve reiterates that growth is very slow in the initial years indicating the presence of various barriers to implement new technology followed by a phase of rapid growth, which at a later stage slows down while approaching the saturation level K. Up to the inflection point, growth rate or capacity addition increases and beyond the inflection point, growth rate increase is decelerating.
In case of India, where the Gompertz function seems to fit better, growth is relatively rapid during initial phase and increasingly slows down in the attempt to reach the saturation level. It exhibits maximum rate of growth during earlier phase when compared to the logistic model. For the states whose RETs future growth is best explained by the logistic function, the growth is slow during early phase and more rapid towards the maturity. The logistic model witnesses a higher rate of growth during the later phase in comparison with the Gompertz model.
The growth of RETs in India has witnessed a rapid pace in the recent years and assuming the same trend, the Gompertz function suggests that India could achieve 99% of its potential in RETs by 2068 i.e., 88862 MW. This means in India, the diffusion of RETs as an energy alternative could reach 99% of the estimated RETs potential by 2068. For India, the time period required to achieve its RETs potential from 10 percent to 90 percent is 36.14 years. The inflection point as explained by the Gompertz function is reached nearly by 2017. Fisher-Pry transform of the Logistic fit given below helps to understand the orderliness of the diffusion process.

Asia Pacific Business & Economics Perspectives, 1(1), Summer 2013
31
Figure 4. Fisher-Pry transform - IIASA model.
Figure 5. Gompertz fit - IIASA model. Wind Energy Technology in Different States of India
The modelling for states in wind energy technologies is shown in the Figure 6.
Figure 6. States - projected wind energy installation capacity Legend: GJ: Gujarat, KA: Karnataka, MH: Maharashtra, AP: Andhra Pradesh, TN: Tamilnadu, RJ: Rajasthan, MP: Madhya Pradesh, KL: Kerala
Gujarat could achieve 99 percent of its potential in wind energy technology by 2030 i.e., 10513.99 MW. This means that the diffusion of wind energy
0
5000
10000
15000
2000 2020 2040 2060 2080
GJ KA MH APTN RJ MP KL

Asia Pacific Business & Economics Perspectives, 1(1), Summer 2013
32
technology as an energy alternative in Gujarat could reach 99 percent of the estimated potential by 2030. For Gujarat, the time period required to achieve its wind energy technology potential from 10 percent to 90 percent is 13.83 years.
Karnataka could achieve 99 percent of its potential in wind energy technology by 2028 i.e., 8504.27 MW. This means that, the diffusion of wind energy technology as an energy alternative in Karnataka could reach 99% of the estimated potential by 2028. For Karnataka, the time period required to achieve its wind energy technology potential from 10% to 90% is 17.36 years. The inflection point as explained by the logistic function is reached nearly by 2017.
Maharashtra could achieve 99 percent of its potential in wind energy technology by 2041 i.e., 5382.63 MW. This means that, the diffusion of wind energy technology as an energy alternative in Maharashtra could reach 99% of the estimated potential by 2041. For Maharashtra, the time period required to achieve its wind energy technology potential from 10 percent to 90 percent is 16.38 years. The inflection point as explained by the logistic function is reached nearly by 2012.
Andhra Pradesh could achieve 99 percent of its potential in wind energy technology by 2301 i.e., 5340.06 MW. This means that, the diffusion of wind energy technology as an energy alternative in Andhra Pradesh could reach 99 percent of the estimated potential by 2301. For Andhra Pradesh, the time period required to achieve its wind energy technology potential from 10% to 90 percent is 47.15 years. The inflection point as explained by the logistic function is reached nearly by 2047.
Tamilnadu could achieve 99 percent of its potential in wind energy technology by 2033 i.e., 5318.62 MW. This means that, the diffusion of wind energy technology as an energy alternative in Tamilnadu could reach 99% of the estimated potential by 2033. For Tamilnadu, the time period required to achieve its wind energy technology potential from 10 percent to 90 percent is 7.81 years. The inflection point as explained by the logistic function is reached nearly by 2006.
Rajasthan could achieve 99 percent of its potential in wind energy technology by 2040 i.e., 4953.27 MW. This means that, the diffusion of wind energy technology as an energy alternative in Rajasthan could reach 99 percent of the estimated potential by 2040. For Rajasthan, the time period required to achieve its wind energy technology potential from 10 percent to 90 percent is 10.8 years. The inflection point as explained by the logistic function is reached nearly by 2013.
Madhya Pradesh could achieve 99 percent of its potential in wind energy technology by 2053 i.e., 916.2 MW. This means that, the diffusion of wind energy technology as an energy alternative in Madhya Pradesh could reach 99 percent of the estimated potential by 2053. For Madhya Pradesh, the time period required to achieve its wind energy technology potential from 10 percent to 90 percent is 12.31 years. The inflection point as explained by the Gompertz function is reached nearly by 2014.
Kerala could achieve 99 percent of its potential in wind energy technology by 2053 i.e., 916.2 MW. This means that, the diffusion of wind energy technology as an energy alternative in Kerala could reach 99 percent of the estimated potential by 2053. For Kerala, the time period required to achieve its wind energy
Asia Pacific Business & Economics Perspectives, 1(1), Summer 2013
33
technology potential from 10 percent to 90 percent is 14.4 years. The inflection point as explained by the Gompertz function is reached in 27.73 years i.e., nearly by 2022.
Notable Distinct Features
As per the forecasting, the states of Tamilnadu, Maharashtra, Rajasthan and Madhya Pradesh have already reached their inflection points. These states, though witnessing growth beyond their inflection points, will face decelerating growth rates.
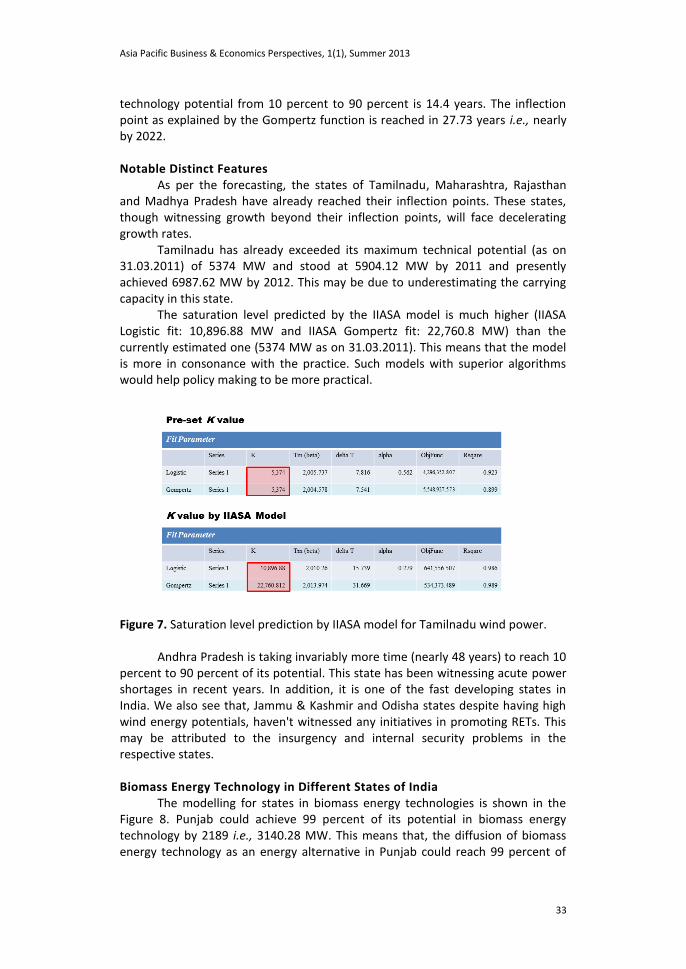
Tamilnadu has already exceeded its maximum technical potential (as on 31.03.2011) of 5374 MW and stood at 5904.12 MW by 2011 and presently achieved 6987.62 MW by 2012. This may be due to underestimating the carrying capacity in this state.
The saturation level predicted by the IIASA model is much higher (IIASA Logistic fit: 10,896.88 MW and IIASA Gompertz fit: 22,760.8 MW) than the currently estimated one (5374 MW as on 31.03.2011). This means that the model is more in consonance with the practice. Such models with superior algorithms would help policy making to be more practical.
Figure 7. Saturation level prediction by IIASA model for Tamilnadu wind power.
Andhra Pradesh is taking invariably more time (nearly 48 years) to reach 10 percent to 90 percent of its potential. This state has been witnessing acute power shortages in recent years. In addition, it is one of the fast developing states in India. We also see that, Jammu & Kashmir and Odisha states despite having high wind energy potentials, haven't witnessed any initiatives in promoting RETs. This may be attributed to the insurgency and internal security problems in the respective states. Biomass Energy Technology in Different States of India
The modelling for states in biomass energy technologies is shown in the Figure 8. Punjab could achieve 99 percent of its potential in biomass energy technology by 2189 i.e., 3140.28 MW. This means that, the diffusion of biomass energy technology as an energy alternative in Punjab could reach 99 percent of

Asia Pacific Business & Economics Perspectives, 1(1), Summer 2013
34
the estimated potential by 2189. For Punjab, the time period required to achieve its biomass energy technology potential from 10 percent to 90 percent is 21.17 years. The inflection point as explained by the logistic function is reached nearly by 2030.
Maharashtra could achieve 99 percent of its potential in biomass energy technology by 2057 i.e., 1867.19 MW. This means that, the diffusion of biomass energy technology as an energy alternative in Maharashtra could reach 99 percent of the estimated potential by 2057. For Maharashtra, the time period required to achieve its biomass energy technology potential from 10 percent to 90 percent is 9.37 years. The inflection point as explained by the logistic function is reached nearly by 2014.
Figure 8. States - projected biomass energy installation capacity. Legend: PN: Punjab, UP: Uttar Pradesh, HR: Haryana
Uttar Pradesh could achieve 99 percent of its potential in biomass energy technology by 2025 i.e., 1600 MW. This means that, the diffusion of biomass energy technology as an energy alternative in Uttar Pradesh could reach 99 percent of the estimated potential by 2025. For Uttar Pradesh, the time period required to achieve its biomass energy technology potential from 10 percent to 90 percent is 10.08 years. The inflection point as explained by the logistic function is reached nearly by 2012.
Haryana could achieve 99 percent of its potential in biomass energy technology by 2069 i.e., 1319.67 MW. This means that, the diffusion of biomass energy technology as an energy alternative in Haryana could reach 99 percent of the estimated potential by 2069. For Haryana, the time period required to achieve its biomass energy technology potential from 10 percent to 90 percent is 4.15 years. The inflection point as explained by the logistic function is reached nearly by 2015.
Karnataka could achieve 99% of its potential in biomass energy technology by 2060 i.e., 1120 MW. This means that, the diffusion of biomass energy technology as an energy alternative in Karnataka could reach 99% of the estimated potential by 2060. For Karnataka, the time period required to achieve
0500
10001500200025003000
2000 2020 2040 2060 2080 2100
PN MH UP HR
KA TN RJ

Asia Pacific Business & Economics Perspectives, 1(1), Summer 2013
35
its biomass energy technology potential from 10% to 90% is 24.17 years. The inflection point as explained by the logistic function is reached nearly by 2015.
Tamilnadu could achieve 99 percent of its potential in biomass energy technology by 2049 i.e., 1059 MW. This means that, the diffusion of biomass energy technology as an energy alternative in Tamilnadu could reach 99 percent of the estimated potential by 2049. For Tamilnadu, the time period required to achieve its biomass energy technology potential from 10 percent to 90 percent is 17.94 years. The inflection point as explained by the logistic function is reached nearly by 2013.
Rajasthan could achieve 99 percent of its potential in biomass energy technology by 2082 i.e., 1070 MW. This means that, the diffusion of biomass energy technology as an energy alternative in Rajasthan could reach 99 percent of the estimated potential by 2082. For Rajasthan, the time period required to achieve its biomass energy technology potential from 10 percent to 90 percent is 12.35 years. The inflection point as explained by the Gompertz function is reached nearly by 2019. SMALL HYDRO POWER TECHNOLOGY IN DIFFERENT STATES OF INDIA
The modelling for states in small hydro power (SHP) technologies is shown in the Figure 9.
Figure 9. States - projected SHP installation capacity. Legend: HP: Himachal Pradesh, UK: Uttarakhand, JK: Jammu & Kashmir, Ar.P: Arunachal Pradesh, CH: Chhattisgarh,
Himachal Pradesh could achieve 99 percent of its potential in SHP technology by 2058 i.e., 2245 MW. This means that, the diffusion of SHP technology as an energy alternative in Himachal Pradesh could reach 99 percent of the estimated potential by 2060. For Himachal Pradesh, the time period required to achieve its SHP technology potential from 10 percent to 90 percent is 14.81 years. The inflection point as explained by the logistic function is reached nearly by 2017.
Uttarakhand could achieve 99 percent of its potential in SHP technology by 2120 i.e., 1561 MW. This means that, the diffusion of SHP technology as an energy alternative in Uttarakhand could reach 99 percent of the estimated potential by
0500
1000150020002500
2000 2020 2040 2060 2080 2100
HP UK JK Ar.P CH
MP KA MH KL TN

Asia Pacific Business & Economics Perspectives, 1(1), Summer 2013
36
2120. For Uttarakhand, the time period required to achieve its SHP technology potential from 10 percent to 90 percent is 32.9 years. The inflection point as explained by the logistic function is reached nearly by 2029.
Jammu & Kashmir could achieve 99 percent of its potential in SHP technology by 2188 i.e., 1403.82 MW. This means that, the diffusion of SHP technology as an energy alternative in Jammu & Kashmir could reach 99 percent of the estimated potential by 2188. For Jammu & Kashmir, the time period required to achieve its SHP technology potential from 10 percent to 90 percent is 108.11 years. The inflection point as explained by the logistic function is reached nearly by 2068.
Arunachal Pradesh could achieve 99 percent of its potential in SHP technology by 2120 i.e., 1315.2 MW. This means that, the diffusion of SHP technology as an energy alternative in Arunachal Pradesh could reach 99 percent of the estimated potential by 2120. For Arunachal Pradesh, the time period required to achieve its SHP technology potential from 10 percent to 90 percent is 26.65 years. The inflection point as explained by the logistic function is reached nearly by 2028.
Chhattisgarh could achieve 99 percent of its potential in SHP technology by 2314 i.e., 983.07 MW. This means that, the diffusion of SHP technology as an energy alternative in Chhattisgarh could reach 99 percent of the estimated potential by 2314. For Chhattisgarh, the time period required to achieve its SHP technology potential from 10 percent to 90 percent is 64.24 years. The inflection point as explained by the logistic function is reached nearly by 2068.
Madhya Pradesh could achieve 99 percent of its potential in SHP technology by 2058 i.e., 661.5 MW. This means that, the diffusion of SHP technology as an energy alternative in Madhya Pradesh could reach 99 percent of the estimated potential by 2058. For Madhya Pradesh, the time period required to achieve its SHP technology potential from 10 percent to 90 percent is 33.41 years. The inflection point as explained by the logistic function is reached nearly by 2028.
Karnataka could achieve 99 percent of its potential in SHP technology by 2012 i.e., 740.52 MW. This means that, the diffusion of SHP technology as an energy alternative in Karnataka could reach 99 percent of the estimated potential by 2012. For Karnataka, the time period required to achieve its SHP technology potential from 10 percent to 90 percent is 7.68 years. The inflection point as explained by the logistic function is reached nearly by 2007.
Maharashtra could achieve 99 percent of its potential in SHP technology by 2108 i.e., 726 MW. This means that, the diffusion of SHP technology as an energy alternative in Maharashtra could reach 99 percent of the estimated potential by 2108. For Maharashtra, the time period required to achieve its SHP technology potential from 10 percent to 90 percent is 52.27 years. The inflection point as explained by the logistic function is reached nearly by 2019.
Kerala could achieve 99 percent of its potential in SHP technology by 2109 i.e., 697 MW. This means that, the diffusion of SHP technology as an energy alternative in Kerala could reach 99 percent of the estimated potential by 2109. For Kerala, the time period required to achieve its SHP technology potential from 10 percent to 90 percent is 41.78 years. The inflection point as explained by the logistic function is reached nearly by 2024.

Asia Pacific Business & Economics Perspectives, 1(1), Summer 2013
37
Tamilnadu could achieve 99 percent of its potential in SHP technology by 2351 i.e., 653.4 MW. This means that, the diffusion of SHP technology as an energy alternative in Tamilnadu could reach 99 percent of the estimated potential by 2351. For Tamilnadu, the time period required to achieve its SHP technology potential from 10 percent to 90 percent is 124.97 years. The inflection point as explained by the logistic function is reached nearly by 2062.
Figure 10. Saturation Level Prediction by IIASA model for Karnataka small hydro power. Barriers for Diffusion in IRETS
Though the IRETS has grown significantly, it is still fraught with problems. Resource Assessment has been one of the foremost problems leading to under estimation of the potential of various RETs. This is clearly visible from certain proactive states that have crossed the estimated potential already - Tamilnadu (Wind) and Karnataka (Small Hydro).
The manufacturing sector though has gained proficiency in certain RETs like solar PV, wind, etc, seems to be lagging in MW scale biomass technology. This is evident from the fact that even in the adolescent stage, India’s First 1.2MW Grid-connected Biomass Power Generation System is 100 percent imported from M/s Shendong Power Machinery Company Ltd., China (MNRE, 2012).
With the launch of JNNSM, Solar technology seems to get overwhelming attention at the expense of others especially Small hydro and new energies.
Costs are the overriding barrier that is standing in the way of faster diffusion of RETs. Even today, costs are prohibitively high for entrepreneurs to venture into the system as well as for users to enjoy the fruits of RETs. Invariably, all over the world, governments have to step in to fill the gap by way of offering incentives and subsidies. In India, MNRE has shouldered this responsibility to a larger extent complemented by various regulations and policies.
Table 1 shows the capital cost in lakhs per MW of each RET type. Solar PV has shown a consistent down trend, which is also a drastic reduction in just four years. Technological changes, government promotions have been major factors behind such capital cost reduction. On the other hand, all others have shown a mixed trend of increasing and decreasing. This can be attributed to changing

Asia Pacific Business & Economics Perspectives, 1(1), Summer 2013
38
government promotional incentives to some RETs (Wind), remote and inaccessible locations (SHP), lack of availability of raw material (Biomass). Table 2. Capital cost trends across various RETs
Capital Cost Norm derived by CERC in ₹ a Lakhb/MW
2009-10 2010-11 2011-12 2012-13
Wind 515 467.13 492.52 575
Solar PV 1700 1690 1442.00 1000
Thermal 1300 1530 1500 1300 Biomass 450 402.54 426.03 445
SHP
Himachal Pradesh, Uttarakhand and North Eastern States (less than 5 MW) 700 634.94 669.42 770
Himachal Pradesh, Uttarakhand and North Eastern States (5MW to 25 MW) 630 571.44 602.48 700
Other States (below 5 MW) 550 498.88 525.97 600
Other States ( 5MW to 25 MW) 500 453.53 478.16 550
Non-fossil fuel based co-generation projects 445 398.07 421.3 420 Note: ₹ is Indian Rupees (INR); One Lakh = 100,000 Source: (CERC, 2009)
The diffusion rate of the three RETs chosen differs significantly. The wind
technologies are reaching their plateau of productivity in the first half of the 21st Century, followed by the biomass technologies (second half of the 21st Century) and the small hydro technologies (first half of 22nd Century). But, rural development and livelihood improvement cannot wait for a century. A development that makes the beneficiaries to wait for a century is not really a development. As such, there is an immediate need to diffuse the technologies at a faster rate.

Asia Pacific Business & Economics Perspectives, 1(1), Summer 2013
39
Figure 11. Solar PV: trends in costs and installed capacity (PIB, 2012)(CERC, 2012).
REFERENCES Bhattacharya, S., & Jana, C. (2009). Renewable energy in India: Historical
developments and prospects. Energy, 981-991. BusinessLine. (2012, June 13). India’s crude oil import bill jumps 40% to $140 bn in
FY12. Retrieved December 05, 2012, from thehindubusinessline: http://www.thehindubusinessline.com/ industry-and-economy/article3523827.ece
Carolin, M. M., & Fernandez, E. (2008). Growth and future trends of wind energy in India. Renewable and Sustainable Energy Reviews, 1745–1757.
CERC. (2012, October 15). Orders. Retrieved from CERC: http://www.cercind.gov.in/orders.html
CERC. (2012, December 10). Recent Orders/Records of Proceedings. Retrieved from CERC: http://www.cercind.gov.in/recent_orders_rops.html
CSO. (2012). Energy Statistics 2012. Retrieved 10 20, 2012, from MINISTRY OF STATISTICS AND PROGRAMME IMPLEMENTATION, Government of India: http://mospi.nic.in/Mospi_New/upload/Energy_Statistics_ 2012_28mar.pdf?status=1&menu_id=201
Das, D. (2012). Growth of mobile phone subscribers in India. Basic Research Journal of Business Management and Accounts, 14-20.
Dmitry , K. (2007). APPLICATION OF S-SHAPED CURVES. ETRIA TRIZ Future Conference 2007. Frankfurt.
EIA. (2011, November 21). Country Analysis Briefs - India. Retrieved December 6, 2012, from EIA: http://www.eia.gov/cabs/india/Full.html
EngineeringReview. (2012, February). BUSINESS NEWS. Retrieved December 06, 2012, from engrreview: http://www.engrreview.com/Editorial_

Asia Pacific Business & Economics Perspectives, 1(1), Summer 2013
40
pages/2012/02_February_12/ER1202_ind-news_06.html Franses, P. H. (1994). A Method to Select Between Gompertz and Logistic Trend
Curves. TECHNOLOGICAL FORECASTING AND SOCIAL CHANGE, 45-49. Garg, H., & Adhikari, R. (1998). RENEWABLE ENERGY PROGRAMME AND VISION IN
INDIA. Renewable Energy, 473-478. Gartner. (2012, July 27). Hype Cycle for Emerging Energy Technologies, 2012.
Retrieved from Gartner: http://www.gartner.com/Display Document?doc_cd=234060
Gevorg, S., Bhatia, M., Banerjee, S. G., Raghunathan, K., & Soni, R. (2010). Resources. Retrieved October 18, 2012, from http://siteresources. worldbank.org/EXTENERGY2/Resources/Unleashing_potential_of_renewables_in_India.pdf
Harvey, A. C. (1984). Time Series Forecasting Based on the Logistic Curve. The Journal of the Operational Research Society, 641-646.
IREDA. (2012, December 01). Annual REport 2011-12. Retrieved from IREDA: http://www.ireda.gov.in/pdf/Annual_Report2011-12Eng.pdf
MNRE. (2012). Annual Report 2011-2012. Retrieved November 29, 2012, from Ministry of New and Renewable Energy, Government of India: http://mnre.gov.in/file-manager/annual-report/2011-2012/EN/ Chapter%205/chapter_5.htm
MNRE. (2012). Decentralized Systems. Retrieved 11 27, 2012, from Ministry of New and Renewable Energy, Govenment of India: http://www.mnre.gov.in/schemes/decentralized-systems/
MNRE. (2012, December 25). Grid Connected Power. Retrieved from MNRE: http://www.mnre.gov.in/schemes/grid-connected/
MNRE. (2012, December 25). New Technologies. Retrieved from MNRE: http://www.mnre.gov.in/schemes/new-technologies/
MNRE. (2012, December 25). Off-Grid Power. Retrieved from MNRE: http://www.mnre.gov.in/schemes/offgrid/
MOF. (2012). Balance of Payments. Retrieved December 1, 2012, from indiabudget: http://indiabudget.nic.in/es2011-12/echap-06.pdf
MOF. (2012, December 5). International Trade. Retrieved from indiabudget: http://indiabudget.nic.in/es2011-12/echap-07.pdf
MOSPI. (2012, October 23). Energy Statistics - 2011. Retrieved from Ministry of Statistics and Programme Implementation: http://mospi.nic.in/ Mospi_New/site/inner.aspx?status=3&menu_id=171
Muneer, T., Asif, M., & Munawwar, S. (2005). Sustainable production of solar electricity with particular reference to the Indian economy. Renewable and Sustainable Energy Reviews, 444–473.
PIB. (2012, December 30). Year End Review of Ministry of New and Renewable Energy. Retrieved from PIB: http://pib.nic.in/newsite/pmreleases .aspx?mincode=28
Reddy, S., & Painuly, J. (2004). Diffusion of renewable energy technologies - barriers and stakeholders’ perspectives. Renewable Energy , 1431–1447.
REN21. (2012). Renewables 2012 Global Status Report. Paris: REN21 Secretariat. Sayigh, A. (1999). Renewable energy - the way forward. Applied Energy, 15-30.

Asia Pacific Business & Economics Perspectives, 1(1), Summer 2013
41
Swaran Singh, K. B. (1998). INDIA AND RENWABLE ENERGY : A FUTURE CHALLENGE . Renewable Energy , 16-21.
WorldBank. (2010). Data. Retrieved January 28, 2013, from Data.Worldbank: http://data.worldbank.org/indicator/EG.ELC.ACCS.ZS?order=wbapi_data_value_2009%20wbapi_data_value%20wbapi_data_value-first&sort=desc

Asia Pacific Business & Economics Perspectives, 1(1), Summer 2013
42
Response of the Philippines’ Gross Domestic Product to the Global
Financial Crisis
Cynthia P. Cudia De La Salle University Manila, Philippines [email protected]
John David C. Castillo De La Salle University Manila, Philippines [email protected]
ABSTRACT
The Philippines has been positioning itself as a country heavily dependent on the global economy by receiving remittances from overseas Filipino workers, participating in foreign direct investments, and enlarging its market for export products especially to developed countries such as the United States. This has made the Philippine economy vulnerable to changes in global trends. With the 2008 Global Financial Crisis (GFC), the economic turmoil of the United States translated to economic slowdown for most countries, including the Philippines. Employing vector auto-regression methodology, we used time series data for the period 1980 to 2012 to analyze the response of the Philippines’ Gross Domestic Product to the economic shocks associated with the GFC. Based on the impulse response to the financial crisis, the empirical results reveal the anticipated Philippines’ economic performance. The predicted responses point to derive policy implications in ensuring stability of economic growth of the Philippines such as diversifying its exports, supporting its agricultural sector, attracting investments from the Middle East, and support SMEs in the country amidst the threats of external shocks. JEL Classification: F01, F15, O24 Keywords: global financial crisis, Philippines’ GDP, exchange rate
INTRODUCTION
The economic slowdown of most countries in 2008 due to the Global Financial Crisis (GFC) was inexorably imputable to the collapse of the economy of the United States (US). Being the largest economy in the world, its economic turmoil consequently translated to economic slowdown for most countries heavily dependent on the global economy, including the Philippines. The GFC perplexed

Asia Pacific Business & Economics Perspectives, 1(1), Summer 2013
43
the economic standing of the Philippines in terms of changes in exports, remittances of Filipinos working abroad, and foreign direct investments. Likewise, the Philippine economy is exposed to movements of the foreign exchange rates.
According to 2012 International Monetary Fund Statistics, the economy of the Philippines is the 40th largest in the world and is also one of the emerging markets in the world. The Philippines has been named as one of the Tiger Club Economies together with Indonesia, Malaysia and Thailand. It has been transitioning from being one based on agriculture to services and manufacturing.
Openness in international trade is highly valuable in the Philippine economy in promoting economic growth with its continuous battle against its internal dilemmas such as political disputes, unemployment, and unsustainable increase in population. It is primarily concerned in strengthening economic partnership, to tap bigger markets for its main products such as electronics and semiconductors that are strategically beneficial in increasing its exports, consequently resulting in an increase in GDP. Historically, the export activities of the Philippines account to approximately 30 percent of its GDP (World Bank Report, 2010). The US has been its major trading partner and has served as the market for about 18 percent of total exports of the Philippines. Aside from the US, the Philippines established trading relations with the Association of Southeast Asian Nations (ASEAN) member countries namely, Japan, Hong Kong, and South Korea.
While interdependence of countries is considered to be advantageous in improving production processes, expanding open markets for final and intermediate goods, and having accessibility to inflows (e.g. providing and obtaining monetary assistance to supplement economic needs), the Philippines has also been heavily relying on the incremental income of Overseas Filipino Workers (OFWs) in augmenting its economic performance. The country has been considered as one of the top recipients of remittances.
Given that the Philippines is a developing country which is sensitive to external market, this study analyzes the response of the Philippine economy to the shocks driven by the GFC on the Philippine economy. Specifically, using vector auto-regression analysis, we examine the effect in the Philippine’ Gross Domestic Product with respect to the changes in Philippine Exports, movements of the Philippine currency in terms of exchange rate of Philippine Peso (PHP) to US Dollars (USD), and change in US GDP and US imports.
The study aims to derive policy implications in improving the economic performance of the Philippines and ensuring stability of economic growth given its exposure to the fiasco of the global economy linked to financial crisis.
LITERATURE REVIEW
The outcome of the 2008 Global Financial Crisis (GFC) proved to have a contagion effect as large financial institutions around the world that led to economic downturns experience represents a turning point in the global economy as a whole. The problems of the sub-prime lending attributed to the irrational conduct of both lenders and borrowers and the problems about the monetary and fiscal policies were considered to be the principal cause of the economic turmoil of the

Asia Pacific Business & Economics Perspectives, 1(1), Summer 2013
44
US. Moreover, the meltdown of the sub-prime mortgages was also associated with predicaments such as depressed prices of housing, continued lack of liquidity, and increased investment risk which all summed up and contributed to the downfall of US financial institutions and investment firms. The economy of the US was further aggravated by the instability of currency and crash of stock markets. In addition, US imports declined significantly as a result of the crisis which recorded an annual decrease of 34 percent starting from the last quarter of 2007 until the first quarter of 2009 (Bailey & Eliot, 2009).
As the financial and economic downturn of the US manifested, developed and developing countries have suffered in the same manner. According to the Asian Development Bank (ADB), the East Asian Economies as a result of the crisis experienced slowdown in terms of GDP growth rate and even negative growth rates. As affirmed by Yap, Reyes & Cuenca (2009), “The 2009 first and second quarter year-on-year GDP growth rates of major East Asian economies are as follows: China: 6.1 percent, 7.9 percent; Indonesia: 4.4 percent, 4 percent; Malaysia: -6.2 percent, -3.9 percent; Japan -8.7 percent, -7.2 percent; Korea: -4.3 percent, -2.7 percent; Philippines 0.6 percent, 1.5 percent; Singapore: -9.5 percent, -3.5 percent; Thailand: -7.1 percent, -4.9 percent; Viet Nam; 3.1 percent, 4.1 percent.
The decline in GDP in the ASEAN region however, was not related to its financial sector but was associated with the international trade contraction due to the decrease in world demand for goods. Thus, ASEAN member countries suffer decline in output as a result of the sharp decrease in exports as the primary markets such as the US and Europe decrease their imports.” The exports of the Philippines to US decreased significantly, marking a decline of 16 percent in 2008 (Yap, et al., 2009). In addition, generally viewed and at a global level, hypothetical but quite realistic 20 percent drop in world demand for ASEAN’s exports would be equivalent to a 15 percent drop in ASEAN’s total gross national products (Perkins, 2009).
The slowdown of the economic growth of the Philippines country was evident since GDP growth rate for 2008recorded only 3.8 percent compared to 7.1 percent growth rate recorded during 2007. Aside from the trading sector with the international market, the Philippine economy showed the decline in terms of the inflow of remittances from 18.2 percent during 2008 to 3.8 percent in the first seven months of 2009 (Yap, et al., 2009). Furthermore, cases of retrenchment and wage cut for the overseas Filipino workers were considered to be the consequences of the economic slowdown of the US and other developed countries.
METHODOLOGY
To analyze the response of Philippines’ Gross Domestic Product to the economic shocks associated with the Global Financial Crisis, we employed a Vector Autoregressive (VAR) model, culled from Cudia (2012). According to Enders (2004), this model generalizes the univariate autoregressive model to dynamic multivariate time series that is extensively used for the purposes of forecasting, structural inference, and policy analysis. The structural equation considers several

Asia Pacific Business & Economics Perspectives, 1(1), Summer 2013
45
endogenous variables, which are explained by the lagged values of all the other variables in the model. Hence, in analyzing the dynamic behavior of the time series variables, this model takes into account the lagged values of both the dependent and explanatory variables (Enders, 2004, cited in Rivera & See, 2009 and Cudia, 2012). The study utilizes the model to depict the time path of the dependent variable with respect to its prior period values (Gujarati & Porter, 2009). Moreover, the VAR approach is a-theoretic wherein the data generation process determines the model (Gujarati & Porter, 2009).
In analyzing the response of the Philippine Gross Domestic Product as a result of the Global Financial Crisis, we implement the Reduced Form VAR approach in the form of the equation expressed as:
𝑌𝑡 = 𝐴0 + ∑ 𝐴𝑘𝑝𝑘=1 𝑌𝑡−𝑘 + 𝜀𝑡 (1)
where 𝑌𝑡 is a vector of n variables, 𝐴0 is an n x 1 vector of constant terms, Ak is an n x n matrix of coefficients, 𝜀𝑡 is an n x 1 vector of stochastic error terms, and p is the order of autoregression. The lag order of the VAR (p) is set such that the error terms are not serially correlated.
Equation (1) states the current value of each m series as a weighted average of all the series in the past plus a stochastic term, 𝜀𝑡, which represents other factors that affect the series but are not explicit in the model.
The interpretation of the VAR (p) shown by the equation is normally based on its moving average representation. In addition, conducting further substitution and rearranging of a moving average signified by Equation (1) is expressed as:
𝑌𝑡 = 𝐵0 + ∑ 𝐵𝑘𝑞𝑘=1 𝜀𝑡−𝑘 + 𝜀𝑡 (2)
where 𝑌𝑡 is a vector of n variables, 𝐵0 is an n x 1 vector of constant terms, 𝐵𝑘 is an n x n matrix of coefficients, 𝜀𝑡 is an n x 1 vector of error terms, and q is the moving average order. The lag order of the VAR (q) is set such that the stochastic disturbance terms are non- auto correlated.
We specify the the length of the lag k and then estimate the 𝐴0 and 𝐵0 variables (Gujarati and Porter, 2009). For this purpose, we choose the model that gives the lowest values using the Akaike Information Criterion (AIC) or the Schwarz Information Criterion (SIC). We use Cholesky factorization (Enders, 2004) to address possible estimation problems that may arise from the presence of stochastic explanatory variables and the possibility of serial correlation that cannot be adequately identified. Data and Test Requirements
Sourced from the International Financial Statistics (IFS), this study employed the quarterly time series data for the period covering 1980 to 2012. The variables in the study include Philippine Gross Domestic Product (GDPPH), Exports of the Philippines (EXPPH), Philippine currency movement in terms of exchange rate from Philippine Peso to US Dollar (FRXPH), US Gross Domestic Product (GDPUS), and US Imports (IMPUS).
VAR analysis requires unit root testing of all the variables in the model. Hence, we implement Augmented Dickey-Fuller (ADF) Unit Root Test. Also,

Asia Pacific Business & Economics Perspectives, 1(1), Summer 2013
46
stationary is assumed to avoid spurious regressions in the time series data involved in the study.
VAR analysis also requires to establish the number of cointegrating vectors in the system. In this study, we implement Johansen Cointegration Test, which includes the λ-max test and the trace test for hypotheses on individual eigenvalues and for joint hypotheses, respectively.
Vector Auto-regression Model Specification
To analyze the response of the Philippine gross domestic product to the economic shocks associated with the Global Financial Crisis, the study estimated the Vector Autoregressive (p) model. The lowest AIC and SIC determines the optimal lag structure p of the VAR model (Gujarati, 2003).
GDPPHt = f(EXPPHt, FRXPHt, GDPUSt, IMPUSt) + 𝜀𝑡 (3) EXPPHt = f(GDPPHt, FRXPHt, GDPUSt, IMPUSt) + 𝜀𝑡 (4)
FRXPHt = f(EXPPHt, GDPPHt, GDPUSt, IMPUSt) + 𝜀𝑡 (5) GDPUSt = f(EXPPHt, GDPPHt, FRXPHt, IMPUSt) + 𝜀𝑡 (6)
IMPUSt = f(EXPPHt, GDPPHt, FRXPHt, GDPUSt) + 𝜀𝑡 (7)
RESULTS AND DISCUSSION We present the details and results of the preliminary tests, VAR estimation procedure, and Impulse Response for Equation 3 in Appendix A, Appendix B, and Appendix C respectively. We discuss the summary of the results in the succeeding sections.
Cointegration Test
The model satisfies the requirement of at least one cointegrating equation. As shown in Appendix A, cointegration test results show that at 5 percent level, there are 5 cointegrating equations and at 1 percent level, there are two cointegrating equation. Therefore, the variables are cointegrated and consequently considered to be stationary. Thus, we proceeded to VAR estimation.
VAR Estimation and Impulse Response
We summarize in this section the results of vector auto-regression analysis presented in Appendix B and Impulse Response in Appendix C, which indicate the response of Philippine Gross Domestic Product (GDPPH) to the economic shocks asssociated with the Global Financial Crisis with respect to changes on the Philippine Gross Domestic Product, Philippine currency movement in terms of exchange rate from Philippine Peso (PHP) to US Dollar (USD), US GDP, and US imports.
Response of Philippines’ Gross Domestic Product to Internal Shocks. Results indicate that the shocks affecting GDPPH are positively generated by the impact of the shocks on GDPPH itself in the future. Vector autoregression estimates indicate that GDPPH for the current period responds positively to the effect of the shock associated with GFC to GDPPH for both two quarters and a quarter ago. This

Asia Pacific Business & Economics Perspectives, 1(1), Summer 2013
47
implies that in the future, a possible decline of GDP of the Philippines brought about by an external shock would consequently lead to a decline in its GDP for the next two quarters. Response of Philippine Gross Domestic Product to Philippine Export Sector. On the export sector, results indicate that GDPPH responds positively to the impact of shock affecting the Philippine exports a quarter ago. This suggests that the country’s economy is directly and proportionately affected by the impact of GFC on its export sector. This implies that a possible decrease in its export sector during the quarter in which a shock happens would lead to the decline of GDPPH for the succeeding quarter. However, after another quarter, GDPPH responds negatively to the change in the export sector brought about by GFC. This result reveals that a decrease in demand for export products of the Philippines such as electronic products due to a shock, would only be felt by the economy at the contemporaneous period. Thereafter, we would anticipate a progressive economic growth as represented by the increase in the GDP. The decrease in exports could be counterbalanced by other sectors in the economy such as sustained growth on construction, infrastructure and manufacturing sectors, and continuing remittances from overseas Filipino workers.
Response of Philippines’ Gross Domestic Product to Philippine Currency Movement. Results indicate that after a quarter when a shock happens, Philippine GDP responds negatively to the impact of the shock to Philippine currency movement in terms of exchange rate from PHP to USD. This implies that the the Philippine currency affected by an external shock such as GFC would not significantly influence the country’s economy immediately after the crisis. However, VAR analysis revealed that this variation in Philippines’ GDP is only at the contemporaneous period. GDPPH responds positively to the impact of the GFC to the Philippine currency after two quarters in which the shock happens. Depreciation of PHP due to a shock would lead to a decline in Philippine GDP. The result suggests that the response after two quarters indicate a lag effect as to its impact on GDP. Response of Philippine Gross Domestic Product to GDP of the US. Results show that the Philippines’ GDP responds positively to the impact of the GFC affecting the GDP of the US a quarter after the shock happens. Thus, a decline in the economy of the US due to a shock that happens a quarter ago would lead a decline in the Philippine GDP for the current quarter. On the other hand, the shock affecting the economy of the US would have a negative impact on the GDPPH two quarters after the shock happens. This indicates that although the Philippines is heavily dependent on the US in terms of exports and remittances, which would result in the downturn of the Philippine economy if the economy of the US collapses, the Philippines would be able to recover after two quarters due to its reforms in terms of the financial sector and its initiatives to diversify its exports, support its agricultural sector, attract investments from the Middle East, and support SMEs in the country. Thus, the decrease of the GDP of the Philippines would only have an instantaneous and short term effect to the GDP of the US

Asia Pacific Business & Economics Perspectives, 1(1), Summer 2013
48
since the economy of the US is primarily independent from the economy of the Philippines. Response of Philippine Gross Domestic Product to the Imports of the US. Results indicate that the shock affecting the imports of the US a quarter ago has a positive impact on the current Philippine’ GDP. This implies that a decrease of US imports during a quarter due to a shock would also mean a decrease in GDPPH for the next quarter. The decline in imports of the US due to a shock would have an initial impact on the Philippine economy since the US is considered as one of the largest markets of Philippine commodities. Philippines ranked the 36th largest supplier to the US of semiconductors and electronic parts. On the other hand, the shock affecting the imports of the US has a negative impact on the Philippines’ GDP two quarters after the shock. This means that the change in the flow of imports to the US as affected by a shock would have an inverse effect on the Philippine GDP for the current period. For instance, a decrease in imports of the US two quarters ago due to the GFC would mean an increase in the Philippines’ GDP for the current quarter. This negative response can be attributable to the initiative of the Philippine government to diversify not only its products but also the markets for its goods. The Philippines would be able to hedge the effects of the downturn in the demand of the products of the US, leading to an improvement in the GDPPH two quarters following the quarter period of the shock.
CONCLUSIONS
The Philippines has been positioning itself as a country dependent on the global economy by receiving external remittances, participating in foreign direct investments, and enlarging its market for export products especially to developed countries such as the US, which made the Philippine economy vulnerable to changes in global trends. With the 2008 Global Financial Crisis (GFC), the economic turmoil of the US translated to economic slowdown for most countries, including the Philippines.
Using vector autoregression analysis (VAR) and impulse-response functions, this study empirically analyzes the response of the Philippines’ Gross Domestic Product to the economic shocks associated with the GFC with respect to the changes on the Philippine exports, Philippine currency movement in terms of exchange rate from PHP to USD, US GDP, and US imports since US is a major trading partner of the Philippines. It is important to note that the VAR analysis and impulse-response functions rely on what the data demonstrate in terms of trend and behavior. The dynamics of the market is reflected in the data. The analysis is grounded on a transmission mechanism among economic variables. Time lags and the process, through which all economic variables affect each other, one way or another, characterize the transmission mechanism.
Results of our study reveal that the Philippines’ GDP responds positively to the effect of the shock associated with the GFC to the Philippine economy itself in the next two quarters following a shock. This implies that a possible decrease in Philippines’ GDP following the quarter in which a shock happens would lead to the decline of GDPPH for the succeeding quarter as revealed by the data patterns.

Asia Pacific Business & Economics Perspectives, 1(1), Summer 2013
49
Similarly, GDPPH responds positively to the impact of GFC on the export sector of the country a quarter following the period of shock. However, the significant positive response only posits temporarily as a decrease in export sector activities would have an inverse effect as represented by the increase in the GDP after another quarter. The progressive economic growth could be attributed to the volatility arising from the trend in the global market and other factors affecting GDP rate such as sustained growth on construction, infrastructure and manufacturing sectors, along with continuing remittance from overseas Filipino workers that is noted to be a constant growth driver.
Meanwhile, the results indicate that the Philippines’ GDP responds negatively to the shock affecting the Philippine currency movement in terms of exchange rate from PHP to USD. Variations in the exchange rates would result inversely on the Philippine economy at initial period following the shock. However, two quarters after the shock, results show a reverse response as depreciation of PHP would signify a decline in Philippines’ GDP. The results suggest that the response two quarters after a shock indicate a lag effect as to its impact on GDP.
Results reveal a positive response of the Philippines’ GDP to the impact of GFC affecting the GDP of the US. This denotes that the effect of shock on the economy of the US would imply the economy of the Philippines gearing towards the same direction at initial periods. This change in the GDPUS due to a shock would only have an instantaneous and short term effect to GDPPH as the Philippines would be able to recover on its own at some point, specifically after two quarters.
Furthermore, results indicate that the Philippines’ GDP responds positively to the impact of GFC to the imports of the US at initial periods. However, an inverse effect would be felt after two quarters following the quarter in which the shock happens as Philippine economy would respond negatively. This suggests that the Philippines would be able to surge again through diversification of its products and markets for its goods to other countries while converging with other main drivers of growth such as manufacturing and services.
RECOMMENDATIONS
The Philippine economy has already demonstrated its robustness in the face of external shocks. Despite the past threats from external shocks, the country has exhibited to be resilient given that the economy is significantly relying on external remittances, foreign direct investments, and exports. This translates to susceptibility of the economy to the changes in global trend. The VAR analysis and impulse-response function is deemed the appropriate methodology because we can capture what the data speaks for itself. We are able to make an analysis on how macroeconomic variables behave given stimulus that is captured by data. Consequently, based on the results of the impulse-response of the Philippine economy to the financial crisis, we suggest protecting the vulnerable sectors such as its export sector that affect the Philippines’ GDP in response to the economic shocks. We propose protecting this sector through enhancing

Asia Pacific Business & Economics Perspectives, 1(1), Summer 2013
50
competitiveness and expanding its trading relationships with existing and prospective partners. Likewise, we suggest counterbalancing the effect of shocks such as decline in exports to industrialized countries by creating programs to promote greater domestic demand and intra-regional trade that will stimulate the economy to ensure sustainable growth. Furthermore, we suggest promoting further the development of domestic financial markets to attract foreign investments. This would reduce foreign currency borrowing and the economy’s risk exposure to currency variances as a result of shocks affecting Philippine currency movement. Further studies can explore the use of structural vector auto-regression (SVAR) to see more robust results.
REFERENCES Baily, M.N. & Elliott, D. (2009). The US Financial Crisis: Where Does It Stand and
Where Do We Go From Here?. Initiative on Business Policy and Public Brooking.
Cudia, C. (2012). The Effect of Global Financial Crisis on the Philippines’ Export Sector: A Vector Auto-Regression Analysis. Journal of International Business Research, vol.11, Special Issue, No.2, 2012, ISSN 1544-0222.
Enders, W. (2004). Applied Econometric Time Series, 2nd Edition. John Wiley and Sons, Inc.
Gujarati, D., & Porter, D. (2009). Basic Econometrics 5th Edition. Singapore: McGraw-Hill Companies, Inc
Perkins, D. (2009): Regional Study, “The Global Economic Crisis and the Development of Southeast Asia”. Strategic Asia 2009-10. 2009 National Bureau of Asian Research.
Rivera, J.P. & See, K.G (2009). The Economic Implications of China’s Open Door Policy to the Asia-Pacific Economies. De La Salle University, Manila.
World Bank Annual Report, 2010. ISBN/ISSN No. 97080821383766. Retrieved from http://preventionweb.net/go/15927.
Yap, J., Reyes, C. & Cuenca. (2009): “Impact of the Global Financial and Economic Crisis on the Philippines." PIDS Discussion Paper 2009-30.
APPENDICES
Appendix A Johansen Cointegration Test Included observations: 124 after adjusting endpoints Trend assumption: Linear deterministic trend Unrestricted Cointegration Rank Test
Hypothesized Trace 5 Percent 1 Percent No. of CE(s) Eigenvalue Statistic Critical Value Critical Value
None ** 0.227711 86.66755 68.52 76.07 At most 1 ** 0.165899 54.62638 47.21 54.46 At most 2 * 0.118529 32.13276 29.68 35.65

Asia Pacific Business & Economics Perspectives, 1(1), Summer 2013
51
At most 3 * 0.090037 16.48846 15.41 20.04 At most 4 * 0.037884 4.788957 3.76 6.65
*(**) denotes rejection of the hypothesis at the 5%(1%) level Trace test indicates 5 cointegrating equation(s) at the 5% level Trace test indicates 2 cointegrating equation(s) at the 1% level Hypothesized Max-Eigen 5 Percent 1 Percent No. of CE(s) Eigenvalue Statistic Critical Value Critical Value
None 0.227711 32.04116 33.46 38.77 At most 1 0.165899 22.49363 27.07 32.24 At most 2 0.118529 15.64430 20.97 25.52 At most 3 0.090037 11.69950 14.07 18.63
At most 4 * 0.037884 4.788957 3.76 6.65
*(**) denotes rejection of the hypothesis at the 5%(1%) level Max-eigenvalue test indicates no cointegration at both 5% and 1% levels
Unrestricted Cointegrating Coefficients (normalized by b'*S11*b=I):
GDPPH EXPPH FRXPH GDPUS IMPUS -0.023778 0.008295 -0.004479 3.27E-05 7.56E-05 0.007084 -0.009637 -0.010238 0.000537 -2.39E-05 -0.000788 -0.013630 -0.003420 -0.001823 6.97E-05 0.007970 0.017737 -0.018309 -0.003127 -2.03E-06 -0.000815 -0.021689 0.000695 0.000780 1.79E-05
Unrestricted Adjustment Coefficients (alpha):
D(GDPPH) 7.152820 -1.107584 1.304471 -6.711968 -4.305700 D(EXPPH) -0.927018 2.465755 -4.080782 -3.790623 1.388547 D(FRXPH) 2.933366 6.885654 1.050894 1.642231 -0.469559 D(GDPUS) 5.338246 -1.781842 -13.52983 3.819417 -6.671026 D(IMPUS) -1702.697 1030.297 -838.8421 -478.8381 -940.7254
1 Cointegrating Equation(s): Log likelihood -3607.924
Normalized cointegrating coefficients (std.err. in parentheses) GDPPH EXPPH FRXPH GDPUS IMPUS
1.000000 -0.348859 0.188352 -0.001376 -0.003179 (0.25652) (0.16350) (0.02801) (0.00056)
Adjustment coefficients (std.err. in parentheses) D(GDPPH) -0.170083
(0.08105) D(EXPPH) 0.022043
(0.04653) D(FRXPH) -0.069751
(0.04468) D(GDPUS) -0.126935
(0.12889) D(IMPUS) 40.48753
(16.3245)

Asia Pacific Business & Economics Perspectives, 1(1), Summer 2013
52
2 Cointegrating Equation(s): Log likelihood -3596.677
Normalized cointegrating coefficients (std.err. in parentheses) GDPPH EXPPH FRXPH GDPUS IMPUS
1.000000 0.000000 0.751786 -0.028009 -0.003113 (0.29879) (0.04864) (0.00102)
0.000000 1.000000 1.615079 -0.076344 0.000189 (0.63795) (0.10386) (0.00219)
Adjustment coefficients (std.err. in parentheses) D(GDPPH) -0.177929 0.070008
(0.08452) (0.04332) D(EXPPH) 0.039510 -0.031451
(0.04817) (0.02469) D(FRXPH) -0.020975 -0.042021
(0.04344) (0.02226) D(GDPUS) -0.139557 0.061453
(0.13442) (0.06889) D(IMPUS) 47.78582 -24.05294
(16.8443) (8.63235)
3 Cointegrating Equation(s): Log likelihood -3588.855
Normalized cointegrating coefficients (std.err. in parentheses) GDPPH EXPPH FRXPH GDPUS IMPUS
1.000000 0.000000 0.000000 0.085065 -0.005848 (0.03334) (0.00076)
0.000000 1.000000 0.000000 0.166576 -0.005688 (0.05750) (0.00131)
0.000000 0.000000 1.000000 -0.150408 0.003639 (0.06665) (0.00152)
Adjustment coefficients (std.err. in parentheses) D(GDPPH) -0.178957 0.052229 -0.025157
(0.08451) (0.06345) (0.03978) D(EXPPH) 0.042725 0.024168 -0.007138
(0.04714) (0.03540) (0.02219) D(FRXPH) -0.021803 -0.056344 -0.087230
(0.04338) (0.03258) (0.02042) D(GDPUS) -0.128898 0.245858 0.040604
(0.13031) (0.09785) (0.06135) D(IMPUS) 48.44668 -12.61993 -0.053986
(16.7262) (12.5595) (7.87451)
4 Cointegrating Equation(s): Log likelihood -3583.005
Normalized cointegrating coefficients (std.err. in parentheses) GDPPH EXPPH FRXPH GDPUS IMPUS
1.000000 0.000000 0.000000 0.000000 -0.003952 (6.6E-05)
0.000000 1.000000 0.000000 0.000000 -0.001974 (9.5E-05)
0.000000 0.000000 1.000000 0.000000 0.000286 (0.00012)
0.000000 0.000000 0.000000 1.000000 -0.022293

Asia Pacific Business & Economics Perspectives, 1(1), Summer 2013
53
(0.00082)
Adjustment coefficients (std.err. in parentheses) D(GDPPH) -0.232450 -0.066824 0.097734 0.018248
(0.08705) (0.08591) (0.07252) (0.01222) D(EXPPH) 0.012514 -0.043068 0.062265 0.020587
(0.04853) (0.04790) (0.04043) (0.00681) D(FRXPH) -0.008715 -0.027215 -0.117298 -0.003255
(0.04537) (0.04477) (0.03780) (0.00637) D(GDPUS) -0.098458 0.313605 -0.029326 0.011939
(0.13650) (0.13472) (0.11373) (0.01916) D(IMPUS) 44.63043 -21.11325 8.713149 3.524335
(17.5236) (17.2942) (14.5994) (2.45953)
Appendix B Vector Autoregression Estimates Date: 01/02/14 Time: 12:35 Sample(adjusted): 1981:2 2012:4 Included observations: 127 after adjusting endpoints Standard errors in ( ) & t-statistics in [ ]
GDPPH EXPPH FRXPH GDPUS IMPUS
GDPPH(-1) 0.097800 -0.155215 0.013092 -0.017383 -75.27808 (0.08952) (0.03561) (0.02753) (0.08323) (12.2319) [ 1.09247] [-4.35824] [ 0.47556] [-0.20886] [-6.15424]
GDPPH(-2) 0.561508 0.089472 -0.003915 -0.178169 78.14050 (0.08641) (0.03438) (0.02657) (0.08034) (11.8074) [ 6.49785] [ 2.60258] [-0.14733] [-2.21773] [ 6.61794]
EXPPH(-1) 0.884220 0.748954 -0.065972 0.220061 22.69949 (0.24993) (0.09943) (0.07686) (0.23235) (34.1489) [ 3.53794] [ 7.53271] [-0.85837] [ 0.94710] [ 0.66472]
EXPPH(-2) -0.929457 0.098946 0.032160 0.314865 -19.88612 (0.25772) (0.10253) (0.07926) (0.23960) (35.2143) [-3.60642] [ 0.96506] [ 0.40578] [ 1.31412] [-0.56472]
FRXPH(-1) -0.179031 -0.055844 0.722461 0.032780 -38.04142 (0.29803) (0.11856) (0.09165) (0.27708) (40.7221) [-0.60071] [-0.47100] [ 7.88271] [ 0.11831] [-0.93417]
FRXPH(-2) 0.265235 0.152375 0.202145 -0.071753 53.19432 (0.29355) (0.11678) (0.09027) (0.27291) (40.1097) [ 0.90354] [ 1.30478] [ 2.23926] [-0.26292] [ 1.32622]
GDPUS(-1) 0.018563 -0.026202 0.016162 1.133675 36.54273 (0.10090) (0.04014) (0.03103) (0.09380) (13.7864) [ 0.18397] [-0.65276] [ 0.52088] [ 12.0856] [ 2.65063]
GDPUS(-2) -0.010047 0.053877 -0.016298 -0.119666 -30.63584 (0.10160) (0.04042) (0.03124) (0.09446) (13.8822)

Asia Pacific Business & Economics Perspectives, 1(1), Summer 2013
54
[-0.09888] [ 1.33298] [-0.52164] [-1.26690] [-2.20685]
IMPUS(-1) 0.001729 0.000837 -9.06E-05 0.000514 1.104542 (0.00076) (0.00030) (0.00023) (0.00071) (0.10383) [ 2.27572] [ 2.76962] [-0.38783] [ 0.72748] [ 10.6379]
IMPUS(-2) -0.000422 -0.000907 0.000107 -0.001040 -0.240359 (0.00079) (0.00031) (0.00024) (0.00073) (0.10746) [-0.53676] [-2.89823] [ 0.44270] [-1.42199] [-2.23679]
C -131.5225 -126.3549 8.465728 70.94130 -20417.66 (89.0923) (35.4432) (27.3978) (82.8280) (12173.3) [-1.47625] [-3.56499] [ 0.30899] [ 0.85649] [-1.67726]
R-squared 0.991465 0.992841 0.974345 0.999782 0.997539 Adj. R-squared 0.990730 0.992223 0.972133 0.999763 0.997326 Sum sq. resids 432139.6 68392.89 40867.24 373506.5 8.07E+09 S.E. equation 61.03557 24.28155 18.76976 56.74401 8339.687 F-statistic 1347.576 1608.651 440.5464 53093.19 4701.292 Log likelihood -696.6073 -579.5463 -546.8476 -687.3482 -1321.107 Akaike AIC 11.14342 9.299942 8.785002 10.99761 20.97807 Schwarz SC 11.38977 9.546289 9.031349 11.24396 21.22442 Mean dependent 783.7464 329.1824 169.2835 8586.684 259494.9 S.D. dependent 633.9216 275.3483 112.4379 3683.847 161290.3
Determinant Residual Covariance
9.78E+19
Log Likelihood (d.f. adjusted) -3823.921 Akaike Information Criteria 61.08537 Schwarz Criteria 62.31711 Appendix C

Asia Pacific Business & Economics Perspectives, 1(1), Summer 2013
55
The attributes of Thai product quality, measurement, and validity
Pajaree Ackaradejruangsri Ritsumeikan Asia Pacific University Beppu, Oita, Japan [email protected]
. ABSTRACT
Product quality is subjective, very difficult to define and fairly undervalued by firms. This is mainly because there are very few studies about appropriate measurements and applicable methods in evaluating various types of product quality. This research proposes new product attributes particularly for measuring Thai product quality in three different product categories: electronics/IT products, automobile, and home appliance; and test for its validity. This research applies content analysis and statistics test by converting 86 of those three product categories reviewed from Thailand’s well-known public brands into a 5-point scale on overall product quality and 11-point scale on the proposed product attributes. These attributes are “Function”, “Ease of Use”, “Reliability”, “Durability”, “Design”, “Eco-Friendliness”, “Customer Satisfaction”, “Support Service”, “Value for Money”, and “Adaptability”. The results show high correlations and significant effects of attributes on overall Thai product quality, especially on automobile and electronics/IT products. Moreover, these proposed attributes also test the validity measurements of similar types of products. JEL Classification: L1, L15 Keywords: product quality, attribute, public reviews, content analysis
INTRODUCTION In many economics and marketing models, a product is usually described in a simple dimension of “quality”, and according to many studies, consumers are willing to pay for those premiums when a product is perceived as having “high quality” (Maynes, 1976; Olson, 1977). However, there is a research gap on aggregation and differentiation whether the product is of high quality or low quality, and its corresponding measurement methodology. Since the 1950s, Leavitt (1954) examined the relevance of price on product quality. His study was one of the earliest to indicate that consumers were likely inclined to use price as an indicator. Accordingly, numerous studies also tried to examine the correlation between price and product quality in various statistical tests. Many qualitative reviews suggest that there is a positive relationship or high correlation between price and perceptions of quality for certain products and within certain price ranges (Monroe, 1973, 1977; Monroe & Dodds, 1988; Monroe

Asia Pacific Business & Economics Perspectives, 1(1), Summer 2013
56
& Krishnan 1985; Olson 1977; Peterson & Wilson 1985; Rao & Monroe 1988; Zeithaml, 1988). In addition, the result of Rao and Monroe’s study in 1989 confirmed that besides price, brand and store name also have statistically significant positive relationship with consumers’ perceptions of product quality. However, are price, brand name, and store name the only measures of product quality? Is there an alternative measurement in evaluating product quality? Are there underlying attributes that validly explain product quality measurement? These remain to be answered in this paper. I suggest a simple and practical method in measuring product quality and aim to answer the following: What are the product quality attributes in Thailand? How are these measured? Are these product quality attributes measurable and validly applicable to various types of product categories? This research examines previous empirical studies to see what were attributes scholars and researchers used for measuring product quality. Based on that, I propose the attributes specifically for Thailand. Moreover, I assess the country’s top and most reliable public reviews in three product categories: electronics & IT products, automobile, and home appliances. The product quality review scores are then converted into an 11-point scale to test and verify the relationship between the proposed attributes and product quality. The results show the effects of attributes on Thai product quality, measurement and its validity. This research will be a useful guideline for applying product quality measurement and evaluation method to benefit similar Asian products.
REVIEW OF RELATED LITERATURE
Relative Importance of Previous Studies Perception of product quality is undeniably difficult to define and measure.
Under the hedonic view, there is no such measurement of product quality, since it is rather inconsistent to directly combine and pull the various elements and characteristics together (Triplett, 1976). However, many economists deemed that measuring product quality can be done through a process comparable to -how Gross National Product (GNP) is measured, in which apples and oranges (attributes of product quality) can be combined into an aggregate notion called “fruit” (product quality). It is, therefore, rational to physically value individual fruit (attributes) and aggregate it as the overall evaluation and measurement of real GNP of fruits (product quality measurement). Hence, by combining various attributes, product quality could be ideally aggregated and measured.
In 1961, Adelman and Griliches proposed, “the quality of a commodity be regarded as a composite of different characteristics”. The characteristics in their context were referred to as durability, reliability, workmanship, and other utilities that give multiple benefits to a commodity. Furthermore, Maynes (1976) also ratified that product quality could be assessed for a variety of a product combinations, when the characteristics of a seller is taken into consideration. In addition, Olson (1973) revealed that normative consumers use a variety of cues to infer product quality. These include extrinsic cues such as price, brand name, and store name as well as intrinsic cues such as utilities or abilities of a product. In my previous study on Thai consumers’ perception, Defining Thai Product Quality in

Asia Pacific Business & Economics Perspectives, 1(1), Summer 2013
57
the 21st Century, I detailed the composite product attributes, i.e. function, ease of use, reliability, durability, and many related attribution factors that have positive influence on buying decisions (Ackaradejruangsri, 2012). Therefore, as numerous product quality perceptions findings uphold the view, product quality may be considered as a multidimensional construct and the use of multiple attributes as independent variables is feasible and essential for this empirical test. Heterogeneity of Tastes, Imperfect Information, and Reviewed Quality Many researchers and marketers strongly assert that consumers have different preferences and diverse tastes, at various dimensions (Hjorth-Annderson, 1984; Kamakura et al. 1988). Researchers and marketers assume that there is no single expert who could possibly grade the quality of products with no ambiguity, since he or she would not be able to come up with a valid scale that could capture all consumers for a wide array of products. Consider two individual consumers (I and II) who are asked to choose between two different features (A and B) of a product, which has only two characteristics (x and y). Assume further that the proportions of characteristics x and y in feature A are different from the combination of x and y found in feature B, yet both A and B are offered at the same price, and other characteristics and conditions other than x and y are identical. After individual evaluation, individual I prefers A to B, while individual II prefers B to A. Eventually, there is no ultimate explanation why individual I prefer A than B, and the same thing for individual II, unless interpersonal comparisons and in-depth analysis were made. This kind of consumers’ differences in taste additionally makes consistent product quality measurement much more complicated. In addition under an efficient market, several evidences suggest that consumers are imperfectly informed of product quality and cannot assess product quality review immediately (Nelson, 1970; Tellis & Wernerfelt, 1987). Different markets across all ranges of products have different speeds of product take off (Tellis & Chandrasekaran, 2008). Compellingly, the information about a new product will also take some time to reach a market before it will be ready for selling. Relative Importance of Attribute Dimensions of Product Quality Research on valid multiple attributes of product quality in marketing and product engineering rarely exists, but there is one that has a great impact on a product’s success in the marketplace - the eight dimensions proposed by Garvin (1984). His study suggests performance, feature, reliability, conformance, durability, serviceability, aesthetics, and perceived quality, as the basic elements of product quality. Each of these dimensions is independent as well as distinct, and could be ranked as high or low. Moreover, several marketing research and studies, including Tellis and Johnson (2007), commonly applied these similar terms and dimensions of product quality on capturing and rating products. However, there is no definite composite attributes of product quality that is applicable to all. In general, when referring to technology-based products, i.e, IT products, automobiles, as well as electronic appliances, the most important attributes

Asia Pacific Business & Economics Perspectives, 1(1), Summer 2013
58
regarding quality would commonly be utility, usability, reliability, durability, feature, and value for money. In technology-based products, firms are continuously and competitively introducing new products into the market. However, consumers do not purchase new products immediately. They initially compare existing products and do a cost-benefit analysis before making their final buying decision. At this point, the cognitive analysis of utility, performance, and compatibility among the new, old, and current product is important for consumers. Second, new products tend to develop through further advancements in technology; they often come with unfamiliar and complex parts that are not user friendly. Consumers need time to explore and figure out the way to use the product. Thus, user friendliness is a very important dimension of product quality. Third, as there are varieties of new generation products offered by many producers in the market, there is intense competition and pressure among firms to deliver new products in a short time span. Even if new products proliferate in the market, consumers are still concerned about reliability and durability which are important product quality attributes. They most likely prefer to buy products from a reliable maker and these should be durable over a long period of time. Fourth, firms recently pay high attention not only in software but also in hardware; the new products come out in many varieties and creative designs. It is undeniable that the first impression on product appearance somehow has an influence on consumer decision. Therefore, feature is an important attribute for consumer evaluation on product quality. Fifth, many empirical studies suggested consumers more likely use price as an indicator of product quality. Furthermore, other dimensions such as energy efficiency or eco-friendliness, especially for cars and electronic devices, support service, adaptability, and even overall satisfaction are also important dimensions that are widely used by consumers in evaluating product quality (Ackaradejruangsri, 2012). Literature points that utility, usability, reliability, durability, feature, value for money, eco-friendliness, overall satisfaction, support service, and adaptability are generally used and are proven to be feasible measures of attributes of product quality. For the purpose of this research, those dimensions and terms have been revised. Thus, the proposed composite attributes particularly for Thai products and consumers would be function, ease of use, reliability, durability, design, eco-friendliness, customer satisfaction, support service, value for money, and adaptability. These attributes are described in Appendix A.
METHODOLOGY Hypothesis According to literature, suppose that consumers differ in tastes and there is imperfect information, then a measurement of composite product quality would have no particular relationship to any underlying attributes of product quality reviewed. Therefore, the following is our null hypothesis:

Asia Pacific Business & Economics Perspectives, 1(1), Summer 2013
59
Hypothesis H0: A composite measurement of product quality (Thai product quality) obtained from public reviews of new launching product will bear no relationship to the underlying proposed product quality attributes. If the above null hypothesis is true, then the underlying proposed product quality attributes could not represent and cannot be the determinant for measuring Thai product quality. It might also be invalid to measure general product quality. However, there are strong arguments that in such event, experts who have specialty knowledge with explicit resources could sample products, give personal evaluations based on valid and various dimensions, and publish reviews before consumers could actually assess the products. Henceforth, the previous uninformed consumers are now informed, and to some extent rely their purchasing decision on those public reviews. This kind of extensive demand for public reviews and ratings of products, especially electronic products in computer and IT magazines as well as on the internet, suggests that such public reviews and ratings employ relatively significant influence on the market values (Mayzlin, 2006; Moorman et al. 2005; Eliashberg & Shugan, 1997). If the above argument is valid, the alternative hypothesis against H0 is: Hypothesis HA0: A composite measurement of product quality (Thai product quality) obtained from public reviews of new launching product will have a positive relationship to the underlying proposed product quality attributes. Research Context Firms typically do not rate or release their product quality information to the market because it is inappropriate to judge products from the producers’ perspective. To avoid this bias, a possible solution is to assess public reviews. There are numerous public reviews available in the market, mostly in electronics and IT products, automobile, and in small home appliances. In Thailand, product reviews are regularly subscribed as a part or a sub-section in magazines, periodicals, or in business journals. They issue weekly, monthly, or quarterly editions in print and online. As Thai consumers become more informed with new product releases, there is growing demand for information. This research focuses on three product categories; electronics & IT products, automobiles, and home appliances. Electronics & IT products are limited to mobile phones, computers, laptops, and tablets, while home appliances are limited to televisions, refrigerators, washing machines, and air conditioners. For this research, the samples consist of product quality reviews in the three product categories: electronics & IT products quality in PC Today, automobile in Headlight Magazine, and home appliance in CE Mart. The reviews were assessed from January 2011 to December 2012. All the issues are collected in relation to the three product categories. No single review has been omitted, unless the reviews were out of the research focus. Measuring Product Quality Data

Asia Pacific Business & Economics Perspectives, 1(1), Summer 2013
60
To verify the relationship between the proposed attributes and Thai product quality, I collected product quality reviews and converted them into a product quality score and the proposed product quality attributes. Since most of the public reviews, including PC Today, Headlight Magazine, and CE Mart, do not publish their product quality reviews in numbers, I applied a content analysis1 by Tellis et al. (2007) with some adjustments. Applying a content analysis of product quality reviews, I converted the concluding remark of each review into numerical scores. I initially developed a set of terms that reviewers use to describe these products; electronics & IT products, automobile, and home appliance, then grouped these terms into a 5-point scale, ranging from 1 to 5, with 1 as the lowest score represented by “unacceptable”; and 5 as the highest score represented by “excellent”. The content analysis outline for grading overall of product quality reviews from public reviews is described in Appendix B. To further verify, I also converted the product quality data (the descriptive of product quality reviews) from three public sources into an 11-point scale, rating from 0 to 10, which 0 is the lowest score represented “completely dissatisfied” and 10 is the highest score represented “completely satisfied”, into the proposed attributes. Appendix C illustrates the guideline for grading product quality reviews from the public reviews into each attribute. Note that to avoid many 0s from product reviews when reviewers did not mention these attributes, I substituted that value with the average scale at 5 point, with neither satisfied nor dissatisfied. Hence, after obtaining the scores, the following regression model was developed: Product Qualityi = γ0 + γf Fuctioni + γe Ease of Usei + γr Reliabiltyi + γdu Durabilityi + γde Designi + γeco Eco-friendlyi+ γs Satisfactioni + γsv Servicei + γm Moneyi + γa
Adaptabilityi + µi Where the γs are coefficients to be estimated for each of corresponding attributes of product quality, the µis are error terms principally assumed to be identical and independent following a normal distribution. By regressing the overall product quality scores on the proposed attributes, I expected to see a high or low correlation that would clarify the relationship and the effect of attributes on Thai product quality.
RESULTS AND DATA ANALYSIS 86 product quality reviews were identified and broken down into 38 reviews in electronic/IT products, 30 reviews in automobile, and 18 reviews in home appliance. Recall that the measurement of these product quality reviews is coded through a 5-point scale for overall product quality and 11-point scale for
1 Content analysis or textual analysis is a methodology in the social sciences for studying the content of communication. This research technique intends to use for making inferences by systematically and objectively identifying specified characteristics within text (Neuendorf, 2002).

Asia Pacific Business & Economics Perspectives, 1(1), Summer 2013
61
attributes. The results of the three categories of product quality and their regressions are presented as follows. Table 1: Regression of overall electronics / IT product quality on its attribute
Variables Coefficients Std. error p-value H0 (5%) reject? Intercept -0.22 0.35 0.54 No Function 0.10 0.04 0.02 Yes Ease of use 0.07 0.02 0.00 Yes Reliability 0.07 0.03 0.03 Yes Durability 0.03 0.05 0.54 No Design 0.06 0.03 0.04 Yes Eco-friendliness -0.06 0.05 0.25 No Customer satisfaction 0.14 0.04 0.00 Yes Support service -0.02 0.06 0.71 No Value for money 0.05 0.02 0.04 Yes Adaptability 0.05 0.02 0.07 No Note: R = 0.98; R-square = 0.96; Std. error = 0.07; n = 38 The results in Table 1 show that the correlation coefficient or R for the 38 reviews of electronics/IT products is 0.98, and the coefficient of determination or R2 is 0.96. This very high R2 points that the total attributes could vividly explain the linear relationship with the overall electronics & IT product quality. Moreover, most of the attributes establishes significant effects on overall electronics & IT product quality. Two out of ten attributes, which seemingly are ease of use and customer satisfaction, have strong coefficients at 0.07 and 0.14 with seemingly perfect effects of p-value at 0.00. Other attributes including function, reliability, and design also have substantial effects with strong coefficients at 0.10, 0.07, and 0.06 respectively on overall electronics/IT product quality. However, adaptability, eco-friendliness, and particularly durability and support service attributes to some extent have less effects and have relatively weak/negative coefficients with overall electronics/IT product quality. Table 2: Regression of overall automobile product quality on its attributes
Variables Coefficients Std. error p-value H0 (5%) reject? Intercept -0.4 0.18 0.04 Yes Function 0.03 0.03 0.21 No Ease of use 0.07 0.02 0.00 Yes Reliability 0.10 0.02 0.00 Yes Durability 0.02 0.02 0.44 No Design 0.04 0.01 0.01 Yes Eco-friendliness 0.06 0.01 0.00 Yes Customer satisfaction 0.14 0.03 0.00 Yes Support service 0.00 0.01 0.46 No Value for money 0.07 0.01 0.00 Yes Adaptability 0.00 0.01 0.71 No Note: R = 0.99; R-square = 0.99; Std. error = 0.03; n = 30
In the foregoing, the results in Table 2 also show comparable significant results. The correlation coefficient or R for the 30 reviews of automobile product quality is 0.99, and the coefficient of determination or R2 is at 0.99. Again, this is a

Asia Pacific Business & Economics Perspectives, 1(1), Summer 2013
62
very high R2 which significantly implies that 99 percent of the total attributes of automobile product quality can be strongly explained by the linear relationship between them. Furthermore, almost all of the attributes appear to have significant effects on automobile product quality. To clarify, five out of ten attributes, which are ease of use, reliability, eco-friendliness, customer satisfaction, and value for money have perfect effects that are significantly different from 0 (p-value = 0) with high coefficients at 0.07, 0.10, 0.06, 0.14, and 0.07 respectively. In addition, design attribute has a very strong effect on automobile quality with its coefficient relatively high at 0.04 and its p-value significant at 0.01. Nonetheless, the other four attributes including function, durability, support service, and adaptability are proven to have somewhat less effects and low coefficients on automobile product quality. Table 3: Regression of overall home appliance product quality on its attributes
Variables Coefficients Std. error p-value H0 (5%) reject? Intercept 0.37 0.76 0.64 No Function -0.05 0.09 0.59 No Ease of use -0.01 0.16 0.94 No Reliability 0.24 0.10 0.05 Yes Durability -0.08 0.09 0.38 No Design 0.13 0.05 0.05 Yes Eco-friendliness -0.04 0.03 0.27 No Customer satisfaction 0.43 0.15 0.03 Yes Support service 0.00 0.06 0.97 No Value for money -0.12 0.13 0.39 No Adaptability -0.04 0.03 0.24 No
Note: R = 0.98; R-square = 0.96; Std. error = 0.08; n = 18
As expected, the result in Table 3 also illustrates compatible outcomes with the previous two product qualities’ regressions. The correlation coefficient or R for the 18 reviews of home appliance product quality is 0.98, and the coefficient of determination or R2 is 0.96. Although, R2 is very significant at 96 percent, the correlation between the total attributes and overall home appliance product quality appears to be relatively insignificant due to relatively high p-values of many attributes. Only three attributes of reliability, design, and customer satisfaction have strong effects with high coefficients at 0.24, 0.13, and 0.43 respectively on home appliance quality, whereas, the other seven of attributes, including function, durability, eco-friendliness, value for money, adaptability, and particularly ease of use and support service have comparatively weak effects and mostly negative coefficients with high p-values on home appliance product quality. However, the overall results of the simple regression at the confidence level or D at 0.05 evidences that there are strongly positive and significant relationships of the proposed attributes on the overall of product quality of electronics & IT products, automobile, and home appliance. To probe further, I applied the multiple regressions on these three product categories, and the results such as the sizes and significances of correlation coefficient and coefficient of determination of the multiple regression are very similar and do not change much from the simple regression. This clearly identifies and confirms that there is

Asia Pacific Business & Economics Perspectives, 1(1), Summer 2013
63
high correlation between the proposed attributes on the three focused product quality. It signifies the proposed ten attributes represent relatively independent aspects of the overall of product quality, remarkably in automobile and electronics/IT products. Furthermore, the reviewers in three leading public reviews; PC Today, Headlight Magazine, and CE Mart, have been able to evaluate the products independently on each attribute with less halo and bias. With all these significant results, the null hypothesis can be rejected. On the other hand, these positive correlations notably support an opposite argument and hold hypothesisA0, which is “A composite measurement of product quality (Thai product quality) obtained from public reviews of new launching product will have positive relationship to the underlying proposed product quality attributes”.
DISCUSSION
The search for the effects of attributes on Thai product quality yields significant results. This research suggests an alternative metric by assessing product quality reviews from public sources, which can be a useful method to obtain independently product quality attribute data. When product quality data translate into a suitable quantitative scale and at a right composite attribute, the results show that the individual attributes of product quality have strong and significantly positive effects on overall product quality. In general, the attributes that have the strongest effects on three categories of product quality are reliability, design, and customer satisfaction. The possible reasons for these three attributes could be Thai consumers are very brand conscious, and rely their purchasing decisions largely on reputable producers. Intuitively, a product made by a well-known manufacturer automatically translates as good quality product as perceived by consumers. Moreover, the design or feature of a product is also very important and has a big influence on Thai consumers’ perceptions. Consumers could easily switch their purchasing decisions and perceptions from one product to another product, simply because of a better product design. Reliability, design, and other attributes are also important in evaluating product quality. However, all of these attributes would be meaningless if a product does not satisfy consumers’ needs and wants. Therefore, it is logical that customer satisfaction attribute has a positive significant effect on the overall for product quality. On the contrary, support service, adaptability, and surprisingly durability seem to have less effect on three categories of product quality than the other attributes. The feasible reason for these latter three attributes could be the imperfect availability of information on product quality reviews published in public sources. They do not elaborate or give reviews much on these three related views. Nevertheless, the results suggest that support service, adaptability and durability appear to have less effect on the three categories of product quality. These do not imply that support service, adaptability, and durability are not important attributes. These are important attributes but happen to have less correlation on the focused product quality reviewed.

Asia Pacific Business & Economics Perspectives, 1(1), Summer 2013
64
Considering electronics & IT products alone, the regression results indicate that ease of use and customer satisfaction are particularly important attributes that have the greatest effects on product quality. Furthermore, function, reliability, design, and value for money are also relatively important attributes that also have substantial and significant effects on the overall for electronics & IT product quality; whereas, durability, eco-friendliness, support service, and adaptability have the least effects. The probable reasons for this could be, with more frequency and availability of new electronics & IT products in the market, Thai consumers are ensured that the products perform well, exhibit user-friendliness, provide compatibility with the old version, and suit their needs. Likewise, Thai consumers often replace their old electronics products and IT gadgets with the latest version before the gadgets actually break down or run out of warranty. In addition, consumers do not also consider energy efficiency and eco-friendliness important when buying a new mobile phone, tablet, or computer. Thus, durability, eco-friendliness, support service, and adaptability seem to have relatively less significance on electronics & IT product quality. For automobile, the results of regression indicate that ease of use, reliability, eco-friendliness, customer satisfaction, value for money and design are particularly important attributes that have the greatest effects on automobile product quality. On the other hand, function, durability, support service, and adaptability have the least effects. When Thai consumers consider buying normal goods, especially cars, they instinctively take many aspects into consideration, which include credit from the car maker, energy saving matters, ease of use, reasonable price, elegant features, as well as the utility or performance of the car. However, the results of this regression suggest that function attribute has less effect on the overall for automobile product quality. This high p-value or relatively low correlation might be an indirect effect of public reviews, in which they often evaluate new automobiles under the real market value. For home appliances, the results of regression indicate that customer satisfaction, reliability, and design are important attributes that have significant effects on home appliance product quality. Whereas, function, ease of use, durability, eco-friendliness, support service, value for money and adaptability are relatively less important attributes that have the least effect on home appliance product quality. These unfavorable results of many attributes have comparatively low correlations could possibly be due to the small sample size or the diverse characteristics of examined home appliance products (television, refrigerator, washing machine, and air conditioner). The proposed attributes may be inappropriate and unsuited to generalize and capture home appliance characters. A search for more appropriate of composite attributes for evaluating home appliance product quality is suggested. All the research results generally provide a means for managers to identify important attributes that should be emphasized more when producing a quality product for Thai market. By highlighting these attributes, firms could improve their product quality, consequentially reduce their production costs and ultimately provide a higher and better product quality to the market. In summary, with significance in correlation coefficients and p-values, the results of this research verify that there are positive and significant effects of the

Asia Pacific Business & Economics Perspectives, 1(1), Summer 2013
65
proposed attributes on Thai product quality, particularly on automobile and electronics & IT products quality. Furthermore, the results also provide evidence that the proposed attributes are valid, uphold the hypothesisA0, and can be used in measuring various types of product quality, particularly in the case of Thailand.
LIMITATIONS AND FUTURE STUDY
This research only identifies the effect of attributes on product quality but do not identify the causality between attributes and product quality. It would be very interesting to see the causality between them. The assessments of product quality are knowledge-dependent and based on various aspects. To translate and grade product quality scores and attributes scores by only one assessor, the results might be bias and differ from other assessors. If product quality were to be assessed by two or more assessors, the results could be remarkable. Finally, the sample size of this research is rather small, specifically in home appliance. By examining bigger sample size, more significant research result could be delivered.
REFERENCES
Ackaradejruangsri, P. (2012). Defining thai Product quality in the 21st century.
Ritsumeikan Journal of Asia Pacific Studies , 31, 91-99. Adealman, I. & Grilliches, Z. (1961). On an index of quality change. Journal of the
American Statistical Association , 56, 535-548. Brezina, C. (2012). Understanding the gross domestic product and the gross
national product. New York, United States: The Rosen Publishing Group, Inc.
Eliashberg, J. & Shugan, M. S. (1997). Film critics: Influencers or predictors? Journal Marketing, 61. 68-78.
Garvin, A. D. (1984). What does product quality really mean? Sloan Management Review, 26(1) 25-43.
Hjorth-Anderson, C. 1984. The concept of quality and the efficiency of market for consumer products. Journal Consumer Report, 11. 708-718.
Kamakura, W. A., Ratchford, T. B. & Agarwal, J. (1998). Measuring market efficiency and welfare loss. Journal Consumer Reports. 25(3). 289-302.
Leavitt, H. J. (1954). A note on some experimental findings about the meaning of price, Journal of Business, 27 (July), 205-210.
Maynes, E. S. (1976). The concept and measurement of product quality. (N.E. Terleckyj, Ed.) National Bureau of Economic Research, 529-284.
Mayzlin, D. (2006). Promotional chat on the internet. Marketing Science, 25(2). 155-163.
Monroe, K. B. (1973). Buyers’ subjective perceptions of price, Journal of Marketing Research, 10 (February), 70-80.
Monroe, K. B. (1977). Objective and subjective contextual influences on price perceptions, consumer and industrial buying behavior. In Arch G. Woodside, Jagdish N. Sheth, & Peter D. Bennett, eds (pp. 267-286). New York: North Holland Publishing Company.

Asia Pacific Business & Economics Perspectives, 1(1), Summer 2013
66
Monroe, K. B. & Petroshius M. S. (1981). Buyers’ perceptions of price: An update of the evidence, perspectives of consumer behavior (3rd ed.). In Harold H. Kassarjian and Thomas S. Robertson, eds. (pp. 43-55). Glenview, IL: Scott, Foresman and Company.
Monroe, K. B. & Krishnan, R. 1985. The effect of price on subjective product evaluations, perceived quality: How consumers view stores and Merchandise. In Jacob Jacoby & Jerry Olson, eds. (pp. 209-232). Lexington, MA: Lexington Books, Inc.
Monroe, K. B. & William B. D. (1988). A research program for establishing the validity of the price-quality relationship. Journal of the Academy of Marketing Science, 16, 151-168.
Moorman, C., Du, R. & Mela, F. C. (2005). The effect of standardized information on firm survival and marketing strategies. Marketing Science, 24(2) 263-274.
Nelson, P. (1970). Information and consumer behavior. Journal of Political Economy, 78(2), 311-329.
Neuendorf, A. K. (2002). The Concept analysis guidbook. California: Sage Publications, Inc., 1-23.
Olson, J. C. (1973). Cue properties of price: Literature review and theoretical considerations. Presented to 83rd Annual Convention of the American Psychological Association, Montreal, Canada.
Olson, J. C. (1977). Price as an informational cue: Effects on product evaluations, consumer and industrial buying behavior. In Arch G. Woodside, Jagdish N. Sheth, & Peter D. Bennett, eds. (pp. 267-286). New York: North Holland Publishing Company.
Peter, R. A. & Wilson, W. R. (1985). Perceived risk and price-reliance scheme and price perceived quality mediator in perceived quality. In Jacob, J. and Olson, J. eds. Lexington, MA: Lexington Books.
Rao, A. R. & Monroe, B. K. (1988). The modernizing effect of prior knowledge on cue utilization in product evaluations. Journal of Consumer Research. 15(September), 253-264.
Rao, A. R. & Monroe, B. K. (1989). The effect of price, brand name, and store name on buyers’ perceptions of product quality: An integrative review. Journal of Marketing Research, 26(3), 351-357
Tellis, G. J. & Wernerfelt, B. (1987). Competitive price and quality under asymmetric Information. Marketing Science, 6(3) 240-253.
Tellis, G. J. & Johnson, J. 2007. The value of quality. Marketing Science , 26 (6), 758-773.
Tellis, G. J. & Chandrasekaran, D. (2008). Global takeoff new products: Culture, wealth, or vanishing differences? Marketing Science, 00(0) 1-17.
Triplett, J. E. (1976). Comments on "the concept and measurement of product quality". (N. E. Terleckyj, Ed.) National Bureau of Economic Research, 567-574.
Zeithamal, V. A. (1988). Consumer perceptions of price, quality, and value: A mean-end model and synthesis of evidence. Journal of Marketing, 52, 2-22.

Asia Pacific Business & Economics Perspectives, 1(1), Summer 2013
67
APPENDICES
Appendix A: The definitions of the proposed ten attribute / dimensions
Function The ability, utility, and performance of a product compared to previous version or similar type of product, e.g. speed, intelligibility, technology, etc.
Ease of use The charecter by which a product can be utilized by general consumer without any difficulties and problems.
Reliability The property of a product being creditable, reliable, e.g. market recognition, brand awareness, safety, etc.
Durability The ability of a product that is able to perform over long period of time without technical error and physical breakdown.
Design The total outlook and feature of a product, e.g. color, size, weight, etc.
Eco-friendliness A product that is free from chemicals and is harmless to environment, e.g. green material, recyclable, energy saving, carbon credit, related to green concept, etc.
Customer Satisfaction
The overall feeling and perception of a consumer on a product, compared to consumer’s expectation and/or previous experience usage of a same brand product or from the same company.
Support Service Additional and intangible value(s) that attached to a product, e.g. product guarantee/warranty, seller courtesy, accessibility and availability of retail store, etc.
Value for Money The consumer’s perception in terms of economic value of a product e.g. actual price, price of repairing parts, price as a secondhand product etc.
Adaptability The ability of a product that is workable and adjustable among the brands or different producers.
Appendix B: The content analysis outline for grading overall product quality
reviews from public reviews
Excellent – 5 point: A market leader that offers exceptional performance; willing to buy
x It is considered the most powerful product available at that specific period of time.
x This product is the big winner. x Editor/Reviewer’s choice. x This product is excellent. x This product could be one of those milestones that change the
way the consumers use that particular product. x It is unquestionably the most powerful product you can buy. x It is miles ahead of the competitors.

Asia Pacific Business & Economics Perspectives, 1(1), Summer 2013
68
x The product stands at the top. x It is the very best product of the year. x This product has a very good chance of establishing a new standard. x It is one of the product that does everything right. x It is an outstanding performer that excels in every aspect.
(1) Good – 4 point: Excels in many areas; good to buy x This product is an attractive alternative. x This product is a good choice to buy. x This product is a serious threat to the current standard. x It is an impressive product. x It is a richer product than its principal competitors. x It is best in many aspects, but still there is a little weakness.
(2) Acceptable – 3 point: Average for its class; justifiable to buy x The product is well thought out and yet it is a strong competitor
to its rivals, nevertheless there are a few problems in it. x It is obviously not the best product, but it is economical and a
reasonable choice to buy. x It is a fairly good performer that meets the required standard. x It is a product that consumers decide to buy, but it may not fully
satisfy. (3) Poor – 2 point: Substandard; positives offset by more negative
features; buy with conditions x The product has been outdistanced by its competitors. x It looks dim and unattractive beside its competition. x In many areas, it still maintains major weaknesses and does not
develop much from the past. x It performs unsatisfactorily and parts of its features do not meet
the standard. x If there is no other alternative, it is not that bad choice to buy.
(4) Unacceptable – 1 point: Missing necessary features; avoid to buy x It scored the lowest in overall satisfaction. x It occupied the lowest spot and ranked at the bottom among its competitors. x It performs poorly and most of it features do not meet the standard. x Definitely avoid/ do not buy.
Appendix C: The content analysis outline for grading product quality reviews from public reviews into each attribute
(1) Completely Satisfied – 10 point: Extremely excellent on particular dimension
x The product is considered to be the most outstanding in that particular attribute in the market (market leader) and among the competitors.

Asia Pacific Business & Economics Perspectives, 1(1), Summer 2013
69
x This attribute is the utmost strength and the best selling point of the product.
x This attribute is extremely excellent, much beyond the expectation and very much above the standard.
x This attribute dimension receives the highest scores from the Editor/Reviewer and it is extremely recommended to buy.
x This attribute is clearly the most powerful among other attribute dimensions.
x This attribute makes a product to be/offer the best among its competitors.
x This attribute has a very good chance of establishing a new standard.
(2) Very Satisfied – 9 point: Excellent product quality on particular dimension
x The product is considered to be outstanding in that particular attribute in the market and for its class.
x This attribute is one of the strengths of a product and potentially is one of the selling points.
x This attribute is excellent, somewhat beyond the expectation and slightly above the standard.
x This attribute receives high scores from the Editor/Reviewer and it is very worthwhile to buy.
x This attribute is one of the best among competitors and it is very appealing and attractive in the market.
(3) Moderatly Satisfied – 8 point: Very good product quality on particular dimension
x The product is considered to be great in that particular attribute in the market and for its class.
x This attribute could probably be one of the strengths of a product and one of the selling points.
x This attribute is very good, meets the expectation, and qualifies for the standard.
x This attribute is an attractive alternative; it makes a product very reasonable to buy.
x There is high opportunity and room for this attribute for the improvement to become a top class.
x This attribute is not the best among the competitors but it is still competitive in the market.
(4) Satisfied – 7 point: Good product quality on particular dimension x This attribute is considered to be good, meets the expectation,
and achieves the standard. x There are rooms for this attribute for further improvement. x It is obviously not the best in that particular attribute, but it is
comparatively reasonable to buy. (5) Somewhat Satisfied – 6 point: Somewhat good product quality on
particular dimension

Asia Pacific Business & Economics Perspectives, 1(1), Summer 2013
70
x This attribute is considered to be somewhat good, somewhat meets the expectation, and somewhat achieves required standard.
x There is much room for this attribute for improvement. x Taking other factors into consideration, this attribute still and
somewhat makes a product economical and reasonable to buy. (6) Neither Satisfied nor Dissatisfied – 5 point: Acceptable product
quality on particular dimension x The product is considered to be an average in that particular
attribute in the market and for its class. x This attribute is considered to be acceptable, nearly meets the
expectation, and somewhat achieve required standard. x To be more competitive, this attribute needs many
improvements. x This attribute makes a product a moderate choice to buy.
(7) Somewhat Dissatisfied – 4 point: Somewhat poor product quality on particular dimension x This attribute is considered to be somewhat poor, could not
meet the expectation, and could not achieve required standard. x This attribute still can be improved, and it needs somewhat
advanced improvement in order to achieved required standard. x If there is no other alternative, it is not that bad choice to buy.
(8) Dissatisfied – 3 point: Poor product quality on particular dimension x This attribute is considered to be poor, somewhat a
disappointment, and substandard. x This attribute makes a product outdistanced by its competitors. x This attribute performs somewhat unsatisfactory, maintain
previous weaknesses, and do not develop much from the past. x This attribute seriously needs advanced improvement. x If there is no other alternative, buy with conditions.
(9) Moderately Dissatisfied – 2 point: Very poor product quality on particular dimension x This attribute is considered to be very poor, disappointment, and
behind substandard. x This attribute is the weakness of a product, makes a product
look dim, unattractive, and unable to compete with competitors. x This attribute performs unsatisfactorily, maintains major flaws,
and does not develop from the past at all. x Not recommended to buy.
(10) Very Dissatisfied – 1 point: Unacceptable product quality on particular dimension
x The product is considered to be miserable in that particular attribute in the market and among its class.
x This attribute is unacceptable, very disappointing, and much behind substandard.
x This attribute is the threat of a product.

Asia Pacific Business & Economics Perspectives, 1(1), Summer 2013
71
x This attribute receives very low scores from the Editor/Reviewer. x This attribute performs badly and it is quite pointless to improve. x Avoid to buy.
(11) Completely Dissatisfied – 0 point: Extremely unacceptable product quality on particular dimension
x The product is considered to be the most miserable in that particular attribute in the market and among the competitors.
x This attribute is extremely unacceptable, totally a disappointment, and substandard.
x This attribute is obviously the threats of a product that could possibly turn a product into a dead product.
x This attribute receives the lowest scores from the Editor/Reviewer and ranks at the bottom among competitors.
x This attribute performs very badly and it is ultimately pointless to improve.
x Do not buy at any conditions.

Asia Pacific Business & Economics Perspectives, 1(1), Summer 2013
72
Exploring customer needs of Huis Ten Bosch per customer attribute: Market segmentation and targeting by using
blog text mining and conjoint analysis
Junichi Kato Tsukuba International University Tsuchiura, Ibaraki Prefecture, Japan [email protected]
Tetsuro Hyodo Tokyo University of Marine Science and Technology Tokyo, Japan [email protected] Mamoru Imanishi Fukuoka University Fukuoka, Japan [email protected]
Saburo Saito Fukuoka University Fukuoka, Japan [email protected]
ABSTRACT
This study aims to determine customer needs per customer attribute through market segmentation and targeting by taking Huis Ten Bosch as one example. Conjoint analysis and RFM analysis show us that HTB customers of different customer attribute attach importance to different needs. We interpret that these needs can be satisfied by providing matching products and services. These customers who are high level or low level of R, F, M, or all RFM have different willingness to pay for each product attribute. By clarifying these different needs per customer attribute, managers can decide not to provide similar services for all customers and managers can decide which products or services are better suited for particular customers. Managers can focus only on important customers and attract them. JEL Classification: L1, L71 Keywords: marketing, text mining, conjoint analysis, KIP, Huis Ten Bosch

Asia Pacific Business & Economics Perspectives, 1(1), Summer 2013
73
INTRODUCTION It is one of the most important management issues for an organization, which faces severe business environment to grasp the important customer needs by using targeting and attract customers who share similar needs by using market segmentation.
The aim of this paper is to clarify the customer needs per customer attribute through executing market segmentation and targeting by taking Huis Ten Bosch (HTB) as one example. This research has two objectives. The first objective is to clarify customer needs by using blog text mining. Blogs are the media which give us raw customers' voices. Blogs give us more massive natural language data than questionnaires. In this research, we disclose customer needs by using blog text mining.
The second object is to detect the more important needs per customer attribute. Second object includes two analyses. The first is Recency, Frequency, and Monetary (RFM) analysis. By using RFM analysis, customers are ranked from the viewpoint of Recency (customers recently visit HTB), Frequency (customers frequently visit HTB), and Monetary (customers spend more money for the trip to HTB or in HTB). These scores are customer attributes. The second is to grasp the important customer needs per customer attribute and price customers would like to pay to satisfy their needs by using conjoint analysis. These analyses enable us not only to execute the market segmentation but also to do targeting.
More detail outline is as follows. First, we use blog texts as data and execute the market segmentation by following Kato and Ishikawa Procedure (KIP). The results of this analysis were earlier presented in a non-refereed Japanese national conference. KIP is the procedure which shows us the customer needs from blog texts data by using text mining. It was difficult to interpret customer needs from results of analysis. Accordingly, we use the principal component analysis for this research. The results are shown in the section of results of blog text mining.
The advantages to use blog texts data for marketing research were already pointed out by existing marketing studies. Volo (2010) points out the following specifications of blog text data. We can use data which blog authors wrote spontaneously. Blog texts as data have less possibility that force test subjects to create data. Mitamura et al. (2008) use computer programs for analysis and process the big data we cannot analyze by hands. This means we can use massive natural language data.
Pan, MacLaurin, and Crotes (2007), Volo (2010), and Mitamura et al. (2008) employ a web search engine. These previous researches could collect various opinions as data from a wide range of subjects. The distinction of KIP is not from the viewpoint of an engineer but from the viewpoint of the previous marketing studies. KIP follows the definition of market segmentation that Kotler and Keller (2006) use.
Next, after getting the results of principal components analysis, we execute both RFM analysis and conjoint analysis. We can grasp important customer needs for managers by using both these methods. RFM analysis enables us to isolate customers who visit HTB recently, visit HTB frequently, or spend more money

Asia Pacific Business & Economics Perspectives, 1(1), Summer 2013
74
when visiting HTB and in HTB. We clarify the needs which the customers value by using conjoint analysis. The results are shown in the section of results of RFM and conjoint analysis.
From the above results of blog text mining and results of RFM and conjoint analysis, needs about HTB which customers value are clarified per customer attribute. This procedure including KIP, RFM analysis, and conjoint analysis enables us to do targeting which could not be executed based on the results of past blog text mining alone. At this point, this research contributes to both academic research and business practices.
METHODS Blog text mining by using KIP
The procedure of market segmentation from blog texts is shown in Figure 1. This is the procedure in Kato and Ishikawa (2011a). In this research, this procedure is called KIP. However, this research uses step 5 (Author Analysis) for step 4 or 5 in the procedure for author clustering. Additionally, this research executes principal component analysis in step 6 for easy labeling and easy interpreting of the results. Kato (2013) explains the procedure which used the principal component analysis in KIP in detail.
Figure 1. Procedure of market segmentation Source: Kato and Ishikawa (2011b), p. 26 [Original is in Japanese]
Data for KIP is prepared as follows. First, researchers decide one word (Target Keyword) which expresses the market they would like to analyze and they
Author Clustering
4. Nested Analysis
5. Author Analysis
Keywords Selection
2. Selection of Product Keywords
3. Selection of Personal Keywords
1. Data Collection
6. Labeling

Asia Pacific Business & Economics Perspectives, 1(1), Summer 2013
75
collect all goo blog authors who used the word (Target Keyword) even if for one time only. Next, researchers gather all blog texts of all blog authors who used the Target Keyword. Finally, researchers extract words from all blog texts and prepare words for analysis. This is row data for KIP. This step is data collection.
The next step involves selection of words which researchers use for clustering of blog authors. These words are used as criteria for clustering. Blog authors with the same frequency of use of selected words are clustered in the same group.
KIP uses two types of words as criteria for grouping of blog authors. One of these is words which pertain to the product. These are product keywords. The other type of words is personal keywords which denote the customers. Researchers choose these two types of words from row data and use these as criteria.
Blog authors who have the same frequency of use of these product keywords and personal keywords are gathered, with these keywords as criteria. These groups are the results of market segmentation.
Lastly, principal axes which comprehend each group are extracted and are put on labels. Because researchers cannot understand and interpret the needs which these groups share, principal axes which grasp each group of blog authors are extracted by using principal component analysis. And then, the labels are put on the basis of the eigenvector of each word for easy interpretation. Experimental Design by Using AlgDesign and Making of Web Questionnaire
Questionnaires for conjoint analysis are made from principal axes which are extracted by using blog text mining. First, the experiment is designed. This research uses the AlgDesign package of the statistical environment R for the experimental design. This procedure is introduced in Aizaki and Nishimura (2007). According to Aizaki and Nishimura (2007), questionnaires are made by using six steps described in Figure 2.
Questionnaires are created by following this procedure. In this process, M in step 3 and 4 is 2, and P in step 5 is 8. These questionnaires are made by using two axes that are extracted from loyal authors and two axes that are extracted from longtail authors. The six steps are executed for loyal and longtail authors separately. As a result, 16 question items are made.
Lastly, the php program is made for investigating these items by web questionnaires. The web questionnaires are shown on a Web server. The php program reads the file of the items which is prepared, and generates the html file dynamically. When a subject replies to items, the answers are saved as raw data in a Comma Separated Value form (CSV) after having checked required items.
As a consequence of using undergraduate students as subjects, most of them usually do not have device (e.g., smart phone) to access the Internet and to see web questionnaires. Hence, the paper-based questionnaires which are completely the same as the web questionnaires are prepared, and the answers to the paper-based questionnaires are inputted by using web questionnaires. In other words, web questionnaires are used as the data input form. The web questionnaires are shown publicly.

Asia Pacific Business & Economics Perspectives, 1(1), Summer 2013
76
RFM Analysis Data gathered are analyzed by using RFM framework. The first step is data
cleaning. Data are checked from the viewpoints of the same person's repetitive answers, inappropriate answers, or theoretically impossible answers, and so on. The inappropriate answers are deleted from data.
The second step is allocation of RFM scores. The question items in this research are on the basis of the framework of Recency Frequency and Monetary (RFM). The data which are only in conjunction with these RFM are analyzed here. Researches on RFM framework are reviewed by Wei, Lin, and Wu (2010) in detail. The analysis of this paper is executed while referring to Wei, Lin, and Wu(2010).
First, data which are related to RFM are extracted from all data. Those data are Questions No. 5 to 11. Question No. 8 is about whether the subject has the experience of visiting HTB.
Figure 2. Procedure of creating of questionnaires Source: Aizaki and Nishimura (2007), p. 153 [Original is in Japanese]
Second, these extracted data are allocated RFM scores. Recency is related to two types of questions. One is how many months have passed from the last trip, while the other is how many months have passed from the last visit to HTB. The smaller the number of months is, the higher scores of Recency are allocated. The 4 is allocated as score to subjects of the highest 25 percent of number of months. Then the 3, 2, or 1 are allocated per each 25 percent. This 25 percent denotes a percentile. Each customer is allocated one of scores from 4 to 1 as Recency score. Therefore, the higher the score is, the higher the loyalty is.
Frequency is related to two types of questions. One is how many times the subject has traveled in the recent five years. It includes similar places to which the

Asia Pacific Business & Economics Perspectives, 1(1), Summer 2013
77
subject visits. The other is how many times the subject has visited HTB in the last five years. The 4 is allocated as score to subjects of the highest 25 percent. Then the 3, 2, or 1 are allocated for each 25 percent. This 25 percent refers to a percentile. Each customer is allocated one of scores from 4 to 1 as Frequency score. The higher the score is, the higher the loyalty is.
Monetary is related to two types of questions. One is how much subject spends for one travel. The traveling includes international and national trips. The cost for traveling includes transport and lodging expenses. The other is how much subject spends for one travel to HTB. The 4 is allocated as score to subjects of the highest 25 percent. Then the 3, 2, or 1 are allocated for each 25 percent. This 25 percent pertains to a percentile. Each customer is allocated one of scores from 4 to 1 as Monetary score. The higher the score is, the higher the loyalty is.
The third step is the narrowing of data. In the previous procedure, RFM scores and answers for questions from No. 5 to 11 are prepared. Data are more refined from these data. Only subjects who are allocated 4 or 1 as score of R, F, and M are selected. According to this third step, the following subjects’ sets are prepared. The subjects’ set as “q5-R1” includes the subjects who have 1 as score of R for question No.5. The “q6-F1” means the set of subjects who have 1 as score of F for question No.6. The “q7-M1” is the set of subjects who have 1 as score of M for question No.7. Similarly, the “q5-R4” is set of subjects who have 4 as the score of R for question No.5. The “q6-F4” is the set of subjects who have 4 as the score of F for question No.6. The “q7-M4” is the set of subjects who have 4 as score of M for question No.7. By using these data, the next RFM analysis can be executed.
The fourth step is an implementation of RFM analysis by using the narrowed-down data. In RFM analysis, the mean values are calculated by using each data of q5-R1, q6-F1, q7-M1, q5-R4, q6-F4, and q7-M4. For instance, in the set of subjects (q5-R1), the average of data of question No.5 is calculated. These mean values are the result of RFM analysis. Conjoint Analysis
Conjoint analysis consists of three steps. Step 1 involves the preparation of data sets from questions No.12 to No.19. First of step1, subjects for conjoint analysis are only persons who have previously visited HTB. Therefore, data sets, answers of which are from questions No. 12 to No.19 are selected by the condition that subjects choose 1 in question No.8.
Next of step 1, items which are from questions No.12 to No.19 are principal axes of loyal authors. So data sets are chosen by the criteria that the RFM score is either 3 or 4 in the RFM analysis. For example, when q9-R3 or 4 means that R score in question No.9 is 3 or 4, sets of subjects, whose RFM scores are q9-R3 or 4, q10-F3or4, q11-M3 or 4, and q9 to 11-RFM3 or 4, are prepared.
Final of step 1, answers to questions from No.12 to No.19 are shaped into data sets, which can be analyzed by statistical environment R for conjoint analysis. The value (1 or 0), which corresponds to whether subject has each attribute or not, is inputted under the column headers. The column headers are price.planA, price.planB, price.non, medinfo.planA, medinfo.planB, medinfo.non, resort.planA, resort.planB, and resort.non. The data sets are prepared by using eight rows for

Asia Pacific Business & Economics Perspectives, 1(1), Summer 2013
78
each subject. The number of rows (eight rows) is the same as the number of questions (questions No.12 to No.19). These data sets are prepared for the number of subjects. Table 1. Data set for conjoint analysis mode price.A price.B price.N re.A re.B re.N mi.A mi.B mi.N sex R F M Q12 A 6000 6500 0 0 1 0 0 1 0 1 3 4 4 Q13 B 5500 5000 0 0 1 0 1 0 0 1 3 4 4 Q14 B 5500 5500 0 1 0 0 0 1 0 1 3 4 4 Q15 N 5000 6500 0 0 0 0 1 0 0 1 3 4 4
… Q19 N 6000 6000 0 0 0 0 0 0 0 1 3 4 4 Q12 N 6000 6500 0 0 1 0 0 1 0 0 3 3 4 Q13 A 5500 5000 0 0 1 0 1 0 0 0 3 3 4 Q14 N 5500 5500 0 1 0 0 0 1 0 0 3 3 4 Q15 B 5000 6500 0 0 0 0 1 0 0 0 3 3 4
… Q19 B 6000 6000 0 0 0 0 0 0 0 0 3 3 4
… Q12 N 6000 6500 0 0 1 0 0 1 0 0 4 4 4 Q13 N 5500 5000 0 0 1 0 1 0 0 0 4 4 4 Q14 N 5500 5500 0 1 0 0 0 1 0 0 4 4 4 Q15 N 5000 6500 0 0 0 0 1 0 0 0 4 4 4
… Q19 A 6000 6000 0 0 0 0 0 0 0 0 4 4 4
Source: Authors
The word “mode” is added to the first part of column headers of the data sets which are prepared for the number of subjects. This column header means the plan which a subject chooses in questions from No.12 to No.19 (plan A, plan B, or neither). The words “sex”, “R”, “F”, and “M” are added to the last part of column headers. Then, the values which correspond to each column header are inputted. These values are repeated by the number of questions. If the number of questions is eight, the values are repeated eight times by using eight rows. Data sets are then prepared for conjoint analysis. A part of data sets is shown in the Table 1 as one example. The values in Table 1 are not real data. Additionally, expressions of column headers are simplified in this example. The “A” means “plan A”; “B”, “plan B”; “N”, “none”; “mi”, “medinfo”; and “re”, “resort”.
Step 2 requires the preparation of data sets from question No.20 to No.27. First of step 2, subjects of data sets are only persons who have previously visited HTB. Therefore, only subjects who choose 1 for question No.8 are selected. Their answers from question No.20 to No.27 are data sets.
Next of step 2, items which are questions No. 20 to No. 27 are principal axes of longtail authors. Data sets are extracted by the criteria that RFM scores are only 1 or 2. When q9-R1or2 means set of subjects who choose 1 or 2 in question No. 9 as R score, the q9-R1or2, q10-F1or2, q11-M1or2, and q9to11-RFM1or2 are prepared. They are a set of subjects whose scores are low for conjoint analysis.
Final of step 2, answers to questions No. 20 to No. 27 are made into data sets which can be used for conjoint analysis in statistical environment R. The answers which correspond to price.planA, price.planB, price.non, eco.planA, eco.planB, eco.non, blog.planA, blog.planB, and blog.non are inputted as the value 1 or 0 in each column. These answers (1 or 0) mean whether subject agrees with each attribute or not. The data sets are created by using eight rows which are the same as the number of questions (No. 20 to No. 27). These data sets are prepared for the number of subjects.
The word “mode” is added to the first part of column headers of the data sets. This column header means a plan which a subject chooses from questions

Asia Pacific Business & Economics Perspectives, 1(1), Summer 2013
79
No. 20 to No. 27 (plan A, plan B, or neither). The words “sex”, “R”, “F”, and “M” are added to the last part of column headers. Then, the values which correspond to each column header are inputted. These values are repeated by the number of questions. When the number of question is eight because the questions are from No. 20 to No. 27, the values are repeated eight times by using eight rows. Data sets are then prepared for conjoint analysis. The outline is the same as Table 1.
Step 3 is to execute conjoint analysis for each RFM score. Sets of subjects are extracted in step 1 and 2. These data sets are analyzed by using mlogit library of statistical environment R. The mlogit library enables users to build various types of the discrete choice models. These models include MNL (Multinomial Logit Model), NL (Nested Logit Model), MNP (Multinomial Probit Model), and MXL (Mixed Logit Model).
Data sets which are used in this research do not need to pay attention to the error structures. MNL of mlogit library is employed as a method of conjoint analysis. As is evident from Table 1, the number of choices is three in this model. For example, the probability of choices is expressed as the equation (1). The θk
means parameters in the equation (2). Xik is kth explanatory variable (in this research, it is price, medinfo, or resort etc.) of alternatives i (in this research, it is plan A, plan B, or non).
(1)
(2)
RESULTS Blog Text Mining
In the first step, data are gathered by using target keyword “Huis Ten Bosch”. Blog sites are searched by using goo blog search engine. Nine hundred seven blog entries are retrieved. Authors of all these blog entries are gathered, total of which is 522. The time period of the collected data is from March, 9, 2004 to September, 18, 2011. Some dates of gathered blogs are unrealistic. For example, these years are 0000 or 1968. In this research, time periods is decided as follows.
The starting day of a goo blog site is March, 9th, 2004 (I checked http://pr.goo.ne.jp/detail/290/ on October 3, 2011). After checking dates of the retrieved data, the period of blogs are decided between that starting day of a blog site and the day at which data are gathered. Needless to say, the unrealistic dates of the gathered blogs do not mean that data of blogs are nonsense. So these blogs are still used as data in this research.
Blog texts are extracted from the blog entries. These blog texts are analyzed by morphological analysis. Words are drawn from these blog texts. If the retrieval rate of 90 percent cannot be achieved for a particular blog, the author of this blog is omitted from the list of 522 authors. There is not a rigorous criterion of acceptance of blogs as data. Over 90 percent is the figure used as a criterion in
> @> @ > @ > @nonpl anBpl anA
pl anApl anA VVV
VP
expexpexpexp
��
¦ k ikki XV T

Asia Pacific Business & Economics Perspectives, 1(1), Summer 2013
80
this research, but over 99 percent or 100 percent is used as a criterion in the previous research. A rigorous criterion cannot be determined because the number of blogs which can be gotten depends on the condition of networks. Finally, 487 authors, 517,126 blog entries, and 914,109 words are shortlisted.
In the second step, product keywords are chosen. Product keywords are defined as similar words with target keyword “Huis Ten Bosch”. Words which are more similar with Huis Ten Bosch are employed as product keywords. The 10,230 words are selected as product keywords. In the third step, personal keywords are chosen. First, blog entries are gathered for each author. The words that one author uses but other authors do not use very much are defined as personal keywords. The 10,230 words are selected as personal keywords. The same number of words is used as product keywords because there is no criterion.
The fourth step is author analysis. An author analysis means categorization of authors per keyword. That categorization includes loyalty to a product. First, blog entries are clustered for each author. Then, these authors are categorized by product keywords that are selected in step 2. Each categorization forms groups of authors who used similar words as product keywords.
A relative ratio of significant scores of product keywords is calculated for each author of each cluster in these four clusters, and then mean scores of the 25 percent of upper side are calculated for each cluster. The cluster which has a maximum value of mean scores is defined as loyal authors. They have a high level loyalty to the product. The number of loyal authors is 104. In contrast, authors who have the minimum value of loyalty score are defined as longtail authors. The number of longtail authors is 116. Authors categorized by product keywords are grouped by personal keywords that were selected in step 3. This categorization creates four groups from 104 loyal authors and 116 longtail authors.
The fifth step is labeling. Four groups of loyal authors include 79,465 words (18 authors), 107,624 words (64 authors), 142,748 words (14 authors), and 32,168 words (eight authors). Four groups of longtail authors include 229,550 words (33 authors), 255,159 words (61 authors), 80,253 words (10 authors), and 343,445 words (12 authors). Four groups of loyal authors are unified to one group and four groups of longtail authors are unified to another. Loyal authors have 243,382 words and longtail authors have 672,155 words.
The values of significance of each word are calculated by using p-value of chi-squared. The smaller the p-value is, the smaller the probability of independence is. A small p-value of a word shows that the word characterizes the loyal authors or longtail authors. Meanwhile, chi-squared value of each word is calculated per each cluster for a later analysis. More important words that characterize authors than other words are chosen. Words with smaller p-value are selected as a criterion. The selected words are 0.1 percent of all words (calculating to one decimal place and rounding down if the number is less than 5). Results show that 243 words are selected from 243,382 words of loyal authors, and 672 words from 672,155 words of longtail authors.
A principal component analysis is executed for 243 words and 672 words by using values of chi-squared as data. Loyal and longtail authors consist of four clusters each. Four principal components that characterize these clusters are extracted by principal component analysis. From the result of principal component

Asia Pacific Business & Economics Perspectives, 1(1), Summer 2013
81
analysis, the first and second principal components capture 85.9 percent of cumulative proportion in loyal authors and 78.8 percent of cumulative proportion in longtail authors. Almost 80 percent of loyal and longtail authors are explained by the first and second principal components. Therefore, the first and second principal components are employed for interpreting the needs of loyal and longtail authors.
These two components are interpreted as follows. The word with the maximum absolute value of eigenvector in the first and second component is found out. If the value of eigenvector is positive, words are sorted and 50 words are selected in descending order. On the other hand, if the value of eigenvector is negative, words are sorted and 50 words are selected in ascending order. These 50 words are used for interpreting customer needs.
Loyal authors have two axes. The first principal axis of loyal authors includes the following words: “www, http, html, jp, PDF, youtube, cigarette, research institute, new type, virus, information, specimen, influenza, blogspot, public welfare, US, Ministry of Labor, cause of disease”, and so on. These consist of information-related words and medical-related words. Hence, we put medical information as the label on the first principal axis of loyal authors. The second principal axis of loyal authors is characterized by the following words: “aviation, Tokyo, Chiba, Narita, Monaco, resort, Monte Carlo, hotel”, and so on. These are related to resorts. Therefore, we put foreign resorts as label on the second principal axis. Therefore, labels of loyal authors consist of medical information and foreign resorts.
On the other hand, longtail authors have two axes. The first principal axis of longtail authors includes: “diary, archives, seesaa, sale, SeesaaBlog, blog, umbrella, size, doll, html, livedoor, entry, FC, Blog”, and so on. Most of these words are related to blogs. Thus, we put blogs as label on the first principal axis. The second principal axis of longtail authors is characterized by the following words: “political party, last year, bank, finance, Diet, natural disaster, United States of America, the House of Representatives, March, committee, case, administration, prime minister, people, policy, budget”, and so on. These words are related to political and economic issues. Hence, we put political and economic issues as label on the second axis of longtail authors. Labels of longtail authors consist of blogs and political and economic issues.
AlgDesign and Data Collection
Web questionnaire is created for clarifying the degree of the effect of customer choice probability on the basis of the principal axes. However, the paper-based questionnaire is used because most subjects cannot access the website. Web questionnaire is used for the data input format in this research.
Step 1, the result of question items which are based on the principal axes of loyal authors is shown. First of step 1, two axes are extracted as attributes of loyal authors from the results of principal component analysis. These two axes are medical information and accommodations like foreign resorts as shown in Table 2. These two axes have two levels each. Additionally, four levels of price are set by referring to the real prices of HTB.

Asia Pacific Business & Economics Perspectives, 1(1), Summer 2013
82
Table 2. Factors and levels from loyal authors Loyal Providing medical information from HTB
1.YES 2.NO
Having facilities like foreign resorts in HTB
1.YES 2.NO
Price (One day entrance fee including the fee of some institutions)
1.6500JPY 2.6000JPY 3.5500JPY 4.5000JPY
Source: Authors
Second of step 1, following six steps of Aizaki and Nishimura (2007) which is shown in method part of this paper, combinations of these attributes and levels are prepared by using AlgDesign library. Table 3 simply shows the results of attributes and levels which are created by using AlgDesign. The values in Table 3 are numbers which are allocated to each attribute of Table 2. Question items (questions No. 12 to No. 19) are prepared from axes of loyal authors on the basis of Table 3. Table 3. Combinations of factors and levels by using AlgDesign from loyal authors Plan A Plan B PRICE MEDINFO RESORT PRICE MEDINFO RESORT Q 12 2 2 2 1 1 1 Q 13 3 1 2 4 2 1 Q 14 3 2 1 3 1 2 Q 15 4 1 2 1 2 2 Q 16 4 2 1 3 2 1 Q 17 1 2 2 4 1 2 Q 18 1 1 1 2 1 1 Q 19 2 1 1 2 2 2 Source: Authors Table 4. Factors and levels from longtail authors Longtail Providing information by using blogs from HTB.
1.YES 2.NO
Holding events to learn political and economic issues.
1.YES 2.NO
Price (One day entrance fee including the fee of some institutions)
1.6500JPY 2.6000JPY 3.5500JPY 4.5000JPY
Source: Authors
Step 2, question items, which are based on longtail authors are shown. First of step 2, two axes are extracted as attributes of longtail authors from the results of principal component analysis. The two axes are the sending and receiving information by using blogs and the holding of educational events about political

Asia Pacific Business & Economics Perspectives, 1(1), Summer 2013
83
and economic issues in Table 4. Each axis has two levels. Four levels prices are set by referring to the real prices of HTB.
Second of step 2, question items are prepared by combining attributes and levels in Table 4. The method to prepare these by using AlgDesign library is summarized as six steps of Aizaki and Nishimura (2007). Table 5 simply shows that the results of combination of attributes and levels are created by using AlgDesign. The values in Table 5 are numbers which are allocated to each attribute of Table 4. From Table 5, question items (questions No. 20 to No. 27) are created on the basis of axes which are extracted from longtail authors. Conjoint cards are created from the results of loyal and longtail authors. Table 5. Combinations of factors and levels by using AlgDesign from longtail authors Plan A Plan B PRICE BLOG ECON PRICE BLOG ECON Q 20 3 2 1 3 1 2 Q 21 1 2 2 1 1 1 Q 22 4 2 1 2 1 1 Q 23 3 1 2 2 2 2 Q 24 4 1 2 3 2 1 Q 25 2 2 2 4 2 1 Q 26 1 1 1 4 1 2 Q 27 2 1 1 1 2 2 Source: Authors
Questionnaire is prepared by combining this conjoint card and question items of RFM. The affiliations of test subjects are Nakamura Gakuen University (Total 415 response includes the 288 valid response.), Tsukuba International University (Total 50 response includes the 45 valid response.), and Fukuoka University (Total 33 response includes the 28 valid response.). The study period is from July 9 to July 18, 2013. RFM and Conjoint Analysis
RFM. Not only are subjects questioned about the experience of visiting HTB, but also about each RFM. The ratio of visiting HTB is 45.7 percent. The RFM analysis is in accordance with the procedure which is explained in the method section in this paper.
The subjects, whose Recency score is 4, let pass (1) 1.49 months on average from the day of last trip to the day of answering the questionnaire, and (2) 3.65 months on average from the day of last visit to HTB to the day of answering the questionnaire. On the other hand, the subjects, whose Recency score is 1, let pass (1) 20.06 months on average from the day of last trip to the day of answering the questionnaire, and (2) 104.83 months on average from the day of last visit to HTB to the day of answering the questionnaire.
The subjects, whose Frequency score is 4, travel to (1) places which include the same destinations 10.20 times during last five years, and (2) HTB 1.51 times during the last five years. On the other hand, the subjects, whose Frequency score

Asia Pacific Business & Economics Perspectives, 1(1), Summer 2013
84
is 1, (1) travel to places which include the same destination 0.91 times during the last five years, and (2) have not traveled to HTB during the last five years. This means that there are no subjects who have smaller frequency than 25 percentile point.
The subjects, whose Monetary score is 4, spend (1) 70,994.87 yen on average per one time traveling which includes travel expenses and the cost of staying, and (2) 40234.38 yen on average per one trip to HTB which includes traveling expenses and the cost of staying. On the other hand, the subjects, whose Monetary score is 1, spend (1) 17031.75 yen on average per one trip which includes travel expenses and the cost of staying and (2) 4450 yen on average per one trip to HTB which includes travel expenses and the cost of staying.
RFM and conjoint analysis. Conjoint cards consist of (1) two principal factors with two levels each from loyal authors and four levels of prices, and (2) two principal factors with two levels each from longtail authors and four levels of prices. Answers of subjects with high-level score in each RFM to conjoint cards made from loyal authors’ axes are analyzed.
For the results, the subjects of 3 or 4 in Recency scores have the following values. The estimated coefficient value of price is -0.00092 and its probability of significance is 0.1 percent. The estimated coefficient value of foreign resort is 1.00224 and its probability of significance is 0.1 percent. The estimated coefficient value of medical information is 0.38682 and its probability of significance is 1 percent. The Willingness to Pay (WTP) of each factor is 1,089.39 yen for foreign resort and 420.46 yen for medical information.
The subjects of 3 or 4 in Frequency scores have the following values. The estimated coefficient value of price is -0.00086 and its probability of significance is 0.1 percent. The estimated coefficient value of foreign resort is 0.96832 and its probability of significance is 0.1 percent. The estimated coefficient value of medical information is 0.50451 and its probability of significance is 0.1 percent. WTP of each factor is 1,125.95 yen for foreign resort and 586.64 yen for medical information.
The subjects of 3 or 4 in Monetary scores have the following values. The estimated coefficient value of price is -0.00079 and its probability of significance is 0.1 percent. The estimated coefficient value of foreign resort is 1.02563 and its probability of significance is 0.1 percent. The estimated coefficient value of medical information is 0.58431 and its probability of significance is 0.1 percent. WTP of each factor is 1,298.27 yen for foreign resort and 739.63 yen for medical information.
The subjects of 3 or 4 in all Recency, Frequency and Monetary scores have the following values. The estimated coefficient value of price is -0.00098 and its probability of significance is 0.1 percent. The estimated coefficient value of foreign resort is 0.99357 and its probability of significance is 0.1 percent. The estimated coefficient value of medical information is 0.34878 and its probability of significance is 5 percent. WTP of each factor is 1,013.85 yen for foreign resort and 355.90 yen for medical information. The results are summarized as follows.
Lastly, answers of subjects of low score in each RFM to conjoint cards made from longtail authors’ axes are analyzed. For the results, the subjects, whose Recency score is 1 or 2, have the following values. The estimated coefficient value

Asia Pacific Business & Economics Perspectives, 1(1), Summer 2013
85
of price is -0.00079 and its probability of significance is 0.1 percent. The estimated coefficient value of blogs is 0.61439 and its probability of significance is 0.1 percent. WTP of blogs is 777.71 yen. Table 6. Conjoint analysis high level of RFM Estimate Pr(>|t|) Log-
Likelihood
McFadden
R^2
Likelihood ratio
test
R 3 or 4 PRICE -0.00091793 2.731e-14 *** -639.54 0.11101 chisq = 159.73
(p.value = < 2.22e-
16)
RESORT 1.00223851 3.819e-14 ***
MEDINFO 0.38681586 0.001928 **
F 3 or 4 PRICE -0.00085805 < 2.2e-16 *** -875.83 0.1015 chisq = 197.87
(p.value = < 2.22e-
16)
RESORT 0.96831503 < 2.2e-16 ***
MEDINFO 0.50451261 2.549e-06 ***
M 3 or 4 PRICE -0.00079324 3.553e-14 *** -819.57 0.1031 chisq = 188.41
(p.value = < 2.22e-
16)
RESORT 1.02562708 < 2.2e-16 ***
MEDINFO 0.58430942 5.451e-08 ***
RFM
3 or 4
PRICE -0.00097724 3.645e-10 *** -368.12 0.11645 chisq = 97.035
(p.value = < 2.22e-
16)
RESORT 0.99357071 3.253e-09 ***
MEDINFO 0.34877752 0.026352 *
Signif. codes: 0 ‘***’ 0.001 ‘**’ 0.01 ‘*’ 0.05 ‘.’ 0.1 ‘ ’ 1 Source: Authors
The subjects, whose Frequency score is 1 or 2, have the following values. The estimated coefficient value of price is -0.00081 and its probability of significance is 0.1 percent. The estimated coefficient value of blogs is 0.72953 and its probability of significance is 0.1 percent. WTP of blogs is 900.65 yen. The subjects, whose Monetary score is 1 or 2, have the following values. The estimated coefficient value of price is -0.00084 and its probability of significance is 0.1 percent. The estimated coefficient value of blogs is 0.45182 and its probability of significance is 1 percent. WTP of blogs is 537.88 yen. Table 7. Conjoint analysis low level of RFM Estimate Pr(>|t|) Log-
Likelihood McFadden R^2
Likelihood ratio test
R 1 or 2 PRICE -0.00079346 7.055e-11 *** -625.84 0.076494 chisq = 103.68 (p.value = < 2.22e-16) ECON 0.11594044 0.3809387
BLOG 0.61438882 2.965e-06 *** F 1 or 2 PRICE -0.00080841 1.973e-07 *** -392.56 0.089206 chisq = 76.897
(p.value = 5.904e-14) ECON 0.18152163 0.2871047 BLOG 0.72952873 1.898e-05 ***
M 1 or 2 PRICE -0.00084387 1.021e-08 *** -440.38 0.05992 chisq = 56.139 (p.value = 7.3834e-09) ECON -0.03079431 0.848495
BLOG 0.45181732 0.004951 ** RFM 1 or 2
PRICE -0.00108307 8.918e-05 *** -120.4 0.15255 chisq = 43.346 (p.value = 2.8601e-07) ECON 0.17328520 0.562626
BLOG 0.69249649 0.019809 *
Signif. codes: 0 ‘***’ 0.001 ‘**’ 0.01 ‘*’ 0.05 ‘.’ 0.1 ‘ ’ 1 Source: Authors
The subjects, whose all Recency, Frequency and Monetary scores are 1 or 2, have the following values. The estimated coefficient value of price is -0.00108 and its probability of significance is 0.1 percent. The estimated coefficient value of

Asia Pacific Business & Economics Perspectives, 1(1), Summer 2013
86
blogs is 0.69250 and its probability of significance is 5 percent. WTP of blogs is 641.20 yen. The results are summarized as the tables.
DISCUSSION AND CONCLUSION This research has two objectives. The first objective is to clarify customer needs by using blog text mining, while the second object is to detect the more important needs per customer attribute. Second object includes two analyses. The first is RFM analysis. By using RFM analysis, customers are ranked from the viewpoint of Recency, Frequency, and Monetary. These scores are customer attributes. The second is to grasp the important customer needs per customer attribute and price customers would like to pay to satisfy their needs by using conjoint analysis. These analyses enable us not only to execute the market segmentation but also to do targeting.
The results of extracting of customer needs from blog texts are already shown in the section of the results of blog text mining as interpretations of principal axes. The results of RFM and conjoint analysis are the heart of the discussion of this section. This discussion sheds light on important customer needs per customer attribute like RFM from the viewpoint of customers.
In this section, our discussion consists of two parts per customer attribute (RFM score). First, the customer needs which customers with the high RFM level value and price which customers would like to pay to satisfy their needs are analyzed. Second, the customer needs which customers with the low RFM level value and price which customers would like to pay to satisfy their needs are discussed. This procedure enables to execute targeting which the existing blog text mining has never been able to execute. Customers of high RFM level
When customers have scores of 3 or 4 on Recency, Frequency, Monetary, or all RFM, the factors like foreign resorts and medical information significantly affect the probabilities of choices. Therefore, foreign resorts and medical information are important factors for them.
However, the degrees of importance are different on the basis of the values of coefficients. Next, the differences of importance are emphasized. First, the coefficients of foreign resorts for customers whose scores in Recency, Frequency, Monetary, or all RFM are 3 or 4 are compared. The order by which tourists regard the facilities like foreign resorts as the most important factor is as follows. The first is customers who spend more money for the trip to HTB, followed by customers who recently visited HTB, then customers who recently did and frequently visit it and spend more money, and customers who frequently visit it.
Second, the coefficients of medical information for customers whose scores in R, F, M, or all RFM are 3 or 4 are compared. The order by which subjects regard medical information as the most important factor is as follows. The first is subjects who spend more money for the trip to HTB, followed by subjects who frequently visit HTB, then subjects who recently did visit HTB, followed by subjects who recently did and frequently visit HTB and spend more money for the trip to

Asia Pacific Business & Economics Perspectives, 1(1), Summer 2013
87
HTB. These orders are one criterion for selection of priority of product attributes when attributes of target customers are decided.
The selection of product attributes depends on the balance between attributes and price. Customers who regard price as the most important are subjects whose scores of RFM are 3 or 4. Therefore, when target is these subjects, managers need to pay attention to the price. The clue to make decision about price is WTP.
Third, WTPs of subjects whose scores in Recency, Frequency, Monetary, or all RFM are 3 or 4 are compared. Subjects who spend more money think of spending the most money for facilities like foreign resorts. The price is 1,298 yen. Similarly, subjects who spend more money also think of spending the most money for medical information. The price is 740 yen. Subjects who spend more money would like to maintain facilities like foreign resorts, even if they pay 1,298 yen. They would like to be provided medical information even though they pay 740 yen.
On the contrary, the customers who have the least amount of WTP to facilities like foreign resorts and to medical information are subjects who recently visited and frequently visit HTB and spend more money. The prices of their WTPs are 1,014 yen to foreign resorts and 356 yen to medical information. They recently visited and frequently visit HTB and spend more money. It is assumed that such customers are critical of price. When managers provide the target customers with the products and services, they can refer to this WTP and can set a realistic price.
From these discussions, customers who spend more money for the trip to HTB regard facilities like foreign resorts and medical information as more important than customers with other attributes. Therefore, the price they would like to pay is the highest of all compared to customers with other attributes. If they are the target customers, facilities like foreign resorts and medical information are effective even though within the limited range of WTP.
On the other hand, customers who recently did and frequently visit HTB and spend more money for the trip to HTB do not regard medical information as important and do not think of paying much money for medical information when their attributes are compared with other attributes, even if their attributes significantly affect the probabilities of choice. To provide medical information for customers who have the same attributes as theirs is not as effective compared to those of other attributes. Customers of low RFM level
Customers whose scores in Recency, Frequency, Monetary, or all RFM scores are 1 or 2 are discussed. They do not significantly regard events for learning about political and economic issues as important but regard providing information by using blogs as important. Therefore, providing information by using blogs is important for attracting them.
However, the degrees of importance are different. First, coefficients of blogs of customers whose Recency, Frequency, Monetary, or all RFM scores are 1 or 2 are estimated and compared. The order by which customers regard blogs as important is as follows. The first is customers who do not frequently visit HTB very much, followed by customers who did not recently and do not frequently visit HTB

Asia Pacific Business & Economics Perspectives, 1(1), Summer 2013
88
and who do not spend more money for the travel to HTB, then customers who did not recently visit HTB, and customers who do not spend more money for the trip to HTB. Therefore, it seems that knowing the present situations of HTB by blogs is useful for customers who do not visit HTB very much.
The important product attributes for each customer attribute are criteria to decide the priority for selection of target customers. This is especially true when managers would like to expand the market, and customers who have the low-level scores become the target. The important product attributes for each customer attribute are keys. It is clarified that customers who do not frequently visit HTB very much evaluate providing information by using blogs as the important compared to customers with other attributes.
The selection of the important product attribute depends on the balance between attributes and price. Customers who regard price as the most important thing are subjects who did not recently and frequently visit HTB and who do not spend more money for the trip to HTB. This means that these customers have low level scores in all RFM. This is the rational and appropriate result. Therefore, when managers target these customers, they need to pay attention to price setting. The clue for managers to decide the price setting is WTP.
Second, WTPs of customers whose scores in Recency, Frequency, Monetary, or all RFM are 1 or 2 are compared. Customers who do not frequently visit HTB think of spending the most money for providing information by blogs. The price is 901 yen. On the contrary, customers who do not spend money for the trip to HTB very much have the least WTP for providing information by blogs. The price is 538 yen.
Therefore, the amount of money which customers who do not spend money very much would like to pay is calculated. This amount is about half of the amount of money which customers who do not frequently visit HTB would like to pay. This difference of WTP is clue for managers to decide the realistic price setting.
Customers who do not frequently visit HTB regard providing information as more important thing and think of paying more money than customers with other attributes. Therefore, when they are the targets for expanding the market, providing information by blogs is the effective product attribute even though the range is limited within WTP.
On the contrary, customers who do not frequently visit HTB do not regard providing information by blogs as more important than customers with other attributes. Therefore, providing information by blogs is not effective for customers who do not visit HTB very much compared to customers with other attributes, even if it significantly affects the probabilities of choice.
For each group of customers of high and low RFM level, the important product attributes and WTP per customer attributes are examined. Deciding the important product attribute and appropriate price setting for each target customer helps to create the plan for attracting customers. This procedure enables managers to execute targeting per customer attributes, which the existing blog text mining has never been able to execute. This is the contribution of this research.

Asia Pacific Business & Economics Perspectives, 1(1), Summer 2013
89
Finally, the remaining future research issues are summarized. First, the samples of this research questionnaire are undergraduate students. Therefore, it is hard to generalize from the results of this research. Generalization of this research needs a rigorous sampling. Second, the php program needs to be revised for creating web questionnaire form dynamically. Lastly, some items of questionnaire are not encoded well by after-coding. In future researches, the way to collect data needs revision. These are the limitation of this research.
REFERENCES
Aizaki, H., & Nishimura, K. (2007). Introduction to choice experiments using R: Technical report of the National Institute for Rural Engineering. Tsukuba, Japan: National Institute for Rural Engineering.
Kato, J. (2013). Explore the customers' needs for foreign tourism destinations by using blog text mining. Bulletin of Tsukuba International University, 19, 35-50.
Kato, J., & Ishikawa, M. (2011a). Semi-automatic procedure for market segmentation by using massive weblog data. The 2011 Spring National Conference of Operations Research Society of Japan Abstract, 104-105.
Kato, J., & Ishikawa, M. (2011b). Market segmentation on IPad by using weblog data analysis. The National Conference of Japan MOT Society, 25-28.
Kotler, P., & Keller, K. (2006). Marketing management (12th ed). Upper Saddle River, N.J: Pearson Prentice Hall.
Mitamura, T., Iwasa, W., Yukawa, K., & Oohori, T. (2008). The study of tourism informatics using blog. Tourism and Informatics, 4,(1), 57-65.
Pan, B., MacLaurin, T., & Crotts, J.C. (2007). Travel blogs and the implications for destination marketing. Journal of Travel Research, 46(1), 35-45.
Volo, S. (2010). Bloggers’ reported tourist experiences: Their utility as a tourism data source and their effect on prospective tourists. Journal of Vacation Marketing, 16, 297-311.
Wei, J.T., Lin, S-Y., & Wu, H-H. (2010). A review of the application of RFM model. African Journal of Business Management, 4(19), 4199-4206.

Asia Pacific Business & Economics Perspectives, 1(1), Summer 2013
90
The regional movement of human resources in East Asia: A facilitating
factor of economic integration John Paolo R. Rivera Ateneo De Manila University Manila, Philippines [email protected]
ABSTRACT
The movement in remittances from Overseas Filipino Workers (OFWs) is an explanatory factor of temporary labor migration in the Philippines - regardless of the existence of an economic slowdown; the deployment of migrant workers and inflow of remittances has remained relatively stable. Labor movement has been facilitated by labor agreements have been established between partner countries. Case in point, the Philippines receives a significant amount of remittances from Japan, Hong Kong, Korea, and Taiwan as far as East Asia is concerned. Labor agreements and the existing institutional supports providing technical assistance and mutual recognition have facilitated the temporary migration flows by providing intermediation that will ease the flow of labor between places where there are labor surplus to destinations where there are shortages.
JEL Classifications: F15, F22 Keywords: bilateral labor agreement, economic integration, remittances, temporary labor migration
INTRODUCTION With at least 10 percent of its population deployed as permanent residents and/or temporary workers in more than 200 economies, the Philippines has been known as a global exporter of manpower. Due to the scarcity of opportunities in the Philippines, many opted to seek for better pastures abroad to earn a decent living for their families. According to the Philippine Overseas Employment Agency (POEA), from 2008 to 2009, there was a 15.1 percent increase in the number of Overseas Filipino Workers (OFWs) deployed aboard while from 2009 to 2010, there was a 3.4 percent increase. As deployment increase, remittance income remitted to the country also increases. According to the Bangko Sentral ng Pilipinas (BSP), there was a registered inflow of USD 18.8 billion in 2010, which is an 8.7 percent growth from 2009. These inflows account for more than 12 percent of the economy’s Gross Domestic Product (GDP) – an indication that economic growth in the country is externally sourced (Ang, Sugiyarto & Jha, 2009).

Asia Pacific Business & Economics Perspectives, 1(1), Summer 2013
91
Despite the adverse effects of the 2008 Global Financial Crisis (GFC), Filipinos who lost their jobs opted to instead seek for new employment abroad as opposed to coming back home. Reaffirming this trend, the World Bank's Remittance Trends 2007 ranked the Philippines fourth amongst the top recipients of workers’ remittances.
Given the extent of temporary labor migration in the Philippines, this is further armored by existing bilateral labor agreements (BLAs) with partner countries. Hence, the country is using BLAs as an avenue to manage temporary movement of labor (Rivera, Serrano & Tullao, 2013). Furthermore, according to Rivera, Serrano and Tullao (2013), BLAs can be considered as a viable option in expanding and enhancing trade in services.
Hence, given this backdrop on the experience of the Philippines in temporary labor migration, this study1 will focus in addressing the following objectives: � To examine the role of BLAs in the management of temporary labor migration
in selected East Asian economies; and � To assess whether the management of temporary labor migration in East Asia
can promote regional integration.
FACILITATION OF THE REGIONAL MOVEMENT OF PEOPLE
There are two perspectives on the movement of human resources in the East Asian region namely the trade negotiation perspective and the labor market perspective (Tullao, 2008). Trade negotiation perspective is defined as the role of trade negotiations at different levels in facilitating or restricting the flow of manpower across the region. On the other hand, labor market perspective is defined as the market drivers on the regional flow of human resources that stems from the responses of individuals and countries to regional economic and demographic asymmetries that produce differential impact on the labor markets in various countries.
Trade Negotiations Perspective
East Asian economies have participated in trade negotiations at the multilateral level that resulted to the establishment of the General Agreement on Trade in Services (GATS) under the World Trade Organization (WTO). Likewise, countries in East Asia and have entered into agreements towards regional economic cooperation including the ASEAN Framework Agreement on Services (AFAS) to facilitate trade in services. Furthermore, according to Tullao (2008), there are programs within the Asia Pacific Economic Cooperation (APEC) that are intended to enhance trade in services via Mode 4: Movement of Natural Persons (MNP). On the other hand, economies enter into Free Trade Agreements (FTA) to facilitate the flow of goods, capital, services and people with their major trading partners at the bilateral level.
These agreements entered into by countries at various levels of trade negotiations include horizontal and sectoral commitments pertaining to MNP. Additionally, part of the commitments is the enumeration of the limitations on market access and national treatment. According to Tullao (2008), “market access

Asia Pacific Business & Economics Perspectives, 1(1), Summer 2013
92
limitations refer to qualifications and restrictions on the number and type of foreign workers in activities and economic sectors where foreign workers are allowed.” On the other hand, Tullao (2008) referred to national treatment limitations as restrictions on activities and sectors on the basis of nationality of workers.
National treatment limitations are associated with domestic regulations. Foreigners are restricted to practice their profession in a receiving territory due to public interest. In cases where foreign professionals are allowed to practice in a receiving territory, they have to satisfy first qualification requirements such as educational attainment, number of years of experience, and licensing procedures among others. However, it must be noted that these requirements vary across receiving countries. Furthermore, other forms of limitations can include but are not limited to the following: setting a limit on the number of foreign nurses in a hospital, barring accountants, engineers, or teachers to practice their respective profession in a foreign country, and requiring an economic needs test (ENT) before a foreign worker can work in a receiving country. Such limitations will have repercussions on MNP between sending and receiving countries by impeding the flow of workers across borders.
To address these gaps in the qualification requirements across countries, Tullao (2008) specified that receiving and sending countries can establish mutual recognition arrangements (MRA), whose goal is to establish accreditation procedures for equivalency while recognizing the inter-country differences in employment requirements for the practice of professions. Labor Market Perspective
The mismatch in economic growth and population growth facilitates an excessive labor supply, which is being experienced by developing economies that are usually the labor sending countries (Todaro & Smith, 2006). To alleviate the increasing domestic labor underutilization, the international labor market is seen as a destination for the excess labor. However, the entry of foreign workers is constrained by domestic regulations specifically immigration policies of receiving countries, pre-employment requirements, restrictions on VISAs, security clearance, health clearance, personal, and professional references among others (Tullao, 2008). Note that domestic regulations also part of the labor market perspective since the entry of foreign workers has an impact on wages and employment of domestic workers. According to Tullao (2008), due to this potential impact, receiving countries may require ENT before allowing foreigners to enter and work in their destination countries.
To ease the flow of labor across the region, sending and receiving economies have established programs and agreements to lessen the costs and advance the benefits of the regional labor movement through the institutions involved in the management of temporary labor migration and programs for the protection of overseas workers. In the Philippines, the POEA is tasked of managing the outflow of OFWs, certifying recruiters, providing orientation programs for OFWs, protecting OFWs from abuse and violence, and collecting funds for mutual assistance among others. Moreover, non-government organizations (NGOs) conduct pre-deployment seminars to acquaint temporary

Asia Pacific Business & Economics Perspectives, 1(1), Summer 2013
93
labor migrants of their destination country’s culture, laws, and other relevant information related to their work.
Furthermore, the movement of workers can be seen as a response to the labor market asymmetries in East Asia. Consequently, sending countries are pressured to open up their markets or face labor surpluses; and the increasing number of surplus workers will put pressure on them to establish BLAs that will facilitate entry and employment of the surplus labor in neighboring countries (Tullao & Cortez, 2006).
THE ROLE OF BILATERAL LABOR AGREEMENTS The Concept of a Bilateral Labor Agreement
The International Labor Organization (ILO) defined BLAs as formal agreements or memoranda of association to ensure that temporary labor migration flows take place in accordance with agreed principles and procedures. It sets out each country’s commitments, and may provide for quotas, and is more formal, binding, specific, and action-oriented (Wickramasekara, 2006). Meanwhile a less formal agreement is a Memorandum of Understanding (MOU), which is a softer option providing a broad framework to address common concern (Wickramasekara, 2006).
According to Wickramasekara (2006) and Go (2007), most receiving countries prefer MOUs because these are flexible and non-binding agreements and are easier to negotiate, to implement, and to modify according to changing economic and labor market conditions. Likewise, MOUs are the preferred choice for dealing with low skilled labor. Countries sign such agreements for political reasons, to reflect friendly relations, or to reinforce cooperation in managing irregular migration. Meanwhile, for the destination countries, BLAs help achieve a labor flow that meets the needs of employers and industrial sectors, while providing for better management and promoting cultural ties and exchanges. On the other hand, for sending countries, these BAs ensure continued access to overseas labor market opportunities to promote the protection and welfare of their workers. Objectives of BLAs
For labor receiving countries, the primary objectives for entering into any BLAs include the following as enumerated by Go (2007): � To address the manpower needs of employers and industrial sectors; � To promote cooperation in the management of migration; and � To promote cultural and political ties with partner countries.
Meanwhile, for receiving countries, the objectives for entering into these agreements, as enumerated by Go (2007) include: � To ensure continued access to the labor market of receiving countries; � To ease unemployment pressures; � To promote the protection of workers; and � To obtain foreign exchange through remittances. According to Rivera, Serrano and Tullao (2013), BLAs, in comparison with the AFAS and GATS, covers all types of workers, whether skilled or semi-skilled

Asia Pacific Business & Economics Perspectives, 1(1), Summer 2013
94
because of the need of these recipient countries for labor. BLAs can be treated as a facilitating measure to narrow the gap between the labor surplus and labor deficits countries. In the implementation of BLAs, the Department of Labor and Employment (DOLE) though the POEA deploy the preferred type of laborers stipulated in the BLA. In contrast, the AFAS and GATS are very limited in scope and coverage because it is for the enhancement of trade in services and is monitored by the Department of Trade and Industry (DTI). Bilateral Labor Agreement of the Philippines with East Asia
The Philippines has been doing well in negotiating BLAs across the globe. According to Go (2007), since 1974, when the overseas employment program commenced, the country established BLAs with 13 countries, 12 of which are labor receiving and 1 labor sending.
East Asia continues to demand professionals given the development plans of Asian economies to expand their respective economic bases. For instance, Malaysia’s petroleum sector continues to thrive despite the negative effects of the 2008 GFC. Development plans include new infrastructure projects in transportation, communication, tourism, housing, healthcare services, and utilities in the energy sector. Meanwhile, Singapore is expecting a recovery of its economy by 2010 and is on the thrust of becoming a leading global city and knowledge capital in Asia.
Likewise, following the framework that migration is structural and demand driven as mentioned by United Nations Economic and Social Commission for Asia [UN-ESCAP] (2002), the changing demographics and economic dynamism has led to the need for domestic services in nearby countries like Hong Kong and Singapore. Filipino domestic helpers have been meeting this demand since the 1980s. Also, Taiwan is also a lucrative country to send Filipino migrant workers where the composition of migrant workers is a combination of domestic helpers, factory workers, and professionals. This is due to Taiwan’s comprehensive medium term development plan (MTDP) will create 700,000 jobs in the next 5 years and 210,000 jobs of which will be offered to the Philippines, Indonesia, Thailand, and Viet Nam in accordance with BLAs established among these economies.
According to Lee (2006), the memorandum of understanding (MOU) between the Philippines and Taiwan recognized the need to continue promoting the interest of welfare of OFWs through the implementation of socially compliant policies and programs. Moreover, under this MOU, both countries have jointly conceived and agreed to implement a socially responsive program that is designed to optimize the benefits of overseas employment for both Filipino workers and Taiwanese employers.
The MOU implemented a special hiring facility that allows employers in Taiwan to directly hire Filipino workers without manpower agencies. Such facility provides Taiwanese employers an alternative to the hiring of workers through manpower agencies. It also included the commitment to advance the interests of both Taiwanese employers and Filipino workers (Go, 2007). The outcome of the MOU of Taiwan and the Philippines facilitated the entry of OFWs as can be seen in Table 1.

Asia Pacific Business & Economics Perspectives, 1(1), Summer 2013
95
Table 1. Deployment of Overseas Filipino Workers to Taiwan
Year
Deployed Professional
Nurses (New Hires)
Deployed Caregivers (New
Hires)
Deployed Performing
Artists (New Hires)
Deployed Land Based OFWs
(New Hires and Rehires)
2001 9 - 8 38,311 2002 131 - 6 46,371 2003 200 14,716 - 45,186 2004 6 13,928 2 45,059 2005 357 11,604 7 46,737 2006 273 8,410 13 39,025 2007 174 6,346 3 37,136 2008 231 6,251 19 38,546 2009 202 5,942 - 33,751 2010 252 6,184 - 36,866 2011 - - - 41,896 2012 - - - 41,492
Source: Philippine Overseas Employment Administration (POEA)
Meanwhile, the Philippine government through POEA will ensure that the workers to be deployed to Taiwan are technically and medically qualified and should possess a prescribed level of technical qualification and physical, medical and psychological fitness as certified by the Technical Education and Skills Development Authority (TESDA) and the Department of Health (DOH) respectively. Additionally, according to Aguinas (2008), the Commission on Higher Education (CHED) and the Professional Regulation Commission (PRC) work together toward skills standardization, assessment, and certification. On the other hand, the Council of Labor Affairs (CLA) of Taiwan has the role of ensuring that only qualified workers enter their national territories in accordance with agreed terms. Likewise, they also monitor the hiring of Filipino workers for employment in Taiwan by presenting to DOLE and POEA the recruitment applications from their employers for employment of Filipino manpower.
Moreover, in terms of the agencies recruiting workers to be deployed to Taiwan, POEA licenses, regulates, and monitors their performance, and prosecutes illegal recruiters. Also, POEA regulates the placement fees which recruiting agencies charge and maintains its policy of holding the recruitment agency and the foreign employer liable for the claims of OFWs despite demands for limited liability from the agencies and their principals. Along these lines, it also hears welfare cases and referees contractual conflicts between OFWs and their employers. With this, CLA also has the job of addressing disputes together with DOLE and POEA. Also, they have the power to send home any OFWs from Taiwan if their presence is against public interest and national security, which must be communicated to the Philippine embassy.
Therefore, in order that the special hiring facility be implemented effectively, both countries have agreed on the following. � The coverage of the special hiring program included the hiring of workers in
the manufacturing and construction sectors for corporate employers; and

Asia Pacific Business & Economics Perspectives, 1(1), Summer 2013
96
processing of employment documents of household workers classified as name hires and rehires;
� To regulate and process certain job categories, which will require Taiwanese employers to hire Filipino workers through the said special hiring facility;
� The special hiring facility has a prescribed employment contract for every skill category that were acceptable to both parties and consistent with prevailing regulations;
� The special hiring facility was as an option for Taiwanese employers that will not prevent them from hiring through manpower agencies;
� The schedule of expenses of workers hired through the special hiring facility will be mutually agreed by both parties without prejudice to the welfare of the workers and relevant rules and laws of both countries;
� Established mutually acceptable guidelines, systems, procedures, and mechanisms through regular and continuing consultations, with the end view of simplifying and facilitating the hiring and deployment of foreign workers hired through the special hiring facility at the least possible costs.
Table 2. Remittance Inflow from Taiwan
Year Remittance Inflow (In Thousand USD) 2003 66,712 2004 72,714 2005 86,551 2006 168,998 2007 183,357 2008 194,071 2009 91,779 2010 121,728 2011 156,676 2012 167,979
Source: Bangko Sentral ng Pilipinas (BSP)
As a consequence of this facilitating measure to the entry of Filipino workers in Taiwan, the remittance inflow that can be associated with this labor agreement is shown in Table 2. The surge in the remittance inflow from Taiwan from 2005 to 2006 can be associated with the commencement of the MOU between the Philippines and Taiwan because it eased the entry of OFWs to Taiwan’s labor market.
Likewise, the Philippines also established an MOU with South Korea. According to Ha (2006), South Korea, as of 2005, had an MOU with the Philippines for the hiring of foreign workers under its Employment Permit System (EPS), instituted to deal with the problems of irregular migrant workers and to promote and to protect the foreign workers welfare and human rights. Moreover, it sets a quota for the number of workers to be admitted into South Korea and the specific industries in which foreign workers are allowed. A 3-year employment period is set with an initial 1-year labor contract, which can be renewed on an annual basis. With this, the national laws of South Korea also apply to the migrant workers; and it is a government-to-government hiring scheme. Hence, it enabled a number of Filipinos to work in South Korea as seen in Table 3. Notice that there was generally an increase in the number of OFWs in South Korea from 2005.

Asia Pacific Business & Economics Perspectives, 1(1), Summer 2013
97
Table 3. Deployment of Overseas Filipino Workers to South Korea
Year Deployed Performing Artists (New Hires)
Deployed Land Based OFWs (New Hires and Rehires)
2001 94 2,555 2002 256 3,594 2003 237 7,136 2004 615 8,392 2005 687 9,975 2006 487 13,984 2007 1,350 14,265 2008 1,020 12,367 2009 - 14,851 2010 - 11,697
Source: Philippine Overseas Employment Administration (POEA)
As a consequence of this facilitating measure to the entry of Filipino workers in South Korea, the remittance inflow that can be associated with this labor agreement is shown in Table 4. The surge in the remittance inflow from South Korea from 2005 to 2006 can be associated with the commencement of the MOU between the Philippines and South Korea because it eased the entry of OFWs to South Korea’s labor market.
Also, a larger portion of Filipino workers is attracted to work in Japan. Since 1960s, according to POEA, Filipino workers have established their presence in Japan wherein from 5,508 Filipino entrants in Japan in 1960, the number increased several folds to 20,477 in 1970 and some 77,870 OFWs by 2000s. However, according to Tullao (2007), there are issues in MNP that do not facilitate the free movement of migrant labor.
Tullao (2007) highlighted the issues of exploitation and trafficking as negative consequences of labor migration to Japan. The issue of access and cultural opposition was seen as a natural reaction to the proposed liberalization of Japan’s health services sector. Basic sectors in Japan are closed to foreign-service providers to protect the national interest of quality and access by domestic providers while the Philippines has been aggressive in developing and certifying new skills, language and cultural training to meet Japan’s work requirements. Table 4. Remittance Inflow from South Korea
Year Remittance Inflow (In Thousand USD) 2003 59,343 2004 36,951 2005 99,710 2006 100,670 2007 95,434 2008 81,642 2009 97,035 2010 112,215 2011 156,619 2012 176,438
Source: Bangko Sentral ng Pilipinas (BSP)

Asia Pacific Business & Economics Perspectives, 1(1), Summer 2013
98
As Japan opened its labor market to foreign workers and as the economy continuously advanced in its employment of highly skilled foreign workers in healthcare, agriculture, manufacturing, construction, and machine assembly, the Japan – Philippines Economic Partnership Agreement (JPEPA) was established. Case in point, Japan will hire around 60 nurses and 101 caregivers from the Philippines in 2010 under the JPEPA (Tullao, 2007). Hence, it can be implied that establishing labor agreements is indeed an element of regional integration since through these agreements; the movement of workers and flow of remittances to and from East Asia can be facilitated. According to Tullao (2007), as a BLA, the JPEPA has provisions that allow the ease of entry qualified Filipino workers to temporary work in Japan as nurses, caregivers, technical workers, investors, and businessmen. Table 5. Deployment of Overseas Filipino Workers to Japan
Year Deployed IT Related Workers Deployed Land Based OFWs (New Hires and Rehires)
2003 4 62,539 2004 12 74,480 2005 3 42,633 2006 17 10,615 2007 37 8,867 2008 24 6,555 2009 7 6,418 2010 4 5,938
Source: Philippine Overseas Employment Administration (POEA)
Table 5 shows the trend of migrant flows from the Philippines to Japan. However, due to the effects of the global crisis, Japan reduced the number of OFWs it will hire. Specifically, it will hire only around 60 nurses and 101 caregivers from the Philippines in 2010 for the second batch of health workers under the JPEPA (Rivera, Serrano & Tullao, 2013).
As a consequence of this facilitating measure to the entry of Filipino workers to Japan, the remittance inflow that can be associated with this labor agreement is shown in Table 6. Note that although there was a decrease in the number of OFWs deployed to Japan, remittances still registered an increase. Table 6. Remittance Inflow from Japan
Year Remittance Inflow (In Thousand USD) 2003 346,057 2004 308,128 2005 356,659 2006 453,398 2007 401,612 2008 575,181 2009 773,561 2010 882,996 2011 913,548 2012 1,009,595
Source: Bangko Sentral ng Pilipinas (BSP)

Asia Pacific Business & Economics Perspectives, 1(1), Summer 2013
99
Table 7. Deployment of Overseas Filipino Workers to Indonesia
Year Number of Deployed Teachers (New Hires)
Deployed Land Based OFWs (New Hires and Rehires)
2003 15 1,534 2004 12 1,744 2005 3 2,186 2006 18 2,102 2007 44 3,285 2008 45 2,798 2009 40 3,705 2010 37 4,084
Source: Philippine Overseas Employment Administration (POEA) The Philippines also signed a BLA with another labor sending country,
which is Indonesia. According to Go (2007), this agreement was the first successful attempt of the Philippines to consolidate the efforts of other labor sending countries in the region towards promoting the rights and welfare of migrant workers by identifying the following as priorities for joint initiative and cooperation: � Promotion of the welfare and rights of migrant workers for both economies; � Training and certification of migrant workers; � Provision of legal aid for the protection of the rights of migrant workers; � Exchange information, materials, experience, and human resources; and � Development of collaborative training, joint research and development, joint
efforts to promote and protect the welfare and rights of workers, and joint efforts to provide legal assistance for the protection of the rights of workers.
Table 7 shows the trend of migrant flows from the Philippines to Indonesia and as a result of this facilitating measure to the entry of Filipino workers to Indonesia, the remittance inflow that can be associated with this labor agreement is shown in Table 8. Table 8. Remittance Inflow from Indonesia
Year Remittance Inflow (In Thousand USD) 2003 3,520 2004 2,748 2005 3,138 2006 3,604 2007 2,907 2008 3,450 2009 11,282 2010 12,837 2011 15,824 2012 18,319
Source: Bangko Sentral ng Pilipinas (BSP) Inflow of Remittances
Thus, what was deemed as a temporary solution to the unemployment problem in the 1970s, temporary labor migration has been an integral part of the Philippine economy. With billions of remittances from OFWs pouring into the

Asia Pacific Business & Economics Perspectives, 1(1), Summer 2013
100
economy annually, as seen in Table 9, it brought improvements in households and communities and has contributed significantly in the growth of the economy. Such volume of remittances can also be attributed to the existence of BLAs that facilitated the movement of labor from the Philippines to the receiving countries. Note that BLAs do not include provisions on remittance. It is the existing institutional support that facilitates these remittance flows. Table 9. Overseas Filipino’s Remittances from 1997 to 2012
Year Total Remittances (In Thousand USD) 2000 6,050,450 2001 6,031,271 2002 6,886,156 2003 7,578,458 2004 8,550,371 2005 10,689,005 2006 12,761,308 2007 14,449,928 2008 16,426,854 2009 17,348,052 2010 18,762,989 2011 20,116,992 2012 21,391,333
Source: Bangko Sentral ng Pilipinas (BSP)
CONCLUSION AND RECOMMENDATIONS The overall objective of enhancing MNP in East Asia is to expand regional economic integration and there are two drivers to achieve this expansion - through trade negotiations and through labor market mechanisms. Another major explanation on the movement of labor can be traced on an economy’s management of temporary labor migration. The substantial labor flows are influenced by globalization and liberalization measures under the AFAS accompanied by scarcity of job opportunities, labor market asymmetries, and demographic asymmetries and are facilitated by BLAs, which is seen as a potent avenue for enhancing economic integration.
Therefore, it can be deemed that BLAs indeed facilitate the temporary migration flows by making intermediation between places where there are labour surplus to destinations where there are shortages. Also, BLAs can cover the technical and highly skilled professionals under MNP. Likewise, BLAs can cover more industries beyond the services sector, more workers beyond highly skilled professionals, and not merely to expand trade in services but to facilitate the temporary migration flows in addressing labor market imbalances across economies. In a way, these BLAs promote cooperation between two economies. Consequently, this temporary migration flows have created the inflows of remittance income into the sending country. Although, BLAs do not include provisions on remittance inflows, the existing institutional support facilitate these remittance flows. Also, in most MOUs, there is provision for technical assistance

Asia Pacific Business & Economics Perspectives, 1(1), Summer 2013
101
and mutual recognition. In more advanced countries, the transfer of technology is possible and together with brain gain and can have development impact on the sending economy.
If BLAs can be expanded into multilateral labor agreements (MLAs), then it the incidence of labor migration in East Asia can be an avenue for further regional integration. Various reasons are seen regarding the establishment of MLAs such as the apprehension of member countries in making bound commitments in international accords because of prioritization of domestic interest. The balancing of interests among countries is the problem unlike if there are only two economics negotiating. These BLAs in temporary migration are partly responsible for the inflows of remittance into the sending economy.
To date, there is need for regional cooperation to enhance the regional flow of workers to realize the contributions of the movement of foreign workers on regional output and employment. This can be done through the establishment of MRAs, elimination of barriers to entry, movement towards regulatory homogeneity, and continuous liberalization measures on the management of temporary labor migration.
Various BLAs were established by the Philippines with economies in East Asia. Although there are variations, these are primarily intended to facilitate deployment of OFWs in various destinations abroad. For the Philippines, aside from than facilitation objective the protection of deployed workers is likewise emphasized in these BLAs. Although the number of OFWs slightly declined in some destinations due to the effects of the 2008 GFC, this does not indicate that BLAs are ineffective. BLAs are established with the intention of facilitating the movement of OFWs. In other economies, the number of deployed OFWs has increased, which can be deemed as evidences that BLAs have facilitated their movement and remittance generation.
ENDNOTES
1 This was culled from the study of Rivera (2010) entitled Temporary labor migration, and remittance flows as indicators of economic integration presented at the International Association for Asia Pacific Studies (IAAPS) last 17 November 2010 at the Ritsumeikan Asia Pacific University, Beppu, Oita, Japan. It was also presented at The East Asia Watch 2011: 1st Academic International Conference with the theme of Cross-Cultural Studies and Management in East Asia held in Chonburi, Thailand last 18 August, 2011. Disclaimer: The findings, interpretations, and conclusions expressed in this work do not reflect the views of the author’s institutional affiliation, its Board of Executive Directors, or the institutions they represent. The other usual disclaimer applies.
REFERENCES
Agunias, D. R. (2008). Managing temporary labor migration: Lessons from the
Philippine model. Manila: Program on Migrants, Migration and Development. Migration Policy Institute.
Ang, A., Sugiyarto, G., & Jha, S. (2009). Remittances and household behavior in the Philippines (ADB Economics Working Paper Series No. 188). Philippines: Asian Development Bank.
Go, S.P. (2007). Asian labor migration: The role of bilateral labor and similar agreements. Philippines: Philippine Migration Research Network.

Asia Pacific Business & Economics Perspectives, 1(1), Summer 2013
102
Ha, S. (2006). Case study: Republic of Korea. Japan Institute of Labour Policy and Training (JILPT) Workshop on International Migration and Labour Market in Asia. Geneva: International Labor Organization (ILO).
Lee, J. S. (2006). Report on bilateral agreement on recruiting and managing of foreign workers: The case of Taiwan. Japan Institute of Labour Policy and Training (JILPT) Workshop on International Migration and Labour Market in Asia. Geneva: International Labor Organization (ILO).
Memorandum of Understanding between the Taipei Economic and Cultural Office in the Philippines and the Manila Economic and Cultural Office in Taiwan on the Special Hiring Program. (2006).
Rivera, J.P.R., Serrano, D.J.D., & Tullao, T.S. (2013). Bilateral labor agreements and trade in services – The experience of the Philippines. In S. Saez (Eds.). Let Workers Move: Using Bilateral Labor Agreements to Increase Trade in Services (109-127). Washington D.C., United States of America: International Bank for Reconstruction and Development / The World Bank.
Todaro, M. P., & Smith, S.C. (2006). Economic development (8th edition). Philippines: Pearson South Asia Pte. Ltd.
Tullao, T.S. (2007). Factors affecting the movement of human resources from the Philippines to Japan. Manila: De La Salle University
Tullao, T.S. (2008). Movement of human resources: An avenue for regional integration. Tokyo: Summer Institute of the Global Institute for Asian Regional Integration.
Tullao, T.S., & Cortez, M.A.A. (2006). Enhancing the movement of natural persons in the ASEAN region: Opportunities and constraints. Bangkok: Asia-Pacific Research and Training Network on Trade.
United Nations Economic and Social Commission for Asia and the Pacific (UN-ESCAP). (2002). International migration: An emerging opportunity for the socioeconomic development of the ESCAP region (Social Policy Paper No. 6.) Bangkok: ESCAP
Wickramasekara, P. (2006). Labour migration in Asia: Role of bilateral agreements and MOUs. International Migration and Labour Market in Asia.

Asia Pacific Business & Economics Perspectives, 1(1), Summer 2013
103
Contributors Pajaree Ackaradejruangsri is a Ph.D. candidate from Ritsumeikan Asia Pacific University in Beppu, Oita, Japan. Her research interests revolve around product quality for marketing and management research. Behrooz Asgari is a Professor of Operations and Information Technology Management at Ritsumeikan Asia Pacific University. He took his Doctor of Philosophy in Industrial Engineering and Management at the Tokyo Institute of Technology, Graduate School of Decision Science and Technology, Tokyo, Japan. He specializes on innovation and institutional dynamics. John David C. Castillo is an undergraduate student of De La Salle University, Manila, Philippines taking up Bachelor of Science in Applied Economics and Bachelor of Science in Accountancy. His research interests include accounting and environmental economics. She is mentored by Prof. Cynthia P. Cudia. Cynthia P. Cudia is an Assistant Professor of Accountancy at De La Salle University, Manila, Philippines. She took her Master of Science in Accountancy from De La Salle University. She is currently finishing her Doctor of Philosophy in Economics from the same university. Her research interests include econometric modeling, statistics, and financial performance analysis. Harinatha R. Beeram, is a Master of Business Administration student at Ritsumeikan Asia Pacific University, Japan. His research interests include innovation and institutional dynamics. He is mentored by Dr. Behrooz Asgari. Tetsuro Hyodo is a Doctor of Engineering and a Professor at the Tokyo University of Marine Science and Technology. His research interests are demand forecast analyses on transportation planning. Discrete choice models are the center of his research field. Mamoru Imanishi is a postdoctoral researcher at the Fukuoka University Institute of Quantitative Behavioral Informatics for City and Space Economy (FQBIC), Japan. His research interests are algorithmic studies on optimal estimation of non-intrusive appliance load monitoring for smart grids and game theoretic studies on collective decision-making in urban redevelopment. Junichi Kato is an Associate Professor of Marketing at the Department of Media and Communication Studies of Tsukuba International University, Japan. He obtained his Ph.D. in Commerce from Kobe University, Japan. His research interests include clarifying market creation processes. Together with his co-authors, they recently suggested a procedure to clarify the creation of markets by using mainly text data from social media such as the blogs.

Asia Pacific Business & Economics Perspectives, 1(1), Summer 2013
104
John Paolo R. Rivera is an Assistant Operations Manager at Veritas Financial Partners. Prior to joining the financial services industry, he was an Associate Professor at De La Salle University, Manila, Philippines. He was also a Research Associate at the Angelo King Institute for Economic and Business Studies (AKIEBS). He obtained his Doctor of Philosophy in Economics, Master of Science in Economics, and Bachelor of Science in Applied Economics (Magna cum laude) from De La Salle University. He is currently taking the Ateneo-Regis Master in Business Administration at the Graduate School of Business of the Ateneo De Manila University. His fields include Macroeconomics and Macroeconomic Modeling, International Trade, Econometrics, Mathematical Economics, and Economic Development.
Maria Claret M. Ruane earned her Ph.D. in International Economic Development from the University of California-Riverside and her B.S. and M.A. in Economics from San Jose State University in California. She is currently Full Professor of Economics at the University of Guam-School of Business and Public Administration and the Resident Economist for the University of Guam-Pacific Center for Economic Initiatives. She has more than 20 years of research and advisement experience in International Macroeconomic Development, with special interest in policy formulation and the Asia-Pacific region. Saburo Saito is a Doctor of Engineering and a Professor of Regional Science and Consumer Behavior Analysis under the Faculty of Economics of Fukuoka University, Japan. His research concern is to develop quantitative methods for city and regional planning based on consumers’ micro-behavior data such as shopping and tourism using probabilistic, statistical, and data mining models. His statistical method to estimate the pattern of consumer shop-around behavior was registered as a Japanese Patent in 2006. Fred R. Schumann is an Associate Professor of Global Resources Management at the University of Guam. He holds a B.A. from Western State College in Colorado, an M.A. from the University of Oregon, and a PhD from Ritsumeikan Asia Pacific University, Japan. He has participated in economic revitalization projects with the University of Guam’s Pacific Center for Economic Initiatives (PCEI) and is active as a Board Member of Guam’s Tourism Education Council (TEC) and as a member of the Guam Visitors Bureau’s Research Committee. He has conducted extensive research on modern society and overseas tourism, with a focus on how current changes in society affect consumption and leisure habits.

Asia Pacific Business & Economics Perspectives, 1(1), Summer 2013
105
Guidelines for Contributors
EDITORIAL OBJECTIVES The objective of the Asia Pacific Business and Economics Perspective (Perspectives) is to publish high-quality theoretical, empirical, business case studies, policy research and methodological research in the fields of business and economics.
EDITORIAL POLICIES In line with the objective of Perspectives, priority shall be given to the following submissions:
� Theoretical research: Studies that explore or test theoretical issues and provide additional insights on the issues.
� Empirical research: Studies that re-examine important empirical work using alternative theoretical or empirical frameworks, or a different data set. These studies often involve experimental designs and multivariate techniques that examine relationships among variables.
� Business case studies: Studies that illustrate best practices of companies or industries on emerging business concepts.
� Policy research: Studies that use business field research to enact policies on an economy, country, or community.
� Methodological research: Studies that present new approaches in analyzing data or addressing research problems.
� Review articles: Surveys that review and critically evaluate the literature. A review article must go beyond summarizing previous research. It must provide a critical and integrative evaluation of prior research, develop a conceptual framework to explain contradictory findings and suggest directions for further research.
Perspectives also encourages and welcomes manuscripts that use an
interdisciplinary approach (i.e. law and economics) in analyzing issues as well as those that use multiple research methods to support hypotheses.
In addition to the above types of articles, Perspectives also welcomes critiques, short notes, or comments on previously published articles and consequently, rejoinders from the authors of these articles. Short articles which are not full-length research papers, but the content of which adds new insights into or knowledge to their respective fields will be considered. These short articles and comments shall be included under a separate section called - Research Notes.
PUBLICATION DETAILS Perspectives is a bi-annual peer reviewed journal of APUGSM Conferences and the Asia Pacific Business and Economics Research Society. The two issues are released

Asia Pacific Business & Economics Perspectives, 1(1), Summer 2013
106
every summer and winter in Japan which coincides with, but not limited to, the APUGSM Conferences.
Our double blind peer-review process is composed of faculty from Ritsumeikan Asia Pacific University, Japan, keynote speakers from the APUGSM Conferences, and academic networks of the editors from scholarly journals. We do not charge for review fee, hence, the peer review process is determined based on the matching of the topic and the expertise of the reviewer.
The journal comes with the one time annual membership of presenting authors in the APUGSM Conferences. Annual membership to the Asia Pacific Business & Economics Research Society is USD70. For non-members, a printed copy may be requested for USD25 per issue inclusive of standard mailing costs.
REVIEW PROCESS Papers may be published two ways: (1) presentation at APUGSM Conferences; (2) and via direct submission to APBERS.
Presented papers at the APUGSM Conferences are evaluated by the review panel composed of the conference chairs, keynote speakers, and APBERS board members. Outstanding papers are invited for submission to the peer review process.
Papers are then reviewed by an Advisory Editorial Board and invited experts in the fields of business and economics. A ten-point grading scale is used. Papers with more than 90 percent score are considering a clean acceptance and the authors may or may not considering the comments of the reviewers. Papers with 80 to 89 percent are considered minor acceptance with required revisions from the reviewers. Papers with 70 to 79 percent score are considered accepted with required major revisions. Papers scoring below 70 are returned to the authors with constructive comments. Each author of a paper not accepted is given a written notice of the action taken on his/her paper.
From the pool of articles reviewed, six or more papers are reviewed again by the Editor-in-Chief and the Managing Editor. If more revisions are required, the papers are sent back to the authors for revision and re-submission. The Editorial Board of the APBEP reserves the right to keep copies of all papers submitted.
Direct submissions to APBERS are also welcome provided that the papers qualify for the thematic issues. Authors of direct submission must then be a member of APBERS to commence the peer review process and eventually publish.
SUBMISSION OF INITIAL MANUSCRIPT
Manuscripts submitted must not have been published or accepted for publication elsewhere. Authors may e-mail their submissions to the Editor at [email protected].
STYLE GUIDELINES A manuscript should be written in APA style. It should be typed single spaced, on B5 paper (17.6-cm. x 25.01-cm.), with a margin of 2.54-cm. on top and bottom and

Asia Pacific Business & Economics Perspectives, 1(1), Summer 2013
107
3.17-cm. on the left and right. It should not exceed 20 pages, inclusive of text, tables, figures, references, and appendices. The manuscript should be typed with Calibri 10 pt. font. The right-hand margin should have justified alignment. Equations must be numbered. Footnotes should not be used for reference purposes and should be avoided when possible. All references and/or content notes must be placed at the end of the text. A detailed set of style guidelines will be sent to the author once a manuscript is accepted for publication.
SUBMISSION OF FINAL MANUSCRIPT
The mandatory word processor for the final version is Microsoft Word. The author should also submit a short profile for inclusion in the section - The Contributors. It should include the complete name of the author, academic and/or professional affiliations, educational background, e-mail address and research themes.
DISCLAIMER The findings, interpretations, and conclusions expressed in the studies included in this issue do not reflect the views of the author’s institutional affiliation, its Board of Executive Directors, or the institutions they represent. The authors execute a publication copyright agreement and assume all liabilities. The authors agree to hold harmless and indemnify the Asia Pacific Business & Economics Research Society and the Editor of the Asia Pacific Business & Economics Perspectives against any claim, demand, suit or action arising from claims of plagiarism, libel, defamation, obscenity, unlawfulness or invasion of privacy or copyright infringement in the Work. The author shall be responsible for the integrity of the contents of their work. The Advisory Editorial Board is responsible for the selection of manuscripts for publication from among those submitted for consideration. The editors of Perspectives accept final manuscripts in digital form and make adjustments solely for the purposes of pagination and organization.

Asia*Paci-ic*Business*&*Economics*Perspectives*is*a*biUannual*peer*reviewed*journal*of*APUGSM*Conferences*and*the*Asia*Paci-ic*Business*and*Economics*Research*Society.**The*two*issues*are*released*every*summer*and*winter*in*Japan*which*coincides*with*the*APUGSM*Conferences.**Our*double*blind*peerUreview*process*is*composed*of*faculty*from*Ritsumeikan*Asia*Paci-ic*University,*Japan,*keynote*speakers*from*the*APUGSM*Conferences,*and*academic*networks*of*the*editors*from*scholarly*journals.**We*do*not*charge*for*review*fee,*hence,*the*peer*review*process*is*determined*based*on*the*matching*of*the*topic*and*the*expertise*of*the*reviewer.**The*journal*comes*with*the*one*time*annual*membership*of*presenting*authors*in*the*APUGSM*Conferences.**Annual*membership*to*the*Asia*Paci-ic*Business*&*Economics*Research*Society*is*USD70.**For*nonUmembers,*a*printed*copy*may*be*requested*for*USD30*per*issue*inclusive*of*standard*mailing*costs.**For*correspondence,*contact:**THE*EDITOR*Asia*Paci-ic*Business*&*Economics*Perspectives*Ritsumeikan*Asia*Paci-ic*University*Faculty*Of-ices,*B408*1U1*Jumonjibaru,*Beppu,*Oita,*8748577,*Japan*Telephone*No.*+81977*78*1232*[email protected]*
APUGSM*CONFERENCES*