Embed Size (px)
Citation preview

141
Introduction
Government and Scientists have been showing particular interest in oil pollution in aquatic systems due to release of large amounts of oil in the water bodies. The Niger Delta, as now defined officially by the Nigerian government, extends over about 70,000 km² and makes up 7.5% of Nigeria's land mass. The Niger delta is an oil-rich region, and has been the centre of international controversy over devastating pollution.
The effects of oil in the fragile Niger Delta communities and environment have been enormous. Local indigenous people have seen little if any improvement in their standard of living while suffering serious damage to their natural environment. According to Nigerian federal government figures, there were more than 7,000 oil spills between 1970 and 2000 (Vidal, 2010).
A B S T R A C T
The physicochemical fate of a simulated oil spill (930m3 ) in a brackish surface water of 1.5m2 in the Niger Delta was investigated. The model included the most significant processes like mechanical spreading, evaporation, dissolution and the change in density and viscosity. These processes were described by a set of differential equations and were allowed to vary simultaneously even though they depended on one another. The rate of evaporation and dissolution were 0.02469% and 0.00357% at 900seconds respectively. Physicochemical parameters of the River water prior and after crude oil contamination include pH 7 and 7.33, dissolved oxygen 7.2 and 6.0mg/l and nitrate 2.47 and 6.53 mg/l respectively. At a probability level of 0.05,there was no significant difference in the microbiological characteristics of the River water and sediment prior and after crude oil contamination.The model predicts the variation of water incorporation, density and viscosity but seems to overestimate the fraction evaporated.
KEYWORDS
Physicochemical fate, simulated oil spill, evaporation, dissolution
Modeling of the Physicochemical Fate of a Simulated oil spill in brackish surface water in the Niger delta, Nigeria
Williams, Janet O.1* and Odokuma, Lucky O.2
1Department of Applied and Environmental Biology, Rivers State University of Science and Technology, Port Harcourt, Rivers State, Nigeria 2Department of Microbiology, University of Port Harcourt, Port Harcourt, Rivers State, Nigeria Corresponding author
ISSN: 2347-3215 Volume 2 Number 9 (September-2014) pp. 141-152
www.ijcrar.com

142
Complex processes of oil transformation in the aquatic environment start developing from the first seconds of oil's contact with water bodies. The progression, duration, and result of these transformations depend on the properties and composition of the oil, parameters of the actual oil spill, and environmental conditions. The main characteristics of oil transformations are their dynamism, especially at the first stages, and the close interaction of physical, chemical, and biological mechanisms of dispersion and degradation of oil components up to their complete disappearance as original substances. Similar to an intoxicated living organism, an aquatic ecosystem destroys, metabolizes, and deposits the excessive amounts of hydrocarbons, transforming them into more common and safer substances. Some fate of oil spill include the following: physical transport evaporation, dissolution, emulsification, sedimentation and biodegradation
Physical transport: During the first few days after the spill, a considerable part of oil transforms into the gaseous phase. Besides volatile components, the slick rapidly loses water-soluble hydrocarbons but the more viscous fractions slow down the slick spreading.
Further changes take place under the combined impact of meteorological and hydrological factors and depend mainly on the power and direction of wind, waves, and currents. An oil slick usually drifts in the same direction as the wind. While the slick thins, especially after the critical thickness of about 0.1 mm, it disintegrates into separate fragments that spread over larger and more distant areas. Storms and active turbulence speed up the dispersion of the slick and its fragments. A considerable part of oil disperses in the water as fine droplets
that can be transported over large distances away from the place of the spill.
Evaporation occurs when the lighter substances within the oil mixture become vapors and leave the surface of the water. This process leaves behind the heavier components of the oil, which may undergo further weathering or may sink to the ocean floor. For example, spills of lighter refined petroleum-based products such as kerosene and gasoline contain a high proportion of flammable components known as light ends. These may evaporate completely within a few hours, thereby reducing the toxic effects to the environment. Heavier oils leave a thicker, more viscous residue, which may have serious physical and chemical impacts on the environment. Wind, waves, and currents increase both evaporation and natural dispersion.
Dissolution: Most oil components are water-soluble to a certain degree, especially low molecular-weight aliphatic and aromatic hydrocarbons. Polar compounds formed as a result of oxidation of some oil fractions in the aquatic environment also dissolve in seawater. Compared with evaporation, dissolution takes more time. Hydrodynamic and physicochemical conditions in the surface waters strongly affect the rate of the process.
Emulsification. Oil emulsification in the marine environment depends, first of all, on oil composition and the turbulent regime of the water mass. The most stable emulsions such as water-in-oil contain from 30% to 80% water. They usually appear after strong storms in the zones of spills of heavy oils with an increased content of non volatile fractions (especially asphaltenes). They can exist in the marine environment for over 100 days in the form of peculiar "chocolate mousses". Stability of these emulsions

143
usually increases with decreasing temperature. The reverse emulsions, such as oil-in-water (droplets of oil suspended in water), are much less stable because surface-tension forces quickly decrease the dispersion of oil.
This process can be slowed with the help of emulsifiers - surface-active substances with strong hydrophilic properties used to eliminate oil spills. Emulsifiers help to stabilize oil emulsions and promote dispersing oil to form microscopic (invisible) droplets. This accelerates the decomposition of oil products in the water column.
Sedimentation: About 10-30% of oil is adsorbed on the suspended material and deposited to the bottom. This mainly happens in the narrow coastal zone and shallow waters where particulates are abundant and water is subjected to intense mixing. In deeper areas remote from the shore, sedimentation of oil (except for the heavy fractions) is an extremely slow process.
Biodegradation:The fate of most petroleum substances in an aquatic environment is ultimately defined by their transformation and degradation due to microbial activity. About a hundred known species of bacteria and fungi are able to use oil components to sustain their growth and metabolism.
In pristine areas, their proportions usually do not exceed 0.1-1.0% of the total abundance of heterotrophic bacterial communities. In areas polluted by oil, however, this portion increases to 1-10% [Atlas, 1993].
The objective of this study was to model the physicochemical fate of a simulated oil spill in brackish surface water in the Niger Delta, Nigeria.
Methods
Water and Sediment Samples Sources and Collection
Water and sediment samples were collected from Eagle Island (Brackish water) behind the Rivers State University of Science and Technology, Port Harcourt, Rivers State, Nigeria. Physicochemical analyses of the water and sediment samples were determined in a simulated environment (Fig 1). River Water served as the liquid phase while the solid phase was sediment from the brackish aquatic environment. Water troughs made of glass materials were used for the tests; with dimensions: 1.5m length x 1m width x 0.3m depth. Each water trough had an outlet situated 16cm from the bottom of the trough. The experimental set-up illustrated was used to monitor various parameters prior to covering with black polythene paper to assess biodegradation. The spread of oil was determined with the aid of a stopwatch and tape measurement. The wind speed and direction were assumed. In this paper, only the physicochemical fate of oil spill would be considered.
Crude Oil
Bonny light crude oil obtained from Nigerian National Petroleum Corporation (N.N.P.C.) Port Harcourt, was employed in this study.
Chemical Reagents
The following chemical reagents: Manganese Sulphate solution, Alkaline-Iodide-Azide reagent, Silver nitrate solution, Potassium Chromate indicator solution, Standard Sodium Chloride solution, Potassium dichromate solution, Concentrated Sulphuric acid, Ferrous ammonium Sulphate solution, Ferroin (indicator solution), anhydrous sulphate

144
solution, etc. employed in this study were products of Aldrich Chemical Co, Milwauke, USA, BDG Chemicals, Poole, England and Sigma Chemical Company, St. Louis Missouri, USA.
Preparation of test concentration
Pre sieved sediment was mixed with the crude oil to obtain the desired concentrations (5,000ppm, 50,000ppm and 100,000ppm).
Physico chemical Analyses
The pH of the test water was determined using the Jenway pH meter (3015 model). Azide modification method as described in (APHA, 1998) was employed for the determination of dissolved oxygen while conductivity was determined using a WTW electronic conductivity meter model, Germany. The mercury thermometer was used to determine the temperature. Salinity was determined by employing Argentometric method (APHA, 1998).
Bacteriological Analyses
The baseline analysis of the river water and sediment was done and the analysis immediately the simulation is done with the crude oil on the environment. The total heterotrophic bacterial count was performed in duplicates in nutrient agar plates using the spread plate method( APHA,1998). Plates were enumerated after 48 hours of incubation. Vapour phase transfer method (Okpokwasili et al.,1988) was used in estimating the population of crude oil utilizing bacteria..Modified mineral Salt medium (Mineral C) was inoculated with river water and sediment samples (Katsner et al.,1994). Plates were enumerated after 7days of incubation at room temperature
Determination of Fate of Oil Spill using Nigerian Oil Spill Method (NOSM) Evaporation
Mackay evaporative exposure formula developed by (Mackay, 1980) was used. It is mostly used to calculate the evaporation rate of oil. Evaporation depends on the type of oil, spill area, oil slick thickness, vapor pressure and mass transfer coefficient. These are in turn composition of the oil, wind speed and temperature.
Dissolution
Mackay and Leonine algorithm for dissolution of oil is used. The method of Cohen et. al.,(1980) is applied. Dissolution accounts for a negligible fraction of the mass balance of the oil. It is a function of oil slick area, dissolution mass transferability and oil solubility in water.
Mechanical Spreading
Fay s spreading theory of 1971 was used. In Fay s theory, oil spill is considered to pass through 3 phases. In the first phase, only gravity and inertial forces are important. In the second phase, gravity and viscous forces dominate. The third phase is governed by the balance between surface tension and viscous forces.
Shoreline deposition
NOSM simulates the shoreline deposition as an exponential decay function. The movement of the oil slick in the model actually represents the movement of the centroid of the slick. The amount of oil that can be deposited onshore is a function of the area of the shore exposed to tide and wave action. This model is based on a simplified version of Reed et. al. ,(1989).

145
Emulsification
Nigerian Oil Spill Model formula on emulsification is based on a function of evaporative losses and change in water content which is based on Mackey et.al. (1982).
Advection
This is the main mechanism that governs the drifting of suspended oil and surface of oil slick. The advection of surface oil is caused by combined effects of surface currents and wind.
Results and Discussion
Table 1 shows some physicochemical parameters of the liquid phase of the Solid Phase Continuous Flow System(SPCFS).The pH fell within the range of the acceptable limits for natural aquatic systems which is between 6-9 (FMEnv ,1991). Conductivity is strongly influenced by the concentration of dissolved solids. The conductivity level was within the permissible limits of FMEnv, 1991. The sulphate, nitrate and salinity levels were all within the acceptable limits (FMEnv, 1991). The result of the Physicochemical analyses of the river water and sediment prior and immediately after the crude oil pollution is shown on table 1.
The result of the microbiological characteristics of the river water and sediment prior to crude oil contamination and immediately after the pollution is shown on table 2 below. After crude oil pollution, all the microorganisms present were slightly higher than prior pollution but there was no significant difference at 0.05 confidence level.
Evaporation is a function of many variables. (1) Wind speed at 10m above water surface (2) spill area (3) surface temperature (4) initial vapor pressure of oil among other variables.
F =
PotCKInInPo
C E
11.........................
.............................................. (1)
Where F = KEt is the evaporative exposure term which varies with time and environmental conditions KE = KM AVm
(RTVo); Km = 0:0025 Uwind0.78 is the mass
transfer coefficient in m/sec. Uwind is the wind speed in m/s
A = Spill area in m2
Vm = Molar Volume in cubic meters per mol. R = Gas constant, 82.06 x 10⁻⁶ atm m3 mol-1
K-1
T = Surface temperature of oil in degree Kelvin which is generally close to the ambient temperature in degrees Kelvin Po=Initial vapor pressure
Vo = Initial Spill volume in cubic meter. The initial vapor pressure, Po in atm at the temperature, TE is In Po = 10.6 (1- To/TE)
Where To = Initial boiling point in 0K, the constant, C can be determined by the relationship, C = constant. C value and initial boiling point, To are calculated at TE = 2830K for various types of oils.
Through curve fittings (numerical analysis) C and To at TE = 2830k can be calculated C = 1158.9 API-1.1435
To = 542.6
30.275 API + 1.565 API2
0.03439 API3 + 0.0002604 API4.
146
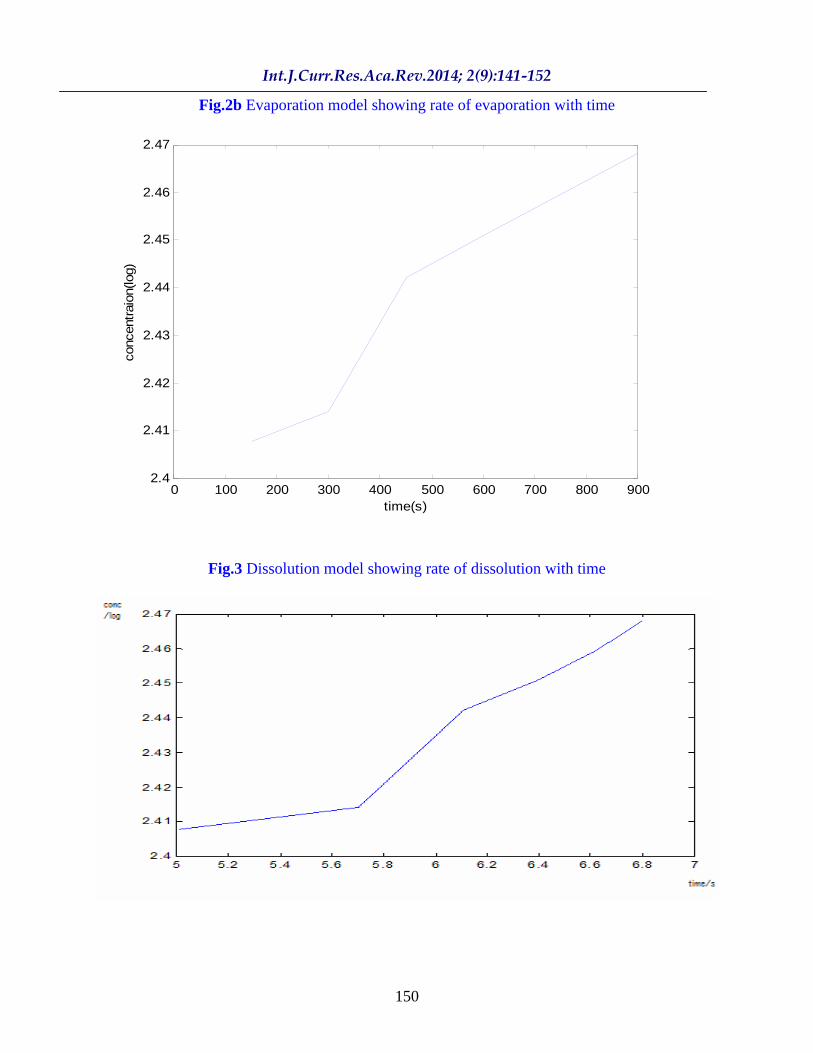
The results in Figs. 2a and b show the evaporation model with area of spill and time. Evaporation rate was 0.02469% at 900seconds. Dissolution is a function of oil slick area, dissolution mass transferability and oil solubility in water. Total Dissolution Rate, N is calculated by:
N=KAsS................................................................................................................. (2)
Where N is the total dissolution rate of the slick in g/hr.; K is the dissolution mass transfer coefficient in m/hr., As is the slick area in m2 and S is the oil solubility in water. The result in Fig. 3 shows dissolution with time.
In this study, the rate of dissolution at 900 seconds was 0.00357%. In mechanical Spreading, 3 phases are considered during the spreading of the oil The slick. Spreading is assumed to be radial. Gravity
Inertia 4
1214.1 tg ................................................
....... (3) Gravity - Viscous
61
21
23298.0 Vtg ...................................
........ (4) Surface tension - Viscous
41
123260.1 wVpt ............................................ (5)
= 1 (eo/ew) V = Kinetic Viscosity (constant) 1.14 x 10⁻⁶
m2S-1 or stoke (st) g = 9.8m/s t = time of spill
= total volume of crude oil ew = water density (1.0) eo =oil density
= time step
The result in Fig. 4 shows the initial spread of oil. The overall surface area of the slick increased with time. Jeffery, 1973; Clark and Macleod, 1977,Shen,et.al.,1987 reported an increase in the overall surface area of the slick during the early stages of an oil spill in water, thereby enhancing mass transfer via the evaporation and dissolution processes. The equation for emulsification is presented below but no results are achieved due to lack of data necessary to give information about it. Nigerian Oil Spill Model s formulation on emulsification is based on a function of evaporation losses and change in water content. It is as follows:
Y = C3
tWC 21
6102exp1
3
................................
....................... (6) Where; Y = Fractional water content C3= Mousse viscosity constant (final fraction water content) 0.7 for crude oils. W = Wind speed (m s-1).
Mousse formation causes an increase in viscosity which may be computed by the Mooney equation:
YC
Y
30 1
5.2exp ..................................
..................................................... (7)
Where; µ0 = Parent oil Viscosity (cP). Buchana et. al. (1988) calculates the parent oil viscosity by µ0 =224A ½ where A = Asphaltene content (%)
The equation for shoreline deposition is presented below, but no results are achieved due to lack of data necessary to give information about half
life of the shoreline

147
in which the oil that reaches the coastline is deposited.
5.01b
b ................................. (8)
Where,
b
= Vol. of beached oil entrained into
the sea during each of time step.
b = volume of oil on the beach.
= half-life. = time step.
The equation for advection-diffusion (Venkatesh 1988) is presented below but no results are achieved due to lack of data necessary to give information about it. The diffusive part of the equation represents spreading of the oil itself and the convective term represents the advection of oil by current and winds (Paladino et.al.2000). The governing equations for the motion and spread of the oil on the surface water can be written as a conventional advection diffusion equation:
Model Equation for Advection Diffusion;
yxDyxMSSCz
CKzCCV
y
CKy
yx
CKx
zCV
yCU
xt
C
SSdCSS
ywvb
SSSSSS
,,1
............................. (9)
Where x, y, z and t are space and time variables; z = vertical co-ordinate measured downward from the water surface; Cs = local oil concentration on water surface layer per unit area, Cv = the volumetric oil concentration of oil in the suspended layer per unit volume of water; Us and Vs are the components of different velocities in x and y directions respectively; kx, ky and kz are the
diffusion coefficients in the x,y and z directions respectively; 1 = coefficient representing probability in oil droplet reaching the water surface; Vb = the bouyant velocity of suspended oil parcels, = coefficient describing the rate at which the surface oil is dispersed into the water column, Sd and SE are the rate of dissolution and evaporation per unit area of the surface slick respectively; Ms = effect on the distribution of surface oil by shoreline disposition.
Oil spill simulation model is used in oil response and contingency planning as a tool in oil fate and impact assessment (Rossouw, 1998). In the event of an oil spill taking place, predictions of the slick can be supplied, provided that the necessary meteorological information is available (Rossouw, 1998).
In this study, it was also observed that evaporation is dependent on time and area of spill. Only about 0.02469% of crude oil in 900 seconds was lost by evaporation. This small fraction of oil evaporated is because of the small area of spill available (1.5m2).
Dissolution accounts for only a small portion of the important behavior parameter because the soluble components of oil, particularly the smaller aromatic compounds are more toxic to aquatic species than the aliphatic components. In our study, a negligible fraction of the mass balance of oil was lost by dissolution. Cohen et.al, 1980 reported similar findings where a little fraction of oil was lost by dissolution.
In this study, during the early stages of the oil spill in water, the overall surface area of the slick increased. Jeffery 1973; Clark and Macleod, 1977, Shen, et.al, 1987 reported an increase in the overall surface area of the slick during the early stages of an oil spill in

148
water, thereby enhancing mass transfer via the evaporation and dissolution processes. Our study shows the first phase of the spread of oil lasts for only a few minutes. The second phase was also considered, that is, gravity
viscous spreading in an area of
1.5m2 with the formula according to Fay s models as modified by Wang et al. (1975). The third phase, the tension viscous phase was neglected because it occurs when the
slick may have dispersed or broken into separate slicks.
From the study on the rate of emulsification of crude oil, an uptake of about 60% water into oil with increased viscosity and volume was observed. The temperature and oil composition (presence of certain constituents which favor mousse formation) are factors on which emulsification depends.
Fig.1. Set-up for the monitoring of the fate of oil spill
Table.1 Physicochemical analysis prior and after crude oil contamination PARAMETERS POLLUTION PERIOD Eagle island water Prior After pH 7.33 7.0 Dissolved oxygen (DO) (mg/l) 7.2 6.0 Biochemical oxygen demand (mg/l) 3.84 4.36 Chemical oxygen demand 80.0 27.4 Salinity (mg/l) 10.7 10 Conductivity (µs/cm) 1684 1662 Total dissolved solid (mg/l) 2,140 1,340 Nitrate (mg/l) 2.47 6.53 Sulphate (mg/l) 62 39 Phosphate (mg/l) 0.08 0.17 Ammonia (mg/l) 0.02 0.12 Total suspended solid (mg/l) 4,000 8600 Total organic carbon (%) 8.96 14.03 Dissolved organic carbon (%) 0.105 3.43 Total hydrocarbon (mg/l) 1.0 308
Temperature (°C) 27 27 Eagle island sediment (100,000mg/kg) Nitrogen (%) 2.80 2.45 Total organic carbon (Toc)(%) 2.496 0
149
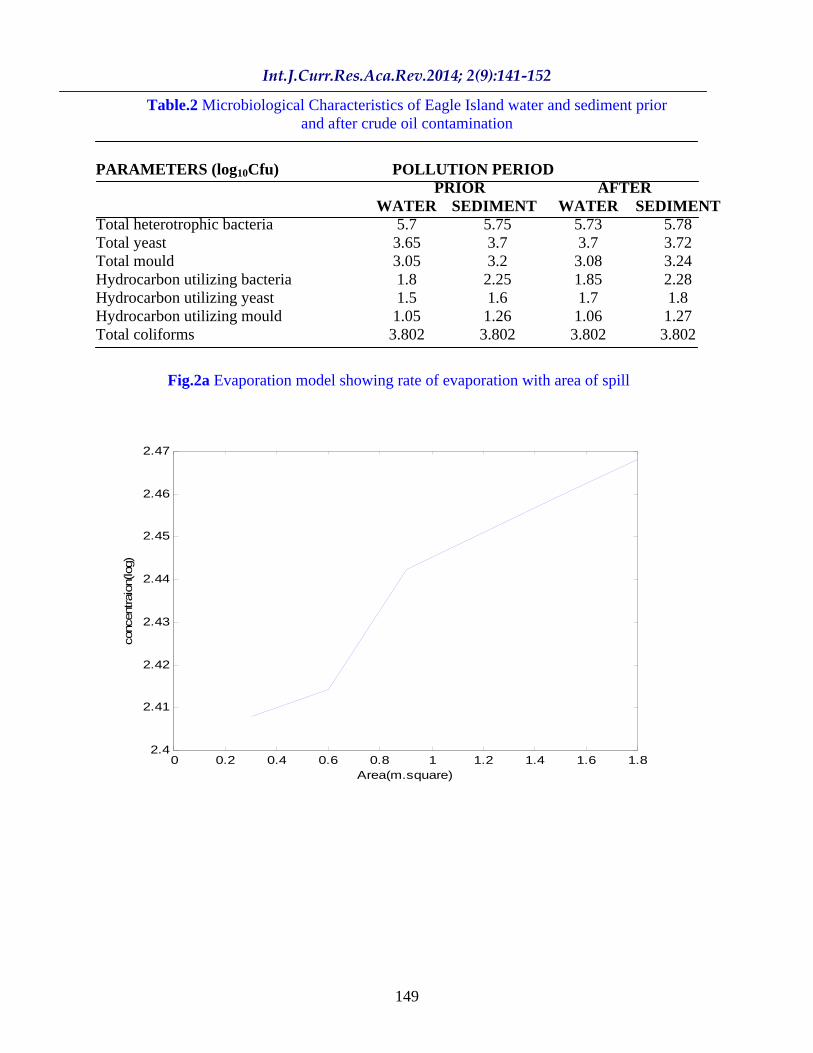
Table.2 Microbiological Characteristics of Eagle Island water and sediment prior
and after crude oil contamination
PARAMETERS (log10Cfu) POLLUTION PERIOD PRIOR AFTER
WATER
SEDIMENT WATER
SEDIMENT
Total heterotrophic bacteria 5.7 5.75 5.73 5.78 Total yeast 3.65 3.7 3.7 3.72 Total mould 3.05 3.2 3.08 3.24 Hydrocarbon utilizing bacteria 1.8 2.25 1.85 2.28 Hydrocarbon utilizing yeast 1.5 1.6 1.7 1.8 Hydrocarbon utilizing mould 1.05 1.26 1.06 1.27 Total coliforms 3.802 3.802 3.802 3.802
Fig.2a Evaporation model showing rate of evaporation with area of spill
0 0.2 0.4 0.6 0.8 1 1.2 1.4 1.6 1.82.4
2.41
2.42
2.43
2.44
2.45
2.46
2.47
Area(m.square)
conc
entrai
on(lo
g)
150
Fig.2b Evaporation model showing rate of evaporation with time
0 100 200 300 400 500 600 700 800 9002.4
2.41
2.42
2.43
2.44
2.45
2.46
2.47
time(s)
conc
entr
aion
(log)
Fig.3 Dissolution model showing rate of dissolution with time

151
Fig.4 Mechanical spreading model showing initial spread of oil slick with time
Acknowledgement
This work was sponsored by Ven.(Dr.) and Mrs. S. Bayo Odukoya.A great thanks to Prof. Lucky Odokuma for his thorough supervision all through this work
References
American Public Health Association (1988) Standard Methods for the Examination of water and waste water 16th
(ed) . American Public Health Association New York.
Applied Science Associates, Inc. (ASA) (1996). Technical Manual for spill impact modeling (SIMAP), Version W1.0.
Atlas, R.M (1993) Petroleum biodegradation and oil spill bioremediation. Marine Pollution Bulletin, 31: 178-182.
Buchanan, J. and Hurford, N. (1988). Methods for predicting the physical
changes in oil spilt at sea. Oil Chemical Pollution 4(4): 311-328.
Clark,R.C. and Macleod, W.D. (1977). Inputs, transports and concentrations. In effect of petroleum on arctics and subarctic marine environments and organisms. Vol.1: Nature and Fate of Petroleum, ed. D.C. Mulins, academic press. 91-222.
Cohen Y. D. Mackay and W.Y Shiu, (1980); Mass transfer rate between oil slick and water. The Canadian journal of chemical engineering. 58.
Department of petroleum resources (1997). Guidelines for the laboratory determination of biodegradability of chemical under Nigeria conditions. DPR draft Biodegradability Test Protocol.
Fay, J.A (1971); Physical processes in the spread of oil on a water surface, in proceedings of the joint conference on prevention and control of oil spill.

152
American Petroleum institute,463
467
Federal Ministry of Environment and Urban Development (1991).Federal Ministry of Environment National Guidelines and Standards for water quality in Nigeria.
French; D. Howlett and D. Mendolsohn (1994); Oil and chemical spill impact model system descriptions and application, P 815-835 in: Seventeenth Artic and Marine Oil Spill Prog Technical Seminar.2.
Jeffrey,P.G.(1973).Large scale experiments on spreading of oil at sea and its disappearance by natural factors,Proc.Joint EPA,Al,USCG conf.on prevention and control of oil spills. 469-474.
Kirsten, B., J.R. Clayton, C. Clary, T.R. Payne, D. Mc Nabb, G. Fauna and R, Redding (1985); integration of suspended particulate matter and oil transportation study, Mineral Mgt. services, Anchorage, Alaska.
Mackay. D., S. Paterson and S. Madeau, (1980): Calculation of the Evaporation rate of Volatile Liquids. In Proceeding National Conference on control of Hazardous Material Spills, Louis Ville Kentucky, 361-368
Mackey, D., J. Buist, R; Mascarehas and S. Paterson (1980a) Oil Spill Processes and Models. Report E-8 Environment Protection Services, Ottawao Canada
Mackay, D.S, Paterson and K. Trudel (1980b): A Mathematical Model of Oil Spill Behavior. Department of Chemical and applied Chemistry, University of Toronto, Canada.
Mackey, D., W.Y. Shiu, K. Hossain, W. Stiver, D. McCurdy and S, Peterson (1982): development and Calibration of an oil Spill behavior model, report NO. CG
D
27-83, USA Coast
Guard, Research and development Centre, Croton, CT.
Paladino,E.E.and C.R.Maliska (2000):Mathematical modeling and numerical simulation of oil spill trajectories on the sea, fed. Univ. of santa carina Brazil.
Reed,M.E.,Gundlach and T.Kana (1989) A coastal zone oil spill model.Devt.and sensitivity studies.Oil and Chem.Pollution.5:411-449.
Rossouw M. (1998) Oil Spill Simulation: Reducing the Impact. START/IOC/LOICZ Workshop on climate change and coastal Process in Cotonou, Benin, West Africa.
Shen H. T., P.D. Yapa and M.E. Petroski (1987). A Simulation Model for Oil Slick.
Venkatesh, S. (1988) the Oil Spill, behavior model of the Canadian Atmospheric Environment Service, p+ 1. Atmosphere Ocean.26 : 93 - 108
Vidal,John (2010). Nigeria s agony dwarfs the Gulf oil spill. The US and Europe ignore it . The Observer, 30 May, 2010.
Wang, H. Campbell, J.R. and Ditmars, J.D. (1975). Computer Modelling of Oil drift and Spreading in Delaware Bay Ocean Engineering, University of Delaware.


![Ukrainian Defense Review #3 [July-September2014]](https://img.dokumen.tips/doc/110x75/568c54fb1a28ab4916c0f35e/ukrainian-defense-review-3-july-september2014.jpg)