Embed Size (px)
Citation preview

Journal of International Academic Research for Multidisciplinary
ISSN 2320 -5083
A Scholarly, Peer Reviewed, Monthly, Open Access, Online Research Journal
Impact Factor – 1.393
VOLUME 1 ISSUE 12 JANUARY 2014
A GLOBAL SOCIETY FOR MULTIDISCIPLINARY RESEARCH
www.jiarm.com
A GREEN PUBLISHING HOUSE

Editorial Board
Dr. Kari Jabbour, Ph.D Curriculum Developer, American College of Technology, Missouri, USA.
Er.Chandramohan, M.S System Specialist - OGP ABB Australia Pvt. Ltd., Australia.
Dr. S.K. Singh Chief Scientist Advanced Materials Technology Department Institute of Minerals & Materials Technology Bhubaneswar, India
Dr. Jake M. Laguador Director, Research and Statistics Center, Lyceum of the Philippines University, Philippines.
Prof. Dr. Sharath Babu, LLM Ph.D Dean. Faculty of Law, Karnatak University Dharwad, Karnataka, India
Dr.S.M Kadri, MBBS, MPH/ICHD, FFP Fellow, Public Health Foundation of India Epidemiologist Division of Epidemiology and Public Health, Kashmir, India
Dr.Bhumika Talwar, BDS Research Officer State Institute of Health & Family Welfare Jaipur, India
Dr. Tej Pratap Mall Ph.D Head, Postgraduate Department of Botany, Kisan P.G. College, Bahraich, India.
Dr. Arup Kanti Konar, Ph.D Associate Professor of Economics Achhruram, Memorial College, SKB University, Jhalda,Purulia, West Bengal. India
Dr. S.Raja Ph.D Research Associate, Madras Research Center of CMFR , Indian Council of Agricultural Research, Chennai, India
Dr. Vijay Pithadia, Ph.D, Director - Sri Aurobindo Institute of Management Rajkot, India.
Er. R. Bhuvanewari Devi M. Tech, MCIHT Highway Engineer, Infrastructure, Ramboll, Abu Dhabi, UAE Sanda Maican, Ph.D. Senior Researcher, Department of Ecology, Taxonomy and Nature Conservation Institute of Biology of the Romanian Academy, Bucharest, Romania Dr. Reynalda B. Garcia Professor, Graduate School & College of Education, Arts and Sciences Lyceum of the Philippines University Philippines Dr.Damarla Bala Venkata Ramana Senior Scientist Central Research Institute for Dryland Agriculture (CRIDA) Hyderabad, A.P, India PROF. Dr.S.V.Kshirsagar, M.B.B.S,M.S Head - Department of Anatomy, Bidar Institute of Medical Sciences, Karnataka, India. Dr Asifa Nazir, M.B.B.S, MD, Assistant Professor, Dept of Microbiology Government Medical College, Srinagar, India. Dr.AmitaPuri, Ph.D Officiating Principal Army Inst. Of Education New Delhi, India Dr. Shobana Nelasco Ph.D Associate Professor, Fellow of Indian Council of Social Science Research (On Deputation}, Department of Economics, Bharathidasan University, Trichirappalli. India M. Suresh Kumar, PHD Assistant Manager, Godrej Security Solution, India. Dr.T.Chandrasekarayya,Ph.D Assistant Professor, Dept Of Population Studies & Social Work, S.V.University, Tirupati, India.

JOURNAL OF INTERNATIONAL ACADEMIC RESEARCH FOR MULTIDISCIPLINARY Impact Factor 1.393, ISSN: 2320-5083, Volume 1, Issue 12, January 2014
1 www.jiarm.com
AN ANALYSIS THE TREND AND ECONOMIC GROWTH AFTER ECONOMIC REFORM -A CASE STUDY OF INDIA
MS. RAMANDEEP KAUR*
*Assistant Professor in Commerce, B.P.R. College, Kurukshetra, Haryana, India
ABSTRACT The economic liberalization in India refers to ongoing economic reforms in India that
started on 24 July 1991. The first attempt was reversed in 1967. Thereafter, a stronger version
of socialism was adopted. Second major attempt was in 1985 by Prime Minister Rajiv
Gandhi. The process came to a halt in 1987, though 1966 style reversal did not take place. In
1991, after India faced a balance of payments crisis, it had to pledge 20 tons of gold to Union
Bank of Switzerland and 47 tons to Bank of England as part of a bailout deal with the
International Monetary Fund (IMF). In addition, IMF required India to undertake a series of
structural economic reforms. As a result of this requirement, the economic reforms of 1991,
initiated by then Indian Prime Minister P.V Narasimha rao and his finance minister
Manmohan Singh did away with investment, industrial and import licensing and ended many
public monopolies, allowing automatic approval of foreign direct investment in many sectors.
This new model of economic reforms is commonly known as the LPG or liberalization,
privatization and globalization model. Liberalization refers to the slackening of government
regulations. Privatization refers to the participation of private entities in businesses and
services and transfer of ownership from the public sector to the private sector as well.
Globalization stands for the consolidation of the various economies of the world. The effects
of these models have been positive and since 1990, India has high growth rates and emerged
as one of the wealthiest economies in the developing.
Introduction:
The term economic reform refers to policies directed to achieve improvements in economic
efficiency, either by eliminating or reducing distortions in individual sector of the economy
or by reforming economy wide policies such as tax policy and competition policy with an
emphasis on economic efficiency, rather than other goals such as equity or employment
growth. “economic reform” usually refers to deregulation or at times to reduction in the size
of government, to remove distortions caused by regulations or the presence of government,
rather then new or increased regulations or government programs to reduce distortions caused
by market failure. The economic liberalization in India refers to ongoing economic reforms in
India that started on 24 July 1991. After Independence in 1947, India adhered to socialist

JOURNAL OF INTERNATIONAL ACADEMIC RESEARCH FOR MULTIDISCIPLINARY Impact Factor 1.393, ISSN: 2320-5083, Volume 1, Issue 12, January 2014
2 www.jiarm.com
policies. Attempts were made to liberalize economy in 1966 and 1985. The first attempt was
reversed in 1967. Thereafter, a stronger version of socialism was adopted. Second major
attempt was in 1985 by Prime Minister Rajiv Gandhi. The process came to a halt in 1987,
though 1966 style reversal did not take place. In 1991, after India faced a balance of
payments crisis, it had to pledge 20 tons of gold to Union Bank of Switzerland and 47 tons to
Bank of England as part of a bailout deal with the International Monetary Fund (IMF). In
addition, IMF required India to undertake a series of structural economic reforms. As a result
of this requirement, the economic reforms of 1991, initiated by then Indian Prime Minister
P.V Narasimha Rao and his finance minister Manmohan Singh, did away with investment,
industrial and import licensing and ended many public monopolies, allowing automatic
approval of foreign direct investment in many sectors. P.V. Narsimha Rao, congress
government after resumption of office on June 21, 1991 adopted a number of stabilization
measures that were designed to restore internal and external confidence. The government
adopted, as the centerpiece of economic strategy, a programme to bring about reduction in
fiscal imbalance to be supported by reforms in economic policy that were essential to impart
a new element of dynamism to the growth process in the economy. In his memorandum on
economic policies submitted to IMF, Dr. Manmohan Singh proposed, “the trust will be to
increase the efficiency, utilize foreign investment and technology to a much greater degree
than in the past, to improve the performance and rationalize the scope of the public sector,
and to reform and modernize the financial sector so that economy can more efficiently serve
the needs of the economy”. This new model of economic reforms is commonly known as the
LPG or liberalization, privatization and globalization model. Liberalization refers to the
slackening of government regulations. Privatization refers to the participation of private
entities in businesses and services and transfer of ownership from the public sector to the
private sector as well. Globalization stands for the consolidation of the various economies of
the world. The effects of these models have been positive and since 1990, India has high
growth rates and emerged as one of the wealthiest economies in the developing The new neo-
liberal policies included opening for international trade and investment, deregulation,
initiation of privatization, tax reforms, and inflation-controlling measures. The overall
direction of liberalization has since remained the same, irrespective of the ruling party,
although no party has yet tried to take on powerful lobbies such as the trade unions and
farmers, or contentious issues such as reforming labour laws and reducing subsidies. Thus,
unlike the reforms of 1966 and 1985 that was carried out by the majority Congress
JOURNAL OF INTERNATIONAL ACADEMIC RESEARCH FOR MULTIDISCIPLINARY Impact Factor 1.393, ISSN: 2320-5083, Volume 1, Issue 12, January 2014
3 www.jiarm.com
governments, the reforms of 1991 carried out by a minority government proved sustainable.
The fruits of liberalization reached their peak in 2007, when India recorded its highest GDP
growth rate of 9%.With this; India became the second fastest growing major economy in the
world, next only to China. The growth rate has slowed significantly in the first half of
2012.An Organization for Economic Co-operation and Development (OECD) report states
that the average growth rate 7.5% will double the average income in a decade, and more
reforms would speed up the pace. Indian government coalitions have been advised to
continue liberalization. India grows at slower pace than China, which has been liberalizing its
economy since 1978.The McKinsey Quarterly states that removing main obstacles "would
free India’s economy to grow as fast as China’s, at 10 percent a year”. For 2010, India was
ranked 124th among 179 countries in Index of Economic Freedom World ranking, which is
an improvement from the preceding year. The impact of these reforms may be gauged from
the fact that total foreign investment(including foreign direct investment, portfolio
investment, and investment raised on international capital market in India grew from a
minuscule US$132 million in 1991–92 to $5.3 billion in 1995–96.India gained highly from
the LPG model as its GDP increased to 9.7% in 2007-08.in respect of market capitalization,
India ranks 4th in the world. Growth in financial services after dipping to 5.6% in 2003-04
bounced to back to 10.9% in 2005-06.
The rapid growth and development of the Indian software industry after the
liberalization of the economy in 1991 validates this understanding. The period until then was
one of sluggish growth for the industry; the private sector was subject to numerous controls
and had restricted access to technology. However, the economic reforms of 1991 changed the
Indian business context from one of state-centered, control orientation, to a free, open market
orientation –especially for hi-tech companies. It allows Indian companies to start competing
effectively on a global scale. As evidence of this, India’s software exports increased from
US$ 128 million in 1991 to US$ 6.2 billion in 2001.similarly India’s domestic software sales
increased from US$ 115 million in 1991 to US$ 2 billion in 2001.infosys further exemplifies
this – the company grew from Rs. 1 million and 12 employees in 1982 to about Rs. 90
million and 300 employees in 1992, to Rs. 19.5 billion and over 10,000 employees in 2001.
However, the more substantial benefits were reduction in the interference of the bureaucracy,
enhancement of the confidence of Indians in exploring global markets, and India emerging as
an attractive destination for foreign institutional investors (FIIs). The reform process in India
has benefited the nation tremendously and is now irreversible. In fact, successive

JOURNAL OF INTERNATIONAL ACADEMIC RESEARCH FOR MULTIDISCIPLINARY Impact Factor 1.393, ISSN: 2320-5083, Volume 1, Issue 12, January 2014
4 www.jiarm.com
governments have continued the reform process. These governments irrespective of their
political affiliations have introduced measure to improve the speed and flexibility of decision-
making of corporations. These include measure such as allowing listing on foreign
exchanges, and formulating acquisition norms as well as regulations for employees stock
option plans (ESOPs).we also need to understand the lesion that the success of the reform
process has, for the economy as a whole. The only way we can solve the problem of poverty
is by creating more jobs. Moreover, the Indian consumer deserves better product and
services. Thus we need to encourage competition from world class companies. Moreover,
Indian companies should benchmark themselves globally in terms of quality, cost, time,
customer responsiveness, investor friendliness and corporate governance practices. Further,
our government has to enhance its efficiency in every interface it has with business. Finally,
we, Indians, can succeed only if our political leadership, bureaucracy, corporate leadership
and academia work collaboratively. So the economic reforms helped in rising living
standards, alleviating poverty, assuring food security, making substantial contribution to the
national economic growth.
The rest of the research paper is organized as follows. In section-II we have discussed the
review of literature and objectives of the study. The Section III presents source of Data and
the methodology, in section IV we have presented the results. The conclusions emerging out
of the study have been presented in section -V
NEED FOR ECONOMIC REFORMS:
Need for economic reforms or new economic policy was felt on account of domestic as well
as external factors. The government and the pro-reformist gave following reasons for
implementing new economic policy.
International factors:
(1)International scenario
(2)International pressure and condition
Domestic circumstances:
(1)Increase in fiscal deficit
(2)Deficit of current account and increase in foreign debt
(3)Balance of payment crisis
(4)Mounting inflationary pressure
(5)Unsatisfactory performances of public sector
JOURNAL OF INTERNATIONAL ACADEMIC RESEARCH FOR MULTIDISCIPLINARY Impact Factor 1.393, ISSN: 2320-5083, Volume 1, Issue 12, January 2014
5 www.jiarm.com
Review of Literature:
The review of literature in the context of developing country is related by and large to the
empirical body of research devoted to testing the economic reforms and its impact on Indian
economy.
Pinki Goel (June, 2012); this study shows that about the economic reform in India and also
explain the impact of Indian economy. This study shows that economic reform, aided by the
rapid diffusion of technology have enabled individuals, groups and companies to top talent to
not only create new business but set off a virtuous cycle of growth and entrepreneurship but
on the other side agriculture sector adversely affected. Foreign direct investment, exports and
other related variables of external sector shows a positive outcome growth of Indian
economy. This study analyzes the impact of 2 decades of economic reforms, on growth of
GDP and other related factors, using regression model.
Sanjay Kumar (2004); this study analyze the result of surveys conducted after the three
successive lok sabha elections of 1996,1998 and 1999.the basic thrust of the study lies in
exploring whether there exists any relationship between people’s opinion on economic
reforms and their voting preferences. This study is largely based on data collected by
nationwide surveys, which indicate that three indeed is a differential trend in the voting
pattern of those who support economic reforms compared to those who oppose these policies.
But at the same time, the study also indicates that level of awareness on economic reforms is
very low.
T. Meheswari (2012); this study analyze the social sector spending in India. The objectives of
this study are to assess the performance in the social sector exp. education, health, nutrition,
housing, food security and poverty situation in India. The data was collected from various
NSS rounds, social economic statistics, indiastate.com etc. This study shows is confined to
the post reform period only. Now we are ready to welcome to 12th five year plan, in this study
we examine the situation of social sector and expenditure made on social sector in India. We
find that indicators are good planners but not good implementers.
K N Ninan; This study analyze the impact of economic reforms initiated in India in 1991 on
the poor and poverty reduction. Using time series analysis of poverty indicators for all India
and across states, it notes that while rural and urban& overall national poverty levels in India
recorded a significant decline during the pre reform period (1967-70 to 1990-91), during the
post reform period (1991-92 to 1993-94).The study then probes into the role of different
factors on poverty levels, using time series analysis of all India data and a cross section
JOURNAL OF INTERNATIONAL ACADEMIC RESEARCH FOR MULTIDISCIPLINARY Impact Factor 1.393, ISSN: 2320-5083, Volume 1, Issue 12, January 2014
6 www.jiarm.com
analysis of interstate data for 2 points of time covering the pre and post reform periods. It
suggests that policies to accelerate agricultural growth, improve access to subsided food
through the public distribution system.
C.P. Chandrasekhar (1999) this study shows that the Indian economic reform process and the
implications of the Southeast Asian crisis. The objective of the study is the Indian reform
process and the implications of the South-East Asian crisis gives an overview of the reform
policies in India as well as an assessment of the impacts of these policies, especially in
relation to employment and incomes. This assessment is then juxtaposed with the South-East
Asian crisis in 1997-1999. This study discuss to what extent the crisis in South-East Asia has
an effect on the reform process in India, not only in terms of changes in the international
markets (trade and capital) but also in terms of drawing lessons from the crisis in South-East
Asia for the reform process in India. This study conclude that it is necessary in order to
understand the reform processes in India to unbundle the different elements of the economic
reform process (liberalization, privatization, fiscal policy, monetary policy) and argue that in
order for India to have a stronger and more sustainable development path, the reform process
in India should be part of a wider set of economic and social policies including trade policies,
industrial policies, and social policies. Be applied in line with trade and investment policies.
In this study we seek to unravel each of these issues with specific reference to the
implications for the Indian process of "Economic reform" instituted since 1991.
Echkard Siggel and Pardeep Agrawal (2009); this study analyzed how the reforms were
perceived and coped with manufacturing enterprise. The impact of India’s economic reforms
of on Indian manufacturers, there is hardly any previous study that has taken up the task of
actually asking the manufacturing firms as to what the true impact of economic reforms has
been on them. In this study, we report the findings of a small sample economic reform of
1990s. Most firms felt that the reforms were helpful by increasing access to foreign
technology and making imports of capital and intermediate goods cheaper. They also felt that
improvement in infrastructure and more flexible Slab our laws will facilitate further growth
of India’s manufacturing sector. This study suggests that economic reforms of 1991 were
helpful to most industries by increasing access to foreign technology and cheaper capital
goods & raw materials. Most firms felt that improvement in infrastructure and more flexible
labour laws will further aid the growth of India’s manufacturing sector.
Rajesh chadha (1997); this study shows that the analysis of India’s policy reforms. The
Indian govt. has introduced significant unilateral macroeconomic and trade reforms since

JOURNAL OF INTERNATIONAL ACADEMIC RESEARCH FOR MULTIDISCIPLINARY Impact Factor 1.393, ISSN: 2320-5083, Volume 1, Issue 12, January 2014
7 www.jiarm.com
1991-93.under the import policy reforms, both tariffs and NTBs have been reduced. The
economy has also been further opened up on the export side by reducing export barriers.
Finally, the structure of indirect taxes on production along with subsidies has been
undergoing major reform. This study analyze the comparatives static effects of selected trade
and domestic economic policy reforms on trade, output ,domestic prices, economic welfare,
and the intersectional allocation of resources using a computable general equilibrium model
of the Indian economy. The results indicate that the import liberalization enhances the
welfare of the economy, and that the effect gets further in large if exports are also liberalized
simultaneously.
2.3 OBJECTIVES OF THE STUDY
The main objective of this study is to examine growth rate of economic variable in Post
Reform Era.
The sub-objectives of the study are as follows:
1) To examine the growth rate of export and import after economic reform.
2.) To analyze growth rate of GDP in India.
3). To identify the growth Rate of balance of payment.
Section III
Research Methodology: Firstly the study find out the growth rates of economic variable. It
have been calculated by using the following formulas:
GROWTH RATE= (PRESENT VALUE-PAST VALUE)
------------------------------------------- X 100
PAST VALUE
SECTION-IV
4.1 Empirical Results: The objective of this Section is to present an overview of some of
the most relevant growth rate of economic variable. In this section; first of all we see the
trend and growth rate of economic variable after economic reform.

JOURNAL OF INTERNATIONAL ACADEMIC RESEARCH FOR MULTIDISCIPLINARY Impact Factor 1.393, ISSN: 2320-5083, Volume 1, Issue 12, January 2014
8 www.jiarm.com
TABLE: 1 .1 TREND AND GROWTH RATE OF ECONOMIC VARIABLE IN INDIA :1991-2011
YEAR GNP G.R (GNP)
NNP G.R (NNP)
GDS G.R (GDS)
GDCF G.R (GDCF)
1991-92 603451 51.1 538824 14.2 14530 151563
1992-93 692078 14.7 617940 14.1 164621 1032.973 187768 23.88776
1993-94 805881 16.4 723024 17 192994 17.23535 189737 1.048634
1994-95 942302 16.9 845554 16.9 246668 27.81123 242514 27.81587
1995-96 1105102 17.3 992516 17.4 289265 17.26896 319603 31.78744
1996-97
1288706 16.6 1158858 16.8 318387 10.06759 313055 -2.04879
1997-98 1434408 11.3 1287141 11.1 379790 19.28565 385445 23.12373
1998-99 1653771 15.3 1490030 15.8 418159 10.10269 424046 10.01466
1999-00 1831842 10.8 1645370 10.4 516847 23.60059 542682 27.97715
2000-01
1969249 7.5 1762358 7.1 515545 -0.25191 525078 -3.24389
2001-02 2147677 9.1 1918827 8.9 585374 13.5447 602456 14.73648
2002-03 2321510 8.1 2075329 8.2 656230 12.1044 633277 5.115892
2003-04 2601508 12.1 2329354 12.2 823775 25.53144 742517 17.28154
2004-05 2949089 13.4 2629198 12.9 1050703 27.54733 1052231 41.67321
2005-06 3364387 14.1 3000666 14.1 1235151 17.55472 1266073 20.322721
2006-07 3920042 16.5 3501313 16.7 1485909 20.30181 1540583 21.682
2007-08 4561574 16.4 4076878 16.4 1836332 23.58307 1896799 23.12216
2008-09 5270644 15.5 4705447 15.4 1802620 -1.83583 2000103 5.446228
2009-10 6053585 14.9 5395687 14.7 2182970 21.09984 2332380 16.61299
2010-11 7078512 16.9 6325038 17.2 2481931 13.69515 2749189 17.87054
SOURCE: Reserve bank of India ( RBI), ECONOMIC SURVEY (2011) FIGURE- (a)

JOURNAL OF INTERNATIONAL ACADEMIC RESEARCH FOR MULTIDISCIPLINARY Impact Factor 1.393, ISSN: 2320-5083, Volume 1, Issue 12, January 2014
9 www.jiarm.com
FIGURE (b)
FIGURE(c)
In table (1.1), show about actual variables and growth rate of all variables. In this table, we
take variables are GNP (Gross national product), NNP (Net national product), GDS (gross
domestic saving), GDCF (Gross domestic capital formation). This table is collected by
economic survey (2011).With the help of this table; we make a diagram of these variables to
find out the trend and growth rate. Firstly in figure (a), we take a variable of GNP. In this
figure, that is show that GNP is continuously increased in 1991 to 2011 but the growth rate
first increased then decreased in that particular time period. In figure (b) we take a variable of
GDS, that is show that the actual GDS are continuously increased in 1991 to 2011 but the
growth rate are constant in that particular time period. in figure (c), we take a variable of
GDCF, that is show that GDCF was 1515163 in 1991-92 increase to 2001-02.it was 525078.
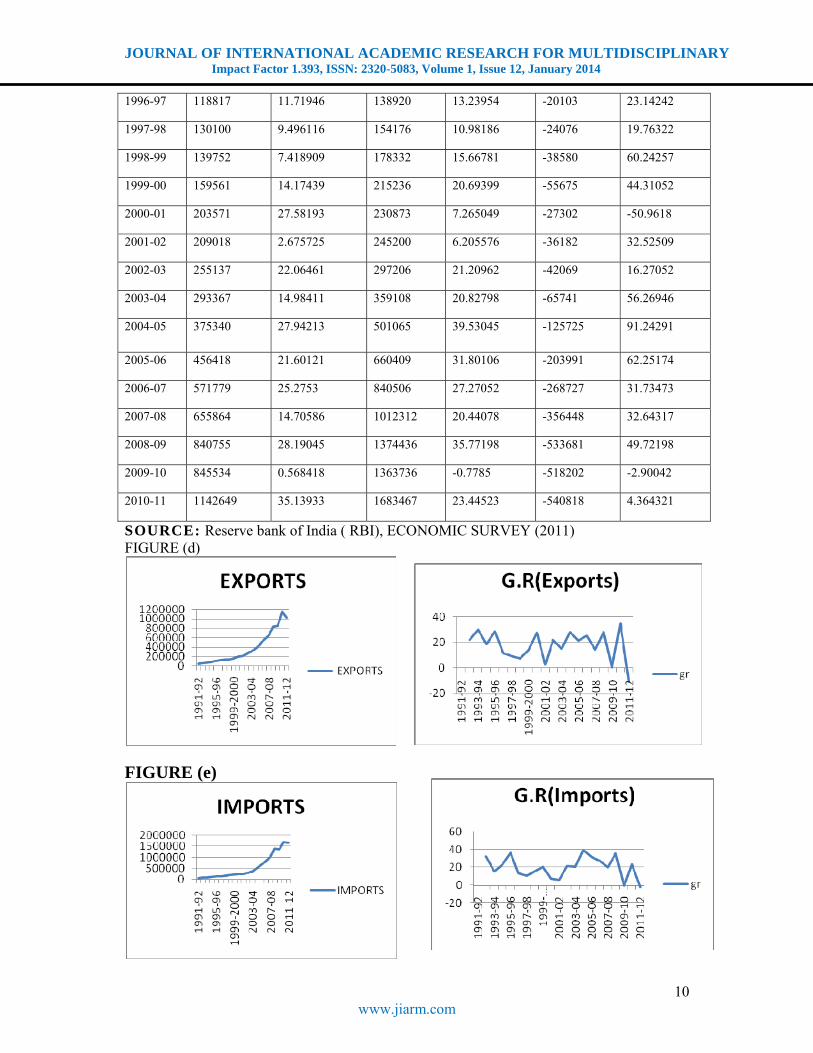
TABLE-1.2 YEAR EXPORTS G.R
(EXPORTS) IMPORTS G.R
(IMPORTS) TRADE BALANCE
G.R (TRADE BALANCE)
1991-92 44041 47851 -3810
1992-93 53688 21.90549 63375 32.44237 -9687 154.252
1993-94 69751 29.91916 73101 15.34675 -3350 -65.4176
1994-95 82674 18.52733 89971 23.07766 -7297 117.8209
1995-96 106353 28.64141 122678 36.35282 -16325 123.7221
JOURNAL OF INTERNATIONAL ACADEMIC RESEARCH FOR MULTIDISCIPLINARY Impact Factor 1.393, ISSN: 2320-5083, Volume 1, Issue 12, January 2014
10 www.jiarm.com
1996-97 118817 11.71946 138920 13.23954 -20103 23.14242
1997-98 130100 9.496116 154176 10.98186 -24076 19.76322
1998-99 139752 7.418909 178332 15.66781 -38580 60.24257
1999-00 159561 14.17439 215236 20.69399 -55675 44.31052
2000-01 203571 27.58193 230873 7.265049 -27302 -50.9618
2001-02 209018 2.675725 245200 6.205576 -36182 32.52509
2002-03 255137 22.06461 297206 21.20962 -42069 16.27052
2003-04 293367 14.98411 359108 20.82798 -65741 56.26946
2004-05 375340 27.94213 501065 39.53045 -125725 91.24291
2005-06 456418 21.60121 660409 31.80106 -203991 62.25174
2006-07 571779 25.2753 840506 27.27052 -268727 31.73473
2007-08 655864 14.70586 1012312 20.44078 -356448 32.64317
2008-09 840755 28.19045 1374436 35.77198 -533681 49.72198
2009-10 845534 0.568418 1363736 -0.7785 -518202 -2.90042
2010-11 1142649 35.13933 1683467 23.44523 -540818 4.364321
SOURCE: Reserve bank of India ( RBI), ECONOMIC SURVEY (2011) FIGURE (d)
FIGURE (e)
JOURNAL OF INTERNATIONAL ACADEMIC RESEARCH FOR MULTIDISCIPLINARY Impact Factor 1.393, ISSN: 2320-5083, Volume 1, Issue 12, January 2014
11 www.jiarm.com
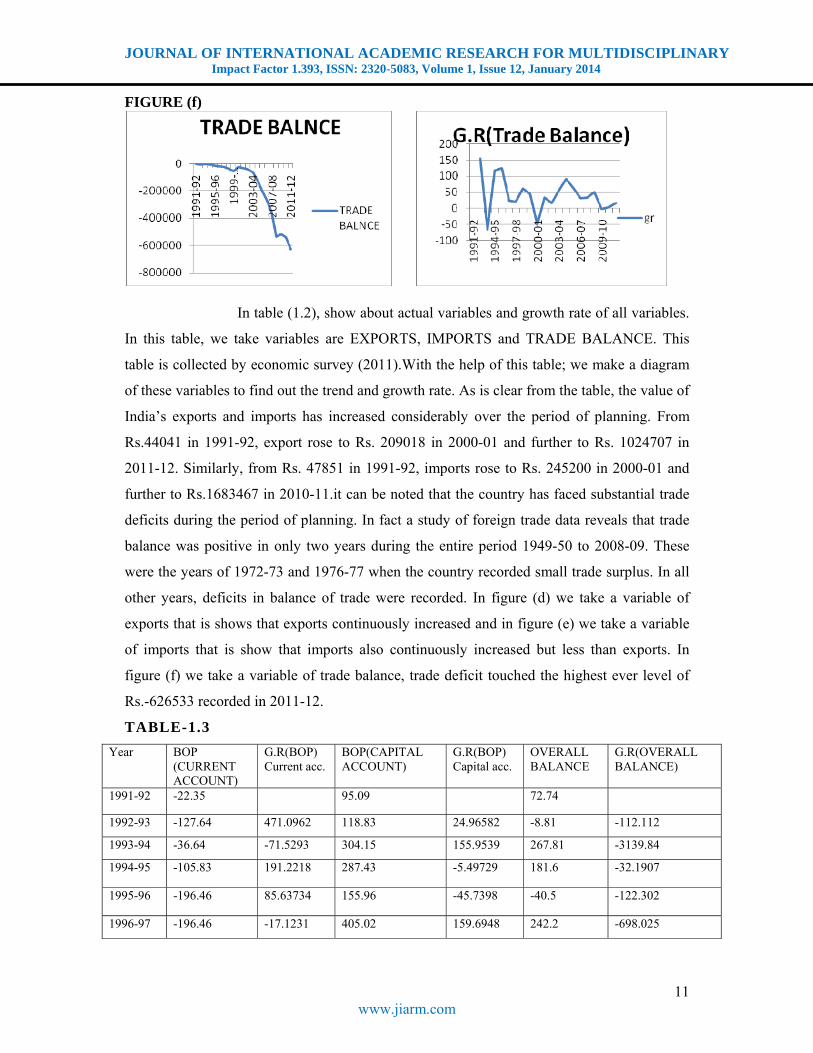
FIGURE (f)
In table (1.2), show about actual variables and growth rate of all variables.
In this table, we take variables are EXPORTS, IMPORTS and TRADE BALANCE. This
table is collected by economic survey (2011).With the help of this table; we make a diagram
of these variables to find out the trend and growth rate. As is clear from the table, the value of
India’s exports and imports has increased considerably over the period of planning. From
Rs.44041 in 1991-92, export rose to Rs. 209018 in 2000-01 and further to Rs. 1024707 in
2011-12. Similarly, from Rs. 47851 in 1991-92, imports rose to Rs. 245200 in 2000-01 and
further to Rs.1683467 in 2010-11.it can be noted that the country has faced substantial trade
deficits during the period of planning. In fact a study of foreign trade data reveals that trade
balance was positive in only two years during the entire period 1949-50 to 2008-09. These
were the years of 1972-73 and 1976-77 when the country recorded small trade surplus. In all
other years, deficits in balance of trade were recorded. In figure (d) we take a variable of
exports that is shows that exports continuously increased and in figure (e) we take a variable
of imports that is show that imports also continuously increased but less than exports. In
figure (f) we take a variable of trade balance, trade deficit touched the highest ever level of
Rs.-626533 recorded in 2011-12.
TABLE-1.3
Year BOP (CURRENT ACCOUNT)
G.R(BOP) Current acc.
BOP(CAPITAL ACCOUNT)
G.R(BOP) Capital acc.
OVERALL BALANCE
G.R(OVERALL BALANCE)
1991-92 -22.35 95.09 72.74
1992-93 -127.64 471.0962 118.83 24.96582 -8.81 -112.112
1993-94 -36.64 -71.5293 304.15 155.9539 267.81 -3139.84
1994-95 -105.83 191.2218 287.43 -5.49729 181.6 -32.1907
1995-96 -196.46 85.63734 155.96 -45.7398 -40.5 -122.302
1996-97 -196.46 -17.1231 405.02 159.6948 242.2 -698.025
JOURNAL OF INTERNATIONAL ACADEMIC RESEARCH FOR MULTIDISCIPLINARY Impact Factor 1.393, ISSN: 2320-5083, Volume 1, Issue 12, January 2014
12 www.jiarm.com
1997-98 -208.83 28.2582 375.36 -7.3221 166.53 -31.2428
1998-99 -167.89 -19.6045 350.34 -6.6656 182.45 9.559839
1999-00 -203.31 21.09715 481.01 37.29805 277.7 52.20608
2000-01 -115.98 -42.9541 392.41 -18.4196 276.43 -0.45733
2001-02 164.26 -241.628 401.67 2.359777 565.93 104.7281
2002-03 306.6 86.6553 513.77 27.90848 820.37 44.95962
2003-04 639.83 108.6865 800.1 55.73116 1439.93 75.52202
2004-05 -121.74 -119.027 1280.81 60.08124 1159.07 -19.5051
2005-06 -437.37 259.2656 1096.33 -14.4034 658.96 -43.1475
2006-07 -443.83 1.47701 2080.17 89.7394 1636.34 148.3216
2007-08 -635 43.0728 4331 108.2041 3697 125.931
2008-09 -1276 100.9449 305 -92.9577 -971 126.265
2009-10 -1797 40.83072 2439 699.6721 643 -166.22
2010-11 -2101 16.91708 2696 10.53711 594 -7.62053
2011-12 -3760 78.9624 3074 14.02077 -685 -215.32
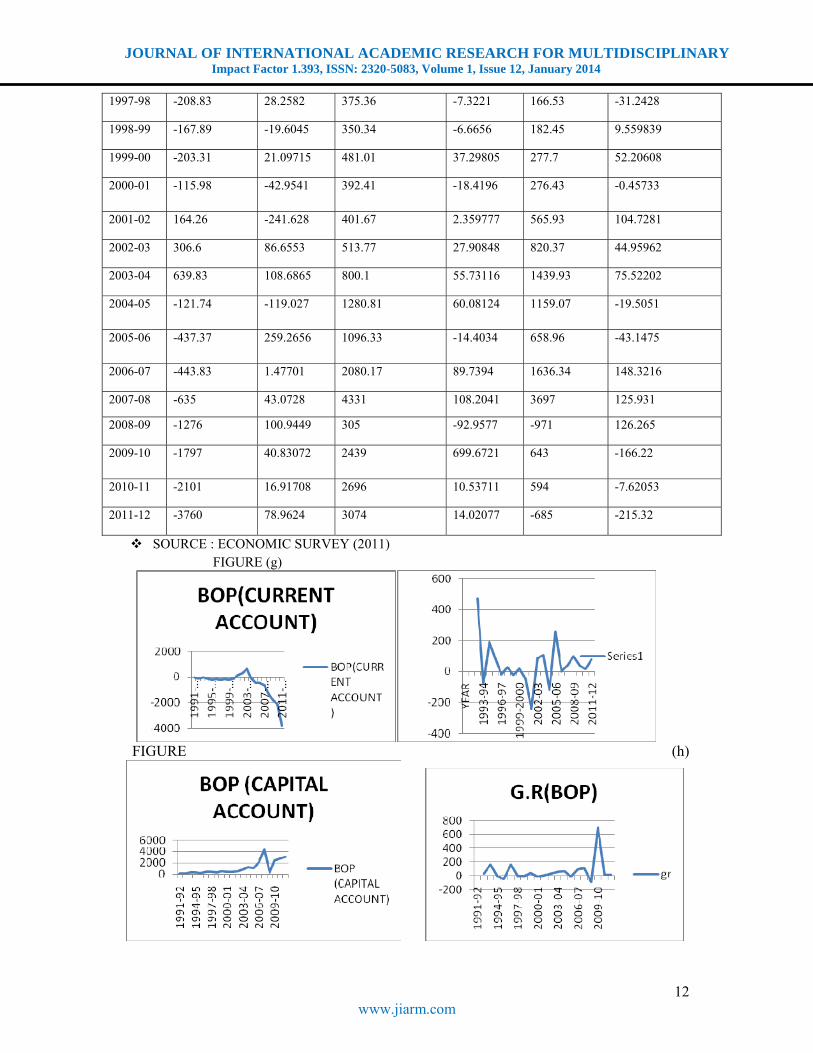
SOURCE : ECONOMIC SURVEY (2011) FIGURE (g)
FIGURE (h)

JOURNAL OF INTERNATIONAL ACADEMIC RESEARCH FOR MULTIDISCIPLINARY Impact Factor 1.393, ISSN: 2320-5083, Volume 1, Issue 12, January 2014
13 www.jiarm.com
FIGURE (i)
In table (1.3), show about actual variables and growth rate of all variables. In this table, we
take variables are BOP (current account), BOP (capital account), OVERALL BALANCE.
This table is collected by economic survey (2011).With the help of this table; we make a
diagram of these variables to find out the trend and growth rate. In figure (g), we take a
variable of BOP at current account, that is show that in figure (h),we take a variable of BOP
at capital account, that is show that, Bop continuously increased from 1991-2007 but than it
is decreased.
Conclusion
As the result of this study we take variables are GNP (Gross national product), NNP (Net
national product), GDS (gross domestic saving), GDCF (Gross domestic capital formation).
we make a diagram of these variables to find out the trend and growth rate. Firstly we take a
variable of GNP show that is continuously increased in 1991 to 2011 but the growth rate first
increased then decreased in that particular time period. we take a variable of GDS, that is
show that the actual GDS are continuously increased in 1991 to 2011 but the growth rate are
constant in that particular time period. We take a variable of GDCF, that is show that GDCF
was 1515163 in 1991-92 increase to 2001-02.it was 52507.we take variables are EXPORTS,
IMPORTS and TRADE BALANCE. These variables to find out the trend and growth rate.
As is clear from the table, the value of India’s exports and imports has increased considerably
over the period of planning. From Rs.44041 in 1991-92, export rose to Rs. 209018 in 2000-
01 and further to Rs. 1024707 in 2011-12. Similarly, from Rs. 47851 in 1991-92, imports
rose to Rs. 245200 in 2000-01 and further to Rs.1683467 in 2010-11.it can be noted that the
country has faced substantial trade deficits during the period of planning. In fact a study of
foreign trade data reveals that trade balance was positive in only two years during the entire
period 1949-50 to 2008-09. These were the years of 1972-73 and 1976-77 when the country
recorded small trade surplus. In all other years, deficits in balance of trade were recorded.
Exports that is shows that exports continuously increased and variable of imports that is

JOURNAL OF INTERNATIONAL ACADEMIC RESEARCH FOR MULTIDISCIPLINARY Impact Factor 1.393, ISSN: 2320-5083, Volume 1, Issue 12, January 2014
14 www.jiarm.com
show that imports also continuously increased but less than exports. we take variables are
BOP (current account), BOP (capital account), OVERALL BALANCE. these variables to
find out the trend and growth rate. we take a variable of BOP at current account and BOP at
capital account, that is show that, Bop continuously increased from 1991-2007 after that it is
decreased.
REFERENCES
1. Anthony P. Thirlwall,(2000): ―Trade, Trade Liberalisation and Economic Growth: Theory and Evidenceǁ ECONOMIC RESEARCH PAPERS NO. 63.
2. AadityaMattoo, Randeep Rathindran ,and Arvind Subramanian(2001): ―Measuring Services Trade Liberalization and Its Impact on Economic Growth: An Illustrationǁ
3. Ahluwalia, M.S (2002), "Economic reforms in India since 1991: Has Gradualism worked? Journal of economic perspectives, 16 (3) summer 67-78.
4. Alcala, F., and ciccone, (2004), “Trade and productivity", quarterly Journal of economics. 119(2),613-46
5. Arora.A, Gambardella,(2004)" The globalization of the software industry: perspectives and opportunities for developed and developing country", NBER working paper no. 10538
6. Anwer, M. S., and R. K. Sampath (2001), Exports and Economic Growth‘, Indian Economic Journal, 47(3): 79-88.
7. Bahmani-Oskooee, M., and J. Alse(1993), Export Growth and Economic Growth: Application of Cointegration and Error Correction Modelling‘, Journal of Developing Areas, 27:535-42.
8. Dollar, D. and A Kraay. (2002), "Institutions Trade and growth". Paper prepared for the Carnegie- Rochester conference series on public policy, World Bank, Washington D.C.
9. De long, B. (2004) "India since independence, an analytic growth narrative, ch. 7 D. Rodrik (ed.) in search of prosperity", Princeton, NJ, prince ton University press 184-204.
10. EckhardSiggel and Pradeep Agrawal (2009): ―The Impact of Economic Reforms on Indian Manufacturers: Evidence from a Small Sample Surveyǁ Forthcoming in Asian Profile, Vol. 37, August 2009
11. Feder, G. (1982), ‗On Exports and Economic Growth‘, Journal of Development Economics, 5: 59-73. 12. Granger, C. W. J. (1969), ‗Investigating Causal Relations by Econometric Models and Cross-Spectral
Methods, Econometrica, 37: 424-38. 13. HalitYanikkaya (2002): Trade openness and economic growth: a cross-country empirical investigationǁ 14. HrushikeshMallick (2008): ―Government Spending, Trade Openness and Economic Growth in India:
A Time Series Analysisǁ Working Paper 403 15. Kohli, A. (2006 a), "politics of economic growth in India:1980-2005ǁ economic and political weekly. 16. Ram, R. (1987), ‗Exports and economic growth in developing countries: Evidence from Time-Series
and Cross-Section Data‘, Economic Development and Cultural Change, 36(1): 51-63. 17. Romain Wacziarg and Karen Horn Welch (2009): ―Trade Liberalization and Growth: New Evidence
ABBRIBATION G.R=GROWTH RATE
GNP=GROSS NATIONAL PRODUCT
NNP=NET NATIONAL PRODUCT
GDS=GROSS DOMESTIC SAVING
GDCF=GROSS DOMESTIC CAPITAL FORMATION
BOP=BALANCE OF PAYMENT