Embed Size (px)
Citation preview

Mekong River Commission
Report on the 2008 biomonitoring survey of the lower Mekong River and
selected tributaries
MRC Technical Paper No. 27
February 2010
Meeting the Needs, Keeping the Balance
ISSN: 1683-1489


Mekong River Commission
Report on the 2008 biomonitoring survey of the lower Mekong River and
selected tributaries
MRC Technical Paper No. 27
February 2010
ISBN : 1683 – 1489

ii
Published in Vientiane, Lao PDR in February 2010 by the Mekong River Commission
Cite this document as:
DAO Huy Giap, Tatporn KUNPRADID, Chanda VONGSOMBATH, DO Thi Bich Loc, and PRUM Somany (2010) Report on the 2008 biomonitoring survey of the lower Mekong River and selected tributaries, MRC Technical Paper No. 27. Mekong River Commission, Vientiane. 69 pp.
The opinions and interpretation expressed within are those of the authors and do not necessarily refl ect the views of the Mekong River Commission.
Editors: V.H. Resh, H. BachGraphic design: J. Simery
© Mekong River Commission184 Fa Ngoum Road, Unit 18, Ban Sithane Neua, Sikhottabong District,Vientiane 01000, Lao PDRTelephone: (856 – 21) 263 263 Facsimile: (856 – 21) 263 264E-mail: [email protected]: www.mrcmekong.org

iii
Table of contents
Acknowledgements ...................................................................................................................... ix
Abbreviations and acronyms ........................................................................................................ xi
Glossary of biomonitoring terms ............................................................................................... xiii
Summary ................................................................................................................................... xvii
1. Introduction ...............................................................................................................................1
2. Materials and methods ..............................................................................................................32.1 Sampling sites ..................................................................................................................32.2 Data collection ...............................................................................................................182.3 Calculation of biometric indicators................................................................................242.4 Evaluation of sites ..........................................................................................................25
3. Results and discussion ............................................................................................................293.1 Environmental variables ................................................................................................293.2 Benthic diatoms .............................................................................................................323.3 Zooplankton ...................................................................................................................373.4 Littoral macroinvertebrates ............................................................................................413.5 Benthic macroinvertebrates ...........................................................................................473.6 Evaluation of sites ..........................................................................................................53
4. Conclusions .............................................................................................................................59
References ...................................................................................................................................61
Appendix 1. List of participants on the sampling fi eld trips in 2008 ...........................................63
Appendix 2. Detail site descriptions for 2008 Ecological Health Monitoring ............................65
Appendix 3. Detail environmental variables measurement at 32 sites sampled in 2008 .............69

iv

v
Table of fi gures
Figure 1.1 Timeline for biomonitoring in the Mekong River and its tributaries ..............2
Figure 2.1 Map of sites surveyed in 2008 .......................................................................17
Figure 3.1 Rating of sites in the Lower Mekong Basin surveyed in 2008. ....................57

vi

vii
List of tables
Table 2.1 Sites sampled in 2008 and during previous years’ biomonitoring surveys ...............3
Table 2.2 Description of sites sampled in 2008 ......................................................................14
Table 2.3 Guidelines for biological indicators of ecosystem health based on 2004 - 2007 baseline studies ........................................................................................................27
Table 3.1 Environmental variables at the 32 sites sampled in 2008. ......................................32
Table 3.2 Abundance, average richness and ATSPT of benthic diatom recorded at sites sampled during 2004-2008 ......................................................................................36
Table 3.3 Abundance, average richness and ATSPT of zooplankton recorded at sites sampled during 2004 - 2008 ..................................................................................................40
Table 3.4 Abundance, average richness and ATSPT of littoral macroinvertebrates recorded at sites sampled during 2004 - 2008 ............................................................................46
Table 3.5 Abundance, average richness and ATSPT of benthic macroinvertebrates recorded at sites sampled during 2004 - 2008 ........................................................................52
Table 3.6 Assessment of all sites following the suggested guidelines. ..................................55
Table 3.7 Site assessment during 2004-2008 ..........................................................................56

viii

ix
Acknowledgements
The authors thank the staff of the Environment Programme of the Mekong River Commission for their assistance in coordinating the sampling programme in 2008. The authors also express their appreciation for the support given to the study by representatives from the National Mekong Committees of Cambodia, Lao PDR, Thailand, and Viet Nam, particularly for the help they provided in the fi eld.
The authors are indebted to Prof. Vincent Resh and Dr. Bruce Chessman for their guidance during the fi eld programme and their help with drafting this report. The authors also express their appreciation to Dr. Vithet Srinetr, Dr. Pornsook Chongprasith and Dr. Hakan Berg for their comments and suggestions when reviewing the report.

x

xi
Abbreviations and acronyms
ATSPT Average Tolerance Score per TaxonBDP Basin Development Plan Programme of the MRCSBMWP Biological Monitoring Working PartyLMB Lower Mekong BasinMRC Mekong River CommissionMRCS Mekong River Commission SecretariatNMC National Mekong CommitteeSDS Site Disturbance Score

xii
xiii
Glossary of biomonitoring terms
Abundance: This is a measurement of the number of individual plants or animals belonging to a particular biological indicator group counted in a sample. Low abundance is sometimes a sign that the ecosystem has been harmed.
Average richness: This measurement refers to the mean number of taxa (types) of plants or animals belonging to a particular biological indicator group (e.g. diatoms, zooplankton) counted in a sample.
Average Tolerance Score per Taxon (ATSPT): Each taxon of a biological indicator group is assigned a score that relates to its tolerance to pollution. ATSPT is a measure of the average tolerance score of the taxa recorded in a sample. A high ATSPT may indicate harm to the ecosystem, as only tolerant taxa survive under these disturbed conditions.
Benthic macroinvertebrates: In this report, the use of this term refers to animals that live in the deeper parts of the riverbed and its sediments, well away from the shoreline. Because many of these species are immobile, benthic macroinvertebrates respond to local conditions and, because some species are long living, they may be indicative of environmental conditions that are long standing.
Biological indicator groups: These are groups of animals or plants that can be used to indicate changes to aquatic environments. Members of the group may or may not be related in an evolutionary sense. So while diatoms are a taxon that is related through evolution, macroinvertebrates are a disparate group of unrelated taxa that share the characteristic of not having a vertebral column, or backbone. Different biological indicator groups are suitable for different environments. Diatoms, zooplankton, littoral and benthic macroinvertebrates, and fi sh are the biological indicator groups most commonly used in aquatic freshwater environments. In addition, although not strictly a biological group, planktonic primary productivity can also be used as an indicator. However, for a number of logistical reasons fi sh and planktonic primary production are not suitable for use in the Mekong.
Diatoms: These are single-celled microscopic algae (plants) with cell walls made of silica. They drift in river water (planktic/planktonic) or live on substrata such as submerged rocks and aquatic plants (benthic/benthonic). They are important primary producers in aquatic food webs and are consumed by many invertebrate animals. Diatoms are a diverse group and respond in

xiv
many ways to physical and chemical changes in the riverine environment. Diatom communities respond rapidly to environmental changes because of their short generation times.
Environmental variables: These are chemical and physical parameters that were recorded at each sampling site at the same time as samples for biological indicator groups were collected. The parameters include altitude, water transparency and turbidity, water temperature, concentration of dissolved oxygen (DO), electrical conductivity (EC), activity of hydrogen ions (pH), and concentrations of chlorophyll-a, as well as the physical dimensions of the river at the site.
Littoral macroinvertebrates: In this report, the use of this term refers to animals that live on, or close to, the shoreline of rivers and lakes. This group of animals is most widely used in biomonitoring exercises worldwide. They are often abundant and diverse, and are found in a variety of environmental conditions. For these reasons littoral macroinvertebrates are good biological indicators of environmental changes.
Littoral organisms: These are organisms that live near the shores of rivers, lakes, and the sea.
Macroinvertebrates: An informal name applied to animals that do not have a vertebral column, including snails, insects, shrimps, and worms, which are large enough to be visible to the naked eye. Biomonitoring programmes often use both benthic and littoral macroinvertebrates as biological indicators of the ecological health of water bodies.
Primary producers: These are organisms at the bottom of the food chain, such as most plants and some bacteria (including blue-green algae), which can make organic material from inorganic matter.
Primary production: This refers to the organic material made by primary producers. Therefore, planktonic primary production is the primary production generated by plants (including diatoms) and bacteria (including blue-green algae) that live close to the surface of rivers, lakes, and the sea.
Primary productivity: This refers to the total organic material made by primary producers over a given period of time.
Reference sites: These are sampling sites that are in an almost natural state with little disturbance from human activity. To be selected as a reference site in the MRC biomonitoring

xv
programme, a site must meet a number of requirements including pH (between 6.5 and 8.5), electrical conductivity (less than 70 mS/m), dissolved oxygen concentration (greater than 5 mg/L) and average SDS (between 1 and 1.67). Reference sites provide a baseline from which to measure environmental changes.
Sampling sites: These are sites chosen for single or repeated biological and environmental sampling. Although locations of the sites are geo-referenced, individual samples may be taken from the different habitats at the site that are suitable for particular biological indicator groups. Sites were chosen to provide broad geographical coverage of the basin and to sample a wide range of river settings along the mainstream of the Mekong and its tributaries.
Site Disturbance Score (SDS): This is a comparative measure of the degree to which the site being monitored has been disturbed by human activities, such as urban development, water resource developments, mining, and agriculture. In the MRC biomonitoring programme, the SDS is determined by a group of ecologists who attribute a score of 1 (little or no disturbance) to 3 (substantial disturbance) to each of the sampling sites in the programme after discussion of possible impacts in and near the river.
Taxon/taxa (plural): This is a group or groups of animals or plants that are related through evolution. Examples include species, genera, or families.
Total richness: This measurement refers to the total number of taxa (types) of plants or animals belonging to a particular indicator group (e.g. diatoms, zooplankton) collected at a site.
Zooplankton: Small or microscopic animals that drift or swim near the surface of rivers, lakes, and the sea. Some are single celled while others are multi-cellular. They include primary consumers that feed on phytoplankton (including diatoms) and secondary consumers that eat other zooplankton. Zooplankton can be useful biological indicators of the ecological health of water bodies because they are a diverse group with a variety of responses to environmental changes. Zooplankton communities respond rapidly to changes in the environment because of their short generation times.

xvi

xvii
Summary
The Mekong River is one of the most important rivers in the world in terms of human dependency on riverine aquatic resources for sustenance and survival. The quality of life of the 60 million or more people living in the Lower Mekong Basin (LMB) depends on both the economic resources and the ecological health of the river.
This report describes the biomonitoring survey conducted in 2008 in the lower Mekong River and which contribute to the evaluation of the overall ecological health of the river. These studies build on the development of the methods used for sampling and analysis in the biomonitoring programme that evolved during the 2003 - 2007 studies when various approaches were tested and modifi ed. In 2008, the biomonitoring programme was transferred to the Mekong River Commission (MRC) Member Countries so, in contrast to the previous organisation of sampling, identifi cation, analysis and reporting from 2004 - 2007, each of the National teams with support from the MRC Secretariat (MRCS) performed all of these processes in the eight sites examined within their own countries. Three types of biometric indicators of the health of the Mekong aquatic ecosystem were calculated for each of four groups of organisms: benthic diatoms, zooplankton, littoral macroinvertebrates and benthic macroinvertebrates included in the biomonitoring programme. These indicators were abundance, average richness, and the Average Tolerance Score per Taxon (ATSPT). A healthy ecosystem is indicated by high abundance, high average richness, or a low ATSPT (signifying of the presence of pollution-sensitive species). Each indicator was calculated for individual samples of each group of organisms collected during a site examination. The collection of multiple samples per site enables the assessment of within-site variability of the indicators and also allows for statistical testing of the signifi cance of differences both within and between the same sites over multiple years.
The objectives of this report are to (i) describe the biological indicator groups sampled during 2008, (ii) use this information to derive biological indicators for the sites examined in 2008 and (iii) use biometric indicators to evaluate these sites.
The total of 32 sites were assessed and classifi ed into four class groupings. Of the 2008 sites, 9 were in Class A (‘excellent ecological health’), 12 in Class B (‘good’), 10 in Class C (‘moderate’) and 1 in Class D (‘poor’). A temporal change of ecological health over the period of 2004 - 2008 was found in many locations. Lower scores may have resulted from an increase in human disturbance, and declines in habitats and water quality. Some locations indicate improvement, others indicate degradation. The temporal trend of ecological health of the Mekong River sounds a warning that environmental impacts, such as human disturbance. and degradation of habitats and water quality are occurring in some parts of the Mekong River. Further investigations to identify the causes and effects on biological components are needed to suggest remedial actions.

xviii

Page 1
1. Introduction
The Mekong River is one of the most important rivers in the world in terms of human dependency on riverine aquatic resources for sustenance and survival. For the 60 million or more people living in the Lower Mekong Basin (LMB) their quality of life depends on both the economic resources and the ecological health of the river.
This report describes the biomonitoring survey in the lower Mekong River conducted in 2008 and which contribute to the evaluation of the overall ecological health of the river. These activities were initiated in 2003, when pilot studies determined the biological indicator groups which could be used for biomonitoring. In 2004, a major part of the analysis was the comparison of the biological variability both within and between individual sites. This analysis confi rmed that within-site variability is comparatively low, and that the sampling effort used in the programme is suffi cient to characterise each site adequately. In 2005, the study focus was on testing the performance of assessment metrics developed and widely used elsewhere to describe community structure (species richness, abundance, a species diversity index, and a dominance index) when these approaches are applied to data from the Mekong River system. In many cases these metrics did not perform very well. In 2006, the emphasis was on developing tolerance values to stress for each taxon (which included organisms identifi ed to species, genus or family) that are specifi cally applicable to the Mekong River system. In addition, the other metrics were re-tested with the larger data set that was then available. In 2007, the study focus was on three biological metrics (richness, abundance, and ATSPT). Regression analyses were used to examine relationships between biological metrics and environmental variables. The results of the development of the biomonitoring survey are published in the MRC Technical Paper Series (Sangpradub and Boonsoong, 2006; Davison et al., 2006; MRC, 2008; Vongsombath et al., 2009a; and Vongsombath et al., 2009b). In 2008, the biomonitoring programme was transferred to the MRC Member Countries. In contrast to the organisation of sampling, identifi cation, analysis and reporting in 2004 - 2007, each of the National teams with support from the MRCS performed all of these processes at the eight sites examined within their own countries. These initial surveys, together with the information collected in 2008 produced a large body of information (109 sampling events, 60 sites) on the Mekong River and its tributaries. Figure 1.1 illustrates the development of the monitoring activities through time.
The objectives of this report are to (i) describe the biological indicator groups sampled during 2008, (ii) use this information to derive biological indicators for the sites examined in 2008 and (iii) use biological indicators to evaluate sites.
Three types of indicators of the health of the Mekong aquatic ecosystem were calculated for each of four groups of organisms: benthic diatoms, zooplankton, littoral macroinvertebrates and benthic macroinvertebrates included in the biomonitoring programme. These indicators were abundance, average richness, and ATSPT of each of the four groups. A healthy ecosystem is indicated by high abundance, high average richness, or a low ATSPT (signifying the presence of

Report on the 2008 biomonitoring survey of the lower Mekong River and selected tributaries
Page 2
pollution-sensitive species). Each indicator was calculated for individual samples of each group of organisms collected when a site was examined. The collection of multiple samples per site enables an assessment of within-site variability of the indicators and also allows for statistical testing of the signifi cance of differences both within and between the same sites over multiple years.
Figure 1.1 Timeline for biomonitoring in the Mekong River and its tributaries
Design of activities Develop and test methods Transfer of activities Dissemination
2003:Biological groups selected:
Benthic diatoms; Zooplankton; Littoral macro-invertebrates; Benthic macroinvertebrates
2003 2004 2005 2006 2007 2008 2009 2010
2007: Sites evaluated using biological indicators
2008: Data collected
2010: Publication a methods hand-
book, identification books and educational materials on
biomonitoring
2004-2007: Biological indicators tested
2009: Data analysis and reporting
2010: National Teams continue biomonitoring activities

Page 3
2. Materials and methods
2.1 Sampling sites
For the 2008 biomonitoring survey, a team of national experts in consultation with the MRCS and the National Mekong Committees of the four LMB countries of Cambodia, Lao PDR, Thailand and Viet Nam selected a total of 32 sites to be sampled during March 2008. Eight sites were selected in each country. Some of these had been sampled in the previous years’ biomonitoring surveys but nine were new; four in Thailand and fi ve in Viet Nam (Table 2.1). Details of the 2008 survey sites are given below, and summarised in Table 2.2 and Figure 2.1.
Table 2.1 Sites sampled in 2008 and during previous years’ biomonitoring surveys
Country Site Location 2004 2005 2006 2007 2008Cambodia CKT Mekong River, Kampi pool, Kratie province X X X
CMR Mekong River, Stung Treng Ramsar site X X X XCSJ Se San River, downstream of Srepok River junction X X X X
CKM Se Kong River, Kbal Koh village, Stung Treng province X X X X
CSP Sre Pok River, Phik village, Ratanakiri province X X X X XCSU Se San River, Dey It village, Rattanakiri Province X X X XCKL Bassac River, Koh khel X XCSK Stoeng Sangke River, Battambang X X
Lao PDR LDN Mekong River, Done Ngiew X XLSD Se Done River, Ban Hae X XLKL Se Kong River, Ban Xou X X XLBH Se Bang Hieng River, under bridge X XLBF Se Bang Fai River, under bridge X XLVT Mekong River, Ban Huayhome X X XLMX Mekong River, Ban Xiengkok X XLPB Mekong River, Done Chor X X X
Thailand TNP Mekong River, Nakorn Panom XTSM Songkhram River, Mekong junction X XTNK Nam Kam River, Na Kae X XTMU Nam Mun River, Ban Tha Phae, Ubon Ratchathani X XTKC Nam Mun River, Mekong junction XTUN Nam Mun River, Ubonrachathani XTCS Mekong River, Chiang San, Chiang Rai XTKO Nam Kok River, Chaing Sean Water Quality Station X X X
Viet Nam VCT Bassac River, Phu An, Can Tho X XVLX Bassac River, Long Xuyen, An Giang X XVDP Bassac River, Da Phuoc, An Giang XVKB Bassac River, Khanh Binh, An Giang XVTP Mekong River, Thuong Phuoc, Dong Thap XVTT Mekong River, Thuong Thoi, Dong Thap XVCL Mekong River, Cao Lanh, Dong Thap X XVVL Mekong River, My Thuan, Vinh Long X

Report on the 2008 biomonitoring survey of the lower Mekong River and selected tributaries
Page 4
Cambodia
In March 2008, the Ecological Health Monitoring Team conducted its annual sampling at eight sites in Cambodia’s Mekong system. Six sites, CKT, CRM, CSJ, CKM, CSP, and CSU were in the Upper Mekong mainstream and its tributaries, one site (CKL) was in the Tonle Bassac River downstream of the Mekong, and one site (CSK) was in the Tonle Sap Great Lake. The sites were selected in an attempt to include a diversity of habitats and the three types of localities of the Mekong system present in Cambodia, i.e. upstream, downstream, and in the Great Lake area.
CKT (Mekong River, Kampi pool, Kratie province)
The CKT site on the Mekong mainstream is at Kampi Village, Sam Bok Commune, Kratie District, Kratie. Here there are a few houses on the left bank and a tourist site for dolphin watching on the right bank. The riverbank has a moderate slope and shows evidence of some erosion. The banks are covered with various grasses and trees. The substratum is composed of sandstones, rocks, rocks with algae, and some debris. There is a large, deep pool nearby, which is believed to be the main habitat of the dolphins.
CMR (Mekong River, Stung Treng Ramsar site)
The CMR site, in Sdao Village, Sdao Commune, Stung Treng District, Stung Treng Province, is on the Mekong mainstream where the Se San River joins the Mekong. It site is characterised by many trees and some houses on the bank. The substratum is composed of sand, cobbles, bedrock covered by fi lamentous algae, and some debris. There is noticeable human and animal waste fl owing down a damaged bank into the river.
CSJ (Se San River, Downstream of Srepok River junction)
The CSJ site, in Kam Phon Village, Kam Phon Commune, Se San District, Stung Treng Province, is at the confl uence of the Se San and Sre Pok Rivers. It is characterised by forests and some houses. The substratum is composed of sand, pebbles, cobbles, bushes, some rocks and debris. There are small areas showing evidence of bank erosion.

Page 5
Materials and methods
CKM (Se Kong River, Kbal Koh Village, Stung Treng Province)
The CKM site on the lower Se Kong River is in Kbal Koh Village, Cheuteal Thom Commune, Thalab Rovath District, Stung Treng Province. The site is characterised by a few houses and many trees. There is small-scale agriculture, livestock raising, a ferry port, and a small amount of bank erosion. The substratum is composed of sand, rocks, mud, and a little debris.
CSP (Sre Pok River, Phik Village, Ratanakiri Province)
The CSP site upstream on the Sre Pok River, is in Phik Village, Ratanakiri Commune, Ratanakiri District, Ratanakiri Province. The site is characterised by some forested areas, small-scale agriculture, a ferry crossing, and sewage inputs from the village. The substratum is composed of bedrock and cobbles, clay and mud, sand, debris, and bamboo leaves.
CSU (Se San River, Dey It Village, Rattanakiri Province)
The CSU site on the Se San River is in Dey It Village, Chey Udom Commune, Lum Phat District, Ratanakiri Province and is about 500 m from the ferry port. It is characterised by a few houses and some erosion on the left bank, with small-scale agriculture, abundant vegetation and bamboo stands, and some cultivation such as that of cashew nut and fruit trees alongside the riparian zone. The riverbed substratum contains boulders on bedrock, sand, rock, and debris. There is some sewage and bank erosion. Local people report that two days before our sampling visit there was no fl ow in the river, possibly the result of upstream dam activities.
CKL (Bassac River, Koh Khel Village, Kan Dal Province)
The CKL site on the Bassac River is in Koh Khel Village, Koh Khel Commune, Koh Phom District, Kan Dal Province. This is a dense residential area with agricultural villages. Large amounts of human and livestock waste fl ow into the river. The substratum is composed of sand, mud, debris, and a few pebbles. The water surface is completed covered by water hyacinths.
Report on the 2008 biomonitoring survey of the lower Mekong River and selected tributaries
Page 6
CSK (Stoeng Sangke River, Battambang Province)
The CSK site, in Unlung Taua Village, Anling Taua Commune, Battabang Province, lies at the point where the Stoeng Sangke River enters the Tonle Sap Great Lake. The Stoeng Sangke River fl ows through many residential areas of the three north-western provinces of the country. The site is characterised by fl ooded forests, water hyacinths, fi sh pens, fl oating huts and a fl oating village. The substratum is composed of deep layers of mud and debris.
Lao PDR
Sampling sites in Lao PDR include localities on the Mekong and its major tributaries, and cover a range of river settings from bedrock-confi ned channels in northern Lao PDR through to the alluvial channel systems of central and southern Lao PDR. The sites also exhibit varying levels of disturbance from human activity. Most are located in or close to villages or towns. Some are next to fi elds where crops are grown, others are upstream of dams, and in areas (LKL) where for the past two years gold has been collected. At some sites, bank erosion, sand or gravel excavation, fi shing and river transport occur.
LDN (Mekong River, Done Ngiew)
The LDN site on the Mekong River is in Done Ngiew, a part of Ban Muang, Pathumphone District, Champasack Province. The sampling point is about 800 m above the ferry crossing to Watphu Champasack. The right bank is quite steep. Bank erosion is present in some areas where there are a few maize gardens, vegetable cultivation and the growth of riparian shrubs (Homonia riparia). About 100 m from the bank, there are plantations and rice fi elds. The slope on the left bank is covered with tobacco and vegetable gardens and there are houses about 200 m from the bank. Substrata at the site are almost completely bedrock, with sandy areas and some small islands in the channel. A large area is covered by fl oating and attached fi lamentous algae.
LSD (Se Done River, Ban Hae, Pakse)
The LSD site is on the Se Done River, a tributary of the Mekong, in Ban Hae, Pakse Town and is approximately 4 km upstream from the mouth of the Se Done River. There are maize and vegetable gardens on the right bank, with houses, a school, and vegetable gardens on the left bank. This site is often disturbed by people fi shing and pumping water. Substrata of the site are bedrock, with sandy and muddy areas.

Page 7
Materials and methods
LKL (Se Kong River, Ban Xou Touat, Attapeu)
The LKL site on the lower Se Kong River, a tributary of the Mekong, is in Ban Xou Touat, Sanamxay District, Attapeu Province. On the right bank, there is a town and gardens. Large areas of bank erosion and boat docks are present. On the left bank, there are banana gardens, and stands of bamboo. There is some bank erosion. For the past two years, gold mining has taken been taking place on the right bank and on an island in the middle of the river. Substrata in faster-fl owing areas are cobbles, pebbles and gravel, with sand and debris accumulating in the pond or areas with slow currents.
LBH (Se Bang Hieng River, Ban Se Bang Hieng, Savannakhet)
The LBH site in Ban Se Bang Hieng, Songkhone District, Savannakhet Province, lies under the bridge over the Se Ban Hieng River, a tributary of the Mekong. There are houses and small vegetable gardens on both banks. The substratum is a mix of boulders, concrete, sand, mud, and debris. This location is frequently disturbed by villagers’ activities.
LBF (Se Bang Fai River, Ban Se Bang Fai, Khammouan)
The LBF site in Ban Se Bang Fai, Se Bang Fai District, Khammouan Province, lies under the bridge over the Se Bang Fai River, a tributary of the Mekong. There are houses and small vegetable gardens on both banks. The substratum is a mix of boulders, concrete, sand, mud and debris. This location is frequently disturbed by villagers’ activities.
LVT (Mekong River, Vientiane)
The LVT site is on the Mekong River, with the sampling being carried out in Ban Huayhome, Sikhottabong District, about 5 km upstream from Vientiane Capital. Thailand lies on the right bank and Lao PDR on the left where there is a village, large vegetable gardens and a boat dock. Some sampling problems related to national boundaries were experienced here making sampling impossible on the right side of the river. Other problems arose from the presence of a bedrock substratum and strong currents in the middle of the river. Therefore samples were taken only from the left side of the river .

Report on the 2008 biomonitoring survey of the lower Mekong River and selected tributaries
Page 8
LMX (Mekong River, Ban Xiengkok, Luangnamtha)
The LMX site is on the Mekong River, at upper Ban Xiengkok, Long District, Luangnamtha Province. Myanmar lies on the right bank and Lao PDR on the left where there are villages, guesthouses, an immigration offi ce and a port. Sampling could be done only along the left bank. In general, this site experiences strong currents and is much disturbed by human activities and river traffi c. The substratum close to the bank is clay and sand; with cobbles and pebbles about 5 m from the bank.
LPB (Mekong River, Ban Done Chor, Luangprabang)
The LPB site is at Done Chor on the Mekong River, about 1.5 km above Suphanuvong University. It is on an island belonging to Ban Done Chor, Luangprabang District. There is secondary forest on the right of the island with some grass and sandy areas on the island itself. There are villages, roads, and sand and gravel excavation on the left of the island. The substrata of running water areas are cobbles, pebbles, and gravel with attached algae. There is a pond below the island and this standing water habitat has a substratum composed of clay, mud and sand. In general, this site experiences a great deal of disturbance from various activities such as those related to water use, sand and gravel excavation, and river traffi c.
Thailand
The selected sampling sites include sites sampled during the 2004 - 2007 biomonitoring programme and some new sites in north-eastern Thailand. These include localities on the Mekong and its major tributaries and are mostly in the north and north-east of Thailand with two sites in the north and six in the north-east. The sites exhibit various disturbances refl ecting low to high human-activity impacts. Some sites are in or close to villages or towns; some are next to fi elds where crops are grown and livestock graze; some are upstream or downstream of dams or weirs, and some are exposed to moderate to heavy river traffi c.
TNP (Mekong River, Nakorn Panom)
The TNP site is on the border between Thailand and Lao PDR and is about 1.5 km upstream of the Nakorn Phanom downtown area. There are many small villages of about 100 inhabitants around the site. The left bank on the Lao side is steep with a slope of 30°; the slope on the right bank on the Thai side is 45°. The river substratum is mud and clay near both banks with bedrock and cobbles in the middle of the river. There is some agriculture in the riparian zone,with a few houses, some open shoreline, trees, and small-scale fi sh farms. The impact from human

Page 9
Materials and methods
activities appears to result from rubbish disposal, agricultural runoff, and fi sh farming. There is some bank erosion.
TSM (At the confl uance of the Songkram and Mekong Rivers)
The TSM site lies on the border between Thailand and Lao PDR at the confl uence of the Songkram and Mekong Rivers. The left bank is relatively level with a fl at sand bar while the right has a 40° slope. The riparian vegetation is bamboo forest. This site is surrounded by small villages with about 80 inhabitants. The riparian zone includes some forest, landslide areas, a few houses, aquatic plants, algae such as river weed (called ‘Kai’ or Cladophora glomerata), small scale agriculture, pear trees, fl oating houses and fi sh cages. The substrata are composed of sand and clay, and fi rm mud and sand. The human impact appears to come from a restaurant, fi sh cages, the disposal of human and animal wastes, agricultural runoff and damage to banks by livestock.
TNK (Nam Kam River, Mukdaharn)
The TNK site is about 20 km downstream from the water pumping station. The river at this site is shallow (<0.5-1.5 m deep) with 20 - 30° slopes on both banks. The vegetation on the right bank is bamboo and grasses. The substrata are composed of wood and leaf debris, but include areas with material from soil erosion and land slides, and sand and clay mixed with gravel, sand and mud. The human activities include human waste and rubbish disposal, and there is some bank erosion.
TMU (Nam Mun River, Kong Chiam District, Ubonrachathani)
The TMU site is about 2 km above the confl uence of the Mun and Mekong Rivers. It is surrounded by moderate-sized communities of about 300 inhabitants. Both banks have 30° slopes. In the riparian zone there are rice fi elds, agriculture, houses, soil erosion areas, cattle grazing, fi sh farms and fl oating houses. The substratum is almost all sand and gravel. The human impact appears to be related to the disposal of human and animal wastes, agricultural and urban runoffs.
TKC (Nam Mun River, Kong Chiam District, Ubonrachathani)
The TKC site lies on the border between Thailand and Lao PDR at the confl uence of the Mun and Mekong Rivers. There is a fl at sand bar near the steep left bank which slopes at 40° (Lao

Report on the 2008 biomonitoring survey of the lower Mekong River and selected tributaries
Page 10
side); the right bank has a 45° slope (Thai side). The riparian vegetation is bamboo forest. This site is surrounded by fi shing villages with about 800 inhabitants. The riparian zone includes some forest, land slides, tourist sites, pear trees, fl oating houses and fi sh cages. The substratum is composed of sand and clay, with some fi rm mud and sand. The human impacts come from a restaurant, fi sh cages, and the disposal of human and animal wastes.
TUN (Nam Mun River, Ubonrachathani)
The TUN site is about 10 km from downtown Ubon Rachathani and surrounded by a few houses of fi shermen. Both banks have slopes of 15°. The riparian zone includes cattle grazing areas, soil erosion areas, and algae and aquatic plants. The substratum is composed of mud and aquatic plants, sand and clay, and fi rm sand and gravel. The human impact appears to come from the disposal of human and animal wastes, river traffi c and agriculture.
TCS (Mekong River, Chiang San District, Chiang Rai)
The TCS site, on the border between Thailand and Lao PDR, is in Chiang San District. This site is the most important dock for river traffi c, and for the transportation of imports and exports between Thailand and the other countries in the Mekong Region. There is a fl at sand bar on the left bank (Lao PDR) while the right bank consists of an artifi cial bank and concrete wall. This site is surrounded by large communities of about 10,000 inhabitants. The riparian zone includes some forest, land slide areas, pastures for large animals such as water buffalo, areas of soil erosion, algae and aquatic plants, and a local market. The substratum is composed of sand, clay, mud and gravel. The human impacts at this site come from river traffi c, construction, domestic waste, and disposal of rubbish resulting from human and trading activities.
TKO (Nam Kok River, Chiang, Chiang Rai)
The TKO site was also sampled in 2004 and 2005. The left bank has a 30° slope while the right is fl at. Both banks are eroded and the riparian areas are cleared forest, with agricultural development on the left bank and a village on the right. There is a cobble and gravel island in the centre of the river. Human infl uences are related to agricultural runoff, river traffi c (particularly to the effects on the banks from the wakes created by tourist boats), and a small village. The substratum is composed of sand, cobbles and gravel.

Page 11
Materials and methods
Viet Nam
The sampling sites in Viet Nam are on the Mekong and Bassac Rivers. Four sites are on the Bassac River near Can Tho City, Long Xuyen City, and Khanh Binh, An Giang Province. Three sites are on the Mekong River in Dong Thap Province. The remaining site is in an urban area of Vinh Long Province. Two new sites near the border between Viet Nam and Cambodia were selected. These new sites are not signifi cantly impacted by human activities and have strong current fl ows. The substratum of one of these consists of fi ne sand and alluvia, while that of the other consists of sand and hard clay. The other six sites are affected by tides. There are alluvial deposits in the littoral zones and the bottom of the river is sand.
VCT (Bassac River, Phu An, Cai Rang, Can Tho)
The VCT site is in the lowermost segment of the Bassac River, near the rapidly developing city of Can Tho. There are many houses and orchards on both sides of this site. The littoral substratum is mainly a thin layer of mud, while that right bank consists of sand, mud, and organic material. On the left side of the river it is mainly clay, mud and organic matter. In midstream areas, there is sand and a little mud. The My Thuan bridge in this region is under construction. There are many different activities involving humans; such as transportation by ships and barges, the operations of a river port and of oil storage facilities, the treatment and discharge of urban sewage water, fi shing and bathing.
VLX (Bassac River, Long Xuyen, An Giang)
The VLX site is in Long Xuyen city. The fl ows here are rather strong, and the left bank is eroded. Agricultural production is both diverse and large, and there are some rice processing factories. Littoral areas consist of mud, organic matter, and rubbish (such as plastic bags, wood, decaying bodies of dead animals). The right bank substratum is composed of sand and organic matter, while the left bank is soil, mud and clay. The midstream is sand. This site is near Long Xuyen River Port, so there are many ships, boats, and barges. There are many other human related activities including rice processing plants and the sewage treatment and discharge.
VDP (Bassac River, Da Phuoc, An Phu, An Giang)
The VDP site is in an agricultural area, with many houses and orchards on the left bank, and rice, maize, beans and other plants growing on the right bank. At the river, there is alluvium on the right side and sand and clay on the left. There is sand in midstream areas. There are

Report on the 2008 biomonitoring survey of the lower Mekong River and selected tributaries
Page 12
boats, fi shing, and washing activities, as well as houses along the banks. At some places, soil is eroding into the river.
VKB (Bassac River, Khanh Binh, An Phu, An Giang)
The VKB site is on the Bassac River on the border between Cambodia and Viet Nam. On the left bank areas of natural land alternate with agricultural land. On the right bank, there are markets and shops. The littoral area is sand and detritus. The right river bed contained rubbish, sand, and sewage. The left river bed is clay, sand and silt. In midstream there is sand and silt. A lot of sewage water and rubbish from the market are discharged into the river. Many other activities occur including agriculture, sand excavation, fi sh farming, washing and boating.
VTP (Mekong River, Thuong Phuoc, Hong Ngu, Dong Thap)
The VTP site is near the border between Cambodia and Viet Nam. A border checkpoint and areas of natural land lie on the left bank and on the right bank are houses, gardens and another border checkpoint. The littoral area consists of sand and alluvium. The right river bed is sand and clay, while the left is sand, as is the midstream area. The human activities are limited here, only sand excavation and small transport boats are evident.
VTT (Mekong River, Thuong Thoi, Hong Ngu, Dong Thap)
The VTT site is on the Mekong River. On the left bank areas of natural land alternate with agricultural land. There is natural land on the right bank, and in some places the soil is eroded. Littoral areas consist of alluvium and organic matter. On the river bed, there is clay on the right, alluvium and organic matter on the left, and sand in midstream areas. Some human activities such as fi shing, farming and boat transportation are evident. There is some soil erosion.
VCL (Mekong River, Tan Hau, Tan Thuan Tay, Cao Lanh, Dong Thap)
The VCL site is on the Mekong River, near Cao Lanh City. Many areas of agricultural land alternate with natural land on the left bank, with houses and gardens on the right bank. Littoral areas consist of mud, alluvium, and a great deal of rubbish such as dead trees, plastic bags, etc. On the left river bed, there is mud, alluvium, and rubbish, including pesticide bottles. On the right river bed, there is sand and clay, and in midstream there is sand and alluvium. The human activities consist of agriculture, boat transportation, fi shing and washing.

Page 13
Materials and methods
VVL (Mekong River, My Thuan, Vinh Long)
The VVL site is on the Mekong River near Vinh Long Town. On the left bank there are gardens, agricultural land, and houses. On the right bank, there are houses, orchards, and construction-material storage areas. There is a mixture of sand, dead fi sh, rubbish, plastic bags, and pesticide bottles in the littoral areas. On the right river bed, there is clay and sand. On the left bank, there is sand, and also dead fi sh, rubbish, plastic bags, and pesticide bottles. The midstream bed is sand. Since this site is near a bridge construction area there are many of ships, barges and boats. Many construction materials are stored on the right bank, and sand excavation, fi shing, erosion, sewage and agricultural activities are evident.

Report on the 2008 biomonitoring survey of the lower Mekong River and selected tributaries
Page 14
Table 2.2 Description of sites sampled in 2008
Site code
River Location Date sampled
Coordinates (UTM)
Land cover of left bank
Land cover of right bank
Littoral substratum
Potential human impacts
CKT Mekong Kampi pool 19/3/08 48PN1393502E0610914
Few houses; tourist area; moderate slope; some erosion
Steep, eroded bank; some trees on face; many on top; few houses
Sand; some stones
Tourism activities at dolphin tourist site
CMR Mekong Stung Treng Ramsar site
23/3/08 48PN1504098E618663
Forest, few houses
Forest, few houses
Sand; pebbles; cobbles; bedrock; fi lamentous algae
Disposal of human and animal wastes
CSJ Se San downstream of Srepok River junction
20/3/08 48PN1498832E621744
Forest; water buffalo
Forest; water buffalo
Sand; pebbles; cobbles; bushes
In signifi cant impact from human activities
CKM Se Kong Kbal Koh village
21/3/08 48PN1539069E606331
Forest; few houses; eroded banks
Forest; few houses; eroded banks
Sand-rocks, mud and little debris.
Disposal of animal wastes, navigation
CSP Sre Pok Phik village 23/3/08 48PN1525674E765124
Forest, small scale agriculture; ferry crossing
Forest; small scale agriculture; ferry crossing
Bedrock and cobble, with many small channels
Disposal of human wastes
CSU Se San Dey It village
24/3/08 48PN1490553E717794
Forest, bamboo, cashew nut trees outside riparian zone
Forest and bamboo; fruit trees outside riparian zone
Boulders on bedrock
River traffi c
CKL Bassac Koh Khel 29/3/08 48PN1245255E503786
Villages and gardens; bananas
Villages and gardens
Sand; mud; water hyacinth
Disposal of human and animal wastes
CSK Stoeng Sangke
Battambang 28/3/08 48PN1461902E357473
Open forest; fi sh pens; fl oating hut; fl oating village downstream
Open forest; fi sh pens
Silt; fl ooded bushes
Disposal of human waste; fi shing; river traffi cn
LDN Mekong Done Nguei 10/3/08 48PN1657517E596193
Maize and tobacco gardens, bank erosion
Villages and vegetable gardens; shrub (Homonia riparia)
Sand; mud fi lamentous algae
Fishing and river traffi c
LSD Se Done Ban Hae 11/3/08 48PN1671756E587623
Villages and gardens; bananas
Maize, vegetable gardens
Bed rock; mud; sand; fi lamentous algae
Agricultural runoff; disposal of human, pumping, and animal wastes
LKL Se Kong Ban Xou Touat
13/3/08 48PN1623478E670696
Gardens; bananas; bamboo; bank erosion
Villages and gardens; bank erosion
Cobbles; pebble; gravel; changes in water channel since 2007
Disposal of human waste; fi shing; river traffi c and animal wastes
LBH Se Bang Hieng
Under the bridge
15/3/08 48QN1887920E498434
Houses; some trees on bank; washing place
Villages; washing place; boat parking; vegetation; gardens downstream
Boulders on bedrock; sand; mud; fi lamentous algae
Human wastes; rubbish disposal; and animal wastes

Page 15
Materials and methods
Site code
River Location Date sampled
Coordinates (UTM)
Land cover at left bank
Land cover at right bank
Littoral substratum
Potential human impacts
LBF Se Bang Fai Under the bridge
16/3/08 48QN1959958E454745
Houses; water pumping; some trees on bank; washing place
Houses; offi ce; fl oating pump; washing place; vegetation gardens downstream
Little boulders on bedrock; sand; fi lamentous algae on bed rock
Waste and rubbish; disposal of human and animal wastes; bank erosion downstream
LVT Mekong Ban Huayhome
18/3/08 48QN1988731E239871
Lao villages; port; vegetable gardens, and grass on the bank
Thai villages; port and vegetable gardens, and grass on the bank
Cobbles, gravel, sand; debris, and clay
Agricultural run off; human wastes and rubbish disposal; fi sh farming and river traffi cn
LMX Mekong Ban Xiengkok
20/3/08 47QN2311778E670860
Lao villages; port and; washing place
Burmese vegetable gardens, bamboo and cattle
Cobbles; gravel; fi lamentous algae; clay
Wakes from large boats; damage to banks; bank erosion; disposal of human and animal wastes; livestock
LPB Mekong Done Chor 22/3/08 48QN2206957E206113
Village; downstream of university; large sand and gravel excavation; road from left to the island
Steep, eroded bank; some trees on face; many on top; village downstream
Cobble; gravel; sand fi lamentous algae; clay
Sand and gravel excavation, river traffi c, fi shing
TNP Mekong Nakorn Panom
5/3/2008 48QN1926454E476094
Agriculture, a few houses.
Agriculture, some trees on bank, small scale fi sh farms
Clay and mud, bed rock, wood debris,
Rubbish disposal, agricultural runoff, fi sh farming, bank erosion
TSM Songkhram Mekong junction
6/3/2008 48QN1951509E443775
Forest , land slide, few houses, aquatic plants and algae
Small scale agriculture, docks, fl oating houses and fi sh cages
Sand and clay, fi rm mud and sand
Restaurant, fi sh cages, disposal of human and animal wastes, agricultural runoff, livestock damage to bank
TNK Nam Kam Mukdaharn 7/3/2008 48QN1874332E450496
Soil erosion, a few houses, wood and leaf debris,
Soil erosion and land slide
Sand and clay, gravel, sand and mud
Human waste and rubbish disposal form downstream, bank erosion
TMU Nam Mun Kong Chiam
8/3/2008 48PN1673182E552465
Fields, agriculture, houses and fl oating houses, soil erosion, cattle grazing
Fish farm and fl oating house
Sand and gravel Disposal of human and animal wastes, agricultural and urban runoffs, urban runoffs
TKC Nam Mun and Mekong
Kong Chaim
9/3/2008 48PN1694552E552099
Village, agriculture, cattle grazing, fi sh farm
Bed rock and cobbles, with many small channels and soil erosion
Sand and mud Agricultural runoff, livestock damage to banks, urban runoff
TUN Nam Mun Ubon-rachathani
10/3/2008 48PN1685056E494860
A few houses, small scale agriculture
Aquatic plants and a few houses
Sand and silt River traffi c, agriculture

Report on the 2008 biomonitoring survey of the lower Mekong River and selected tributaries
Page 16
Site codte
River Location Date sampled
Coordinates (UTM)
Land cover at left bank
Land cover at right bank
Littoral substratum
Potential human impacts
TCS Mekong Chiang San 11/3/2008 47QN2240109E614718
Water buffalo, soil erosion, algae, aquatic plants
Mud, aquatic plants, a few houses, market
Sand and clay, fi rm sand, gravel
River traffi c, construction, domestic and human waste disposal, market rubbish
TKO Nam Kok Chiang Rai 12/3/2008 47QN2201793E582195
Gravel and sand
Riparian zone Cobbles, gravel and sand
Agricultural runoff, river traffi c, small village
VCT Bassac Phu An, Cai Rang, Can Tho
17/03/08 48PN1106685E589048
Orchards, housing
Orchards, housing Thin mud Bridge construction, transport, navigation works, oil storage, washing, sewage treatment, port materials and fi shing
VLX Bassac Long Xuyen, An Giang
18/03/08 48PN1143437E551897
Agriculture, land erosion, strong fl ows
Housing, processing factory
Mudfl ats, organic matter, rubbish (plastic bags, wood, decaying bodies of dead animals)
Boats and ships, rice storage, grain processing factory, agriculture, bank erosion, washing, boat transportation, waste water,
VDP Bassac Da Phuoc, An Phu, An Giang
19/03/08 48PN1188035E514690
Agriculture, housing, gardens, bushes, trees
Agriculture such as maize, beans, etc.,
Alluvium, Boating fi shing, washing, housing, gardens, soil erosion
VKB Bassac Khanh Binh, An Phu, An Giang
20/03/08 48PN1210872E509482
Grain agriculture, natural land, grass cover
Market, shop Sand, detritus, rubbish, clay
Market, waste water, rubbish, agriculture, river transportation, washing, sand excavation, fi sh farming and fi shing
VTP Mekong Thuong Phuoc 1, Hong Ngu, Dong Thap
22/03/08 48PN1205766E519830
Natural land, border guard post
Housing, gardens, border guard post
Sand, alluvium Sand excavation, transportation activities
VTT Mekong Thuong Thoi, Hong Ngu, Dong Thap
23/03/08 48PN1194447E528951
Grain agriculture, natural land
Soil erosion, natural land
Sediment, alluvium, organic fertilizer
Fishing, agriculture, farming, soil erosion, river transportation.
VCL Mekong Tan Hau, Tan Thuan Tay, Cao Lanh, Dong Thap
24/03/08 48PN1153777E563798
Agricultural and natural land
Housing, gardens, river transportation
Mudfl ats, alluvium, a lot of rubbish like dead trees, plastic bags, etc.
Agricultural activities, river transportation, fi shing, solid rubbish, decaying organic matter
VVL Mekong My Thuan, Vinh Long
25/03/08 48PN1134514E603698
Gardens, agricultural land, housing
Housing, orchards, construction materials storage
Sediment, sand, dead fi sh, rubbish, plastic bags, pesticide bottles
Ships and boats, construction material storage on the right bank, sand excavation, fi shing, erosion, sewage and agriculture

Page 17
Materials and methods
Figure 2.1 Map of sites surveyed in 2008
0 100 200 km
109108
107106105
104
103
102
9594
93
92
9190
89
88
87
86
85
84
83
8281
8079
78
101100
99 98
97
96
VVLVCL
VTT
VTPVKB
VDP
VLX
VCT
TKO
TCS
TUNTKC
TMU
TNK
TSM
TNP
LPB
LMX
LVT
LBF
LBH
LKL
LSD
LDN
CSK
CKL
CSU
CSPCKM
CSJCRM
CKT
Gulf of Thailand
Gulf of Tonkin
Thailand
Viet Nam
Cambodia
Lao PDR
Viet Nam
LOWER MEKONG BASIN
96 TNK: Sampling order and site code
Biomonitoring survey 2008

Report on the 2008 biomonitoring survey of the lower Mekong River and selected tributaries
Page 18
2.2 Data collection
Environmental variables
The objective in studying the physical and chemical factors related to the selected sites in the lower Mekong River is to describe certain environmental variables by collecting data on altitude, river width and depth, the Secchi depth (water transparency), water temperature, dissolved oxygen (DO), pH and electrical conductivity (EC) and to determine a Site Disturbance Score.
1. The map coordinates and altitude of the sampling sites are determined with a Garmin GPS 12XL.
2. Stream width is measured with a Newcon Optik LRB 7x50 laser rangefi nder.
3. At each site, water-quality measurements are made in three sections of the river: near the left bank, near the right bank, and in the centre of the river.
a. A Secchi disc is used to determine water transparency. The disc is slowly lowered into the water, and the depth at which it disappears is recorded. The disc is then lowered another metre and slowly pulled up until it reappears. If the difference between the depths of disappearance and reappearance is more than 0.05 m the procedure is repeated.
b. Temperature, DO, EC, and pH are measured with a YSI 556MP5 meter, calibrated according to the manufacturer’s instructions. Readings are taken at the surface and at a depth of 3.5 m, or at the maximum depth of the river, whichever is less.
c. Elevation and river width are reported in m. Water transparency is expressed in m. Temperature is reported as degrees Celsius, and conductivity as mS/m.
4. In some situations, such as the determination of chemical variables such as DO, EC and pH, water samples can be collected from the water surface using of a water sampler. One litre per sample or three litres per site is collected. Bottles are labelled, kept in an ice box and transferred to the water quality laboratory within 24 – 36 hours for analysis.
a. For DO, the water sample is stored in 250 mL glass bottles.
b. The DO of each fi eld sample is fi xed immediately by pipetting 2 mL of manganous sulphate solution and 2 mL of alkali-iodide- azide solution into the water sample. The bottle is carefully stoppered to prevent air bubbles. The contents are mixed by inverting the bottle for at least 5 minutes and then letting it stand until the precipitate settles.

Page 19
Materials and methods
c. DO is reported as mg/L (the same as ppm).
4. All measurements of environmental variables are reported as average values.
5. A Site Disturbance Score is determined by a team of eight to ten ecologists/biologists who rate each site visited in terms of their individual observations of the combination of stressors generated by human activities. Light stress is rated 1, medium stress 2, and heavy stress 3. Sites are awarded initial independent scores which are later discussed by the group of assessors. A small percentage (-1% overall) of the scores are changed. The scores are averaged to obtain the overall Site Disturbance Score for each site.
Benthic diatoms
The objective in studying the benthic diatoms is to describe the characteristics of the diatom community in quantative terms. Diatoms respond rapidly to environmental changes.
Field methods
1. Benthic diatom sampling is performed at sites where the water depth is less than 1 m and suitable substrata extend over a distance of 100 m. The most appropriate substrata are cobbles and other grades of stones with a surface area greater than 10 cm2, but that are still small enough to fi t in a 20 – 30 cm diameter sampling bowl. At sites where the river bed is predominantly muddy or sandy and lacking suitably sized stones, samples can be taken from bamboo sticks, aquatic plants, and artifi cial materials.
2. At each site, ten samples are collected at about 10 m intervals. A sample is collected from a stone if this is coated with a thin brownish fi lm or has a slippery feel. These characteristics are often indicative of the presence of abundant benthic diatoms. Where there were no suitable stones, the nearest hard substratum can be sampled instead.
3. To sample the diatoms, a plastic sheet with a 10 cm2 square cut-out is placed on the upper surface of the stone or other substratum, and the benthic diatoms are brushed and washed off into a plastic bowl until the cut-out area is completely clear. Each sample is transferred to a plastic container and labelled with the site name, a location code, the sampling date, and sample-replicate number. The collector’s name and substratum type are also noted. Samples are preserved with Lugol’s solution.
Laboratory methods

Report on the 2008 biomonitoring survey of the lower Mekong River and selected tributaries
Page 20
1. In the laboratory, the samples are cleaned by digestion in concentrated acid, and then centrifuged at 3,500 rpm for 15 minutes. The diatom cells (which form the brown layer between the supernatant and solid particles) are siphoned into an 18-cm core tube.
2. Strong acid (H2SO4, HCl or HNO3) is added and the tubes are heated in a boiler (70 – 80ºC) for 30-45 minutes. The samples are then rinsed 4 - 5 times with de-ionized water. Distilled water is added to give a fi nal volume of 1 mL.
3. A drop (0.02 mL) of each sample is placed on a microscope slide and dried. A mounting agent such as Naphrax or Durax is added to make a permanent slide for diatom identifi cation and counting.
4. Identifi cations are made using a compound microscope, and are based on frustule type, size, special characteristics, and structure, as described and illustrated in textbooks, monographs and other publications on tropical and temperate diatoms (see Foged, 1971, 1975, 1976; Krammer & Lange-Bertalot, 1986, 1988, 1991a, 1991b; Pfi ster, 1992). In many cases identifi cation to species-level is not possible and presumptive species are designated by numbers (e.g. Navicula sp.1). This designation must be applied to that particular morphological type over all the years of the study.
5. The total count of cells on the slide (i.e. the number in the 0.02 mL drop) is used to estimate total number of individuals per sample. The number of cells counted, when multiplied by 5 gives the number per cm2. The average richness is the number of taxa per 0.2 cm2 sampled.
6. Richness, abundance and ATSPT scores are always reported per sample (0.02 cm2).
Zooplankton
The objective in studying the zooplankton is to describe the characteristics of the zooplankton community in quantitative terms. Zooplankton provide a refl ection of the biological environment and chemistry of the water column whereas the other indicators used tend to refl ect the infl uences of water chemistry and substrate characteristics.
Field Methods
1. Three sets of samples are collected at each site. One sample is taken near the left river bank, at a distance of about 4 – 5 m from the water’s edge. A second sample is taken at a similar distance from the right bank, and the third sample is taken in the middle of the river. The samples are taken at least 1 m from any potential contaminants such as debris and aquatic plants, and at least 2 m from vertical banks. At sites where the water current

Page 21
Materials and methods
is too fast to sample in the exact mid-stream, samples are collected closer to the left or the right bank, but not as close to the bank as where the sets of near-bank samples are taken.
2. Before sampling at each site, the sampling equipment (a net, bucket, and plastic jar) is washed to remove any organisms and other matter left from the previous site. Quantitative samples are collected at a depth of 0 - 0.5 m using a bucket with a volume of 10 L.
3. The 10 L of river water collected are slowly fi ltered through a plankton net (with a mesh size of 20 μm) in order to avoid any overfl ow. Water is splashed on the outside of the net to wash down any zooplankton adhering to the inner surfaces of the net.
4. When only about 150 mL of water remains in the net, the water (which contains the zooplankton) is transferred to a 250 mL plastic jar. The sample is immediately fi xed by adding about 75 mL of 10% formaldehyde to give a fi nal concentration of 4 - 5% formaldehyde. The sample jars are labelled with the site name, site code, sampling position (left bank, middle, right bank), sampling date, and the sample number.
Laboratory methods
1. In the laboratory, any large particles of debris are removed from the samples with forceps. The samples are shaken to remove any attached zooplankton, and each is fi ltered through a net with a mesh size of 10 μm, rinsed with distilled water, then allowed to settle to the bottom of a graduated cylinder and left for one hour. Any excess water is poured off until about 50 mL of water and the settled material (which contains the zooplankton) remain.
2. This 50 mL together with the settled material is transferred to a Petri dish and examined under a stereomicroscope at a magnifi cation of 40x to identify the larger species of zooplankton (> 50 μm in diameter). The smaller species and details of larger species are examined using a compound microscope at a magnifi cation of 100 – 400x. All individuals collected are counted and identifi ed to the lowest level of taxonomy possible, generally species. Identifi cation is based on morphology as described in various references (e.g. Dang et al., 1980; Eiji, 1993). After analysis, samples are returned to the bottles and preserved.
3. Richness, abundance and ATSPT scores are always reported per sample (10 L).

Report on the 2008 biomonitoring survey of the lower Mekong River and selected tributaries
Page 22
Littoral macroinvertebrates
The objective of studying the littoral macroinvertebrates is to describe, in quantative terms, the characteristics of the macroinvertebrate community living in the shallow near-shore areas.
Field methods
1. At each site, littoral macroinvertebrate samples are usually taken only on one side of the river. In most instances, this is the depositional side where sampling is easier because of the gradual shelving of the bottom that occurs in this setting in contrast to the steeper bottom characteristic of the erosional side. In addition, the depositional side tends to support more aquatic vegetation, which also provides more habitats suitable for invertebrates. Because the study area is usually large, a wide range of littoral habitat types are typically sampled. As far as possible, similar habitats are selected at each site to facilitate comparisons between sites.
2. At each site, sweep sampling methods are used. A D-frame net with 30 cm x 20 cm opening and mesh size of 475 μm is used. Sweep samples are taken along the shore at about 20 m intervals. To obtain each sweep sample, the collector stands in the river about 1.5 m from the water’s edge and sweeps the net towards the bank, near the substrate surface. Ten sweeps make up a sample. Each sweep is done for about 1 m at right angles to the bank, in water no deeper 1.5 m and should not overlap the previous sweep. Ten sweep samples are taken per site.
3. After the sample collection, the net contents are washed to the bottom of the net by splashing the outside with water. The net is then inverted and its contents emptied into a metal sorting tray, with any material adhering to the net being washed off with clean water. Invertebrates are picked from the tray with forceps and placed in a jar of 70% ethanol. Samples with a small number of individuals are kept in 30 mL jars while large samples are kept in 150 mL jars. During the picking process, the tray is shaken from time to time to redistribute the contents, and tilted occasionally to look for animals adhering to it. Sorting proceeds by working back and forth across the tray until no more animals are found.
4. The sample jars are labelled with the site name, site location code, date, and sample replicate number. The collector’s name, the sampling site, and replicate characteristics (including substrate types sampled) are recorded in a fi eld notebook.
Laboratory methods
1. In the laboratory, the samples are identifi ed using a stereomicroscope with a 2 – 4x objective lens and a 10x eyepiece. Identifi cation is done to the lowest taxonomic level

Page 23
Materials and methods
that could be applied accurately, which is usually to the genus level. The references used for identifi cation include Sangpradub and Boonsoong (2006), Nguyen et al. (2000), Morse et al. (1994) and Merritt and Cummins (1996).
2. Specimens are divided into orders, and kept in separate jars labelled by site.
3. Richness, abundance and ATSPT scores are always reported per sample (10 sweeps or approximately 3 m2 of substrate surface).
Benthic macroinvertebrates
The objectives of the benthic macroinvertebrates study are to describe, in quantative terms, the characteristics of the macroinvertebrates in the substrata in deeper waters away from the littoral zone of the river.
Field methods
1. Five sample locations in the right, middle, and left parts of the river are selected at each site. At some sites, it is impossible to take samples from the middle of the river because of the presence of hard bed material (which the grab sampler cannot penetrate) or fast currents. Also, the middle portion of those sites where the river is narrower than 30 m cannot be sampled.
2. Prior to sampling, all the equipment to be used is thoroughly cleaned to remove any material left from the previous sampling site. At each sampling location, four sub-samples are taken with a Petersen grab sampler and composited into a single sample which covers a total area of 0.1 m2. Grab contents are discarded if the grab does not close properly because material such as wood, bamboo, large water-plants, or stones jammed the grab’s jaws. In these cases the sample is retaken.
3. Each sample is washed through a sieve (0.3 mm mesh) with care taken to ensure that any macroinvertebrates do not escape over the sides of the sieve.
4. The contents of the sieve are then placed on a white sorting tray and the materials (including the benthic macroinvertebrates) are dispersed in water. All the animals in the tray are picked out with forceps and pipettes, placed in jars, and fi xed with 10% formaldehyde at a fi nal concentration of 5%. Samples taken by less experienced sorters are checked by an experienced sorter.
5. The sample jar is labelled with the site name, location code, date, position within the river, and sample replicate number. The sampling location conditions, collector’s name and sorter’s name are recorded on a fi eld sheet. Sometimes, samples can not be sorted at

Report on the 2008 biomonitoring survey of the lower Mekong River and selected tributaries
Page 24
a site because the boat is too unsteady, a very large number of animals are collected, there is insuffi cient time, or because the presence of lumps of clay cause continual clouding of the samples. In these cases, the entire sample is preserved and sorted in the laboratory.
Laboratory methods
1. All individuals collected are identifi ed and counted using a compound microscope (with magnifi cations of 40 – 1200x) or a dissecting microscope (16 – 56x). Oligochaeta, Gastropoda, Bivalvia, and Crustacea are generally identifi ed to species level. Insects are usually identifi ed only to genus level. The references used for identifi cation include Sangpradub and Boonsoong (2006), Nguyen et al. (2000), Morse et al. (1994), Merritt and Cummins (1996), Fernando and Cheng(1963), and Lehmkuhl (1979).
2. Richness, abundance and ATSPT scores are always reported per sample (0.1 m2).
2.3 Calculation of biometric indicators
The biometric indicators calculated for all sites are: abundance (the number of individual organisms collected per sample or unit area or volume), average richness (the mean number of taxa counted in a sample), and the Average Tolerance Score per Taxon (ATSPT) for each site. ATSPT is an indicator of the presence of environmental stressors such as water pollution. Species that are sensitive to stress, and tend to be absent at stressed sites, have low tolerance scores. Stress-tolerant species, which are hardy and survive at stressed sites, have high tolerance scores. Consequently, the average score is higher at sites with environmental stress.
Calculation of abundance
Abundance is a measurement of the number of individual plants or animals belonging to a particular biological indicator group counted in a sample. Low abundance is sometimes a sign that the ecosystem has been harmed. Abundance can be measured as the number of individuals per unit area, volume or sample.
Calculation of average richness
Average richness refers to the mean number of taxa (types) of plants or animals belonging to a particular indicator group (e.g. diatoms, zooplankton) counted in a sample.
Page 25
Materials and methods
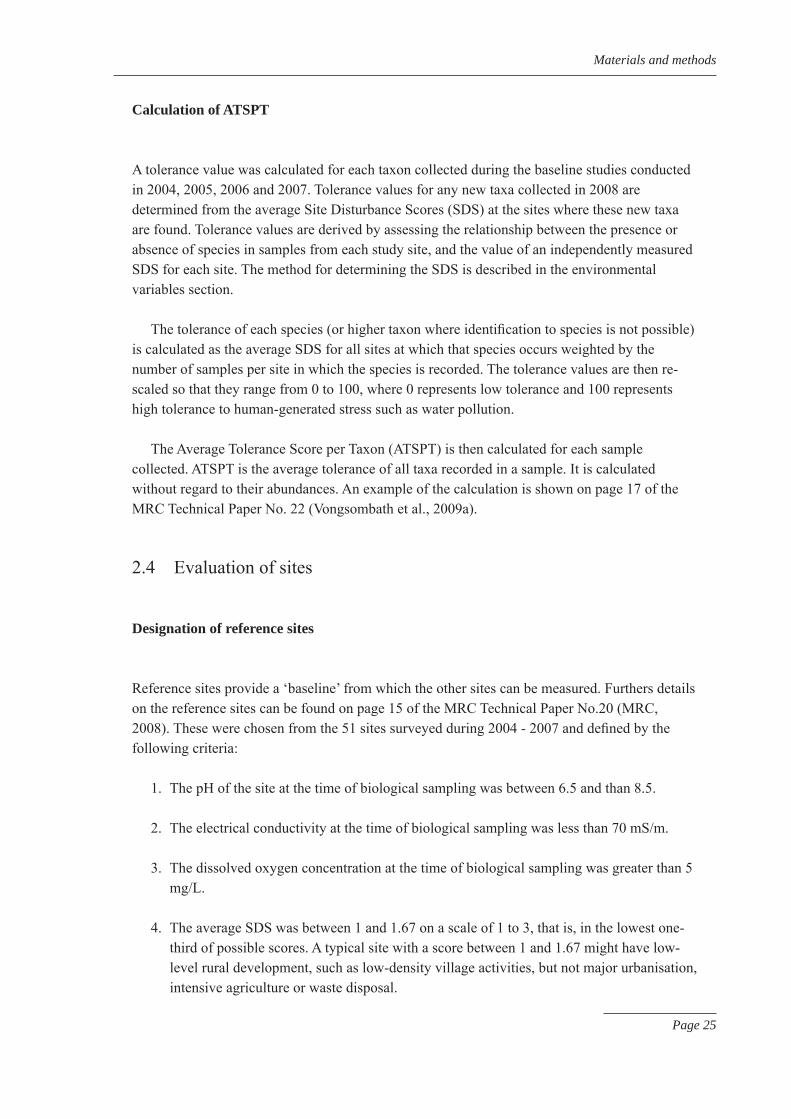
Calculation of ATSPT
A tolerance value was calculated for each taxon collected during the baseline studies conducted in 2004, 2005, 2006 and 2007. Tolerance values for any new taxa collected in 2008 are determined from the average Site Disturbance Scores (SDS) at the sites where these new taxa are found. Tolerance values are derived by assessing the relationship between the presence or absence of species in samples from each study site, and the value of an independently measured SDS for each site. The method for determining the SDS is described in the environmental variables section.
The tolerance of each species (or higher taxon where identifi cation to species is not possible) is calculated as the average SDS for all sites at which that species occurs weighted by the number of samples per site in which the species is recorded. The tolerance values are then re-scaled so that they range from 0 to 100, where 0 represents low tolerance and 100 represents high tolerance to human-generated stress such as water pollution.
The Average Tolerance Score per Taxon (ATSPT) is then calculated for each sample collected. ATSPT is the average tolerance of all taxa recorded in a sample. It is calculated without regard to their abundances. An example of the calculation is shown on page 17 of the MRC Technical Paper No. 22 (Vongsombath et al., 2009a).
2.4 Evaluation of sites
Designation of reference sites
Reference sites provide a ‘baseline’ from which the other sites can be measured. Furthers details on the reference sites can be found on page 15 of the MRC Technical Paper No.20 (MRC, 2008). These were chosen from the 51 sites surveyed during 2004 - 2007 and defi ned by the following criteria:
1. The pH of the site at the time of biological sampling was between 6.5 and than 8.5.
2. The electrical conductivity at the time of biological sampling was less than 70 mS/m.
3. The dissolved oxygen concentration at the time of biological sampling was greater than 5 mg/L.
4. The average SDS was between 1 and 1.67 on a scale of 1 to 3, that is, in the lowest one-third of possible scores. A typical site with a score between 1 and 1.67 might have low-level rural development, such as low-density village activities, but not major urbanisation, intensive agriculture or waste disposal.

Report on the 2008 biomonitoring survey of the lower Mekong River and selected tributaries
Page 26
5. There was no major dam or city within 20 km upstream of the site, and fl ow at the site was not affected by inter-basin water transfers. Downstream development was also considered where a site had upstream fl ow because of tidal infl uences.
Using biological indicators to evaluate sites
Until recently, physical and chemical information were often the only basis for monitoring the environmental quality of rivers and lakes. Today, with the widespread implementation of biological monitoring programmes, physical and chemical data are complemented with biological information.
Three types of indicators of the health of the Mekong aquatic ecosystem are calculated for each of the four groups of organisms (benthic diatoms, zooplankton, littoral macroinvertebrates and benthic macroinvertebrates) included in the biomonitoring programme. The indicators are abundance, average richness, and ATSPT (the Average Tolerance Score per Taxon) for each of the four groups. A healthy ecosystem is indicated by high abundance, high average richness, or a low ATSPT (signifying the presence of pollution-sensitive species).
Each indicator is calculated for individual samples of each group of organisms collected during the site examination. The collection of multiple samples per site enables the assessment of the within-site variability of the indicators. It also allows for statistical testing of the signifi cance of differences within and between the same sites over multiple years.
Guidelines for site-average values of each indicator are set according to the range of site-average values obtained at the reference sites. For indicators where low values indicate harm to the ecosystem (abundance and average richness) the guideline was set at the 10th percentile of reference site values (the value that is lower than 90% of all reference values). For the indicator where a high value indicates harm to the ecosystem (tolerance) the guideline was set at the 90th percentile of reference site values (the value that is higher than 90% of all reference values). These percentiles are commonly used in biomonitoring programmes in other parts of the world. Interim guidelines are listed in Table 2.3.

Page 27
Materials and methods
Table 2.3 Guidelines for biological indicators of ecosystem health based on 2004 - 2007 baseline studies
Biological metrics Biological indicator groups Reference site values Guideline of healthy ecosystem10th percentile 90th percentile
Abundance (mean number of individual organisms per sample).
Diatoms 136.22 376.34 Greater than 136.22Zooplankton 22.33 174.07 Greater than 22.33Littoral macroinvertebrates 46.68 328.56 Greater than 46.68Benthic macroinvertebrates 5.37 56.34 Greater than 5.37
Average richness (mean number of taxa per sample).
Diatoms 6.54 11.78 Greater than 6.54Zooplankton 9.80 20.20 Greater than 9.80Littoral macroinvertebrates 5.37 18.48 Greater than 5.37Benthic macroinvertebrates 1.87 7.88 Greater than 1.87
Average tolerance Score per Taxon (ATSPT).
Diatoms 30.85 38.38 Less than 38.38Zooplankton 34.83 41.80 Less than 41.80Littoral macroinvertebrates 27.80 33.58 Less than 33.58Benthic macroinvertebrates 31.57 37.74 Less than 37.74
Four biological groups: benthic diatoms, zooplankton, littoral macroinvertebrates and benthic macroinvertebrates were selected for the studies. Three biological metrics namely abundance, average richness and the Average Tolerance Score per Taxon (ATSPT) were measured for each of the biological groups. Thus a total of twelve biological indicators were used to evaluate sites. The sites were classifi ed as one of four groupings:
• Class A (Excellent): 10 - 12 of the 12 indicators meet the guidelines. The biodiversity and ecological capacity to support fi sh and other freshwater functions are similar to those at the reference sites defi ned in the 2004 – 2007 surveys. These reference sites provide a ‘baseline’ against which other sites can be measured.
• Classes B (Good) 7 - 9 of the 12 indicators meet the guidelines. The biodiversity and ecological capacity are slightly less than that at the reference sites. Human activities may have caused some disturbance.
• Classes C (Moderate) 4 - 6 of the 12 indicators meet the guidelines. The biodiversity and ecological capacity are markedly less than that at the reference sites. Disturbance resulting from human activities is present.
• Class D (Poor) 0 - 3 of the 12 indicators meet the guidelines. The biodiversity and ecological capacity are signifi cantly less than that at the reference sites. Various disturbances from human activities are likely to be present.
In 2008, poor sample preservation resulted in the loss of zooplankton data from Cambodia, so the rating criteria for the assessment of the Cambodian sites were: Class A where 7 – 9 of the nine indicators met the guidelines; Class Class B where 5 – 6 of the nine indicators met the guidelines; Class C where 3 – 4 of the nine indicators met the guidelines; and Class D where 0 – 2 of the nine indicators met the guidelines.

Report on the 2008 biomonitoring survey of the lower Mekong River and selected tributaries
Page 28

Page 29
3. Results and discussion
3.1 Environmental variables
Cambodia
There was a broad range of the averages of the environmental variables across the eight study sites examined in Cambodia (Table 3.1). Altitude varied from 3 to 134 m above sea level. River width varied from 130 to 1,310 m. The site with largest river width is CKT on the Mekong mainstream, at Kampi Village, Sam Bok Commune, Kratie District, Kratie and the narrowest is CSK where the Sangke River enters the Tonle Sap Great Lake, Battabang Province.
Water temperature ranged from 22.3°C in one high-altitude site, CSP - Sre Pok River, to 30.7°C in lower-altitude sites such as CKT, with an average of 28.8°C. As expected, temperatures tended to be lower at the higher altitudes, although there was considerable variation.
Concentrations of dissolved oxygen were generally high, ranging from 4.9 to 8.14 mg/L with an average of 6.79 mg/L. A low DO concentration was found at CSK on the mouth of the Sangke River, which fl ows through many residential areas before fl owing into the Tonle Sap Great Lake. At most sites, the water was slightly alkaline, with pH varying between 6.79 and 8.29, with an average of 7.45. EC was generally low, varying from 3.57 to 120.93 mS/m with an average of 24.32 mS/m. Water transparency (Secchi depth) was also variable, and ranged from 0.39 to 1.54 m with an average of 1.09 m.
The site disturbance score in Cambodia ranged from 1.1 to 2.0. The highest human disturbance score was assigned to CSK, where the lowest DO concentration and Secchi depth were also found.
Lao PDR
There was a broad range of values of the environmental variables across the eight widely dispersed study sites in Lao PDR (Table 4.1). For example, altitude varied from 72 m above sea level at LKL to 410 m at LMX. Channel width varied from being as narrow as 80 m at LBF to as wide as 1,240 m at LDN. Water transparency (Secchi depth) ranged from 0.19 m at LPB and 0.2 m at LMX to 1.4 m at LDN. The average water transparency of all sites was 0.77 m (with a standard deviation of ±0.46 m). Turbidity was generally higher at sites in the main channel than at sites in the tributaries, and downstream sites. Turbidity was especially high at LMX where the

Report on the 2008 biomonitoring survey of the lower Mekong River and selected tributaries
Page 30
site sampled was downstream from the Chinese border, and at LPB where the site sampled was affected by upstream gravel excavation.
Water temperature varied slightly from site to site, with an average of 26.74°C (±2.45°C). The lowest value of 23.0°C was recorded at LMX, and the highest value of 29.3°C at LKL. Dissolved oxygen (DO) concentrations were generally high compared to those typically reported for tropical waters, with an average of 7.85 mg/L (±0.57 mg/L).
Water was slightly alkaline at most of the sites, with pH varying between 7.2 and 8.5 and averaging 7.76 (±0.45). Electrical conductivity varied from 7.1 to 33.0 mS/m, with an average of 24.0 mS/m (±9.3). Higher conductivity was found at sites LBH; LMX and LBF with values of 33.0; 31.0 and 30.1 mS/m, respectively.
Thailand
There was a broad range of values of the environmental variables across the widely dispersed sites examined in Thailand (Table 3.1). The water temperature varied widely from site to site, ranging from 23.0°C to 26.3°C. Lower temperatures were recorded at the upstream sites with the lowest values of 23.0°C and 24.0°C being recorded at TCS and TKO respectively. Higher temperatures were recorded at TSM, with the highest value of 26.3°C being recorded in the Mekong River at Songkram Mountain. The dissolved oxygen (DO) concentrations were generally high compared to those typically reported for tropical waters, with an average of 7.3 – 8.3 mg/L. The highest DO value of 8.3 mg/L was recorded in the Mekong River at TSM. Lower DO values were found at sites where human activities were present, such as at TMU where the value was 7.3 mg/L. The water pH was in the neutral range at most of the sites, with pH varying between 6.6 and 7.4. The highest pH value of 7.41 was recorded in the Mekong River at TSM and the lowest of 6.6 at TNK. The electrical conductivity varied from 17.1 to 28.5 mS/m, with an average of 22.2 mS/m. The highest conductivity was found at TSM and the lowest was found at TUN in the Mun River.
The values of the environmental variables at the sampling sites were mostly within the normal ranges expected for surface waters in this region. However, at some sites where the surrounding land is saline such as TSM, conductivity was slightly outside the normal range. The pH, DO, and temperature data were within the ranges defi ned for aquatic ecosystems according to the standards for surface water quality set by Thailand, Viet Nam, and Cambodia, in comparison to the Water Quality Standards of Thailand (MRC, 2005; PCD, 2004) could be classifi ed as Category 2 - 3. The DO values were on the high side, even at those sites showing evidence of human disturbance from villages, agriculture, or dam construction; all sites had DO values higher than or very close to 6 mg/L, falling within Class 2 (very clean) of Thailand’s Water Quality Standards. However, all measurements were made during the daytime, and some values may refl ect the infl uence of factors such as photosynthesis that could affect pH and DO. The pH and DO in TSM was higher than those at other sites. This area may be more suitable for the growth of autotrophic organisms such as river weed and algae.

Page 31
Results and discussions
Viet Nam
There was a broad range of values of most of the environmental variables across the eight study sites in Viet Nam. Altitude varied from 5 m above sea level at VDP to 10 m above sea level VCT. The channel width varied from being as narrow as 250 m at VKB to as wide as 2,000 m at VCL, and the depth varied from 5 m at VCT to 20 m at VTR.
Water transparency (Secchi depth) ranged from 22 cm at the right hand river bank at VCT to 85 cm at the mid-river sampling area of VTP. It also varied from site to site, with an average of 54.6 cm (±18.4 cm).
Water temperature varied slightly from site to site, from 28.3°C to 30.2°C, with an average of 29.1°C (±0.4°C). Dissolved oxygen (DO) concentrations ranged from 5.00 mg/L to 8.25 mg/L and were generally high compared to those typically reported for tropical waters, with an average of 6.6 mg/L (±0.9 mg/L). The highest DO value of 8.25 mg/L was at the site on the left of the river at VTP, and lower values were found at sites with the presence of human activities, such as the left hand river site at VVL.
At most sites, the water was slightly alkaline with pH varying between 7.14 and 8.37 and averaging 7.96 (±0.27).
Electrical conductivity varied from 13.8 mS/m to 19.0 mS/m, with an average of 17.8 mS/m (±1.65 mS/m). The highest conductivity of 19.0 mS/m was found in the mid-river area of VCL with the lowest of 13.81 mS/m. being found at VKB,
Conductivity was within the normal range and yielded much the same results as those found in the previous studies. The pH, DO, and temperature data were also within the normal ranges for aquatic ecosystems according to the standards for surface water quality set by Viet Nam. Dissolved oxygen values were high, even at those sites showing evidence of human disturbance from villages, agriculture, or dam construction. Most of the sites had DO values higher than or very close to 6 mg/L, the concentration described as being necessary for biodiversity conservation.
The highest turbidity and lowest Secchi disk depths at all of sites were comparable those found in 2006. Most probably, turbidity was caused by the sediments released from the upstream by agriculture, bridge construction, transport activities, river traffi c, oil storage, washing and bathing activities, sewage treatment, soil erosion, sand excavation, and other factors.
The environmental variables at the sampling sites were mostly within the normal ranges expected for surface waters in this region.
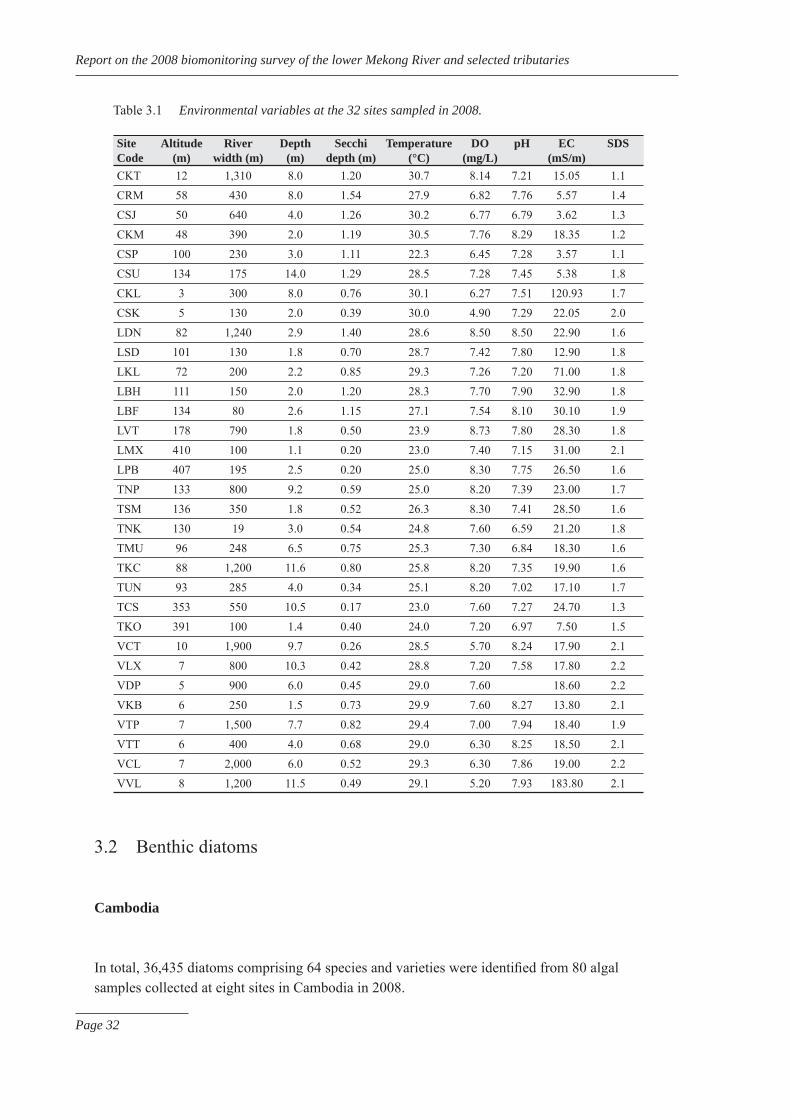
Report on the 2008 biomonitoring survey of the lower Mekong River and selected tributaries
Page 32
Table 3.1 Environmental variables at the 32 sites sampled in 2008.
Site Code
Altitude (m)
River width (m)
Depth (m)
Secchi depth (m)
Temperature (°C)
DO (mg/L)
pH EC (mS/m)
SDS
CKT 12 1,310 8.0 1.20 30.7 8.14 7.21 15.05 1.1CRM 58 430 8.0 1.54 27.9 6.82 7.76 5.57 1.4CSJ 50 640 4.0 1.26 30.2 6.77 6.79 3.62 1.3CKM 48 390 2.0 1.19 30.5 7.76 8.29 18.35 1.2CSP 100 230 3.0 1.11 22.3 6.45 7.28 3.57 1.1CSU 134 175 14.0 1.29 28.5 7.28 7.45 5.38 1.8CKL 3 300 8.0 0.76 30.1 6.27 7.51 120.93 1.7CSK 5 130 2.0 0.39 30.0 4.90 7.29 22.05 2.0LDN 82 1,240 2.9 1.40 28.6 8.50 8.50 22.90 1.6LSD 101 130 1.8 0.70 28.7 7.42 7.80 12.90 1.8LKL 72 200 2.2 0.85 29.3 7.26 7.20 71.00 1.8LBH 111 150 2.0 1.20 28.3 7.70 7.90 32.90 1.8LBF 134 80 2.6 1.15 27.1 7.54 8.10 30.10 1.9LVT 178 790 1.8 0.50 23.9 8.73 7.80 28.30 1.8LMX 410 100 1.1 0.20 23.0 7.40 7.15 31.00 2.1LPB 407 195 2.5 0.20 25.0 8.30 7.75 26.50 1.6TNP 133 800 9.2 0.59 25.0 8.20 7.39 23.00 1.7TSM 136 350 1.8 0.52 26.3 8.30 7.41 28.50 1.6TNK 130 19 3.0 0.54 24.8 7.60 6.59 21.20 1.8TMU 96 248 6.5 0.75 25.3 7.30 6.84 18.30 1.6TKC 88 1,200 11.6 0.80 25.8 8.20 7.35 19.90 1.6TUN 93 285 4.0 0.34 25.1 8.20 7.02 17.10 1.7TCS 353 550 10.5 0.17 23.0 7.60 7.27 24.70 1.3TKO 391 100 1.4 0.40 24.0 7.20 6.97 7.50 1.5VCT 10 1,900 9.7 0.26 28.5 5.70 8.24 17.90 2.1VLX 7 800 10.3 0.42 28.8 7.20 7.58 17.80 2.2VDP 5 900 6.0 0.45 29.0 7.60 18.60 2.2VKB 6 250 1.5 0.73 29.9 7.60 8.27 13.80 2.1VTP 7 1,500 7.7 0.82 29.4 7.00 7.94 18.40 1.9VTT 6 400 4.0 0.68 29.0 6.30 8.25 18.50 2.1VCL 7 2,000 6.0 0.52 29.3 6.30 7.86 19.00 2.2VVL 8 1,200 11.5 0.49 29.1 5.20 7.93 183.80 2.1
3.2 Benthic diatoms
Cambodia
In total, 36,435 diatoms comprising 64 species and varieties were identifi ed from 80 algal samples collected at eight sites in Cambodia in 2008.

Page 33
Results and discussions
Abundance
The average number of diatoms ranged from 64 - 916 cells, with an average of 320 individuals per sample (0.2 cm2). The greatest abundance was found at the Se San River site (CSJ) and the lowest the Bassac River site (CKL) where the water surface was completely covered by water hyacinths (Table 3.2).
Average richness
Average richness per site ranged from 3 - 10 taxa. The highest average richness of 10 and 9 taxa occurred at CKM and CSJ in the Se Kong and Se San Rivers respectively. The CKL site was covered by water hyacinths. This may explain the low abundance and average richness of this site.
ATSPT
The average ATSPT per site ranged from 33 - 41, with the highest value found at CSK and the lowest at both CMR and CSJ (Table 3.2). The ATSPT values in the 2008 survey were quite similar to those values found in previous years, except at CKL, where the ATSPT dropped from 44 in the 2006 survey to 34 in the 2008 survey.
Lao PDR
From a total of 18,025 diatoms collected in Lao PDR, 71 species were identifi ed from 80 samples collected at the eight sites in 2008.
Abundance
The average number of diatoms per sample ranged from 25 - 568 cells (Table 3.2). A comparison of the previous years’ samples with those of 2008 showed a high variability through the years. For example, in 2007 the abundance of 1,338 cells found at LVT decreased 3.6 fold to 373 cells found in the 2008 sample. There was also a decrease at LSD, where the abundance decreased by a factor of 2 from 108 cells found in 2007 to 58 individuals found in the 2008 sample. This decrease in abundance may have been the result of a lack of suitable substrata and/or diffi culties in sample collections at LVT and, LSD.

Report on the 2008 biomonitoring survey of the lower Mekong River and selected tributaries
Page 34
Average richness
The total number of taxa per site ranged from 2 - 23 taxa. Average richness per sample ranged from 2 - 6 species (Table 3.2). The lowest average richness was found at both LSD and LBF, and highest at LVT. The average richness per site in 2008 samples showed a decrease of 2 - 8 taxa per site from the previous years. LMX suffered the greatest decrease with the loss of 8 taxa; LSD and LPB both decreased by 7 taxa; LSD and LBF decreased by 6 and 5 taxa respectively. Other sites decreased by 2 - 3 taxa.
ATSPT
The Average Tolerance Score per Taxon (ATSPT) of diatom samples taken in 2008 ranged from 35 - 44, with the highest value being found at LMX and the lowest at LDN (Table 3.2). ATSPT values within sites and through the years showed little change, showing consistently low values of between 35 and 44.
Thailand
The eight sites sampled in Thailand in 2008 yielded a total of 72 taxa of benthic diatoms out of the 20,502 individuals in the samples. Twenty two previously uncollected taxa were found. The most common taxa were in the order Naviculales (26 taxa) and order Cymbellales (15 taxa). Cymbella turgidula, Gomphonema lagenula, and Synedra ulna were present in the greatest abundance and had the widest distribution being found at all the sites sampled. In 2008, the total richness per site in Thailand ranged from 15 - 38 taxa.
Abundance
The average density of diatoms ranged from 45 - 366 cells (Table 3.2). The greatest abundance was found at the Mekong River site of TCS while the lowest was found at the Mun River site (TUN) where substratum of mud and sand was unsuitable and the turbidity was the highest.
Average richness
The highest average richness of 12 taxa was found at both TCS and TKC, while 11 taxa were found at TSM. The lowest richness was found at those Mekong River sites with sandy and muddy substrata, such as the sites of TNP (6 taxa) and TUN (7 taxa).

Page 35
Results and discussions
ATSPT
The Average Tolerance Score per Taxon (ATSPT) of benthic diatom samples taken in 2008 showed little variation, and ranged from 36 - 39 (Table 3.2). The highest value was found at TMU and the lowest at both TCS and TSM. The ATSPT values for sites in the 2008 study are only slightly different to those found in the previous investigations.
Viet Nam
In 2008, a total of 80 samples of algae containing 252,936 individuals were collected from the eight sampling sites. These samples yielded a total of 125 taxa of benthic diatoms. Nitzschia fi liformisi, Cymbella affi nis, and Navicula sp. were the most widely distributed with each occurring at all the sites.
Abundance
The average density of diatoms ranged from 213 - 14,940 cells per sample. The greatest abundance occurred at VVL, while the lowest was found at VLX.
Average richness
The average richness per site ranged from 11 - 16 taxa (Table 3.2). The highest average richness occurred at VTT, while the lowest was found in those lower Mekong River sites that had sandy and muddy substrata, such as VCT.
ATSPT
ATSPT ranged from 49 - 52, with the highest at VVL where the greatest abundance of 14,925 individuals/sample was also found. In comparison to other countries in the region, the ATSPT of benthic diatoms is the highest in Viet Nam. The average ATSPT in Viet Nam was 49, while those in Cambodia, Lao PDR and Thailand were 33, 35, and 36, respectively.

Report on the 2008 biomonitoring survey of the lower Mekong River and selected tributaries
Page 36
Table 3.2 Abundance, average richness and ATSPT of benthic diatom recorded at sites sampled during 2004-2008
Site code
Abundance Average richness ATSPT
2004 2005 2006 2007 2008 2004 2005 2006 2007 2008 2004 2005 2006 2007 2008
CKT 318 134 307 12 8 6 34 39 36CMR 206 217 58 439 6 10 7 6 33 36 37 33CSJ 214 314 655 916 7 11 6 9 33 36 34 33CKM 191 250 71 820 9 11 7 10 33 37 34 34CSP 144 232 308 532 219 8 10 9 8 6 36 30 36 35 36CSU 269 140 287 412 9 6 5 8 36 39 38 37CKL 311 64 8 3 44 34CSK 107 469 5 5 44 41LDN 266 213 9 3 34 35LSD 108 58 8 2 38 40LKL 219 63 305 7 7 5 35 40 38LBH 257 197 8 6 36 39LBF 46 75 6 2 36 36LVT 563 1,338 373 13 8 6 41 39 40LMX 133 82 10 3 39 45LPB 388 305 568 11 12 5 37 38 41TNP 219 6 38TSM 128 252 5 11 39 36TNK 101 300 7 8 48 39TMU 346 272 9 6 40 39TKC 279 12 38TUN 45 7 37TCS 366 12 37TKO 372 229 318 21 10 8 41 40 37VCT 72 362 5 11 48 50VLX 317 213 6 12 51 50VDP 4,936 14 50VKB 510 12 51VTP 1,384 13 49VTT 2,362 16 51VCL 180 603 6 13 49 51VVL 14,925 15 52

Page 37
Results and discussions
3.3 Zooplankton
Lao PDR
The eight sites in Lao PDR recorded a total of 9,080 individual specimens of zooplankton and larvae. These comprised 101 taxa within 28 families. The fi ve main zooplankton groups were: Crustacea, Eurotatorea, Lobosea, Fiosea, Phytomastigophora and larvae. The most prolifi c were Eurotatorea of which there were 59 taxa in 15 families, while Filosea and the larvae were of only one family. The larval forms were present in the highest numbers.
Abundance
In 2008, abundance varied widely across the eight sites, with an average of 17 - 1,707 individuals per 10L sample (Table 3.3). The highest average abundance was found at LDN, while the lowest averages of 17 and 19 individuals/sample were found at LVT and LBH respectively. The dominant taxa were Copepoda sp (larval stages) and Ceratium spp. These characteristically occur in sites where the river is wide and deep with slow water currents. However in four sites, the average abundance in 2008 was 2 – 28 times less than that found in 2007. The decrease was even greater in comparison to that found in 2005, with 28, 10, 6 and 2 fold decreases found in LBH, LVT, LSD and LMX respectively. These may have been caused by stronger currents and shallower water than in earlier years. At the four other sites, abundance increased 2 – 10 fold. For example, in 2008 the greatest number of individuals/sample (219) were found at LKL while 2007 and 2005 only 17 and 22 individuals/sample had been found. At LDN, LPB, and LMX the numbers also increased 7, 7 and 2 fold respectively. These were increases in only a few common taxa and Copepoda larvae, which are widely distributed.
Average richness
The total number of taxa per site ranged from 11 - 61 taxa, with the lowest number found at LMX and the highest at LDN. The average richness per site ranged from 6 - 40 taxa. The lowest average richness was at LBH, and the highest at LDN. (Table 4.3). The taxa of the Copepod group and the Peridiniidae family predominated and were widely distributed.
In almost all of the 2008 sites, there was a decreasing trend in the average richness in comparison to samples taken in previous years. For example, at six sites richness per site decreased by 2 – 10 taxa. At LSD, LBH and LMX richness reduced by 10, 10 and 8 taxa, respectively, and at LPB, LVT and LKL by 4, 3 and 2 taxa respectively. In 2008, only the two sites of LDN and LBF showed any increase in average richness. These decreases in average richness probably resulted from the same causes as those given for the decreases in abundance.

Report on the 2008 biomonitoring survey of the lower Mekong River and selected tributaries
Page 38
ATSPT
The ATSPT for zooplankton ranged from 29 - 42 (Table 3.3). The lowest occurred at LMX. All the other seven sites showed a narrow range varying from 38 - 42.
Thailand
The eight sites sampled in 2008 yielded a total of 3,191 individual specimens of 24 taxa of zooplankton. Eighteen of which belonged to the order of Ploima and four to the order of Cladocera. In 2008, 12 taxa were found for the fi rst time. Overall Keratella cochlearis and Polyarthra vulgaris were present in the greatest number and were the most widely distributed, occurring at all the sites sampled.
Abundance
In 2008, the average abundance of zooplankton ranged from 15 - 328 individuals at the sites examined. The greatest abundance occurred at TSM, while the lowest was found in the Mekong River at the Chiang San site (TCS). The abundances in the 2008 samples were lower than those found in previous samples at TMU and TKC.
Average richness
In 2008, average richness per site ranged from 3 - 11 taxa (Table 3.3). The highest average richness of 11 and 8 taxa occurred at TMU and TSM respectively, while the lowest of 3 taxa were found both in the north in the tributary at TKO and in the Mekong River at TCS. The average zooplankton richness was signifi cantly lower than that found in the previous studies.
ATSPT
The Average Tolerance Score per Taxon (ATSPT) of zooplankton samples taken in 2008 ranged from 38 - 40 (Table 3.3). There was little variation in ATSPT values between the sites. This was similar to the previous years’ ATSPT values in Thailand which had also shown little variation ranging from 40 - 43. In 2008, there was a decrease in ATSPT from the 2005 levels in some sites such as TKO and TNK.

Page 39
Results and discussions
Viet Nam
A total of 3,904 individual specimens of zooplankton was recorded at the eight sites in Viet Nam. These comprised 32 taxa belonging to 16 families and 5 larval stages. There were four main zooplankton groups: Protozoa, Eurotatorea, Crustaceae (which included Cladocera, Copepoda and Ostracoda) and larval stages. The predominant group with 15 taxa in 10 families was that of Crustaceae accounting for 46.9% of the total zooplankton collected. The second biggest group, accounting for 19.4% of the zooplankton, was Eurotatorea of which there were 12 taxa. The smallest group was that of Protozoa where there was only 1 taxa. This group accounted for 3.1% of the total zooplankton.
Abundance
The average abundance of zooplankton ranged from 7 - 1,115 individuals/sample (Table 3.3). The greatest abundance occurred at VKB. The dominant group was the Crustaceae (Bosminidae, Daphniidae, Moinidae, Cyclopidae and Larvae). The lowest abundance was found at VVL where the dominant groups were Eurotatorea and larvae, while Crustaceae were represented by only a few individuals.
Average richness
In 2008, the total richness per site ranged from 8 - 19 taxa while the average richness ranged from 5 - 13 taxa (Table 3.3). The highest average richness occurred at VKB. Two taxa, Trichocerca longiseta (Eurotatorea, Trichocercidae), and Heterocypris anomala (Crustaceae, Cyprididae), were present only at VKB. The lowest average richness of 5 taxa was found in all four of the sites of VDP, VTT, VCL, and VVL.
ATSPT
The ATSPT for zooplankton ranged from 47 - 54 (with an average of 50). The sites of VCT and VVL, which have experienced greater impacts had high values of 52 and 54 respectively, while those at VTT and VTP, which have experienced smaller impacts showed the lower value of 47.

Report on the 2008 biomonitoring survey of the lower Mekong River and selected tributaries
Page 40
Table 3.3 Abundance, average richness and ATSPT of zooplankton recorded at sites sampled during 2004 - 2008
Site code
Abundance Average richness ATSPT
2004 2005 2006 2007 2008 2004 2005 2006 2007 2008 2004 2005 2006 2007 2008
CKT 36 27 15 12 44 37 CMR 39 24 35 11 9 12 38 39 38 CSJ 119 62 52 14 20 17 37 38 38 CKM 78 21 35 14 11 14 39 37 39 CSP 22 86 70 62 12 13 12 15 41 36 37 42 CSU 14 176 113 11 32 28 37 40 39 CKL 844 22 48 CSK 1,431 34 46 LDN 194 1,707 21 40 40 41LSD 1,408 278 26 16 44 40LKL 22 17 219 14 10 8 35 39 40LBH 473 19 16 6 41 42LBF 222 508 17 20 39 41LVT 24 160 17 9 10 7 37 40 41LMX 76 47 15 7 40 29LPB 182 26 231 10 13 9 36 42 38TNP 60 7 40TSM 2,586 328 19 8 43 40TNK 473 200 25 6 43 40TMU 1,327 77 40 11 43 39TKC 115 7 39TUN 300 7 40TCS 15 3 40TKO 53 145 27 14 29 3 40 42 38VCT 55 47 11 7 46 52VLX 148 39 16 9 45 51VDP 32 5 47VKB 1,115 13 50VTP 16 6 49VTT 35 5 47VCL 127 11 15 5 46 49VVL 7 5 54

Page 41
Results and discussions
3.4 Littoral macroinvertebrates
Cambodia
In 2008, a total of 6,484 individual specimens of littoral macroinvertebrates were collected at the eight sites Cambodia. These specimens comrised 34 taxa.
Abundance
The average abundance per site ranged from 17 - 587 individuals/sample, with the greatest occurring at CMR on the Mekong River, and the lowest at CKL, on the Bassac River at Koh Khel village. With the exception of CKM and CKL where the average abundances were respectively reduced from 136 to 22 and from 163 to 17 individuals, average abundances at all the other sites were higher than those previously recorded.
Average richness
In 2008, the average richness per site ranged from 3 - 6 taxa (Table 3.4) with the greatest numbers of 6 taxa occurring at both CKT and CSJ, while the lowest of 3 taxa being found at both CSP and CKL. However, the average richness values of most of the sites were lower than those of the previous years.
ATSPT
In Cambodia, the ATSPT for littoral macroinvertebrates showed a wide variation from 13 - 38, with an average of 28. The lowest ATSPT was found at CSP and the highest at CKL. At the other sites of CKT, CMR, CSJ, and CSK, the ATSPT ranged from 27 to 31.
Lao PDR
The 13,111 individual specimens collected from the eight sites in Lao PDR contained 92 taxa of littoral macroinvertebrates. In terms of biodiversity, the highest number of taxa were in the insect orders of Ephemeroptera and Trichoptera, and the Molluscs, with 32, 21 and 20 taxa, respectively. Richness in the orders of Hemiptera, Coleoptera, and Diptera was moderate ranging from 13 - 15 taxa. All of these orders were widely distributed with, for

Report on the 2008 biomonitoring survey of the lower Mekong River and selected tributaries
Page 42
example, Heterocloeon sp. (Baetidae, Ephemeroptera) found at all sites, while Micronecta sp. (Hemiptera) and Chironomus sp. (Diptera) were found at seven sites, and taxa of Decapoda and Corbicula sp. (Bivalvia) being found at most sites. Eighty taxa occurred at only a few sites. Some of these widespread groups are characteristic of taxa that typically occur in nutrient-rich conditions.
Abundance
The average number of individuals per site was highly variable, ranging from 55 individuals at LKL to 7,948 at LBF, with an average abundance ranging from 11- 795 individuals/sample (Table 3.4). The greatest abundances occurred at sites with large macroalgae and submerged vegetation, such as LBF. The lowest abundance was at LKL. The high abundance groups were in the orders of Mesogastropoda, Hemiptera, and Ephemeroptera. There were 4,407 individuals of Hubendickia sp, 2,236 individuals of Karelainia sp (Mesogastropoda), and 2,786 of Micronecta sp (Hemiptera). However, the average abundance in fi ve of the eight sites showed a 1 – 4 fold decrease in abundance in comparison to the 2007 samples. For example, there was a 3 - 4 fold decrease in the average abundance at LKL, and at a 4 fold decrease LVT in comparison to the 2007 and 2005 values. These decreases probably resulted from the same causes as those discussed below in terms of the average richness. At some sites (LDN, LSD and LBF) abundance increased. This resulted from increases in only a few groups such as snails and water bugs, probably because in both these groups there are a large number of species which are widely distributed, and are taxa with a moderate to high tolerance to water pollution.
Average richness
The number of taxa collected per site ranged from 11 - 47. The average richness per site ranged from 5 to 15 taxa (Table 3.4). The highest richness occurred at LBF and the lowest at both LKL and LMX.
In general, high values of richness were found at sites with cobbles, gravel, submerged vegetation, and low to moderate human levels of impact. Such sites are the six sites of LVT, LBF, LBH, LSD, LDN and LKL that are in the middle and south of Lao PDR and where the conditions are good in terms of the diversity of taxa. However, in the 2008 samples, the average richness of these sites decreased by 1 – 8 taxa when compared to the 2007 results. This was especially true for LKL, which lost eight taxa. (In 2007, there were 13 taxa but only 5 taxa in 2008.) This site was a 2005 reference site, and rated a B score in the 2007 survey, but in 2008 the average richness was poor. The change may have been caused by bank erosion during the rainy season and by other human activities. At this site, many areas were found to have changed. In particular, there were changes in the direction of the water-fl ows, and in the accumulation of sand and clay. These changes could have affected many types of organisms previously found in this area.

Page 43
Results and discussions
In the northern sites, such as LPB, the average richness increased from 5 taxa in 2004 and 2005 to 8 taxa in 2008. The environmental conditions appeared to be stable at this site, although on a nearby island there was some sand and gravel excavtion, this appeared to have only small effects on the site.
ATSPT
The ATSPT for littoral macroinvertebrates ranged from 26 - 34 (Table 3.4). The lowest was found at LDN since this site had probably experienced little human impact (the SDS was 1.6), and the conditions provided habitats suitable for littoral macroinvertebrates. Such conditions were the presence of large amounts of fl oating macroalgae and other aquatic plants. The highest value of 34 was at LMX. In general, in 2008 the range in the ATSPT values at the sites was narrow with values for all of the sites indicating very low levels of pollution tolerance (<35). However, the trend in the ATSPT values has been that of an annual increase, perhaps indicating a change in the environmental health of the water resources.
Thailand
The eight sites sampled in 2008 in Thailand yielded a total of 3,266 specimens of littoral macroinvertebrates belonging to 52 taxa. Ten of these were in the orders of Odonata and Ephemeroptera while 33 were taxa not found in the previous 2004 - 2007 studies. The dominant littoral macroinvertebrates were Macrobrachium sp in the order of Decapoda where 704 specimens were found. Oligochaeta, Baetis sp. and Micronecta sp. were common and found at all the sites sampled.
Abundance
In 2008 , the average abundance ranged from 8 - 107 individuals per site. The highest abundance occurred at TUN, while the lowest abundance was found in the Mekong River at TNP, the Nakornpanom site where the substratum is unsuitable for invertebrates.
Average richness
In 2008, the average richness per site ranged from 5 - 13 taxa (Table 3.4). The highest richness occurred at TKO, while the lowest was found at TCS. Some sites had richness values lower than those found in the previous studies, while, in contrast, richness values increased at other sites, such as TKO, where 13 taxa were found compared to only 5 found in 2004 and 7 in 2005.

Report on the 2008 biomonitoring survey of the lower Mekong River and selected tributaries
Page 44
ATSPT
The ATSPT of littoral macroinvertebrate samples taken in 2008 ranged from 29 - 34 (Table 3.4), with the highest values found at both TNP and TKN and the lowest of 29 at both TCS and TKO.
Viet Nam
In 2008, a total 9,714 specimens of littoral macrovertebrates belonging to125 taxa were collected at the eight sites (Table 3.4). Mesogastropoda, Decapoda, Oligochaeta, and Veneroida were the predominant orders with 24, 14, 13 and 12 taxa, respectively being found. Diptera, Hemiptera, Decapoda, Mesogastropoda, Oligochaeta, Mytinoida, and Veneroida had the widest distribution, being found at all sites. In contrast, taxa of some small groups (Coleoptera, Ephemeroptera, Hirudinea, and Tricoptera) were found at only two sites. A number of the widespread groups comprised some taxa that typically occur in nutrient-rich conditions. All of the eight sites examined in 2008 had more than 6 taxa and had high abundance values.
Abundance
The average abundance was highly variable, ranging from 7 taxa found in VTP to 546 in VTT. Both the numbers of taxa and the highest abundances occurred at sites with a range of sediment types, alluvium, debris, substrata, macroalgae, and aquatic vegetation, while the lowest abundances occurred at sites such as VTP and VDP with sand, alluvium, and muddy substrates (Table 4.4). In the sites with the highest abundance, such as VTT, VVL, and VCT, taxa of Hemiptera, Mesogastropoda, Diptera, and Veneroida were dominant. These common taxa occurred on sediment substrata, alluvium, debris, macroalgae and aquatic vegetation, and in the water column.
Average richness
The average number of taxa collected per site ranged from 3 - 14, with the highest average richness at sites (such as VLX with 14 taxa, VCL with 13, VVl with 12 and VCT with 11). Mudfl ats, organic matter, wood, alluvium, dead trees, sand, thin mud, and sediments were present at this sites. In contrast, the lowest richness was at sites (such as VTP with 3 taxa and VTT with 5) with sediment, alluvium, organic fertilizer, and sand (Table 4.4). Taxa of Hemiptera, Mesogastropoda, Diptera and Venenoida were abundant at the richest sites, occurring among sediment, alluvium, debris, sand, dead fi sh, rubbish, plastic bags, pesticide bottles and abundant aquatic plant growth.

Page 45
Results and discussions
ATSPT
The ATSPT of littoral macroinvertebrates of sweep samples taken in 2008 ranged from 50.2 to 58.1, with the highest value found at VLX and the lowest at VKB (Table 3.4). The average ATSPT value in Viet Nam was higher in 2008 than it had been in the 2006 survey, with an increase from 43 to 54 in 2006 and 2008, respectively.
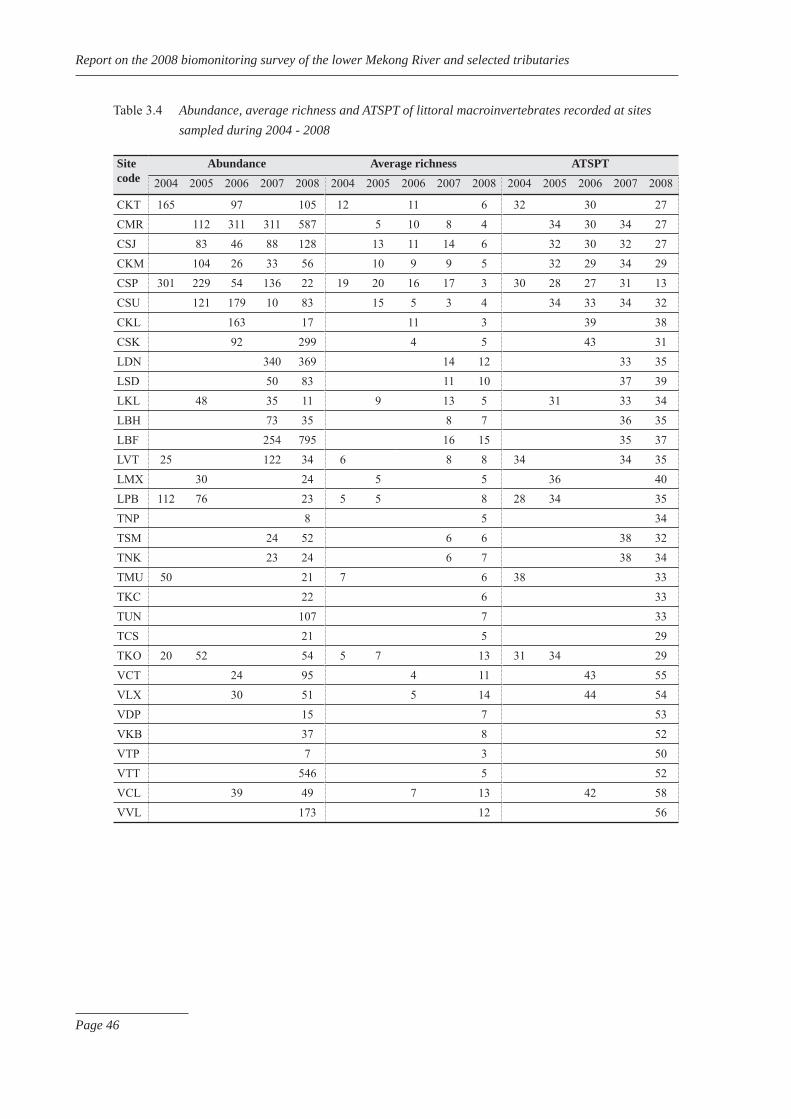
Report on the 2008 biomonitoring survey of the lower Mekong River and selected tributaries
Page 46
Table 3.4 Abundance, average richness and ATSPT of littoral macroinvertebrates recorded at sites sampled during 2004 - 2008
Site code
Abundance Average richness ATSPT
2004 2005 2006 2007 2008 2004 2005 2006 2007 2008 2004 2005 2006 2007 2008
CKT 165 97 105 12 11 6 32 30 27CMR 112 311 311 587 5 10 8 4 34 30 34 27CSJ 83 46 88 128 13 11 14 6 32 30 32 27CKM 104 26 33 56 10 9 9 5 32 29 34 29CSP 301 229 54 136 22 19 20 16 17 3 30 28 27 31 13CSU 121 179 10 83 15 5 3 4 34 33 34 32CKL 163 17 11 3 39 38CSK 92 299 4 5 43 31LDN 340 369 14 12 33 35LSD 50 83 11 10 37 39LKL 48 35 11 9 13 5 31 33 34LBH 73 35 8 7 36 35LBF 254 795 16 15 35 37LVT 25 122 34 6 8 8 34 34 35LMX 30 24 5 5 36 40LPB 112 76 23 5 5 8 28 34 35TNP 8 5 34TSM 24 52 6 6 38 32TNK 23 24 6 7 38 34TMU 50 21 7 6 38 33TKC 22 6 33TUN 107 7 33TCS 21 5 29TKO 20 52 54 5 7 13 31 34 29VCT 24 95 4 11 43 55VLX 30 51 5 14 44 54VDP 15 7 53VKB 37 8 52VTP 7 3 50VTT 546 5 52VCL 39 49 7 13 42 58VVL 173 12 56

Page 47
Results and discussions
3.5 Benthic macroinvertebrates
Cambodia
In 2008, a total of 928 individual specimens belonging to 43 taxa of benthic macroinvertebrates were collected from the eight sites. The total number of taxa per site varied from 8 - 18. The highest value was found at CKT and the lowest at both CSP and CSU. The average richness ranged from 2 to 4 taxa.
Abundance
The average abundance of benthic macroinvertebrates ranged from 4 - 20 individuals/sample (Table 3.5). The highest abundance was found in the Sangke River at CSK. The river fl ows through residential areas before entering the Tonle Sap Great Lake. The lowest abundance was found in the Se San River at CSJ where the substratum is composed of bedrock and cobbles, clay and mud, sand, debris, and bamboo leaves.
Average richness
In 2008, the average richness per sample ranged from 2 - 4 taxa. The highest average richness occurred at CSK, while the lowest richness values of 2 taxa were found at CSJ, CKM, and CSP in tributaries of the Mekong River.
ATSPT
The ATSPT ranged from 23 - 39. The highest value was at CKL and the lowest at CSP. The ATSPT values in this year’s study were lower compared to those of previous studies. The average ATSPT in the 2008 sites was 30 while that of the sites during the 2004 - 2007 survey was 37.
Lao PDR
In 2008, a total of 1,985 individual specimens of benthic macroinvertebrates belonging to 61 taxa were collected from the eight sites. In terms of diversity, the most diverse were snails of which there were 15 taxa, next came 12 taxa of mayfl ies. The insect orders of Diptera and

Report on the 2008 biomonitoring survey of the lower Mekong River and selected tributaries
Page 48
Oligochaeta were widely distributed, with individuals of the family Chironomidae being found at all sites, and individuals of the orders of Ephemeroptera, Mesogastropoda, Odonata, Trichoptera and Veneroida being found at most sites. Other groups occurred at only a few sites.
Abundance
The number of individuals per site was highly variable, ranging from 34 individuals at LKL to 747 at LDN. The average density at a site was also highly variable, ranging from 2 - 50 individuals/sample (a square metre). The highest abundances occurred at sites with mud, clay mixed with sand, submerged plants and debris, such as at LDN (with 50 individuals/sample), while the lowest density occurred at sites with sandy and rocky substrata, such as at LKL with 2 individuals/sample (Table 3.5). The high abundance was the result of the presence of Chironomus sp (Diptera) and Oligochaeta. However, there was little change in average abundance between the 2008 samples and the 2007 and 2005 samples. At four sites (LDN, LSD, LKL and LBF) abundance decreased, at two sites (LVT and LP) there were no changes and at another two sites (LBH and LMX) abundance increased. Decreasing abundance may have been caused by changes in substrate types or increased diffi culties in taking samples, for example those caused by the large amounts of sand present at LKL and LSD, and the rocky substrate at LDN.
Average richness
Taxon richness varied widely at the eight sites sampled in 2008. Richness ranged from 8 - 26 taxa, with an average richness from 1 to 7 taxa per sample (Table 3.5). The highest richness occurred at sites such as LDN with soft substrata of mud and debris, and some submerged plants, while the lowest richness occurred at sites such as LMX with sandy and rocky substrata. In the sites with the highest richness Hubendickia sp (snails) and Chironomus sp (Diptera) were dominant. These are common taxa occurring in mixed substrata containing mud, debris, and submerged plants. In general, there was little change in taxa richness in the sites sampled in 2004 – 2008; taxa richness decreased by 1 - 2 taxa in only three sites, in three sites there was no change, and in two sites richness increased by 1 - 2 taxa.
ATSPT
The ATSPT) of the benthic macroinvertebrate samples taken in 2008 showed narrow variation, similar to that of littoral macroinvertebrates, and ranged from 36 - 40 taxa (Table 3.5). The highest values were found at LMX, LBF, LKL and LSD, and the lowest at LDN. No sites ranked in the high or very high stress level. There was little or no change from year to year, except at LKL where ATSPT increased from 35 in 2005, to 37 in 2007, and to 40 in 2008, and

Page 49
Results and discussions
for both LMX and LPB where there was an increase from 33 and 36 in 2005, to 36 and 40 in 2008, respectively.
Thailand
The eight sites sampled in 2008 yielded a total of 3,790 individual specimens of 50 species of benthic macroinvertebrates. Twelve of these were in the order of Diptera and eight in the order of Ephemeroptera. The remaining 36 taxa had not been found in the previous studies of 2004 - 2007. The dominant taxa were Cryptochironomus sp. with 962 individuals present. The most commonly distributed species were Oligochaeta and Bezzia sp which were found at all the sites.
Abundance
The average abundance of benthic macroinvertebrates ranged from 7 - 79 individuals at the 2008 sites (Table 3.5). The greatest abundances of 79 and 68 individuals were found TNP and TKO respectively. These sites had hard and suitable substrata, composed of cobbles and gravel. The lowest abundances was found at sites such as TMU (7 indivduals) on tributaries of the Mekong River with muddy substrata. Benthic macroinvertebrates were more widely distributed than the previous studies had shown. This was especially true in TKO, a site on a tributary of Kok River, in the main channel site of TSM in the mouth of the Songkram River, and in the Nakornpanom site (TNP).
Average richness
In the 2008 survey, the average richness per sample ranged from 1 - 3 taxa (Table 3.5) with the highest average richness occurring at both TKC and TKO, and the lowest at the lower Mekong River sites with sandy and muddy substrata, such as the sites of TMU and TCS.
ATSPT
In 2008, the ATSPT) of benthic macroinvertebrate samples had a very narrow range, from 26 - 36 (Table 3.5). The highest value was found in TUN and the lowest at TCS. The ATSPT values were lower than those of the previous studies. In general, the ATSPTs in the Thai sites were between 30 and 45.

Report on the 2008 biomonitoring survey of the lower Mekong River and selected tributaries
Page 50
Viet Nam
In 2008, 13,805 individual specimens of 108 taxa of benthic macroinvertebrates were collected in the eight sites. The predominant taxa, in terms of both density and abundance, were those of the Mollusca phylum, and were found in all the sites. The two lowest richness values were found for the taxa of Arthropoda (including cruscateans) with only one taxon found at each site and the taxa of Annelida-Polychaeta with 3 taxa at each site.
The Oligochaeta was the richest group and were present at each of the sites. They were also the most widely distributed. Taxa of the Tubifi cidae family were also abundant. Molluscs were also widely distributed, occurring at all sites. The insect species collected at each site were high in richness and widely distributed. Diptera species were especially diverse, with species in the Chironomidae family having highest richness and occurrence. Cricotopus sp. and Chironomus sp. were found in many sites. Many widespread species, in particular those of the oligochaetes, and of the Tubificidae, are characteristic of nutrient-rich conditions, .
There was a large diversity of Mollusca (snails and mussels) in the lower Mekong River. Mollusca were also abundant and widely distributed. Twenty fi ve species of gastropoda were identifi ed. Species of the families Thiaridae, Stenothyridae, and Viviparidae had the highest richness values.
Abundance
The density of benthic macroinvertebrate at each site was high, with total counts ranging from 18 - 301 individuals/sample (Table 3.5). The densities in the sites VCL (301 individuals/sample), VCT (115 individuals/sample), VKB (145 individuals/ sample) and VDP (108 individuals/sample) were the highest. At these sites, the substrata are clay, sand, alluvium, mudfl ats, and dead trees. In contrast, the sites with low abundance such as VTP (18 individuals/sample), VTT (47 individuals/sample), VVL (60 individuals/sample), and VLX (74 individuals/sample) had substrata of sand, sediment, clay, alluvium, organic fertilizer, dead fi sh, rubbish, plastic bags, soil, and mud. In the four sites of VCL, VCT, VKB and VDP with high abundances, the dominant groups were Naididae (Oligochaeta), Stenothyridae, Thiaridae, Viviparidae (Mollusca, Gastropoda); Corbiculidae, Amblemidae (Mollusca, Bivalvia), Palaemonidae (Decapoda), Chironomidae (Diptera) and Corophiidae (Amphipoda). The widespread species were present in the sites with substrata of sand, soil, and roots of vegetable and other organic plant matter. The benthic macroinvertebrates were not evenly distributed with abundances differing between the banks and the middle of the river, and even the different banks of the same river. This was the result of construction and building activities, agriculture, deposits of alluvia, and other factors. In the middle areas of the river, where the river bottom is affected by ship and boat traffi c and sand excavation, or there are variations in the river depth, differences in the abundance of benthic macroinvertebrates can result.
Page 51
Results and discussions
The density of benthic macroinvertebrates across the river varied because of differences in deposits of alluvia and the river depth. The banks usually have a higher density of benthic macroinvertebrates than do sampling sites in the middle of the river. Moreover, there is a greater diversity of benthic macroinvertebrate and a greater abundance of aquatic insect taxa at river banks than in the middle of the river. In contrast, the abundance of the bivalve classes and gastropoda in the middle of the river is higher than at river banks.
The composition of benthic macroinvertebrates often differed along the banks as a result of erosion or landslides. If a river bank bottom was sand, soil, and clay then the taxa of mollusca and aquatic insects were abundant. In contrast, if the bank had accumulated alluvia and debris then taxa of the phylum Annelida and larvae of Diptera predominated.
Average Richness
In 2008. the average richness varied widely from 5 - 11 taxa per sample at the eight sites. The highest average richness of 11 taxa occurred at both VLX and VDP, and of 10 taxa at VCL. The lowest richness values were at VTP (5 taxa), VCT (7 taxa), and VKP (8 taxa). In VLX, VDP, and VCL, the sites with the highest richness, taxa in the families of Tubificidae (Oligochaeta), Stenothyiidae and Hydrobiidae (Mollusca, Gastropoda), Corbiculidae and Amblemidae (Mollusca, Bivalvia), and Gomphidae (Insecta, Odonata) and Chironomidae (Insecta, Diptera) were dominant. These common taxa occurred in mixed substrata containing mud, soil, tree roots, and aquatic vegetation.
ATSPT
In 2008, the ATSPT of benthic macroinvertebrates in each site was high, ranging from 50 - 56. At the VLX, VDP, VCL, and VVL sites, the ATSPT indices were the highest at 56, while VTP was the lowest at 50 (Table 3.5). In sites, with substrata of sand, soil, organic matter, and aquatic plants, the ATSPT was higher than at sites with bottoms of clay, stones, and dead trees.

Report on the 2008 biomonitoring survey of the lower Mekong River and selected tributaries
Page 52
Table 3.5 Abundance, average richness and ATSPT of benthic macroinvertebrates recorded at sites sampled during 2004 - 2008
Site code
Abundance Average richness ATSPT
2004 2005 2006 2007 2008 2004 2005 2006 2007 2008 2004 2005 2006 2007 2008
CKT 7 8 11 2 2 3 35 31 31CMR 20 24 11 10 4 3 3 3 37 43 37 26CSJ 3 3 5 4 2 2 3 2 37 33 36 27CKM 4 3 4 6 2 2 3 2 35 36 37 26CSP 8 25 6 7 6 3 6 3 3 2 35 38 31 33 23CSU 23 8 5 7 5 3 3 3 36 39 37 34CKL 17 11 5 3 52 39CSK 11 20 3 4 47 34LDN 51 50 8 7 36 37LSD 13 11 5 4 40 40LKL 25 4 2 6 2 2 35 37 40LBH 7 20 3 5 38 38LBF 38 26 6 6 38 40LVT 1 6 7 1 3 3 31 39 40LMX 4 10 2 1 35 41LPB 25 6 6 7 2 2 32 33 36TNP 79 2 33TSM 9 59 3 2 37 32TNK 3 12 2 2 42 35TMU 8 7 3 1 46 32TKC 51 3 31TUN 12 2 36TCS 14 1 26TKO 31 12 68 6 4 3 36 34 29VCT 8 115 3 7 63 55VLX 24 74 5 11 57 56VDP 108 11 56VKB 145 8 55VTP 18 5 50VTT 47 9 54VCL 9 301 3 10 53 56VVL 60 9 56

Page 53
Results and discussions
3.6 Evaluation of sites
The eight sites in each of the Member Countries were assessed following the guideline proposed in the 2004 - 2007 studies. Sites sampled were classifi ed and grouped according to how many of the 12 indicators met the guidelines. Since, there were no Zooplankton data available from Cambodia, nine indicators were used as the criteria for the assessment of the Cambodian sites.
The total of 32 sites were assessed and classifi ed into the four class groupings. Twenty four of the sites were in good or excellent ecological health, with only one site in a poor condition. In order to illustrate their status and trends over time, the 2008 results are summarised in Table 3.6 and Table 3.7 together with the previous years’ results. A temporal change of ecological health indicators over the period of 2004 - 2008 was found in many locations with some showing improvement, and others degradation. The temporal trend of ecological health of the Mekong River sounds a warning of environmental impacts such as those from human disturbance and from degradation of habitats and water quality in some parts of the river. Further investigations into the causes and effects on biological components are needed to identify the necessary remedial and restorative actions.
Cambodia
In Cambodia, most site classifi cations were stable and some even showed a slight improvement. Four sites were assessed as Class A (excellent ecological health), three sites as Class B (good), and one site as Class C (moderate). No sites were identifi ed as being in a poor condition.
Lao PDR
In the Lao PDR, one site was assessed as Class D, three as Class C, and three as Class B. Only one site was assessed as Class A. The LKL site, a 2005 reference site, was assessed as Class C in the 2007 and 2008 surveys. This decrease may have been caused by bank erosions during the rainy season and other human activities which had taken place after 2005. At this site, there had been many changes, especially in terms of water fl ows, and the amounts of accumulated sand and clay. These factors could have affected many organisms living in the area.
The LMX site was assessed in 2005 as Class C and in 2008 as Class D. This decrease in ranking may be because almost all the biometric indicators were lower, most probably resulting from water level fl uctuations, increased disturbance, and large decreases in water quantity compared to those of 2005.

Report on the 2008 biomonitoring survey of the lower Mekong River and selected tributaries
Page 54
Thailand
In 2008, four sites were assessed as Class A, three as Class B and only one as Class C. This revealed that human activities had had only a light to moderate impact. The Site Disturbance Scores for the eight sites were also low. Although no reference sites were examined in 2008 the 2008 survey results showed slight differences in all the sites. The sites of TKO and TSM were assessed as Class A in 2008 but TKO had been assessed as Class B in 2004, and TSM as Class C in 2007. Impacts at these sites have been decreasing as a result of the more limited use of tourist boats at the TKO site, and the bank protection provided by the Thai Government at the TSM site.
Viet Nam
The site assessment in Viet Nam shows a slight improvement at some sites. As in the 2006 survey, several sites in the rivers of the Mekong Delta were assessed as Class C and showed signs of ecosystem stress. Two sites (VCT and VLX) improved from Class C in 2006 to class B in the 2008 survey.

Page 55
Results and discussions
Table 3.6 Assessment of all sites following the suggested guidelines.
Site code
Benthic diatom Zooplankton Littoral macroinvertebrate Benthic macroinvertebrate Number meeting
guidelines
Class
Abun-dance
Average richness
ATSPT Abun-dance
Average richness
ATSPT Abun-dance
Average richness
ATSPT Abun-dance
Average richness
ATSPT
CKT Y N Y Y Y Y Y Y Y 8 ACMR Y N Y Y N Y Y Y Y 7 BCSJ Y Y Y Y Y Y N Y Y 8 ACKM Y Y Y Y N Y Y Y Y 8 ACSP Y N Y N N Y Y Y Y 6 BCSU Y Y Y Y N Y Y Y Y 8 ACKL N N Y N N N Y Y N 3 CCSK Y N N Y N Y Y Y Y 6 BLDN Y N Y Y Y Y Y Y N Y Y Y 10 ALSD N N N Y Y Y Y Y N Y Y N 7 BLKL Y N Y Y N Y N N N N Y N 5 CLBH Y N N N N N N Y N Y Y N 4 CLBF N N Y Y Y Y Y Y N Y Y N 8 BLVT Y N N N N Y N Y N Y Y N 5 CLMX N N N Y N Y N N N Y N N 3 DLPB Y N N Y N Y N Y N Y Y Y 7 BTNP Y N Y Y N Y N N N Y N Y 6 CTSM Y Y Y Y N Y Y Y Y Y Y Y 11 ATNK Y Y N Y N Y N Y N Y Y Y 8 BTMU Y N N Y Y Y N Y Y Y Y Y 9 BTKC Y Y Y Y N Y N Y Y Y Y Y 10 ATUN N Y Y Y N Y Y Y Y Y Y Y 10 ATCS Y Y Y N N Y N N Y Y Y Y 8 BTKO Y Y Y Y N Y Y Y Y Y Y Y 11 AVCT Y Y N Y N N Y Y N Y Y N 7 BVLX Y Y N Y N N Y Y N Y Y N 7 BVDP Y Y N Y N N N Y N Y Y N 6 CVKB Y Y N Y Y N N Y N Y Y N 7 BVTP Y Y N N N N N N N Y Y N 4 CVTT Y Y N Y N N Y N N Y Y N 6 CVCL Y Y N N N N Y Y N Y Y N 6 CVVL Y Y N N N N Y Y N Y Y N 6 C
Y = meets guidelines; N = does not meet guidelines

Report on the 2008 biomonitoring survey of the lower Mekong River and selected tributaries
Page 56
Table 3.7 Site assessment during 2004-2008
Site code and Location Site assessment by year2004 2005 2006 2007 2008
CambodiaCKT Mekong river, Kampi A A ACMR Mekong river, Stung Treng Ramsar site B A B BCSJ Se San river, Sesan A B A ACKM Se Kong river, Ramsar site A B B ACSP Se Kong river, Pum Pi A A A A BCSU Se San river, Lum Phat A B B ACKL Bassac river, Koh khel B CCSK Stoeng Sangke river, Prek Toal C BLao PDRLDN Mekong river, Done Nguei A ALSD Se Done river, Ban Hae B BLKL Se Kong river, Ban Xou A C CLBH Se Bang Hieng river, under bridge A CLBF Se Bang Fai river, under bridge B BLVT Mekong river, Ban Huayhome C B CLMX Mekong river, Ban Xiengkok C DLPB Mekong river, Done Chor A A BThailandTNP Mekong river, Nakorn Panom CTSM Connection between Songkram & Mekong Rivers C ATNK Nam Kam river, Mukdaharn C BTMU Nam Mun river, Ubonrachathani B BTKC Connection between Nam Mun & Mekong Rivers ATUN Nam Mun river, Ubonrachathani ATCS Mekong river, Chiang San, Chiang Rai BTKO Kok River, Chiang Rai B A AViet NamVCT Bassac river, Phu An, Can Tho C BVLX Bassac river, Long Xuyen, An Giang C BVDP Bassac river, Da Phuoc, An Giang CVKB Bassac river, Khanh Binh, An Giang BVTP Mekong river, Thuong Phuoc, Dong Thap CVTT Mekong river, Thuong Thoi, Dong Thap CVCL Mekong river, Cao Lanh, Dong Thap C CVVL Mekong river, My Thuan, Vinh Long C

Page 57
Results and discussions
Figure 3.1 Rating of sites in the Lower Mekong Basin surveyed in 2008.
0 100 200 km
VVLVCL
VTT
VTPVKB
VDP
VLX
VCT
TKO
TCS
TUNTKC
TMU
TNK
TSM
TNP
LPB
LMX
LVT
LBF
LBH
LKL
LSD
LDN
CSK
CKL
CSU
CSPCKM
CSJCRM
CKT
Gulf of Thailand
Gulf of Tonkin
Thailand
Viet Nam
Cambodia
Lao PDR
Viet Nam
LOWER MEKONG BASIN
Class A: Excellent
Class B: Good
Class C: Moderate
Class D: Poor
Map shows 32 sites surveyed and their aquatic ecological health classification in 2008

Report on the 2008 biomonitoring survey of the lower Mekong River and selected tributaries
Page 58

Page 59
4. Conclusions
This report covers the ecological health monitoring activities that were transferred to the Member Countries in 2008. During the 2008 biomonitoring survey, eight sampling locations were examined in each country. Some of these were new sites where samples had not been collected during the 2004 – 2007 surveys. Four of these were in Thailand and fi ve in Viet Nam.
The total of the 32 sites assessed were classifi ed into four class groupings. Of the 2008 sites, nine were in Class A (excellent ecological health), 12 in Class B (good), 10 in Class C (moderate) and one in Class D (poor). Lower scores may have resulted from increased human activities, and reductions in both habitats and water quality.
In order to illustrate their status and trends, the 2008 results are summarised and compared to the previous years’ results. Stability of site classifi cations in more than half of the sites and the improvement in some sites particularly in those in the Mekong Delta are positive signs for the health of the Mekong River. Some locations indicate improvement while others show degradation.
On-site observation suggests that the decline seen at some sites has probably been caused by bank erosion during the rainy season. Other sites have changed since 2005 in terms of water fl ows, water levels and amounts of sand and clay accumulation. These factors could have affected the organisms living in the area and caused the recorded changes.
The trends of degradations in isolated locations give a warning of increasing environmental impacts caused by human activities, and degradation of habitats in some parts of the Mekong River. Further investigations into the causes and effects on biological components are needed to identify the necessary remedial actions and possible restoration efforts.

Report on the 2008 biomonitoring survey of the lower Mekong River and selected tributaries
Page 60

Page 61
References
Dang, N.T, Thai, T.B. and V.M. Pham (1980) Classifi cation of freshwater invertebrate zoology in North Viet Nam. Science and Technology Publisher.
Eiji, T. (1993) An illustrated guide to fresh water zooplankton. Togai University .
Fernando C. H. and L. Cheng (1963) Guide to Genera of Malayan Water Bugs. Department of Zoology, University of Singapore.
Foged, N. (1971) Freshwater diatoms in Thailand. Odense, Lehre.
Foged, N. (1975) Some littoral diatoms from the coast of Tanzania. Odense, Lehre.
Foged, N. (1976) Freshwater diatoms in Sri Lanka (Ceylon) Odense, Lehre.
Krammer, K. and H. Lange-Bertalot (1986) Bacillariophyceae. Teil 1. Institute for Sporeplanter.
Krammer, K. and H. Lange-Bertalot (1988) Bacillariophyceae. Teil 2. Institute for Sporeplanter.
Krammer, K. and H. Lange-Bertalot (1991a) Bacillariophyceae. Teil 3. Institute for Sporeplanter.
Krammer, K. and H. Lange-Bertalot (1991b) Bacillariophyceae. Teil 4. Institute for Sporeplanter.
Lehmkuhl, D.M. (1979) How to know the aquatic insects. W.C. Brown, Dubuque, Iowa. 168 p.
Merritt, R.W. and K. W. Cummins (1996) An introduction to the aquatic insects of North America. 3rd edition. Kendall Hunt, Dubuque, Iowa.
MRC (2005) Integrated water quality management report No. 1. Mekong River Commission, Vientiane, Lao PDR.
Sangpradub, N. and B. Boonsoong (2006) Identifi cation of freshwater invertebrates of the Mekong River and its tributaries. Vientiane, Lao PDR.
Davidson, S.P., Kunpradid, T., Peerapornisal, Y., Nguyen, T.M.L., Pathoumthong, B., Vongsambath, C. and Pham, A.D. (2006) Biomonitoring of the lower Mekong River and selected tributaries, MRC Technical Paper No. 13. Mekong River Commission, Vientiane, Lao PDR.

Report on the 2008 biomonitoring survey of the lower Mekong River and selected tributaries
Page 62
MRC (2008) Biomonitoring of the lower Mekong River and selected tributaries 2004-2007, MRC Technical Paper No. 20. Mekong River Commission, Vientiane, Lao PDR.
Vongsombath, C., Pham, A.D., Nguyen,T.M.L., Kunpradid, T., Davison, S.P., Peerapornpisal, Y., Sok, K. and Meng, M. (2009a) Report on the 2006 biomonitoring survey of the lower Mekong River and selected tributaries, MRC Technical Paper No. 22. Mekong River Commission, Vientiane, Lao PDR.
Vongsombath, C., Pham, A.D., Nguyen,T.M.L., Kunpradid, T., Davison, S.P., Peerapornpisal, Y., Sok, K. and Meng, M. (2009b) Report on the 2007 biomonitoring survey of the lower Mekong River and selected tributaries, MRC Technical Paper No. 23. Mekong River Commission, Vientiane, Lao PDR.
Morse, J.C., Y. Liangfang and T. Lixin (1994) Aquatic Insects of China Useful for Monitoring Water Quality. Hohai University Press, Nanjing, China.
Nguyen X.Q., D.Y. Mai., C. Pinder and S. Tilling (2000) Biological surveillance of freshwaters using macroinvertebrates. A practical manual and identifi cation key for use in Viet Nam. Field Studies Council.
PCD (2004) Standard surface water quality for Thailand. Pollution Control Department, Ministry of Natural Resources and Environment, Thailand, Bangkok. http://www.pcd.go.th/info_serv/en_reg_std_water05.html#s3.
Pfi ster, V. P. (1992) Phytobenthos communities from 2 Tyrolean mountain streams. Arbeitsgemeinschaft Limnologie, Telfs, Austria.

Page 63
Appendix 1. List of participants on the sampling fi eld trips in 2008
No. Name Position Professional speciality
Participants on the sampling fi eld trip in Cambodia, 19 – 28 March 20081 Dr. Prum Somany Team leader Inland Fisheries Research and Development Institute (IFReDI)2 Mr. Em Samy Member IFReDI3 Dr. Chea Tharith Member IFReDI4 Mr. Thach Phanara Member IFReDI5 Mr. Touch Bunthang Member IFReDI6 Ms. Kim Sopheap Member IFReDI7 Mr. Chea Vanara Member Ministry of Water Resource and Meteorology (MoWRAM)8 Mr. Mon Samoun Member MoWRAM9 Mr. Phin Rady Member Ministry of Environment (MOE)10 Mr. Chek Roth Member MOEParticipants on the sampling fi eld trip in Lao PDR, 10 – 23 March 20081 Mr. Chanda Vongsombath Team leader Macroinvertebrate specialist2 Ms. Nian Sivong Say Member Zooplankton specialist3 Ms. Chanthima Ponthalith Member Diatom specialist4 Mr. Phoangsavat Member Lecturer at Suphanuvong University5 Mr. Xoxiong Member Lecturer at Suphanuvong University6 Mr. Orlavanh Member Lecturer at Champasak University7 Ms. Odeth Member Lecturer at Champasak University8 Mr. Vila Member Water quality specialistParticipants on the sampling fi eld trip in Thailand, 05 – 12 March 20081 Dr. Tartporn Kunpradid Team leader Benthic diatom specialist2 Dr. Narumon Jangpradub Member Macroinvertebrate specialist3 Ms. Kusuma Nuengchaknin Member Water quality specialist4 Ms. Kesiree Kidsukum Member Water quality specialist5 Ms. Jeeraporn Pekkoh Member Blue green algae specialist6 Ms. Nopparut Sithiwong Member Algae specialist7 Ms. Rungnapa Tagun Member Macroinvertebrate specialist8 Dr. Nisarat Tungpairojwong Member Macroinvertebrate specialist9 Ms. Prapatsorn Dabseepai Member Zooplankton specialist10 Mr. Pragut Udonphimai Member Macroinvertebrate specialist11 Dr. Pornsilp Pholpanthin Member Zooplankton specialistParticipants on the sampling fi eld trip in Viet Nam, 16 – 26 March 20081 Ms. Do Thi Bich Loc Team leader Benthic diatom specialist2 Mr. Ngo Xuan Quang Member Benthic macroinvertebrate specialist3 Mr. Duong Duc Hieu Member Benthic macroinvertebrate specialist4 Mr. Phan Doan Dang Member Zooplankton specialist5 Mr. Nguyen Xuan Dong Member Zooplankton specialist6 Mr. Le Cong Nhat Phuong Member Water quality specialist7 Mr. Tran Quang Vinh Member Water quality specialist8 Mr. Nguyen Van Sinh Member Littoral macroinvertebrate specialist9 Mr. Thai Ngoc Tri Member Littoral macroinvertebrate specialist10 Mr. Pham Thanh Luu Member Benthic diatom specialist

Report on the 2008 biomonitoring survey of the lower Mekong River and selected tributaries
Page 64

Page 65
Appendix
Appendix 2. Detail site descriptions for 2008 Ecological Health Monitoring
Sam
plin
g ev
ent
Site
C
ode
Riv
erLo
catio
nD
ate
Sam
pled
Coo
rdin
ates
Land
Use
Cov
erSu
bstra
tum
Pote
ntia
l hu
man
im
pact
sU
TMU
TM (N
)U
TM (E
)Le
ft ba
nkR
ight
ban
kLi
ttora
lC
hann
el
78C
KT
Mek
ong
Kam
pi19
/3/0
848
P13
9350
261
0914
Few
hou
ses;
tour
ist
area
; mod
erat
e sl
ope;
som
e er
osio
n
Stee
p, e
rode
d ba
nk; s
ome
trees
on
face
; man
y on
to
p; fe
w h
ouse
s
Sand
; som
e st
ones
R: S
and;
rock
; litt
le d
ebris
Tour
ism
ac
tiviti
es
at d
olph
in
tour
ist s
ite
M: S
and;
rock
; alg
ae
L: S
and;
rock
; alg
ae
79C
RM
Mek
ong
at R
amsa
r si
te23
/3/0
848
P15
0409
861
8663
Fore
st, f
ew h
ouse
sFo
rest
, few
ho
uses
Sand
; peb
bles
; co
bble
s;
bedr
ock;
fi l
amen
tous
alg
ae
R: S
and;
rock
; litt
le d
ebris
Dis
posa
l of
hum
an a
nd
anim
al w
aste
sM
: San
d; li
ttle
debr
is
L: S
and;
deb
ris
80C
SJSe
San
dow
nstre
am
of S
repo
k R
iver
ju
nctio
n
20/3
/08
48P
1498
832
6217
44Fo
rest
; wat
er
buffa
loFo
rest
; wat
er
buffa
lo
Sand
; peb
bles
; co
bble
s; b
ushe
sR
: San
d; ro
ckIn
sign
ifi ca
nt
impa
ct fr
om
hum
an
activ
ities
M: R
ock;
cob
bles
; san
d
L: S
and;
rock
; litt
le d
ebris
81C
KM
Se K
ong
Low
er S
e K
ong
Riv
er21
/3/0
848
P15
3906
960
6331
Fore
st; f
ew h
ouse
s;
erod
ed b
anks
Fore
st; f
ew
hous
es; e
rode
d ba
nks
Sand
-roc
ks, m
ud
and
little
deb
ris.
R: S
and;
littl
e de
bris
Dis
posa
l of
ani
mal
w
aste
s, na
viga
tion
M: R
ock
L: S
and;
mud
; deb
ris
82C
SPSr
e Po
kLu
mph
at23
/3/0
848
P15
2567
476
5124
Fore
st, s
mal
l sca
le
agric
ultu
re; f
erry
cr
ossi
ng
Fore
st; s
mal
l sc
ale
agric
ultu
re;
ferr
y cr
ossi
ng
Bed
rock
and
co
bble
s, w
ith
man
y sm
all
chan
nels
R: C
lay
and
mud
, bam
boo
leav
esD
ispo
sal o
f hu
man
was
tes
M: S
and
L: M
ud w
ith fe
w le
aves
83C
SUSe
San
Phum
Pi (
Se
San
Riv
er a
t bo
rder
)
24/3
/08
48P
1490
553
7177
94 F
ores
t, ba
mbo
o bu
shes
; cas
hew
nut
be
hind
ripa
rian
Fore
st a
nd
bam
boo
bush
es;
frui
t tre
es b
ehin
d rip
aria
n
Bou
lder
s on
bedr
ock
R: S
and;
deb
risN
avig
atio
n
M: R
ock;
sand
L: S
and;
mud
; deb
ris
84
CK
LB
assa
cB
assa
c R
iver
at
Koh
Khe
l
29/3
/08
48P
1245
255
5037
86V
illag
es a
nd
gard
ens;
ban
ana
trees
Vill
ages
and
ga
rden
s
Sand
; mud
; w
ater
hya
cint
hR
: San
d; m
udD
ispo
sal o
f hu
man
and
an
imal
was
tes
M: S
and;
a fe
w g
ranu
les
L: M
ud; fi
ne
sand
; deb
ris
85C
SKSt
oeng
Sa
ngke
Stoe
ng
Sang
ke
Riv
er (P
rek
Toal
)
28/3
/08
48P
1461
902
3574
73O
pen
fore
st; fi
sh
pens
; fl o
atin
g hu
t; fl o
atin
g vi
llage
do
wns
tream
Ope
n fo
rest
; fi s
h pe
ns
Silt;
fl oo
ded
bush
esR
: Mud
; deb
risD
ispo
sal o
f hu
man
was
te;
fi shi
ng;
navi
gatio
n
M: M
ud; l
ittle
deb
ris
L: M
ud; d
ebris

Report on the 2008 biomonitoring survey of the lower Mekong River and selected tributaries
Page 66
Sam
plin
g ev
ent
Site
C
ode
Riv
erLo
catio
nD
ate
Sam
pled
Coo
rdin
ates
Land
Use
Cov
erSu
bstra
tum
Pote
ntia
l hum
an
impa
cts
UTM
UTM
(N)
UTM
(E)
Left
bank
Rig
ht b
ank
Litto
ral
Cha
nnel
86LD
NM
ekon
g D
one
Ngu
ei10
/3/0
848
P16
5751
759
6193
Mai
ze a
nd to
bacc
o ga
rden
s, ba
nk e
rosi
onvi
llage
s and
ve
geta
ble
gard
ens
Sand
; mud
fi la
men
tous
al
gae;
kha
i tre
e (H
omon
oia
ripar
ia)
R: C
lay;
Mud
; san
dFi
shin
g an
d na
viga
tion
M: S
and;
littl
e m
ud
L: S
and;
littl
e m
ud
87LS
DSe
Don
eB
an H
ae11
/3/0
848
P16
7175
658
7623
Vill
ages
and
gar
dens
; ba
nana
tree
sM
aize
, Veg
etab
le
gard
ens
Bed
rock
; mud
; san
d;
fi lam
ento
us a
lgae
R: S
and;
mud
Agr
icul
tura
l run
off;
disp
osal
of h
uman
, pu
mpi
ng, a
nd
anim
al w
aste
s
M: S
and;
deb
ris
L: M
ud; c
lay,
fi ne
sand
88LK
LSe
Kon
gB
an X
ou
toua
t13
/3/0
848
P16
2347
867
0696
Gar
dens
; ban
ana
trees
; ba
mbo
o; b
ank
eros
ion
Vill
ages
and
ga
rden
s; b
ank
eros
ion
Cob
bles
; peb
bles
; gr
avel
; Kha
i tre
e (H
omon
oia
ripar
ia).
Wat
er c
hann
el
Cha
nged
from
last
yea
r
R: S
and;
mud
Dis
posa
l of h
uman
; fi s
hing
; nav
igat
ion
and
anim
al w
aste
sM
: San
d; a
few
gra
nule
s
L: F
ine
sand
; litt
le d
ebris
89LB
HSe
Ban
g H
ieng
un
der t
he
brid
ge15
/3/0
848
Q18
8792
049
8434
Hou
ses;
som
e tre
es o
n ba
nk; w
ashi
ng p
lace
Vill
ages
; w
ashi
ng p
lace
; bo
at p
arki
ng;
vege
tatio
n ga
rden
s do
wns
tream
Bou
lder
s on
bedr
ock;
sa
nd; m
ud; fi
lam
ento
us
alga
e
R: C
lay;
mud
; san
dH
uman
was
tes;
ru
bbis
h di
spos
al;
and
anim
al w
aste
sM
: Mud
; san
d;L:
San
d an
d lit
tle d
ebris
; litt
le
mud
90LB
FSe
Ban
g Fa
i un
der t
he
brid
ge16
/3/0
848
Q19
5995
845
4745
Hou
ses;
wat
er
pum
ping
; som
e tre
es o
n ba
nk; w
ashi
ng p
lace
Hou
ses;
offi
ce;
fl oat
ing
pum
p;
was
hing
pla
ce;
vege
tatio
n ga
rden
s do
wns
tream
Littl
e bo
ulde
rs
on b
edro
ck; s
and;
fi l
amen
tous
alg
ae o
n be
d ro
ck
R: M
ud a
nd sa
ndW
aste
and
rubb
ish;
di
spos
al o
f hum
an
and
anim
al w
aste
s;
bank
ero
sion
do
wns
tream
M: s
and
L: M
ud
91LV
TM
ekon
gB
an
Hua
yhom
e18
/3/0
848
Q19
8873
123
9871
Lao
Vill
ages
; por
t and
ve
geta
ble
gard
ens;
Thai
Vill
ages
; po
rt an
d ve
geta
ble
gard
ens
Cob
bles
, gra
vel,
sand
; de
bris
, gra
ss o
n th
e ba
nk
L: u
pper
- cla
y; li
ttle
debr
isA
gric
ultu
ral r
un o
ff;
hum
an w
aste
s and
ru
bbis
h di
spos
al;
fi sh
farm
ing
and
navi
gatio
n
L: m
iddl
e; li
ttle
debr
is; l
ittle
mud
L: lo
wer
; litt
le d
ebris
and
sand
92LM
XM
ekon
gB
an
Xie
ngko
k20
/3/0
847
Q23
1177
867
0860
Lao
Vill
ages
; por
t and
; w
ashi
ng p
lace
Bur
mes
e ve
geta
ble
gard
ens,
bam
boo
and
cattl
e
Cob
bles
; gra
vel;
fi lam
ento
us a
lgae
; cla
y an
d gr
ass o
n th
e ba
nk
L: u
pper
sand
; litt
le d
ebris
Fluc
tuat
ion
from
bi
g bo
at; d
amag
e to
ba
nks;
ban
k er
osio
n;
disp
osal
of h
uman
an
d an
imal
was
tes;
liv
esto
ck
L: m
iddl
e; li
ttle
sand
and
mud
L: lo
wer
; litt
le d
ebris
and
sand
93LP
B M
ekon
g D
one
Cho
r, up
per S
u-ph
anuv
ong
Uni
vers
ity
22/3
/08
48Q
2206
957
2061
13V
illag
e; d
owns
tream
U
nive
rsity
; lar
ge sa
nd
and
grav
el c
olle
ctio
n;
road
from
left
to th
e is
land
Stee
p, e
rode
d ba
nk; s
ome
trees
on
face
; man
y on
to
p; V
illag
e in
do
wns
tream
Cob
bles
; gra
vel;
fi lam
ento
us a
lgae
; cla
y an
d K
hai t
ree
on th
e ba
nk
R: S
and;
rock
; litt
le d
ebris
Sand
and
gra
vel
colle
ctio
n,
Nav
igat
ion,
fi sh
ing
M: S
and
L: m
ud a
nd c
lay

Page 67
Appendix
Sam
plin
g ev
ent
Site
C
ode
Riv
erLo
catio
nD
ate
Sam
pled
Coo
rdin
ates
Land
Use
Cov
erSu
bstra
tum
Pote
ntia
l hum
an im
pact
s
UTM
UTM
(N)
UTM
(E)
Left
bank
Rig
ht b
ank
Litto
ral
Cha
nnel
94TN
PM
ekon
gN
akor
n Pa
nom
5/3/
2008
48Q
1926
454
4760
94A
gric
ultu
re, f
ew
hous
e, sh
orel
ine,
Agr
icul
ture
, som
e tre
es o
n ba
nk,
smal
l sca
le fi
sh
farm
s
Cla
y an
d m
ud,
bed
rock
, woo
d de
bris
,
R: m
ud a
nd c
lay
Rub
bish
dis
posa
l, A
gric
ultu
re ru
noff,
fi sh
fa
rmin
g, b
ank
eros
ion
M: B
ed ro
ck a
nd C
obbl
e
L: m
ud a
nd c
lay
95TS
MSo
ngkh
ram
Song
karm
M
ount
6/3/
2008
48Q
1951
509
4437
75Fo
rest
, la
nd sl
ide,
fe
w h
ouse
s, aq
uatic
pl
ants
and
alg
ae
Smal
l sca
le
agric
ultu
re, d
ocks
, fl o
atin
g ho
use
and
fi sh
cage
s
Sand
and
cla
y,
fi rm
mud
and
fi r
m sa
nd
R: s
and,
mud
Res
taur
ant, fi s
h ca
ge,
disp
osal
of h
uman
and
an
imal
was
tes,
agric
ultu
ral
runo
ff, li
vest
ock
dam
age
to
ban
k
M: s
and,
mud
L: c
lay
and
sand
96TN
KN
am K
am N
am K
am7/
3/20
0848
Q18
7433
245
0496
Soil
eros
ion,
few
ho
use,
woo
d an
d le
af d
ebris
,So
il er
osio
n an
d la
nd sl
ide
Sand
and
cla
y,
grav
el, s
and
and
mud
R: g
rave
l and
sand
Hum
an w
aste
s and
rubb
ish
disp
osal
form
dow
nstre
am,
Ban
k er
osio
nM
:
L: sa
nd a
nd m
ud
97TM
UN
am M
un K
ong
Cha
im8/
3/20
0848
P16
7318
255
2465
Fiel
ds, a
gric
ultu
re,
hous
e an
d fl o
atin
g ho
uses
, soi
l ero
sion
, ca
ttle
graz
ing
Fish
farm
and
fl o
atin
g ho
use
Sand
and
gra
vel
R: s
and
and
grav
eldi
spos
al o
f hum
an a
nd
anim
al w
aste
s, ag
ricul
tura
l ru
noff,
urb
an ru
noff
M:
L:
98TK
CM
ekon
g K
ong
Cha
im9/
3/20
0848
P16
9455
255
2099
Vill
age,
agr
icul
ture
, ca
ttle
graz
ing,
fi sh
fa
rm
Bed
rock
and
co
bble
, with
man
y sm
all c
hann
els
and
soil
eros
ion
Sand
and
mud
R: s
and
Agr
icul
tura
l run
off,
lives
tock
dam
age
to b
anks
, ur
ban
runo
ffM
: san
d an
d cl
ay
L: sa
nd a
nd fi
rm m
ud
99TU
NN
am M
un U
bon
New
10/3
/200
848
P16
8505
649
4860
Few
hou
se, s
mal
l sc
ale
agric
ultu
ral,
aqua
tic a
nd ri
paria
nA
quat
ic p
lant
s and
fe
w h
ouse
Sand
and
silt
R: s
and
Nav
igat
ion,
agr
icul
ture
M: s
and
and
clay
L: sa
nd a
nd fi
rm m
ud
100
TCS
Mek
ong
Chi
ang
San
11/3
/200
847
Q22
4010
961
4718
Wat
er b
uffa
lo, s
oil
eros
ion,
alg
ae a
nd
aqua
tic p
lant
s
Mud
, aqu
atic
pl
ants
and
few
ho
use,
mar
ket
Sand
and
cla
y,
Firm
sand
, gr
avel
L: sa
nd a
nd g
rave
lN
avig
atio
n, c
onst
ruct
ion,
do
mes
tic w
aste
, dis
posa
l fo
rm h
uman
and
mar
ket
M: fi
rm sa
nd
R: b
ed ro
ck a
nd c
obbl
e
101
TKO
Kok
Chi
ang
Rai
12/3
/200
847
Q22
0179
358
2195
Gra
vel a
nd sa
nd.
Som
e al
gae
on st
one
Rip
aria
n zo
ne
Cob
ble
and
grav
el sa
ndL:
gra
vel a
nd sa
ndA
gric
ultu
re ru
noff,
na
viga
tion,
smal
l vill
age
M: s
and
R: m
ud a
nd c
lay

Report on the 2008 biomonitoring survey of the lower Mekong River and selected tributaries
Page 68
Sam
plin
g ev
ent
Site
C
ode
Riv
erLo
catio
nD
ate
Sam
pled
Coo
rdin
ates
Land
Use
Cov
erSu
bstra
tum
Pote
ntia
l hum
an im
pact
s
UTM
UTM
(N)
UTM
(E)
Left
bank
Rig
ht b
ank
Litto
ral
Cha
nnel
102
VC
TB
assa
cPh
u A
n,
Cai
Ran
g,
Can
Tho
17/0
3/08
48P
1106
685
5890
48Fr
uit
gard
ens,
hous
e
Frui
t gar
dens
, ho
usin
gTh
in m
udR
: san
d, m
ud, o
rgan
ic m
atte
rB
ridge
con
stru
ctio
n, tr
ansp
ort
activ
ities
, nav
igat
ion,
oil
rest
orat
ion,
hu
man
was
hing
, sew
age
treat
men
t, m
ater
ial p
ort a
nd fi
shin
g
M: S
and,
littl
e m
ud
L: C
lay,
org
anic
mat
ter,
mud
103
VLX
Bas
sac
Long
X
uyen
, An
Gia
ng
18/0
3/08
48P
1143
437
5518
97A
gric
ultu
re,
land
er
osio
n,
stro
ng fl
ow
hous
ing,
pr
oces
sing
fa
ctor
y
Mudfl a
t, or
gani
c m
atte
r, ru
bbis
h as
pla
stic
bag
, w
ood,
dec
ay d
ead
anim
al b
odie
s.
R: S
and,
sedi
men
tH
igh
dens
ities
of b
oats
, shi
ps, r
ice
stor
age,
gra
in p
roce
ssin
g fa
ctor
y,
agric
ultu
re, b
ank
eros
ion,
hum
an
was
hing
, boa
t tra
nspo
rtatio
n, w
aste
w
ater
,
M: s
and
L: so
il, m
ud, c
lay
104
VD
PB
assa
cD
a Ph
uoc,
A
n Ph
u, A
n G
iang
19/0
3/08
48P
1188
035
5146
90A
gric
ultu
re,
hous
ing,
ga
rden
s, bu
shes
tree
s
Gra
in
agric
ultu
re a
s m
aize
, bea
n,
etc.
,
Allu
vium
, se
dim
ent
R: a
lluvi
umB
oat a
ctiv
ities
, fi s
hing
, hum
an
was
hing
, hou
sing
, gar
dens
, soi
l er
osio
nM
: san
d
L: c
lay
105
VK
BB
assa
cK
hanh
B
inh,
An
Phu,
An
Gia
ng
20/0
3/08
48P
1210
872
5094
82G
rain
ag
ricul
ture
, na
tura
l lan
d,
gras
s cov
er
Mar
ket,
shop
Sand
, det
ritus
, se
dim
ent
R: r
ubbi
sh, s
and,
sew
age
Mar
ket,
was
te w
ater
, rub
bish
, ag
ricul
ture
and
boa
t tra
nspo
rtatio
n,
hum
an w
ashi
ng, s
and
expl
oita
tion,
fi s
hing
farm
s and
fi sh
ing
M: S
and,
silt
L: C
lay,
sand
106
VTP
Mek
ong
Thuo
ng
Phuo
c 1,
H
ong
Ngu
, D
ong
Thap
22/0
3/08
48P
1205
766
5198
30N
atur
al
land
, bor
der
guar
d offi c
e
Hou
sing
, ga
rden
s, bo
rder
gua
rd
offi c
e
Sand
, sed
imen
t, al
luvi
umR
: San
d, c
lay
Sand
exp
loita
tion,
tran
spor
ting
activ
ities
M: S
and
L: S
and,
sedi
men
t
107
VTT
Mek
ong
Thuo
ng
Thoi
, Hon
g N
gu, D
ong
Thap
23/0
3/08
48P
1194
447
5289
51G
rain
ag
ricul
ture
, na
tura
l lan
d
Soil
eros
ion,
na
tura
l lan
dse
dim
ent,
allu
vium
, org
anic
fe
rtiliz
er
R: c
lay,
sedi
men
tFi
shin
g, a
gric
ultu
ral f
arm
, soi
l er
osio
n, b
oat t
rans
porta
tion.
M: s
and,
sedi
men
tL:
sedi
men
t, al
luvi
um, o
rgan
ic
ferti
lizer
108
VC
LM
ekon
gTa
n H
au,
Tan
Thua
n Ta
y, C
ao
Lanh
24/0
3/08
48P
1153
777
5637
98A
gric
ultu
ral
land
, nat
ural
la
nd
Hou
sing
, ga
rden
s, bo
at
trans
porta
tion
Mudfl a
t, al
luvi
um, a
lot o
f ru
bbis
h lik
e de
ad
tree,
pla
stic
bag
, et
c.
R: c
lay,
sand
Agr
icul
tura
l act
iviti
es, b
oat
trans
porta
tion,
fi sh
ing,
solid
ru
bbis
hes,
orga
nic
mat
ter d
ecay
M: S
and,
allu
vium
,L:
Mudfl a
t, al
luvi
um, a
lot o
f ru
bbis
h lik
e de
ad tr
ee, p
last
ic b
ag,
pest
icid
e bo
ttle,
etc
.
109
VV
LM
ekon
gM
y Th
uan,
V
inh
Long
25/0
3/08
48P
1134
514
6036
98G
arde
ns,
agric
ultu
ral
land
, hou
ses
Hou
sing
, fr
uit g
arde
ns,
cons
truct
ion
mat
eria
l st
orag
e
Sedi
men
t, sa
nd,
dead
fi sh
es,
rubb
ish,
pla
stic
ba
g, p
estic
ide
bottl
e
R: c
lay,
sand
,H
igh
dens
ities
of s
hips
and
boa
ts,
cons
truct
ion
mat
eria
l sto
rage
on
the
right
ban
k, sa
nd e
xplo
itatio
n,
fi shi
ng, e
rosi
on, s
ewag
e an
d ag
ricul
ture
M: s
and
L: S
edim
ent,
sand
, dea
d fi s
h,
rubb
ish,
pla
stic
bag
, pes
ticid
e bo
ttle

Page 69
Appendix
Appendix 3. Detail environmental variables measurement at 32 sites sampled in 2008
Site
C
ode
Alti
tude
(m
)
Riv
er
wid
th
(m)
Dep
th (m
)Se
cchi
dep
th (m
)Te
mpe
ratu
re (°
C)
DO
(mg/
L)pH
EC (m
S/m
)SD
S
LM
RL
MR
LM
RL
MR
LM
RL
MR
CK
T12
1,31
01.
88
1.7
1.15
1.25
1.20
29.8
32.7
29.6
8.06
8.17
8.18
7.28
7.18
7.18
14.9
815
.16
15.0
11.
1
CR
M58
430
1.5
7.5
1.25
1.55
1.50
1.58
27.8
28.0
27.9
6.88
6.74
6.84
7.74
7.75
7.78
5.58
5.56
5.58
1.4
CSJ
5064
01.
335
11.
201.
101.
4729
.730
.630
.36.
766.
766.
806.
786.
776.
813.
613.
653.
591.
3
CK
M48
390
0.7
1.5
0.5
1.25
1.18
1.13
29.7
30.6
31.2
7.76
7.74
7.79
8.26
8.25
8.36
18.6
318
.26
18.1
71.
2
CSP
100
230
22.
51.
51.
101.
071.
1522
.322
.122
.46.
456.
436.
477.
297.
287.
283.
583.
583.
561.
1
CSU
134
175
1.25
13.5
1.5
1.30
1.17
1.40
28.8
28.3
28.4
7.34
7.29
7.22
7.47
7.46
7.42
5.38
5.37
5.38
1.8
CK
L3
300
48
6.5
0.75
0.72
0.80
30.5
30.3
29.5
6.25
6.28
6.28
7.52
7.51
7.50
121.
0012
0.90
120.
901.
7
CSK
513
00.
751.
751
0.40
0.33
0.45
30.3
30.3
29.5
4.88
4.95
4.87
7.29
7.29
7.30
22.1
322
.01
22.0
22.
0
LDN
8212
402.
34.
02.
51.
61.
531.
1028
.50
28.4
429
8.5
8.4
8.7
8.60
8.40
8.50
22.7
022
.70
23.3
01.
6
LSD
101
130
2.0
2.4
1.0
0.8
0.70
0.70
28.8
528
.66
28.5
37.
57.
537.
227.
737.
658.
0013
.10
12.9
012
.72
1.8
LKL
7220
02.
23.
01.
50.
80.
800.
8029
.20
29.4
29.4
7.24
7.26
7.25
7.30
7.10
7.10
7.10
7.10
7.10
1.8
LBH
111
150
1.8
3.0
1.2
1.1
1.30
1.20
28.1
728
.428
.35
87.
57.
57.
987.
907.
7033
.00
33.0
033
.02
1.8
LBF
134
801.
82.
63.
51.
21.
151.
2027
.20
27.1
527
7.5
7.7
7.43
8.10
8.20
8.00
30.0
029
.90
30.3
71.
9
LVT
178
790
1.5
2.0
1.8
0.4
0.60
0.40
23.6
023
.824
.28.
758.
98.
557.
887.
907.
5028
.40
28.3
028
.21
1.8
LMX
410
100
0.5
1.7
1.1
0.2
0.20
0.20
22.8
023
.223
7.5
7.3
7.4
7.15
7.15
7.15
31.1
030
.90
31.0
02.
1
LPB
407
195
1.7
4.5
2.5
0.2
0.20
0.20
25.0
025
258.
38.
38.
27.
747.
737.
7726
.40
26.2
026
.60
1.6
TNP
133
800
-9.
22.
8-
0.62
0.55
-24
.425
.5-
8.30
8.10
-7.
517.
27-
22.9
023
.10
1.7
TSM
136
350
0.4
1.8
0.6
0.5
0.63
0.50
27.0
025
.226
.69.
008.
007.
007.
627.
167.
4524
.70
30.8
030
.10
1.6
TNK
130
191.
11.
31.
10.
60.
520.
5324
.60
27.0
25.5
7.60
7.25
7.80
6.44
6.56
6.58
20.6
021
.60
21.5
01.
8
TMU
9424
82.
86.
53.
50.
70.
870.
7325
.80
24.8
25.3
7.40
24.8
025
.30
6.85
6.87
6.81
17.7
217
.43
19.8
01.
6
TKC
85-
-11
.64.
8-
1.25
1.00
-26
.125
.2-
8.00
7.80
-7.
437.
70-
22.6
023
.40
1.6
TUN
9328
52.
14.
02.
50.
30.
340.
3424
.20
25.6
25.5
8.20
8.00
8.40
6.84
6.96
7.26
16.1
917
.83
17.2
01.
7
TCS
353
550
--
-0.
20.
150.
1823
.00
22.2
23.7
7.60
7.80
7.40
7.52
7.12
7.17
25.3
024
.60
24.1
01.
3
TKO
391
100
1.2
2.3
1.3
0.4
0.43
0.33
24.8
022
.624
.57.
007.
407.
207.
006.
966.
947.
0067
.30
8.55
1.5
VC
T10
1900
7.0
15.0
7.0
0.3
0.30
0.22
28.7
028
.528
.36.
425.
505.
247.
828.
528.
3717
.81
17.5
318
.47
2.1
VLX
780
08.
018
.05.
00.
40.
400.
5028
.80
28.9
28.8
7.80
7.67
6.14
7.69
7.92
7.14
18.0
517
.43
17.9
22.
2
VD
P5
900
7.0
10.0
1.0
0.5
0.45
0.45
29.2
028
.929
.07.
977.
906.
817.
557.
657.
6718
.69
18.6
218
.43
2.2
VK
B6
250
2.0
7.5
1.0
0.6
0.80
0.80
29.4
030
.230
.07.
578.
037.
298.
168.
278.
3713
.84
13.8
213
.81
2.1
VTP
715
003.
012
.08.
00.
80.
850.
8029
.30
29.4
29.4
8.25
6.19
6.41
8.08
7.90
7.84
18.5
918
.40
18.1
81.
9
VTT
640
01.
55.
03.
00.
70.
630.
7028
.70
29.1
29.2
6.94
6.23
5.82
7.88
8.33
8.55
18.4
518
.49
18.5
22.
1
VC
L7
2000
2.5
8.0
4.0
0.6
0.50
0.50
29.3
029
.329
.36.
755.
296.
758.
128.
027.
4518
.94
19.0
018
.94
2.2
VV
L8
1200
3.5
20.0
3.0
0.4
0.55
0.50
28.9
029
.129
.25.
005.
085.
587.
928.
087.
8018
.18
18.3
218
.64
2.1

Page 70

Some other papers in the MRC Technical Paper series:
MRC Technical Paper No. 11 Hydro-acoustic survey of deep pools in the Mekong River of southern Lao PDR and northern Cambodia.
MRC Technical Paper No. 12 Tagging Fish - a case study from the Tonle Sap, Cambodia.
MRC Technical Paper No. 13 Biomonitoring of the lower Mekong River and selected tributaries.
MRC Technical Paper No. 14 Fish Migration Triggers in the Mekong River and other freshwater tropical systems.
MRC Technical Paper No. 15 Diagnostic study of water quality in the Lower Mekong Basin.
MRC Technical Paper No. 16 Fish Consumption and the Yield of Fish and Other Aquatic Animals from the Lower Mekong River Basin.
MRC Technical Paper No. 17 Socio-economics of the fisheries of the lower Songkhram River Basin, northeast Thailand.
MRC Technical Paper No. 18 Yield and value of the wild fishery of rice fields in Battambang Province, near Tonle Sap Lake, Cambodia.
MRC Technical Paper No. 19 An Assessment of water quality in the Lower Mekong Basin.
MRC Technical Paper No. 20 Biomonitoring of the lower Mekong River and selected tributaries, 2004 – 2007.
MRC Technical Paper No. 21 Flood situation report, August 2008.
MRC Technical Paper No. 22 Report on the 2006 biomonitoring survey of the lower Mekong River and selected tributaries.
MRC Technical Paper No. 23 Report on the 2007 biomonitoring survey of the lower Mekong River and selected tributaries.
MRC Technical Paper No. 24 Adaptation to Climate Change in the Countries of the Lower Mekong Basin.
MRC Technical Paper No. 25 Modelling the cumulative effects of mainstream hydropower dams on migatory fish populations in the Lower Mekong Basin
MRC Technical Paper No. 26 Multi-functionality of Paddy Fields over the Lower Mekong Basin.

Mekong River Commission P.O.Box 6101,Vientiane 01000,
Lao PDR.Telephone: (856) 21 263 263 Facsimile: (856) 21 263 264 E-mail: [email protected] Website: www.mrcmekong.org