Embed Size (px)
Citation preview
Volume 10 No. 1
ISSN 1675-7017
June 2013

SOCIAL AND MANAGEMENT RESEARCH JOURNAL
Chief Editor
Loo Ern Chen Univesiti Teknologi MARA, Malaysia
Journal Administrators Faizah Eliza Abdul Talib
Norazrin bt. Zamri
Editorial Board
Agus Harjitok, Universitas Islam Indonesia, Jogjakarta, Indonesia Alexander N. Kostyuk, Ukrainian Academy of Banking of National Bank of Ukraine, Sumy, Ukraine
Ann Hansford, Bournemouth University, United Kingdom Azizah Abdullah, Universiti Teknologi MARA, Malaysia
Azmi Abdul Hamid, Universiti Teknologi MARA, Malaysia Binh Tram-Nam, The University of New South Wales, Sydney, Australia
Darussalam Abu Bakar, Universiti Teknologi MARA, Malaysia Faridah Hassan, Universiti Teknologi MARA, Malaysia Hajibah Osman, Universiti Teknologi MARA, Malaysia Jama’yah Zakaria, Universiti Putra Malaysia, Malaysia
Kalsom Salleh, Universiti Teknologi MARA, Malaysia Kiranjit Kaur, Universiti Teknologi MARA, Malaysia
Lionel Wee, National University of Singapore, Singapore Megawati Omar, Universiti Teknologi MARA, Malaysia Nor Aziah Alias, Universiti Teknologi MARA, Malaysia
Nor’azam Mastuki, Universiti Teknologi MARA, Malaysia Normah Omar, UniversitiTeknologi MARA, Malaysia
Radiah Othman, Massey Universiti, New Zealand Rashid Ameer, International Pacific College, New Zealand Rasimah Aripin, Universiti Teknologi MARA, Malaysia Razidah Ismail, Universiti Teknologi MARA, Malaysia
Ria Nelly Sari, Universitas Riau, Riau, Indonesia Rohana Othman, Universiti Teknologi MARA, Malaysia Rohaya Md Noor, Universiti Teknologi MARA, Malaysia Roshayani Arshad, Universiti Teknologi MARA, Malaysia
Rosliza Mat Zin, Universiti Utara Malaysia, Malaysia Sabarinah Sheikh Ahmad, Universiti Teknologi MARA, Malaysia
Sardar M.N. Islam, Victoria University, Melbourne, Australia Siti Noor Hayati Mohamed Zawawi, Universiti Teknologi MARA, Malaysia
Yap Voon Choong, Multimedia University, Malaysia
© UiTM Press, UiTM 2013 All rights reserved. No part of this publication may be reproduced, copied, stored in any retrieval system or transmitted in any form or by any means; electronics, mechanical, photocopying, recording or otherwise; without prior permission in writing from the Director of UiTM Press, Universiti Teknologi MARA, 40450 Shah Alam, Selangor Darul Ehsan, Malaysia. e-mail: [email protected] Social and Management Research Journal is jointly published by Research Management Institute (RMI) and University Publication Centre (UPENA), Universiti Teknologi MARA, 40450 Shah Alam, Selangor, Malaysia The views and opinion expressed therein are those of the individual authors and the publication of these statements in the Social and Management Research Journal do not imply endorsement by the publisher or the editorial staff. Copyright is vested in Universiti Teknologi MARA. Written permission is required to reproduce any part of this publication.

i
Vol. 10, No. 1 June 2013 ISSN 1675-7017
1. Attitudes and Perceptions of University Students Towards Calculus
Tang Howe Eng Nor Hazizah Julaihi Voon Li Li
2. InfluenceofPublicServiceMotivationonJobSatisfaction and Organisational Commitment of QuantitySurveyorsinNigerianPublicService
L.O. Oyewobi
3. ModellingPredictorsofStudents’LearningGain-An Empirical Evidence using Structural Equation Modelling
Nor Aini Hassanuddin Sakinah Mat Zin Rohana Yusoff
4. National Transformation Success @ A Theory of EverythingbasedonSimplicityandSophistication
Han Chun Kwong
1
41
77
99
Vol. 8, No. 2 Dec 2011 ISSN 1675-7017
1. The Corporate Governance Structures of GLCs and NGLCs and Firm Performance in MalaysiaAzmi Abd. Hamid
1
2. Brand Personality: A Research on Malaysian Consumers’ Perception of Starbucks Coffee OutletB.Kpd.BalakrishnanS.LeeA.S Md.ShuaibN.H Marmaya
27
3. Workplace Deviant Behaviour: Does Psychological Contract Violation Matter? An Empirical EvidenceAbdul Rahman Abdul RahimAizzat Mohd. Nasurdin
35
4. Deferred Tax and Earnings Management under MASB 25Noor Hasimah M. YacobNor’Azam Mastuki Rohaya Md Noor
57
5. Towards Developing A Service Delivery Improvement Model for the Malaysian Hotel SectorJohanudin LahapG. Barry O’MahonyJim Sillitoe
73
6. The Moderating Effect of Service Types on the Relationship Between Emotional Intelligence and Organization RoleAbdul Kadir OthmanMohamed SulaimanAli Al-Kahtani
95

ii
5. Neuro Cognitive Tracking and Corrective Action: A Way Forward in Academic Performance Norlaila Abdullah Suria Fadhillah Md Pauzi Faizah Azam Ahmad
117
Social and ManageMent ReSeaRch JouRnal VoluMe 10 no. 1, 1-40, 2013
1
ISSN 1675-7017© 2013 Research Management Institute (RMI) Universiti Teknologi MARA (UiTM), Malaysia
ABSTRACT
This study seeks to examine university students’ attitudes and their perceptions on calculus education. Lecturers’ suggestions to remedy the current situation of calculus learning were also investigated. The instruments of this study consisted of three sets of questionnaires, aimed at collecting data regarding students’ attitudes and perceptions on calculus and lecturers’ suggestions. The respondents consisted of 278 full-time diploma students in a public university in Malaysia. The findings indicate that the students’ attitudes towards the Course of calculus according to gender were insignificant. However, there was a significant difference in the students’ attitudes towards the Field of calculus between female and male students. Students of Pre-Calculus and Calculus I were found to be feeling, thinking, and behaving similarly about calculus. Their attitudes towards the Field of calculus among the four engineering and science programmes were significant. After attempting 39.27% of the given questions, students’ perceptions on the difficulty of the questions remained the same, which was neither easier nor harder than they expected. Nevertheless, students’ perceptions changed positively (questions more difficult than expected) in 19.45% of the questions and negatively (questions easier than expected) in 41.28% of the questions. The implications from these findings provided inputs to improve calculus teaching and learning. Information regarding students’ attitudes toward calculus could help lecturers to design comprehensive calculus lessons that suit all kinds of students. Students also need to change their attitudes towards calculus, for example by having a closer inspection of the exact nature of the calculus questions before attempting them.
Keywords: calculus education, attitudes, perceptions, gender, course code, programmes of studies
Attitudes And PercePtions of university students towArds cAlculus
Tang Howe Eng1,NorHazizahJulaihi2andVoonLiLi3
1Universiti Teknologi MARA Sarawak, Mukah Campus, Lot 661, Blok 68, Boulevard Setia Raja Mukah, 96400 Mukah, Sarawak
2,3Universiti Teknologi MARA Sarawak, Samarahan CampusJalan Meranek, 94300 Kota Samarahan, Kuching, Sarawak
1Email: [email protected]

2
Social and ManageMent ReSeaRch JouRnal
InTRoduCTIon
For many years, great concern have been expressed about the excessive failure rate of calculus in many universities around the world. Students’ poor performance in calculus was well documented in previous studies (Gynnild et al., 2005; Basaruddin et al., 2003; Zhang, 2003; Suresh, 2002; Douglas, 1998; Culotta, 1992; Lax, 1990). Most of the studies reported that over a third or probably half of the students enrolled in calculus course(s) each year failed the courses. Numerous studies had been conducted, focusing on the difficulty in acquiring a good working knowledge of calculus (Dreyfus, 1991; Madison & Hart, 1990; Cipra, 1988; NCTM & MAA, 1987; Orton, 1983a; 1983b) and on the influencing factors that contributed to the under-achievements in calculus (Tang et al., 2010, Chen et al., 2002; Tucker & Leitzel, 1995; Orton, 1979). As many problems exist with regards to calculus, there were many national attempts towards calculus reform (Smith III & Star, 2007; Hurley et al., 1999; Narasimhan, 1993; Ferrini-Mundy & Graham, 1991). However, the calculus reform had sparked a backlash (Wilson, 1997; Cipra, 1996) and no consensus has been reached on the problems of reducing the failure rate and the method of teaching conceptual understanding of calculus (Tang et al., 2010; Yudariah & Roselainy, 2001; Thompson, 1994; Douglas, 1986).
Many studies reported that mathematics achievement levels had a causal influence on students’ attitudes (Hannula, 2002; Tapia & Marsh, 2001; Lopez et al,. 1997), while other studies viewed that students’ attitudes affected achievement levels, whereby an increase in positive attitudes towards mathematics might increase students’ achievement levels and students’ enrolment in mathematics courses (Papanastasiou, 2002; Higbee & Thomas, 1999).
As mastering calculus skills is required for almost all disciplines of universities’ programmes around the world, there is a strong need to improve students’ learning of calculus. In addition, attitudes, perceptions and suggestions regarding the teaching and learning of calculus are deemed as necessary attempts to overcome calculus learning problems nationwide. Inspired by this, a study was conducted to achieve the following objectives:
1. To investigate the students’ attitudes towards calculus.2. To examine the students’ perceptions on the learning of calculus.3. To elicit the lecturers’ suggestions on ways to improve the students’
learning of calculus.

3
Attitudes And PercePtions of university students towArds cAlculus
Based on the objectives, this study was carried out to answer the following questions.
1. What are the students’ attitudes towards calculus according to gender?2. What are the students’ attitudes towards calculus according to course
codes?3. What are the students’ attitudes towards calculus according to
programmes of studies?4. What are the students’ perceptions regarding calculus learning in terms
of difficulty of questions before attempting the calculus task?5. What are the students’ perceptions regarding calculus learning in terms
of difficulty of questions after attempting the calculus task?6. Is there any disparity in the students’ perceptions of calculus difficulty
before and after attempting the calculus task?7. Is there any disparity between the students’ difficulty ranking scores
and the Bloom’s Taxonomy order?
LITeRATuRe RevIew
Much research relating to attitudes towards mathematics teaching and learning had been done over the last three decades. This section investigates some research in the context of students’ attitudes towards mathematics and their perceptions of difficulty in mathematics and calculus. Literature concerning gender differences in attitudes, perceptions of mathematics and strategies undertaken by educators to improve calculus learning were also reviewed as they served as the basis for our study on calculus.
ATTITudeS And PeRCePTIonS of MATheMATICS
Numerous literature had documented students’ poor performance in mathematics where students’ attitudes was reported as a vital contributing factor (Aiken, 1976; Randel et al., 2000; Anthony, 2000; Yara, 2009). In a review paper by Aiken (1976), it was stated that students’ attitudes came about after ability in forecasting students’ mathematics achievement. However, over the years, behavioural studies on students’ attitudes had gained more importance. According to Randel et al. (2000), about 70% of Japanese high school students rated the attitudes of studying hard as the basis
4
Social and ManageMent ReSeaRch JouRnal
for doing well in mathematics, whereas less than 20% of the corresponding Germans agreed so. The latter valued factors relating to good teacher and innate ability as better indicators of mathematics success. Later, it was found that Japanese students had higher mathematics achievement in five mathematics domains as compared to their German counterparts. Anthony (2000) had also identified students’ attitudes as affecting students’ first-year mathematics performance. As for students’ attitudes with respect to interest and motivation greatly influenced their success in mathematics learning, various aspects of students’ attitudes had been researched in the recent years. Yara (2009) stated that students developed the types of attitude by the kind of approaches undertaken by teachers, either in terms of personalities or styles of teaching.
Students’ experiences in the classrooms were said to influence students’ attitudes towards mathematics, and that when students were taught to investigate and explore mathematics problems creatively by lecturers, students’ attitudes towards mathematics learning changed positively with respect to their confidence and enjoyment in the related subject area (Ponte, 2007). Other than attitudes as causal effect on students’ achievement, Di Martino and Zan (2010) stated that instable attitudes of students towards mathematics affected their behaviours, which provided directions to future deeds. Research on the differences in students’ attitudes towards mathematics across gender had produced mixed results. According to Kaisser-Messmer (1993), German secondary school students’ attitudes towards mathematics varied between males and females, where male students significantly showed greater interest, importance and willingness to be involved in mathematics related career, which had been traditionally known for years. Further, Etsey and Snetzler (1998) reported that male students had slight positive attitudes towards mathematics as compared to female students, but opined that more evidence was needed. However, in Pakistan, Farooq and Shah (2008) reported no gender differences in secondary school tenth grade students’ attitudes. Prior research into students’ attitudes on mathematics gave some basis for research on university students’ attitudes toward calculus.
Few literatures were found on students’ perceptions on difficulty in mathematics (Craig, 2002; Wood & Smith, 2007). According to Craig (2002), students’ perceptions on difficulty level differed in familiarity, context and visual illustration of mathematics questions, and that depended on the students’ mathematical experience. By categorizing calculus questions according to the order of Bloom’s Taxonomy, Wood and Smith

5
Attitudes And PercePtions of university students towArds cAlculus
(2007) reported on the significant differences in students’ perceptions of calculus questions. Concept-based calculus questions were deemed more difficult as compared to fact-based or procedural type of questions. Students also perceived difficulty differently after attempting 37.5% of the given calculus questions. While Li (2004) found that female students rated geometry and numbers and operations as more difficult than male students, Mohd Ayub et al. (2005) revealed that female students’ perceived calculus more positively than male students. To date, studies relating to gender and ethnicity differences of students’ perceptions of difficulty towards calculus in the Malaysia context are scarce.
IMPRoveMenT STRATegIeS
Various strategies had been looked into by many educators for the sake of improving the teaching and learning of calculus in higher learning institutions. In Nanyang Technological University, Ahuja et al. (1998) proposed strategies such as curriculum development, effectiveness in teaching methods, utilization of technology, creative thinking and up-to-date training for lecturers. Nevertheless, prior to that, Dungan and Thurlow (1989) opined that even with the use of new technology or a variety teaching styles, their effects on students’ attitudes have not been established. Yudariah and Roselainy (2001) reported various remedial strategies that were implemented in Universiti Teknologi Malaysia (UTM) to overcome problems faced by its students in their calculus education. Among the strategies was the setting up of remedial centre and the centre for first year studies to help students who were weak in basic mathematics skills. Remedial help and easy access to lecturers were vital aspects in successful learning as it provided the necessary course support for students (Anthony, 2000). In addition, Yudariah and Roselainy (2001) also suggested materials development which included module, textbooks and web-based support materials that linked to other learning sites. Meanwhile, Mohd Ayub et al. (2008) developed calculus teaching modules using computer courseware for university diploma students, and this group of students had better performance compared to the traditional teaching and tutorial type group.
In developing the learning module contents, aspects relating to cognitive, independence and flexible learning were seriously considered. According to Joiner et al. (2002), Calculus and Maple reformed environment

6
Social and ManageMent ReSeaRch JouRnal
and restrictive classroom environment of the non-computer class caused students to learn differently. It was said that students preferred the Calculus and Maple reformed class as it provided the space for participation through exploration and collaboration, resulting in less abstract but more interaction with the lecturer. The enjoyment of students in the reformed class might be due to the opportunity for a more free and independent learning at their own pace. When Noinang et al. (2008) taught multivariate integral calculus by integrating Maple into the learning model, students were motivated to self-planned learning and self-planned assessment. Positive results were also reported by Pee (2011) when the self-learning Matlab laboratory sessions for engineering mathematics model was implemented for first year university students. While there appears to be a likelihood that calculus education is moving towards technology integration, the differences in lecturers’ beliefs are still uncertain.
MeThodoLogy
This study was a survey research. The major purpose of a survey is to describe the characteristics of a population. In this study, random samples of diploma students were selected for investigating their attitudes and perceptions on the learning of calculus. Lecturers’ suggestions on ways to improve the students’ calculus performance were also elicited for this study.
PoPuLATIon And SAMPLe
The population of this study comprised all the diploma students of the Pre-Calculus course and Calculus I course in a public university in Malaysia. All the students who had taken Pre-Calculus course and Calculus I course for a particular semester were asked to respond to Questionnaire I (Appendix 1). They were students of the Diploma in Electrical Engineering, Diploma in Civil Engineering, Diploma in Chemical Engineering and Diploma in Science.
Two groups of students who had taken Pre-Calculus course and another two groups who had taken Calculus I for the semester were asked to respond to Questionnaire II (Appendix 2). The Pre-Calculus students were from the Diploma in Electrical Engineering programme and the Calculus I students were from the Diploma in Science programme through random sampling.

7
Attitudes And PercePtions of university students towArds cAlculus
To elicit the lecturers’ suggestions on how to improve the students’ calculus performance, the lecturers who had experience in teaching calculus were invited to provide feedback. A total of eleven lecturers who have at least six years of experience in teaching calculus responded to Questionnaire III (Appendix 3), which is about 61% of the total number of lecturers from the Mathematics Department of the university under study.
InSTRuMenTS
The instruments of this study consisted of three sets of questionnaires; namely Questionnaire I, Questionnaire II and Questionnaire III. Questionnaire I was adapted from Wise (1985); namely “Attitudes toward Statistics”, which was developed to measure the students’ attitudes towards the Statistics Course subscale and also attitudes towards the Statistics Field subscale. Wise’s questionnaire had high (~0.90) internal consistency for both attitudes towards the Course and attitudes towards the Field subscale scores (Wise, 1985; Schultz & Koshino, 1998).
In this study, the term “Statistics” in Wise’s questionnaire was changed to “Calculus”. Further, the total number of items was reduced from 29 items in Wise’s to 20 items in this study due to their appropriateness in the context used. Questionnaire I for this study comprised information on the students’ demography while the 20 items measured the students’ attitudes towards calculus. The 20 items were analyzed by two subscales; namely the attitudes towards Field subscale, which measured the students’ attitudes towards the use of calculus in their field of study and the attitudes towards Course subscale, which measured the students’ attitudes towards the particular calculus courses they enrolled.
For Questionnaire I, the attitudes towards the Field subscale consist of 11 items whereby the attitudes towards the Course subscale consist of 9 items. The students were asked to respond to each statement using a “1” (strongly disagree) to “5” (strongly agree) scale. The analysis on the reliability of Questionnaire I showed an alpha value of 0.874 for the 20 items. This alpha value indicated that Questionnaire I had high internal consistency and thus reliable to measure the students’ attitudes towards calculus.
Questionnaire II aimed at investigating the students’ perceptions on the learning of calculus. This questionnaire included the students’ particulars, Task 1 (for Pre-Calculus students) (Appendix 2(a)) and Task 2 (for Calculus

8
Social and ManageMent ReSeaRch JouRnal
I students) (Appendix 2(b)). This questionnaire was further divided into 4 sections, namely Sections A, B, C and D. Section A sought to investigate the students’ perceptions on the difficulty of calculus before attempting the given calculus tasks. Section B investigated the students’ knowledge in solving calculus questions. Section C investigated the students’ perceptions on the difficulty of calculus after completing the given calculus tasks. Section D investigated the students’ perceptions on the clarity of the given tasks and previous experience in the learning of calculus.
Questionnaire III aimed at eliciting the lecturers’ suggestions in helping to improve students’ calculus performance. The lecturers were asked to give suggestions on how to improve the students’ performance in calculus.
dATA CoLLeCTIon PRoCeduReS
Questionnaire I was given to all the diploma students who had taken the Pre-Calculus course and the Calculus I course for the semester. The respective lecturers who were teaching the courses helped to distribute Questionnaire I to all the students. The students were asked to answer the questionnaire without any time limitation. Questionnaire II was given to the two groups of students from Diploma in Electrical Engineering programmes who had taken the Pre-Calculus course and another two groups of students from Diploma in Science programmes who had taken the Calculus I course for the semester. The respective lecturers who were teaching these groups of students helped to distribute Questionnaire II. The students answered the second questionnaire without any time limitation as well.
Questionnaire III was distributed to the lecturers who had taught calculus. The questionnaire was answered by the lecturers at anytime convenient to them. The researchers then collected the questionnaire from the respective lecturers.
dATA AnALySIS PRoCeduReS
The data was analyzed by using Statistical Package for Social Sciences (SPSS). The descriptive statistics such as mean scores, percentages and frequencies were generated to summarize and present the data. The inferential statistics such as Mann Whitney U Test and Kruskal Wallis Rank Sum Test were generated to make the possible inferences on the data.

9
Attitudes And PercePtions of university students towArds cAlculus
Mann Whitney U Test was used to determine whether there is any significant difference in the students’ attitudes towards calculus between male and female students, as well as, whether there is any significant difference between the Pre-Calculus students and the Calculus I students. Kruskal Wallis Rank Sum Test was used to analyze whether there is any significant difference in the students’ attitudes towards calculus between the four different programmes. Mean scores were calculated to analyse if there is any significant difference in the scores before the students attempted the given calculus tasks (pre-score) and after the students had attempted the given calculus tasks (post-score).
fIndIngS
This section reports the findings of the data analysis that was conducted to determine the students’ attitudes towards calculus (Questionnaire I) and students’ perceptions of difficulty in calculus (Questionnaire II). Lecturers’ views and suggestions to remedy the current situation of learning calculus were also reported (Questionnaire III).
STudenTS’ ATTITudeS TowARd CALCuLuS
The analysis on students’ attitudes based on the data obtained from 278 respondents was carried out according to gender, course codes and programmes of studies. The results are presented in Tables 1 and 2.
STudenTS’ ATTITudeS ACCoRdIng To gendeR
Students’ attitudes were evaluated based on the 20-items, on a five-point Likert scale that assessed their attitudes towards the Course of calculus and towards the Field of calculus. Table 1 indicated that data from 271 respondents were analyzed for attitudes towards Course subscale whereby data from 272 respondents were analyzed for attitudes towards Field subscale.

10
Social and ManageMent ReSeaRch JouRnal
Table 1: Mann-whitney u Test and Kruskal-wallis Rank Sum Test for Analyzing Students’ Attitudes
Attitude to Course Subscale
Attitude to Field Subscale
N Mean Rank
Sum of Ranks N Mean
RankSum of Ranks
Gender Male 138 138.36 19094.00 140 146.38 20493.00
Female 133 133.55 17762.00 132 126.02 16635.00
Course Code Pre-Calculus 153 133.18 20376.50 154 140.56 21646.00
Calculus I 118 139.66 16479.50 118 131.20 15482.00
Programme Applied Science 92 149.75 91 119.96
Civil Engineering 81 124.80 83 134.70
Electrical Engineering 52 132.19 53 156.35
Chemical Engineering 46 132.53 45 149.90
Overall, data from 277 respondents were used in the gender analysis. Mann-Whitney U Test is used since the assumption of normality was violated for the students’ attitudes. The test statistics from Mann-Whitney U Test for analyzing students’ attitudes according to gender, as shown in Table 2, indicated that the results, with correction for ties and Z-score conversion, was not significant (p>.05) for students’ attitudes towards Course of calculus between male and female students. However, significant result (p<.05) was found for students’ attitudes towards Field of calculus between male and female students.

11
Attitudes And PercePtions of university students towArds cAlculus
Table 2: Test Statistics to compare Attitudes across gender, Course Code and Programmes
Attitude to Course Subscale Attitude to Field Subscale
Gender Course Code Programme Gender Course
Code Programme
Mann-Whitney U 8851.000 8595.500 7857.000 8461.000
Wilcoxon W 17762.000 20376.500 16635.000 15482.000
Z -.507 -.677 -2.142 -.976
Asymp. Sig. (2-tailed) .612 .498 .032* .329
Chi-Square 4.738 8.824
df 3 3
Asymp. Sig. .192 .032*
* p < .05
STudenTS’ ATTITudeS ACCoRdIng To CouRSe CodeS
In analyzing students’ attitudes according to course codes, the output of Mann-Whitney U Test, as shown in Table 1 indicated that data from 271 respondents were analysed for attitudes towards Course subscale whereby data from 272 respondents were analysed for attitudes towards Field subscale. Generally, data from 278 respondents were used in the course code analysis. Mann-Whitney U Test is used since the assumption of normality was violated for the students’ attitudes. From Table 2, the output of the test statistics of Mann-Whitney U Test for analysing students’ attitudes according to course codes indicated that the result was not significant (p>.05) for students’ attitudes towards Course of calculus between the students of Pre-Calculus and Calculus I. The result was also not significant (p>.05) for students’ attitudes towards Field of calculus between Pre-Calculus and Calculus I students.

12
Social and ManageMent ReSeaRch JouRnal
STudenTS’ ATTITudeS ACCoRdIng To PRogRAMMeS of STudIeS
The output of Kruskal-Wallis Rank Sum Test for analyzing students’ attitudes according to programmes of studies as indicated in Table 1 revealed data from 271 respondents which were analyzed for attitudes towards Course subscale, whereby data from 272 respondents were analyzed for attitudes towards Field subscale. On the whole, data from 278 respondents were used in the programmes of studies analysis. Kruskal-Wallis Rank Sum Test is used since the assumption of normality was violated for the students’ attitudes according to programmes of studies. The statistics from Kruskal-Wallis Rank Sum Test, as shown in Table 2 indicated that the result was not significant (p>.05) for students’ attitudes towards Course of calculus among the students of the four programmes, namely Applied Science, Civil Engineering, Electrical Engineering and Chemical Engineering. However, the result was significant (p<.05) for students’ attitudes towards Field of calculus among students of all the four programmes.
STudenTS’ PeRCePTIonS of dIffICuLTy In LeARnIng CALCuLuS
In examining the students’ perceptions on the learning of calculus in terms of difficulty, the data was analyzed from 88 first year students from the programmes of Applied Science and Electrical Engineering who took the Pre-Calculus and Calculus I courses. Table 3 shows the demographic data of the respondents, which comprised of gender, race and language spoken at home.

13
Attitudes And PercePtions of university students towArds cAlculus
Table 3: Students’ Demographic Profile
Course Students’ demographic
Frequency
Pre-Calculus Gender MaleFemale
2710
Calculus I Gender MaleFemale
1932
Pre-CalculusandCalculus I
Race MalayMelanauBidayuhIban KayanBajau DusunOthers
48711171112
Pre-CalculusandCalculus I
Home Language MalayMelanauBidayuhIban KayanBajau English and mother tongueOthers
43481411134
Students were asked to answer Questionnaire II, whereby Task 1 was for the Pre-Calculus students and the Task 2 was for the Calculus I students. The six questions in Task 1 and Task 2 were designed based on the six categories of Bloom’s Taxonomy (Bloom, 1956) and were presented in random order (see Table 4). These questions were carefully chosen with the aim of identifying the type of questions that students perceived as either easy or difficult.
Table 4: Questions Representing the Categories in Bloom’s Taxonomy
Course Pre-Calculus(Task 1)
Calculus I(Task 2)
Categories of Bloom’s Taxonomy
Level 1 Knowledge Question 6 Question 1Level 2 Comprehension Application
Question 5Question 3
Question 3Question 4
Level 3 Analysis Synthesis Evaluation
Question 2Question 4Question 1
Question 2Question 5Question 6

14
Social and ManageMent ReSeaRch JouRnal
In order to determine the difficulty of the questions, the students were requested to scale each question twice, before attempting the task (pre-scale) and after completing the task (post-scale). The 5-point Likert-scale was rated from ‘1’ (very easy) to ‘5’ (very difficult). Based on the results shown in Table 5, it was revealed that students’ perceptions on the difficulty did not change after they had attempted the task in 39.27% of the given calculus questions (i.e. the questions were neither easier nor harder than expected before and after answering the questions). However, students’ perceptions changed negatively (questions were easier than expected) in 41.28% of the calculus questions and changed positively (questions were more difficult than expected) in 19.45% of the calculus questions. Most of the questions were found to be easier than expected, except for question 4 and question 5 of Calculus I (Task 2).
Table 5: The Differences of Scaling in Difficulty before and after Answering the Questions
Course Pre-Calculus (Task 1) Calculus I (Task 2) Overall (Task 1 & Task 2)Scale percentage(%)
Ties Negative Positive Ties Negative Positive Ties Negative Positive
Question 1 33.34 42.42 24.24 44.90 38.78 16.322 8.33 80.55 11.11 55.10 32.65 12.253 41.67 50.00 8.33 49.02 39.22 11.764 44.44 30.56 25.00 43.14 15.69 41.175 19.44 61.11 19.44 39.22 19.61 41.176 41.67 41.67 16.67 50.98 43.14 5.88
All questions 39.27 41.28 19.45
Based on the mean scores of the pre-scale and post-scale as shown in Table 6, questions 3, 5 and 6 of Pre-Calculus were considered difficult before and after attempting the questions. Meanwhile, for Calculus I, question 6 was considered as very easy whereas questions 2, 4 and 5 were considered difficult before and after attempting the questions.

15
Attitudes And PercePtions of university students towArds cAlculus
Table 6: The Scores of Difficulty before and after Answering the Questions
Course Pre-Calculus (Task 1) Calculus I (Task 2)
Difficulty Pre-scale
Pre-mean
Post-scale
Post-mean
Pre-scale
Pre-mean
Post-scale
Post-mean
Question 1 4 2.57 2 2.36 6 2.06 6 1.63*2 1 2.97 4 2.53* 3 2.47 1 2.18*3 2 3.35 1 2.69* 1 2.54 3 2.20*4 6 3.43 6 3.14 2 2.76 2 2.51*5 3 3.76 3 3.17* 4 3.29 4 3.63*6 5 4.22 5 3.33 5 3.39 5 3.75*
*significant at 5% level
To investigate the reasons why students chose the scores, they were then asked whether the questions were clearly worded, whether they understood the questions and whether they had seen similar questions before (see Tables 7 and 8). The 5-point Likert scale used for “language” was ‘1’ for ‘very clear’ to ‘5’ for ‘very hard to understand’, while “understanding” was analyzed based on the scale ‘1’ for ‘very easy to understand’ to ‘5’ for ‘very hard to understand’. In general, Table 7 shows that questions that were clearly worded caused students to have better understanding in answering the questions. Most students seemed to have clear understanding on the questions except for questions 3, 5 and 6 of Pre-Calculus (Task 1), which recorded scores of between ‘moderate’ and ‘hard’. Earlier on, these questions were rated as difficult by students. For Calculus I (Task 2), although students had previously rated questions 2, 4 and 5 as difficult, but language and understanding did not seem to contribute to students’ difficulty in answering these questions.
Table 7: Mean Scores of Question Analysis Based on Language and understanding of the Students
Course Pre-Calculus (Task 1) Calculus I (Task 2)Mean score Language Understanding Language UnderstandingQuestion 1 1.46 2.30 1.37 1.53
2 1.68 2.65 1.73 2.203 2.86 3.49 1.96 2.254 2.22 2.42 2.22 2.675 3.78 3.92 2.35 2.786 2.14 3.05 1.51 1.55

16
Social and ManageMent ReSeaRch JouRnal
The results in Table 8 show that there was a strong link between the familiarity on the type of questions and the difficulty of the questions. The question that was familiar to the students was perceived as easy before and after attempting the question. Table 8 shows that students were not familiar with question 3 (68.57%) and question 5 (61.11%) of Pre-Calculus (Task 1). Unfamiliarity with the questions might be the reason why students rated questions 3 and 5 as difficult before and after attempting the questions. As for Calculus I (Task 2), the students had previously rated question 4 and question 5 as difficult whereby these questions were also perceived as unfamiliar as compared to the other totally familiar questions. Thus far, the results implied that calculus questions that were clearly worded and expressed, easy to understand and deemed familiar were perceived as easy by students.
Table 8: familiarity Scores by Types of Question
Course Pre-Calculus (Task 1) Calculus I (Task 2)Familiarity percentage (%) Yes No Yes NoQuestion 1 97.22 2.77 100.00 0.00
2 91.67 8.33 100.00 0.003 31.43 68.57 100.00 0.004 91.67 8.33 70.59 29.415 38.88 61.11 68.63 31.376 88.88 11.11 100.00 0.00
The students were also asked to rank the six calculus questions in order of difficulty. Based on the results shown in Table 9, the comparison between students’ difficulty ranking scores and the Bloom’s Taxonomy order showed that there was no considerable agreement between the taxonomy categories and the ranking given by the students. Generally, Pre-Calculus students viewed question of the ‘comprehension’ type as the easiest, while question of the ‘knowledge’ type as the most difficult. On the contrary, students of Calculus I perceived the ‘application’ type of question as the easiest and the ‘evaluation’ type as the most difficult. According to Wood and Smith (2007), there was no priori reason for the Bloom’s Taxonomy order to reflect difficulty, since the rationale of its development was to reflect conceptual complexity. To summarise, it was found that students’ perceptions of difficulty in calculus learning differ from one student to another student. The majority of the students viewed the questions to be

17
Attitudes And PercePtions of university students towArds cAlculus
easier than expected. The students’ perceptions of the difficulty did not change after attempting the task. Only a minority viewed the questions to be more difficult than expected. Further, the students’ ranking scores on task difficulty were found to differ from the orders of Bloom’s Taxanomy.
Table 9: Comparison between Students’ Difficulty Ranking and Bloom’s Taxonomy order
Pre-Calculus (Task 1) Calculus I (Task 2)Taxonomy order
Students’ Ranking Mean Taxonomy
orderStudents’ Ranking Mean
Question 1 6 4 3.25 1 3 2.782 5 1 3.33 3 2 2.963 3 3 3.42 4 4 2.964 2 2 3.56 2 1 3.715 4 5 3.72 5 5 3.966 1 6 3.72 6 6 4.58
SuggeSTIonS To IMPRove STudenTS’ PeRfoRMAnCe In CALCuLuS
Many research had reported under achievement in calculus courses, hence, there is an urgent need to explore effective ways to improve students’ performance in these courses. Following are the suggestions recommended by mathematics lecturers from a public university in Malaysia.
LeCTuReRS’ RoLe
The lecturers’ teaching method must be properly sequenced and well-organized. The teaching approach must be effective and tally with the level of understanding of the students. Classroom activities must relate to real life situations and discussions on calculus theories and applications must be in the daily life contexts. By doing so, students would appreciate what they had learned and be able to master the calculus skills easily.
The integration of technology and the implementation of new teaching and learning methods could be effective ways to enhance students’ understanding of calculus as well as to encourage independence in learning. For example, the use of mathematics software such as Maple, Mathematica and Matlab could help students to develop in-depth understanding of

18
Social and ManageMent ReSeaRch JouRnal
calculus if used properly in daily lectures. Meanwhile, this move would require huge resources and physical laboratory spaces due to the increasing enrolment of students.
Furthermore, by providing a comprehensive instructional system, which includes complete module of calculus subjects, students could be encouraged to learn independently. The module should comprise of all the calculus topics of the subject and provides various examples, comprehensive exercises and also more problem-solving questions for the students.
Lecturers should be more patient when teaching calculus concepts to the students. Lecturers should try to assist students whenever they need help. Students’ interest in studying calculus needs to be built up so that they are confident when answering calculus questions and do not easily give up. Sometimes, learning calculus in small group could be effective as students could discuss calculus concepts and communicate better with their peers.
STudenT’S RoLe
Students would have to change their attitudes in learning calculus. They must practise regular study habits by attending lectures and tutorials as well as attempting all the assignments and exercises in order to master the calculus concepts. Falling behind tends to be one of the most frequent causes of failure in calculus. Therefore, students should play their part by studying hard and always make an effort to consult the lecturers whenever they face problems in learning calculus.
unIveRSITy ToP MAnAgeMenT’S RoLe
A review on the scope of calculus syllabus by the university top management is needed to ensure that there is a flow on delivering the calculus concepts. Besides, the calculus syllabus should also be relevant to the market needs. The scope of the calculus syllabus should be moderate so that it allows lecturers to instil deeper calculus understanding in students. Under the current situation and most of the time, lecturers need to rush through the syllabus. Students do not have enough time to learn and think further, as the syllabus is so packed for certain calculus courses.
When processing new intakes of students, the top management should select students with strong basic calculus background for programmes that

19
Attitudes And PercePtions of university students towArds cAlculus
need a good command of calculus. A strong basic calculus background enables the students to master higher level calculus without much problem.
ConCLuSIonS
This study explored students’ attitudes towards calculus, their perceptions of the difficulty in calculus and the lecturers’ suggestions to remedy the current situation of calculus learning. Students’ attitudes towards calculus across gender, course codes and programme of studies were investigated. To gather the data on the students’ perceptions of difficulty in calculus, the students were requested to scale the questions twice, before attempting the task (pre-scale) and after completing the task (post-scale). The lecturers’ who had taught calculus courses gave their perceptions on the calculus courses.
In this study, the students’ attitudes towards the Course of calculus across gender were not significant. On the other hand, there was a significant difference in the students’ attitudes towards the Field of calculus across gender. This finding illustrated that male and female students did not differ in their opinions towards the Course of calculus. Regarding the Field of calculus, male students tend to be more positive in attitude as compared to their female counterparts. This result was consistent with the reviews by Frost et al. (1994) and Leder (1995) which stated that females tend to display more negative attitudes towards the usage of mathematics as compared to males.
Further, McLeod (1994) commented that there was a tendency for females to behave more negatively as they progress to secondary school, meaning that the higher they study, females tend to behave more negatively. Nevertheless, regardless of gender, students’ attitudes towards calculus need to be enhanced in order to improve calculus education, may it be in the course of study or field of study, which would serve as invaluable knowledge in their future profession. This statement is supported by Randel et al. (2000), Anthony (2000) and Yara (2009) who documented that one of the vital contributing factors to students’ poor performance in mathematics is students’ attitudes. In addition, Randal et al. (2000) reported that 70% of Japanese high school students rated the attitudes of studying hard as the basis for doing well in mathematics.
With regards to the students’ attitudes towards calculus across course code, there was no significant difference in the students’ attitudes, both

20
Social and ManageMent ReSeaRch JouRnal
towards the Course of calculus and the Field of calculus. Both Pre-Calculus and Calculus I students seemed to view, think and behave coherently towards the Course of calculus and the Field of calculus. For the students’ attitudes across programmes of studies, no significant difference was found for the students’ attitudes towards the Course of calculus. Nevertheless, there was significant difference in the students’ attitudes towards the Field of calculus among the four programmes, namely Electrical Engineering, Civil Engineering, Applied Science and Chemical Engineering.
Regarding the students’ perceptions on the difficulty in learning calculus, their perceptions of the difficulty did not change after they had attempted the task in 39.27% of the given calculus questions. However, the students’ perceptions changed negatively (questions easier than expected) in 41.28% of the questions and positively (questions more difficult than expected) in 19.45% of the questions. Most of the questions were found to be easier than expected except for question 4 and question 5 in Calculus I. The students’ unfamiliarity with question 4 and question 5 in Calculus I (application and synthesis type of question respectively) might be the reason behind their expectations. Students might have underestimated or overestimated the difficulty of the questions at first glance. This might be due to the questions’ appearances. The questions might look quite hard or easy enough, but closer inspection of the questions would reveal the exact nature of the questions.
As for the comparison between the students’ difficulty ranking scores and the Bloom’s Taxonomy order, the students’ rankings scores on task difficulty were found to differ from the order of Bloom’s Taxanomy. This result was consistent with that of Wood and Smith (2007), which stated that the rationale of its development was to reflect conceptual complexity and not difficulty. In Task 1 for Pre-Calculus, the categories of questions which were considered as difficult before and after attempting the task were of the application (question 3), comprehension (question 5) and knowledge (question 6) types. On the contrary, in Task 2 for Calculus I, the categories of questions which were considered as difficult before and after attempting the task were of the analysis (question 2), application (question 4) and synthesis (question 5) types. Generally, questions which were deemed familiar to the students, in which simple language was used, were perceived as easy. The differences in the students’ perceptions of difficulty before attempting the task and its reality, as categorized by Bloom’s Taxonomy had provided an understanding and opportunity for further improvement in the calculus teaching and learning.

21
Attitudes And PercePtions of university students towArds cAlculus
In this study, few suggestions had been recommended by the mathematics lecturers in order to improve students’ performance in calculus. Calculus lessons should be designed to connect facts and theories to real life situations. The use of mathematics software such as Maple, Mathematica and Matlab would be an added advantage to enhance students’ understanding of calculus as well as to encourage independent learning. By providing a comprehensive instructional system, which includes complete module of calculus subjects, students could be encouraged to learn independently. This is supported by Turner (2008) whereby a systematic approach had been used to cater to the critical problem of student retention and high school-college transition. The overall structure of the approach included predictor, corrector step and followed by refinement step. The overall structure utilized various activities and materials to guide students’ independent review. The statistics supported the belief that the approach had significant positive impact.
Besides the lecturers’ roles, lecturers believed that students also need to change their attitudes towards calculus. A review on the scope of the calculus syllabus by the university top management is needed, especially in terms of quantity and continuity of prior knowledge. It is suggested that only those students with the strong basic calculus background are processed to be enrolled in programmes that need good command of calculus. This suggestion was found to be parallel with that of Wankat and Oreovicz (2005), which reported that the mathematics skills of students entering university, particularly in Pre-Calculus, require close monitoring because success in engineering hinges on them. Students who do not have high school calculus should be tested in college Algebra and Trigonometry, and those who failed should be assisted so that they can graduate on time.
This study provides vital information regarding the students’ attitudes and perceptions as well as lecturers’ perceptions towards calculus teaching and learning and calculus education research in this new era. Future study could continuously investigate on the current students’ learning situation of calculus courses. In-depth students’ opinions regarding the syllabus, the difficulty of the final examination questions and the duration of completing the syllabus could help in gaining a better overview of what actually happens during the teaching and learning process. It is recommended that a larger sample size be used and also that the advanced diploma and degree students be involved in future studies. Finally, the uses of Maple and Matlab are recommended to enhance students’ understanding of calculus, as the mathematics software could cater for students with different types of

22
Social and ManageMent ReSeaRch JouRnal
attitudes, to promote independence in learning and to provide comprehensive instruction system.
RefeRenCeS
Ahuja, O.P., Lim-Teo, Suat, K. and Lee, P.Y. (1998). Mathematics teachers’ perspective of their students’ learning in traditional calculus and its teaching strategies. Journal of the Korea Society of Mathematical Education Series D, 2(2), 89-108.
Aiken, L.R. (1976). Update on attitudes and other affective variables in learning mathematics. Review of Educational Research, 46(2), 293-311.
Anthony, G. (2000). Factors influencing first-year students’ success in mathematics. International Journal of Mathematical Education in Science and Technology, 31(1), 3-14.
Basaruddin, F., Ahmad Zabidi S.F. and Yusoff. M.Z. (2003). An analysis Study on the Topics of Calculus I. The Development and Utilization of Effective Teaching Softwares in Teaching and Learning Mathematics. Proceedings of the International Conference on Research Education and Mathematics, Universiti Putra Malaysia, 294-302.
Bloom B.S. (1956). Taxonomy of Educational Objectives, Handbook 1: The Cognitive Domain. New York: David McKay Co Inc.
Chen, C.H.A., Chu M.C., Pai, Y.H. and Ho, C.H. (2002). The design of a web-based calculus learning environment. World Conference on Educational Multimedia, Hypermedia and Telecommunications, (1), 283–284.
Cipra, B. (1988). Calculus: Crisis looms in mathematics’ future. Research News, 239, 1491-1492.
Cipra, B. (1996). Calculus reform sparks a backlash. Science, 271(5251), 901.

23
Attitudes And PercePtions of university students towArds cAlculus
Craig, T. (2002). Factors affecting students’ perceptions of difficulty in calculus word problems. Research report, University of Cape Town, South Africa.
Culotta, E. (1992). The calculus of education reform. Science, 225, 1060–1062.
Di Martino, P. and Zan, R. (2010). ‘Me and maths’: toward a definition of attitude grounded on students’ narratives. Journal of Math Teacher Education, 13, 27-48.
Douglas, R.G. (1986). Toward a lean and lively calculus. Washington, DC: Mathematical Association of America.
Douglas, R.G. (1998). Today’s calculus course are too watered down and outdated to capture the interest of students. The Chronicle of Higher Education, 34, B1-B3.
Dreyfus, T. (1991). Advanced mathematical thinking. In P. Nesher & J. Kilpatrick (Eds.), Mathematics and cognition: A research synthesis by the International Group for the Psychology of Mathematics Education (113-134). Cambridge, England: Cambridge University Press.
Dungan, J.F. and Thurlow, G.R. (1989). Students’ attitudes to mathematics: A review of the literature. The Australian Mathematics Teacher, 45(3), 8-11.
Etsey, Y.K. and Snetzler, S. (1998). A meta-analysis of gender differences in student attitudes toward mathematics. Paper presented at the annual meeting of the American Educational Research Association, San Diego, C.A.
Farooq, M.S. and Shah, S.Z.U. (2008). Students’ attitudes toward mathematics. Pakistan Economic and Social Review, 46(1), 75-83.
Ferrini-Mundy, J. and Graham, K.G. (1991). An overview of the calculus curriculum reform effort: Issues for learning, teaching and curriculum development. American Mathematical Monthly, 98, 627–635.

24
Social and ManageMent ReSeaRch JouRnal
Frost, L.A., Hyde, J.S. and Fennema, E. (1994). Gender, mathematics performance and mathematics related attitudes and affect: a meta-analytic synthesis. International Journal of Educational Research, 21, 373-385.
Gynnild, V., Tyssedal, J. and Lorentzen, L. (2005). Approaches to study and the quality of learning. Some empirical evidence from engineering education. International Journal of Science and Mathematics Education, 3, 587-607.
Hannula, M. (2002). Attitude toward mathematics: Emotions, expectations, and values. Educational Studies in Mathematics, 49, 25-46.
Higbee, J.L. and Thomas, P.V. (1999). Affective and cognitive factors related to mathematics achievement. Journal of Developmental Education, 23(1), 1-15.
Hurley, J. and Koehn, U. (1999). Effects of calculus reform: local and national. American Mathematical Monthly, 106(9), 800.
Joiner, K.F., Malone, J.A. and Haimes, D.H. (2002). Assessment of classroom environments in reformed calculus education. Learning Environment Research, 5, 51-76.
Kaisser-Messmer, G. (1993). Results of an empirical study into gender differences in attitudes toward mathematics. Educational Studies in Mathematics, 25, 209-233.
Lax, P.D. (1990). Calculus reform: A modest proposal. Undergraduate Mathematics Education Trend, 2(2), 1.
Leder, G. (1995). Equity inside the mathematics classroom: Fact or artifact? In W.G. Secada, E. Fennema and L.B. Adajian (eds.), New Directions for Equity in Mathematics Education, Cambridge University Press.
Li, Q. (2004). Beliefs and gender differences: A new model for research in mathematics education. Interchange, 35(4), 423-445.

25
Attitudes And PercePtions of university students towArds cAlculus
Lopez, F., Lent, R., Brown, S. and Gore, P. (1997). Role of socio-cognitive expectations in high school students’ mathematics-related interest and performance. Journal of Counseling Psychology, 44(1), 44-52.
Madison, B.L. and Hart, T.A. (1990). A challenge of numbers: People in the mathematical sciences. Washington, DC: National Academy Press.
McLeod, D.B. (1994). Research on affect and mathematics learning in the JRME: 1970 to present. Journal for Research in Mathematics Education, 24, 637-647.
Mohd Ayub, A.F., Wong, S.L. and Mukti, N. (2005). Students’ attitudes toward calculus: A preliminary study among diploma students at Universiti Putra Malaysia. Jurnal Teknologi, 42(E), 49-60.
Mohd Ayub, A.F., Tengku Sembok, T.M. and Wong, S.L. (2008). Teaching and learning calculus using computer. Proceedings of the Thirteenth Asian Technology Conference in Mathematics, Suan Sunandha Rajabhat University, Bangkok, Thailand.
Narasimhan, C.C. (1993). Calculus reform for the non-science client disciplines. PRIMUS, 3(3), 254–262.
National Council of Teachers of Mathematics & Mathematics Association of America (NCTM/MAA) (1987). Curriculum for grades 11-14. In L.A. Steen (Ed.). Reshaping collage mathematics: A project of the committee on the undergraduate program in mathematics (MAA notes 13, 91-102). Washington DC: The mathematical Association of America.
Noinang, S., Wiwatanapataphee, B. and Yong, H.W. (2008). Teaching-Learning tool for integral calculus. Proceedings of the Thirteenth Asian Technology Conference in Mathematics, Suan Sunandha Rajabhat University, Bangkok, Thailand.
Orton, A. (1979). An investigation into the understanding of elementary calculus in adolescents and young adults. Cognitive Development. Research in Science and Mathematics, Universidad de Leeds, Gran Bretana, 201-215.

26
Social and ManageMent ReSeaRch JouRnal
Orton, A. (1983a). Students’ understanding of integration. Educational Studies in Mathematics, 14, 1-18.
Orton, A. (1983b). Students’ understanding of differentiation. Educational Studies in Mathematics, 14, 235-250.
Papanastasiou, C. (2002). Effects of background and school factors on the mathematics achievement. Educational Research and Evaluation, 8(1), 55-70.
Pee, C.T. (2011). Self learning laboratory sessions for engineering mathematics. Proceedings of the Sixteenth Asian Technology Conference in Mathematics, Suan Sunandha Rajabhat University, Bangkok, Thailand.
Ponte, J.P. (2007). Investigations and explorations in the mathematics classroom. ZDM Mathematics Education, 39, 419-430.
Randel, B., Stevenson, H.W. and Witruk, E. (2000). Attitudes, beliefs, and mathematics achievement of German and Japanese high school students. International Journal of Behavioral Development, 24(2), 190-198.
Schultz, K.S. and Koshino, H. (1998). Evidence of reliability and validity of Wise’s attitudes toward statistics scale. Psychological Reports, 82, 27-31.
Smith III, J. and Star, J. (2007). Expanding the notion of impact of K-12 standards-based mathematics and reform calculus programs. Journal for Research in Mathematics Education, 38(1), 3–34.
Suresh, R. (2002). Persistence and attrition in Engineering: Understanding the nature of students’ experience with barrier courses. PhD. dissertation, University of New York.
Tang, H.E., Voon, L.L. and Julaihi, N.H. (2010). The relationship between students’ underachievement in Mathematics courses and influencing factors. Procedia of Social and Behavioral Sciences, 8, 134-141.

27
Attitudes And PercePtions of university students towArds cAlculus
Tapia, M. and Marsh, G.E. (2001). Effect of gender, achievement in mathematics, and grade level on attitudes toward mathematics. Paper presented at the Annual 135 Meeting of the Mid-South Educational Research Association. Science, Mathematics, and Environmental Education, 1-20.
Thompson, P.W. (1994). Images of rate and operational understanding of the fundamental theorem of calculus. Educational Studies in Mathematics, 26, 229-274.
Tucker, A.C. and Leitzel, J.R.C. (Eds.) (1995). Assessing calculus reform efforts: A report to the community (MAA Report No. 6). Washington, DC: Mathematical Association of America.
Turner, P.R. (2008). A predictor-corrector process with refinement for first-year Calculus transition support. Primus: Problems, Resources, and Issues in Mathematics Undergraduate Studies, 18(4), 370-393.
Wankat, P. and Oreovicz, F. (2005). Starting with square one. ASEE Prism, November, 46.
Wilson, R. (1997). A decade of teaching reform calculus has been a disaster, critics charge: Mathematicians divide over a curricular movement that some say has cheated students. The Chronicle of Higher Education, 43(22), A12–A13.
Wise, S.L. (1985). The development and validation of a scale measuring attitudes toward statistics. Educational and Psychological Measurement, 45, 401-405.
Wood, L.N. and Smith, G.H. (2007). Perceptions of difficulty. Research report, University of Technology, Sydney, Broadway, Australia.
Yara, P.O. (2009). Students attitude toward mathematics and academic achievement in some selected secondary schools in Southwestern Nigeria. European Journal of Scientific Research, 36(3), 336-341.

28
Social and ManageMent ReSeaRch JouRnal
Yudariah, M.Y. and Roselainy A.R. (2001). Mathematics education at Universiti Teknologi Malaysia (UTM): Learning from experience. Jurnal Teknologi, 34(E), 9-24.
Zhang, B. (2003). Using student-centred teaching in calculus. The Chinese Papers. 100-103. Retrieved on December 10, 2009, from http://sydney.edu.au/science/uniserve_science/pubs/china/vol2/biaozhang.pdf

29
Attitudes And PercePtions of university students towArds cAlculus
Appendix 1
QueSTIonnAIRe I on CALCuLuS CouRSeS And Me
name:
Student no:
(A) Please circle where applicable.
1. Gender:
1 2 Male Female
(B) Please tick (√) in the appropriate column.
Strongly Strongly Disagree Disagree Neutral Agree Agree –––––––––—— ———— ———— ———1. I would like to continue my Calculus learning in an advanced course. –––––—— ———— ———— ———— —
2. I feel that Calculus will be useful to me in my future profession. ––––––—— ———— ———— ———— — 3. The thought of being enrolled in a Calculus course makes me nervous. ––––––––— ———— ———— ———— — 4. Calculus seems very mysterious to me. –––––––———— ———— ———— ———
5. Most people would benefit from taking a Calculus course. –––———— ———— ———— ———— —
6. I have difficulty seeing how Calculus is related to my field of study. ––––——— ———— ———— ———— — 7. I see being enrolled in a Calculus course as a very pleasant experience. –———— ———— ———— ———— —
8. Calculus is not really useful because it tells me what I already know anyway. ––———— ———— ———— ———— —
9. I wish that I could avoid taking my Calculus course. ———— ———— ———— ———— ——

30
Social and ManageMent ReSeaRch JouRnal
10. Calculus is too Calculus-oriented to be of much use to me in the future. ———— ———— ———— ———— ——
11. I get upset at the thought of enrolling in another Calculus course. ——— ———— ———— ———— ——
12. I feel frightened when I have to deal with mathematical formulas. ––—— ———— ———— ———— ——
13. I am excited at the prospect of actually using Calculus in my future job. –— ———— ———— ———— ————
14. Studying Calculus is a waste of time. –— ———— ———— ———— ————
15. Calculus thinking can play a useful role in everyday life. ———— ———— ———— ———— —
16. Dealing with numbers makes me uneasy. –———— ———— ———— ———— —
17. Calculus is too complicated for me to use effectively. ——— ———— ———— ———— ——
18. Calculus thinking will one day be as necessary for efficient citizenship as the ability to read and write. ———— ———— ———— ———— —— 19. Calculus will be useful to me in comparing the relative merits of different objects, methods, programs, etc. ——— ———— ———— ———— ——
20. Calculus training is relevant to my performance in my field of study. ———— ———— ———— ———— —
Thank you for your cooperation!

31
Attitudes And PercePtions of university students towArds cAlculus
Appendix 2(a)Questionnaire II (TASK I)
Name :
Student No. :
Gender :
Race :
Home Language :
Section A : Students’ perception of the difficulty BEFORE attempting task.
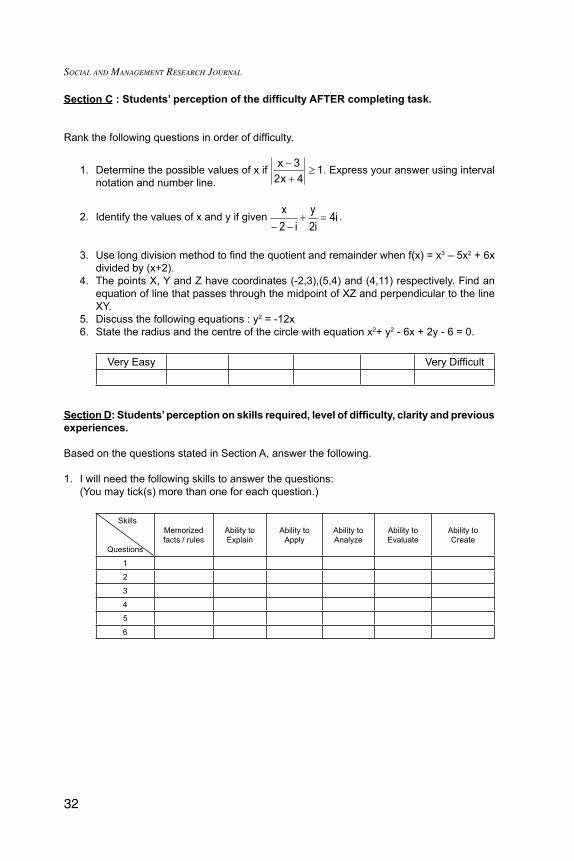
Rank the following questions in order of difficulty.
1. Determine the possible values of x if
20
Appendix 2(a)
Questionnaire II (TASK I)
Name :
Student No. :
Gender :
Race :
Home Language :
Section A :Students’perceptionofthedifficultyBEFOREattemptingtask.
Rank the following questions in order of difficulty.
1. Determine the possible values of x if 14x2
3x≥
+− . Express your answer using interval
notation and number line.
2. Identify the values of x and y if given i4i2
y
i2
x=+
−−.
3. Use long division method to find the quotient and remainder when f(x) = x3 – 5x2 + 6x divided by (x+2).
4. The points X, Y and Z have coordinates (-2,3),(5,4) and (4,11) respectively. Find an equation of line that passes through the midpoint of XZ and perpendicular to the line XY.
5. Discuss the following equations : y2 = -12x6. State the radius and the centre of the circle with equation x2+ y2 - 6x + 2y - 6 = 0.
Very easy Very Difficult
SectionB: Answer the following questions.
1. Determine the possible values of x if 14x2
3x≥
+− . Express your answer using interval
notation and number line.
2. Identify the values of x and y if given i4i2
y
i2
x=+
−−.
3. Use long division method to find the quotient and remainder when f(x) = x3 – 5x2 + 6x divided by (x+2).
4. The points X, Y and Z have coordinates (-2,3),(5,4) and (4,11) respectively. Find an equation of line that passes through the midpoint of XZ and perpendicular to the line XY.
5. Discuss the following equations : y2 = -12x6. State the radius and the centre of the circle with equation x2+ y2 - 6x + 2y - 6 = 0.
. Express your answer using interval notation and number line.
2. Identify the values of x and y if given
20
Appendix 2(a)
Questionnaire II (TASK I)
Name :
Student No. :
Gender :
Race :
Home Language :
Section A :Students’perceptionofthedifficultyBEFOREattemptingtask.
Rank the following questions in order of difficulty.
1. Determine the possible values of x if 14x2
3x≥
+− . Express your answer using interval
notation and number line.
2. Identify the values of x and y if given i4i2
y
i2
x=+
−−.
3. Use long division method to find the quotient and remainder when f(x) = x3 – 5x2 + 6x divided by (x+2).
4. The points X, Y and Z have coordinates (-2,3),(5,4) and (4,11) respectively. Find an equation of line that passes through the midpoint of XZ and perpendicular to the line XY.
5. Discuss the following equations : y2 = -12x6. State the radius and the centre of the circle with equation x2+ y2 - 6x + 2y - 6 = 0.
Very easy Very Difficult
SectionB: Answer the following questions.
1. Determine the possible values of x if 14x2
3x≥
+− . Express your answer using interval
notation and number line.
2. Identify the values of x and y if given i4i2
y
i2
x=+
−−.
3. Use long division method to find the quotient and remainder when f(x) = x3 – 5x2 + 6x divided by (x+2).
4. The points X, Y and Z have coordinates (-2,3),(5,4) and (4,11) respectively. Find an equation of line that passes through the midpoint of XZ and perpendicular to the line XY.
5. Discuss the following equations : y2 = -12x6. State the radius and the centre of the circle with equation x2+ y2 - 6x + 2y - 6 = 0.
. 3. Use long division method to find the quotient and remainder when f(x) = x3 – 5x2 + 6x
divided by (x+2).
4. The points X, Y and Z have coordinates (–2,3),(5,4) and (4,11) respectively. Find an equation of line that passes through the midpoint of XZ and perpendicular to the line XY.
5. Discuss the following equations : y2 = –12x 6. State the radius and the centre of the circle with equation x2 + y2 – 6x + 2y – 6 = 0.
Very easy Very Difficult
Section B: Answer the following questions.
1. Determine the possible values of x if
20
Appendix 2(a)
Questionnaire II (TASK I)
Name :
Student No. :
Gender :
Race :
Home Language :
Section A :Students’perceptionofthedifficultyBEFOREattemptingtask.
Rank the following questions in order of difficulty.
1. Determine the possible values of x if 14x2
3x≥
+− . Express your answer using interval
notation and number line.
2. Identify the values of x and y if given i4i2
y
i2
x=+
−−.
3. Use long division method to find the quotient and remainder when f(x) = x3 – 5x2 + 6x divided by (x+2).
4. The points X, Y and Z have coordinates (-2,3),(5,4) and (4,11) respectively. Find an equation of line that passes through the midpoint of XZ and perpendicular to the line XY.
5. Discuss the following equations : y2 = -12x6. State the radius and the centre of the circle with equation x2+ y2 - 6x + 2y - 6 = 0.
Very easy Very Difficult
SectionB: Answer the following questions.
1. Determine the possible values of x if 14x2
3x≥
+− . Express your answer using interval
notation and number line.
2. Identify the values of x and y if given i4i2
y
i2
x=+
−−.
3. Use long division method to find the quotient and remainder when f(x) = x3 – 5x2 + 6x divided by (x+2).
4. The points X, Y and Z have coordinates (-2,3),(5,4) and (4,11) respectively. Find an equation of line that passes through the midpoint of XZ and perpendicular to the line XY.
5. Discuss the following equations : y2 = -12x6. State the radius and the centre of the circle with equation x2+ y2 - 6x + 2y - 6 = 0.
. Express your answer using interval notation and number line.
2. Identify the values of x and y if given
20
Appendix 2(a)
Questionnaire II (TASK I)
Name :
Student No. :
Gender :
Race :
Home Language :
Section A :Students’perceptionofthedifficultyBEFOREattemptingtask.
Rank the following questions in order of difficulty.
1. Determine the possible values of x if 14x2
3x≥
+− . Express your answer using interval
notation and number line.
2. Identify the values of x and y if given i4i2
y
i2
x=+
−−.
3. Use long division method to find the quotient and remainder when f(x) = x3 – 5x2 + 6x divided by (x+2).
4. The points X, Y and Z have coordinates (-2,3),(5,4) and (4,11) respectively. Find an equation of line that passes through the midpoint of XZ and perpendicular to the line XY.
5. Discuss the following equations : y2 = -12x6. State the radius and the centre of the circle with equation x2+ y2 - 6x + 2y - 6 = 0.
Very easy Very Difficult
SectionB: Answer the following questions.
1. Determine the possible values of x if 14x2
3x≥
+− . Express your answer using interval
notation and number line.
2. Identify the values of x and y if given i4i2
y
i2
x=+
−−.
3. Use long division method to find the quotient and remainder when f(x) = x3 – 5x2 + 6x divided by (x+2).
4. The points X, Y and Z have coordinates (-2,3),(5,4) and (4,11) respectively. Find an equation of line that passes through the midpoint of XZ and perpendicular to the line XY.
5. Discuss the following equations : y2 = -12x6. State the radius and the centre of the circle with equation x2+ y2 - 6x + 2y - 6 = 0.
. 3. Use long division method to find the quotient and remainder when f(x) = x3 – 5x2 + 6x
divided by (x+2). 4. The points X, Y and Z have coordinates (–2,3),(5,4) and (4,11) respectively. Find an
equation of line that passes through the midpoint of XZ and perpendicular to the line XY.
5. Discuss the following equations : y2 = –12x 6. State the radius and the centre of the circle with equation x2 + y2 – 6x + 2y – 6 = 0.
32
Social and ManageMent ReSeaRch JouRnal
Section C : Students’ perception of the difficulty AFTER completing task.
Rank the following questions in order of difficulty.
1. Determine the possible values of x if
20
Appendix 2(a)
Questionnaire II (TASK I)
Name :
Student No. :
Gender :
Race :
Home Language :
Section A :Students’perceptionofthedifficultyBEFOREattemptingtask.
Rank the following questions in order of difficulty.
1. Determine the possible values of x if 14x2
3x≥
+− . Express your answer using interval
notation and number line.
2. Identify the values of x and y if given i4i2
y
i2
x=+
−−.
3. Use long division method to find the quotient and remainder when f(x) = x3 – 5x2 + 6x divided by (x+2).
4. The points X, Y and Z have coordinates (-2,3),(5,4) and (4,11) respectively. Find an equation of line that passes through the midpoint of XZ and perpendicular to the line XY.
5. Discuss the following equations : y2 = -12x6. State the radius and the centre of the circle with equation x2+ y2 - 6x + 2y - 6 = 0.
Very easy Very Difficult
SectionB: Answer the following questions.
1. Determine the possible values of x if 14x2
3x≥
+− . Express your answer using interval
notation and number line.
2. Identify the values of x and y if given i4i2
y
i2
x=+
−−.
3. Use long division method to find the quotient and remainder when f(x) = x3 – 5x2 + 6x divided by (x+2).
4. The points X, Y and Z have coordinates (-2,3),(5,4) and (4,11) respectively. Find an equation of line that passes through the midpoint of XZ and perpendicular to the line XY.
5. Discuss the following equations : y2 = -12x6. State the radius and the centre of the circle with equation x2+ y2 - 6x + 2y - 6 = 0.
. Express your answer using interval notation and number line.
2. Identify the values of x and y if given
20
Appendix 2(a)
Questionnaire II (TASK I)
Name :
Student No. :
Gender :
Race :
Home Language :
Section A :Students’perceptionofthedifficultyBEFOREattemptingtask.
Rank the following questions in order of difficulty.
1. Determine the possible values of x if 14x2
3x≥
+− . Express your answer using interval
notation and number line.
2. Identify the values of x and y if given i4i2
y
i2
x=+
−−.
3. Use long division method to find the quotient and remainder when f(x) = x3 – 5x2 + 6x divided by (x+2).
4. The points X, Y and Z have coordinates (-2,3),(5,4) and (4,11) respectively. Find an equation of line that passes through the midpoint of XZ and perpendicular to the line XY.
5. Discuss the following equations : y2 = -12x6. State the radius and the centre of the circle with equation x2+ y2 - 6x + 2y - 6 = 0.
Very easy Very Difficult
SectionB: Answer the following questions.
1. Determine the possible values of x if 14x2
3x≥
+− . Express your answer using interval
notation and number line.
2. Identify the values of x and y if given i4i2
y
i2
x=+
−−.
3. Use long division method to find the quotient and remainder when f(x) = x3 – 5x2 + 6x divided by (x+2).
4. The points X, Y and Z have coordinates (-2,3),(5,4) and (4,11) respectively. Find an equation of line that passes through the midpoint of XZ and perpendicular to the line XY.
5. Discuss the following equations : y2 = -12x6. State the radius and the centre of the circle with equation x2+ y2 - 6x + 2y - 6 = 0.
. 3. Use long division method to find the quotient and remainder when f(x) = x3 – 5x2 + 6x
divided by (x+2). 4. The points X, Y and Z have coordinates (-2,3),(5,4) and (4,11) respectively. Find an
equation of line that passes through the midpoint of XZ and perpendicular to the line XY.
5. Discuss the following equations : y2 = -12x 6. State the radius and the centre of the circle with equation x2+ y2 - 6x + 2y - 6 = 0.
Very Easy Very Difficult
Section d: Students’ perception on skills required, level of difficulty, clarity and previous experiences.
Based on the questions stated in Section A, answer the following.
1. I will need the following skills to answer the questions: (You may tick(s) more than one for each question.)
Skills
Questions
Memorized facts / rules
Ability to Explain
Ability to Apply
Ability to Analyze
Ability to Evaluate
Ability to Create
1
2
3
4
5
6

33
Attitudes And PercePtions of university students towArds cAlculus
2. I would rate the question as : (Please tick one answer for each question.)
Scale
Questions
Very easy
1
Easy
2
Moderate
3
Difficult
4
Very Difficult
5
1
2
3
4
5
6
3. The language of the question is : (Please tick one answer for each question.)
Scale
Questions
Very clear
1
Clear
2
Moderate
3
Hard
4
Very hard to understand
5
1
2
3
4
5
6
4. The question is : (Please tick one answer for each question.)
Scale
Questions
Very easy to understand
1
Easy
2
Moderate
3
Hard
4
Very hard to understand
5
1
2
3
4
5
6
5. I have done the similar questions before. (Please tick one answer for each question.)
Answer
Questions
No
0
Yes
1
1
2
3
4
5
6
34
Social and ManageMent ReSeaRch JouRnal
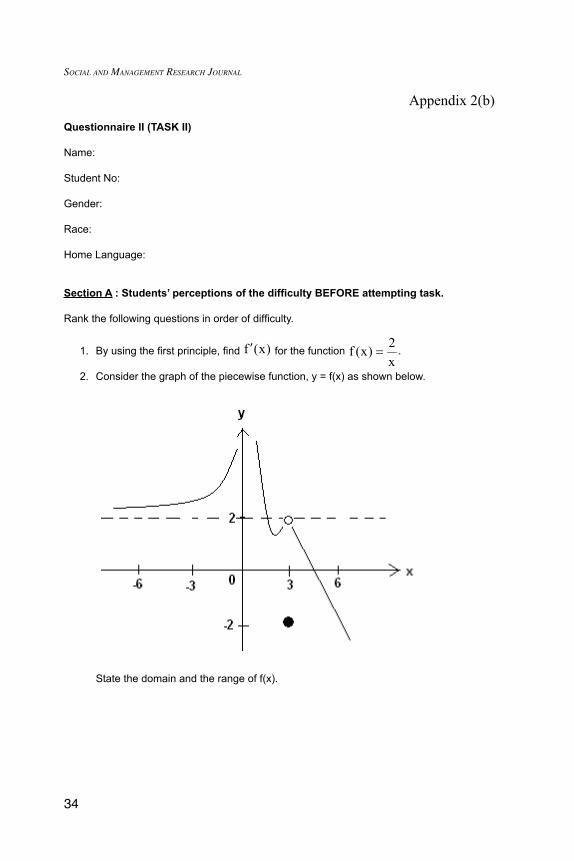
Appendix 2(b)
Questionnaire II (TASK II)
Name:
Student No:
Gender:
Race:
Home Language:
Section A : Students’ perceptions of the difficulty BEFORE attempting task.
Rank the following questions in order of difficulty.
1. By using the first principle, find
23
Appendix 2(b)Questionnaire II (TASK II)
Name:
Student No:
Gender:
Race:
Home Language:
Section A :Students’perceptionsofthedifficultyBEFOREattemptingtask.
Rank the following questions in order of difficulty.
1. By using the first principle, find )x(f ′ for the functionx2)x(f = .
2. Consider the graph of the piecewise function, y = f(x) as shown below.
State the domain and the range of f(x).
3. Given the function
>
≤<+=
3x,6
3x0,1x2)x(g
Discuss the continuity at x = 3.
4. Determine the slope of the line that is tangent to the curve 3y5x2 2 =− at the point (1, 0).
5. Find the equation of the tangent line to the curve 1x3y6 22 =− at the point (1, 3).
6. Evaluate
+−
→ 2x4xlim
2
2x.
for the function
23
Appendix 2(b)Questionnaire II (TASK II)
Name:
Student No:
Gender:
Race:
Home Language:
Section A :Students’perceptionsofthedifficultyBEFOREattemptingtask.
Rank the following questions in order of difficulty.
1. By using the first principle, find )x(f ′ for the functionx2)x(f = .
2. Consider the graph of the piecewise function, y = f(x) as shown below.
State the domain and the range of f(x).
3. Given the function
>
≤<+=
3x,6
3x0,1x2)x(g
Discuss the continuity at x = 3.
4. Determine the slope of the line that is tangent to the curve 3y5x2 2 =− at the point (1, 0).
5. Find the equation of the tangent line to the curve 1x3y6 22 =− at the point (1, 3).
6. Evaluate
+−
→ 2x4xlim
2
2x.
.
2. Consider the graph of the piecewise function, y = f(x) as shown below.
23
Appendix 2(b)Questionnaire II (TASK II)
Name:
Student No:
Gender:
Race:
Home Language:
Section A :Students’perceptionsofthedifficultyBEFOREattemptingtask.
Rank the following questions in order of difficulty.
1. By using the first principle, find )x(f ′ for the functionx2)x(f = .
2. Consider the graph of the piecewise function, y = f(x) as shown below.
State the domain and the range of f(x).
3. Given the function
>
≤<+=
3x,6
3x0,1x2)x(g
Discuss the continuity at x = 3.
4. Determine the slope of the line that is tangent to the curve 3y5x2 2 =− at the point (1, 0).
5. Find the equation of the tangent line to the curve 1x3y6 22 =− at the point (1, 3).
6. Evaluate
+−
→ 2x4xlim
2
2x.
State the domain and the range of f(x).
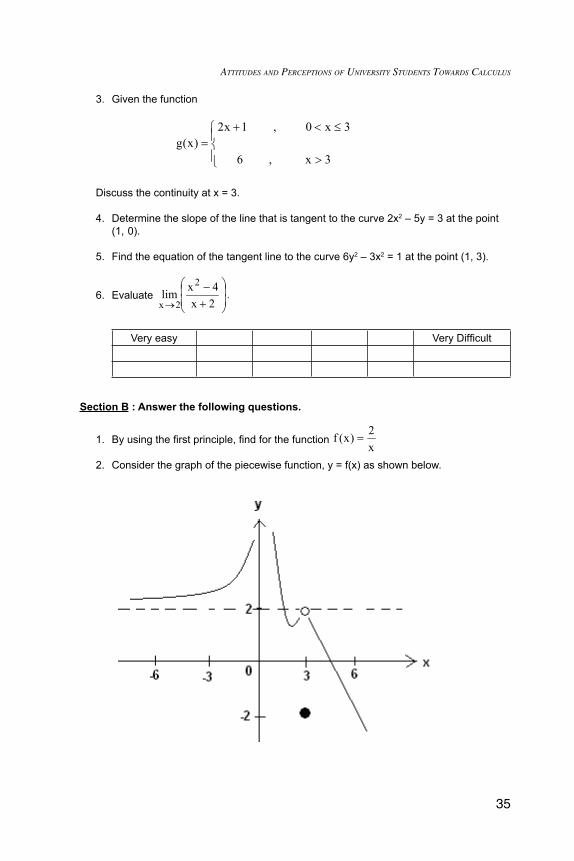
35
Attitudes And PercePtions of university students towArds cAlculus
3. Given the function
23
Appendix 2(b)Questionnaire II (TASK II)
Name:
Student No:
Gender:
Race:
Home Language:
Section A :Students’perceptionsofthedifficultyBEFOREattemptingtask.
Rank the following questions in order of difficulty.
1. By using the first principle, find )x(f ′ for the functionx2)x(f = .
2. Consider the graph of the piecewise function, y = f(x) as shown below.
State the domain and the range of f(x).
3. Given the function
>
≤<+=
3x,6
3x0,1x2)x(g
Discuss the continuity at x = 3.
4. Determine the slope of the line that is tangent to the curve 3y5x2 2 =− at the point (1, 0).
5. Find the equation of the tangent line to the curve 1x3y6 22 =− at the point (1, 3).
6. Evaluate
+−
→ 2x4xlim
2
2x.
Discuss the continuity at x = 3.
4. Determine the slope of the line that is tangent to the curve 2x2 – 5y = 3 at the point (1, 0).
5. Find the equation of the tangent line to the curve 6y2 – 3x2 = 1 at the point (1, 3).
6. Evaluate
24
Very easy Very Difficult
SectionB : Answer the following questions.
1. By using the first principle, find )x(f ′ for the functionx2)x(f = .
2. Consider the graph of the piecewise function, y = f(x) as shown below.
State the domain and the range of f(x).
3. Given the function
>
≤<+=
3x,6
3x0,1x2)x(g
Discuss the continuity at x = 3.
4. Determine the slope of the line that is tangent to the curve 3y5x2 2 =− at the point (1, 0).
5. Find the equation of the tangent line to the curve x1x3y6 22 −=− at the point (2, 3).
6. Evaluate
+−
→ 2x4xlim
2
2x.
Section C:Students’perceptionofthedifficultyAFTERcompletingtask.
1. Rank the following questions in order of difficulty.
1. By using the first principle, find )x(f ′ for the functionx2)x(f = .
2. Consider the graph of the piecewise function, y = f(x) as shown below.
Very easy Very Difficult
Section B : Answer the following questions.
1. By using the first principle, find for the function
23
Appendix 2(b)Questionnaire II (TASK II)
Name:
Student No:
Gender:
Race:
Home Language:
Section A :Students’perceptionsofthedifficultyBEFOREattemptingtask.
Rank the following questions in order of difficulty.
1. By using the first principle, find )x(f ′ for the functionx2)x(f = .
2. Consider the graph of the piecewise function, y = f(x) as shown below.
State the domain and the range of f(x).
3. Given the function
>
≤<+=
3x,6
3x0,1x2)x(g
Discuss the continuity at x = 3.
4. Determine the slope of the line that is tangent to the curve 3y5x2 2 =− at the point (1, 0).
5. Find the equation of the tangent line to the curve 1x3y6 22 =− at the point (1, 3).
6. Evaluate
+−
→ 2x4xlim
2
2x.
2. Consider the graph of the piecewise function, y = f(x) as shown below.
24
Very easy Very Difficult
SectionB : Answer the following questions.
1. By using the first principle, find )x(f ′ for the functionx2)x(f = .
2. Consider the graph of the piecewise function, y = f(x) as shown below.
State the domain and the range of f(x).
3. Given the function
>
≤<+=
3x,6
3x0,1x2)x(g
Discuss the continuity at x = 3.
4. Determine the slope of the line that is tangent to the curve 3y5x2 2 =− at the point (1, 0).
5. Find the equation of the tangent line to the curve x1x3y6 22 −=− at the point (2, 3).
6. Evaluate
+−
→ 2x4xlim
2
2x.
Section C:Students’perceptionofthedifficultyAFTERcompletingtask.
1. Rank the following questions in order of difficulty.
1. By using the first principle, find )x(f ′ for the functionx2)x(f = .
2. Consider the graph of the piecewise function, y = f(x) as shown below.

36
Social and ManageMent ReSeaRch JouRnal
State the domain and the range of f(x). 3. Given the function
23
Appendix 2(b)Questionnaire II (TASK II)
Name:
Student No:
Gender:
Race:
Home Language:
Section A :Students’perceptionsofthedifficultyBEFOREattemptingtask.
Rank the following questions in order of difficulty.
1. By using the first principle, find )x(f ′ for the functionx2)x(f = .
2. Consider the graph of the piecewise function, y = f(x) as shown below.
State the domain and the range of f(x).
3. Given the function
>
≤<+=
3x,6
3x0,1x2)x(g
Discuss the continuity at x = 3.
4. Determine the slope of the line that is tangent to the curve 3y5x2 2 =− at the point (1, 0).
5. Find the equation of the tangent line to the curve 1x3y6 22 =− at the point (1, 3).
6. Evaluate
+−
→ 2x4xlim
2
2x.
Discuss the continuity at x = 3.
4. Determine the slope of the line that is tangent to the curve 2x2 – 5y = 3 at the point (1, 0).
5. Find the equation of the tangent line to the curve 6y2 – 3x2 = 1 – x at the point (2, 3).
6. Evaluate
24
Very easy Very Difficult
SectionB : Answer the following questions.
1. By using the first principle, find )x(f ′ for the functionx2)x(f = .
2. Consider the graph of the piecewise function, y = f(x) as shown below.
State the domain and the range of f(x).
3. Given the function
>
≤<+=
3x,6
3x0,1x2)x(g
Discuss the continuity at x = 3.
4. Determine the slope of the line that is tangent to the curve 3y5x2 2 =− at the point (1, 0).
5. Find the equation of the tangent line to the curve x1x3y6 22 −=− at the point (2, 3).
6. Evaluate
+−
→ 2x4xlim
2
2x.
Section C:Students’perceptionofthedifficultyAFTERcompletingtask.
1. Rank the following questions in order of difficulty.
1. By using the first principle, find )x(f ′ for the functionx2)x(f = .
2. Consider the graph of the piecewise function, y = f(x) as shown below.
Section C: Students’ perception of the difficulty AFTER completing task.
Rank the following questions in order of difficulty.
1. By using the first principle, find
23
Appendix 2(b)Questionnaire II (TASK II)
Name:
Student No:
Gender:
Race:
Home Language:
Section A :Students’perceptionsofthedifficultyBEFOREattemptingtask.
Rank the following questions in order of difficulty.
1. By using the first principle, find )x(f ′ for the functionx2)x(f = .
2. Consider the graph of the piecewise function, y = f(x) as shown below.
State the domain and the range of f(x).
3. Given the function
>
≤<+=
3x,6
3x0,1x2)x(g
Discuss the continuity at x = 3.
4. Determine the slope of the line that is tangent to the curve 3y5x2 2 =− at the point (1, 0).
5. Find the equation of the tangent line to the curve 1x3y6 22 =− at the point (1, 3).
6. Evaluate
+−
→ 2x4xlim
2
2x.
for the function
23
Appendix 2(b)Questionnaire II (TASK II)
Name:
Student No:
Gender:
Race:
Home Language:
Section A :Students’perceptionsofthedifficultyBEFOREattemptingtask.
Rank the following questions in order of difficulty.
1. By using the first principle, find )x(f ′ for the functionx2)x(f = .
2. Consider the graph of the piecewise function, y = f(x) as shown below.
State the domain and the range of f(x).
3. Given the function
>
≤<+=
3x,6
3x0,1x2)x(g
Discuss the continuity at x = 3.
4. Determine the slope of the line that is tangent to the curve 3y5x2 2 =− at the point (1, 0).
5. Find the equation of the tangent line to the curve 1x3y6 22 =− at the point (1, 3).
6. Evaluate
+−
→ 2x4xlim
2
2x.
.
2. Consider the graph of the piecewise function, y = f(x) as shown below.
24
Very easy Very Difficult
SectionB : Answer the following questions.
1. By using the first principle, find )x(f ′ for the functionx2)x(f = .
2. Consider the graph of the piecewise function, y = f(x) as shown below.
State the domain and the range of f(x).
3. Given the function
>
≤<+=
3x,6
3x0,1x2)x(g
Discuss the continuity at x = 3.
4. Determine the slope of the line that is tangent to the curve 3y5x2 2 =− at the point (1, 0).
5. Find the equation of the tangent line to the curve x1x3y6 22 −=− at the point (2, 3).
6. Evaluate
+−
→ 2x4xlim
2
2x.
Section C:Students’perceptionofthedifficultyAFTERcompletingtask.
1. Rank the following questions in order of difficulty.
1. By using the first principle, find )x(f ′ for the functionx2)x(f = .
2. Consider the graph of the piecewise function, y = f(x) as shown below.
State the domain and the range of f(x).
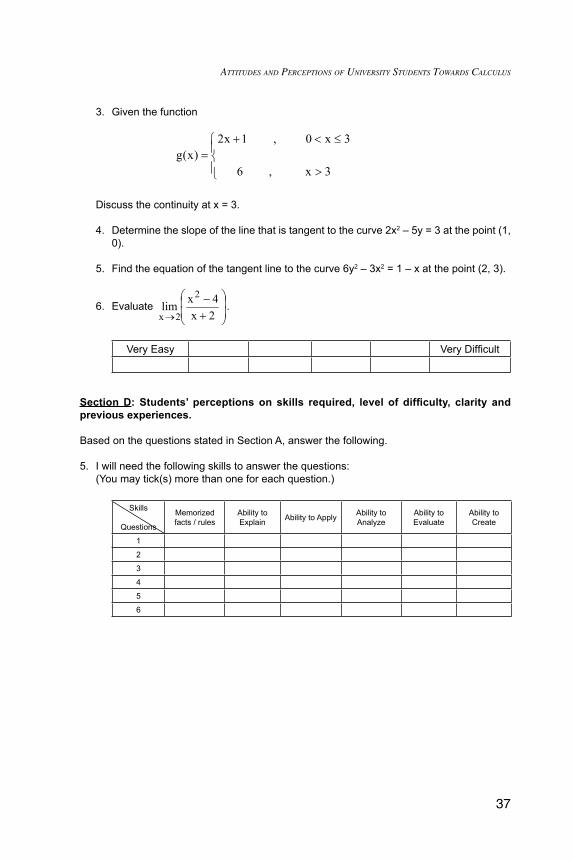
37
Attitudes And PercePtions of university students towArds cAlculus
3. Given the function
23
Appendix 2(b)Questionnaire II (TASK II)
Name:
Student No:
Gender:
Race:
Home Language:
Section A :Students’perceptionsofthedifficultyBEFOREattemptingtask.
Rank the following questions in order of difficulty.
1. By using the first principle, find )x(f ′ for the functionx2)x(f = .
2. Consider the graph of the piecewise function, y = f(x) as shown below.
State the domain and the range of f(x).
3. Given the function
>
≤<+=
3x,6
3x0,1x2)x(g
Discuss the continuity at x = 3.
4. Determine the slope of the line that is tangent to the curve 3y5x2 2 =− at the point (1, 0).
5. Find the equation of the tangent line to the curve 1x3y6 22 =− at the point (1, 3).
6. Evaluate
+−
→ 2x4xlim
2
2x.
Discuss the continuity at x = 3.
4. Determine the slope of the line that is tangent to the curve 2x2 – 5y = 3 at the point (1, 0).
5. Find the equation of the tangent line to the curve 6y2 – 3x2 = 1 – x at the point (2, 3).
6. Evaluate
24
Very easy Very Difficult
SectionB : Answer the following questions.
1. By using the first principle, find )x(f ′ for the functionx2)x(f = .
2. Consider the graph of the piecewise function, y = f(x) as shown below.
State the domain and the range of f(x).
3. Given the function
>
≤<+=
3x,6
3x0,1x2)x(g
Discuss the continuity at x = 3.
4. Determine the slope of the line that is tangent to the curve 3y5x2 2 =− at the point (1, 0).
5. Find the equation of the tangent line to the curve x1x3y6 22 −=− at the point (2, 3).
6. Evaluate
+−
→ 2x4xlim
2
2x.
Section C:Students’perceptionofthedifficultyAFTERcompletingtask.
1. Rank the following questions in order of difficulty.
1. By using the first principle, find )x(f ′ for the functionx2)x(f = .
2. Consider the graph of the piecewise function, y = f(x) as shown below.
.
Very Easy Very Difficult
Section d: Students’ perceptions on skills required, level of difficulty, clarity and previous experiences.
Based on the questions stated in Section A, answer the following.
5. I will need the following skills to answer the questions: (You may tick(s) more than one for each question.)
Skills
Questions
Memorized facts / rules
Ability to Explain Ability to Apply Ability to
AnalyzeAbility to Evaluate
Ability to Create
1
2
3
4
5
6
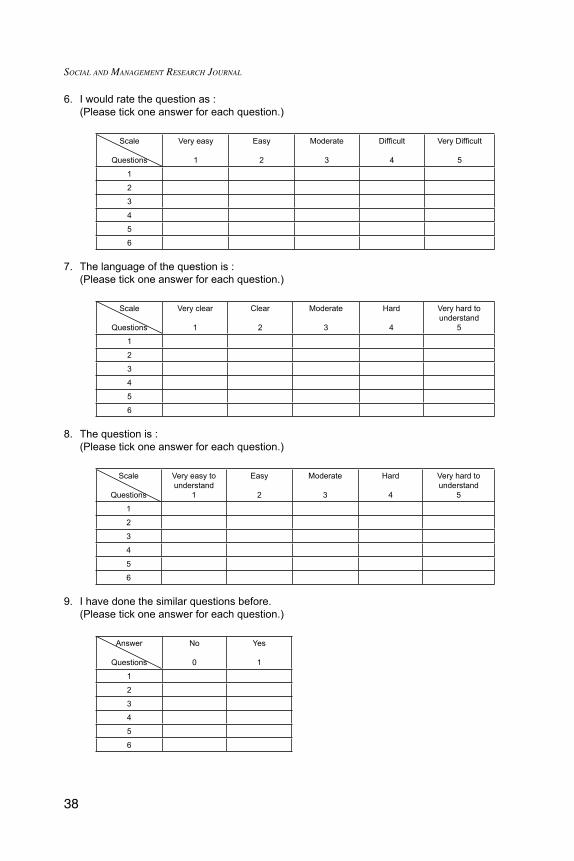
38
Social and ManageMent ReSeaRch JouRnal
6. I would rate the question as : (Please tick one answer for each question.)
Scale
Questions
Very easy
1
Easy
2
Moderate
3
Difficult
4
Very Difficult
5
1
2
3
4
5
6
7. The language of the question is : (Please tick one answer for each question.)
Scale
Questions
Very clear
1
Clear
2
Moderate
3
Hard
4
Very hard to understand
5
1
2
3
4
5
6
8. The question is : (Please tick one answer for each question.)
Scale
Questions
Very easy to understand
1
Easy
2
Moderate
3
Hard
4
Very hard to understand
5
1
2
3
4
5
6
9. I have done the similar questions before. (Please tick one answer for each question.)
Answer
Questions
No
0
Yes
1
1
2
3
4
5
6

39
Attitudes And PercePtions of university students towArds cAlculus
Appendix 3
Questionnaire III
QueSTIonnAIRe
Dear Lecturers,
This questionnaire is designed to gather the information on lecturers’ perceptions on Calculus. The findings of this research will be used to generate ideas to overcome the problems in Calculus. As such, your input in this research is very important and your kind cooperation to complete the questionnaire is very much needed.
All the information contributed will be regarded with the highest esteem and confidentiality is assured. Your participation and cooperation in the survey is deeply appreciated. We will be most grateful if you can send the completed questionnaire to us.
Thank you.
LeCTuReR’S PeRCePTIon on STudenTS’ CALCuLuS LeARnIng
1. What do you think of your students’ Calculus understanding? 2. Do the students face difficulty in learning Calculus?
If yes, what are the problems normally faced by the students? If no, which aspect of Calculus the students like most?
3. What is your suggestion to further improve students’ performance in Calculus?
ThAnK you foR youR KInd CooPeRATIon!