Embed Size (px)
Citation preview


Dengue Bulletin – Volume 38, 2014 i
Contents
Acknowledgements .................................................................................................. iii
Preface ..................................................................................................................... v
1. Epidemiological importance of container pupal index (CPI), for vector surveillance and control of dengue in national capital territory (NCT) – Delhi, India ................................................................................................................1J Nandi, Aditya Prasad Dash, PK Dutta, AC Dhariwal
2. Pattern of dengue serotypes in four provinces of northern Thailand from 2003–2012 ....................................................................................................11Punnarai Veeraseatakul, Sawalee Saosathan and Salakchit Chutipongvivate
3. Estimation of the adjustment factor for hospitalized clinical cases diagnosed and tested for dengue in Madurai, Tamil Nadu (India) ....................20Brij KishoreTyagi, Shanmugavel Karthiga, ChellaswamyVidya, Narendra KArora, Deoki Nandan, Yara A Halasa, Jhansi Charles, N Mohan, Poovazhagi Varadarajan, T Mariappan, P Philip Samuel, R Paramasivan, S Vivek Adhish, Mukul Gaba, R T Porkaipandianh and Donald S Shepard
4. Dengue vectors survey at Punjab University, Lahore, Pakistan, January 2012 – April 2014 ..............................................................................33Muhammad Saeed Akhtar, Ayesha Aithetasham, Mehwish Iqtedar, Nasim Begum and Muhammad Akhtar
5. Trends in dengue during the periods 2002–2004 and 2010–2012 in a tertiary care setting in Trivandrum, Kerala, India ..............................................43Henna AS, Ijas Ahmed K, Harilal SL, Saritha N, Ramani BaiJ T, Zinia T Nujum
6. Evaluation of the efficacy of thermal fogging applied in closed premises on dengue vector Aedes aegypti in Malaysia ........................................................54Nurulhusna AH, Khadijah K, Khadri MS, Roziah A,Muhamad-Azim MK, Mahirah MN, Khairul-Asuad M, Ummi Kalthom, S and Lee HL
7. Civil-military cooperation (CIMIC) for an emergency operation against a dengue outbreak in the western province, Sri Lanka .......................................64HA Tissera, PC Samaraweera, BDW Jayamanne, WCD Botheju, NWAN Wijesekara, MPPU Chulasiri, MDS Janaki, KLNSK De Alwis, P Palihawadana

ii Dengue Bulletin – Volume 38, 2014
8. Dengue in South Asian sub-continent: how well have the surveillance systems done? ................................................................................................78Ananda Amarasinghe, Anil K Bhola, Scott B Halstead
9. Evaluation of sensitivity and specificity of commercially available dengue rapid test kit in two hospitals in Colombo, Sri Lanka .......................................84Hasitha A Tissera, Dinindu P Kaluarachchi, Thilini D Jayasena, AnandaAmarasinghe, Aravinda M de Silva, BuddikaWeerakoon, SunethraGunasena, Jayantha S D K Weeraman, Duane Gubler, Annelies Wilder-Smith, Paba Palihawadana
10. Prevalence of dengue vector in relation to dengue virus infection in central region of Nepal ...................................................................................96Bijaya Gaire, Komal Raj Rijal, Biswas Neupane, Pravin Paudyal, Ishan Gautam, Megha Raj Banjara, Kouichi Morita and Basu Dev Pandey
11. The first tetravalent dengue vaccine is poised to combat dengue...................108Usa Thisyakorn, Maria Rosario Capeding & Sri Rezeki Hadinegoro
12. Trends of imported dengue fever cases in Japan, 2010 to 2013 .....................113Meng Ling Moi, Akira Kotaki, Shigeru Tajima, Makiko Ikeda, Kazumi Yagasaki, Chang-kweng Lim, Hitomi Kinoshita , Eri Nakayama, Yuka Saito, Ichiro Kurane, Kazunori Oishi, Masayuki Saijo, Tomohiko Takasaki
13. Instructions for contributors ..........................................................................120

Dengue Bulletin – Volume 38, 2014 iii
AcknowledgementsThe Editor, Dengue Bulletin, World Health Organization (WHO) Regional Office for South-East Asia, gratefully thanks the following for peer reviewing manuscripts submitted for publication.
1. Baruah, Kalpana Joint Director National Vector Borne Disease Control programme Sham Nath Marg Delhi-110 054, India
2. Dash, Aditya P. Former Regional Adviser VBN 190 Dharma Vihar, Jagamara Bhubaneswar 751030, INDIA
3. Gubler, Duane J. Professor, Emerging Infectious Diseases Program Duke-NUS Graduate Medical School Singapore
4. Hoti, S.L. Scientist Regional Medical Research Centre Nehru Nagar Belgaum, India
5. Jambulingam, Purushothaman Director Vector Control Research Centre Medical Complex, Indira Nagar Puducherry-605006, India
6. Kalayanarooj, Siripen Queen Sirikit National Institute of Child Health Bangkok, Thailand
7. Mourya, D.T. Director National Institute of Virology Dr Ambedkar Road Pune-411001, India
8. Nagpal, B.N. Scientist National Institute of Malaria Research Sector 8, Dwarka New Delhi-110 077, India
9. Sharma, R.S. Additional Director National Centre for Disease Control New Delhi, India
10. Shepard, Donald S Schneider Institutes for Health Policy Brandeis University Massachusetts, USA
11. Thisyakorn, Usa Faculty of Tropical Medicine Mahidol University Bangkok 10400, Thailand
12. Tyagi, B K Scientist and Director Centre for Research in Medical Entomology Chinnachokkikulam Madurai-625002, India
13. Velayudhan, Raman Vector Ecology and Management Department of Control of Neglected Tropical Diseases (HTM/NTD) World Health Organization Geneva, Switzerland
14. Yadav, Dr Rajpal Scientist-in-Charge Vector Ecology and Management Department of Control of Neglected Tropical Diseases World Health Organization Geneva, Switzerland
The quality and scientific standing of the Dengue Bulletin is largely due to the conscientious efforts of the experts and also to the positive response of contributors to comments and suggestions.
The manuscripts were reviewed by Dr Aditya P Dash and Dr Mohamed A Jamsheed, with respect to format; content; conclusions drawn, including review of tabular and illustrative materials for clear, concise and focused presentation; and bibliographic references.


Dengue Bulletin – Volume 38, 2014 v
Preface
The ongoing spread of dengue in the WHO South-East Asia Region (SEAR) continues to be a major public health concern. Our Region contributes to more than half of the global burden of dengue. About 52% of the global population at risk resides in this Region. The disease is endemic in 10 of the 11 Member States.
Dengue cases have been regularly reported in this Region since 2000. The Region was severely hit in 2010 with more than 350 000 cases and around 2000 deaths. The number of cases in 2013 surpassed even this figure, with Member States reporting almost 400 000 cases. Five of our Member States viz. India, Indonesia,
Myanmar, Sri Lanka and Thailand are among the 30 most highly endemic countries in the world.
Up to June 2014, 76 492 cases have been reported from endemic countries in the Region with 348 deaths. As many as 35 640 cases and 316 deaths were reported from Indonesia alone during this period.
Dengue is also a major public health problem in several countries of the Western Pacific Region which surround the South-East Asia Region. Malaysia, Philippines and Singapore have reported thousands of cases this year. There are reports of dengue cases in the Pacific islands including New Caledonia, French Polynesia and the Solomon islands.
To combat this rapidly growing viral infection, we must keep pace with the changing epidemiology of dengue, especially the multiple ecological factors that influence the spread of this disease. Being a vector-borne disease, ever increasing numbers and varieties of mosquito-breeding habitats are being created with rapid and poorly planned urbanization, globalization, consumerism, poor solid waste and water management and increasing population movement without adequate measures to prevent vector breeding. Climate change is also influencing ecology that benefits vectors.
Proper case management has helped Member States in reducing the case-fatality ratio to less than 0.5%. This is a commendable achievement. The objective now is to prevent any deaths due to dengue. Substantial research is being undertaken to improve our case management protocols and methods. Clinical trials for dengue vaccine are also in advanced stages with optimistic outcomes. Availability of an efficacious and affordable dengue vaccine shall provide a strong intervention in our fight against dengue.

vi Dengue Bulletin – Volume 38, 2014
WHO has been assiduously working through advocacy, normative functions and provision of technical support to Member States against dengue. We continue to advocate to the governments on the public health importance of vector-borne diseases, especially dengue and its control, strengthening of public health systems in Member States including capacity-building and allocation of appropriate resources.
In accordance with its mandate of disseminating scientific information, WHO – through the annual issues of Dengue Bulletin – has been providing a platform to scientists all over the world to disseminate the peer-reviewed research and best practices in different settings that can be used to improve public health response against dengue.
Dr Poonam Khetrapal SinghRegional DirectorWHO South-East Asia Region

Dengue Bulletin – Volume 38, 2014 1
Epidemiological importance of container pupal index (CPI) for vector surveillance and control of
dengue in national capital territory (NCT) – Delhi, IndiaJ Nandia#, Aditya Prasad Dashb, PK Duttac, AC Dhariwala
aDirectorate of National Vector Borne Disease Control Programme, 22 Shamnath Marg, Delhi 110054, India
bFormer Regional Adviser, WHO/SEARO, New Delhi
cEx- Associate Professor of Preventive and Social Medicine, Armed Force Medical College, Pune
Abstract
Dengue fever (DF) is endemic in National Capital Territory (NCT) Delhi. The disease vector, Aedes aegypti is deeply entrenched in urban NCT Delhi and its surrounding National Capital Region (NCR) as well. Vector population change with seasonal fluctuations of breeding indices, container index (CI) and container pupal index (CPI) were positively correlated with proportion of breeding habitats found positive for pupae as well as incidence of DF. Present communication descried the potential the breeding containers with pupa in domestic environment identifying most productive containers. This information can be used as a tool for vector surveillance. National institutions engaged in vector-borne disease control and also teaching institutions are to formulate guidelines on vectors surveillance and training module targeting potential containers. Incorporation of this tool in national strategy for dengue control will be more meaningful interventions to reduce the adult emergence in high risk localities by targeting most productive breeding containers in terms of CPI. Seasonal productive containers in domestic and peri-domestic environment for pupae require vigorous search during monsoon and post-monsoon months for elimination of productive breeding habitats. CPI and proportion of containers positive with pupae should be the basis for vector surveillance and disease control. Enormous population migration, rapid growth of urban and peri-urban areas, water storage practices, lax behavior of communities towards weekly cleaning of containers rendered NCT Delhi a high endemic zone of DF. An effective vector control method based on CPI and seasonally most productive containers are to be targeted must be taken into longitudinal vector surveillance programme to achieve objective of global strategies for dengue prevention and control.
Keywords: Dengue fever; Container index; Seasonal productivity.
#E-mail: [email protected]
Epidemiological importance of CPI for vector surveillance and control of dengue in NCT - Delhi, India
2 Dengue Bulletin – Volume 38, 2014
Introduction
Dengue fever (DF) probably was reported in India in 1872 from Calcutta (now Kolkata), West Bengal1. An epidemic of dengue hemorrhagic fever (DHF) was reported in July 1963 in Kolkata when more than 0.1 million people were affected, mostly children with 40% case fatality rate in hospital admitted DHF cases2. Dengue fever (DF) has been a major arbo-viral disease in NCT Delhi3. Outbreak of DF continued to occur since 1996 when highest number of cases and deaths were reported4. All four serotypes of DF and many genotypes including DENV-3, subtype-III, the virulent strain responsible for DHF and dengue shock syndrome, were recorded circulating in NCT Delhi and its surrounding areas5,6. An outbreak of DF in 1988 in NCT Delhi recorded 33% mortality among children admitted in hospitals7.
Following the DHF outbreak in Kolkata, a reconnaissance survey of Aedes aegypti in 1964 described perennial breeding habitats and breeding behavior in Delhi8. Transmission of DF is determined by the seasonal breeding propensity, container larval index and containers positive for pupae of Aedes aegypti9. Earlier studies in NCT Delhi were mostly based on traditional House Index (HI), Container Index and Breteau Index to measure to larval positive containers. No survey on pupal positivity of containers were conducted in NCT Delhi, hence this survey was taken up.
Anti-larval operations by source reductions during transmission months are to be organized based on containers positivity with pupae and there classification in domestic environment. The traditional House Index and Breteau Index approaches were less sensitive in controlling the DF as the indices were to measure only larvae positive containers. The pupae positive survey by the estimation of container pupal index per house would be useful in targeting source reduction and more systematic survey methodologies10.
This communication is observed on breeding habitats and seasonal productive containers in relation to positive for pupae and their implication in vector surveillance and control11.
Study area
The NCT Delhi is a narrow strip of indo-Gangetic plain, lying between 28025’ and 28053’ north latitude and 76050’ and 77022’ east longitude. The NCT Delhi is divided in 14 administrative zones implementing vector control strategies.
(1) Municipal Corporation of Delhi: 1399 sq.km.
z South Delhi Municipal Corporation comprising five zones namely South, Central, West, Nazafgarh and Delhi Cantonment.

Epidemiological importance of CPI for vector surveillance and control of dengue in NCT - Delhi, India
Dengue Bulletin – Volume 38, 2014 3
z East Delhi Municipal Corporation comprising two zones Shahdra (North) and Shahdra (South).
z North Delhi Municipal Corporation comprising six zones City, Civil Lines, S.P. Ganj, Karol Bagh, Rohini and Narela
(2) New Delhi Municipal Council : 42.74 sq. km. (Figure 1)
Besides these 14 administrative zones, seven independent agencies have also been implementing vector control strategies. These independent agencies were:
(1) Delhi Cantonment Board: 42.89 sq. km.
(2) Jawaharlal Nehru University: restricted area
Figure 1: Map showing zones under Municipal Corporation of Delhi and New Delhi Municipal Council
East Delhi Municipal Corporation
South Delhi Municipal Corporation
North Delhi Municipal Corporation
NMDC
Delhi Cantt. Zone

Epidemiological importance of CPI for vector surveillance and control of dengue in NCT - Delhi, India
4 Dengue Bulletin – Volume 38, 2014
(3) Zoological Park: restricted area
(4) Indian Institute of Technology: restricted area
(5) All India Radio: restricted area
(6) President’s Estate: restricted area
(7) Northern Railways: restricted area
NCT Delhi, in recent times, experienced a remarkable growth of population due to large scale migration mostly from rural areas of various states of the country. The metro city also witnessed a phenomenal vertical growth in residential building construction, commercial complex, shopping malls and educational institutions leading to rapid urbanization that exerted increased demand for civic amenities, particularly on water supply and solid waste disposal.
Materials and methods
Reporting and case definition: Confirmed dengue cases from all over India are reported to National Vector Borne Disease Control Programme (NVBDCP) monitoring vector-borne diseases. Patients with clinical symptoms like sudden onset of high fever, severe body ache and headache, myalgia, nausea, vomiting and rash with positive IgM in a single serum specimen were considered as confirmed dengue cases. Clinical symptoms with lower thrombocytopenia and leucopenia were also taken as confirmed cases of dengue fever. The presence of both these two criteria with hemorrhagic manifestation and deaths were taken as confirmed deaths due to dengue fever12.
Monthly surveillance of vector breeding habitats was carried out by Central Cross Checking Organization (CCCO) under NVBDCP through search of various containers both in domestic and peri-domestic human environment. Vector breeding habitats or containers were searched on weekly basis in various localities of Municipal Corporation of Delhi and New Delhi Municipal Council, Delhi including areas under seven independent agencies implementing vector control strategies as detail in the study areas of NCT-Delhi. During the two years survey (23 Months) 45 421 houses and 53 307 containers in January-February; 55 648 houses and 64 017 containers in March-April; 62 106 houses and 711 571 containers in May-June; 55 713 houses and 76 481 containers in July-August; 45 109 houses and 71 850 containers in September-October and 60 229 houses and 69 031 containers in November-December were searched. The containers positive with larvae and the containers positive with pupae were recorded.

Epidemiological importance of CPI for vector surveillance and control of dengue in NCT - Delhi, India
Dengue Bulletin – Volume 38, 2014 5
Month-wise incidence of serologically confirmed dengue cases was also recorded. Bi-monthly breeding indices for Container Index (CI) and container positive for pupae per house were recorded and canalized. CPI was derived by calculation of total number of containers positive with pupa divided by number of houses searched multiplied by 100.
Vector breeding habitats in domestic environment were classified to identify seasonal productive containers on bi-monthly basis. These were in water vapour room coolers (colloquially known as desert cooler); cement tanks; plastic drums/barrels and other big or small plastic containers; earthen pots; metal containers; tyres; flower pots trays and overhead tanks. Proportion of these containers positive with larvae and pupae were worked out on bi-monthly basis for 23 months of two years, 2012 and 2013.
Results
During 2012 and 2013, a total of 7667 cases of DF were recorded. Incidence of dengue fever was 0.05% in both January-February (4 cases) and March-April (5 cases) period, increased to 0.2% in May-June (13 cases) summer months. The incidence of DF increased from 0.2% in May-June period to 5.3% during July-August (404 cases) the monsoon months. DF reached to peak at 79.4% in September-October (6093 cases) period in post monsoon months. The incidence came down to 15.0% in November-December (1148 cases) period at the beginning of winter.
Incidence of dengue fever, CI, CPI and proportion of pupae are given in Table 1.
Table 1: Incidence of dengue fever and corresponding container indices
Months % of dengue fever CI CPI/House % Container
positive for pupae
Jan-Feb 0.05 0.03 0.02 62.5
Mar-Apr 0.05 0.3 0.1 45.8
May-June 0.2 0.6 0.6 66.7
July-Aug 5.3 5.2 4.6 64.2
Sept-Oct 79.4 3.9 4.2 67.5
Nov-Dec 15.0 0.4 0.1 24.5
Both the CI and CPI were lowest at 0.03 and 0.02 respectively in January-February. During these two months, 0.05% dengue cases were reported. The proportion of containers positive with pupae was 62.5.

Epidemiological importance of CPI for vector surveillance and control of dengue in NCT - Delhi, India
6 Dengue Bulletin – Volume 38, 2014
Both CI and CPI were 0.3 and 0.1 respectively for the period of March-April with 0.05% of dengue cases. Proportion of container positive for pupae was second lowest at 45.8 during these two months, the onset of north Indian summer. During May-June, the incidence of dengue cases increased to 0.2% as compared with 0.05% during previous four months (January-April). The CI was 0.6 and CPI 0.4 during May-June, with containers positive with pupae increased from 45.8% during March-April to 66.7 in May-June bi-monthly peak summer months. Introduction of room coolers and increased trend of water storage practices in domestic environment induced increased proportion of containers positivity with pupae.
Incidence of dengue positive cases was 5.3% in July-August period with CI 5.2 and CPI 4.6. The incidence of dengue positive cases was at its peak during September-October period with 79.4% when CI was 3.9 and CPI 4.2. Proportion of containers positive with pupae decreased marginally to 64.2% in July-August period but again increased to 67.5% in September-October period when the incidence of dengue cases was at its peak. The increased proportion of container positivity for pupae was due to spread of breeding infestation to varieties of containers in domestic and peri-domestic human habitations.
The incidence of DF decreased to 15% with CI at 0.4, CPI at 0.1 and proportion of container positive with pupae was lowest at 24.5.
Seasonal productivity of containers in domestic environment
During January-February (two months period) 80% of plastic drums, barrels and similar other plastic containers big or small were found positive with pupae.
In March-April period, 57.3% of plastic containers and similar other big or small plastic containers with 17.1% metal/scraps containers together formed 74.4% positive for pupae. Room coolers formed 12.3%; 51.1% of plastic drums, barrels and similar other plastic containers big or small were found positive with pupae, 12.7% of metal containers/scraps together made 76.1% of containers positive of pupae in May-June period. Room coolers (13.2), plastic drums, barrels and similar other plastic containers big or small (34.6), metal / scraps containers (14.9) and trays used for flower pots (11.4), constituted 74.1% positive for pupae in July-August bi-monthly period. During September-October period, room coolers; plastic drums, barrels and similar other plastic containers; earthen pots and metal / scraps containers formed 82.5% positive for pupae in and around domestic and peri-domestic situation. Gradual rising trend of breeding of Aedes aegypti was evident from proportion of room coolers positive for pupae increased from 8.4% in March-April period to 14% in September-October period. Proportion of containers positive for pupae only decreased to 72.3% in November-December period when 38.5% of plastic drums, barrels and similar other plastic containers, 16.9% earthen pots and the metal / scraps containers found positive for pupae (Table 2).

Epidemiological importance of CPI for vector surveillance and control of dengue in NCT - Delhi, India
Dengue Bulletin – Volume 38, 2014 7
Seasonal positivity of containers with pupae:
Table 2: Proportion of containers and types positive for pupae
Months
Overall proportion
of all positive
containers
Type of container
TotalRoom coolers
Plastic drum, barrel similar
other big or small
containers
Earthen pots
Metal/scraps
Flower pot
trays
Jan-Feb 62.5 0 80.0 0 20.0 0 100.0
Mar-Apr 45.8 8.4 57.3 0 17.1 0 82.8
May-June 66.7 12.3 51.1 10.8 12.7 7.1 94.0
July-Aug 64.2 13.2 34.6 9.6 14.9 11.4 83.7
Sept-Oct 67.5 14.0 32.3 15.2 21.0 4.6 87.1
Nov-Dec 24.5 7.7 38.5 16.9 16.9 1.5 81.5
Abundance of different types of containers positive for pupae, their low mortality indicated most productive vector population emergence and high transmission potential during four months period i.e. July to October.
The positive co-relation (0.52) between CPI and proportion of containers positive for pupae and strong positive correlation (0.9) between CI and CPI were suggestive of very high breeding potentials of Aedes aegypti in domestic environments. Seasonal increasing trend of CPI as well as proportion of dengue cases coincided with rainfall months (July to October) when maximum precipitation occurred. The transmission peak of DF was in September-October during the receding monsoon months.
Discussion
Dengue fever has been endemic with regular incidence in NCT-Delhi. Proliferation of breeding of Aedes aegypti increased during July-August period and continued unabated with higher containers with pupal infestation during September-October period. Importance of association of rainfall and dengue outbreak was reported as a disease of monsoon by creating more breeding sites13. Intensified pupal survey as an important tool for vector surveillance has been highlighted14,15. Vector control in NCT region is heavily relied on source reduction, chemical control as larvicidal in water collections and containers, focal thermal fogging in and around houses with confirmed dengue cases. These anti-larval and anti-adult activities were supported by health education campaign to enhance community awareness and

Epidemiological importance of CPI for vector surveillance and control of dengue in NCT - Delhi, India
8 Dengue Bulletin – Volume 38, 2014
participation. All these efforts had limited success to either containment of breeding or prevent occurrence of the disease.
India has been highly endemic for mosquito borne diseases16. NCT Delhi has been a water scarcity zone. Water storage practices in innumerable varieties of containers were common in every social stratum in NCT Delhi. Plastic drums/barrels and other similar receptacles were most productive containers due to storage or collection of potable water for domestic use and epidemiologically important17. Varieties of plastic containers formed 80% positive with pupae in January-February period were actually “mother foci” involved in low level transmission18.
Health education messages were incomplete and weak as information to communities were more towards weekly cleaning of room coolers leaving unconventional breeding potentials in domestic and peri-domestic environment with prolific breeding potentials were not targeted. In consideration of high CPI and percentage of highly preferred seasonal breeding containers, an effective vector control approach is required. Population migration has been the major concern for unplanned urbanization creating slums, often challenged with acute scarcity of safe potable water. These factors, primary causes for water storage in varieties of containers were highly productive for pupae, high emergence and man-mosquito contact. Data analysis on rising larval, particularly container pupal index in monsoon months was inadequate to organize effective vector control operations involving communities. Annual disease incidence of DF has clearly demonstrated managerial inefficiency of surveillance systems and implementation of strategies for dengue control.
Existing disease surveillance system in NCT Delhi has been oriented to seasonal planning rather than anticipatory action to prevent recurrence to dengue fever by controlling or prevention of proliferation of breeding potentials with high vector abundance in terms of proportion of containers positive for pupae. Monsoon and post monsoon months, the classical “dengue season” were associated with high proportion of containers positive with pupae and CPI. Particular search would be required to detect/identify breeding habitats of room coolers, plastic containers/drums/barrels and other small/medium or big discarded containers, metal/scraps containers in and around human habitations responsible for highest proportion of positivity of pupae and thus formed most productive containers.
Vector surveillance based on containers positive for pupae survey during monsoon months to determine risk areas prone to recurrence or outbreak of dengue for planning control strategies would be essential. Principles of integrated vector management involving all strata of residential complexes in association with civic bodies are to be implemented for effective vector control measures and sustainable achievements. Increasing trend of dengue has been attributed to three most important factors (i) urbanization, (ii) globalization and (iii) lack of effective mosquito control19.
Epidemiological importance of CPI for vector surveillance and control of dengue in NCT - Delhi, India
Dengue Bulletin – Volume 38, 2014 9
Human migration in NCT Delhi laid to creation of more slums with acute shortage of basic facilities for human settlement. Such conditions were identified responsible for emerging vector-borne diseases in rapidly urbanized metropolitan cities20,21. First spreading dengue virus has emerged as a major tropical arbo-viral disease. It has imposed a tremendous burden and economic loss in countries endemic of the disease22.
Acknowledgements
The authors thankfully acknowledge the guidance from Mr N.L. Kalra, former Deputy Director, NVBDCP, to improve the contents and the manuscript. The most sincere efforts of CCCO staff are highly appreciated. Authors are grateful to Mr A. Negi, Mr R. Kumar, Mr D. Singh, Mr A. N. Pandey, Mr A. A. Akhtar and Mr N. K. Jha for their contribution in the preparation of figures, tables and the compilation of field data.
References[1] Verchere AM. Report on the epidemic dengue of 1872, as it appeared in Fort Williams, Calcutta.
Indian Med. Gaz. 1879;14:91-95.
[2] Ramakrishna SP, Gelfand HM, Bose PN, Sehgal PN, Mukherjee RN. The epidemic of acute hemorrhagic fever in Calcutta, 1963, epidemiological inquiry. Indian J Med Res. 1964;52:1-18.
[3] Nandi J, Sharma RS, Dutta PK, Dhillon GPS. Dengue in the National Capital Territory (NCT) of Delhi (India): epidemiological and entomological profile for the period 2003 to 2008. Dengue Bulletin. 2008;32:157-161.
[4] Kaul SM, Sharma RS, Sharma SN, Panigrahi N, Phukan PK, Lal Shiv. Preventing dengue/dengue haemorrhagic fever outbreaks in the national capital territory of Delhi – the role of entomological surveillance. J Commun Dis. 1998;30:187-192.
[5] Kumar M, Pasha ST, Mittal V, Rawat DS, Arya SC, Agarwal N, Bhattacharya D, Rai Arvind. Unusal emergence of Guate 98-like molecular subtype of DEN-3 during 2003 dengue outbreark in Delhi. Dengue Bulletin. 2004;25:161-167.
[6] Saxena P, Parida MM, Dash PK, Santoshi SR, Srivastava A, Tripathi NK, Gupta N, Saini AK, Bhargava R, Singh CP, Tiwari KN, Sekhar K, Rao PVL. Co-circulation of dengue virus serotypes in Delhi, India. Implication for increased DHF/DSS. Dengue Bulletin. 2006;10:283-287.
[7] Kabra SK, Verma IC, Arora NK, Jain Y, Kalra V. Dengue haemorrhagic fever in children in Delhi. Bull World Health Organ. 1992;70(1):105-8.
[8] Krishnamurthy BS, Kalra NL, Joshi GC, Singh NN. Reconnaissance survey of Aedes aegypti in Delhi. Bull. Indian Soc. Mal. Commun. Dis. 1965;2(1):56-57.
[9] Focks DA. A review of entomological sampling methods and indicators for dengue vectors. Geneva: World Health Organization, 2003. Document No. TDR/IDE/DEN/03.1.
Epidemiological importance of CPI for vector surveillance and control of dengue in NCT - Delhi, India
10 Dengue Bulletin – Volume 38, 2014
[10] Focks DA, Alexender N. Multicountry study of Aedes aegypti pupal productivity survey methodology: findings and recommendations.Geneva: WHO, 2006. Document No. TDR/IRM/DEN/06.1/2006. http://www.who.int/tdr/publications/documents/aedes.pdf - accessed 17 December 2014.
[11] World Health Organization. Operational guide for assessing the productivity of Aedes aegypti breeding sites. Geneva: WHO, 2011. http://www.who.int/tdr/publications/ documents/sop-pupal-surveys.pdf - accessed 17 December 2014.
[12] World Health Organization. Dengue guidelines for diagnosis, treatment, prevention and control. New edition. Geneva: WHO, 2009.
[13] Li CF, Lim TW, Han LL, Feng R. Rainfall, abundance of Aedes aegypti and dengue infection in Selangor, Malaysia. South East Asian J Trop Med Pub Health. 1985;16:560-8.
[14] Focks DA, Chadee DD. An epidemiologically significant surveillance method for Aedes aegypti: An example using data from Trinidad. An. J. Trop. Med Hsg. 1997;56:1959-67. RMID:9080874.
[15] Arunachalam N, Tana Sasilowali, Espino F, Kittayapong P, Abeyewickreme. Eco-bio-social determinants of dengue vector breeding : a multicentric study in urban and peri-urban Asia. Bulletin of the World Health Organization. 2010;88:173-184.
[16] Alirol E, Getaz L, Stoll B, Chappuis F, Loutan L. Urbanization and infectious diseases in a globalised world. www.thelancet.com/infection. 2011 Feb;11:131-41. - accessed 17 December 2014.
[17] Knox t, Nam VS, Yen NT, Kay B, Ryan P. Optimising surveillance for dengue vector immatures in large water storage containers in Vietnam. Arbovirus Research in Australia. 2005;9:184-187.
[18] Chandler AC. Factors influencing the uneven distribution of Aedes aegypti in Texas cities. American Journal of Tropical Medicines. 1945;25:145-149.
[19] Gubler DJ. Dengue, urbanization and globalization: the unholy trinity of the 21st century. Trop Med Health. 2011 Dec;39(4 Suppl):3-11. http://www.ncbi.nlm.nih.gov/pmc/articles/ PMC3317603/ - accessed 17 December 2014.
[20] Hofez PJ, Fenwick A, Savioli L, Molyneux DH. Rescuing the bottom billion through control of neglected tropical diseases. Lancet. 2009 May 2; 373(9674): 1570-75. http://www.who.int/ neglected_diseases/Bottom_billion_ntd_control.pdf - accessed 17 December 2014.
[21] World Health Organization, South-East Asia Region-Western Pacific Region. Social determinants of health. In: Asia Pacific strategy for emerging diseases: technical papers. New Delhi, Manila: WHO-SEARO-WPRO, 2010. pp. 119-129. – accessed 17 December 2014.
[22] Garg P, Nagpal J, Khaimer P, Seneviratne SL. Economic burden of dengue infection in India. Trans R Soc Trop Med Hsg. 2008 Jun;102(6):570-7. doi: 10.1016/j.trstmh.2008.02.015. Epub 2008 Apr 9.

Dengue Bulletin – Volume 38, 2014 11
Pattern of dengue serotypes in four provinces of northern Thailand from 2003–2012
Punnarai Veeraseatakul,a# Sawalee Saosathana and Salakchit Chutipongvivateb
aRegional Medical Sciences Center 1 Chiangmai, Department of Medical Sciences, Ministry of Public Health, Chiangmai 50180, Thailand
bRegional Medical Sciences Center 6 Chonburi, Department of Medical Sciences, Ministry of Public Health, Chonburi 50180, Thailand
Abstract
Dengue virus infection is an epidemic prone infectious disease and currently a major health problem in Thailand including four provinces of the northern region; Chiangmai, Lamphun, Lampang and Mae Hong Son. This study determined the dengue serotype from dengue patients in these provinces from January 2003 to December 2012, a total of 1,756 seropositive acute samples were tested specifically for dengue serotype by reverse transcriptase polymerase chain reaction (RT-PCR). Eight hundred and ninety five samples were positive RNA dengue virus, of which 40.3% were the predominant dengue serotype DENV-1, followed by 37.7% DENV-2, 13.4% DENV-4 and 8.6% DENV-3, respectively. Throughout 10 years, the pattern of predominant dengue serotypes showed mainly switching between two serotypes; as a sequence from 2003 to 2005, DENV-2 was 59.7%, 70.3% and 44.1%, respectively. From 2006 to 2009, DENV-1 was 54.2%, 61.1%, 74.2% and 61.8%, respectively. From 2010 to 2011, DENV-2 was 59.3% and 81.8%. Lastly in 2012, DENV-1 was 44.3%. Our results indicated that all four dengue serotypes were circulating and coexisting in this region and the predominant serotypes were not stable and changed between DENV-1 and DENV-2. This pattern may occur continuously in northern Thailand, it was affected in the group of non-immunity population to new predominant, to increasing of patient. This information will be beneficial to surveillance system of dengue infection control.
Keywords: Dengue serotype; Northern Thailand.
Introduction
Dengue is a mosquito-borne viral infection and has become a major disease in Thailand and a public health problem. In the past 25 years, the dengue outbreak occurred many times with a high incidence rate per 100 000 population, the largest epidemic ever recorded was shown in 1987 at 325.11 and the incidence rate per 100 000 population in the periods of
#E-mail: : [email protected]; Fax: 66-53-112192

Pattern of dengue serotypes in four provinces of northern Thailand from 2003–2012
12 Dengue Bulletin – Volume 38, 2014
1997, 1998, 2001, 2002, 2008 and 2010 were 167.21, 211.42, 224.43, 187.52, 141.78 and 183.59, respectively.2-4 Dengue virus is in the Flaviviridae family genus Flavivirus and is divided into four serotypes:DENV-1, DENV-2, DENV-3 and DENV-4 that are genetically related but antigenically distinguishable.5 The phenomenon of co-circulation of multiple dengue serotypes is referred to as hyperendemicity on account of dengue haemorrhagic fever (DHF) recovery from infection by one provides lifelong immunity against that particular serotype, but cross-immunity to the other serotypes after recovery is only partial and temporary.6-8 Subsequent infections by other serotypes increase the risk of developing severe dengue.
The previous reports of predominant dengue serotype in Bangkok showed DENV-1 from 1990-1992, DENV-2 from 1973-1986 and 1988-1989; DENV-3 in 1987 and 1995-1999; and DENV-4 from 1993-1994.9-10 Anantapreecha et al.3 detected the most common DENV-1 in 2001 and DENV-2 in 2002 from six provinces across Thailand. In north of Thailand, four provinces such as Chiangmai, Lamphun, Lampang and Mae Hong Son have a large area (49 828 163 sq.km) and population (3 061 482 mid-year population in 2012), and have subsequently reported dengue incidence rate from 2003 to 2012 with 95.12, 55.56, 97.34, 46.67, 48.66, 199.34, 99.39, 303.37, 35.26 and 81.33, respectively.4 Whereas dengue vaccine development is currently being investigated in clinical trial, the efficient dengue surveillance, prevention and control programme plays a key role in the strategy of Thailand. Hence, the data of continuous dengue serotype circulation is an important factor in effectively developing dengue surveillance and prevention and control programmes. The objective of this study was to determine the pattern of dengue serotypes in four provinces of northern Thailand from 2003-2012.
Materials and methods
Specimen
Serum samples were collected from dengue patients in four provinces of northern Thailand including Chiangmai, Lamphun, Lampang and Mae Hong Son (Figure 1) during 2003-2012 and were confirmed for dengue infection by IgM/IgG ELISA.11 A total of 1756 seropositive acute samples were subsequently subjected to dengue serotype examination at Regional Medical Sciences Center 1 Chiangmai, Thailand (RMSC1_CM).
Viral RNA extraction
Dengue viral RNA was extracted by using QIAamp viral RNA Mini Kit, Cat. No. 52 904 (QIAGEN, Hilden, Germany) according to manufacturer’s instruction. 12 The eluted RNA was kept in -70°C until use.

Pattern of dengue serotypes in four provinces of northern Thailand from 2003–2012
Dengue Bulletin – Volume 38, 2014 13
RT-PCR
Dengue serotype was performed by using two steps conventional RT-PCR according to protocol previously described by Yenchitsomanus et al.13 Dengue serotypes were identified by the size of the resulting bands with 504 bp of DENV-1, 346 bp of DENV-2, 196 bp of DENV-3 and 145 bp of DENV-4.
Results
The number of seropositive acute samples and percentage of dengue serotypes in the four provinces from 2003 to 2012 are shown in Table 1. The data of all ten years, a total of 1756 seropositive acute samples were analyzed, of which 895 samples (51.0%) were positive specific dengue serotype by RT-PCR. All four dengue
serotypes were found during this study, of which DENV-1 was the most predominant serotype 40.3%, followed by DENV-2, DENV-4 and DENV-3 as 37.7%, 13.4% and 8.6%, respectively.
Table 1: Summary of dengue serotypes in 4 provinces of northern Thailand, 2003–2012
Year Seropositve acute sample
Positive dengue RNA
Dengue serotype (%)
DENV-1 DENV-2 DENV-3 DENV-4
2003 205 62 20 (32.3) 37 (59.7) 2 (3.2) 3 (4.8)
2004 257 148 37 (25.0) 104 (70.3) 2 (1.4) 5 (3.4)
2005 241 136 26 (19.1) 60 (44.1) 13 (9.6) 37 (27.2)
2006 161 72 39 (54.2) 3 (4.2) 4 (5.6) 26 (36.1)
2007 238 126 77 (61.1) 12 (9.5) 3 (2.4) 34 (27.0)
2008 250 97 72 (74.2) 7 (7.2) 11 (11.3) 7 (7.2)
2009 97 55 34 (61.8) 3 (5.5) 18 (32.7) 0 (0.0)
2010 68 54 16 (29.6) 32 (59.3) 6 (11.1) 0 (0.0)
2011 92 66 5 (7.6) 54 (81.8) 6 (9.1) 1 (1.5)
2012 147 79 35 (44.3) 25 (31.6) 12 (15.2) 7 (8.9)
Total 1756 895 361 (40.3) 337 (37.7) 77 (8.6) 120 (13.4)
Figure 1: Map of four provinces of northern Thailand

Pattern of dengue serotypes in four provinces of northern Thailand from 2003–2012
14 Dengue Bulletin – Volume 38, 2014
The pattern of dengue serotypes by year from 2003 to 2012 was shown in Figure 2. During 2003-2005, a total of 62, 148 and 136 samples showed the proportion of predominant serotype DENV-2 as 59.7%, 70.3% and 44.1%, respectively, followed by serotype DENV-1 as 32.3% in 2003 and 25.0% in 2004, while DENV-4 was 27.2%.in 2005. During 2006-2009, a total of 72, 126, 97 and 55 samples showed the proportion of predominant serotype DENV-1 as 54.2%, 61.1%, 74.2% and 61.8%, respectively, followed by serotype DENV-4 as 36.1% in 2006 and 27.0% in 2007, whereas DENV-3 as 11.3% in 2008 and 32.7% in 2009. During 2010-2011, the result of 54 and 66 samples showed the proportion of predominant serotype DENV-2 as 59.3% and 81.8%, with followed by serotype DENV-1 as 29.6% and DENV-3 as 9.1%, respectively. In 2012, a total of 79 samples showed DENV-1 as 44.3% and followed by DENV-2 as 31.6%.
Figure 2: The pattern of dengue serotypes in northern Thailand by year from 2003 to 2012
100%90%80%70%60%50%40%30%20%10%0%
2003n=62
2004n=148
2005n=136
2006n=72
2007n=126
2008n=97
2009n=55
2010n=54
2011n=66
2012n=79
DENV-1
DENV-2
DENV-3DENV-4
The pattern of dengue serotypes by province from 2003 to 2012 is shown in Figure 3 (A-D). The number of positive dengue RNA in each province, which has more than 5 samples per year was analyzed. The data study of Chiangmai province has shown throughout 10 years, the predominant dengue serotype was DENV-2 during 2003-2005 and 2010-2011 as 54.8%, 71.4%, 52.0%, 67.7% and 50.0%, respectively. DENV-1 was predominant as 56.9%, 85.1%, 79.2% and 40.0% in 2006, 2008, 2009 and 2012, respectively. DENV-4 was predominant in 2007 as 53.9% (Figure 3A). In Lamphun province, the data of predominant dengue serotypes in seven years were showed DENV-2 as 50.0% in 2004, DENV-4 as 61.8% and 77.8% in 2005 and 2006, respectively. During 2007-2009 and in 2012, DENV-1 was 85.7%, 76.2%, 79.2%and 87.5%, respectively (Figure 3B). In Lampang province, the predominant dengue serotypes in six years were showed mainly DENV-2 from 2003 to 2005, 2007 and 2011 as 62.5%, 79.3%, 40.0%, 33.3% and 80.0%, respectively. DENV-1 was predominant as 71.4% in 2006 (Figure 3C). In Mae Hong Son province, the predominant dengue serotypes throughout eight years were DENV-2 as 75.1% and 40.0% in 2005 and 2012, respectively. DENV-1 was

Pattern of dengue serotypes in four provinces of northern Thailand from 2003–2012
Dengue Bulletin – Volume 38, 2014 15
predominant during 2006-2009 and 2011-2012 as 80.0%, 97.3%, 50.0%, 48.1%, 97.5% and 40.0%, respectively. While in 2010, we found only serotype DENV-3. Moreover, we detected predominant serotypes with equally percentage in 2009 (DENV-1 and DENV-3) and in 2012 (DENV-1 and DENV-2) (Figure 3D).
Figure 3: The pattern of dengue serotypes by province, (A) Chiangmai province, (B) Lamphun province (C) Lampang province and (D) Mae Hong Son province
(A) Chiangmai province
DENV-1 DENV-2 DENV-3 DENV-4
100%
90%
80%
70%
60%
50%
40%
30%
20%
10%
0%2003n=42
2004n=98
2005n=75
2006n=51
2007n=39
2008n=47
2009n=24
2010n=48
2011n=20
2012n=50
(B) Lamphun province
DENV-1 DENV-2 DENV-3 DENV-4
100%
90%
80%
70%
60%
50%
40%
30%
20%
10%
0%2004n=20
2005n=34
2006n=9
2007n=21
2008n=21
2009n=24
2012n=8

Pattern of dengue serotypes in four provinces of northern Thailand from 2003–2012
16 Dengue Bulletin – Volume 38, 2014
(C) Lampang province
DENV-1 DENV-2 DENV-3 DENV-4
100%
90%
80%
70%
60%
50%
40%
30%
20%
10%
0%2003n=16
2004n=29
2005n=15
2006n=7
2007n=33
2011n=5
(D) Mae Hong Son province
DENV-1 DENV-2 DENV-3 DENV-4
100%
90%
80%
70%
60%
50%
40%
30%
20%
10%
0%2005n=12
2006n=5
2007n=33
2008n=26
2009n=27
2010n=6
2011n=40
2012n=20
Discussion
Our study has shown the pattern of dengue serotypes over the 10-year period that was determined from the seropositive acute samples from Chiangmai province, (the second

Pattern of dengue serotypes in four provinces of northern Thailand from 2003–2012
Dengue Bulletin – Volume 38, 2014 17
biggest city of Thailand) and its 3 neighboring provinces (Lamphun, Lampang and Mae Hong Son) in northern highland areas.
Throughout the 10 years, the overall results of dengue serotypes circulation were presented and all four serotypes were prevalent in this region in different proportion. The pattern of predominant dengue serotype fluctuated circulating with a proportion of 44-81% and was mainly switching between two serotypes of DENV-1 and DENV-2.
During the first period, from 2003 to 2005, our result of predominant serotype was DENV-2 that differed from the previous study of Queen Sirikit National Institute of Child Health (QSNICH), Bangkok, capital of Thailand during 2003-2005 and the study from KhonKan province, Northeast region, Thailand in 2004 which indicated the predominance of DENV-1.14-15 The annual epidemiological surveillance report of Thailand during 2004-2005 and the study from Kamphaeng Phet province, central region of Thailand in 2004 indicated a predominance of DENV-4.4, 16
During the second period, from 2006 to 2009, the predominant serotype in the study areas switched to DENV-1 that was also observed by the study of QSNICH from Bangkok13 and the study in children from Ratchaburi province, 100 km west of Bangkok.17 During 2010-2011, the predominant serotype changed back to DENV-2 like the studies in other regions of Thailand.4, 14-15 Whereas, the report from South-East Asia countries in 2010; Brunei18 and Cambodia, Republic of Lao, Malaysia, Philippines and Vietnam in 2011 showed predominant DENV-1 except Singapore report (2011) was DENV-2.19 In 2012, DENV-1 was predominant in this region as the report from Indonesia20 but the report from central region of Thailand had still DENV-2 predominant.4 Our data was indicated the predominant serotype from major outbreak in 2008 was DENV-1 and changed to DENV-2 when the next outbreak occurred in 2010. Our data indicated the predominant serotype from major outbreak in 2008 was DENV-1 with a high dengue incidence rate4 as 199.34 and the rate was down to 99.39 in 2009. While it was changed to DENV-2 in the next outbreak 2010, the rate was the highest as 303.37 and down to 35.26 in 2011. Moreover, the rate in 2012 was increasing to 81.33 and predominant serotype was changed back to DENV-1. We therefore considered the proportion of other serotypes, DENV-4 was mostly at low levels but trend to increase proportion when DENV-2 was displaced to DENV-1 during 2005-2007. Moreover, the proportion of DENV-3 in the last 5 years of study were higher rate than in the first 5 years that also likely the QSNICH report.13
We compared the pattern of dengue serotype in each province. The predominant serotype in Chiangmai province during 10 years were mostly shown as the overall result of four provinces. This is also seen in the data of four years in Lamphun province (2004, 2007–2008 and 2012), the data of three years in Lampang province (2003, 2006 and 2011) and the data of seven years in Mae Hong Son province (2005–2009, and 2011–2012). Whereas, the predominant serotypes in some provinces and years were found differently from neighbouring area with temporal serotype such as DENV-4 in Lamphun province (2005–2006), DENV-2 in Lampang province (2007) and DENV-3 in Mae Hong Son province (2010).

Pattern of dengue serotypes in four provinces of northern Thailand from 2003–2012
18 Dengue Bulletin – Volume 38, 2014
Our study has surveyed long-term dengue serotype circulated in northern Thailand where the incidence rate may differ from year to year. Our data presented here will not suggest that dengue serotype DENV-1 and DENV-2, the most frequently detected serotypes, represented the indigenous serotype in the northern region of Thailand, but also provided an update of epidemiological hyperendemicity with multiple serotypes and its pattern. We agreed with the previous study that the pattern of dengue serotypes in geographical locations in Thailand and several South-East Asian countries is dynamic and there may have many factors associated with these dynamic changes such as human and vector population in terms of the number and their movement, environment, social factor and public health infrastructure.15, 21 This study will provide data to the activity of the dengue surveillance, prevention and control programmes including the possible vaccine trial in the future.
Acknowledgements
The authors express their sincere thanks to Mr Bumroong Kongdee, former director and Mr Terasak Suphachaiyakit, Director of Regional Medical Sciences Center 1 Chiangmai, for their support.
References[1] Halstead SB. The XX century dengue pandemic: need for surveillance and research. World Health
Stat Q. 1992;45(2-3):292-8.
[2] Thailand, Ministry of Public Health. Annual epidemiological surveillance report 1999. Nonthaburi: Bureau of Epidemiology, Department of Disease Control, 1999.
[3] Anantapreecha S, Chanama S, A-Nuegoonpipat A, Naemkhunthoy S, Sa-ngasang A, Sawanpanyalert P, Kurane I. Annual changes of predominant dengue virus serotypes in six regional hospitals in Thailand from 1999 to 2002. Dengue Bulletin. 2004;28:1-6.
[4] Thailand, Ministry of Public Health. Annual epidemiological surveillance report 2003-2012. Nonthaburi: Bureau of Epidemiology, Department of Disease Control. http://www.boe.moph.go.th/Annual/ Total_Annual.html - accessed 4 Jan 2014.
[5] Gubler DJ. The global emergence/resurgence of arboviral diseases as public health problems. Arch Med Res. 2002;33(4):330-42.
[6] Kliks SC, Nimmanitya S, Nisalak A, Burke DS. Evidence that maternal dengue antibodies are important in the development of dengue hemorrhagic fever in infants. Am J Trop Med Hyg. 1988;38(2):411-9.
[7] Burke DS, Nisalak A, Johnson DE, Scott RM. A prospective study of dengue infections in Bangkok. Am J Trop Med Hyg. 1988;38(1):172-80.
[8] Sangkawibha N, Rojanasuphot S, Ahandrik S, Viriyapongse S, Jatanasen S, Salitul V, Phanthumachinda B, Halstead SB. Risk factors in dengue shock syndrome: a prospective epidemiologic study in Rayong, Thailand. I. The 1980 outbreak. Am J Epidemiol. 1984;120(5):653-69.

Pattern of dengue serotypes in four provinces of northern Thailand from 2003–2012
Dengue Bulletin – Volume 38, 2014 19
[9] Nisalak A, Endy TP, Nimmannitya S, Kalayanarooj S, Thisayakorn U, Scott RM, Burke DS, Hoke CH, Innis BL, Vaughn DW. Serotype-specific dengue virus circulation and dengue disease in Bangkok, Thailand from 1973 to 1999. Am J Trop Med Hyg. 2003;68(2):191–202.
[10] Kalayanarooj S, Nimmannitya S. Clinical and laboratory presentations of Dengue patients with different serotypes. Dengue Bulletin. 2000;24:53-9.
[11] Innis BL, Nisalak A, Nimmannitya S, Kusalerdchariya S, Chongswasdi V, Suntayakorn S, Puttisri P, Hoke CH. An enzyme-linked immunosorbent assay to characterize dengue infections where dengue and Japanese encephalitis co-circulate. Am J Trop Med Hyg. 1989;40(4):418-27.
[12] QIAamp® viral RNA mini handbook. 3rd edn. Sample & Assay Technologies. QIAGEN. June 2012.
[13] Yenchitsomanus PT, Sricharoen P, Jaruthasana I, Pattanakitsakul SN, Nitayaphan S, Mongkolsapaya J, Malasit P. Rapid detection and identification of dengue viruses by polymerase chain reaction (PCR). Southeast Asian J Trop Med Public Health. 1996;27(2):228-36.
[14] Kalayanarooj S, Vangveeravong M, Vatcharasaevee V, Eds. Guidelines for diagnosis and treatment of dengue hemorrhagic fever. In: The celebration of Her Majesty the Queen’s 80th Birthday Anniversary. Second edition. Bangkok: Ministry of Public Health, Thailand Press; 2013.
[15] Pongsiri P, Themboonlers A, Poovorawan Y. Changing pattern of dengue virus serotypes in Thailand between 2004 and 2010. J Health Popul Nutr. 2012;30(3):366-70.
[16] Rabaa MA, Klungthong C, Yoon IK, Holmes EC, Chinnawirotpisan P, Thaisomboonsuk B, Srikiatkhachorn A, Rothman AL, Tannitisupawong D, Aldstadt J, Nisalak A, Mammen MP, Gibbons RV, Endy TP, Fansiri T, Scott TW, Jarman RG. Frequent in-migration and highly focal transmission of dengue viruses among children in Kamphaeng Phet, Thailand. PLoS Negl Trop Dis. 2013;7(1):e1990. doi:10.1371/journal.pntd.0001990.
[17] Sabchareon A, Sirivichayakul C, Limkittikul K, Chanthavanich P, Suvannadabba S, Jiwariyavej V, Dulyachai W, Pengsaa K, Margolis HS, Letson GW. Dengue infection in children in Ratchaburi, Thailand: a cohort study. I. Epidemiology of symptomatic acute dengue infection in children, 2006-2009. PLoS Negl Trop Dis. 2012;6(7):1732-9.
[18] Rahman ZH, Osman O, Muharram SH, Mabruk M. The prevalence of dengue virus in Brunei Darussalam during January-November 2010.Southeast Asian J Trop Med Public Health. 2013;44(4):594-601.
[19] Arima Y, Edelstein ZR, Han HK, Matsui T. Epidemiologic update on the dengue situation in the Western Pacific Region, 2011. Western Pacific Surveillance and Response Journal. 2013;4(2):47-54.
[20] Fahri S, Yohan B, Trimarsanto H, Sayono S, Hadisaputro S, Dharmana E, Syafruddin D, Sasmono RT. Molecular surveillance of dengue in Semarang, Indonesia revealed the circulation of an old genotype of dengue virus serotype-1. PLoS Negl Trop Dis. 2013;7(8):e2354. doi:10.1371/journal.pntd.0002354.
[21] Ahmad-Nizal MG, Rozita H, Mazrura S, Zainudin MA, Hidayatulfathi O, Faridah MA, Noor-Artika I, Er AC. Dengue infections and circulating serotypes in Negeri Sembilan, Malaysia. Malaysian Journal of Public Health Medicine. 2012;12(1):21-30.

20 Dengue Bulletin – Volume 38, 2014
Estimation of the adjustment factor for hospitalized clinical cases diagnosed and tested for dengue in
Madurai, Tamil Nadu (India)Brij KishoreTyagi,a# Shanmugavel Karthiga,a Chellaswamy Vidya,a
Narendra K Arora,b Deoki Nandan,†c Yara A Halasa,d Jhansi Charles,e,f N Mohan,e Poovazhagi Varadarajan,g T Mariappan,a P Philip Samuel,a R Paramasivan,a S Vivek Adhish,c Mukul Gaba,b R T Porkaipandianh and Donald S Shepardd
aCentre for Research in Medical Entomology, Indian Council of Medical Research (ICMR), No.4, Sarojini Street, Chinna Chokkikulam, Madurai, Tamil Nadu, India.
bInternational Clinical Epidemiology Network (INCLEN) Trust International, F-1/5 2nd floor, Okhla Industrial Area Phase I, New Delhi-110020, India.
cNational Institute of Health and Family Welfare, Munirka, New Delhi-110067, India.dBrandeis University, Schneider Institutes for Health Policy, The Heller School, P.O. Box 549110,
Waltham, MA 02454-9110, USA.eMadurai Medical College, Madurai, Tamil Nadu, India.
fThe Tamil Nadu Dr. M.G.R. Medical University, Chennai, Tamil Nadu, India.gInstitute of Child Health, Madras Medical College, Chennai, Tamil Nadu, India.
hDepartment of Public Health and Preventive Medicine, Chennai, Tamil Nadu, India
Abstract
Dengue is a notifiable disease in India since 1996, with an annual average of 20 018 laboratory confirmed cases reported between 2006 and 2012. However, the true magnitude of dengue burden is poorly understood. A study was conducted to estimate the true number of clinically diagnosed dengue cases in Madurai District, Tamil Nadu. A descriptive inventory was developed on healthcare facilities treating and/or testing and laboratories testing dengue. The hospitals were stratified by bed capacity and the laboratories by type of dengue tests performed. Numbers of dengue cases clinically diagnosed, tested and confirmed for the years 2009–2011 were obtained from the selected facilities and extrapolated to obtain a realistic estimate. Projected cases were compared with the officially reported numbers to highlight possible missing cases of dengue. The average projected number of clinically diagnosed dengue cases referred to laboratory for testing was 6334 whereas that of hospitalized confirmed dengue cases accounted for 2188. Ironically, for the same period, the average number of reported dengue cases for the district was 134 and for the 126 state. This gives an adjustment factor of 16.29 at the district level and 17.41 at the state
#E-mail: : [email protected], [email protected]

Estimation of the adjustment factor for hospitalized clinical cases diagnosed and tested for dengue in Madurai, Tamil Nadu (India)
Dengue Bulletin – Volume 38, 2014 21
level for confirmed dengue cases, and 47.15 at the district level and 50.40 at the state level for clinically diagnosed dengue cases laboratory tested cases.Under-representation of dengue cases in India is a serious handicap in determining the realistic disease burden and thereby also hindering in proper planning and executing the health delivery system effectively.
Keywords: Dengue; Disease surveillance; Adjustment factor.
Introduction
Dengue infection (DI), transmitted by Aedes mosquitoes, is a rapidly emerging arboviral infection and a major public health concern globally with a 30-fold increase during past five decades.1,2 Worldwide, an estimated 3.6 billion people (50% of the world population), living in more than 125 dengue-endemic countries, are at risk of infection whereas countries in Asia-Pacific regions alone bear nearly 75% of global burden.1-4 India reported its first dengue case in 19465, followed soon by a disease epidemic in Calcutta and other east-coastal towns of India in 1963-1964.6-8 Ever since the dengue incidence has been showing an upward trend as between 2006 and 2012, India reported a total of 143 321 dengue cases and 923 deaths.9 Presently dengue fever is endemic in 34 States/Union territories (UTs); the only exception being Lakshadweep. About 68% of the dengue burden is contributed by States in the north and south regions.
WHO has categorised countries based on the dengue transmission potential; until 2009, India was in Category B (micro level). However, in 2010, WHO revisited its categorization and grouped India in Category A (macro level) countries where dengue is a major public health problem with a leading cause of hospitalization and death among children. Interestingly, once considered an urban infection, dengue with all the four serotypes has lately been reported appreciably from rural environments.10
In India, dengue surveillance was a component of national disease specific health programmes till 1997. In order to strengthen the disease surveillance activities, National Surveillance Programme for Communicable Diseases (NSPCD), operative in 101 districts in all States/UTs 11, 12 was established in 1997 by the Government of India to predict outbreaks. In 2000, the percentage of under-reporting for vector-borne disease mortality was estimated by comparing the reported national data with WHO estimated mortality. The comparison found that nearly 99.8% of dengue mortality was missed from reporting in the surveillance system.13-15 A study on the dengue epidemic in Chennai in 2001 indicated that the present surveillance system in India is unlikely to generate proper information on epidemiology of dengue, hampering the design of the prevention and control measures against dengue.16
Therefore, the Government of India launched an Integrated Disease Surveillance Project (IDSP) in 200417,18 to integrate and strengthen the disease surveillance in the country to detect early warning signals and use them for effective public health action in disease
Estimation of the adjustment factor for hospitalized clinical cases diagnosed and tested for dengue in Madurai, Tamil Nadu (India)
22 Dengue Bulletin – Volume 38, 2014
control and management.18 To reach this objective the IDSP identified and established 347 Sentinel Surveillance Hospitals (SSH) with full-fledged laboratories and 14 Apex Referral Laboratories for augmentation of diagnostic facilities for dengue.17 The IDSP was established in Tamil Nadu in 2005 with 21 SSHs and 9 Zonal Entomological Teams (ZETs)17 that report to the district surveillance unit from where first to the state surveillance unit and finally to the central surveillance unit. Diagnostic test kits for screening dengue were provided to all SSHs and ZETs by the GoI through National Institute of Virology, Pune.17
While the sentinel disease surveillance programme in India covers all the villages, districts/zones in States/UTs19 through network of SSHs linked to referral laboratories, actual coverage is low partly because healthcare practitioners and hospitals are not legally required to report dengue cases.20 Moreover, variation in dengue testing, poor diagnostic facilities, misdiagnosis, and the absence of feedback to medical practitioners also contribute to under-reporting of dengue.21-25 In the Americas and South-East Asia, researchers have estimated the true dengue burden by extrapolating from cohort studies with active surveillance.26,27 However, we are not aware of comparable cohort studies and projections in India. Therefore, to address this gap in knowledge a study was conducted in Madurai district, Tamil Nadu (India) as a component of a multi-institutional research project aiming to estimate the economic burden of dengue in India (2012 population 1260 Millions)28 based on hospitalized clinically-diagnosed and laboratory confirmed dengue cases. The current pilot study is the first to our knowledge that seeks to derive an adjustment factor to adjust for the under-reporting of dengue in India.
The pilot study was located at Madurai district in Tamil Nadu state for three reasons: (1) its established dengue surveillance system compared to other states in India, (2) between 2006 and 2012, Tamil Nadu reported 14% of the total dengue cases in India (20 164/143 321), and (3) due to the endemicity of dengue, we believe, the health work force is better informed and familiar with dengue compared to other states. The annual average number of dengue cases reported (126) at Madurai was found comparable with the average of other health districts (125) at state level.
Methods
A descriptive inventory was prepared of all healthcare facilities or laboratories treating or testing dengue patients in the district based on data inculcated from Madurai Corporation, Indian Medical Association (IMA), and Madurai Laboratory Association. Healthcare units were classified by sector, into private and public based on their statutory ownership. All healthcare units were also classified by setting into ambulatory facilities and hospitals. The public sector was further classified based on administrative set up (Taluk/Non-Taluk) and its healthcare system (rural and urban). Private hospitals were stratified according to their bed capacity into three groups: (i) small (1 to 50 beds), (ii) moderate (51 to 100 beds), (iii) and large (more than 100 beds). Private laboratories were classified by type of dengue test they performed.

Estimation of the adjustment factor for hospitalized clinical cases diagnosed and tested for dengue in Madurai, Tamil Nadu (India)
Dengue Bulletin – Volume 38, 2014 23
Sample for each stratum
Madurai Medical College (MMC) acts as the public apex reference laboratory and nodal unit for all governmental healthcare units in Madurai. For the public hospital, the laboratory of MMC was selected as the main source to obtain the number of dengue tests performed at a public sector, including the number of hospitalized clinically-diagnosed dengue cases tested for dengue for the years 2009–11.
A sample size of 10% (22/224) of small private hospitals with bed strength between 1 and 50 was adopted following the systematic random procedure, whereas for medium-sized private hospitals with bed strength of 51–100, a sample of 40% (4/10) was selected. As to the larger hospitals with bed strength over 100 beds, a systematic sample of 71% (5/7) was selected. As this design sampled most of the larger hospitals, it managed to capture 5 out of the 6 (83%) sentinel sites, the official government sentinel surveillance hospital (Madurai Medical College) and four out of the five sentinel private hospitals/practitioners reporting to the district surveillance unit.
A total of 126 private laboratories in Madurai have the capability to test for dengue in Madurai, of which 85 use rapid card test (RCT) and 21 use enzyme-linked immunosorbent assay (ELISA). To understand the dengue dynamics at the private laboratories, a sample of four of these laboratories were selected, in which three used the ELISA test and one used the RCT. We obtained the number of cases tested for dengue and confirmed dengue cases, by the type of test performed, the sources of patients’ referral (ambulatory, hospitals, other labs), and number of providers in each referral category. Data obtained from the private laboratories were used to adjust for the number of clinically diagnosed, hospitalized-dengue cases tested for dengue in the public and private sectors.
Data collection tool
A self-structured standardized questionnaire was developed to collect the number of clinically diagnosed cases tested for dengue and confirmed dengue cases by month and year, and number of deaths due to dengue from January 2009 through December 2011, and hospital statistics such as number of beds and volume of services provided for the study years 2009 through 2011.
Data collection procedure
The questionnaire was shared with the selected hospitals. They reviewed the questionnaire and agreed to collaborate with the study by providing data from the microbiology department for the number of dengue cases tested, and from the medical record department through the death registry to capture death due to dengue. For the public hospital and 6 out of the 15 private hospitals, data were retrospectively collected on the number of clinically diagnosed

Estimation of the adjustment factor for hospitalized clinical cases diagnosed and tested for dengue in Madurai, Tamil Nadu (India)
24 Dengue Bulletin – Volume 38, 2014
hospitalized dengue cases laboratory tested for dengue and confirmed dengue cases from the microbiology department laboratory. Additionally the number of beds, number of inpatients and outpatients visits were collected from human resource department, along with the number of deaths due to dengue from the death registry in the medical record department. One private hospital, with computerized record provided the information directly by retrieving the information from the admissions made in the medical records of the microbiology department. For the remaining eight private hospitals, laboratory technicians collected the number of hospitalized dengue cases tested for dengue and laboratory confirmed cases from the microbiology department, while personnel from the public relations or human resources collected other hospital statistics. Simultaneously, a sample of patients was collected from the list provided by the microbiology department and confirmed the demographic details of patients from the medical records department. For public health facilities, the required data was collected from the microbiology department of MMC, Govt. Emergency and Obstetric Care (EOC) inpatient unit (1 out of 2) and Govt. Railway Hospital, Madurai.
Analyses
The numbers of dengue cases from our sampled hospitals were extrapolated by stratum based on the ratio of cases to total beds in the sampled facilities to beds for all hospitals by stratum. We added the number of dengue cases according to sector and compared it with the officially reported numbers from the district surveillance unit (DSU), and the officially reported numbers from the state surveillance unit (SSU).
To get an adjustment factor for clinically diagnosed hospitalized tested dengue cases at the district and state level we divided the average number of clinically diagnosed hospitalized tested dengue cases for the years 2009-2011 by the average number of reported dengue cases for the year 2009-2011based on the formula given below:
Adjustment factor=
Best estimate of the number of cases of dengue illness in a specified population in one year
Number of reported cases considered for denuge in that population in one year
We conducted sub-analyses to compute the adjustment factor by using certain parameters namely (i) by setting, i.e., hospital and diagnostic facilities, (ii) by sector, i.e., public and private, and (iii) by year, i.e., hospitalised dengue cases recorded between 2009 and 2011.This study is based on empirical ratio evolved from reviewing hospitals and laboratory data after subjecting them to necessary statistical treatment, and accordingly was derived by dividing the number of reported dengue cases by the best estimated number of laboratory confirmed hospitalised dengue cases collected for the purpose of this study. This extrapolation model aims to provide primarily an adjustment factor for commensurate estimation of disease burden in other settings as well.

Estimation of the adjustment factor for hospitalized clinical cases diagnosed and tested for dengue in Madurai, Tamil Nadu (India)
Dengue Bulletin – Volume 38, 2014 25
Results
The overall response rate for private hospitals was 48.39% (15/31). Of the 22 randomly selected small hospitals (1-50 beds) only 7 (32%) provided the needed information, while 6 (40%) did not have the appropriate records to extract the needed data, 3 (20%) declined to participate in the study, 2 (13%) reported dengue as a febrile illness only, 2 (13%) referred the clinically suspicious dengue cases to multi-specialty hospital, and 2 (13%) could not be traced as they had shifted to other places in the city or closed. The response rate among medium private hospitals (51-100 beds) was 100% (4 out of 4) whereas the response rate was 80% (4 out of 5) for the large private hospitals (>100 beds). The fifth hospital failed to offer appropriate records to extract the needed data.
The average projected number of hospitalizedclinically diagnosed dengue cases referred to a microbiology department for test was 6334 of which 17.32% (1097/6334) came from the public sector and 82.68% (5237/6334) from the private sector. Table 1 presents the results for the years 2009-2011.
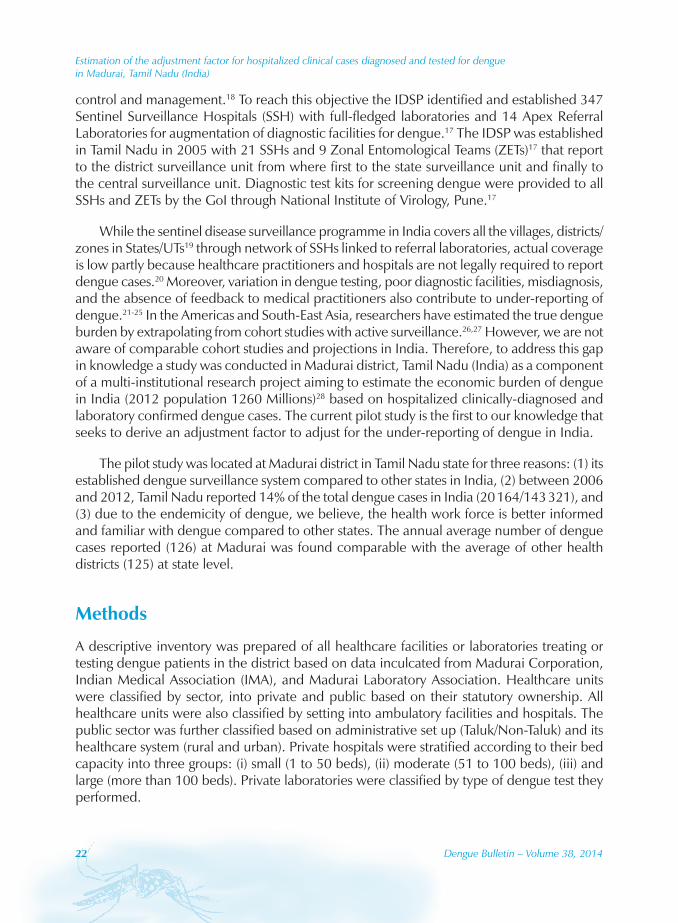
The average projected number of hospitalized confirmed dengue cases was 2188 of which 11.75% (257/2 188) came from the public sector and 88.25% (1931/2188) from the private sector. Table 2 presents the results for the years 2009-2011.
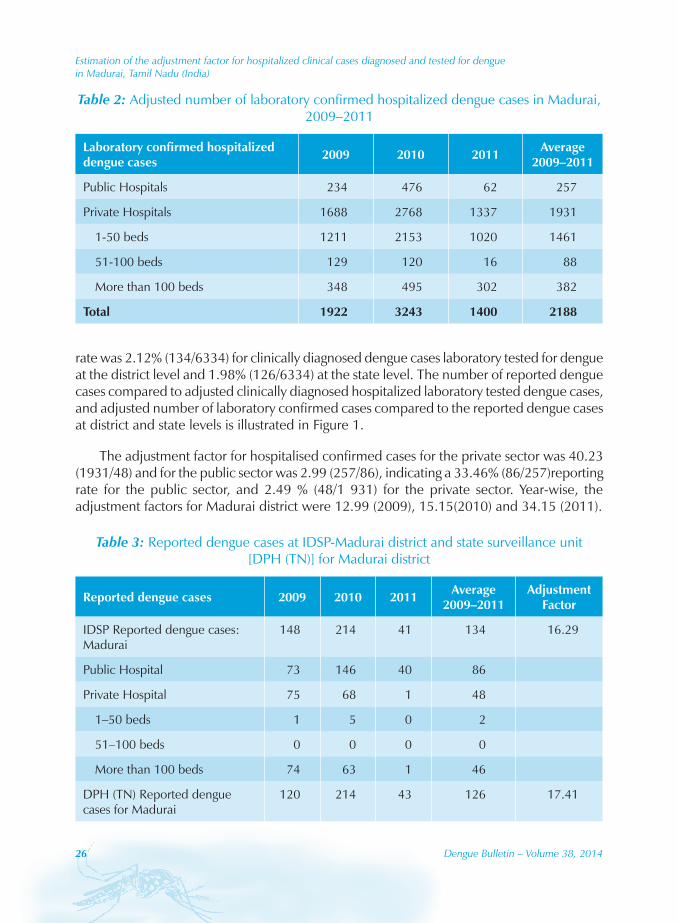
For the same period, the average number of reported dengue cases at the district level was 134 cases, and at the state level were 126 cases as presented in Table 3. This gives an adjustment factor of 47.15 at the district level, and 50.40 at the state level for clinically diagnosed dengue cases laboratory tested for dengue and 16.29 at the district level and 17.41 at the state level, for confirmed dengue cases. The reporting rate was 6.14% (134/2188) for confirmed cases at the district level and 5.76% (126/2188) at the state level. The reporting
Table 1: Adjusted number of hospitalized clinically diagnosed dengue cases tested for dengue in Madurai, 2009–2011
Clinically diagnosed hospitalized dengue cases tested for dengue 2009 2010 2011 Average
2009–2011
Public Hospitals 780 1716 796 1097
Private Hospitals 3921 7418 4371 5237
1-50 beds 1730 4758 3172 3220
51-100 beds 537 755 59 450
More than 100 beds 1654 1905 1140 1566
Total 4701 9134 5166 6334
Estimation of the adjustment factor for hospitalized clinical cases diagnosed and tested for dengue in Madurai, Tamil Nadu (India)
26 Dengue Bulletin – Volume 38, 2014
rate was 2.12% (134/6334) for clinically diagnosed dengue cases laboratory tested for dengue at the district level and 1.98% (126/6334) at the state level. The number of reported dengue cases compared to adjusted clinically diagnosed hospitalized laboratory tested dengue cases, and adjusted number of laboratory confirmed cases compared to the reported dengue cases at district and state levels is illustrated in Figure 1.
The adjustment factor for hospitalised confirmed cases for the private sector was 40.23 (1931/48) and for the public sector was 2.99 (257/86), indicating a 33.46% (86/257)reporting rate for the public sector, and 2.49 % (48/1 931) for the private sector. Year-wise, the adjustment factors for Madurai district were 12.99 (2009), 15.15(2010) and 34.15 (2011).
Table 2: Adjusted number of laboratory confirmed hospitalized dengue cases in Madurai, 2009–2011
Laboratory confirmed hospitalized dengue cases 2009 2010 2011 Average
2009–2011
Public Hospitals 234 476 62 257
Private Hospitals 1688 2768 1337 1931
1-50 beds 1211 2153 1020 1461
51-100 beds 129 120 16 88
More than 100 beds 348 495 302 382
Total 1922 3243 1400 2188
Table 3: Reported dengue cases at IDSP-Madurai district and state surveillance unit [DPH (TN)] for Madurai district
Reported dengue cases 2009 2010 2011 Average 2009–2011
Adjustment Factor
IDSP Reported dengue cases: Madurai
148 214 41 134 16.29
Public Hospital 73 146 40 86
Private Hospital 75 68 1 48
1–50 beds 1 5 0 2
51–100 beds 0 0 0 0
More than 100 beds 74 63 1 46
DPH (TN) Reported dengue cases for Madurai
120 214 43 126 17.41

Estimation of the adjustment factor for hospitalized clinical cases diagnosed and tested for dengue in Madurai, Tamil Nadu (India)
Dengue Bulletin – Volume 38, 2014 27
Between 2009 and 2011, the IDSP surveillance system at Madurai district reported on average 134 dengue cases, of which 64% were reported from the government sector and remaining 36% from the private sector. No dengue deaths were reported by the surveillance system of the study district from either public or private sector in 2009-2011 (unpublished data collected from Madurai district’s IDSP cell, Deputy Directorate of Health Services, 2012). The coverage of healthcare strata by the Madurai district surveillance system is presented in Figure 2. It clearly indicates the exclusion of private health care facilities from the reporting system. Also, none of the small and medium healthcare units, which mainly depend on the private laboratories for screening dengue, were covered under district surveillance reporting system.
Discussion
Since independence, by implementing various national policies and programmes, India has prioritized strengthening the public healthcare services through improving public facilities and appointing a large number of healthcare professionals. In 2005, the National Rural Health Mission (2005–2012) was launched by Government of India in 18 States, mainly to improve the effectiveness of quality care to rural population. Though the chain of healthcare delivery system in India seems well designed, only 20% of the population utilizes public
Figure 1: A comparison of DPH (TN) reported dengue cases with the estimated clinically diagnosed hospitalized dengue cases tested for dengue and the estimated confirmed
dengue cases for Madurai, 2009–2011
126 134
2188
6334
0
1000
2000
3000
4000
5000
6000
7000
DPH TN Reporteddengue cases for
Madurai
IDSP Reported dengue cases at district level
Adjusted hospitalized confirmed dengue cases
Adjusted clinically diagnosed hospitalized dengue cases tested for
dengue
Num
ber o
f Cas
es

Estimation of the adjustment factor for hospitalized clinical cases diagnosed and tested for dengue in Madurai, Tamil Nadu (India)
28 Dengue Bulletin – Volume 38, 2014
services. Approximately 80% of healthcare needs are still being met by the private sector due to dissatisfaction with quality of services at public hospitals, which means that about 80% of healthcare information is available in the private sector is neither included nor regulated.29-31
According to National Family Health Survey30, private sector plays a prime role in the last 25 years in catering the health needs in both rural (63%) and urban areas (70%) in India, in which about 46% of urban and 36% of rural households are approaching private doctors/clinics while private hospitals are second most common sources in private sector. Though the Indian healthcare delivery system is highly dominated by the private sector with around 70% of total market share, but their inclusion in the dengue surveillance system in India was limited.30 In this study it was found that the dengue epidemiological data relies mostly on the public sentinel units and a few major private hospitals and as consequences, the cases that dealt and treated by the private sector/ laboratories are not included for reporting which would lead to under-representation of overall dengue cases and deaths of study district.
Under IDSP framework, it was emphasized that at least 15 urban laboratories and 15 private practitioners/hospitals would be included per district under surveillance.32 In this
Figure 2: Coverage of healthcare stratum by the IDSP surveillance system in Madurai, 2009–2011
0
20
40
60
80
100
120
140
160
180
200
220
1-50 beds 51-100 beds More than 100 beds
Total Public Hospital Private Hospital
Num
ber o
f Lab
orat
ory
Con
firm
ed d
engu
e ca
ses
Hospital Stratum
2009
2010
2011
Estimation of the adjustment factor for hospitalized clinical cases diagnosed and tested for dengue in Madurai, Tamil Nadu (India)
Dengue Bulletin – Volume 38, 2014 29
study with regard to private sector, it was found that only 2.08% of private hospitals were included in the surveillance and observed a high level of under-reporting especially complete exclusion of dengue cases treated at private clinics, in both small and moderate healthcare units. Medical practitioners in private clinics and small healthcare units do not have diagnostic facilities for screening dengue but they utilize the services of private laboratories. All the laboratories and private hospitals who are utilizing the services of private laboratories are not covered under surveillance system, leading to enormous under-reporting of dengue cases and perhaps of dengue deaths. In order to organize and execute an effective dengue case management quick and timely reporting should be encouraged at all levels of healthcare facilities in both public and private sectors.33
This study has helped to document the fact that dengue reporting varies not only between public and private facilities, but also among public facilities. For example, a variation was observed in government sentinel units between the proportions of dengue cases confirmed by laboratory at public hospitals and number of cases reported in district surveillance system. As an apex laboratory, MMC was receiving suspected serum samples from its adjoining districts and often cases were also treated at city government hospitals. Therefore, a strong network should be developed between the district surveillance units in recording, monitoring and follow ups of those cases. Though the Madurai Railway Hospital is a government institution, it instituted the screening test for dengue only in 2009.
Laboratory confirmation improves the specificity of surveillance.34 As per the Government of India‘s guidelines on dengue treatment, Mac-Elisa is prescribed for the confirmatory test for dengue infection. However, many private laboratories and hospitals are detecting dengue through RCT. Dengue confirmation based on rapid diagnostic assays have not been considered as confirmed dengue cases as per the government surveillance system (IDSP), which contributes to understating the real number of dengue cases and deaths and having timely information for reducing disease transmission.
Our study has several limitations, especially the limited number of facilities studied which treat ambulatory dengue cases. Another likely limitation is the absence of testing of some hospitalized dengue patients. Our study focuses only on clinically diagnosed dengue cases hospitalized and tested for dengue.
In summary, this study is the first to our knowledge that used facility-based data to better understand the true burden of dengue in India. To obtain the overall number of hospitalized dengue cases, we need to include those who were hospitalized but not tested. To obtain the total number of symptomatic dengue cases, the number treated in the ambulatory setting must also be estimated. A companion paper presents these extensions, estimating 11 975 hospitalized cases, 24 312 ambulatory cases and 36 287 total clinical cases. These imply an adjustment factor of 281 relating total symptomatic dengue cases to reported dengue cases.35
As dengue varies by region and by year, it would be helpful to replicate this approach across other districts of India.

Estimation of the adjustment factor for hospitalized clinical cases diagnosed and tested for dengue in Madurai, Tamil Nadu (India)
30 Dengue Bulletin – Volume 38, 2014
Acknowledgements
The authors are thankful to Dr V.M. Katoch, Secretary, Government of India and Director General, Indian Council of Medical Research, New Delhi for permission and encouragement. Authors are also thankful to the various medical and healthcare institutions in Madurai and to the District and State health authorities for their support and interactive discussions on this study. They are also thankful to all the staff at CRME for their contributions in completion of this study.
References[1] World Health Organization. Global strategy for dengue prevention and control 2012-2020. Geneva:
WHO, 2012. http://www.who.int/immunization/sage/meetings/2013/ april/5_Dengue_SAGE_Apr2013_Global_Strategy.pdf - accessed 17 December 2014.
[2] World Health Organization. Dengue guidelines for diagnosis, treatment, prevention and control. Geneva: WHO, 2009. http://www.who.int/rpc/guidelines/ 9789241547871/en/ - accessed 17 December 2014.
[3] Ferreira GL. Global dengue epidemiology trends. Rev Inst Med Trop Sao Paulo. 2012 Oct;54(Suppl 18):S5–6. http://www.scielo.br/pdf/rimtsp/v54s18/a03v54s18.pdf - accessed 17 December 2014.
[4] Gubler DJ. Dengue, Urbanization and globalization: the unholy trinity of the 21st century. Trop Med Health. 2011 Dec;39(Suppl 4):3-11. http://www.ncbi.nlm.nih.gov/ pmc/articles/PMC3317603/ - accessed 17 December 2014.
[5] Karamchandani PV. Dengue group of fevers in India. Lancet. 1946;1:92.
[6] Sarkar JK, Chatterjee SN, Chakravarty SK. Haemorrhagic fever in Calcutta: some epidemiological observations. Indian J Med Res. 1964;52:651-659.
[7] Chatterjee SN, Chakravarti SK, Mitra AC, Sarkar JK. Virological investigation of cases with neurological complications during the outbreak of haemorrhagic fever in Calcutta. J Indian Med Assoc. 1965;45:314-316.
[8] Carey DE, Myers RM, Reuben R, Rodrigues FM. Studies on dengue in Vellore, South India. Am J Trop Med Hyg. 1966;15:580-587.
[9] Government of India, Ministry of Health and Family Welfare. Dengue epidemiology. New Delhi: National Vector Borne Disease Control Programme, 2013. www.nvbdcp.gov.in/den-cd.html - accessed 18 December 2014.
[10] World Health Organization, Regional Office for South-East Asia. Comprehensive guidelines for prevention and control of dengue and dengue haemorrhagic fever. New Delhi: WHO-SEARO, 2011. http://www.searo.who.int/entity/vector_borne_tropical_ diseases/documents/SEAROTPS60/en/ - accessed 18 December 2014.
[11] Government of India, Ministry of Health and Family Welfare. National surveillance programme for communicable diseases. New Delhi: NIHFW, 2013. http://nihfw.nic.in/ndc-nihfw/html/programmes/nationalsurveillance.htm - accessed 18 December 2014.

Estimation of the adjustment factor for hospitalized clinical cases diagnosed and tested for dengue in Madurai, Tamil Nadu (India)
Dengue Bulletin – Volume 38, 2014 31
[12] Government of India, Ministry of Health and Family Welfare. Compendium on India epidemic intelligence service (EIS) training programme. Delhi: National Centre for Disease Control, 2013. http://nicd.nic.in/writereaddata/linkimages/ Final_EIS_Comp_20137587478311.pdf – accessed 18 December 2014.
[13] Indian Institute of Management, Chikungunya epidemic mortality in India: lessons from “17th Century bills of mortality” still relevant. Ahmedabad: IIM, 2007. W.P. No. 2007-07-12. http://iimahd.ernet.in/assets/snippets/workingpaperpdf/2007-07-12Mavalankar. pdf – accessed 18 December 2014.
[14] Government of India, Central Bureau of Health Intelligence. Health information of India. New Delhi. CBHI, 2005. pp. 169-77.
[15] Murray CJL, Lopez AD. The Global burden of disease. Cambridge: Harvard School of Public Health, 1996. pp. 624-25.
[16] Kabilan L, Balasubramanian S, Keshava SM, Satyanarayana K. The 2001 dengue epidemic in Chennai. Indian J Pediatr. 2005;72:919-23.
[17] National Vector Borne Disease Control Programme. List of sentinel surveillance hospitals (347) for dengue and chikungunya for the year 2012. New Delhi : NVBDCP, 2013. http://nvbdcp.gov.in/Doc/SSH-Dengue-Chikungunya.pdf - accessed 18 December 2014.
[18] Government of India, Ministry of Health and Family Welfare. Integrated Disease Surveillance Project. New Delhi: National Centre for Disease Control, 2013. www.ncdc.gov.in/index2.asp?slid=478&sublinkid=149 – accessed 18 December 2014.
[19] Prasad MN, Mithilesh M, Rao GVR. Public health surveillance in India challenges and opportunities. Indian Emerg J. 2010;5:21-26.
[20] Beatty E, Stone A, Fitzsimons DW, Hanna JN, Lam SK, Vong S, Guzman MG, Mendez-Galvan JF, Halstead SB, Letson GW, Kuritsky J, Mahoney R, Margolis HS; Asia-Pacific and Americas Dengue Prevention Boards Surveillance Working Group. Best practices in dengue surveillance: a report from the Asia-Pacific and Americas Dengue Prevention Boards. PLoS Negl Trop Dis. 2010 Nov 16;4(11):e890. doi: 10.1371/journal.pntd.0000890. http://www.ncbi.nlm.nih.gov/pubmed/21103381 - accessed 18 December 2014.
[21] Kakkar M. Dengue fever is massively under-reported in India, hampering our response. BMJ. 2012;345:e8574.
[22] Gupta E, Dar L, Geetanjali Kapoor, Shobha Broor. The changing epidemiology of dengue in Delhi, India. Virol J. 2006;3:92. http://www.virologyj.com/content/3/1/92 - accessed 18 December 2014.
[23] Gupta B, Niranjan Reddy BP. Fight against dengue in India: progresses and challenges. Parasitol Res. 2013;112:1367-78.
[24] Harris G. As dengue fever sweeps India, a slow response stirs experts’ fears. New York Times. 2012 Nov 6. http://www.nytimes.com/2012/11/07/world/asia/alarm-over-indias-dengue-fever-epidemic.html?nl=todaysheadlines&emc=edit_th _20121107&_r=1& - accessed 18 December 2014.
[25] Government of India, Ministry of Health and Family Welfare. Mid term plan (2011-2013) for prevention and control of Dengue and Chikungunya. New Delhi: Directorate of National Vector Borne Disease Control Programme, 2013. www.nvbdcp.gov.in/Doc/Mid-Term-Plan-Dengue-Chikungunya-%202011-13.pdf – accessed 18 December 2014.
[26] Shepard DS, Coudeville L, Halasa Y, Zambrano B, Dayan GH. Cost of dengue in the Americas. American Journal of Tropical Medicine and Hygiene. 2011;84(2):200-7.

Estimation of the adjustment factor for hospitalized clinical cases diagnosed and tested for dengue in Madurai, Tamil Nadu (India)
32 Dengue Bulletin – Volume 38, 2014
[27] Undurraga EA, Halasa YA, Shepard DS. Use of expansion factors to estimate the burden of dengue in Southeast Asia: a systematic analysis. PLoS Neglected Tropical Diseases. 2013;7(2):e2056, doi:10.1371/journal.pntd.0002056.
[28] Population Reference Bureau. World population data sheet (1962-2012). Washington, DC: PRB, 2012. http://www.prb.org/pdf12/2012-population-data-sheet_eng.pdf - accessed 18 December 2014.
[29] Government of India, Ministry of Health and Family Welfare. National rural health mission: meeting people’s health needs in rural areas: framework for implementation 2005-2012. New Delhi: MOH&FW. http://jknrhm.com/Guideline/ Frame_Work.pdf - accessed 18 December 2014.
[30] Government of India, Ministry of Health and Family Welfare, International Institute for Population Science, Macro International. National Family Health Survey (NFHS-3) 2005-2006. Mumbai, 2007. pp. 411-47.
[31] Joshi R. Public health information network: need of the hour. Pune, 2008. www.dataonweb.com/webPMC/vision2020/PHIN_ver1.pdf - accessed 18 December 2014.
[32] Government of India, Ministry of Health and Family Welfare. Integrated disease surveillance project. New Delhi: MOH&FW. http://mohfw.nic.in/index1.php?lang= 1&level=5&sublinkid=3218&lid=2188 – accessed 18 December 2014.
[33] World Health Organzation, Pan American Health Organization. Dengue and dengue hemorrhagic fever in the Americas. Washington: WHO-PAHO, 1997.
[34] Runge Ranzinger S, Horstick O, Marx M, Kroeger A. What does dengue disease surveillance contributes to predicting and detecting outbreaks and describing trends. Trop Med Int Health. 2008;13:8:102-41.
[35] Shepard DS, Halasa YA, Tyagi BK, Adhish SV, Nandan D, Karthiga KS, Chellaswamy V, Gaba M, Arora NK, INCLEN Study Group. Economic and disease burden of dengue illness in India. Am Soc Trop Med & Hygiene. 2014;91(6):1235-42. doi:10.4269/ajtmh.14-0002. http://www.ajtmh.org/content/early/2014/10/02/ ajtmh.14-0002.full.pdf - accessed 18 December 2014.

Dengue Bulletin – Volume 38, 2014 33
Dengue vectors survey at Punjab University, Lahore, Pakistan, January 2012 – April 2014
Muhammad Saeed Akhtara,#, Ayesha Aithetashama, Mehwish Iqtedarb, Nasim Beguma and Muhammad Akhtara
aDepartment of Zoology, University of the Punjab, P.O. Box No.54590, Lahore, Pakistan bDepartment of Biotechnology and Microbiology Lahore College University for Women,
Lahore, Pakistan
Abstract
During the period (January 2012-April 2014), 13 positive samples of dengue larvae (per 200 ml of water) were recovered from different sites of Punjab University. Aedes albopictus larvae were more common (59.1%0) than Ae. aegypti (40.9%). More larvae were recovered in September (51) as compared to October (7) and November (10) during 2012. In 2013, however, more larvae of dengue collected in July (35) as compared to August (18) and September (6), and started appearing in the samples earlier than 2012. The adults of dengue (recovered by CDC aspirator appeared much earlier in 2014 (i.e., March and April) than 2013 (June and July) and 2012 (August and September). In Pakistan dengue vector species are spreading their tentacles to cooler span of the year and colder parts of Pakistan. For example, record of Dengue cases in 2013 from Swat, a cooler locality in Pakistan.
Keywords: Dengue vectors; survey; Lahore; Pakistan.
Introduction
Dengue fever surfaced in Pakistan and particularly in Punjab, Lahore very strongly infecting 21 292 humans and killing 354 during 2011. Since then the Government of Punjab and different Universities/Departments have organized themselves to combat the disease and to exterminate the vectors. But the dengue vectors have stayed for a long time wherever they entered, posing a constant threat to the public. For example, for nearly 60 years, dengue was eradicated from the United States with the onset of mosquito combat spraying and prevention campaigns. But since 2001, outbreaks in Hawaii, Texas and Florida’s Key West have signaled its return1.
#E-mail: [email protected]

Dengue vectors survey at Punjab University, Lahore, Pakistan, January 2012 – April 2014
34 Dengue Bulletin – Volume 38, 2014
In 2013, dengue fevers out breaks were reported from various areas of Pakistan. A severe Dengue outbreak confronted District Swat Khyber Pakhtunkhwa province, and from 7th August to 19th September, a total of 5194 Dengue fever cases and 14 deaths were reported.
Fifteen samples tested at NIH revealed that three types of virus (DNV-1, DNV-2, DNV-3) were detected in different patients from Swat2.
Ae. aegypti is highly anthropophilic species and often resides in and near human dwellings, preferentially feeding on humans3,4. After dengue outbreak in Lahore in 2011, regular monitoring of both larvae and adults is being carried out. In spite of preventive control measures in Punjab University area, Dengue vectors in addition to other Culex species stayed in the area and were recovered in samples. In the present report only Dengue vectors larvae and adults are discussed and not the other Culex species which are far more abundant, but are not transmitting diseases at the moment except invading houses for blood feeding exclusively at night on humans.
Materials and methods
Larvae
The studies involved collection of mosquito larvae from reservoirs and containers with water because of rain or negligence of humans. If reservoir or container was positive for the presence of larvae, a sample of 200 ml jar was taken and species identified using WHO guidelines. Water reservoirs were water tanks dug up in the ground (4 feet wide and 5 feet deep), basically developed for experiments on snails. Later on, they were abandoned, and became the abode of mosquitoes. The second types of water reservoirs were drains to irrigate surrounding lawns with tube well water. When the drains were not used for irrigation, the stagnant water was the breeding site for mosquitoes. The containers were dishes of flowers pots, coal tar drums, desert coolers, tree holes, and tyres. The day one type of container was positive for larvae, the total number of containers of that nature examined for that day were considered for container Index (CI), which was worked out as the percentage of water holding containers with larvae.
Adults
Adult mosquitoes were collected from student hostels, teachers’ residences and their surroundings from July to December 2012 using CDC aspirator. The collection effort for each sample was fixed (10 minutes).
The data were statistically analyzed for Correlation using “Graph Pad Prism version 5.00 for Windows, Graph Pad Software, San Diego California USA, www.graphpad.com”.

Dengue vectors survey at Punjab University, Lahore, Pakistan, January 2012 – April 2014
Dengue Bulletin – Volume 38, 2014 35
Results
Table 1 gives details of dengue vector larvae recovered in 13 positive samples of 200 ml each from sewer free water sources from different departments, hostels, tyres, flower pots etc., of Punjab University area. In 2012, larvae were recorded from September onwards up to 13 November 2012. In 2013, larvae were recovered slightly earlier, i.e., from 17 July 2013 and up to 30 September 2013 (Figure 1).
Table 1: Dengue vector larvae (under different temperature and humidity conditions) recovered from Punjab University (Quaid-e-Azam) campus in 200 ml sample,
during 2012 to 2014
Date and Locality Aedes aegypti
Aedes albopictus
Temperature(°C)
Humidity (%)
11.9.2012 (Zoology Depart. Tank 2) 2 34.5 78
13.9.2012 (School of Biological Sciences) 31 35.0 79
14.9.2012 (P.U.Town II) 8 36.0 79
19.9.2012 (English Depart.) 10 29.6 88
9.10.2012 (Hostel No 4) 2 1 33.5 71
9.10.2012 (Hostel No. 9) 4 27.0 71
12.11.2012 (Girls Hostel No.1) 4 27.0 84
13.11.2012 (Girls Hostel No.6) 6 25.8 89
17.7.13 University Executive club, From Tree hole in Alstonia 15 31.5 69
24.7.13 Outside Controller of Examination, From Tyre 20 35.4 96
22.8.18 Department of Botany, from Flower pot 18 35 53
30.9.2013 Jogging Track 3 33.6 62
30.9.2013 (Hostel No 4) 3 33.6 62
Total 52 75
*No larvae of Dengue vectors were collected from University area up to May 8, 2014Correlation coefficient between:No. of Larvae of Ae. aegypti vs. Temperature(r=0.389; P >.05; d.f.3; N.S.) vs. Humidity (r= 0.165; P>.05; d.f.3; N.S.)No. of Larvae of Ae. albopictus vs. Temperature (r=0.205; P >.05; d.f.7;.N.S.) vs. Humidity (r=0.188; P >.05; d.f.7;N.S.)

Dengue vectors survey at Punjab University, Lahore, Pakistan, January 2012 – April 2014
36 Dengue Bulletin – Volume 38, 2014
Table 2 shows the type of water reservoirs/containers examined for the presence of larvae. As only the number of containers examined for the day when containers of that type were positive were considered, CI is very high in some cases. For example, for tyres, the CI is 50. The overall CI, however, was 11.11.
Table 2: Number with container index (CI) the percentage of water-holding containers larvae
Containers/ water sources/reservoirs No. examined No. infested Container index
(CI)
Water tanks in soil 8 1 12.5
Dishes of flower plants 14 1 7.14
Coal Tar drums 6 1 16.66
Desert Coolers 41 4 9.75
No. of tree holes 20 1 5.0
Drains with standing water 6 1 16.16
Tyres 4 2 50.0
Total 99 11 11.11
Figure 1: Dengue vector larvae recovered from Punjab University (Quaid-e-Azam) campus in 200ml sample, during 2012 to 2014
Jan Feb Mar Apr May Jun Jul Aug Sep Oct Nov0
20
40
602012
2013
35
18
51
6 710
Months
Num
ber o
f Lar
vae

Dengue vectors survey at Punjab University, Lahore, Pakistan, January 2012 – April 2014
Dengue Bulletin – Volume 38, 2014 37
In 2012, only one dengue fever patient was reported from boy’s hostel and the patient recovered after treatment. In 2013, twenty one suspected cases of dengue fever were registered in Punjab University Health Centre. Out of these, 7 cases were referred to Shaukat Khanum Memorial Hospital for confirmation. All these patients received treatment from the Health centre and recovered. As far as abundance of dengue larvae is concerned (Table 3) larvae of Ae. albopictus were more abundant (59.1%) than Ae. aegypti (40.9%).
Table 3: Abundance of dengue larvae* from clean water sources/ containers from Punjab University Lahore. (Data based on 13 positive samples of 200 ml each)
Species No. of specimens Percentage of total
Ae. aegypti 52 40.9
Ae.albopictus 75 59.1*larvae of culex species recovered along with dengue larvae are not described in the present report, but they were highly abundant.
The adults were collected with help of CDC aspirator with a collection effort of 10 minutes for each sample. The details are submitted in Table 4. During 2012, adults of dengue vectors were recovered from August to December and were more abundant (Figure 2) in October (recovered 29 adults). In 2013, dengue adults started appearing in the samples from 19.6.13 and samples were positive up to 11.11.13. Dengue adults (mostly Ae. albopictus) expanded.
Figure 2: Number of dengue adults collected from August 2012 to May 2014 from Punjab University with the help of CDC aspirator
0 1 2 3 4 5 6 7 8 9 10 11 120
10
20
30
402012
2013
2014
4 2 2 1
7
2 21
4
29
41
20
Months
Num
ber
of a
dults

Dengue vectors survey at Punjab University, Lahore, Pakistan, January 2012 – April 2014
38 Dengue Bulletin – Volume 38, 2014
Table 4: Number of dengue adults collected from August 2012 to May 2014 from Punjab University using CDC aspirator
Months A. aegypti A. albopictus Temperature(°C)
Humidity at 5.00 P.M.
23.8. 2012 Jogging Track 1 28.4 6213.9.2012 School of Biological Sciences 3 35 6425.9.2012 Department of Zoology 2 1 34.8 4201.10.2012 Sport Ground 4 6 35.3 4102.10.2012 Sport Ground 3 35.4 4409.10.2012 Hostel No. 4 2 1 33.5 4130.10.2012 Jogging Track 6 29 5031.10.2012 Jogging Track 11 29.5 5105.11.2012 Hostel No. 9 1 29.7 7312.11.2012 Girls Hostel No. 1 3 27 4304.12.2012 Jogging Track 1 22.6 4219.06.2013 Jogging Track 1 39.2 5324.06.2013 Jogging Track 1 39.2 5223.7.2013 Department of Zoology 1 35.5 9601.08.2013 Department of Zoology 1 37.2 5101.08.2013 Computer Lab 1 37.2 5107.08.2013 Department of Zoology 1 35.2 6719.08.2013 Department of Zoology 1 34.8 6621.8.2013 Department of Physics 8 32.3 6222.8.2013 Department of botany 7 35 5731.8.2013 Department of Zoology 1 34.4 6214.9.2013 Department of zoology 1 34.5 7830.9.2013 Jogging track 3 37.7 4430.9.2013 Botanical garden 3 37.7 4523.10.2013 Jogging track 1 1 29.6 5411.11.2013 School of Biological sciences 2 26.2 44*18.3.2014 Department of Botany 0218.3.2014 Jogging track 0110.4.2014 I.E.R School 0115.4.2014 Girls Hostel No. 7 01
Total 10 68*Correlation coefficient was worked out for data of only 2012 to 2013: No. of adults of Ae. aegypti vs. Temperature (r=0..603; P>.05; d.f. 5; N.S.) v.s. Humidity (r=-0.209; P>.05; d.f. 5; N.S,).No. of adults of Ae. albopictus vs. Temperature (r=-0.185; P> .05; d.f. 21; N.S.) vs. Humidity (r=-0.157; P>.05 ; d.f. 21; N.S.).

Dengue vectors survey at Punjab University, Lahore, Pakistan, January 2012 – April 2014
Dengue Bulletin – Volume 38, 2014 39
Their survival span to cooler months of the year and consequently dengue vectors during 2014 were recovered in the samples much earlier, i.e., March-April 2014. Adults of Ae albopictus (Table 5) were more abundant (87.18%) than Ae.aegypti (12.82%).
Table 5: Abundance of dengue adults in Punjab University area in 24 positive samples.
Species No. of specimens Percentage of total
Ae. aegypti 10 12.82
Ae.albopictus 68 87.18*Adults of culex species recovered along with dengue adults are not described in the present report, but they were highly abundant.
As regards relationship with temperature and humidity conditions, dengue adults and for that matter dengue cases were more common from September to November, every year. However, relationship of Ae. aegypti larvae with temperature and humidity was not significant (r=0.389) and (r= 0.165), respectively. Similarly the relationship between the recoveries of larvae of Ae. albopictus with temperature and humidity was insignificant (r=0.201),and (r=0.188), respectively.
Availability of Dengue adults in the samples with respect to the temperature and humidity was also considered. In general Dengue mosquitoes were rare during hot period of the year (May and Mid-June, 2013) and also during cold winter. May 2014 was exceptionally cool and comfortable but during 10–12 June 2014 temperature reached up to 48 °c in Lahore. The samples revealed that dengue mosquitoes have evolved adaptability to slightly colder part of the year and were available up till November 2013. The recovery of Ae. aegypti adults at different temperature conditions of the dengue season showed weak and non significant relationship with temperature (r=0.603) but negative and weak with humidity (r= -0.209). The relationship of Ae. albopictus adults with temperature and humidity conditions was very weak, negative and non significant ( r=-.185 ) and (r=–0.157 ), respectively.
Discussion
Dengue is the most common mosquito-borne viral disease in tropical and subtropical regions of the world, and hence, dengue virus (DEN) is an emerging human pathogen of major importance5. Dengue has also expanded its area of distribution and according to a new estimate, 3.6 billion (55% of the world’s population) are at risk of dengue in 124 endemic countries with an estimated 21 000 deaths every year6.
There is no community-based mosquito surveillance data available for Lahore and particularly about Punjab University area. Data about a few localities of Lahore were published in 2011 about House Index (HI) and were 4.16, 2.76, 2.32 for October, November and December, respectively7. Dengue fever outbreaks have been reported from Pakistan in 1994,

Dengue vectors survey at Punjab University, Lahore, Pakistan, January 2012 – April 2014
40 Dengue Bulletin – Volume 38, 2014
1995, and19978,9 which indicates that dengue persisted at different times and in different parts of the country. The histogram given below shows dengue status in different Provinces of Pakistan. Up till 26 April 2014, there were 179 positive dengue cases in Sindh, four in Punjab and Zero in KP2 (Figure 3).
It is predicted that like 2013, dengue epidemic will spread in Khyber Pakhtunkhwa and Punjab after migration of viremic people (mostly labourers) from Sindh to celebrate Eid-ul-Fitr in their native towns in Khyber Pakhtunkhwa and Punjab, during July 2014.
Ae. aegepti infests urban habitats and breeds mostly in artificial container and is a primary vector of dengue. Ae. albopictus, a secondary dengue vector in Asia, is highly adaptive and can survive in cooler temperature regions of Europe. The Asian tiger mosquito can outcompete and eradicate other species with similar breeding habits from the start of its dispersal to other regions and biotopes, It is also known that Ae. albopictus can transmit pathogens and viruses, such as West Nile Virus, Yellow fever virus, St. Louis encephalitis, dengue fever and Chikungunya fever10. The Asian tiger mosquito was responsible for ckikungunya epidemic on the French Island La Reunion in 2005–200611. By September 2006, there were estimated 266 000 people infected with the virus, and 248 fatalities on the Island 11. In Pakistan, however, the Asian tiger mosquito has not been reported to transmit any other virus, so far.
Ae. albopictus has proven to be very difficult to suppress or to control due to their remarkable ability to adapt to various environments, their close contact with humans, and their reproductive biology. Recently (2013) in Pakistan, this mosquito expended its area of distribution and a sort of epidemic in Swat demands serious consideration. The spread of Ae.
Figure 3: Number of positive dengue fever cases by province (1 Jan to 26 Apr 2014)
0 Sindh Punjab KP Balochistan0
50
100
150
200
Num
ber
of c
ases
179
4 0 0

Dengue vectors survey at Punjab University, Lahore, Pakistan, January 2012 – April 2014
Dengue Bulletin – Volume 38, 2014 41
alobpictus is also due to its tolerance to temperature below freezing, hibernation, and ability to shelter in microhabitats. As pointed in the results, dengue cases in Punjab are common during September and October because of favourable temperature and humidity conditions. Frequent rains during dengue season also promote breeding of the dengue mosquitoes.
Table 6: Summary of dengue cases
Year Number of cases reported Number of deaths
By November 2013* 1362 in Punjab 5 in Punjab
By November 2012** 261 Nil
By November 2011 21292 354*The Dawn, 9-11-2013; ** The News, 16-11-2012
The role of dengue vectors in spreading disease in various areas of Pakistan is shown in Figure 3. As indicated in Table 6, after dengue epidemic in 2011 when 21 292 cases were reported with 354 deaths, Government of Punjab and other research organizations started monitoring population of dengue vectors. As a result there was a decline in dengue cases in Punjab in 2012 to 2013. The exception was Swat area where 5194 cases were reported and there were 14 deaths2. Dengue problem in Swat started with migration of labourers/workers from Sindh to celebrate Eid-ul-Fitr in their native towns in Swat and suburbs. It is also important to note that dengue vectors (especially Ae .albopictus) are expanding their span of activity to cooler part of the year and cooler parts of Pakistan and they successfully continued breeding in Swat which has a relatively temperate climate.
In Punjab University Health Centre, 21 suspected dengue fever cases were reported. Out of these, seven patients were referred to the Shaukat Khanum Memorial Cancer Hospital for confirmation. All these patients received the treatment and recovered. Thus, Punjab witnessed considerable decrease in the number of dengue fever cases from 2011 to 2013, as a result of organized control measures.
Conclusion
Very hot summer and very cold winter in Punjab restricts the breeding of dengue vectors. There is, however, no definite relationship of availability of larvae and adults with temperature and humidity. Frequent rains during dengue seasons (August to November) promote breeding of dengue vectors. Preventive and chemical control measures organized by the Government of the Punjab and other research organizations have to a considerable extent controlled the surge of dengue vectors population from 2011–2013. But still there is a need to monitor the population to completely eradicate dengue vectors from Punjab.

Dengue vectors survey at Punjab University, Lahore, Pakistan, January 2012 – April 2014
42 Dengue Bulletin – Volume 38, 2014
Acknowledgement
The authors are grateful to the Vice-Chancellor (Prof Dr. Mujahid Kamran) for providing necessary facilities to accomplish the work.
References[1] Sagastume P. Dengue fever presence in Florida at a pretty serious level. Aljazera America. 2013 Sep 12.
http://america.aljazeera.com/articles/2013/9/12/dengue-fever-presenceinfloridaataprettys eriouslevel.html - accessed 18 December 2014.
[2] World Health Organization. Weekly Epidemiological Bulletin. 2014;5(17).
[3] Gubler DJ, Kuno G. Dengue and denue hemorrhagic fever. New York: CAB International,1997.
[4] Thavara U, Tawatsin A, Chansang C, Kong-ngamsuk W, Paosriwong S, Boon-Long J, Rongsriyam Y, Komalamisra N. Larval occurrence, oviposition behavior and biting of potential mosquito vectors of dengueon Samui Island, Thailand. J. Vector Ecol. 2001Dec;26(2):172-80.
[5] Gubler DJ. Epidemic dengue/dengue hemorrhagic fever as a public health, social and economic problem in the 21st century. Trends Microbiol. 2002 Feb;10(2):100-3.
[6] Pediatric dengue vaccine initiative. Global Burdon of dengue. Kwanal http://www.pdvi.org/about_dengue/GBO.asp - accessed 18 December 2014.
[7] Akhtar MS, Aihetasham A, Saeed M, Abbas G. Aedes survey following a dengue outbreak in Lahore, Pakistan. Dengue Bulletin. 2012;36:87-93.
[8] Chan YC, Salahuddin NI, Khan J, Tan HC, Seah CL, Li J, et al. Dengue haemorrhagicfever outbreak in Karachi, Pakistan. Trans R Soc Trop Med Hyg. 1995;89:619-20.
[9] Qureshi JA , Notta NJ, Salahuddin N, Zamman V, Khan JA. An epidemic of dengue fever in Karachi- associated clinical manifestations. J Pak Med Assoc. 1997 Jul;47(7):178-81.
[10] Hochedez, P Jaureguiberry S, Debruyne M, Bossi P, Hausfater P, Brucker G, et al. Chikungunya infection in travelers. Emerg Infect Dis. 2006 Oct;12(10): 1565-67. http://www.ncbi.nlm.nih.gov/pmc/ articles/PMC3290953/ - accessed 18 December 2014.
[11] Flauhaut A. Chikunguna—Indian Ocean update (32). ProMED. 2006 Oct 14. archive no. 20061014.20062953. http://www.promedmail.org - accessed 18 December 2014.

Dengue Bulletin – Volume 38, 2014 43
Trends in dengue during the periods 2002–2004 and 2010–2012 in a tertiary care setting in
Trivandrum, Kerala, IndiaHenna ASa, Ijas Ahmed Ka, Harilal SLa, Saritha Na,
Ramani BaiJ Ta, Zinia T Nujuma#,
aMedical College, Thiruvananthapuram, Kerala, India
Abstract
Dengue has become one of the major public health concerns in recent years. Kerala is now hyperendemic for dengue. Over the past 10–15 years, next to diarrhoeal disease and acute respiratory infections, dengue has become a leading cause of hospitalisation and deaths. This study was done to compare the trends in the proportionate positivity of dengue among samples tested for dengue IgM during the periods 2002–2004 and 2010–2012 in the Microbiology Department, Government Medical College, Thiruvananthapuram, to look for seasonality and to find age-sex characteristics of the disease during these periods. A descriptive study was done from the records of the Microbiology department, Government Medical College, Thiruvananthapuram. All those patients with clinically suspected dengue whose blood samples were sent to the microbiology department during the period 2002–2004 and 2010–2012 were studied. 10 064 samples were tested over a period of 6 years (2002–2004 & 2010–2012). Out of these, 3334 samples were positive for dengue (33.1%). When compared to 2002–2004 period, there’s a significant increase in dengue positivity for the period 2010–2012 (23.7% v/s 35.8%; p value<0.001).Mean age of study population was 27.05 years (standard deviation-19). Mean age of positive dengue was significantly higher during the period 2010–2012 (27.58) when compared to 2002–2004 (24.42) with p value <0.001. The proportionate dengue positivity among females (34.1%) was higher than males (32.3%). However, among the total 3334 positive cases, 1808 cases (54.2%) were males. A higher increase in the proportionate positivity of dengue was seen among females from 24.2% in 2002–2004 to 36.7% in 2010–2012 (12.5%) when compared to the increase from 23.2% to 35.1% in males (11.9%). Dengue positivity was higher during the months June, July and August (22.6%, 16.2%, and 10.9% respectively). No difference in seasonality was seen across years. There is a rise in dengue positivity over the years and the age of occurrence has also increased. Pre-monsoon activities should be strengthened to reduce the incidence of dengue.
Keywords: Dengue; Proportionate positivity of dengue; Seasonality; Thiruvananthapuram; Kerala.
#E-mail: [email protected]

Trends in dengue during the periods 2002–2004 and 2010–2012 in a tertiary care setting in Trivandrum, Kerala, India
44 Dengue Bulletin – Volume 38, 2014
Introduction
Dengue is one of the most serious and rapidly emerging tropical mosquito-borne diseases. In 2012, dengue ranks as the most important mosquito-borne viral disease in the world1.The global disease burden is 465 000 Disability adjusted life years (DALYs), which is only paralleled by that of malaria among mosquito-borne diseases 2. Worldwide, approximately 2.5–3 billion people (40% of the global population) live in constant risk of contracting this infection. It was estimated that 50 million cases and 24 000 deaths occur annually in 100 endemic countries worldwide. Nearly 500 000 cases are hospitalized annually, of which 90% are children. The south-east Asia region contributes 52% of the cases annually 3. Using cartographic approaches, the annual estimate has been shown to be 390 million (95% credible interval 284–528) dengue infections per year, of which 96 million (67–136) manifest apparently 4.India is one of the seven identified countries in this region that regularly reports dengue fever/dengue hemorrhagic fever (DF/DHF) outbreaks. India appears to be transforming into a major hyperendemic niche for dengue infection. Increasingly, previously unaffected areas are being struck by the dengue epidemic. The first confirmed report of dengue infection in India dates back to the 1940s. Thereafter, several states began to report the disease, which mostly struck in epidemic proportion, often inflicting heavy morbidity and mortality, both in urban and rural environments 5,6.
In Kerala, cases of dengue, including some deaths, were reported for the first time in 1997; nevertheless, DEN-1, DEN-2 and DEN-4 viruses had been previously detected in human sera. Dengue antibodies had been detected in human sera from Kozhikode, Kannur, Palakkad, Thrissur, Kottayam and Thiruvananthapuram districts as early as 19797. The first outbreak in large numbers in Kerala occurred in 2003, soon after the southwest monsoon8.
The risk of dengue has shown an increase in recent years due to rapid urbanization, lifestyle changes and deficient water management including improper water storage practices in urban, peri-urban and rural areas, leading to proliferation of mosquito breeding sites9.
This study was done to compare the trends in the clinically suspected dengue, proportionate positivity of dengue among samples tested for dengue and case load during the periods 2002–2004 and 2010–2012 in the Microbiology Department, Government Medical College, Thiruvananthapuram. The years 2002–2004 marks the beginning of the epidemic of Dengue and the latter years represent the latest available information at the point of the study. We also tried to look for the variations and trends in the age-sex distribution and seasonality across the years.
Methods
A record-based descriptive study was done using the records of Microbiology department, Government Medical College, Thiruvananthapuram. Medical College Hospital, located in Thiruvananthapuram, Kerala, India, is a premier institution for the provision of comprehensive

Trends in dengue during the periods 2002–2004 and 2010–2012 in a tertiary care setting in Trivandrum, Kerala, India
Dengue Bulletin – Volume 38, 2014 45
tertiary health care irrespective of economic or social status and disabilities. It is the largest multi-specialty hospital in South Kerala and serves the major portion of Thiruvananthapuram and Kollam districts and the adjacent districts of Tamil Nadu. All those patients with clinically suspected dengue presenting to this tertiary setting are tested for dengue at the Microbiology department. The samples for serology were tested for dengue virus IgM antibodies by IgM capture ELISA. This is a qualitative detection of IgM antibodies against dengue virus antigen (1–4) in human serum10. The samples pertained to the periods 2002–2004 and 2010–2012. Data collection period consisted of 3 months from August–October, 2013. Important variables included in the data collection Pro forma were year, month, age, sex and results-positive/negative. Proportionate positivity of dengue in this study was defined as the percentage of blood samples tested positive for dengue. Ethical clearance from the Institution Ethical Committee and the permission from the corresponding heads of the departments were obtained. The significance of the difference in proportionate positivity, gender differences across the years and period was tested using chi-square test. The mean age of the positive cases in the two periods were compared to look for any age shift, by the t-test
Results
Out of 10 064 samples tested over a period of 6 years, 3334 (33.1%) were positive for dengue. Among the total tested samples, 7836 (77.9%) samples were collected during 2010–2012 as compared to 2228 (22.1%) collected during 2002–2004. Of the total positive cases, 2807 (84.2%) cases were from 2010–2012 and 527 (15.8%) cases were from 2002–2004. A significantly higher proportion (p value <0.001) of samples tested during 2010–2012 were positive for dengue as compared to 2002–2004 (35.8 % and 23.7 %). The year-wise proportionate dengue positivity is shown in Figure 1. It was the highest in 2012, when nearly half (42%) of the tested samples were positive. 2012 also contributed to 37% of total dengue positive cases. However maximum number of samples was tested during 2010. Out of the total positive cases,1.1%, 6.1%, 8.5%, 32.3%, 15.2% and 36.6% belonged to years 2002, 2003, 2004, 2010, 2011 and 2012 respectively (Table 1, Figure 2).
Out of the total samples that were tested, 5590 (55.5%) samples were of males and 4474 (44.4%) samples were of females. The proportionate dengue positivity among females (34.1%) was higher than males (32.3%). However, among the total 3334 positive cases, 1808 cases (54.2%) were males. These differences were however not statistically significant. The proportionate positivity of dengue among males increased from 23.2% in 2002–2004 to 35.1% in 2010–2012. A higher increase in the proportionate positivity of dengue was seen among females from 24.2% to 36.7% (12.5 %), when compared to the increase from 23.2% to 35.1% in males (11.9%). This increase is also consistently seen across the years (Table 2). In males,the proportionate positivity increased from 21.1% in 2002 to 41.6% in 2012. In females,it has increased from 18.9% in 2002 to 42.3 in 2012.

Trends in dengue during the periods 2002–2004 and 2010–2012 in a tertiary care setting in Trivandrum, Kerala, India
46 Dengue Bulletin – Volume 38, 2014
Figure 1: Proportionate positivity of dengue across the years studied
20.2
26.122.6
35.6
26.8
41.9
0
10
20
30
40
50
60
70
80
90
100
2002 2003 2004 2010 2011 2012
% o
f po
sitiv
e ca
ses
Year
Table 1: Proportionate positivity of dengue during years studied
2002 2003 2004 2010 2011 2012 2002–2004
2010–2012 Total
Dengue positive
38(20.2%)
205(26.1%)
284(22.6%)
1078(35.6%)
508(26.8%)
1221(41.9%)
527 (23.7%)
2807(35.8%)
3334(33.1%)
Dengue Negative
150(79.8%)
581(73.9%)
970(77.4%)
1950(64.4%)
1386(73.2%)
1693(58.1%)
1701(76.3%)
5029 (64.2%)
6730(66.9%)
Total 188(1.9%)
786 (7.8%)
1254(12.5%)
3028(30.1%)
1894(18.8%)
2914(29.0%)
2228(100%)
7836(100%)
10064(100.0%)
There has been a significant shift in mean age of the clinically suspected and positive dengue cases towards higher ages from 2002 to 2012 and across the two comparison periods (Table 3 and Table 4). The mean age of clinically suspected cases increased from 15.91 (SD-16.39) in 2002 to 27.05 in 2012. The maximum number of clinically suspected (30% and 32%) and positive dengue cases (34% and 36%) was found in the age groups of 20–40 years during the two comparison periods. (Table 5, Figure 3)
Dengue was higher during the months June, July and August (22.6%, 16.2% and 10.9% respectively). The seasonality pattern has been maintained from the beginning of the epidemic throughout the years (Table 6 and figure 4)

Trends in dengue during the periods 2002–2004 and 2010–2012 in a tertiary care setting in Trivandrum, Kerala, India
Dengue Bulletin – Volume 38, 2014 47
Table 2: Proportionate positivity of dengue during years studied compared across sex
Year → 2002 2003 2004 2010 2011 2012 2002–2004
2010–2012
Total samples Male (N=5590)
114 465 721 1627 1092 1571 1300 4290
Dengue positive males
24(21.1%)
118(25.4%)
160 (22.2%)
572(35.2%)
281(25.7%)
653(41.6%)
302 (23.2%)
1506(35.1%)
Total samples Female (N=4474)
74 321 533 1401 802 1343 928 3546
Dengue positive females
14(18.9%)
87(27.1%)
124(23.3%)
506 (36.1%)
227(28.3%)
568(42.3%)
225 (24.2%)
1301(36.7%)
Table 3: Mean age of clinically suspect and dengue positive cases across the two periods
Period Mean age SD t value p-value
Clinically suspect Dengue
2010–2012N=7823
27.40 20.08 3.27 0.001
2002–2004N=2224
25.82 20.14
Dengue positive 2010–2012N=2802
27.58 18.95 3.71 <0.001
2002–2004N=527
24.40 17.7
Figure 2: Contribution of each year to total positive cases
1.16.1 8.5
32.3
15.2
36.6
0102030405060708090
100
2002 2003 2004 2010 2011 2012
% c
ontr
ibut
ion
of e
ach
year
Year

Trends in dengue during the periods 2002–2004 and 2010–2012 in a tertiary care setting in Trivandrum, Kerala, India
48 Dengue Bulletin – Volume 38, 2014
Table 4: Mean age of dengue positive case during the years studied
Year N Mean Std. deviation
95% Confidence Interval for Mean Minimum Maximum
Lower bound Upper bound
2002 38 22.36 20.507 15.61 29.10 1 75
2003 205 24.40 17.075 22.04 26.75 0 73
2004 284 24.71 17.861 22.62 26.80 1 93
2010 1074 28.46 18.524 27.35 29.56 0 85
2011 507 28.72 18.991 27.07 30.38 0 88
2012 1221 26.33 19.245 25.25 27.41 1 95
Total 3329 27.08 18.797 26.44 27.72 0 95
Table 5: Clinically suspected and positive dengue cases in different age groups during the two comparison periods
Age group Dengue positive Dengue negative Clinically suspect cases
2010–2012 0–10 610(21.8%) 1370(27.3%) 1980(25.3%)
11–19 527(18.8%) 832(16.6%) 1359(17.4%)
20–40 942(33.6%) 1370(27.3%) 2312(29.6%)
41–60 589(21.0%) 1119(22.3%) 1708 (21.8%)
>61 134(4.8%) 330(6.6%) 464(5.9%)
2002–2004 0–10 144(27.3%) 455(26.8%) 599(26.9%)
11–19 99(18.8%) 309(18.2%) 408(18.3%)
20–40 192(36.4%) 520(30.6%) 712(32.0%)
41–60 71(13.5%) 316(18.6%) 387(17.4%)
>61 21(4.0%) 97(5.7%) 118 (5.3%)

Trends in dengue during the periods 2002–2004 and 2010–2012 in a tertiary care setting in Trivandrum, Kerala, India
Dengue Bulletin – Volume 38, 2014 49
Figure 3: Distribution of total no. of positive cases in different age groups
26.3
15.1
34.1
19.8
4.7
0-10
11-19
20-40
41-60
≥61
Table 6: Variation of dengue cases across months
yr c
ateg
ory
Mon
th
Jan
Feb
Mar
Apr
May
Jun
July
Aug
Sep
Oct
Nov
Dec
2002–2004N=527
No. 67 36 42 17 27 101 146 20 10 10 31 20
% 12.7 6.8 8.0 3.2 5.1 19.2 27.7 3.8 1.9 1.9 5.9 3.8
2010–2012N=2807
No. 166 142 148 114 249 654 395 342 177 161 126 133
% 5.9 5.1 5.3 4.1 8.9 23.3 14.1 12.2 6.3 5.7 4.5 4.7
Total No. 233 178 190 131 276 755 541 362 187 171 157 153
% 7.0 5.3 5.7 3.9 8.3 22.6 16.2 10.9 5.6 5.1 4.7 4.6

Trends in dengue during the periods 2002–2004 and 2010–2012 in a tertiary care setting in Trivandrum, Kerala, India
50 Dengue Bulletin – Volume 38, 2014
Figure 4: Variation of positive cases with months during (2002–2004) & (2010–2012)
12.76.8 8 3.2 5.1
19.2
27.7
3.8 1.9 1.9 5.9 3.8
5.95.1 5.3
4.18.9
23.3 14.1
12.26.3 5.7 4.5 4.7
0
10
20
30
40
50
60
70
80
90
100
Jan Feb Mar Apr May Jun Jul Aug Sep Oct Nov Dec
2002-2004 2010-2012
% p
ositi
ve
case
s
Discussion
Dengue has become a major health concern in recent years. This study was aimed to find the trends, seasonal variation and age-sex variation of dengue across the years. In this study, it was found that the incidence of dengue is increasing across the years. From 20% proportionate positivity, the figure has risen to 42%. A similar study conducted in Malaysia during 2000–201011 and in Lucknow during 2008–201012 also found that there is an increase in the number of dengue cases across the years. Every 10 years, the average annual number of cases of DF/DHF cases reported to WHO continues to grow exponentially. From 2000 to 2008, the average annual number of cases was 1 656 870 or nearly three-and-a-half times the figure for 1990–1999, which was 479 848 cases. In SEAR also, the number of dengue cases has increased over the last three to five years, with recurring epidemics. Moreover, there has been an increase in the proportion of dengue cases with their severity, particularly in Thailand, Indonesia and Myanmar13. In 2008, 2009 and 2010, the average number of cases reported to WHO were 1 279 668, 1 451 083 and 2 204 516. During the past five decades, the incidence of dengue has increased 30-fold1. The reported cases in India have increased from 12 561 in 2008 to 75 454 in 201314. The case reports from Kerala also have increased from 2503 in 2006 to 7 911 in 2013. Reported cases in the district of Thiruvananthapuram have increased from 1150 in 2006 to 4188 in 201315,16.
In the study, when the age characteristics of the positive dengue cases were studied, it shows that the number of cases was more in the 20–40 age group followed by age

Trends in dengue during the periods 2002–2004 and 2010–2012 in a tertiary care setting in Trivandrum, Kerala, India
Dengue Bulletin – Volume 38, 2014 51
group 0–10. Also, the mean age of the positive dengue cases was found to increase across the years. A study conducted at the Central laboratory, Mediciti Institute of Medical Sciences, Ghanpur in 201217 showed that among the seropositives, majority (42.3%) were of the age group 20–30 years and now there is an increasing incidence in the young adults and older age groups. This suggests an age shift of dengue infections indicating an epidemiological change. In another study conducted at Thailand using cases from 1985–200518 found that there is a substantial increase in the average age of dengue cases. The study conducted at Lucknow during 2008–2010 also revealed that there is an age shift from pediatric age group in 2008 & 2009 to a higher age group in 201012.
On analysis of sex-wise distribution of dengue positivity, this study shows that the proportionate positivity of dengue is more among females although the absolute number of clinically suspected and positive cases are more in males. The reason for more positivity among males is because there were more samples or clinically suspected cases of males. This could be because males report to hospital more or male being a risk factor or otherwise, there are more clinical suspects among males. A study conducted at CMC, Vellore during 1999–200319 showed that the overall increase in the dengue IgM positivity seen over the five year period in both the sexes was statistically significant. The increase in percentage positivity seen in females as compared to males was also statistically significant. A recent serological study of adults by Yew et al20 found no significant differences between males and females in recent dengue infection, despite the excess of male cases reported during the same year the serological study was conducted.
The present study shows that the disease has got a seasonal occurrence. The incidence of dengue was at the peak during June–July period which is the peak monsoon period in Kerala. A study conducted in Dhaka during 2000–200821 found that the dengue cases started increasing, as the rainfall increased and with declining rainfall dengue cases also showed gradual decline. Another study conducted at Rajasthan during 2008–201122, on a month-wise analysis of dengue infections revealed that dengue cases increased in number gradually from July onwards and that they peaked in the month of October each year. Most of the cases occurred in the post-monsoon season, with a peak in the month of October, each year.
Limitations
(1) The study was a record-based study. Therefore the validity of the results obtained depends on the efficiency of recording of the system
(2) Since the study was conducted at regional level, it cannot be generalized to state
Trends in dengue during the periods 2002–2004 and 2010–2012 in a tertiary care setting in Trivandrum, Kerala, India
52 Dengue Bulletin – Volume 38, 2014
Conclusion
The number of cases being clinically suspected as dengue, the proportionate positivity among them and the absolute case load are increasing. The proportionate positivity of dengue has risen to 42%. The proportionate dengue positivity among females was higher than males. A higher increase in proportionate positivity is also seen among females. However, the number of clinical suspects and absolute dengue cases are more in males. These differences have not significantly changed across the years. 20–40 years age group contributed to the maximum number of cases. There has been a significant shift in mean age of the clinically suspect and positive dengue cases towards higher ages from 2002 to 2012 and across the two comparison periods. The monsoon period depicted the peak of the case load and this seasonality has not changed across the years.
References[1] World Health Organization. Global strategy for dengue prevention and control 2012–2020. Geneva:
WHO, 2012. http://www.who.int/immunization/sage/meetings/2013/ april/5_Dengue_ SAGE_ _Global_Strategy.pdf - accessed 21 December 2014.
[2] Gubler DJ. Dengue and dengue haemorrhagic fever: its history and resurgence as a global public health problem. In: Gubler DJ, Kuno G. Eds.. Dengue and dengue haemorrhagic fever. New York: CAB International,1997. pp. 1-23.
[3] World Health Organization. Dengue: guidelines for diagnosis, treatment, prevention and control: new edition. Geneva: WHO, 2009. Document No. WHO/HTM/NTD/DEN/2009.1. http://www.who.int/ rpc/guidelines/9789241547871/en/ - accessed 21 December4 2014.
[4] Bhatt S, Peter W. Gething, Oliver J. Brady, Jane P. Messina, Andrew W. Farlow, Catherine L. Moyes, et al. The global distribution and burden of dengue. Nature. 2013 Apr 25;496(7446):504-7. doi: 10.1038/nature12060.
[5] Lall R, Dhanda V. Dengue haemorrahagic fever and the dengue shock syndrome in India. Natl Med J India 1996;9:20.
[6] Kadar A, Kandasamy MS, Appavoo P, Anuradha CN. Outbreak and control of dengue in a village of Dharmapuri, Tamil Nadu. J Commun Dis. 1997;29:69.
[7] Banerjee K, Desai PK. Survey of arbovirus antibodies in South India. Indian J Med Res. 1973;61:344.
[8] Dengue in Kerala: a critical review. ICMR Bulletn. 2006 Apr-May, 36(4-5): 1-31.
[9] National Vector Borne Diseases Control Programme. Guidelines for clinical management of dengue fever, dengue hemorrhagic fever and dengue shock syndrome. Delhi: Publication of Government of India, 2008.
[10] Zinia T Nujum, Vijayakumar K, Pradeep Kumar AS, Anoop M, Sreekumar E, Ramani Bai JT, et al. Performance of WHO probable case definition of dengue in Kerala, India, and its implications for surveillance and referral. Dengue Bulletin. 2012; 36: 94-104.

Trends in dengue during the periods 2002–2004 and 2010–2012 in a tertiary care setting in Trivandrum, Kerala, India
Dengue Bulletin – Volume 38, 2014 53
[11] Mia MS, Begum RA, Er AC, Abidin RD, Pereira JJ. Trends of dengue infections in Malaysia, 2000-2010. Asian Pac J Trop Med. 2013 Jun;6(6):462-6. Doi: 10.1016/s1995-7645(13)60075-9.
[12] Pandey N, Nagar R, Gupta S, Omprakash, Khan D, Singh DD, et al. Trend of dengue virus infection at Lucknow, North India (2008- 2010): a hospital based study. Indian J Med Res. 2012 Nov;136: 862-867.
[13] World Health Organization, Regional Office for South-East Asia. Comprehensive guidelines for prevention and control of dengue and dengue haemorrhagic fever. Revised and Expanded Edition. New Delhi: WHO-SEARO, 2011.
[14] Government of India, Ministry of Health and Family Welfare. Dengue: dengue cases and deaths in the country since 2008. New Delhi: National Vector Borne Disease Control Programme, 2014. http://nvbdcp.gov.in/den-cd.html - accessed 21 December 2014.
[15] Government of Kerala, Directorate of Health Service. Public health. Thiruvananthapuram: DHS. http://dhs.kerala.gov.in/index.php/publichealth ,- accessed 21 December 2014.
[16] Government of Kerala, Directorate of Health Services. State bulletin,Thiruvananthapuram. Integrated Disease Surveillance Project, State Surveillance Unit, 2010.
[17] Ahmed Jalily Q, Pavani G, Nandeshwar AJ. Screening for dengue infection in clinically suspected cases in a rural teaching hospital. J. Microbiol. Biotech. Res. 2013;3(2):26-9.
[18] Cummings DAT, Iamsirithaworn S, Lessler JT, McDermott A, Prasanthong R, Ananda N, et al. The impact of the demographic transition on dengue in Thailand: insights from a statistical analysis and mathematical modeling. PLoS Med . 2009;6(9): e1000139. doi:10.1371/journal.pmed.1000139.
[19] Vijayakumar TS, Chandy S, Narayanan S, Abraham M, Abraham P, Sridharan G. Is dengue emerging as a major public health problem? Indian J Med Res. 2005 Feb;121:100-107.
[20] Yik Weng Yew, Tun Ye, Li Wei Ang, Lee Ching Ng, Grace Yap, Lyn James, Suok Kai Chew, Kee Tai Goh. Seroepidemiology of dengue virus infection among adults in Singapore. Annals of the Academy of Medicine, Singapore. 2009; 38:667–75. pmid:19736569. http://www.annals.edu.sg/pdf/38VolNo8Aug2009/ V38N8p667.pdf - accessed 21 December 2014.
[21] Md. Nazmul Karim, Saif Ullah Munshi, Nazneen Anwar, Md. Shah Alam. Climatic factors influencing dengue cases in Dhaka city: a model for dengue prediction. Indian J Med Res. 2012 July;136(1): 32–9. http://www.ncbi.nlm.nih.gov/pmc/articles/PMC3461715/ - accessed 21 December 2014.
[22] Sood S. A hospital based serosurveillance study of dengue infection in Jaipur (Rajasthan), India. Journal of Clinical and Diagnostic Research. 2013 Sept;7(9):1917-20.

54 Dengue Bulletin – Volume 38, 2014
Evaluation of the efficacy of thermal fogging applied in closed premises on dengue vector Aedes aegypti in
MalaysiaNurulhusna AH1, Khadijah K2, Khadri MS1, Roziah A1,Muhamad-Azim MK1,
Mahirah MN1, Khairul-Asuad M1, Ummi Kalthom, S and Lee HL1
1Medical Entomology Unit & WHO Collaborating Centre for Vectors, Institute for Medical Research, Jalan Pahang, 50588 Kuala Lumpur
2Vector Control Unit, Department of Health, Kuala Lumpur Federal Territory and Putrajaya, Jalan Cenderasari, 50290 Kuala Lumpur
Abstract
Space spraying or fogging of insecticide to control dengue in residential areas is always hampered by inaccessible or unoccupied houses. Therefore, a field study on the efficacy of insecticide thermal fogging through the door-floor gap of closed and unoccupied residences was conducted to determine the most effective angle of fog tube and the fogging duration. Thermal fogging using a fogger (Agrofog®) and a water-based pyrethroid formulation, AquaResigen™, was tested in two types of houses with volume of 186.3m3 (Type 1) and 368.1 m3 (Type 2). The fogging efficacy was tested using 13 unoccupied houses with three houses as controls. The test was conducted in triplicates. A total 25 Aedes aegypti each (sugar-fed laboratory bred, aged 3 – 6 days) were aspirated into ten cages. The cages were hung in the sitting hall and bedrooms of test houses 1.5 m from floor level. Prior to the experiments, the suitable angle of lance at the door-floor gap and the optimum fogging duration through the gap were determined. The insecticide was then discharged into the house at the pre-determined angle and duration. After 60 minutes of exposure, mosquitoes were transferred into clean paper cups and their mortality recorded after 24 hours. Fog tube pointed 30° downward and 15-second fogging duration through the gap induced complete or high mortality of Aedes mosquito in house sized 186.3m3, whereas house sized 368.1 m3 had lower mortality compared to the smaller house. Insecticide droplet analysis indicated generally uniform distribution of the droplets. The current practice of controlling Aedes mosquitoes using thermal fogging in closed houses can be improved if the fog tube is positioned at 300 and with 15 second of fogging through the door-floor gap.
Keywords: Space spraying; Fogging; Aedes aegypti; Insecticide droplet.
#E-mail: [email protected]
Evaluation of the efficacy of thermal fogging applied in closed premises on dengue vector Aedes aegypti in Malaysia
Dengue Bulletin – Volume 38, 2014 55
Introduction
Dengue is endemic in Malaysia and used to be a seasonal problem, but in recent years, dengue outbreaks often occur regardless of the season. There was an increase of 277% of dengue cases in 2013 compared to 2014 within the same week period1. Dengue virus (DENV) transmission occurs in both rural and urban areas; however, dengue infections are most often reported from urban settings. Aedes aegypti (Linnaeus) and Aedes albopictus Skuse have been implicated in the transmission of classical dengue fever (DF), dengue haemorrhagic fever (DHF) and chikungunya in many urban areas of South-East Asia 2-5. Currently, in most tropical countries including Malaysia, dengue is a serious public health problem causing morbidity and mortality. To date, there is still no effective vaccine available to protect the people from periodic recurrent outbreaks of DF and DHF6. Thus, to reduce the incidence of the disease and control periodic outbreaks, the local authorities and public are still dependent very much on the conventional measures of dengue vector control, such as insecticide fogging, public health education and public involvement.
The biological and chemical control of both adult and immature Aedes mosquitoes are still the mainstay of dengue vector control during outbreaks. Space spraying of insecticides or fogging is one of the methods used in controlling the dengue vectors. However, the primary vector of dengue, Aedes aegypti is an indoor breeder and prefers to rest mostly inside the house. Thus space spraying with insecticides to kill adult mosquitoes is not usually effective unless they are used indoors7. Fogging activities to control Aedes mosquito in closed premises seems to be a very difficult task for vector control health personnel since quite a number of houses are closed in an outbreak area. Recent surveys in two dengue outbreak areas in Kuala Lumpur showed that only 23% - 45% of the houses could be fogged indoor8. There are several reasons for this low level of indoor fogging: empty houses, houses were locked (owners left for work) and the owners were reluctant to allow fogging indoors. To improvise a solution, spacespraying through the gap between the door and floor is introduced to try killing Aedes residing inside the closed premise. This study was conducted firstly to observe the effectiveness of fogging through the gap between the door and floor, secondly to evaluate the optimum angle of fog tube nozzle that can be used and finally to optimize fogging duration.
Materials and methods
Study site and premises
The study was conducted from August – November 2011. Based on house size, two types of houses were used in this study. The first type comprised houses sized 186.3 m3 (PPR Beringin) and the second type was houses sized 368.1 m3 (Pangsapuri ATM). Prior to indoor treatment, permission from the housing management in each study area was obtained.

Evaluation of the efficacy of thermal fogging applied in closed premises on dengue vector Aedes aegypti in Malaysia
56 Dengue Bulletin – Volume 38, 2014
PPR Beringin is an urban residential area with a very high population density and covers an estimated area of 0.25 km2. It consists of six blocks of buildings, each composed of 17 floors, with a total of 1896 units and an estimated population of 10 000 people. Each unit consists of three bedrooms, a kitchen, a bathroom and a toilet. This residential area is classified as a denguehigh risk locality since 2009. Pangsapuri ATM consists of five blocks, each with 15 storeys and the total number of residential units is 617. The population was estimated to be 3500 people. Each unit comprises three bedrooms, two bathrooms and a kitchen. This housing estate was declared a dengue outbreak area on May 2011 and a total of 13 cases were reported within the same month. All the test and control (untreated) houses selected were unoccupied and were partially furnished. A total of 13 houses were used in this study, 10 houses used for treatment while three houses were used as controls. The control houses were set up in the untreated block.
Modification of thermal fogger nozzle
The nozzle fitted on the lance of the portable thermal fogger (Agrofog AF35®, Germany) was modified. Originally the fog tube nozzle was round shape 4.7 cm in diameter. The round nozzle was modified into oval shape measuring 2.5 cm x 6.0 cm. The flow rate machine was recorded as 250ml/min.
Optimizing angle of lance
Three angles of lance to the floor gap were chosen: 30°, 45° and 60° (Figure 1). Each angle was tested using the modified lance. The floor-door gaps of the three selected units were measured. Wood wedges each came with 30°, 45° and 60 degrees were used to position the lance. Magnesium oxide-coated rods on a rotator were placed into each test unit to measure the droplet profiles of the fogged insecticide inside the premise. Prior to the fogging, the No. 1 nozzle size (0.8 mm) was used and calibrated to discharge the insecticide solution at 15L/h.
Insecticide
AquaResigen™ EW is a water-based pyrethroid formulation from Bayer CropScience (Germany). It consists of 0.14% S-bioallethrin and 10.27% permethrin and 9.84% piperonyl butoxide. The insectides was prepared as recommended by the manufacturer which is 10ml of the formulation per liter of the diluent for thermal fogging. The application dosage recommended is 10L of diluted solution per hectare.

Evaluation of the efficacy of thermal fogging applied in closed premises on dengue vector Aedes aegypti in Malaysia
Dengue Bulletin – Volume 38, 2014 57
Field experiment
Laboratory-bred sucrose-fed Aedes aegypti females aged 3–5 days from insectary of Institute for Medical Research (IMR) Kuala Lumpur, Malaysia were used in this study. Cylindrical test cages (∅ 9cm, 15cm length) recommended by WHO9 were prepared. A total of 25 female mosquitoes were collected and transferred into each cylindrical cage and a total of 10 cylindrical cages were used per house (Figure 1).
The cylinder cages were numbered and hung from the house ceiling 1.5 m above the floor and 25 cm from each corner of the house. Before the test, all the windows and doors were closed except the doors to all the rooms inside the house. Based on WHO9 standard method for space spraying trial, magnesium oxide-coated rods were place vertically on rotators located at the centre of a room to collect the droplets. Ten houses from each type of house were used in this study. Ten houses were used in this study for both types of houses and three houses in different blocks as a control. The door gap is variable between the test houses. The thermal fogger nozzle was place directly at the gap and supported by a wood wedge to obtain the optimal angle (Figure 2).
Figure 1: Setup of the cages in house sized 186. 3m3 (left) and house sized 368.1m3 (right)
Fogging machine
Cylindrical cage door

Evaluation of the efficacy of thermal fogging applied in closed premises on dengue vector Aedes aegypti in Malaysia
58 Dengue Bulletin – Volume 38, 2014
The rotator was switched on just before fogging started. Fogging was conducted through the closed door-floor gap at an angle of 30o for about 15 seconds. The 15-second duration was based on Khadijah et al10 who showed that this was the optimum duration to discharge the insecticide effectively at door-floor gap compared to 10-second and 20-second duration. Sixty minutes post–exposure, the number of mosquitoes knocked down was recorded and all the mosquitoes were transferred into clean paper cups with 10% sugar pads. The mosquito knockdown rate was observed at one hour and six hours, while mortality rate was observed at 24 hours post-treatment.
Droplet profiles
Insecticidal droplets were examined under a normal light compound microscope fitted with a photo-imaging system at a magnification of 400X. The diameters of the impinged droplets were recorded and a minimum of 200 droplets were measured for each rod to determine the droplet density and droplet size. The droplet analysis was carried out using the software of Sofield and Kent11.
Figure 2: The position of the lance and the door gap

Evaluation of the efficacy of thermal fogging applied in closed premises on dengue vector Aedes aegypti in Malaysia
Dengue Bulletin – Volume 38, 2014 59
Results
Optimizing the fog tube angle
Thermal fog tube placed at an angle of 30o, 45o or 60o during fogging activities produced condensation of insecticides on the floor (Figure 3). However, at the angle of 30o, lesser insecticide condensation was observed compared to the other two angles. In addition, at 45o the fog tube could not fit into the gap between the door and door-grill, whilst at 60o, the fog tube was too tilted and resulted in more condensation of insecticide on the floor. This angle also burdened the operator of the thermal fogging machine. Therefore, fog tube at an angle of 30o was chosen for the purpose of subsequent experiment.
Effectiveness of fogging
The knockdown was observed after one hour and six hours post-fogging interval and followed by post-fogging 24-hour mortality. In the houses sized Type 1 (186.32m3) the knockdown and mortality of the mosquitoes were 100% at every observation interval.
Figure 4 shows the observation of knockdown and mortality rate of Ae. aegypti post-fogging activity in the houses sized Type 2 (368.12m3). The knockdown was higher in the 2nd bedroom (73.60%) and was followed by the 1st bedroom (72.00%), while the cage located in the toilet, 3rd bedroom and kitchen showed 31.60%, 41.20% and 24.00% knockdown respectively.
In the living hall the cages located at position 1, 2, 3 and 5 showed lower knockdowns compared to the living hall at position 4 with percentage <20%. Six hours post-fogging, the location at living room 1, 2, 3, 5 and kitchen showed increased knockdown rate, while in
Figure 3: Schematic representation of insecticide condensation from the fog tube at different angles
30 60°45°°
Fog tube
Door
Grill
condensed insecticide

Evaluation of the efficacy of thermal fogging applied in closed premises on dengue vector Aedes aegypti in Malaysia
60 Dengue Bulletin – Volume 38, 2014
the living room 4, knockdown was decreased from 17.60% to 12.40%. The same decreasing pattern was also observed in locations such as 1st bedroom (36.40%), 2nd bedroom (48.40%), 3rd bedroom (24.00%) and toilet (11.20%).
No complete mortality was recorded in house type 2. Cages located in the 1st bedroom (48.40%), 2nd bedroom (58.40%), 3rd bedroom (37.60%), toilet (26.40%) and kitchen (33.60%) has the highest mortality compared to cages located at in the living room (12.00% - 21.60%). In the living rooms the mortality was 14.80% - 21.60%.
Droplets size determination and analysis
The droplets of water-based insecticide (Aqua Resigen™) were detected on MgO rods on a rotating impactor9 that were placed in the centre of the house hall. The NMD and VMD values were computed using droplet analysis software and are shown in Table 1. The droplet ratio in PPR Beringin and Pangsapuri ATM was 1.40 and 1.36 respectively, indicating the uniform distribution of big and small droplets in both type of houses during the fogging trials.
Figure 4: The knockdown and mortality rates of Aedes aegypti in house size Type 2 (368.12m3) at various placements
4.40 8.
00
6.80
17.6
0
1.60
72.0
0
73.6
0
41.2
0
24.0
0 31.6
0
14.8
0
9.20 13
.60
12.4
0
5.60
36.4
0 48.4
0
24.0
0
25.6
0
11.2
020.8
0
14.8
0 21.6
0
21.2
0
12.0
0
48.4
0 58.4
0
37.6
0
33.6
0
26.4
0
0.00
20.00
40.00
60.00
80.00
100.00
Livingroom 1
Livingroom 2
Livingroom 3
Livingroom 4
Livingroom 5
1stBedroom
2ndBedroom
3rdBedroom
Kitchen Toilet
%
Locations
1 Hour 6 hours 24 Hours

Evaluation of the efficacy of thermal fogging applied in closed premises on dengue vector Aedes aegypti in Malaysia
Dengue Bulletin – Volume 38, 2014 61
Table 1: Analysis of thermal fog droplets collected on MgO coated rods placed at the centre of the main entrance hallway
House area (m3) VMD (µm) NMD (µm) VMD/NMD ratio
Type 1 (186.32) 23.32 16.67 1.40
Type 2 (368.12) 21.36 15.71 1.36
Discussion
During the field study several adjustments were made to optimize the angle of the fog tube at the selected house door. This is needed as every house in both study sites was fitted with door-grill, and the door-floor and door-grill gaps are variable. The design and thickness of the door-grill also may influence the amount of insecticide penetrating the house. The fog tube angle of 45o and 60o were not suitable to be used in these study sites. The observation showed that when the fog tube was pointed at 45o the fog tube cannot be fitted into the gap between the door and house grill and thus influences the rate of insecticide entering the house, while at 60o, the fog tube position was too tilted, thus the fume was easily converted into liquid. Besides that, thermal fogging cannot be operated at this position. The observation also showed that the insecticide quickly condensed; changing its form from fume to liquid which spilled out from the thermal fogging tube onto the floor. This condensation of insecticide on the floor is slippery and may be risky to the residents when entering the house. Fogging at the other two angles produced lesser amount of condensation on the floor. Fogging at door-floor gap at 30o produced the least volume of condensed insecticide; hence the position of the fog tube at 30o was chosen for the purpose of this experiment. Based on our observation, fog tube at 30° was the best angle that allows maximum amount of insecticide to penetrate the room with minimal condensed insecticide on the floor. The results showed that the spraying effectively killed the caged mosquitoes inside the house. The door-gap of 3 mm to 28 mm obviously allowed droplets to travel into all the rooms and spaces available.
The modification of the nozzle shape did not affect the discharge rate of the machine. The modification was made to facilitate entry of the fog into the house. An earlier study conducted by Khadijah (2011) showed that the discharge rate of the fogger was similar for both modified and unmodified nozzle.
Each Type 1 house (186.3 m3) consists of three bedrooms, a hall, a kitchen, a toilet and a bathroom. Comparatively, this is a small house in this country. This may account for the high mortality of mosquitoes tested in this house type. In Type 2 (Pangsapuri ATM) houses the volume of the house is 368.1 m3 which is 49% bigger than Type 1 (PPR Beringin) house. In Type 2 houses, one hour post-spray cage located at 2nd bedroom and cage located at 1st bedroom had the highest knockdown. Six hours post-spray observation of the cage located at the same location (2nd bedroom and 1st bedroom) also showed the highest

Evaluation of the efficacy of thermal fogging applied in closed premises on dengue vector Aedes aegypti in Malaysia
62 Dengue Bulletin – Volume 38, 2014
knockdown rates eventhough the percentage of knockdown decreased from the first one hour post-fogging.
The mortality for all locations in the Type 2 houses was less than 60%. Knockdown rates of mosquitoes in the cage located in the 3rd bedroom, toilet and kitchen had a lower knockdown compared to the 1st & 2nd bedrooms because during one hour post-spraying lesser insecticide droplets entered these places since their locations were far from the door-gap. The insecticide droplets would need to travel further through each room to kill the mosquitoes. This will cause less knockdown rate and mortality observed in this area. The mortality and knockdown rate of the mosquitoes were the lowest in cages placed in the living hall in Type 2 house and this was probably due to wider area of the living hall, which was twice as big than the living hall in Type 1 house. This essentially had a dilution effect on the insecticide fog. The ratio of VMD and NMD at both study sites showed the big and small droplets were homogenous, consistent and uniformly distributed.
Further improvement can be made especially in fogging duration according to house volume. The volume of houses to be fogged through door-floor gap must be estimated correctly to optimize fogging activities and ensure complete mosquito mortality. Further study should be conducted to test field mosquitoes in order to gain more information and since it has been shown that field-collected mosquitoes are more tolerant to insecticides13. In addition, fog obstacles and mosquito hiding and resting places such as curtains and furniture should be considered in future studies.
Conclusion
The study indicated that the mortality of laboratory-bred Aedes aegypti in empty houses in PPR Beringin was high (100%) compared to Pangsapuri ATM (12% - 58%), showing that the insecticide fog generated during the 15-second fogging could travel through the small door-gap as narrow as 3 mm. This study also proved that the water-based insecticide formulation was able to penetrate the door-floor gap and travel throughout the room volume of ≈ 1300 square feet (120.7 m2). Indoor thermal fogging through the door-floor gap appears to be suitable for the control of Aedes aegypti inside closed houses.
References[1] Malaysia, Ministry of Health. Press statement of the Director General Ministry of Health Malaysia,
current situation dengue and chikungunya in Malaysia for week 17/2014 (1st May 2014).
[2] Smith CEG. The history of dengue in tropical Asia and its probable relationship to the mosquito Aedes aegypti. Journal of Tropical Medicine and Hygiene. 1956; 59(10):243-51.
[3] Hammon WM. History of mosquito-borne hemorrhagic fever. Bulletin World Health Organization. 1966;44:643-49.
Evaluation of the efficacy of thermal fogging applied in closed premises on dengue vector Aedes aegypti in Malaysia
Dengue Bulletin – Volume 38, 2014 63
[4] Runnick A. Aedes aegypti and hemorrhagic fever. Bulletin World Health Organization. 1967;36:528. Renganathan E, Parks W, Lloyd L.Towards sustaining behavioural impact in dengue prevention and control. Dengue Bulletin. 2003;27:6–12.
[5] Nero C. Chikungunya the travelling virus.Clinical Microbiology Newsletter. 2008;30 (13):97-100.
[6] Kumar K, Singh PK, Tomar J, Baijal, S. Dengue: epidemiology, prevention and pressing need for vaccine development. Asian Pacific Journal of Tropical Medicine. 2010;3(12):997-1000. doi: 10.1016/s1995-7645(11)60017-5.
[7] Gubler DJ. Aedes aegypti and Aedes aegypti-borne disease control in the 1990s: top down or bottom up. Am. J. Trop. Med. Hyg. 1989;40:571-578.
[8] VBDCKL (2011). Summarize fogging data of Program Perumahan Rakyat (PPR) Beringin and PangsapuriAngkatanTentera Malaysia (ATM). Bilikgerakandenggi.
[9] World Health Organization. Guidelines for efficacy testing of insecticides for indoor and outdoor ground-applied space spray application. Geneva:WHO, 2009. Document No. WHO/HTM/NTD/WHOPES/2009.2.
[10] Khadijah K. Effectiveness and optimizing of thermal fogging for dengue control in closed premise. Thesis submitted for fulfilment of Diploma in Applied Parasitology and Entomology. Kuala Lumpur: Institute for Medical Research, 2011.
[11] Sofield RK, Kent R. A basic program for the analysis of ULV insecticide droplets. Mosq News. 1984;44:73-5.
[12] Himel CM.The optimum size for insecticide spray droplets. J. Econ. Entomol. . 1969;62(4):919-25.
[13] Nazni WA, Kamaludin MY, Lee HL, Rogayah TAR, Sa’diyah I. Oxidase activity in relation to insecticide resistance in vectors of public health importance. J Trop Biomed. 2000;17:69-79.

64 Dengue Bulletin – Volume 38, 2014
Civil-military cooperation (CIMIC) for an emergency operation against a dengue outbreak
in the western province, Sri LankaHA Tissera1,2, PC Samaraweera2, BDW Jayamanne2, WCD Botheju1,
NWAN Wijesekara3, MPPU Chulasiri2, MDS Janaki2, KLNSK De Alwis2, P Palihawadana1
1Epidemiology Unit, Ministry of Health, Sri Lanka 2National Dengue Control Unit, Ministry of Health, Sri Lanka
3Disaster Preparedness and Response Division, Ministry of Health, Sri Lanka
Abstract
Dengue is a major public health problem in Sri Lanka. Despite many preventive strategies in place, the dengue situation in the country worsened mainly due to the densely populated western province. Therefore, a large-scale premises inspection programme was initiated in a phased approach based on the disease and vector surveillance data. Health authorities in partnership with the military identified as Civil-Military Cooperation (CIMIC) initiated a door-to-door programme with the primary objective of source reduction within a short period. Results of this programme seem to be noteworthy while its sustainability is probably a challenge.
Keywords: Dengue; Epidemic; Disease burden; Civil-military partnership; Sri Lanka.
Introduction
Dengue is a major public health concern throughout tropical and subtropical regions of the world with an estimated 390 million infections, 50 000 severe dengue/dengue haemorrhagic fever (DHF) cases and 22 000 deaths annually.1 It is the most rapidly spreading mosquito-borne viral disease, with a 30-fold increase in global incidence over the past 50 years. The World Health Organization (WHO) estimates that 50–100 million dengue infections occur each year and that almost half the world’s population lives in countries where dengue is endemic. While dengue is a global concern, with a steady increase in the number of countries reporting the disease, currently close to 75% of the global population exposed to dengue is in the Asia–Pacific region. Sri Lanka has been witnessing its increasing incidence over the years.2
#E-mail: [email protected]

Civil-military cooperation (CIMIC) for an emergency operation against a dengue outbreak in the western province, Sri Lanka
Dengue Bulletin – Volume 38, 2014 65
Dengue was serologically confirmed in Sri Lanka in 1962, with the first outbreak being reported in 1965. Although the country has had a history of 40 years of dengue, since the early 2000s, progressively large epidemics have occurred at regular intervals. Dengue transmission in Sri Lanka is endemic, with large epidemics being reported in 2004 and 2009 with the peak transmission occurring in June-August soon after the monsoon season. According to official statistics from the Epidemiology Unit, Ministry of Health, this trend has continued to date with an annual average of 33 000 cases reported from 2009 to 2013. In 2012, 44 461 dengue cases were reported nationally, being the highest ever, corresponding to an incidence rate of 220 per 100 000 population and 181 deaths (case fatality rate 0.4%).
Figure 1: Map of Sri Lanka showing the districts mostly affected by dengue outbreak in 2014
Sri Lanka is a tropical country with high humidity and warm temperatures throughout the year. Sri Lanka gets rainfall mainly from two rainy seasons: southwest monsoon (May to August) bringing abundant rainfall to the country’s western and southern regions and the northeast monsoon (November to February) bringing less rain to the dry north and eastern regions. Nearly one quarter of the island is in the “wet zone” which includes the densely populated western province. The average temperature for the country ranges between 26 °C to 28 °C and the day and night temperatures may vary by 4 °C to 7 °C.
Studies show that most of the vector-borne diseases exhibit a distinctive pattern closely linked to climatic parameters such as rainfall, temperature and other weather variables.3

Civil-military cooperation (CIMIC) for an emergency operation against a dengue outbreak in the western province, Sri Lanka
66 Dengue Bulletin – Volume 38, 2014
Distribution of dengue cases is closely associated with the post-rainfall period in Sri Lanka. Dengue incidence has been relatively low during the heavy rainfall and increases when the rainfall starts to decrease, showing a three-to-four-week lag time between the rainfall and dengue outbreaks.4. Two disease peaks occur annually in association with the monsoon rains, when the densities of two mosquito vectors (Ae. aegypti and Ae. albopictus) are high in Sri Lanka. Generally, the first peak occurs in June/July, coinciding with the south-western monsoon that commences in late April. The second peak, comparatively a smaller one, usually occurs at the end of the year and is associated with the north-eastern monsoon rains that prevail from October to December.
Over the past 10 years we have witnessed a dramatic increase in the reported dengue incidence and its severe manifestations (dengue haemorrhagic fever and dengue shock syndrome) making this infectious disease a major public health problem. In Sri Lanka, control and prevention strategies include integrated surveillance (disease, vector, serological), standardized case management of dengue haemorrhagic fever, integrated vector management (IVM), social mobilization and outbreak response.5
Ae. aegypti, the primary vector of dengue, is a ‘hydrophilic species’ i.e. humidity loving and it has adapted to breeding in water-storage containers in domestic habitation. During the rainy season, when temperatures fluctuate and humidity increases, the species invades peridomestic areas and breeds profusely in any man-made or natural container holding rainwater, building up a very high density.6
Globally, vector control (mainly for malaria) has been executed using chemicals, bio-control agents and personal protection measures including insecticide-treated nets (ITNs) but without much success for dengue. A successful vector control programme requires intersectoral coordination, and active individual and community participation.7
Recently, a WHO-sponsored research project entitled “Eco Bio-social Research on Dengue in Asia” concluded that variable influence on vector breeding is complex and public health response should go beyond larviciding /spraying of insecticides. The study emphasized the need to develop close interaction between political leaders, religious leaders, all sectors of the economy and municipal authorities, which is critical for the success of dengue vector control.8
In Sri Lanka, the Ministry of Health has advocated that disease control activities require a sustained high-level government commitment, strengthening of public health infrastructure, inter-sectoral collaboration and community participation. Timely control of dengue epidemics requires preparedness and capacity to undertake suitable and effective control activities during the inter-epidemic period. As dengue disease transmission occurs mostly in places of residence, the ultimate success of the control programme would depend on community participation and cooperation.

Civil-military cooperation (CIMIC) for an emergency operation against a dengue outbreak in the western province, Sri Lanka
Dengue Bulletin – Volume 38, 2014 67
Due to progressive worsening of the dengue situation in the country mainly contributed by the western province (60% of the cases of Sri Lanka)9, a decision was taken by the ‘Presidential Task Force on Dengue Prevention’ on 9 June 2014 to carry out mass scale premises inspection programme including houses, schools, government and non-governmental organizations, public places, religious places and vacant.
The main objectives of the emergency dengue control programme involving Civil-Military Cooperation (CIMIC) were:
z To mobilize a large number of civil-military personnel to rapidly reduce dengue vector breeding sites in the western province.
z To inculcate sustainable behavioural change towards removing dengue breeding sites at household level with the support of the armed forces and police.
This paper discusses the importance of social mobilization and intersectoral coordination in an outbreak situation for control and prevention of dengue in the western province of Sri Lanka.
Methods
Presidential task force on dengue prevention (PTFD)
As the burden of dengue fever is evolving rapidly, with increased frequency of outbreaks and expansion to new geographical areas that were previously unaffected, the Ministry of Health recognized the importance of sustained high-level government commitment through intersectoral collaboration in order to maximize the provision of integrated services. The Presidential Task Force On Dengue Prevention (PTFD) was established on 25 May 2010 in order to strengthen multisectoral collaboration and smooth implementation of strategies at the national, provincial, district and divisional level. Major stakeholders of PTFD include the ministries of education, environment, defence, law and order, public administration, disaster management, mass media, and local government under the technical guidance of the Ministry of Health.
Three-phase mass-scale premises inspection
As a directive of the PTED, an Emergency Dengue Control Programme was conducted in the western province comprising three districts namely Colombo, Gampaha and Kalutara. Colombo district is divided into two administrative divisions called Colombo Municipal Council (CMC) and Colombo Regional Directorate of Health Services (RDHS) while Kalutara District as Kalutara RDHS and National Institute of Health Sciences (NIHS). Gampaha District is administratively under the purview of Gampaha RDHS.

Civil-military cooperation (CIMIC) for an emergency operation against a dengue outbreak in the western province, Sri Lanka
68 Dengue Bulletin – Volume 38, 2014
This programme was conducted in the western province coordinated by the health authorities with the participation of tri forces and police, special task force and civil defence force, together with other stakeholders and the community. In the armed forces this type of collaborative activity is known as Civil-military cooperation (CIMIC). This programme is reported as the first-ever major CIMIC activity in Sri Lanka and probably the sub-continent to battle against dengue outbreak.
A number of planning meetings were held with the participation of all stakeholders prior to the execution of the programme. Furthermore, a training of trainers programme was conducted for over 1500 service personnel on identification of breeding places using a standard checklist. A joint operation centre was activated at the Epidemiological Unit of the Ministry of Health, with the participation of officers from the health ministry, tri forces and police.
The emergency dengue control programme was conducted in the priority high-risk Medical officer of health (MOH) areas based on the epidemiological trends reported. A phased approach was used to manage the logistics. The first phase was conducted from 20 to 22 June 2014 while the second phase was conducted in two levels from 3 to 5 July and 8 to 10 July 2014. The third phase was also conducted in two levels. While 18 June 2014 (1st level) was aimed at institutions and second level conducted again, inspecting residential premises. Altogether a three-phased campaign for 13 days of mass-scale inspection was conducted targeting most vulnerable areas. Inspection teams comprised of one person from the health authorities, two persons from tri-forces and police and a volunteer from the area/village. A standard checklist and the route map were given to each team while assigning a minimum of 50 premises to be targeted. Coordinating officers were assigned at each district while monitoring teams were appointed from the national level to monitor the programme implementation and to ensure smooth operations.
The programme was mainly aimed at detection and elimination of mosquito breeding places onsite, augmented by cleaning up campaigns and the use of available vector reduction methods (introduction of fish, larvicide spraying, fogging). Community awareness was created during the programme and legal action against those premises contributing towards substantial mosquito breeding was also initiated. In order to promote positive behaviours towards eliminating dengue breeding sites, a green sticker was awarded to premises in which not even a single dengue breeding site (positive or potential) could be detected. A yellow sticker was given to identify the premises which were not accessible to the teams on the days of field visits. Mosquito larval breeding sites were targeted according to the available entomological surveillance data, while follow-up surveys were carried out to estimate the reduction.

Civil-military cooperation (CIMIC) for an emergency operation against a dengue outbreak in the western province, Sri Lanka
Dengue Bulletin – Volume 38, 2014 69
Results
Table 1: Total number of premises inspected during all three phases and % of premises with larvae
AreaNo. of
premises visited
No. of premises
with larvae
PercentageNo. of persons mobilized
Health Military Volunteers
Phase I
CMC* 53 533 908 1.7 551 3 738 -
RDHS Colombo 20 628 363 1.8 405 1 343 191
RDHS Gampaha 15 047 766 5.1 322 1 131 -
RDHS Kalutara 16 705 713 4.3 320 1 165 69
Total 105 913 2 750 2.6 1 598 7 377 260
Phase II
CMC 80 726 767 1 1 777 4 582 427
RDHS Colombo 96 005 1 412 1.5 1 324 3 721 903
RDHS Gampaha 50 272 937 1.9 724 2 033 19
RDHS Kalutara 20 940 704 3.4658 2 321 344
NIHS Kalutara 4 889 405 8.3
Total 252 832 4 225 1.5 4 483 12 657 1 693
Phase III
CMC 6 809 67 2.1 456 168 -
RDHS Colombo 47 938 482 1.0 467 2 120 815
RDHS Gampaha 45 639 441 1.0 742 2 220 1 083
RDHS Kalutara 15 742 397 2.5 447 1 045 249
NIHS Kalutara 6 031 59 1.0 169 432 33
Total 122 159 530 1.2 2 281 5 985 2 180
Grand Total 480 904 8 495 1.8 8 362 26 019 4 133*CMC – Colombo Municipal Council

Civil-military cooperation (CIMIC) for an emergency operation against a dengue outbreak in the western province, Sri Lanka
70 Dengue Bulletin – Volume 38, 2014
Table 2: Analysis of reduction of premises with larvae
PhasesPremises Statistics
Without larvae With larvae(%) Test statistic P value
Phase I 103 163 2 750(2.59) – –
Phase II 248 607 4 225(1.67) 18.7147 <0.01
Phase III 122 629 1 520(1.24) 24.7835 <0.01
There was a significant reduction in Premise Index in phases II and III when compared to phase 1 larval percentage during the programme.
Figure 2: Map showing Colombo RDHS area covered in all three phases

Civil-military cooperation (CIMIC) for an emergency operation against a dengue outbreak in the western province, Sri Lanka
Dengue Bulletin – Volume 38, 2014 71
Figure 3: Map showing Gampaha RDHS area covered in all three phases
Figure 4: Map showing Kalutara RDHS area covered in all three phases

Civil-military cooperation (CIMIC) for an emergency operation against a dengue outbreak in the western province, Sri Lanka
72 Dengue Bulletin – Volume 38, 2014
Figure 5: Reported dengue cases by week within the western province from January to August 2014
1200
1000
800
600
400
200
01 2 3 4 5 6 7 8 9 10 11 12 13 14 15 16 17 18 19 20 21 22 23 24 25 26 27 28 29 30
Phase I
Phase IIA
Phase IIB
Phase III
Cas
es
Week of year 2014
Table 3 : Statistical comparision of Premise Indices during follow-up entomological surveys
PhasesPremise Index Statistics
CIMIC Follow-up Test Statistic P value
Phase I 2.59 (2 750/103 163) 3.29 (70/2 125) -1.776 0.07508
Phase II 1.67 (4 225/248 607) 2.18 (50/2 192) -1.775 0.07508
Phase III 1.24 (1 520/122 629) 1.64 (45/2 738) -1.883 0.06010
The effectiveness of the programme is shown by statistical comparison of premise indices during and the follow-up entomological surveys.

Civil-military cooperation (CIMIC) for an emergency operation against a dengue outbreak in the western province, Sri Lanka
Dengue Bulletin – Volume 38, 2014 73
Table 4: Percentages of Aedes positive (for larvae/pupae), potential wet and dry containers observed in follow-up entomological surveys (Phase I to III)
ItemPositive
for Aedes (%)
Potential wet containers
(%)
Potential dry containers
(%)
1 Discarded receptacles 40.32 42.27 65.69
2 Water storage tanks and containers 16.71 15.48 6.08
3 Tree holes, bromilia plants and other natural containers 4.77 7.18 4.62
4 Tyres 4.24 2.38 4.88
5 Roof gutters 3.71 1.81 4.09
6 Air conditioners and refrigerator trays 3.71 6.69 4.11
7 Concrete slabs 2.65 2.03 1.33
8 Abandoned cisterns 2.65 1.20 0.18
9 Ponds and birth baths 2.39 4.80 0.46
10 Hardened soil of plotted plants and flower pot plates 1.59 1.59 0.64
11 Flower vases 1.59 0.86 0.40
12 Clear water drains and gully traps 0.80 1.84 0.42
13 All others* 14.85 11.88 7.11
100.00 100.00 100.00* All others- other miscellaneous places (e.g. covering material (i.e. polythene sheets), tube wells, earth pipes, water leaking areas, discarded building waste/materials (i.e. roof tiles), etc).
According to the follow-up entomological surveys, it was still evident that discarded receptacles remained the most productive type of container.
Discussion
Recurrence of dengue outbreaks in the western province, Sri Lanka has become a growing public health problem despite ongoing control measures. Population growth, rapid urbanization, inadequate basic housing, improper waste disposal systems are a few of the known factors for increased incidence of dengue in general. Reducing larval habitats of the principal vector mosquito Aedes aegypti is a major component of the dengue control programme in Sri Lanka. However, sustainability of source reduction programmes through continued community participation has been a challenge due to lack of interest among the people in removing potential breeding places in their own premises. Therefore, every

Civil-military cooperation (CIMIC) for an emergency operation against a dengue outbreak in the western province, Sri Lanka
74 Dengue Bulletin – Volume 38, 2014
available opportunity to promote social mobilization should be considered in this “war” against the scourge of dengue.
Sri Lanka is committed to controlling vector-borne diseases with a very high-level of political commitment seen by the establishment of the Presidential Task Force on Dengue Prevention in 2010. Vector management is taken very seriously, with the active engagement of various stakeholders and the community. Strengthening intersectoral coordination and social mobilization was the main aim of this civil–military partnership. The high level of inspection of premises is a testament to the close relationship between the armed forces, local field health teams and the community. The armed forces and the police in particular have won the acceptance of the community in Sri Lanka in recent times. Extending and sustaining this model will bring great benefits in dengue prevention and control and ultimately for improvement of public health. In addition, this is a model public health intervention to demonstrate how a well planned and executed community-based intervention could bring about immediate relief to its people in a middle-income country.
Dengue vector mosquitoes use a wide range of confined larval habitats, mainly man-made. It is known that some man-made container habitats produce large numbers of adult mosquitoes, whereas others are less productive. Targeting control efforts at the most productive and epidemiologically more important larval habitats is a key strategy in reducing transmission effectively, especially when working with limited resources. The training provided to all members of inspection teams based on local entomological indices significantly influenced their ability to identify potential and positive breeding habitats more effectively. In the context of dengue vector control, management of non-biodegradable items in solid waste is challenging. Proper storage, collection and disposal of waste through community engagement and empowerment were initiated at every possible instance during the programme. To this end, the support given by the local government bodies is noteworthy.
As a measure of the effectiveness of each programme, follow-up entomological surveys were carried out in the same areas. In the RDHS area of Kalutara district, the follow-up survey Premise Indices (PI) were comparable with phase I, II and III of the programme in contrast with the other three areas. A higher PI was seen in CMC, RDHS Colombo and Gampaha throughout the programme (Table 3). Many factors may be associated with this disparity. In addition, the discrepancy between Table 2 and Table 3 could be the factors for selecting houses for mass scale programme and entomological surveys. Entomological surveys were carried out selecting high-risk localities with a limited number of houses leading to higher possibility of larval detection. Awareness of the programme and dispersion of the message to the public may be very effective that public has complied timely and correctly so that during the programme, breeding sites were minimum. Entomological surveys are carried out by well-trained technical personnel after 2–3 weeks of a particular phase and by that time the public awareness may have returned to neutral level resulting in the above findings. The quality of inspection may be higher than the trained military personnel and health volunteers but in some areas during some phases these factors have played a minimum role. Other

Civil-military cooperation (CIMIC) for an emergency operation against a dengue outbreak in the western province, Sri Lanka
Dengue Bulletin – Volume 38, 2014 75
than the above factors the environmental factors like rainfall, humidity and environmental temperature might also have contributed to the above disparity.
When analysing the data for the last five years there was an exponential increase in reported number of patients per week (900 patients per week on average in the western province during the 22nd to 25th weeks) in 2014 just before starting phase I. According to Figure 5, one can notice the epidemiological impact by the dramatic reduction of case load per week by disrupting the upward trend (estimated forecast of cases for 26th week is 1 162 according to the trend model () generated from the 17th week onwards) rapidly which we cannot achieve without this kind of door-to-door inspection during a month’s time with this sort of civil-military partnership.
The total direct cost on all three phases of the programme by the Ministry of Health was Sri Lankan Rupees 30 million for 481 000 premises (~Sri Lankan Rupees 63 per premise). In 2012, the health system cost of dengue prevention activities in Colombo district reached a total of Sri Lankan Rupees 127 million (per capita cost was around Sri Lankan Rupees 55.10). The total cost of dengue response in Colombo district by health system budgets in 2012 amounted to Sri Lankan Rupees 452.9 million (US$ 3.5 million) giving a per capita cost of Sri Lankan Rupees 196.09 (US$ 1.5). The morbidity cost included control cost per reported case (~Sri Lankan Rupees 13 000) and hospital management cost (DF - Sri Lankan Rupees 26 000–64 000/DHF Sri Lankan Rupees 34 000–114 000) per patient10. Therefore, a substantial cost on case management would have been averted due to this timely intervention through CIMIC.
Integrated Vector Management (IVM) is a rational decision-making process for the optimal use of resources for vector control and the sustainability of the programme. The approach seeks to improve the efficacy, cost-effectiveness, ecological soundness and sustainability of disease-vector control11. The ultimate goal is to prevent the transmission of vector-borne diseases. Successful implementation of IVM should lead by evidence-based decision making guided by operational research and entomological and epidemiological surveillance and evaluation which is a key feature. Adequate human resources, training and career structures need to be developed at national and local level to promote capacity building to sustain these types of programmes. Strengthening the attitude of households and getting their active involvement is the most effective proven strategy of IVM. The Ministry of Health expects to achieve low morbidly and mortality due to dengue illness through this type of CIMIC activities.
Acknowledgements
The authors would like to thank the Presidential Task Force on Dengue (PTFD), His Excellency the President of Sri Lanka and all Ministers and Ministry Officials of the PTFD, and the Secretary, Ministry of Defense for taking the leadership in the activities.
Civil-military cooperation (CIMIC) for an emergency operation against a dengue outbreak in the western province, Sri Lanka
76 Dengue Bulletin – Volume 38, 2014
The Secretary of Health (Sudharma Karunarathna), Director General of Health Services (Dr PG.Mahipala), Deputy Director General-Public Health Services (Dr Sarath Amunugama), Provincial Director – Western Province (Dr Deepthi Perera), Consultant Community Physician (CCP) – Western Province (Dr Priyadarshani Samarasinghe), Regional Directors of Health Services Colombo (Dr Chula Gunasekara), Gampaha (Dr Sugath Darmarathne), Kalutara (Dr UI Rathnayake) Director National Institute of Health Sciences(Dr Lakshman Gamlath), Chief Medical Officer of Health - Colombo Municipal Council (Dr Ruwan Wijemuni), Regional Epidemiologists (Dr Nayani Sooriyarachchi-Colombo, Dr Rohan Ranasinghe/Dr Manjula Arachchi /Dr Chandrani Liyanage (Gampaha), Dr Prasad Liyanage (Kalutara) and Dr Lasitha Tantriwatta (N.I.H.S) Medical Officers of Health (MOOH) and all the field staff Ministry of Health, Provincial Departments of Health –Western Province and Colombo Municipal Council.
Special acknowledgement goes to Major General BA Perera (Director General – Operations and Systems), Brigadier SHFP Perera (Director – Operations and Systems) at Office of the Chief of Defence Staff (OCDS-SL Army), Commander SD Kodikara (Command Land Operations Officer-SL Navy)Wing Commander BR Booso (Staff Officer, Health Services-SLAF),Lieutenant Colonel HMS Priyantha (Civil Affairs Officer-Civil Defence Force), Director Environment Police Division (Quintus Raymond-Senior Superintendent of Police) and all the respective chiefs and team members for their contributions.
Declaration
Authors state that this article has not been published and will not be submitted for publication elsewhere if accepted for publication in the WHO Dengue Bulletin.
References[1] Bhatt S, Gething PW, Brady OJ, Messina JP, Farlow AW, Moyes CL, Drake JM, Brownstein JS, Hoen
AG, Sankoh O, Myers MF, George DB, Jaenisch T, Wint GR, Simmons CP, Scott TW, Farrar JJ, Hay SI. The global distribution and burden of dengue. Nature. 2013 Apr 25;496(7446):504-7. doi: 10.1038/nature12060. Epub 2013 Apr 7. http://www.ncbi.nlm.nih.gov/pmc/articles/PMC3651993/ - accessed 24 December 2014.
[2] World Health Organization. Global strategy for dengue prevention and control, 2012-2020. Geneva: WHO, 2012. Document No. WHO/HTM/NTD/VEM/2012.5. – accessed 24 December 2014.
[3] Gubler DJ, Reiter P, Ebi KL, Yap W, Nasci R, Patz JA. Climate variability and change in the United States: potential impacts on vector-and rodent-borne diseases. Environmental Health Perspectives. 2001 May;109(Suppl 2):223-33. http://www.ncbi.nlm.nih.gov/pmc/ articles/PMC1240669/pdf/ehp109s-000223.pdf – accessed 24 December 2014.

Civil-military cooperation (CIMIC) for an emergency operation against a dengue outbreak in the western province, Sri Lanka
Dengue Bulletin – Volume 38, 2014 77
[4] Pathirana S, Kawabata M, Goonatilake R. Study of potential risk of dengue disease outbreak in Sri Lanka using GIS and statistical modelling. Journal of Rural and Tropical Public Health. 2009;8:8-17. http://epubs.scu.edu.au/cgi/viewcontent.cgi?article=1866& context=esm_pubs – accessed 24 December 2014.
[5] Sri Lanka, Ministry of Health. National plan of action for prevention and control of dengue fever 2005 – 2009. Colombo: Epidemiology Unit. http://www.epid.gov.lk/web/ images/pdf/Circulars/latest_draft_poa_for_dfdhf.pdf - accessed 24 December 2014.
[6] Dash A, Bhatia R, Kalra N. Dengue in South-East Asia: an appraisal of case management and vector control. Dengue. 2012 Dec;36:1-13. http://www.wpro.who.int/mvp/epidemiology /dengue/Dengue_Bulletin_Vol36.pdf – accessed 24 December 2014.
[7] Erlanger T, Keiser J, Utzinger J. Effect of dengue vector control interventions on entomological parameters in developing countries: a systematic review and meta-analysis. Medical and veterinary entomology. 2008;22(3):203-21.
[8] Arunachalam N, Tana S, Espino F, Kittayapong P, Abeyewickrem W, Wai KT, et al. Eco-bio-social determinants of dengue vector breeding: a multicountry study in urban and periurban Asia. Bulletin of the World Health Organization. 2010;88(3):173-84. http://www.scielosp.org/pdf/bwho/v88n3/10.pdf - accessed 25 December 2014.
[9] Sri Lanka, Ministry of Health. Epidemiology Unit. Colombo: MoH, 2011. www.epid.gov.lk – accessed 25 December 2014.
[10] Thalagala N. Health system cost for dengue control and management in Colombo District,Sri Lanka. in 2012. Colombo: Dengue Tool Surveillance Project, Epidemiology unit, Ministry of Health, 2014. http://www.epid.gov.lk/web/images/pdf/Publication/Health_System_Cost_for_Dengue.pdf - accessed 25 December 2014.
[11] World Health Organization . Integrated vector management (IVM). Geneva: WHO. http://www.who.int/neglected_diseases/vector_ecology/ivm_concept/en/ - accessed 25 December 2014.
78 Dengue Bulletin – Volume 38, 2014
Dengue in South Asian sub-continent: how well have the surveillance systems done?
Ananda Amarasinghe1,2, Anil K Bhola3, Scott B Halstead2
1Epidemiology Unit, Ministry of Health, Sri Lanka 2Dengue Vaccine Initiative, International Vaccine Institute, Seoul, Korea
3Independent Public Health Consultant, New Delhi, India
Abstract
The South Asian sub-continent with high population density accounts for two-third of the global burden of symptomatic dengue cases but the severe under-reporting based on passive surveillance systems hardly measures the true extent and spread of dengue infection. It warrants re-orienting and re-vitalizing surveillance systems for effective and efficient control and prevention of dengue, particularly in larger countries in the subcontinent.
Keywords: Dengue; Dengue burden; South Asia; Surveillance.
Background
Dengue virus (DENV) infection is the most prevalent arbo-virus infection in tropical and subtropical regions of Asia and Americas.1 The recent global estimates reveal that 390 million (95% CI 284–528) DENV infections occur annually and 2.5 billion people live in dengue-endemic countries.2 It is estimated that only 30% of dengue infections manifest as overt illnesses ranging from mild acute febrile illness to dengue haemorrhagic fever (DHF).
Out of 96 million global symptomatic cases nearly two-third are from Asia.2 This commentary is focused only on the following South Asian sub-continent countries; Bangladesh, Bhutan, India, Maldives, Nepal, Pakistan and Sri Lanka. All four serotypes of DENV have been reported in these countries.3
The number of cases and the patients clinical care are the concerns of the public and the media. Most countries in the sub-continent have developed national guidelines for the clinical management of dengue by customizing the WHO South-East Asia Region guidelines according to the prevailing local situations.2,3 Availability and better access to good medical
#E-mail: [email protected]

Dengue in South Asian sub-continent: how well have the surveillance systems done?
Dengue Bulletin – Volume 38, 2014 79
care has no doubt significantly reduced mortality. However, the true burden of the disease and its economic impact in these countries is still not adequately studied.4-5 Dengue is a notifiable disease in all these countries and functioning surveillance of communicable diseases; including dengue, is in place. But the issue of concern is whether the dengue surveillance system in the South Asian sub-continent is effective and efficient enough to serve its purpose of controlling and preventing dengue transmission and its spread.
Dengue burden in the South Asian sub-continent
India is the largest country, both geographically and by population, in this region.6 The first ever report of dengue in India was 200 years ago but it has been reported as endemic only over the last two decades.7–9 Only after a severe dengue outbreak in 1996, a sentinel surveillance system was established under the National Vector-Borne Disease Control Programme in India.10 Since then, the number of reported cases has gradually increased. In 2013, the highest-ever number of 75 454 cases with 167 deaths were reproted.10 However, according to the global estimates, annually there are about 32 million symptomatic DENV infections in India.2 Another recent estimate found that there would be 700 000 or more cases of overt dengue illnesses/year in India.9 It is important to note that comparison of these numbers need to be cautious, because there are some distinct features of the numbers: infections (in apparent illness), overt dengue illness and laboratory cases are not the same. The infections represent the highest proportion of the disease, while laboratory cases are the lowest. It is important to note that the reporting system in India is passive, sentinel site-based and only laboratory confirmed cases are reported. This system cannot possibly detect the full magnitude of dengue disease in the country.
Bangladesh, with a population of 156.5 million has hardly reported any major outbreak of dengue, except in 2000,6,11 despite the prevailing factors favouring the disease transmission such as vector, tropical climate, unplanned urbanization, etc. The estimates indicate about 4 million cases of dengue, but national reports by passive surveillance show only around 1000 cases/year.2 It is important to note that Bangladesh reports the lowest rate in the sub-continent (Table 1). Other competing communicable diseases and public health issues and also frequent natural disasters (eg. floods) in the country may have resulted in less attention to dengue.
Global burden study estimates that there are 3.4 million dengue cases in Pakistan with a population of about 182 million.2,6 The first dengue outbreak was reported in 1994.12 Reporting practice varies by the states and mixed passive and ad hoc sentinel site surveillance systems are in place. It is observed that the country surveillance system largely functions only during epidemics. According to the country reports from 2006, less than 5000 cases/year were reported except in 2010–2011 when the country reported the largest-ever outbreak with 252 000 clinically suspected cases, of which 17 000 were laboratory confirmed.13,14

Dengue in South Asian sub-continent: how well have the surveillance systems done?
80 Dengue Bulletin – Volume 38, 2014
Sri Lanka with a population of 20.4 million6, has indicated a hyper-endemic trend of the disease.15 It has a combined sentinel and enhanced passive surveillance system. Dengue was first reported in the 1960s and since 2009, it has been reported on an average of 30 000 to 40 000 clinically suspected cases/year.16 However, according to the global estimates, 670 000 symptomatic cases would be expected annually in the country.2 Sri Lanka has a potentially high opportunity to improve the surveillance system, because of the high public health alert and the disease priority recognized by the health authority.
Dengue is new to Nepal, where 27.7 million population6 first experienced a massive outbreak in 2010, since its first-ever dengue case was reported in 2004.17-18 Country statistics shows around 100 cases/year, while estimates indicate 570 000 cases annually.2
Bhutan, a hilly small country with 0.75 million population,6 also reported around 100 cases/year.19 Dengue started to appear in 2004 and over 2500 cases were reported in the dengue outbreak of 2005.20 The estimated annual burden is 4700 cases/year.2 Both Nepal and Bhutan share a common challenge with its geographical terrain to sustain an efficient surveillance system. In any country, surveillance is a part of the health care delivery system and it depends on the health care infrastructure too. When the infrastructure is underdeveloped, a poor surveillance system is unavoidable.
Maldives with 199 inhabited small islands with 0.35 million population has reported around 1000 cases/year although the global estimates indicate around 6000 cases per year.2 The health care network covering each inhabited island is able to pick suspected dengue cases from a given small population, and is an advantage in its surveillance system.
Central points
The proportion of cases reported by the surveillance system, even during outbreak periods fall short of the global estimates. This is more apparent in larger countries. We used available published estimates to demonstrate a comparison between reported caseload against expected caseload (Table 1). It helps to understand the magnitude of under-reporting and what proportion of cases from the population is missing from the surveillance radar. During the last few decades, an increasing number of research projects including special surveillance have been reported in these countries.4,8-9, 15 This a positive sign that these countries are generating novel country specific data.
According to the new global burden study, India had the highest disease burden of any dengue-endemic country in the world.2 In the last few years, the increasing number of dengue cases reported by India is largely due to improvements in the surveillance system rather than a true increase in disease burden. However, as we have pointed out previously, the surveillance system in India is limited to sentinel sites and also to the laboratory confirmed cases.

Dengue in South Asian sub-continent: how well have the surveillance systems done?
Dengue Bulletin – Volume 38, 2014 81
Table 1: Country surveillance system and its ever reported highest number of cases and dengue burden estimates
Country Type of dengue surveillance system Highest number of cases ever reported versus dengue estimates*
Ratio %
Bangladesh Routine passive surveillance 5000: 4 000 000 0.13%
Bhutan Routine passive surveillance and enhanced sentinel sites surveillance
2500: 4700 53.19%
India Passive sentinel site- laboratory confirmed surveillance
75 000: 32 000 000 0.23%
75 000: 700 000¶ 10.71%
Maldives Routine enhanced passive surveillance 1000: 6000 16.66%
Nepal Routine passive surveillance 7000: 570 000 1.23%
Pakistan Routine passive surveillance and ad-hoc sentinel sites surveillance
252 000: 3 400,000 7.42%
Sri Lanka Routine passive surveillance and Enhanced sentinel site surveillance
44 000: 670 000 6.57%
*Global estimates by Bhatt et al (2012) ¶Estimates for India by Amarasinghe et al (2014)
Laboratory diagnosis is important in dengue, particularly in non-epidemic periods, non-endemic geographical areas and in early detection of the outbreaks. It is also an essential component in research confirming the cases. Although it is a bonus to have a laboratory- supported routine surveillance system it is not practical, one reason being the cost involved. All available dengue diagnostics have their advantages and disadvantages; each of the lab test result is linked with day of illness. The clinical case definition with a good sensitivity and specificity is the key in routine passive surveillance.
Existing passive surveillance systems need to be supported with a sentinel site component. Routine passive surveillance can rely on clinical diagnosis, whereas the sentinel sites need support with laboratory diagnosis. This combination will lead to a high yield in surveillance. Besides, entomological surveillance should also supplement and guide the vector control interventions. It is unrealistic to expect any good output from a surveillance system, without adequate number of trained manpower, logistics support and monitoring and evaluation. These are the core issues common in most of these countries in the sub-continent. It is true that this is an immense challenge, particularly for larger countries with a very high and diverse population, complex administrative structures and health care delivery systems.
The consequences of a weak and flaccid surveillance system are an under-estimated burden of dengue, leading to unrealistic planning that is unlikely to be evidence-based with insufficiently designed prevention and control measures.

Dengue in South Asian sub-continent: how well have the surveillance systems done?
82 Dengue Bulletin – Volume 38, 2014
The countries share some common challenges in dengue surveillance and also have some differences. Therefore, the concern of the public health authority should be to review the country surveillance system in order to address the gaps for measuring the dengue burden and planning, resource allocation, designing disease prevention and control interventions.
Conclusion
Dengue burden as measured by existing surveillance systems in the South Asian sub-continent, particularly in Bangladesh, India and Pakistan are still below expectation and largely under-reported. Surveillance systems in the countries must be re-oriented and re-vitalized for capturing the realistic extent of the burden of dengue. Without realistic data on disease burden it is difficult to have effective interventions for prevention and control of dengue in the sub-continent.
References[1] World Health Organization. Dengue guidelines for diagnosis, treatment, prevention and control: new
edition. Geneva: WHO, 2009. http://www.who.int/rpc/ guidelines/ 9789241547871/en/ - accessed 25 December 2014.
[2] Bhatt S, Gething PW, Brandy OJ, Messina JP, Farlow AW, Moyes CL, Drake JM, Brownstein JS, Hoen AG, Sankoh O, Myers MF, George DB, Jaenisch T, Wint GRW, Simmons CP, Scott TW, Farrar JJ, Hay SI, 2013. The global distribution and burden of dengue, 2013. Nature. 2013 Apr 25;496(7446):504-7. doi:1038/nature 12060.
[3] World Health Organization, Regional Office for South-East Asia. Comprehensive guidelines for prevention and control of dengue and dengue haemorrhagic fever. New Delhi: WHO-SEARO, 2011.
[4] Yara Halasa, Halasa YA, Dogra V, Arora N, Tyagi BK, Nanada D, Shepard DS. Overcoming data limitations: design of a multi component study for estimating the economic burden of dengue in India. Dengue Bulletin. 2011;35:1-14.
[5] Gubler DJ. The economic burden of dengue. Am J Trop Med Hyg. 2012;86(5):743–4. doi: 10.4269/ajtmh.2012.12-0157. http://www.ajtmh.org/content/86/5/743.full.pdf +html - acessed 25 December 2014.
[6] World Bank. Data: population, total. Washington, DC: WB. - accessed on August 08, 2014
[7] Jatanasen S, Thongcharoen P. Dengue haemorrhagic fever in South East-Asian countries. In: Monograph on dengue/dengue haemorrhagic fever. New Delhi: WHO-SEARO, 1993. pp. 23-30.
[8] Chakravarti A, Arora R, Luxemburger C. Fifty years of dengue in India. Trans R Soc Trop Med Hyg. 2012 May;106(5):273-82. doi: 10.1016/j.trstmh.2011.12.007. Epub 2012 Feb 21.
[9] Amarasinghe A. Bhola AK. Halstead SB. Uncovering dengue in India: morbidity estimates. Global Journal of Medicine and Public Health. 2014;3(3). - accessed 25 December 2014.
Dengue in South Asian sub-continent: how well have the surveillance systems done?
Dengue Bulletin – Volume 38, 2014 83
[10] Government of India, Ministry of Health and Family Welfarea. Long term action plan for prevention and control of dengue and chickengunya. New Delhi: Directorate of National Vector Borne Disease Control Programme, MOH&FW, 2007. http://nvbdcp.gov.in/Doc/Final_long_term_Action_Plan%20.pdf - accessed 25 December 2014.
[11] Rahman M, Rahman K, Siddque AK, Shoma S, Kamal AHM, Ali KS, Nisaluk, Breiman RF. First outbreak of dengue hemorrhagic fever. Bangladesh. Emerg Infect Dis. 2002;8(7):738-40. doi:10.3201/eid0807.010398.
[12] Paul RE, Patel AY, Mirza S, Fisher-Hoch SP, Luby SP. Expansion of epidemic dengue viral infections to Pakistan. Int J Infect Dis. 1988;2(4):197-201.
[13] Ahmed S, Mohammad WW, Hamid F, Akhter A, Aftal RK, Mahmood A. The 2011 dengue haemorrhagic fever outbreak in Lahore – an account of clinical parameters and pattern of haemorrhagic complications. J Coll Physicians Surg Pak. 2013 Jul;23(7):463-7. Doi:07.2013/JCPSP.463467. http://www.ncbi.nlm.nih.gov/ pubmed/ 23823947 - accessed 25 December 2014.
[14] World Health Organization, Regional Office for the Eastern Mediterranean. Dengue in Pakistan. Cairo: WHO-EMRO. http://www.emro.who.int/surveillance-forecasting-response/outbreaks/dengue-fever-in-pakistan.html - accessed 25 December 2014.
[15] Tissera H, Amarasinghe A, de Silva AM, Kariyawasam P, Corbett KS, Katzelnick L, Tam CC, Letson GW, Margolis HS, De Silva AD. Burden of dengue infection and disease in a pediatric cohort in urban Sri Lanka. Am J Trop Med Hyg. 2014 Jul;91(1):132-37. doi:10.4269/ajtmh.2013.0540.
[16] Sri Lanka, Ministry of Health. Epidemiology unit. Colombo: MOH. http://www.epid.gov.lk - accessed 25 December 2014.
[17] Pandey BD, Morita K, Khanal SR, Takasaki T, Miyazaki I, Ogawa T, et al. Dengue virus. Nepal. Emerg Infect Dis. 2008;14(3):514–5. Doi: 10.3201/eid1403. http://www.ncbi.nlm.nih.gov/pmc/articles/PMC2570825/ - accessed 25 December 2014.
[18] Gupta BP, Manandhar KD, Malla R, Tamarakar CS, SK Mishra, Rauniyar R. Emergence of dengue virus infection in Nepal. Int J Appl Sci Biotechnol. 2013;1(3):79-84. Doi:10.3126/ijasbt.v1i3.8384. http://ijasbt.org/vol_1/ BP_Gupta_et.al._1(3).pdf – accessed 25 December 2014.
[19] Royal Government of Bhutan, Ministry of Health. Public health laboratory services. Thimphu: Department of Public Health, MOH. http://www.phls.gov.bt - accessed 25 December 2014.
[20] Tandin Dorji, In-Kyu Yoon, Edward C. Holmes, Sonam Wangchuk, Tashi Tobgay, Ananda Nisalak, Piyawan Chinnawirotpisan, Kanittha Sangkachantaranon, Robert V. Gibbons, Richard G. Jarman. Diversity and origin of dengue virus serotypes 1, 2, and 3. Bhutan. Emerg Infect Dis. 2009;15(10):1630–1632. doi: 10.3201/eid1510.090123. http://wwwnc.cdc.gov/eid/article/15/10/09-0123_article accessed 25 December 2014.

84 Dengue Bulletin – Volume 38, 2014
Evaluation of sensitivity and specificity of commercially available dengue rapid test kit in two hospitals in
Colombo, Sri LankaHasitha A Tisseraa, Dinindu P Kaluarachchia, Thilini D Jayasenaa,
AnandaAmarasinghea, Aravinda M de Silvab, BuddikaWeerakoona, SunethraGunasenac, Jayantha S D K Weeramana, Duane Gublerd,
Annelies Wilder-Smithe, Paba Palihawadanaa
aEpidemiology Unit – Ministry of Health, Sri Lanka bDepartment of Microbiology and Immunology, University of North Carolina School of medicine,
Chapel Hill, north Carolina, United States of America (USA) cMedical Research Institute, Colombo, Sri Lanka
dDUKE-NUS, Graduate Medical School, Singapore eUmea University, Sweden
Abstract
Easy to perform and accurate point of care rapid diagnostic test could be a useful tool for timely decision making for management of dengue patients. This study was done on paediatric and adult patients presenting with ≤ 7 days of fever in both outpatient and inpatient settings. Dengue rapid test kit (NS1 and IgM) performance at the point of care was compared with standard in-house RT PCR, NS1 Ag ELISA and IgM Capture ELISA tests. A total of 1225 blood samples, 71.8% collected on 3–5 days of fever, were tested. In outpatient and inpatient departments rapid NS1 test sensitivity ranged from 62.39% to 74.64% upto day 4 of fever and then declined from day 5 onwards. The sensitivity of rapid IgM test was 18.99% for outpatients and 48.85% for inpatients. Overall sensitivity of the rapid test was 77.51% with little variation due to day of fever and type of treatment setting. For acute fever patients in the inpatient setting the rapid test kit would be a useful bedside test to guide the clinicians.
Keywords: Dengue diagnosis; Dengue laboratory tests; Dengue rapid tests.
Introduction
Dengue has become the most common mosquito-borne arboviral infection in the world1. An early diagnosis is important for effective management and prevention of complications2.
#E-mail: [email protected]

Evaluation of sensitivity and specificity of commercially available dengue rapid test kit in two hospitals in Colombo, Sri Lanka
Dengue Bulletin – Volume 38, 2014 85
Detection of viral antigen, RNA and specific antibodies are the common laboratory methods used to confirm the presence of dengue virus (DENV) infection2. Dengue rapid test kits to detect specific antibodies and NS1 antigen are more frequently being used in patient care services as well as for disease surveillance3,4,5.
DENV isolation and a four-fold or greater increase in specific antibodies are considered the “Gold Standard” of diagnosing dengue infection. Because of its higher sensitivity and the rapidity of obtaining results6,7,8 detection of dengue virus RNA by reverse transcriptase polymerase chain reaction (RT-PCR) is replacing standard virology and serologic diagnostic methods. Real-time PCR sensitivity ranges from 62–92.8% and specificity 92.4–100% for all four dengue virus serotypes9,10,11.
NS1 antigen detection can also be used for early detection of dengue infection. Dengue NS1 antigen can be detected from 0–9 days of the illness12,4 and is most sensitive during the first three days of illness and during primary infection13. The sensitivity of NS1 detection by commercial kits vary with the kit (range 21–99%), but in all the specificity remains 100%14,15,16. When the NS1 is combined with IgM antibody in a DUO Kit, the sensitivity improves without compromising specificity17,18.
DENV specific antibodies can be detected by enzyme-linked immunosorbent assay (ELISA), Haemaggulutination inhibition (HI), complement fixation (CF) or neutralization test (NT)4. IgM antibody is detected after 3–5 days of the illness in both primary and secondary infections, but the response is weaker and more transient in the latter4, leading to a small percentage of false negatives19. False positive IgM results have been observed in malaria and secondary dengue patients by rapid IgM assays4,20. IgM sensitivity and specificity by commercially available kits ranges from 21–99% and 77–98%, respectively20,4. Dengue-specific IgG antibodies are detectable only after the first week of illness (day 10–15 of illness) in primary dengue infection, but are detectable in the acute phase sera in high titres in secondary dengue infection4.
Dengue has currently become a major health care issue in Sri Lanka. During the rainy season a large number of febrile patients who are suspected of having dengue illness present to health care institutions. Although there is no rapid test that can be accurately used in a point-of-care setting, in busy medical care settings, early diagnosis can be helpful to physicians in making timely decisions to admit, follow-up and rule out the diagnosis of possible dengue infection. It also benefits the patient/family to care for the illness. In current Sri Lankan health care setting, there is a growing demand for laboratory testing. In such situations dengue rapid test assays can be useful. The rapid test is easy to use and does not require a lab or special expertise. The steps are simple, easy to follow and clinic personnel can be easily trained to perform them. However, it should be emphasized that a suspicion or early diagnosis of dengue in a general practitioner or outpatient setting should be primarily based on the clinical presentation, and not on the rapid test kit results.

Evaluation of sensitivity and specificity of commercially available dengue rapid test kit in two hospitals in Colombo, Sri Lanka
86 Dengue Bulletin – Volume 38, 2014
The objective of this study was to evaluate the sensitivity and specificity of the DUO NS1/IgM dengue rapid test kit and compare it with single plex NS1 and IgM tests in two hospitals in Colombo, Sri Lanka. A secondary objective was to determine the best day and setting (outpatient or inpatient care settings) to perform these tests.
Materials and methods
Study design: The study was a cross-sectional analytical study that was conducted from March 2012 to April 2014.
Study setting: The study was carried out in two main hospitals in the Colombo district; Lady Ridgeway Hospital (LRH) for children, which is the national centre of excellence for paediatric care, and the Infectious Disease Hospital (IDH), the national centre for infectious disease care. Both the inpatient and outpatient settings were used for data collection.
Study population: A total of 1225 patients were enrolled through simple random sampling.
Case definition: A case of fever was defined as a patient having a history of temperature of ≥38 °C lasting ≤7 days at the time of enrolment and was considered a case even in the absence of high temperature at the time of interview since a majority of patients were taking antipyretics before reaching hospital.
Inclusion criteria: A patient having fever lasting ≤7 days who had given consent for blood drawing was included in the study.
Exclusion criteria: Patients having fever for more than seven days, those who have not or were unable to give written consent were not included in the study. Also, patients with a history that could have harmful effects due to blood drawing were also excluded from the study.
Consent: Informed written consent from the patient was taken by a trained pre-intern doctor. In paediatric patients, informed written consent was taken from the parent or guardian with paediatric assent.
Collection of blood samples: A volume of 2.5ml and 5 ml of venous blood was drained from paediatric patients and adult patients respectively into Ethelene diamine tetra acetic acid(EDTA) anti-coagulated vacutainer tubes (BD vacutainer tubes, BD diagnostics, New Jersey, USA). The sample was labelled with a study ID and a small amount of blood taken for on-the-spot rapid test. The cold chain of sample were maintained until transport to the laboratory where laboratory testing was performed and sample allocates were stored for further testing.
Rapid test: The rapid test was performed using the SD Bioline Dengue Duo kit by trained pre-intern doctors. The test was carried out according to the manufacturer’s instruction21.

Evaluation of sensitivity and specificity of commercially available dengue rapid test kit in two hospitals in Colombo, Sri Lanka
Dengue Bulletin – Volume 38, 2014 87
Laboratory testing: The tests performed were the RT-PCR, Dengue IgM antibody and Dengue NS1 Antigen. RT-PCR was performed using an in-house method22 while Standard Diagnostics (DS) Dengue NS1 A°g ELISA kit and SD Dengue IgM Capture ELISA kit were used according to the manufacturer’s instructions23,24.
Data entering and analysis: All the available data were entered in duplicate by two data entry operators into Microsoft Access database. The consent forms and lab reports were stored in secured cupboards accessible only to authorized personnel of the study. All computers and databases were password-protected. Analysis was carried out using SPSS 20.
Ethical clearance for this study was granted by the Research Ethics Committee at the Medical Research Institute, Ministry of Health, Sri Lanka.
Results and discussion
The total sample of 1225 patients consisted of 51.8% (n=635) males, 49.85% (n=611) paediatric (<12 years of age), and 49.3% (n=604) were > 12 years, including 0.7% (n=10) patients aged >65 years. The majority of the samples were collected on day 3–5 of the illness (71.8%), with small numbers on day 1 (n=23) and day 7 (n=37).
The sensitivity and specificity of the Dengue Duo kit NS1 alone were 61.07% and 96.32% respectively (Table 2). These values remained the same for both outpatient and inpatient departments (Figures 4,5). Rapid Test NS1 sensitivity remained high on day 2, 3 and 4 of illness, ranging from 62.39% to 74.64% (Figure 1) but declined from day 5 onwards. This is probably because the NS1 antigen is high in the first few days of the illness and gradually declines thereafter. The Duo kit NS1 specificity remained high in both departments regardless of the day of illness (Figures 4,5).
The sensitivity of Dengue Duo kit IgM alone was 46.04% and the value was comparatively high for inpatients (Table 2). This is probably because the IgM estimation by the rapid test kit is more accurate later in the infection and since most of the samples after the fourth day of illness were collected from the inpatient department. However, the specificity of the test remains more or less the same (95.79%) for both departments.
The SD bioline Dengue Duo kit as a whole had a sensitivity of 77.51% and a specificity of 93.68%. The sensitivity was higher in the inpatient department (78.72%) and the specificity was higher in the outpatient department (98.88%). Overall the sensitivity and specificity showed relatively little variability with the day of illness (Figure 3).
The results show that using the Dengue Duo kit with both NS1 and IgM together will result in a higher sensitivity rather than using each test alone.

Evaluation of sensitivity and specificity of commercially available dengue rapid test kit in two hospitals in Colombo, Sri Lanka
88 Dengue Bulletin – Volume 38, 2014
Also, in the inpatient setting the rapid kit would be a useful bedside screening test rather than a confirmatory test. The decision whether the rapid test kit should be used will depend on the availability of the rapid and conventional tests, costs and time constraints. Interpretation of the test by the health professional should be carried out in collaboration with the respective patient’s clinical scenario and the kit used as a guide rather than a definitive diagnostic tool.
Table 1: Comparison of standard tests vs rapid tests
Rapid tests Standard tests
Result NS-1 Only PCR % Only NS1 % Only
IgM % All 3 % Any of 3 %
Positive 530 310 58.5 486 91.7 350 66.0 154 29.1 516 97.4
Negative 695 220 31.7 38 5.5 178 25.6 357 51.4 14 2.0
Total 1225 530 43.3 524 42.8 528 43.1 511 41.7 530 43.3
Result IgM Only PCR % Only NS1 % Only
IgM % All 3 % Any of 3 %
Positive 405 102 25.2 181 44.7 239 59.0 56 13.8 285 70.4
Negative 820 303 37.0 223 27.2 165 20.1 120 14.6 119 14.5
Total 1225 405 62.1 404 33.0 404 33.0 176 14.4 404 33.0
Result Both (+) Only PCR % Only NS1 % Only
IgM % All 3 % Any of 3 %
Positive 256 109 42.6 238 93.0 237 92.6 34 13.3 170 66.4
Negative 526 147 27.9 15 2.9 18 3.4 86 16.3 160 30.4
Total 782 256 32.7 253 32.4 255 32.6 120 15.3 330 42.2
Table 2: Summary of standard laboratory tests and rapid test kit results
Lab confirmation by RTPCR/ SD IgM/ SD NS1
Test ResultPositive Negative Total
(n=845) (n=380) 1225
Rapid NS1Positive 516 14 530
Negative 329 366 695
Rapid IgMPositive 389 16 405
Negative 456 364 820
Rapid duoPositive 655 24 679
Negative 190 356 546

Evaluation of sensitivity and specificity of commercially available dengue rapid test kit in two hospitals in Colombo, Sri Lanka
Dengue Bulletin – Volume 38, 2014 89
Table 3: Sensitivity and specificity of rapid test kit NS1 antigen and IgM antibody detection
OPD (n=257)
IPD (n=968)
Total (n=1225)
RapidNS1 Sensitivity 58.23% 61.36% 61.07%
RapidNS1 Specificity 98.88% 94.06% 96.32%
RapidIgM Sensitivity 18.99% 48.83% 46.04%
RapidIgM Specificity 100.00% 92.08% 95.79%
Duo Sensitivity 65.82% 78.72% 77.51%
Duo Specificity 98.88% 89.11% 93.68%
Figure 1: Rapid test NS1 sensitivity and specificity variation with duration of illness
RNS1 Sensitivity RNS1 Specificity
100%
90%
80%
70%
60%
50%
40%
30%
20%
10%
0%Day 1 Day 2 Day 3 Day 4 Day 5 Day 6 Day 7
10097.06 97.96 97.06 94.81 93.75
100
45.45
62.05
74.64
62.3958.01
53.4246.88

Evaluation of sensitivity and specificity of commercially available dengue rapid test kit in two hospitals in Colombo, Sri Lanka
90 Dengue Bulletin – Volume 38, 2014
Figure 2: Rapid test IgM sensitivity and specificity variation with duration of illness
RIgM Sensitivity RIgM Specificity
100%
90%
80%
70%
60%
50%
40%
30%
20%
10%
0%Day 1 Day 2 Day 3 Day 4 Day 5 Day 6 Day 7
100 100 100 98.0493.51
85.42
100
18.18
9.38
20.29
36.32
62.7766.44
53.13
Figure 3: Rapid Duo kit : NS1 and IgM combination sensitivity and specificity variation with duration of illness
Duo Sensitivity Duo Specificity
100%
90%
80%
70%
60%
50%
40%
30%
20%
10%
0%Day 1 Day 2 Day 3 Day 4 Day 5 Day 6 Day 7
10097.06 97.96 96.08
89.61 85.42
100
63.6468.75
81.1674.36
80.09 78.08
68.75

Evaluation of sensitivity and specificity of commercially available dengue rapid test kit in two hospitals in Colombo, Sri Lanka
Dengue Bulletin – Volume 38, 2014 91
Figure 4: Outpatient department NS1 with day of illness
NS1 Sensitivity NS1 Specificity
100%
90%
80%
70%
60%
50%
40%
30%
20%
10%
0%Day 1 Day 2 Day 3 Day 4 Day 5 Day 6
10094.12
100 98.25 100 100
42.86
87.05
65.52
45.83
57.14
50.00
Figure 5: Inpatient department NS1 with day of illness
NS1 Sensitivity NS1 Specificity
100%
90%
80%
70%
60%
50%
40%
30%
20%
10%
0%Day 1 Day 2 Day 3 Day 4 Day 5 Day 6 Day 7
100 10093.94 95.56
92.16 93.02100
5054.17
77.06
64.2958.04
53.4746.88

Evaluation of sensitivity and specificity of commercially available dengue rapid test kit in two hospitals in Colombo, Sri Lanka
92 Dengue Bulletin – Volume 38, 2014
Figure 6: Outpatient department IgM with day of illness
IgM Sensitivity Igm Specificity
100%
90%
80%
70%
60%
50%
40%
30%
20%
10%
0%Day 1 Day 2 Day 3 Day 4 Day 5 Day 6 Day 7
100 100 100 100 100 100 100
14.290.00 6.90
33.33
57.14
0.00
Figure 7: Inpatient department IgM with day of illness
IgM Sensitivity Igm Specificity
100%
90%
80%
70%
60%
50%
40%
30%
20%
10%
0%Day 1 Day 2 Day 3 Day 4 Day 5 Day 6 Day 7
100 100 10095.56
90.2083.72
100
25.00
12.50
23.85
36.67
62.9567.36
53.13
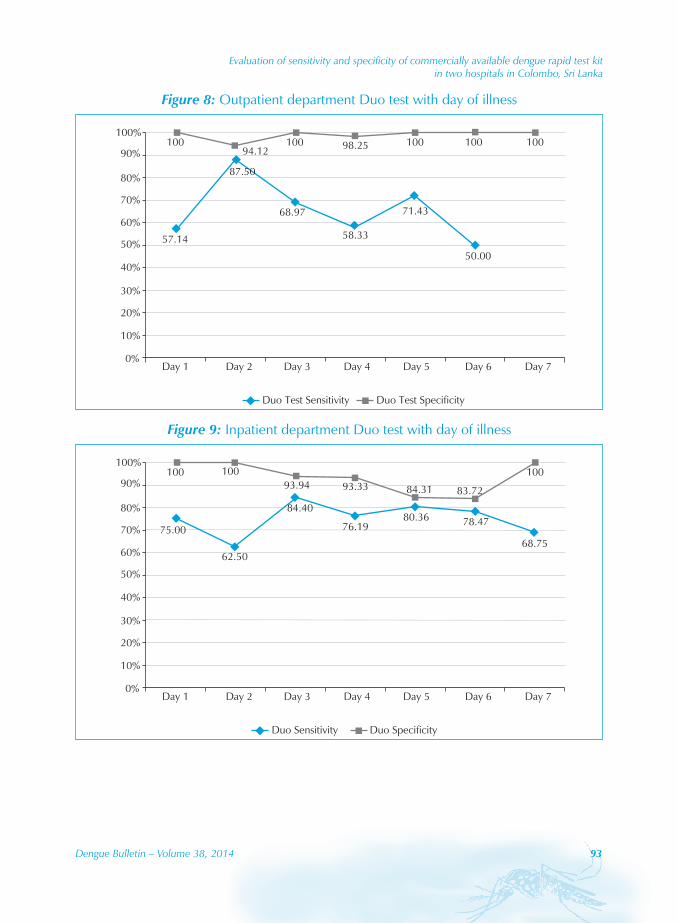
Evaluation of sensitivity and specificity of commercially available dengue rapid test kit in two hospitals in Colombo, Sri Lanka
Dengue Bulletin – Volume 38, 2014 93
Figure 8: Outpatient department Duo test with day of illness
Duo Test Sensitivity Duo Test Specificity
100%
90%
80%
70%
60%
50%
40%
30%
20%
10%
0%Day 1 Day 2 Day 3 Day 4 Day 5 Day 6 Day 7
10094.12
100 98.25 100 100 100
57.14
68.97
58.33
71.43
50.00
87.50
Figure 9: Inpatient department Duo test with day of illness
Duo Sensitivity Duo Specificity
100%
90%
80%
70%
60%
50%
40%
30%
20%
10%
0%Day 1 Day 2 Day 3 Day 4 Day 5 Day 6 Day 7
100 10093.94 93.33 84.31 83.72
100
75.00
84.40
76.1980.36 78.47
62.5068.75

Evaluation of sensitivity and specificity of commercially available dengue rapid test kit in two hospitals in Colombo, Sri Lanka
94 Dengue Bulletin – Volume 38, 2014
Acknowledgements
The study was partly funded under the Health Theme of the Seventh Framework Programme of the European Community (Grant No. 282589). We offer special thanks to Standard Diagnostics, Inc, Republic of Korea and George Steuart Health, Sri Lanka for providing substantial support for the study. The authors thank all the research assistants and project staff for their dedication. Also special thanks go to the laboratory staff of the Medical Research Institute and Genetech Research Institute, Colombo.
References[1] World Health Organization. Dengue prevention and control: report by the Secretariat. Fifty-fifth World
Health Assembly, provisional agenda item 13.14. Geneva: WHO, 2002. Document No. A55/19. http://apps.who.int/gb/archive/pdf_files/WHA55/ea5519.pdf - accessed 26 December 2014.
[2] Guzmán MG, Kourí G. Dengue diagnosis, advances and challenges. International Journal of Infectious Diseases. 2004;8(2):69-80. http://www.idpublications.com/journals/PDFs/ IJID/IJID_MostDown_2.pdf - accessed 26 December 2014.
[3] Navarrete-Espinosa J, Gómez-Dantés H, GermánCelis-Quintal J, Vázquez-Martínez JL. Clinical profile of dengue hemorrhagic fever cases in Mexico. saludpública de méxico. 2005;47(3):193-200. http://www.google.co.in/url?sa=t&rct=j&q=&esrc=s&frm=1&source=web&cd=1&ved= 0CBwQFjAA&url=http%3A%2F%2Fwww.researchgate.net%2Fpublication%2F7657120_Clinical_profile_of_dengue_hemorrhagic_fever_cases_in_Mexico%2Flinks%2F09e4150eacbc401910000000&ei=vNqcVJCrG8-eugTnuIHgCQ&usg=AFQjCNEJYPSpdm7B-cmjhozgcyoJ-nHKQQ - accessed 26 December 2014.
[4] Peeling RW, Artsob H, Pelegrino JL, Buchy P, Cardosa MJ, Devi S, Enria DA, Farrar J, Gubler DJ, Guzman MG, Halstead SB, Hunsperger E, Kliks S, Margolis HS, Nathanson CM, Nguyen VC, Rizzo N, Vázquez S, Yoksan S. Evaluation of diagnostic tests: dengue. Nat Rev Microbiol. 2010 Dec;8(12 Suppl):S30-8.
[5] Lam SK, Devine PL. Evaluation of capture ELISA and rapid immunochromatographic test for the determination of IgM and IgG antibodies produced during dengue infection. Clinical and Diagnostic Virology. 1998;10(1):75-81.
[6] Gentry MK, Henchal EA, McCown JM, Brandt WE, Dairymple JM. Identification of distinct antigenic determinants on dengue-2 virus using monoclonal antibodies. The American Journal of Tropical Medicine and Hygiene. 1982;31(3 Pt 1):548-555.
[7] Henchal EA, McCown JM, Seguin MC, Gentry MK, Brandt WE. Rapid identification of dengue virus isolates by using monoclonal antibodies in an indirect immunofluorescence assay. The American Journal of Tropical Medicine and Hygiene. 1983;32(1):164-169.
[8] World Health Organization. Dengue haemorrhagic fever: diagnosis, treatment prevention and control. 2nd edn. Geneva: WHO, 1997. http://whqlibdoc.who.int/publications/1997/ 9241545003_eng.pdf - accessed 14 August 2014.
[9] Houng HSH, Chung-Ming Chen R, Vaughn DW, et al. Development of a fluorogenic RT-PCR system for quantitative identification of dengue virus serotypes 1–4 using conserved and serotype-specific 3’ noncoding sequences. Journal of Virological Methods. 2001;95(1):19-32.

Evaluation of sensitivity and specificity of commercially available dengue rapid test kit in two hospitals in Colombo, Sri Lanka
Dengue Bulletin – Volume 38, 2014 95
[10] Sudiro TM, Ishiko H, Green S, et al. Rapid diagnosis of dengue viremia by reverse transcriptase-polymerase chain reaction using 3’-noncoding region universal primers. The American Journal of Tropical Medicine and Hygiene. 1997;56(4):424-429.
[11] Henchal EA, Polo SL,Vorndam V, et al. Sensitivity and specificity of a universal primer set for the rapid diagnosis of dengue virus infections by polymerase chain reaction and nucleic acid hybridization. The American Journal of Tropical Medicine and Hygiene. 1991;45(4):418-428.
[12] Alcon S, Talarmin A, Debruyne M, et al. Enzyme-linked immunosorbent assay specific to Dengue virus type 1 nonstructural protein NS1 reveals circulation of the antigen in the blood during the acute phase of disease in patients experiencing primary or secondary infections. Journal of Clinical Microbiology. 2002;40(2):376-381.
[13] Hang VT, Nguyet NM, Tricou V, et al. Diagnostic accuracy of NS1 ELISA and lateral flow rapid tests for dengue sensitivity, specificity and relationship to viraemia and antibody responses. PLoS Neglected Tropical Disease. 2009;3(1):e360.
[14] Guzman MG, Jaenisch T, Gaczkowski R, et al. Multi-country evaluation of the sensitivity and specificity of two commercially-available NS1 ELISA assays for dengue diagnosis. PLoS Neglected Tropical Diseases. 2010;4(8):e811.
[15] Kumarasamy V, Wahab AH, Chua SK, et al. Evaluation of a commercial dengue NS1 antigen-capture ELISA for laboratory diagnosis of acute dengue virus infection. Journal of Virological Methods. 2007;140(1):75-79.
[16] Lima MDRQ,Nogueira RMR, Schatzmayr HG, et al. Comparison of three commercially available dengue NS1 antigen capture assays for acute diagnosis of dengue in Brazil. PLoS Neglected Tropical Diseases. 2010; 4(7):e738.
[17] Tricou V, Vu HT, Quynh NV, et al. Comparison of two dengue NS1 rapid tests for sensitivity, specificity and relationship to viraemia and antibody responses. BMC Infectious Diseases. 2010;10(1):142.
[18] Fry SR, Meyer M, Semple MG, et al. The diagnostic sensitivity of dengue rapid test assays is significantly enhanced by using a combined antigen and antibody testing approach. PLoS Neglected Tropical Diseases. 2011;5(6):e1199.
[19] Centers for Disease Control and Prevention. Dengue: laboratory guidance and diagnostic testing. Atlanta, CA: CDC. http://www.cdc.gov/dengue/clinicallab/laboratory.html - accessed 26 December 2014.
[20] Hunsperger EA, Yoksan S, Buchy P, et al. Evaluation of commercially available anti–dengue virus immunoglobulin M tests. Emerging Infectious Diseases. 2009;15(3):436-40.
[21] Standard Diagnostics, Inc. SD BIOLINE dengue duo (Dengue NS1 Ag + IgG/IgM): optimal test for Dengue infection. http://www.standardia.com/en/home/product/rapid/infectious-disease/ Dengue_Duo.html - accessed 26 December 2014.
[22] Kanakaratne N, Wahala WM, Messer WB, Tissera HA, et al. Severe dengue epidemics in Sri Lanka, 2003–2006. Emerging Infectious Diseases. 2009;15(2):192-9.
[23] Standard Diagnostics, Inc. http://www.standardia.com/en/home/product/ELISA/ Dengue_NS1_Ag _ELISA.html - accessed 26 December 2014.
[24] Standard Diagnostics, Inc. SD dengue IgM capture ELISA. http://www.standardia.com/en/ home/product/ELISA/Anti-Dengue_IgM_Capture_ELISA.html - accessed 26 December 2014.

96 Dengue Bulletin – Volume 38, 2014
Prevalence of dengue vector in relation to dengue virus infection in central region of Nepal
Bijaya Gairea,b, Komal Raj Rijala, Biswas Neupaneb, Pravin Paudyalb,c, Ishan Gautamd, Megha Raj Banjaraa, Kouichi Moritae and Basu Dev Pandeyb#
aCentral Department of Microbiology, Tribhuvan University, Kirtipur, Nepal
bEverest International Clinic and Research Center, Kathmandu, Nepal
cDepartment of Microbiology, National College, Kathmandu, Nepal
dNatural History Museum, Tribhuvan University, Swayambhu, Kathmandu, Nepal
eInstitute of Tropical Medicine, Nagasaki University, Japan
Abstract
This paper describes results of an entomological and serological survey that was conducted from July to October 2012 in Chitwan district, central Nepal. A total of 159 breeding habitats were investigated for the presence of Aedes larvae, among which 54 discarded tyres were found to be positive, with a breeding preference ratio (BPR) of 1.15. In the serological study, 46 dengue cases were determined by enzyme linked immuno-sorbent assay (ELISA) in the same area. The container index (CI) as well as the number of dengue cases was higher in the post-monsoon season than the monsoon season. It is concluded that discarded tyres lying outdoors were the preferable wet container for the dengue vector.
Keywords: Dengue; Dengue vectors; Aedes; Container index.
Introduction
Dengue, the most common arboviral disease, ranks as the most important mosquito-borne viral disease in the world. Annually, about 50-100 million new infections are estimated to occur in more than 100 endemic countries.1 About 2.5 billion people living in tropical and sub-tropical regions are at risk of dengue infection.2 The threat of dengue virus infection (DVI) is increasing in Nepal as the disease causes significant morbidity and mortality every year in the neighbouring country. Being bordered by India in the eastern, western and
#E-mail: [email protected]

Prevalence of dengue vector in relation to dengue virus infection in central region of Nepal
Dengue Bulletin – Volume 38, 2014 97
southern belts, Nepal is more vulnerable to worse consequences of DVI. The first outbreak occurred in Nepal following the Indian epidemic of DF/DHF in September–October 2006 followed by a second dengue epidemic in Chitwan in 2010.3 In 2010, there was a major outbreak of dengue in three districts of the Central Terai with 917 cases reported.4 Chitwan district was the worst hit with more than 700 dengue IgM positive cases (data obtained from District Public Health Office, Chitwan). Further, the epidemic of 2010 in Chitwan alarmed the possibility of future outbreaks in Central Terai region of Nepal.
Dengue virus (DENV) has five serotypes and is transmitted by the day-time biting mosquito Aedes aegypti and Ae. albobticus. Ae. aegypti is the major vector for the dengue virus in many parts of the world; Ae. aegypti has wider geographical distribution at present than at any time in the past and is established in virtually all tropical and subtropical countries.6 Ae. albopictus is considered a secondary vector5 and known to be present in the Terai lowlands, Siwalik hills and Middle Mountain region of Nepal since 19567,8 but the introduction of Ae. aegypti is as recent as 2006 in the Terai region of Nepal9 and is involved in dengue outbreaks in Nepal.9,10,11,12 Presence of Ae. aegypti and Ae. albopictus immatures in different areas of Middle Mountain including Kathmandu valley (average elevation 1350 m above sea level) have been reported12,13,14 including the first record of Ae. aegypti from Kathmandu.15 The geographical distribution of dengue vectors in central Nepal was clearly defined. Dengue distribution has gradually spread since 2004 in Nepal and Ae. aegypti and Ae. albopictus were commonly found upto 1350 m in Kathmandu valley and present but rarely found from 1750 m to 2100 m in Dhunche, Rasuwa district, Nepal.
The primary dengue vector A. aegypti has already expanded to at least above 2000m altitude which clearly defines its geographical distribution in Nepal.14 Its altitudinal ranges, density and distribution could be linked to global and local changes resulting from temperature, rainfall, humidity and seasons, varying latitude and altitude16,17,18 along with vehicular movements, growth in human populations, and their activities13,14,15 attributable to outbreaks at new foci.19,20
In Nepal, despite the geographical expansion and significant morbidity of dengue, very limited entomological studies12,13,15,21 along with knowledge, attitude and practice of the local communities about dengue fever among the healthy population of highland and lowland communities in central and southern Nepal22,23 have been carried out so far and hence, the density of the vector mosquitoes has not been clearly noted in the study area. Chitwan, being the worst hit place by dengue in Nepal, we aimed at relating the serology of dengue with the entomological studies here. The major objective of the study was to identify the relationship between Container Index (CI) of vector larvae with the occurrence of dengue.

Prevalence of dengue vector in relation to dengue virus infection in central region of Nepal
98 Dengue Bulletin – Volume 38, 2014
Methodology
Study area
Chitwan lies in the central part of the southern lowlands of Nepal between 27°21’45’’ to 27°52’30’’ N and 83°54’45’’ to 84°48’15’’ E. The altitude of the district ranges from 141 to 1947 meters above sea level. The sampling for the serological study was performed in a tertiary-care hospital, Bharatpur Hospital during July to October 2012. The hospital has a capacity of >300 beds and serves a mixed population and often gets referrals from adjacent districts such as Nawalparasi, Gorkha, Lamjung, Tanahun, Makawanpur and Rupandehi.
Study population
Patients presenting with history of fever for >5 days or temperature of >37.8 oC were recruited into the study if they had two or more of the signs and symptoms relating to dengue. A case was excluded, if routine laboratory analysis (whole blood cell count, urine analysis) suggested bacterial or any viral infection other than dengue infection or any other disease. Subjects with previous Japanese encephalitis immunization were excluded from the study. After the patient was assessed and provided treatment, a standard case report form was completed. About 5 ml of blood from adults and 3 ml blood from children of five years and younger was collected and serum was separated for further serological testing.
Serological study
The serum samples were transferred to the Everest International Clinic and Research Centre (EICRC), Kathmandu, maintaining the reverse cold chain for further serological tests by IgM antibody capture enzyme linked immunosorbent assay (MAC-ELISA) for DENV (Standard Diagnostics Inc., Korea).
Entomological study
The entomological study was also conducted in Chitwan (Figure 1) during the monsoon and post-monsoon period. All potential Aedes breeding habitats such as discarded tyres, plastic buckets, metal drums and earthen pots were examined. Immatures of Aedes were collected using 400 ml capacity dipper, pipette (10 ml), spoon and torchlight depending on the nature of the breeding habitat. The immature of Aedes that were found in the sites were transferred into a plastic container and were brought back to the lab for identification. All live immature mosquitoes were collected and reared24 until adult emergence at the Natural History Museum, Kathmandu. The adult mosquitoes emerged from reared larvae and pupae were identified on the basis of different morphological characters by using taxonomic keys published earlier.8,25 A total of 159 wet containers (71 in monsoon and 88 in post-monsoon

Prevalence of dengue vector in relation to dengue virus infection in central region of Nepal
Dengue Bulletin – Volume 38, 2014 99
period) were examined which were categorized into four different container types; discarded tyres, plastic buckets, metal drums and earthen pots. Based on data collected, Container Index (CI) and Breeding Preference Ratio (BPR) of dengue vectors for different container were calculated.
Statistical analysis
Data was analyzed using SPSS Version 17.0. Chi-square was done and the value of significance for all statistical tests was p value < 0.05.
Figure 1: Map of Chitwan district
Settlement MapBharatpur Municipality
Chitwan

Prevalence of dengue vector in relation to dengue virus infection in central region of Nepal
100 Dengue Bulletin – Volume 38, 2014
Result
The MAC-ELISA test performed in 227 serum samples from suspected dengue cases detected the dengue virus specific IgM antibodies from 46 (18 males, 28 females) cases (Table 1). Most of the patients were in the age group <15 years.
The highest number of dengue cases (16 out of 55) were detected in October, followed by 15 (out of 66) cases in September. The least numbers of dengue cases (6 out of 49) were detected in July and 9 (out of 57) cases in August (Figure 2). The highest number of dengue positive cases (31) were detected in the post-monsoon season and 15 cases were detected in the monsoon season.
Out of 159 wet containers that were searched for the presence of vector larvae, 71 were searched in the monsoon period (37 in July and 34 in August) and 88 were searched in the post-monsoon period (37 in September and 51 in October). Thirteen containers were positive for vector larvae during the monsoon period with CI of 18.3% and 49 containers were positive during the post-monsoon period with CI 60.3% (Table 2). Among the different searched breeding sites, BPR was highest in the case of discarded tyres, with larvae being found in 54 cases out of 120 wet containers (Table 3). The relation between the number of dengue cases and CI is presented in Figure 3.
Table 1: Demographic distribution of dengue cases
Demographic characters Total no. of samples
No. of positive samples (%) p value
Sex
Male
Female
94
133
18 (39.2)
28 (68.8) 0.73
Age in years
< 15
16-30
31-45
46-60
>60
58
36
49
40
44
13 (28.3)
6 (13.0)
11 (23.9)
6 (13.0)
10 (21.8)
0.83
Total 227 46 (100)

Prevalence of dengue vector in relation to dengue virus infection in central region of Nepal
Dengue Bulletin – Volume 38, 2014 101
Figure 2: Distribution of dengue cases
0
10
20
30
40
50
60
70
80
90
July August September October
Suspected CasesPositive Cases
Table 2: Comparison of month-wise contaner index with IgM seropositivity
MonthTotal
containers searched
Total containers
positive
Container index (CI)
IgM seropositivity
July 37 5 13.5% 13.1%
August 34 8 23.5% 19.6%
September 37 22 59.45% 32.6%
October 51 27 52.94% 34.7%
Table 3: Breeding preference ratio of the vector larvae
Container types Container with water X (%) Container with
larvae Y (%) BPR (Y/X)
Discarded tyres 120 75.5 54 87.1 1.15
Plastic buckets 16 10 5 8 0.8
Metal drums 4 2.5 1 1.6 0.64
Earthen pot 19 12 2 3.3 0.28
Total 159 100 62 100

Prevalence of dengue vector in relation to dengue virus infection in central region of Nepal
102 Dengue Bulletin – Volume 38, 2014
Discussion
It is plausible to assume that DENV could have been introduced into Nepal from India, due to the open border between the two countries. This hypothesis is further supported with the finding of nucleotide sequences of the Nepalese dengue strain that have been described to be very similar to the dengue strains circulating in India.12,26 The emergence and reemergence of dengue is directly related to the geographic distribution and increase in density of the mosquito vectors. The factors that promote vector proliferation, including environmental conditions (temperature, humidity and altitude), poor sanitation or availability of potential breeding sites are important constituents of spreading dengue.27 An investigation of the seasonal distribution during April 2009 – March 2010 of potential artificial breeding habitats of Ae. albopictus in urban agglomeration of Kathmandu and Lalitpur districts of Nepal was performed. The breeding preference ratio during all seasons was highest for discarded tyres lying outdoors in both Kathmandu and Lalitpur districts. Among nine container types searched and examined, 95% of discarded tyres were found positive for Ae. albopictus larvae and pupae, followed by metal drums (2%) and plastic drums (1.25%).13 This entomological study, recommended in various countries endemic for dengue, was primarily conducted to measure the relative presence of disease-carrying arthropod vectors to emphasize its the usefulness for identifying possible causes of dengue outbreaks28, for identifying key containers29,30 and for identifying new breeding sites of vectors.
Figure 3: Relation between serology and entomological results
0
10
20
30
40
50
60
70
0
2
4
6
8
10
12
14
16
18
July August September October
no. of DV casesCI
Prevalence of dengue vector in relation to dengue virus infection in central region of Nepal
Dengue Bulletin – Volume 38, 2014 103
In addition, the study was conducted in Chitwan because it is the central part of Nepal and many people from Eastern to the Far Western Regions travel in and through the district. In addition, the district was the most affected district of 2010 epidemics with 739 reported dengue cases (data obtained from District Public Health Office, Chitwan). Further, previous studies have been performed in this region to assess for the serological, clinical and hematological results31 but the entomological studies have not been reported so far.
Comparatively higher numbers of dengue positive cases were observed in September and October than in July and August, which is in accordance with the entomological finding as CI is also high in September and October. As the CI is the proportion of larvae positive containers, higher CI suggest high numbers of mosquitoes were active in these two months for their life cycle and transmission of disease. During the outbreak of dengue in Nepal in 2006, 75% of DF cases were reported in October and a few positive cases in September and November.32 A high number of dengue cases was recorded in October and November in the epidemic of 2010.33 A similar result was obtained in India in 2003 where the maximum number of cases 583 (65.3%) was reported in October.34 There was also an increase in the number of samples received in the post-monsoon period with a peak in the second and third week of October.35
Unusually heavy rainfall subsequently led to a decrease in temperature during the latter part of the monsoon period. The temperature showed a decline and remained almost constant during August (33.8 °C), continuous heavy rainfall subsequently led to a further decrease in the temperature during September to 33.3 °C (data obtained from Department of Hydrology and Meteorology). This might have caused an increase in the number of dengue cases in the post-monsoon period. It can be further explained by the fact that the stagnant fresh water during the post-rainy seasons favoured the breeding of the vector mosquitoes.36 As regards the seasonal prevalence, it is evident from the result that dengue cases started from July with the maximum number of cases in post-monsoon period.
BPR estimates the degree of breeding affinity of dengue vectors towards a particular container type. In this study four different types of containers were searched for the presence of immature dengue vectors, which revealed that discarded tyres followed by old plastic buckets, metal drums and earthen pots were the preferred breeding habitat for the vector mosquito. Similar studies conducted in Philippines37 and in India38 also recorded the highest positivity of immature dengue vectors in discarded tyres. Growing urbanization which demands excessive use of auto mobiles and lack of discarded tyre management system is the main cause of rampant presence of discarded tyres in urban settings, as Chitwan is the central region of Nepal and is the hub for transportation. Discarded tyres were mainly placed near automobile workshops, above the steel tin roof for support in small houses of slum area and small shops with steel tin roof. Discarded tyres unlike other containers hold stagnant water and remain untouched for a long time making it a favourable and safe place of mosquito

Prevalence of dengue vector in relation to dengue virus infection in central region of Nepal
104 Dengue Bulletin – Volume 38, 2014
breeding even in the rainy season. The potential of other artificial containers for breeding by vectors was found to be less during the study period. This might be due to local awareness campaigns in the region following the heavy rain to destroy the breeding habitat of vectors. Performing a repeat survey afterwards to check for an improvement in the larval indices may help determine the effectiveness of the campaigns. The environmental education strategies aimed at reducing potential breeding habitats of Aedes mosquitoes must be innovative. If the larvae of this vector remain in even a few households, it will be sufficient to produce the winged form of the mosquito that is capable of infesting neighbouring houses, putting the surrounding population at risk.
The limitations of the study include the use of simple tools for the identification of vector mosquitoes, short duration of the study and the small sample size. Further, the use of single serum sample for ELISA instead of paired sera and the unavailability of Reverse Transcriptase - Polymerase Chain Reaction (RT-PCR), Hemagglutination Inhibition (HI) tests and testing for NS1 antigen in the field was a major limitation of our study. In spite of these limitations, the results of this study are potentially helpful in suggesting that used tyres are the major cause of proliferation of the vector mosquitoes. The identification of other biotic and abiotic factors responsible for the process was beyond the scope of the study. The results of the study regarding the breeding sites and the seasonal patterns of the disease and vectors can help the local and national health authorities to formulate different programme aimed to minimize the effect of dengue in the near future.
Conclusion
The entomological study showed a higher number of Aedes larvae in the post monsoon period which is associated with the higher number of dengue cases in the post-monsoon period. Determination of BPR revealed the degree of larval breeding affinities toward particular container type and the results indicate discarded tyres were the preferable breeding habitat for the dengue vector. So, a proper vector management programme and environmental education strategies are essential for reducing vectors in future.
Acknowledgements
We thank the staff of the Everest International Clinic and Research Centre, Kathmandu and the Natural History Museum, Swayambhu, Kathmandu, for their technical help. We are extremely grateful to the medical superintendents, doctors, nurses, staff and patients of the respective hospitals for their kind support during the study. We would also like to thank Mr Jitendra Balami and Mr Subarna Subedi for their assistance in sample collection.

Prevalence of dengue vector in relation to dengue virus infection in central region of Nepal
Dengue Bulletin – Volume 38, 2014 105
References[1] World Health Organization. Global strategy for dengue prevention and control 2012-2020. Geneva:
WHO, 2012. http://www.who.int/immunization/sage/meetings/ 2013/april/ 5_Dengue_SAGE_Apr2013 _Global_Strategy.pdf – accessed 26 December 2014.
[2] World Health Organization. Dengue and severe dengue. Fact sheet No.117, March 2014. Geneva: WHO, 2014. http://www.who.int/mediacentre/factsheets/fs117/en/ - accessed 26 December 2014.
[3] Sedhain A, Adhikari S, Bhattarai GR, Regmi S, Subedee LR, Chaudhary SK, Shah M, Shrestha B. A clinicoradiological and laboratory analysis of dengue cases during an outbreak in Central Nepal in 2010. Dengue Bulletin. 2012;36:134-48.
[4] Griffiths K, Banjara MR, O’Dempsey T, Munslow B, Kroeger A. Public health responses to a dengue outbreak in a fragile state: a case study of Nepal. J Trop Med. 2013;158462. http://www.hindawi.com/journals/jtm/2013/158462/ - accessed 26 December 2014.
[5] Aburas HM. ABURAS Index: a statistically developed index for dengue transmitting vector population prediction. Proceedings of World Academy of Science, Engineering and Technology. 2007;23:151-4.
[6] Halstead SB. Dengue virus-mosquito interactions. Annu Rev Entomol. 2008;53:273-91.
[7] Peters W, Dewar SC. A preliminary record of the megarhine and culicine mosquitoes of Nepal with notes on their taxonomy (Diptera: Culicidae). Indian J Malariol. 1956;10:37–51.
[8] Darsie RF, Pradhan SP. The mosquitoes of Nepal: their identification, distribution and biology. Mosq Systematic. 1990;22:(2):69-130.
[9] Malla S, Thakur GD, Shrestha SK, Banjeree MK, Thapa LB, Gongal G, Ghimire P, Upadhyay BP, Gautam P, Khanal S, Nisaluk A, Jarman RG, Gibbons RV. Identification of all dengue serotypes in Nepal. Emerg Infect Dis. 2008;14(10):1669-70.
[10] Pandey BD, Morita K, Khanal SR, Takasaki T, Miyazaki I, Ogawa T, Inoue S, Kurane I. Dengue virus, Nepal. Emerg Infect Dis. 2008;14:514-5.
[11] Dumre SP, Shakya G, Na-Bangchang K, Eursitthichai V, Grams HR, Upreti SR, Ghimire P, KC K, Nisaluk A, Gibbons RV, Fernandez S. Short report: dengue virus and Japanese Encephalitis virus epidemiological shifts in Nepal: a case of opposing trends. Am J Trop Med Hyg. 2013;88(4):677-80.
[12] Pandey BD, Nabeshima T, Pandey K, RajendraSP, Shah Y, Adhikari BR, Gupta G, Gautam I, TunMMN, Uchida R, Shrestha M, Kurane I, Morita K. First isolation of dengue virus from the 2010 epidemic in Nepal. Trop Med Health. 2013;41(3):103-11.
[13] Gautam I, KC A, Tuladhar R, Pandey BD, Tamrakar AS, Byanju R., Dhimal M, Aryal K, Kuch U. Container preference of the Asian tiger mosquito (Aedes albopictus) in Kathmandu and Lalitpur districts of Nepal. Journal of Natural History Museum. 2012;26: 181–93.
[14] Dhimal M, Gautam I, Kreß A, Müller R, Kuch U. Spatio-temporal distribution of dengue and lymphatic filariasis vectors along an altitudinal transect in central Nepal. PLoS Negl Trop Dis. 2014;8(7):e3035.
[15] Gautam I, Dhimal M, Shrestha SR, Tamrakar AS. First record of Aedes aegypti (L.) vector of dengue virus from Kathmandu, Nepal. Journal of Natural History Museum. 2009;24:156-64.
[16] Johansson MA, Dominici F, Glass GE. Local and global effects of climate on dengue transmission in Puerto Rico. PLoS Negl Trop Dis. 2009;3(2):e382. doi:10.1371/journal.pntd.0000382.

Prevalence of dengue vector in relation to dengue virus infection in central region of Nepal
106 Dengue Bulletin – Volume 38, 2014
[17] Chinery WA. A survey of mosquito breeding in Accra, Ghana during a two year period (Sept.1964-Aug.1996) of larval mosquito control iii. The breeding of Aedes aegypti, Linnaeus, in Accra. Ghana. Med. J. 1970;9:197-200.
[18] Surtees G. The distribution, density and seasonal prevalence of Aedes aegyptiin West Africa. Bulletin of the World Health Organization. 1967;36(4): 539-40.
[19] Ilkal MA, Dhanda V, Hassan MM, Mavale M, MahadevPVM, Shetty PS. Entomological investigations during outbreaks of dengue fever in certain villages in Maharashtra state. Indian J. Med. Res. 1991;93:174-8.
[20] Mehendale SM, Risbud AR, Rao JA, Banerjee K. Outbreak of dengue fever in rural areas of Parbhani district of Maharashtra (India). Indian J. Med. Res. 1991;93:6-11.
[21] Dhimal M, Gautam I, Joshi HD, O’Hara RB, Ahrens B, Kuch U. Risk factors for the presence of chikungunya and dengue vectors (Aedes aegypti and Aedes albopictus), their altitudinal distribution and climatic determinants of their abundance in central Nepal. PLoS Negl Trop Dis. 2014; under review.
[22] Dhimal M, Aryal KK, Dhimal ML, Gautam I, Singh SP, Bhusal CL, Kuch U. Knowledge, attitude and practice regarding dengue fever among the healthy population of highland and lowland communities in central Nepal. PLoS One. 2014; 9(7): e102028. http://www.ncbi.nlm.nih.gov/pmc/articles/PMC4090170/ - accessed 26 December 2014.
[23] Neupane B, Rijal KR, Banjara MR, Pandey BD. Knowledge and prevention measures against dengue in southern Nepal. J Coastal Life Medicine. 2014;2(12):998-1001.
[24] Collins DL. Manual for mosquito rearing and experimental technique. Am. Mosq Control Assoc Bull. 1970;5:190-4.
[25] Reuda IM. Pictorial keys for identification of mosquitoes (Diptera: Culicidae) associated with dengue virus transmission. Zootaxa . 2004;589:1-60.
[26] Takasaki T, Kotaki A, Nishimura K, Sato Y, Tokuda A, Lim CK, Ito M, Tajima S, Nerome R, Kurane I. Dengue virus type 2 isolated from an imported dengue patient in Japan: first isolation of dengue virus from Nepal. J Travel Med. 2008;15:46-9.
[27] World Health Organization. Dengue: guidelines for diagnosis, treatment, prevention and control. New edn. Geneva: WHO, 2009. http://www.who.int/tdr/publications/documents/ dengue-diagnosis.pdf - accessed 26 December 2014.
[28] David MR, Lourenco-de-Oliveira R, Freitas RM. Container productivity, daily survival rates and dispersal od Aedes aegypti mosquitoes in a high income dengue epidemic neighbourhood of Rio de Janeiro: presumed influence of differential urban structure on mosquito biology. MemInst Oswaldo Cruz. 2009;104(6):927-32.
[29] Cruz E, Salazar F, Porras E, Mercado R, Orais V, Bunyi J. Entomological survey of dengue vectors as basis for developing vector control measure in Barangay Poblacion, Muntinlupa City, Philippines. Dengue Bulletin. 2008;32:167-70.
[30] Barrera R, Amador M, Diaz A, Smith J, Munoz-Jordan JL, Rosario Y. Unusual productivity of Aedes aegypti in septic tanks and its implications for dengue control. Med Vet Entomol. 2008;22(1):62-9.
[31] Neupane B, Rijal KR, Aryal GB, Shah Y, BanjaraMR, SherchandJB, Morita K, Pandey BD. Clinical and laboratory features of dengue fever in the southern lowlands of Nepal. Dengue Bulletin. 2013;37:1-10.

Prevalence of dengue vector in relation to dengue virus infection in central region of Nepal
Dengue Bulletin – Volume 38, 2014 107
[32] World Health Organization, Regional Office for South-East Asia. Outbreak investigation of DF in Nepal. New Delhi: WHO-SEARO, 2006. http://www.searo.who.int/ LinkFiles/Dengue_dengue_Nepal.pdf – accessed 26 December 2014.
[33] Pun SB. Dengue: an emerging disease in Nepal. J Nepal Med Assoc. 2011;51(184):203-8.
[34] Chakravorti A, Kumaria R. Eco-epidemiological analysis of dengue infection during an outbreak of dengue fever, India. J Viro. 2005;2:1-6.
[35] Gupta E, Dar L, Kapoor G, Broor S. The changing epidemiology of dengue in Delhi, India. J Viro. 2006;3:92-5.
[36] Sarkar A, Taraphdar D, Chatterjee S. Molecular typing of dengue virus circulating in Kolkata, India in 2010. J Trop Med. 2012;10:1155.
[37] Mahilum MM, Ludwig M, Madon MB, Becker N. Evaluation of the present dengue situation and control strategies against Aedes aegypti in Cebu City, Philippines. J Vector Ecol. 2005;30:277-83.
[38] Singh RK, Das MK, Dhiman RC, Mittal PK, Sinha ATS. Preliminary investigation of dengue vectors in Ranchi, India. J Vector Borne Dis. 2008;45:170-3.

108 Dengue Bulletin – Volume 38, 2014
Short Note
The first tetravalent dengue vaccine is poised to combat dengue
Usa Thisyakorna, Maria Rosario Capedingb & Sri Rezeki Hadinegoroc
aFaculty of Medicine, Chulalongkorn University and consultant to Faculty of Tropical Medicine, Mahidol University, Department of Health, Bangkok Metropolitan Administration, HRH Princess
Maha Chakri Sirindhorn Medical Center, Faculty of Medicine, Srinakarinwirot University and Faculty of Medicine, Thammasat University
bProfessor, Research Institute for Tropical Medicine, Muntinlupa City, Philippines
cStaff member, Infection and Tropical Pediatric Division, Department of Child Health, Medical School, University of Indonesia, Chair of Pediatric Research Centre, Department of Child Health,
Medical School, University of Indonesia, and Chair of Indonesia Technical Advisory Group on Immunization (ITAGI), Indonesian Ministry of Health
Dengue, along with the mosquito vectors that transmit it, is now endemic in over 120 countries throughout the tropical and subtropical regions of the world.1-3 It is nearly ubiquitous in the tropics and has continued to emerge or become hyperendemic in new areas as the range of the Aedes mosquito vectors continue to expand. Global dengue transmission has increased at least 30-fold in the past 50 years4 so that approximately 3.6 billion people are currently at risk for dengue infection.3 The total number of infections per year has been estimated at 390 million, of which 96 million are symptomatic; 500 000 are severe requiring hospitalization, and 20 000 are fatal.1-3
The burden borne by the health and medical resources of affected countries is enormous but nowhere is the burden greater than in the South East Asia (SEA) and the Western Pacific Regions of WHO where the incidence of dengue continues to increase, causing larger and more geographically dispersed outbreaks in seasonal or cyclical epidemic patterns.1,5,6 Currently over 70% of the global population at risk for dengue lives in these Regions.7 A recent study to ascertain the true global burden of dengue found most estimated rates to be substantially higher than those currently reported to WHO (see Table 1). India and China are estimated to account for up to 40% of the global burden.1 The estimated annual economic burden for South-East Asia, excluding prevention and vector control, was nearly $1 billion or $1.65 per capita, with two countries (Indonesia and Thailand) accounting for over 60% of this burden. Dengue infections led to an annual estimated average of 372 DALYs per million inhabitants, with about 45% of the burden in Indonesia and 18% in the Philippines. The dengue burden ranks higher than 17 other conditions, including
#E-mail: [email protected]
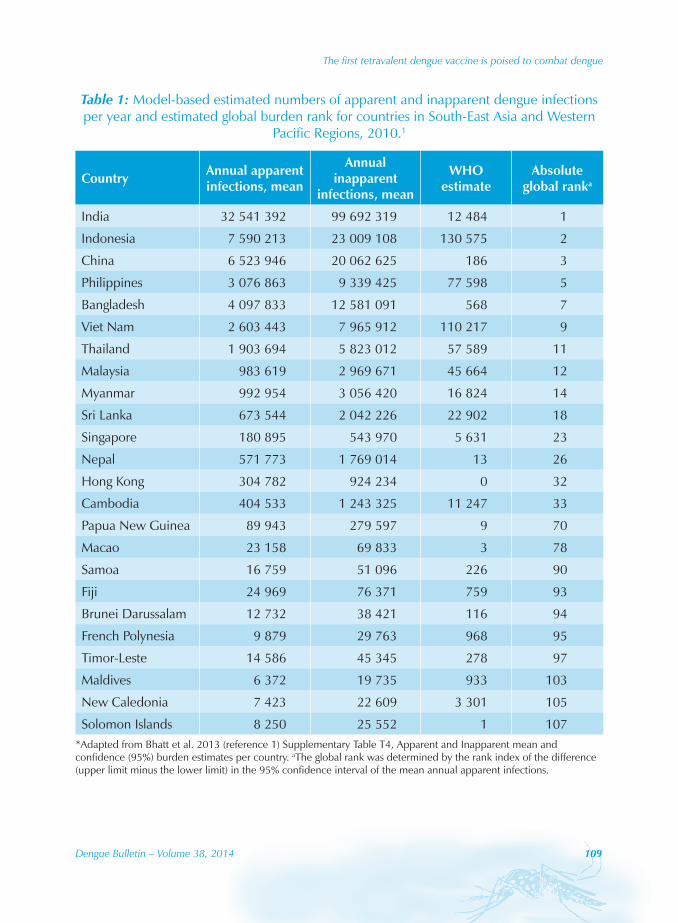
The first tetravalent dengue vaccine is poised to combat dengue
Dengue Bulletin – Volume 38, 2014 109
Table 1: Model-based estimated numbers of apparent and inapparent dengue infections per year and estimated global burden rank for countries in South-East Asia and Western
Pacific Regions, 2010.1
Country Annual apparent infections, mean
Annual inapparent
infections, mean
WHO estimate
Absolute global ranka
India 32 541 392 99 692 319 12 484 1
Indonesia 7 590 213 23 009 108 130 575 2
China 6 523 946 20 062 625 186 3
Philippines 3 076 863 9 339 425 77 598 5
Bangladesh 4 097 833 12 581 091 568 7
Viet Nam 2 603 443 7 965 912 110 217 9
Thailand 1 903 694 5 823 012 57 589 11
Malaysia 983 619 2 969 671 45 664 12
Myanmar 992 954 3 056 420 16 824 14
Sri Lanka 673 544 2 042 226 22 902 18
Singapore 180 895 543 970 5 631 23
Nepal 571 773 1 769 014 13 26
Hong Kong 304 782 924 234 0 32
Cambodia 404 533 1 243 325 11 247 33
Papua New Guinea 89 943 279 597 9 70
Macao 23 158 69 833 3 78
Samoa 16 759 51 096 226 90
Fiji 24 969 76 371 759 93
Brunei Darussalam 12 732 38 421 116 94
French Polynesia 9 879 29 763 968 95
Timor-Leste 14 586 45 345 278 97
Maldives 6 372 19 735 933 103
New Caledonia 7 423 22 609 3 301 105
Solomon Islands 8 250 25 552 1 107*Adapted from Bhatt et al. 2013 (reference 1) Supplementary Table T4, Apparent and Inapparent mean and confidence (95%) burden estimates per country. aThe global rank was determined by the rank index of the difference (upper limit minus the lower limit) in the 95% confidence interval of the mean annual apparent infections.

The first tetravalent dengue vaccine is poised to combat dengue
110 Dengue Bulletin – Volume 38, 2014
Japanese encephalitis and hepatitis B5. In the absence of a dengue vaccine, the measures for controlling dengue in these regions and elsewhere have focused primarily on diagnosis and case management, integrated surveillance, and vector management.4,7 Despite current efforts the disease has continued to spread and cause epidemics, pointing to the need to increase these efforts and to the need for a vaccine. Developing an effective vaccine against all four dengue virus serotypes has been a tremendous challenge, and not without theoretical safety concerns associated with antibody-dependent enhanced disease. Now, after years of research a tetravalent vaccine was found to be safe and efficacious in a Phase 3 study (clinicaltrials.gov NCT01373281). The CYD-TDV live attenuated dengue vaccine being developed by Sanofi Pasteur has demonstrated clinical efficacy and a good safety profile in two recent large-scale clinical trials,9,10 with the results of another phase 3 trial in Latin America due shortly (clinicaltrials.gov NCT01374516). In the pivotal phase 3 study conducted in over 10 000 subjects in five Asian-Pacific countries (Indonesia, Malaysia, the Philippines, Thailand, and Viet Nam), the tetravalent vaccine showed an overall efficacy of 56.5% [95% CI 43.8−66.4] against clinically apparent dengue caused by any serotype10. During the 25 months observation of the study, the observed efficacy was consistent across countries and appeared to vary by serotype (between 34.7% and 72.4%) and by age. Importantly, there was no evidence of disease enhancement in breakthrough episodes and a reduction of 67.2% [95% CI 50.3−78.6] in hospitalization was observed and 88.5% (95% CI 58.2−97.9) reduction against dengue haemorrhagic fever. These results emphasize the potential public health value of the vaccine in substantially reducing the burden and cost of dengue across different epidemiological settings.
WHO has taken strides to reduce dengue morbidity and mortality, and since 2012 has focused efforts toward three objectives: reducing dengue mortality by at least 50% by 2020 and dengue morbidity by at least 25% by 2020, compared with 2010 baseline rates; and estimating the true burden of disease by 2015.7 Attaining these objectives will require confronting the disease on all fronts. With early diagnosis along with timely and appropriate clinical case management, mortality rates of severe dengue have decreased and are now <1% in many countries, although they can be substantially higher during epidemics.4 Dengue morbidity and rate of hospitalizations, however, remain substantial economic burdens. Increasing surveillance efforts and improving the integration of surveillance data in health care systems can help identify outbreaks more quickly and reduce delays in outbreak management, while adequate preparation for outbreaks can facilitate containment and minimize the scale of epidemics. Integrated vector management programmes involving strategic approaches to vector control, such as community advocacy and awareness, collaboration with private and public health sectors, and evidence-based interventions can reduce mosquito populations and dengue transmission. However, to date, these programmes have failed to prevent the increase in dengue cases and other new tools or approaches are urgently needed which can be monitored and sustained for several years with community involvement.

The first tetravalent dengue vaccine is poised to combat dengue
Dengue Bulletin – Volume 38, 2014 111
A dengue vaccine could greatly alter the disease landscape, but this goal can only be realized if the many challenges to its implementation are addressed effectively.11 We have waited a long time for an effective intervention against dengue. Informed decisions must be made for each setting to determine dengue vaccination can be implemented into existing national vaccinations programmes with catch-up campaigns; optimal vaccination strategies must be defined and post-approval safety and efficacy monitored. Countries need to plan for the vaccine introduction, in particular, to identify priority target groups and how the vaccine will complement existing integrated vector management, and to strengthen dengue surveillance, which will be essential to assess the appropriate implementation of dengue vaccination / prevention strategy for each epidemiological setting.
It is good news that a safe, effective dengue vaccine is on the horizon. While this stands to be a critically important achievement in the fight against dengue, we need to understand how to implement this new tool effectively and this will require firm commitments from all affected countries if the WHO objectives are to be met.
Declaration
U. Thisyakorn, M. R. Capeding and S.R. Hadinegoro received a principle investigator research grant for the CYD14 dengue vaccine trial by Sanofi Pasteur.
Prof Thisyakorn is supported by grants from Children’s Hospital Foundation, Thailand; the Ministry of University Affairs, Thailand; the Faculty of Medicine, Chulalongkorn University; the Rockerfeller Foundation, USA; the Centers for Disease Control, USA; UNICEF; the Pediatrics AIDS Foundation; amfAR, USA; UNAIDS; WHO; the Ministry of Foreign Affairs, Thailand; UNDP.
The authors thank Kurt Liittschwager (4Clinics), supported by Sanofi Pasteur, for assistance in preparing the first draft.
References[1] Bhatt S, Gething PW, Brady OJ, Messina JP, Farlow AW, Moyes CL, Drake JM, Brownstein JS, Hoen
AG, Sankoh O, Myers MF, George DB, Jaenisch T, Wint GR, Simmons CP, Scott TW, Farrar JJ, Hay SI. The global distribution and burden of dengue. Nature. 2013 Apr 25;496(7446):504-7. doi: 10.1038/nature12060. Epub 2013 Apr 7. http://www.ncbi.nlm.nih.gov/pmc/articles/PMC3651993/ - accessed 21 December 2014.
[2] Gubler DJ. Dengue, Urbanization and globalization: the unholy trinity of the 21(st) Century. Trop Med Health. 2011;39:3-11.
[3] Murray NE, Quam MB, Wilder-Smith A. Epidemiology of dengue: past, present and future prospects. Clin Epidemiol. 2013 Aug 20;5:299-309. doi: 10.2147/CLEP.S34440. eCollection 2013. http://www.ncbi.nlm.nih.gov/pmc/articles/PMC3753061/ - accessed 21 December 2014 .
The first tetravalent dengue vaccine is poised to combat dengue
112 Dengue Bulletin – Volume 38, 2014
[4] World Health Organization. Dengue: guidelines for diagnosis, treatment, prevention and control: new edition. Geneva: WHO, 2009. http://www.who.int/rpc/guidelines/9789241547871/en/ - accessed 21 Decemer 2014.
[5] Shepard DS, Undurraga EA, Halasa YA. Economic and disease burden of dengue in Southeast Asia. PLoS Negl Trop Dis. 2013;7:e2055.
[6] Banu S, Hu W, Guo Y, Naish S, Tong S. Dynamic spatiotemporal trends of dengue transmission in the Asia-Pacific region, 1955-2004. PLoS One. 2014;9:e89440.
[7] World Health Organization. Global strategy for dengue prevention and control. Geneva: WHO, 2012.
[8] Kakkar M. Dengue fever is massively under-reported in India, hampering our response. BMJ. 2012 Dec 19;345:e8574. doi: 10.1136/bmj.e8574.
[9] Sabchareon A, Wallace D, Sirivichayakul C, Limkittikul K, Chanthavanich P, Suvannadabba S, Jiwariyavej V, Dulyachai W, Pengsaa K, Wartel TA, Moureau A, Saville M, Bouckenooghe A, Viviani S, Tornieporth NG, Lang J. Protective efficacy of the recombinant, live-attenuated, CYD tetravalent dengue vaccine in Thai schoolchildren: a randomised, controlled phase 2b trial. Lancet. 2012 Nov 3;380(9853):1559-67. doi: 10.1016/S0140-6736(12)61428-7. Epub 2012 Sep 11. http://www.ncbi.nlm.nih.gov/pubmed/22975340 - accessed 21 December 2014.
[10] Capeding MR, Tran NH, Hadinegoro SR, Ismail HI, Chotpitayasunondh T, Chua MN, Luong CQ, Rusmil K, Wirawan DN, Nallusamy R, Pitisuttithum P, Thisyakorn U, Yoon IK, van der Vliet D, Langevin E, Laot T, Hutagalung Y, Frago C, Boaz M, Wartel TA, Tornieporth NG, Saville M, Bouckenooghe A; CYD14 Study Group. Clinical efficacy and safety of a novel tetravalent dengue vaccine in healthy children in Asia: a phase 3, randomised, observer-masked, placebo-controlled trial. Lancet. 2014 Oct 11;384(9951):1358-65. doi: 10.1016/S0140-6736(14)61060-6. Epub 2014 Jul 10. http://www.ncbi.nlm.nih.gov/pubmed/25018116 - accessed 21 December 2014.
[11] Thisyakorn U, Capeding MR, Goh DY, Hadinegoro SR, Ismail Z, Tantawichien T, Yoksan S, Pang T. Preparing for dengue vaccine introduction in ASEAN countries: recommendations from the first ADVA regional workshop. Expert Rev Vaccines. 2014;13:581-7.
Dengue Bulletin – Volume 38, 2014 113
Short Note
Trends of imported dengue fever cases in Japan, 2010 to 2013
Meng Ling Moi1, Akira Kotaki1, Shigeru Tajima1, Makiko Ikeda1, Kazumi Yagasaki1, Chang-kweng Lim1, Hitomi Kinoshita2 , Eri Nakayama1, Yuka Saito1, Ichiro Kurane3,
Kazunori Oishi2, Masayuki Saijo1, Tomohiko Takasaki1,#
1Department of Virology I, National Institute of Infectious Diseases, Tokyo, Japan.
2Infectious Disease Surveillance Center, National Institute of Infectious Diseases, Tokyo, Japan.
3National Institute of Infectious Diseases, Tokyo, Japan.
Dengue fever and dengue hemorrhagic fever is a major public health threat in the tropical and subtropical regions. The disease is estimated to infect 400 million people annually and a third of the world population is at risk of developing the disease.1 The rapid increase in dengue cases has been speculated to be related to factors including increased population movement, urbanization and increased international travels. Autochthonous transmission of the disease has also been documented in non-endemic countries including France, Nepal, Bhutan and Croatia. Endemic dengue virus (DENV) transmission was last confirmed in Japan during a series of outbreaks from 1942 to 1944.2,3 Dengue was reported in Nagasaki in 1942, and soon spread north to other densely populated cities including Hiroshima and Osaka, resulting in an epidemic of 200,000 cases. Recently, the number of imported dengue cases has increased; from 92 cases in 2009 to 249 cases in 2013.4,5,6 In this report, we present the demographic features of imported dengue fever and dengue hemorrhagic fever cases in Japan from 2010 to 2013, and cases that were confirmed at the national research facility of the Ministry of Health, Labour and Welfare, the National Institute of Infectious Diseases, Japan.
The number of imported cases has increased 8-folds from 32 cases in 2003 to 249 cases in 2013 (Figure 1). Concurrently, the number of dengue hemorrhagic fever cases has increased 5-folds from 2 cases in 2003 to 11 cases in 2013. Annually, the number of Japanese overseas travelers has increased from 16.6 million in 2010 to 17.5 million in 2013. The number of dengue fever patients was lowest in 2011 during the 4-year period, at 113 cases, as compared to 244 cases in 2010, 221 cases in 2012 and 249 cases in 2013. The decrease in number of patients coincident with the decrease in the percentage of Japanese overseas travelers as compared to 2010, during (March, -9.1%) and in the months (April to June, -8.1% to -3.5%)
#E-mail: [email protected]

Trends of imported dengue fever cases in Japan, 2010 to 2013
114 Dengue Bulletin – Volume 38, 2014
following the Tohoku earthquake and tsunami in 2011, although other factors including milder disease outbreaks in endemic regions may be involved in the decrease in number of dengue patients in 2011. A high percentage of the imported cases were confirmed in the densely populated Tokyo metropolitan and Osaka prefecture; 36.3% (41/113) in 2011, 39.8% (88/221) in 2012 and 40.9% (102/249) in 2013 (Table 2). In 2013, an autochthonous DENV infection was reported in a German traveler from Japan.7 The German traveler had visited Ueda (Nagano, 19–21 August), Fuefuki (Yamanashi, 21–24 August), Hiroshima (24–25 August), Kyoto (25–28 August) and Tokyo (28–31 August) during her two-week trip to Japan, and returned by direct flight to Germany. Although she claimed to have experienced mosquito bites in Yamanashi, there were no confirmed imported dengue cases in Yamanashi for two-consecutive years, 2012 and 2013 (Table 2). Further studies would be required to determine the risk of DENV transmission in these areas, particularly in areas with high population density and imported dengue cases.
Table 1: Number of dengue fever cases confirmed at the National Institute of Infectious Diseases (NIID), Japan, 2010–2013
YearCases examined and confirmed at NIID Number of imported dengue
cases in Japan (% confirmed cases in NIID)
No. of Cases Examined
No. of Cases Confirmed
Positive Rate (%)
2010 183 124 68 244 (51)
2011 129 57 44 113 (50)
2012 231 101 44 221 (46)
2013 262 113 43 249 (45)
Total 805 395 49 827 (48)
Table 2: Number of imported dengue cases in Japan according to prefecture
Rank (Population) Prefecture Population*
(in thousand)
Total number of imported dengue casesYear
2011 2012 20131 Tokyo 13 159 25 56 662 Kanagawa 9 048 10 19 163 Osaka 8 865 16 32 364 Aichi 7 410 9 13 145 Saitama 7 194 4 5 76 Chiba 6 216 4 14 207 Hyogo 5 588 4 8 98 Hokkaido 5 506 10 5 49 Fukuoka 5 071 3 7 1210 Shizuoka 3 765 5 6 411 Ibaraki 2 969 1 3 5
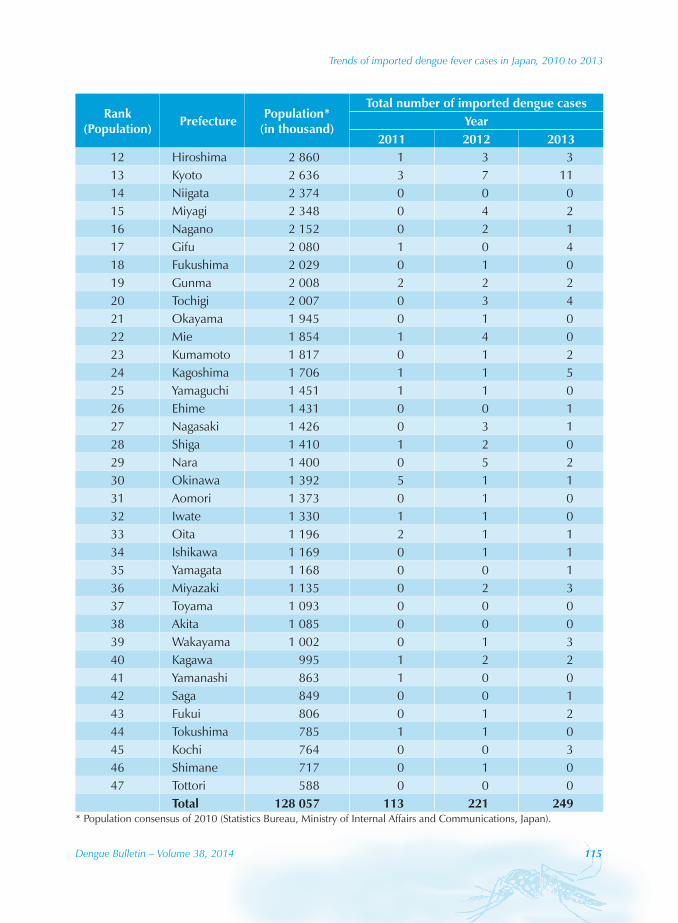
Trends of imported dengue fever cases in Japan, 2010 to 2013
Dengue Bulletin – Volume 38, 2014 115
Rank (Population) Prefecture Population*
(in thousand)
Total number of imported dengue casesYear
2011 2012 201312 Hiroshima 2 860 1 3 313 Kyoto 2 636 3 7 1114 Niigata 2 374 0 0 015 Miyagi 2 348 0 4 216 Nagano 2 152 0 2 117 Gifu 2 080 1 0 418 Fukushima 2 029 0 1 019 Gunma 2 008 2 2 220 Tochigi 2 007 0 3 421 Okayama 1 945 0 1 022 Mie 1 854 1 4 023 Kumamoto 1 817 0 1 224 Kagoshima 1 706 1 1 525 Yamaguchi 1 451 1 1 026 Ehime 1 431 0 0 127 Nagasaki 1 426 0 3 128 Shiga 1 410 1 2 029 Nara 1 400 0 5 230 Okinawa 1 392 5 1 131 Aomori 1 373 0 1 032 Iwate 1 330 1 1 033 Oita 1 196 2 1 134 Ishikawa 1 169 0 1 135 Yamagata 1 168 0 0 136 Miyazaki 1 135 0 2 337 Toyama 1 093 0 0 038 Akita 1 085 0 0 039 Wakayama 1 002 0 1 340 Kagawa 995 1 2 241 Yamanashi 863 1 0 042 Saga 849 0 0 143 Fukui 806 0 1 244 Tokushima 785 1 1 045 Kochi 764 0 0 346 Shimane 717 0 1 047 Tottori 588 0 0 0
Total 128 057 113 221 249* Population consensus of 2010 (Statistics Bureau, Ministry of Internal Affairs and Communications, Japan).

Trends of imported dengue fever cases in Japan, 2010 to 2013
116 Dengue Bulletin – Volume 38, 2014
Because of global-wide DENV epidemics and the presence of DENV vector, Aedes albopictus mosquitoes in Japan, dengue fever is a disease that requires high priority in surveillance and disease control. Dengue is a notifiable disease as required by the Infectious Disease Control Law. Between 2010 and 2013, a total of 827 cases of dengue fever were confirmed in Japan. Of the 827 cases, 395 cases (48%) were confirmed at the National Institute of Infectious Diseases between 2010 and 2013. The disease was confirmed by detection of viral genomic RNA by RT-PCR in serum samples or urine samples8, NS1 antigen9 and a 4-fold increase in antibody titers.10 Of the 395 cases, a high percentage (96.7%) of imported dengue cases had recent travel history in Asian regions, followed by Americas (1.3%), Africa (1.3%) and Oceania (0.8%). A total of 287 cases (287/382, 72.7%) had returned from Indonesia (114/328, 28.9%), 86 cases from Philippines (86/382, 21.8%), 44 cases from Thailand (44/382, 11.1%) followed by 43 cases from India (43/382, 10.9%) (Table 3). The incidence of dengue fever in Japanese travelers returning from Indonesia was 10.5; Thailand 1.2; Philippines 4.2, and India 14.8 per 100 000 travelers in 2010. Interestingly, 5 cases of dengue fever was confirmed in travelers from Benin11, Ghana, Kenya and Tanzania12, suggesting dengue outbreaks in these regions. Additionally, a traveler returning from Australia was confirmed with dengue fever in 2013. Our data concurs with those of other investigators that wider geographic regions are affected with dengue epidemics.1
Table 3: Travel destinations of travelers returning to Japan, 2010–2013
Year Total cases+
(% of total cases)2010 2011 2012 2013
Asia 382 (96.7)
Bangladesh 1 4 1 0 6 (1.5)Cambodia 4 2 5 3 14 (3.5)East Timor 1 0 4 0 5 (1.3)India 25 6 10 2 43 (10.9)Indonesia 44 13 16 41 114 (28.9)Laos 4 0 0 0 4 (1.0)Malaysia 2 2 1 2 7 (1.8)Maldives 0 2 0 1 3 (0.8)Myanmar 0 0 3 3 6 (1.5)Pakistan 1 2 0 0 3 (0.8)Philippines 15 16 34 21 86 (21.8)Saudi Arabia 0 0 0 2 2 (0.5)Singapore 0 1 1 2 4 (1.0)Sri Lanka 1 0 3 3 7 (1.8)Thailand 12 4 10 18 44 (11.1)Vietnam 4 2 2 2 10 (2.5)
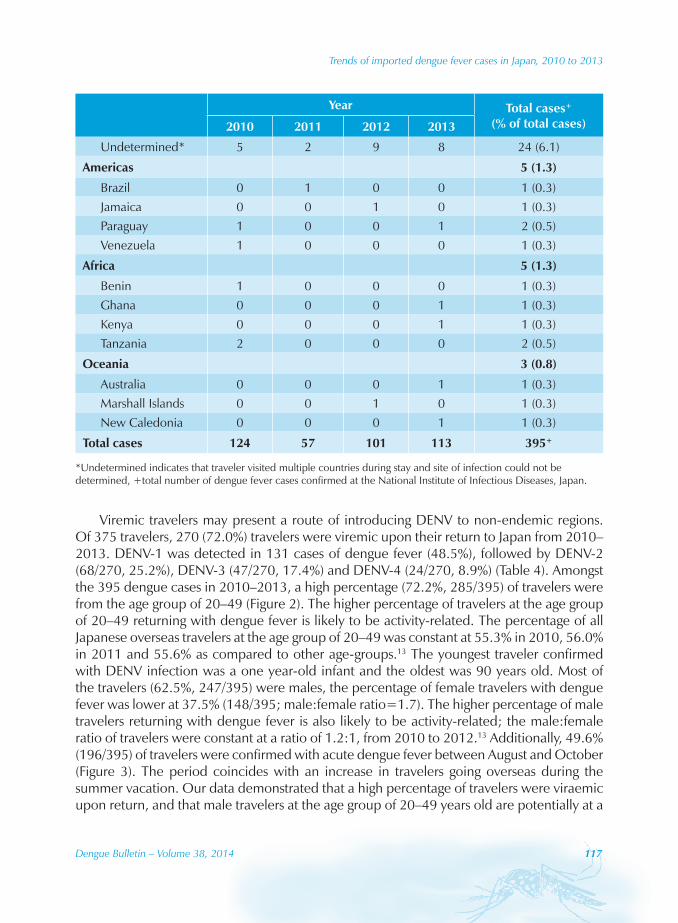
Trends of imported dengue fever cases in Japan, 2010 to 2013
Dengue Bulletin – Volume 38, 2014 117
Year Total cases+
(% of total cases)2010 2011 2012 2013
Undetermined* 5 2 9 8 24 (6.1)
Americas 5 (1.3)
Brazil 0 1 0 0 1 (0.3)Jamaica 0 0 1 0 1 (0.3)Paraguay 1 0 0 1 2 (0.5)Venezuela 1 0 0 0 1 (0.3)
Africa 5 (1.3)
Benin 1 0 0 0 1 (0.3)Ghana 0 0 0 1 1 (0.3)Kenya 0 0 0 1 1 (0.3)Tanzania 2 0 0 0 2 (0.5)
Oceania 3 (0.8)
Australia 0 0 0 1 1 (0.3)Marshall Islands 0 0 1 0 1 (0.3)New Caledonia 0 0 0 1 1 (0.3)
Total cases 124 57 101 113 395+
*Undetermined indicates that traveler visited multiple countries during stay and site of infection could not be determined, +total number of dengue fever cases confirmed at the National Institute of Infectious Diseases, Japan.
Viremic travelers may present a route of introducing DENV to non-endemic regions. Of 375 travelers, 270 (72.0%) travelers were viremic upon their return to Japan from 2010–2013. DENV-1 was detected in 131 cases of dengue fever (48.5%), followed by DENV-2 (68/270, 25.2%), DENV-3 (47/270, 17.4%) and DENV-4 (24/270, 8.9%) (Table 4). Amongst the 395 dengue cases in 2010–2013, a high percentage (72.2%, 285/395) of travelers were from the age group of 20–49 (Figure 2). The higher percentage of travelers at the age group of 20–49 returning with dengue fever is likely to be activity-related. The percentage of all Japanese overseas travelers at the age group of 20–49 was constant at 55.3% in 2010, 56.0% in 2011 and 55.6% as compared to other age-groups.13 The youngest traveler confirmed with DENV infection was a one year-old infant and the oldest was 90 years old. Most of the travelers (62.5%, 247/395) were males, the percentage of female travelers with dengue fever was lower at 37.5% (148/395; male:female ratio=1.7). The higher percentage of male travelers returning with dengue fever is also likely to be activity-related; the male:female ratio of travelers were constant at a ratio of 1.2:1, from 2010 to 2012.13 Additionally, 49.6% (196/395) of travelers were confirmed with acute dengue fever between August and October (Figure 3). The period coincides with an increase in travelers going overseas during the summer vacation. Our data demonstrated that a high percentage of travelers were viraemic upon return, and that male travelers at the age group of 20–49 years old are potentially at a

Trends of imported dengue fever cases in Japan, 2010 to 2013
118 Dengue Bulletin – Volume 38, 2014
higher risk of spread of DENV infection. A potential DENV vector mosquito, Ae. albopictus, is highly active during summer and autumn, but activity is absent during winter in Japan. Due to high activity of vector mosquito during summer and autumn, and the high proportion of travelers returning with dengue fever during this period, dengue needs higher attention with regard to disease management and control, particularly during the summer and autumn period in Japan.
Table 4: Dengue serotypes confirmed in Japan, 2010–2013*
Dengue virus serotype
Year Total (Percentage of total, %)2010 2011 2012 2013
DENV-1 35 22 27 47 131 (48.5)
DENV-2 27 8 17 16 68 (25.2)
DENV-3 13 6 14 14 47 (17.4)
DENV-4 10 2 4 8 24 (8.9)
Total 85 38 62 85 270
*All cases were confirmed at the National Institute of Infectious Diseases, Japan.
There are currently no endemic dengue cases confirmed in Japan, with the exception of a dengue fever case in a German traveler returning from Japan in 2013.7 Emergence of dengue in geographically diverse areas, presence of DENV vector mosquito, and annual reoccurrence of DENV in previously non-endemic regions including Taiwan14 and Nepal15, suggests the urgent need of higher awareness and attention with regard to identification of dengue cases, not only in travelers, but of potential local dengue outbreaks in non-endemic regions.
Acknowledgements
We would like to thank the staff of local health centers and public health institutes/laboratories all over the country for regularly reporting dengue cases and kindly answering our inquiries. This work was supported by grants from Research on Emerging and Re-emerging Infectious Diseases H23-shinkou-ippan-010), from the Ministry of Health, Labour and Welfare, Japan.
References[1] Bhatt S, Gething PW, Brady OJ, Messina JP, Farlow AW, Moyes CL, Drake JM, Brownstein JS, Hoen
AG, Sankoh O, Myers MF, George DB, Jaenisch T, Wint GR, Simmons CP, Scott TW, Farrar JJ, Hay SI. The global distribution and burden of dengue. Nature. 2013;496(7446):504-7.
[2] Hotta S. Dengue epidemics in Japan, 1942-1945. J Trop Med Hyg. 1953;56(4):83.
Trends of imported dengue fever cases in Japan, 2010 to 2013
Dengue Bulletin – Volume 38, 2014 119
[3] Konishi E, Kuno G. In memoriam: Susumu Hotta (1918-2011). Emerg Infect Dis. 2013;19(5):843-4.
[4] Japan, Ministry of Health, Labour and Welfare, Department of Virology 1, National Institute of Infectious Diseases. http://www0.nih.go.jp/vir1/ NVL/dengue.htm - accessed 18 December 2014.
[5] Takasaki T, Kotaki A, Tajima S, Omatsu T, Harada F, C-K Lim, ML Moi, Ito M, Ikeda M, Kurane I. Demographic features of imported dengue fever and dengue haemorrhagic fever in Japan from 2006 to 2009. Dengue Bulletin. 2011;35:217-22.
[6] Nakamura N, Arima Y, Shimada T, Matsui T, Tada Y, Okabe N. Incidence of dengue virus infection among Japanese travelers: 2006 to 2010. Western Pac Surveill Response J. 2012;3(2):39-45. http://www.ncbi.nlm.nih.gov/pmc/articles/ PMC3729080/ - accessed 18 December 2014.
[7] Schmidt-Chanasit J, Emmerich P, Tappe D, Günther S, Schmidt S, Wolff D, Hentschel K, Sagebiel D, Schöneberg I, Stark K, Frank C. Autochthonous dengue virus infection in Japan imported into Germany, 2013. Euro Surveill. 2014;19(3):pii=20681. http://www.eurosurveillance.org/images/dynamic/EE/ V19N03/art20681.pdf - accessed 18 December 2014.
[8] Hirayama T, Mizuno Y, Takeshita N, Kotaki A, Tajima S, Omatsu T, Sano K, Kurane I, Takasaki T. Detection of dengue virus genome in urine by real-time reverse transcriptase PCR: a laboratory diagnostic method useful after disappearance of the genome in serum. J Clin Microbiol. 2012;50(6):2047-52.
[9] Moi ML, Omatsu T, Tajima S, Lim CK, Kotaki A, Ikeda M, Harada F, Ito M, Saijo M, Kurane I, Takasaki T. Detection of dengue virus nonstructural protein 1 (NS1) by using ELISA as a useful laboratory diagnostic method for dengue virus infection of international travelers. J Travel Med. 2013;20(3):185-93.
[10] World Health Organization. Dengue. guidelines for diagnosis, treatment, prevention and control. Geneva: WHO, 2009. http://www.who.int/rpc/guidelines/ 9789241547871/en/ - accessed 18 December 2014.
[11] Ujiie M, Moi ML, Kobayashi T, Takeshita N, Kato Y, Takasaki T, Kanagawa S. Dengue virus type-3 infection in a traveler returning from Benin to Japan. J Travel Med. 2012;19(4):255-7.
[12] Moi ML, Takasaki T, Kotaki A, Tajima S, Lim CK, Sakamoto M, Iwagoe H, Kobayashi K, Kurane I. Importation of dengue virus type 3 to Japan from Tanzania and Cote d’Ivoire. Emerg Infect Dis. 2010;16(11):1770-2.
[13] Japan National Tourism Organization, http://www.jnto.go.jp/jpn/news/ data_info_listing/index.html - accessed 18 December 2014.
[14] Huang JH, Liao TL, Chang SF, Su CL, Chien LJ, Kuo YC, Yang CF, Lin CC, Shu PY. Laboratory-based dengue surveillance in Taiwan, 2005: a molecular epidemiologic study. Am J Trop Med Hyg. 2007;77(5):903-9.
[15] Pandey BD, Nabeshima T, Pandey K, Rajendra SP, Shah Y, Adhikari BR, Gupta G, Gautam I, Tun MM, Uchida R, Shrestha M, Kurane I, Morita K. First isolation of dengue virus from the 2010 epidemic in Nepal. Trop Med Health. 2013;41(3):103-11.

Instructions for contributors
120 Dengue Bulletin – Volume 38, 2014
Instructions for contributors
Dengue Bulletin welcomes all original research papers, short notes, review articles, letters to the Editor and book reviews which have a direct or indirect bearing on dengue fever/dengue haemorrhagic fever prevention and control, including case management. Papers should not contain any political statement or reference.
Manuscripts should be typewritten in English in double space on one side of white A4-size paper, with a margin of at least one inch on either side of the text and should not exceed 15 pages. The title should be as short as possible. The name of the author(s) should appear after the title, followed by the name of the institution and complete address. The e-mail address of the corresponding author should also be included and indicated accordingly.
References to published works should be listed on a separate page at the end of the paper. References to periodicals should include the following elements: name and initials of author(s); title of paper or book in its original language; complete name of the journal, publishing house or institution concerned; and volume and issue number, relevant pages and date of publication, and place of publication (city and country). References should appear in the text in the same numerical order (Arabic numbers in parentheses) as at the end of the article. For example:
(1) Kroeger A, Lenhart A, Ochoa M, Villegas E, Levy M, Alexander N, et al. Effective control of dengue vectors with curtains and water container covers treated with insecticide in Mexico and Venezuela: cluster randomised trials. BMJ 2006;332:1247–52.
(2) Dengue: guidelines for diagnosis, treatment, prevention and control. Geneva: World Health Organization; 2009.
(3) Nathan MB, Dayal-Drager R. Recent epidemiological trends, the global strategy and public health advances in dengue: report of the Scientific Working Group on Dengue. Geneva: World Health Organization; 2006 (TDR/SWG/08).
(4) DengueNet database and geographic information system. Geneva: World Health Organization; 2010. Available from: www.who.int/dengueNet [accessed 11 March 2010].
(5) Gubler DJ. Dengue and dengue haemorrhagic fever: Its history and resurgence as a global public health problem. In: Gubler DJ, Kuno G (ed.), Dengue and dengue haemorrhagic fever. CAB International, New York, NY,1997,1–22.
Figures and tables (Arabic numerals), with appropriate captions and titles, should be included on separate pages, numbered consecutively, and included at the end of the text with instructions as to where they belong. Abbreviations should be avoided or explained at the first mention. Graphs or figures should be clearly drawn and properly labelled, preferably using MS Excel, and all data clearly identified.

Instructions for contributors
Dengue Bulletin – Volume 38, 2014 121
Articles should include a self-explanatory abstract at the beginning of the paper of not more than 300 words explaining the need/gap in knowledge and stating very briefly the area and period of study. The outcome of the research should be complete, concise and focused, conveying the conclusions in totality. Appropriate keywords and a running title should also be provided.
Articles submitted for publication should be accompanied by a statement that they have not already been published, and, if accepted for publication in the Bulletin, will not be submitted for publication elsewhere without the agreement of WHO, and that the right of republication in any form is reserved by the WHO Regional Offices for South-East Asia and the Western Pacific.
One hard copy of the manuscript with original and clear figures/tables and a computer diskette/CD-ROM indicating the name of the software should be submitted to:
The Editor Dengue Bulletin WHO Regional Office for South-East Asia Indraprastha Estate Mahatma Gandhi Marg New Delhi 110002, India Telephone: +91–11–23370804 Fax: +91–11–23379507, 23370972 E-mail: [email protected]
Manuscripts received for publication are subjected to in-house review by professional experts and are peer-reviewed by experts in the respective disciplines. Papers are accepted on the understanding that they are subject to editorial revision, including, where necessary, condensation of the text and omission of tabular and illustrative material.
Original copies of articles submitted for publication will not be returned. The principal author will receive 10 reprints of the article published in the Bulletin. A pdf file can be supplied on request.