Embed Size (px)
Citation preview
ISPRS Journal of Photogrammetry and Remote Sensing xxx (2016) xxx–xxx
Contents lists available at ScienceDirect
ISPRS Journal of Photogrammetry and Remote Sensing
journal homepage: www.elsevier .com/ locate/ isprs jprs
Development and evaluation of a specialized task taxonomy for spatialplanning – A map literacy experiment with topographic maps
http://dx.doi.org/10.1016/j.isprsjprs.2016.06.0130924-2716/� 2016 International Society for Photogrammetry and Remote Sensing, Inc. (ISPRS). Published by Elsevier B.V. All rights reserved.
⇑ Corresponding author at: Centre for Geoinformation Science, GeographyBuilding, University of Pretoria, Pretoria 0028, South Africa.
E-mail addresses: [email protected] (V. Rautenbach), [email protected] (S. Coetzee), [email protected] (A. Çöltekin).
Please cite this article in press as: Rautenbach, V., et al. Development and evaluation of a specialized task taxonomy for spatial planning – A mapexperiment with topographic maps. ISPRS J. Photogram. Remote Sensing (2016), http://dx.doi.org/10.1016/j.isprsjprs.2016.06.013
Victoria Rautenbach a,⇑, Serena Coetzee a, Arzu Çöltekin b
aCentre for Geoinformation Science, Department of Geography, Geoinformatics and Meteorology, University of Pretoria, Pretoria, South AfricabGIScience Center, Department of Geography, University of Zurich, CH-8057 Zurich, Switzerland
a r t i c l e i n f o
Article history:Received 17 February 2016Received in revised form 7 May 2016Accepted 13 June 2016Available online xxxx
Keywords:Topographic mapsMap literacyMap readingTask taxonomy
a b s t r a c t
Topographic maps are among the most commonly used map types, however, their complex andinformation-rich designs depicting natural, human-made and cultural features make them difficult toread. Regardless of their complexity, spatial planners make extensive use of topographic maps in theirwork. On the other hand, various studies suggest that map literacy among the development planning pro-fessionals in South Africa is not very high. The widespread use of topographic maps combined with thelow levels of map literacy presents challenges for effective development planning. In this paper weaddress some of these challenges by developing a specialized task taxonomy based on systematicallyassessed map literacy levels; and conducting an empirical experiment with topographic maps to evaluateour task taxonomy. In such empirical studies if non-realistic tasks are used, the results of map literacytests may be skewed. Furthermore, experience and familiarity with the studied map type play a role inmap literacy. There is thus a need to develop map literacy tests aimed at planners specifically. Wedeveloped a taxonomy of realistic map reading tasks typically executed during the planning process.The taxonomy defines six levels tasks of increasing difficulty and complexity, ranging from recognisingsymbols to extracting knowledge. We hypothesized that competence in the first four levels indicatesfunctional map literacy. In this paper, we present results from an empirical experiment with 49 map lit-erate participants solving a subset of tasks from the first four levels of the taxonomy with a topographicmap. Our findings suggest that the proposed taxonomy is a good reference for evaluating topographicmap literacy. Participants solved the tasks on all four levels as expected and we therefore conclude thatthe experiment based on the first four levels of the taxonomy successfully determined the functional mapliteracy of the participants. We plan to continue the study for the remaining levels, repeat theexperiments with a group of map illiterate participants to confirm that the taxonomy can also be usedto determine map illiteracy.� 2016 International Society for Photogrammetry and Remote Sensing, Inc. (ISPRS). Published by Elsevier
B.V. All rights reserved.
1. Introduction
Topographic maps do not only depict relief, but also natural,human-made and cultural features and provide an accurate andcomprehensive graphic record of locations. Topographic maps areused extensively, for example, by soldiers for battle planning, byengineers when designing and planning roads, by geologists andsurveyors for fieldwork planning and by spatial planners whendeveloping plans for cities or regions (Innes, 1998). While popular,due to the graphically rich nature of topographic maps, they are
considered difficult to read and understand (Chang et al., 1985).The abundance of symbols and colours used in topographic mapscould be challenging, however, a comprehensive, well-designedlegend can assist. According to Chang et al. (1985), the ability toform a 3D mental image of the terrain is considered to be the mostchallenging aspect when working with topographic maps. Themap-reader needs to either interpret contour lines or deduceheights from spot heights.
Map reading is taught in school in many countries, specificallyin primary and secondary education (Board, 1981). However,map reading is a complex task (Rayner, 1996; Board, 1981). In fact,Rayner (1996) reviewed various studies and concluded that mostadults are map illiterate and unable to complete basic map usetasks. More recently, many more empirical studies highlightedthe complexity of map reading tasks; even perceptual tasks that
literacy

2 V. Rautenbach et al. / ISPRS Journal of Photogrammetry and Remote Sensing xxx (2016) xxx–xxx
require no expertise, such as size of the symbols or colour discrim-ination, can hinder map reading severely (Clarke, 2003; Kent andCheng, 2008; Brychtova and Çöltekin, 2014, 2015, 2016). Oomset al. (2016) raised the question whether the increased accessibil-ity of maps with the introduction of new technology and tools,such as Google Maps, has affected map literacy of individuals. Theyfound that secondary education pupils (between the age of 11 and18 years) were able to mostly successfully complete various mapreading tasks at different levels of difficulty. This was especiallytrue for older pupils and those currently enrolled for geography.However, the Ordnance Survey (2015) carried out a survey asking2000 individuals which traditional skills they thought were in dan-ger of dying out, and map reading was in the top spot. The reasonprovided was the increased reliance on technology, such as GPSs(Ordnance Survey, 2015; Bachmann, 2015). Bachmann (2015) sug-gests introducing activities into curricula that would alter a stu-dent’s perception that GPSs and maps are perfect representationsof the world. While it might be difficult for many people, map read-ing is necessary for many everyday tasks as well as professionaluse, e.g., topographic maps contain essential information for spa-tial planning and decision-making. Planners formulate plans foroptimal land management and development in cities and widerregions. For this they rely on topographic maps (among variousother data sources): from gathering information to communicatingplanned developments. Thus, map literacy is an essential skill forplanning professionals. Surprisingly, however, Engel (2004) andClarke (2007) found that map literacy levels among those involvedin development planning in South Africa were simply inadequate.This mismatch naturally presents challenges for effective develop-ment planning and indicates a need for reforming the universitycurricula for educating planners and others who might conductspatial analysis tasks related to planning.
Board and Taylor (1977) suggested that map reading experi-ments for adults rarely used ‘realistic’ map reading tasks, and thatthis might skew the results. It also appears that experience plays amajor role in reading topographic maps, as experienced individualsare more efficient and effective in interpreting contours and visu-alization of terrain, among other spatial tasks (Kent and Cheng,2008; Rinner and Ferber, 2005; Chang et al., 1985). A strong corre-lation has been reported between self-reported familiarity andexperience with topographic maps and participants’ performancewith them in map reading tasks (Chang et al., 1985).
Map literacy tests designed specifically for planners simply donot appear to exist. Such tests could be used to evaluate map liter-acy and to initiate remedial actions, where necessary. In this arti-cle, we propose a map reading task taxonomy that is specificallyrelevant for the spatial planning domain. The map reading tasksin the taxonomy were derived from the tasks that are generallyused in the planning process. Furthermore, we present results froma user experiment where map literate participants used a subset ofthe tasks in the proposed taxonomy, and we measured their mapreading performance. We worked with map literate participantsas a validation mechanism (i.e. we expected them to be successfulwith the tasks we prepared), and we chose a topographic map forthe experiment, as topographic maps are commonly used by plan-ners to gain a general overview of the environment, including ter-rain. The remainder of the paper is structured as follows: Section 2presents the map reading task taxonomy; in Section 3 the studydesign is described; results are presented in Section 4; and in Sec-tion 5 the results are discussed and conclusions are provided.
2. Map reading task taxonomy for planning
Various researchers have identified and proposed map readingtasks for the evaluation of map literacy. For example, in 1990,
Please cite this article in press as: Rautenbach, V., et al. Development and evaluexperiment with topographic maps. ISPRS J. Photogram. Remote Sensing (2016
Saku (1990) identified the following tasks involved in map reading:reading, analysing and interpreting geographic data. These taskswere extended by Keates (1996), as he justifiably discriminatesbetween identifying and interpreting map symbols: the symbolhas to be identified initially, only thereafter interpreted, and lastly,inferred if possible. This concept of tasks that build on each otherfrom basic to advanced was also used by Clarke (2007) to definethree map literacy skill levels for the evaluation of functionalmap literacy: read and understand a single symbol, do simple esti-mations (entry level); recognise symbol groups, analyse spatialpatterns, more complex estimations (level 1); and understandingmeaning and inferential reasoning of map phenomena (level 2).Clarke defined 18 map-use tasks and determined the mapliteracy level required for each task. Based on experimental results,Clarke argued that a person is ‘functionally map literate’ if theindividual is proficient up to level 1. However, professionalsworking in the development planning environment shouldpreferably be competent up to level 2 (Clarke, 2007; Rautenbachet al., 2014).
Developing an instrument to evaluate map literacy is not a newconcept (Koç and Demìr, 2014), however to our knowledge, there iscurrently no instrument specifically designed for planning profes-sionals. To develop our map reading task taxonomy for planners,we considered expert knowledge, peer-reviewed publications,and a number of additional resources, such as national reportsand policy documents, and synthesized them (i.e., Board, 1978,1981; Morrison, 1978; Clarke, 2003, 2007; Engel, 2004; OrdnanceSurvey, 2014, 1992; Department of Basic Education, 2011, 2012;Department of Education, 2008; Innes, 2005, 2003; Bolstad,2012; Bayram, 2007; Wiegand, 2006; Department of the Army,2001; Australian Government, 2005; Land Information NewZealand, 2009; Rayner, 1996; Saku, 1990; Keates, 1996). In the pro-posed taxonomy, we considered tasks for topographic maps, aerialphotography and 2Dmaps (i.e., standard cartographic maps or the-matic maps) as alternatives. However, in this study, we reportresults from an experiment that featured only a single topographicmap, as the main idea was to test the taxonomy itself, and notmake a map-type comparison.
The proposed taxonomy defines six levels of map reading taskswith increasing difficulty and complexity, ranging from recognis-ing symbols to extracting knowledge (see Table 1). Level 1 to Level4 (recognise symbology, orientate, locate, and measure or esti-mate) is considered to be the minimum for functional map literacy.These tasks (Level 1 to Level 4) form the basic building blocks formore advanced tasks. For example, during the first phases of plan-ning (understanding the current environment), a planner/designerneeds to extract knowledge from maps (e.g., spatial patterns orrelationships between phenomena). For this, planners need to per-form basic map reading tasks: recognise symbology on maps, ori-entate themselves on the map, locate features and estimatedistances, etc. on the map.
The proposed taxonomy attempts to update previous map read-ing tasks that focussed on mainly paper maps. For example,Morrison (1978) listed unfolding as a map reading task. The mapreading tasks identified by Board (1978) and Morrison (1978) weremainly a list of actions with little explanation that are applicable tovarious field and applications. Innes (2003) developed a system forschool learners based on the South African Department ofEducations (2011) geography syllabus. This system is based onthe concept of a hierarchy of tasks that would ultimately con-tribute to a desired outcome. Innes’ (2005, 2003) was basic as itis aimed at high school learners and very board. The abovemen-tioned literature formed the starting point of the taxonomy thatwas developed by combining various resources to condense theinformation and verify that all possible tasks are included. Mosttaxonomies or map reading tasks list only focus on functional
ation of a specialized task taxonomy for spatial planning – A map literacy), http://dx.doi.org/10.1016/j.isprsjprs.2016.06.013

Table 1Taxonomy designed specifically for spatial planning related map reading tasks (itemswe used in our user experiment are highlighted in grey).
aFunctional map literacy (Level 1 to Level 4).
V. Rautenbach et al. / ISPRS Journal of Photogrammetry and Remote Sensing xxx (2016) xxx–xxx 3
map literacy, the proposed taxonomy includes complex tasks,specifically aimed towards spatial planning.
A map reading task taxonomy, specifically relevant for the spa-tial planning domain, is not only useful for testing individuals’ mapliteracy, but could also assist in guiding the development of a cur-riculum or a course for planning students at university level. Thetaxonomy could be used as a reference to ensure that studentsare taught the necessary map reading skills.
3. Study design
3.1. Overview
To investigate whether the proposed map reading task taxon-omy can be used to evaluate functional map literacy, we designeda user experiment with topographic maps, using a subset of theproposed map reading task taxonomy from Level 1 to Level 4 (referto Table 1). For this study, we recruited participants that weexpected to be functionally map literate, and should perform wellwhen asked to complete various tasks from the proposedtaxonomy, especially with the topographic map. A subset of thetaxonomy was used (the subset is indicated in grey in Table 1).We designed a within-subject experiment; meaning that all partic-ipants solved all tasks. We presented 22 questions in a randomizedorder to minimise and distribute the learning effect (Table 2).Table 2 lists the questions presented to the participants and showshow the questions relate to the tasks specified in our proposed tasktaxonomy. Most tasks from Level 1 to Level 4 were included in theexperiment. As indicated in Table 1, tasks 1.4, 2.2 and 4.4 wereexcluded: Tasks 1.4 and 2.2 deal with perspective, which is notapplicable to topographic maps as they are typically producedfrom a single perspective. Task 4.4 was excluded, because it wouldrequire altitude or height estimations that would not be sensibleon a topographic map with contours that already provide altitudeinformation, and similarly, object heights or volumes would be dif-
Please cite this article in press as: Rautenbach, V., et al. Development and evaluexperiment with topographic maps. ISPRS J. Photogram. Remote Sensing (2016
ficult to estimate given the scale and level of abstraction of a topo-graphic map. The format of the survey further limited the tasksthat could be included. This specifically related to the type of task,for example, participants did not have access to any resources ortools (e.g., a calculator or the Internet), therefore the questions thatwould require advanced arithmetic (tasks relating to Level 5,Table 1), and tasks involving inference (refer to Level 6, Table 1)were not included. Tasks from Level 5 and Level 6 are better suitedfor an interview or peer-analytical setting to gather additionalinformation beyond the extent of a survey.
Therefore, our independent variables were the 10 tasks asshown in Table 2, which increase in complexity from one level tothe next. Participants solved the questions using a singletopographic map (see Section 3.2). We measured the followingdependent variables in the experiment: accuracy (also known aseffectiveness; was the answer correct?), completion time (alsoknown as efficiency; time taken to complete the question, or responsetime), and the participants’ confidence in their accuracy (does theparticipant think the answer is correct?). In the taxonomy, task com-plexity increases from Level 1 to Level 4, and tasks in each leveldepend on the skills required for tasks in the previous level. Thus,we can expect the participants’ accuracy in solving the tasks, theircompletion time (time taken to complete the question), and confi-dence (does the participant think the answer is correct?) willdecrease from Level 1 to Level 4.
3.2. Materials
A South African topographic map (Fig. 1) from the standardSouth African 1:50,000 raster map series produced by the ChiefDirectorate: National Geo-spatial Information (CD:NGI) was used inthe experiment. CD:NGI is mandated to collect the data and pub-lish the 1:50,000 topographical map series (1913 sheets) coveringthe entire South Africa (National Geo-Spatial Information, 2013).Using various symbols and colours, the 1:50,000 topographicmap series depict the location of natural and human-made (con-structed) features, as well as elevation in 20 m intervals(National Geo-Spatial Information, 2013; Innes, 1998). Specifically,we selected the topographic map of Barberton, a small town in theMpumalanga province, South Africa, as it shows a combination ofurban and natural environments, and thus enables us to test thetasks included in the experiment.
The visualization (i.e., the map) was constant for all participants(no changes in scale or map content or any other detail), as only asingle map was used. The 1:50,000 map was altered to a scale of1:20,000 to ensure that it was readable on the 19-inch light-emitting diode (LED) computer screen with a resolution of at least1366 � 768 which was used in the experiment. The computersused for the experiment were standard issue Windows 7 65-bitlab computers with an i5 3.1 GHz central processing unit (CPU)and 4 gigabytes (GB) of random-access memory (RAM).
3.3. Participants
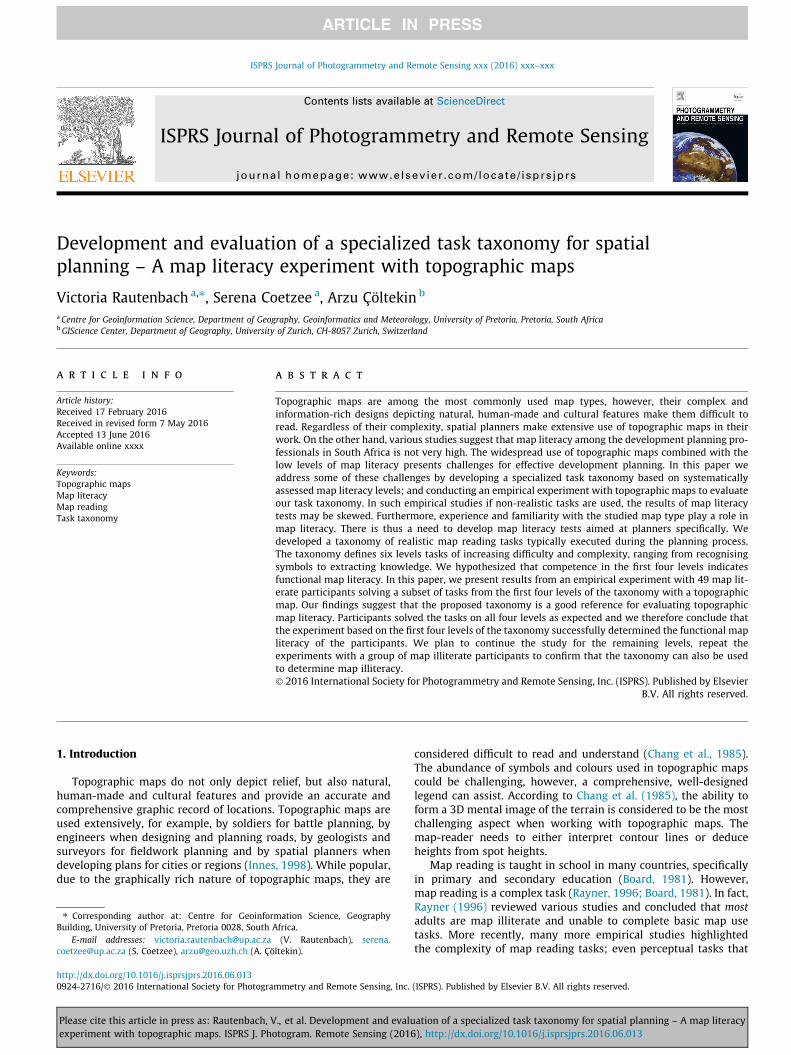
Forty-nine volunteers (24 males and 25 females) ranging from18 to 42 years old (average age of 23) participated in the experi-ment. Approximately half of the participants were undergraduatestudents in geoinformatics (51%) while others were students inrelated domains (a full breakdown of participants’ occupationand degree programs is shown in Fig. 2). Forty-five participants(92%) indicated that they took geography at either high school oruniversity level. Thus we assumed that they have a good founda-tion in map reading, specifically topographic maps, as it is taughtalready in high school geography in South Africa (Department ofBasic Education, 2011, 2012). The remaining four participantswho indicated that they do not have any formal education in
ation of a specialized task taxonomy for spatial planning – A map literacy), http://dx.doi.org/10.1016/j.isprsjprs.2016.06.013

Table 2Relationship between the experimental questions and the task taxonomy.
Qn Experiment question text Task (refer to Table 1) Level
1 Name the feature represented inside the red circle (area feature) 1.1. Name the phenomenon represented by thesymbol
Level 1: Recognisesymbology2
3 Name the features represented by A and B 1.2. Describe the difference in characteristics ofphenomenon based on the symbols or patterns4
5 Indicate the highest point shown in the map below (click on the map) 1.3. Recognise various topographic features in thearea based on symbology or patterns6 Indicate the lowest point shown in the map below (click on the map)
7 What is the relative direction from point A to point B? 2.1. Determine direction or bearing Level 2: Orientate8
9 Locate a sewage works (perennial water) – click in the vicinity of the feature 3.1. Locate a feature3.2. Determine the position at a specific point
Level 3: Locate10 Provide the alphanumeric grid position for Blockhouse (monument)11 Provide the coordinate position for the top left corner of the Barberton Nature
reserve12 Locate a school – click in the vicinity of the school13 What is the alphanumeric grid position for Abbott’s Hill?14 Provide the coordinate position for the Garden of Remembrance (monument)
15 Locate the power line that crosses through the Barberton Nature reserve (clickon the symbol)
3.3. Locate features that exhibit a specificrelationship to another feature
16 Locate a recreation ground that is located along the railway line (click on thesymbol)
17 Is point A visible from point B (assuming no buildings are in the way)? 4.1. Estimate certain topographic elements Level 4: Measure orestimate18 In which area, A or B is the slope the steepest?
19 Estimate the straight line distance between the features indicated (in meters) 4.2. Determine the distance between two points orlength of a linear feature20
21 Estimate the area of the golf course indicated in the red block below (in squaremeters)
4.3. Determine the area or extent of a region
22 Estimate the area of the Barberton Nature reserve (in square meters)
Fig. 1. Topographic map of Barberton. Source: CD:NGI 2009.
4 V. Rautenbach et al. / ISPRS Journal of Photogrammetry and Remote Sensing xxx (2016) xxx–xxx
Please cite this article in press as: Rautenbach, V., et al. Development and evaluation of a specialized task taxonomy for spatial planning – A map literacyexperiment with topographic maps. ISPRS J. Photogram. Remote Sensing (2016), http://dx.doi.org/10.1016/j.isprsjprs.2016.06.013

13
251
411
32
11
51
BSc Geography
BSc Geoinformatics
BSc Geology
BSc Meteorology
Civil Engineer
Computer engineer
GIS Analyst
GIS Intern
GIS systems administrator
Postgraduate student (Computer Science)
Postgraduate student (GISc)
Road Network Assistant Manager
Participant occupation or degree
Fig. 2. Degree or occupation of participants.
2.96
3.47
3.33
2.57
2.31
3.45
3.73
3.65
4.80
4.86
Training in cartography
Training in geography
Training in GIS
Training in planning
Training in computer graphics
Experience in using topographic maps
Experience in using various graphics
Experience in using spatial data
Experience in using browsers
Experience in English
Average of all participants self evaluated experience and training
Fig. 3. Participants’ average self-reported experience and training.
1 http://www.qualtrics.com.
V. Rautenbach et al. / ISPRS Journal of Photogrammetry and Remote Sensing xxx (2016) xxx–xxx 5
geography were undergraduate students in geoinformatics, whohad already completed a number of geography and cartographycourses at the university level. We thus deduced that all our partic-ipants were functionally map literate.
Thirty-six participants (73%) were not familiar with Barbertonand 13 participants (27%) were familiar with the town (the levelof familiarity was not specified; however, familiar and unfamiliargroups were separately analysed). It was important that theparticipants were not familiar with the Barberton area, as priorknowledge would have affected their overall performance in theexperiment.
To establish the participants’ overall experience in map readingand related tasks, they were asked to rate their training and expe-rience on a five-point Likert scale. Their self-reported training andexperience levels are shown in Fig. 3. In general, all participantsrated their experience or training in all aspects as average or aboveaverage (3 or higher). The only aspects that were rated lower thanthe average were training in cartography, training in computergraphics and training in planning. The lack of training in computergraphics and planning can be attributed to the fact that mostparticipants were geoinformatics students who do not have tocomplete computer graphics and planning courses.
Please cite this article in press as: Rautenbach, V., et al. Development and evaluexperiment with topographic maps. ISPRS J. Photogram. Remote Sensing (2016
3.4. Procedure
We conducted the experiment in the form of a questionnaireusing an online survey software product, called Qualtrics,1 in aclassroom (i.e., in a controlled environment). Groups of participants(approximately 20 participants in a lab with 40 computers) com-pleted the survey using a web browser in a lab on computers con-nected to the Internet (see Section 3.2). Therefore, the processingpower of the computers, the display sizes, keyboards as well as thebandwidth, were identical for all participants. Before the surveystarted, the instructor explained to the participants that they wouldbe asked to complete various map reading tasks, and asked partici-pants not to communicate with each other during the session. Theywere given no time limits. A technical assistant was available to pro-vide support with any technical issues during the session (fortu-nately, there were no technical issues during the experiment).After the instructions, the participants responded to the questions,and when they completed the tasks, we thanked them and finishedthe session. The participation was voluntary, and we offered no com-pensation to the participants.
ation of a specialized task taxonomy for spatial planning – A map literacy), http://dx.doi.org/10.1016/j.isprsjprs.2016.06.013

6 V. Rautenbach et al. / ISPRS Journal of Photogrammetry and Remote Sensing xxx (2016) xxx–xxx
4. Results
In this section, we first present the results on whether and howthe individual tasks (our independent variable) affected the partic-ipants’ accuracy scores, their completion time and confidence (ourthree dependent variables). Then we present how task types con-nected to map literacy levels affected performance. The latter isbased on our main hypothesis that participants’ overall perfor-mance (accuracy and completion time) and confidence will varyas the levels are advanced, because all the participants are func-tionally map literate.
As mentioned earlier, the experiment consisted of 22 questions,and at least two of these questions were linked to a task type (thusassociated literacy levels) as indicated in Table 1. A single outlierwas removed; the participant only completed two of 22 questions.Based on the participants’ accuracy (was the answer correct?), anaccuracy score out of 100 was calculated for each participant.Accuracy scores were normally distributed, i.e., the skewness ofthe data is �0.771 (all skewness values between �1 and 1 areregarded as normal), and the kurtosis is 0.563. The skewnessresults for the four accuracy scores in relation to the map literacylevels (referring to task taxonomy levels in Table 1) were slightlydifferent: Level 1 (0.113), Level 2 (�1.891), Level 3 (�1.195) andLevel 4 (�0.162). Level 2 and Level 3 indicate a negative skewness,meaning that participants did above average in these two levels.
First, we analysed the effect of familiarity (i.e. prior knowledge)with the area on the map reading tasks. We found that priorknowledge of the area had no effect on the accuracy score[F(1,46) = 0.010, p = .922], confidence [F(1,46) = 0.055, p = .816]and task completion time [F(1,44) = 3.694, p = .061]. In otherwords, the participants who self-reported ‘familiar’ with the towndid not overall perform better, suggesting perhaps the level offamiliarity was not very high. Thus we kept their data along withthe others in all analyses.
4.1. Participant performance and confidence per question (individualtasks)
Fig. 4 provides an overview of the relationship between theparticipants’ average accuracy scores (in percentage), and their
6
11
14
19 20
21
22
20
40
60
80
100
120
140
160
180
Aver
age
ques
tion
com
plet
ion
tim
e (s
ec)
Average a
Quest
Fig. 4. The average accuracy score in percentage com
Please cite this article in press as: Rautenbach, V., et al. Development and evaluexperiment with topographic maps. ISPRS J. Photogram. Remote Sensing (2016
average question completion time (in seconds) to complete eachindividual question. A strong negative correlation (Pearson correla-tion = �0.732, p = .000 2-sided) between the average accuracy scoreand the average question completion time was observed. Thisshows that the participants made more mistakes with the harderquestions and they took longer to complete the task – in otherwords, we did not observe a speed-accuracy trade-off.
Besides the accuracy and question completion time, we anal-ysed how the confidence levels changed over all tasks. As can beseen in Fig. 5 participants indicated relatively high levels of confi-dence for all questions (between 59% and 93%).
Considering that the questions were designed to vary from sim-ple to complex as we go from 1 to 22, in Fig. 5, we see that on aver-age, the levels of confidence is matching with the levels ofdifficulty. With questions 21 and 22 (determine the area or extentof a region), participants marked their confidence level the lowest.In these two questions, and question 11 and 14 (specifying a loca-tion using coordinates), participants’ accuracy scores were also thelowest. Despite the matching trend, the average confidence of theparticipants was skewed negatively (�1.295), supporting theobservation that participants were over-confident on average (theyover-estimated their performance). A two-tailed Spearman’s rhotest was used to analyse the correlation between the average accu-racy score and confidence of participants. We observed a signifi-cant correlation between the accuracy score and confidence(Spearman’s rho = 0.225, p = .028 2-sided), suggesting that partici-pants were aware of their relative task performance (i.e., they weresomewhat able to judge when they did not do too well, despite ageneral trend of over-confidence).
4.2. Participant performance and confidence per task type in relationto map literacy levels
At this point, to verify the patterns at the task level, we aggre-gated the individual questions into task types as presented inTable 2, and studied the relationship between the accuracy scoresand task completion time (response time) again, at an aggregatelevel. Fig. 6 shows that a similar pattern (as in Fig. 4) emerges aswe compare the average accuracy score and task completion times(as specified in Table 2, a task may be represented by two or more
1
2
3
4
5
78
9
10
12
13
15
16
1718
ccuracy score (%)
ions
pared to the average question completion time.
ation of a specialized task taxonomy for spatial planning – A map literacy), http://dx.doi.org/10.1016/j.isprsjprs.2016.06.013

1 2
3
4
5
6
7 8910
11
1213
14
1516
17
18
19 20
21
22
55
60
65
70
75
80
85
90
95
100
Aver
age
con�
iden
ce (%
)
Average accuracy score (%)
Questions
Fig. 5. The average accuracy score in percentage compared to the participant’s confidence for each question.
Task 1.1
Task 1.2
Task 1.3
Task 2.1
Task 3.1
Task 3.2
Task 4.1
Task 4.2
Task 4.3
10
20
30
40
50
60
70
80
90
100
Aver
age
task
com
plet
ion
tim
e (s
ec)
Average accuracy score (%)
Fig. 6. The average accuracy score in percentage compared to the average task completion time for each task (as specified in Table 2).
V. Rautenbach et al. / ISPRS Journal of Photogrammetry and Remote Sensing xxx (2016) xxx–xxx 7
questions) and verifies our observations at the question level. Fur-thermore, we did not observe a statistical correlation between theaccuracy scores and task completion time per task type, suggestingthat there was no speed-accuracy trade-off at the task type leveleither.
Fig. 7. The average accuracy scores for each of the map literacy levels for allparticipants. Error bars: ±SEM. **p < 0.01.
4.3. Participant performance and confidence per map literacy level
We expected that all participants would attain high accuracyscores, as they are trained in map reading through theireducational attainments and self-reported experience levels (seeFigs. 2 and 3), i.e., our participants are a map literate sample. How-ever, as mentioned earlier, we also expected the accuracy scores todecrease as the tasks associated with higher levels of literacy werepresented, because the higher levels contain presumably hardertasks (as specified in Table 1).
Accuracy scores in relation to the map literacy levels can beseen in Fig. 7. The participants achieved a lower accuracy scorein Level 1 (75.69%) compared to Level 2 (86.98%), which was an
Please cite this article in press as: Rautenbach, V., et al. Development and evaluation of a specialized task taxonomy for spatial planning – A map literacyexperiment with topographic maps. ISPRS J. Photogram. Remote Sensing (2016), http://dx.doi.org/10.1016/j.isprsjprs.2016.06.013

8 V. Rautenbach et al. / ISPRS Journal of Photogrammetry and Remote Sensing xxx (2016) xxx–xxx
unexpected result. We believe this is mostly explained by the lowsuccess rates with Task 1.3, specifically in question 6 (Indicate thelowest point shown in the map) participants performed belowexpectations (see Fig. 7): only 20.4% of the participants were ableto find the lowest elevation point on the map. This result can pos-sibly be attributed to the fact that individuals might find it difficultto read and understand contour lines, as suggested by Chang et al.(1985).
61.25
41.59
67.63
50.9754.75
0
10
20
30
40
50
60
70
80
Task
com
plet
ion
tim
e (s
econ
ds)
Levels of map literacy
Fig. 8. The average completion time for each of the map literacy levels for allparticipants. Error bars: ±SEM.
Fig. 9. The average confidence for each of the map literacy levels for allparticipants. Error bars: ±SEM. *p < 0.05.
76.1
90.6
7075.5
85
20
40
60
80
100
Aver
age
accu
racy
(%)
Levels of
Fig. 10. The average accuracy scores in percentage of the experienced and
Please cite this article in press as: Rautenbach, V., et al. Development and evaluexperiment with topographic maps. ISPRS J. Photogram. Remote Sensing (2016
A one-way ANOVA revealed that the accuracy score increasedbetween Level 1 and Level 2, t(47) = �2.9, p = .006 (refer toFig. 7). The accuracy score then decreased from Level 2 to Level 3as expected, t(47) = 3.208, p = .002, and also between Level 3 andLevel 4, t(47) = 11.17, p = .00.
To complete the performance analysis, after studying the accu-racy (as shown in Fig. 7), we analysed the average task completiontime per map literacy level, seen in Fig. 8.
In Fig. 8, we observe that generally participants took a smallamount of time (between �40 s and �70 s) to complete the tasks.The correlation between the completion time per level and accu-racy scores remains also at this aggregation level, especially whenlooking at Level 2. A one-way ANOVA was performed to analysethe effect of the different map literacy levels on the averagecompletion time per map literacy level, [Level 1, F(6,39) = 1.77,p = .129, Level 2, F(3,42) = 0.297, p = .827, Level 3, F(8,37) = 1.643,p = .146 and Level 4, F(7,38) = 1.194, p = .33]. The results revealedthat the different levels had no statistical effect on the averagetime taken to complete tasks for each map literacy level.
Furthermore, to understand if the participants’ confidencewould reflect the task complexity, we analysed the confidencelevels in relation to tasks per map literacy level (Fig. 9).
Fig. 9 shows the average confidence of participants for eachlevel. Again we can see that participants were very confident intheir answers, with a slight decrease at Level 4, which consistedthe most challenging questions and the participants possiblydetected this. The participants’ average confidence increasedbetween Level 1 and Level 2, t(47) = �2.37, p = .022, and thenslightly decreased between Level 2 and Level 3, t(47) = 2.21,p = .032 and also decreased to Level 4, t(47) = 2.414, p = .020.
4.4. Exploratory group differences in performance and confidencebased on experience and gender
To better understand if the results vary based on participantcharacteristics, we studied the effect of experience and gender.Note that the study was not fully counterbalanced (i.e., we didnot control for the number of experts among men or women,etc.). However, we present an exploratory analysis here, as previ-ous literature suggests that performance differences might berelated to experience and expertise (Çöltekin et al., 2009, 2010)levels, and confidence sometimes depends on gender (Biland andÇöltekin, 2016). Experienced participants were defined asparticipants who rated themselves as ‘excellent’ in all categoriesof the self-reported familiarity and experience questionnaire. Thisresulted in 16 experienced (8 males and 8 females) and 32 inexpe-rienced participants (16 males and 16 females).
.5
46.0
70.868.5
42.5
67.9
map literacy
inexperienced participants for each literacy level. Error bars: ±SEM.
ation of a specialized task taxonomy for spatial planning – A map literacy), http://dx.doi.org/10.1016/j.isprsjprs.2016.06.013

73.5
88.5
71.5
45.0
69.678
85.5
74
42.5
70.0
0
20
40
60
80
100
Level 1 Level 2 Level 3 Level 4 Overall
Aver
age
accu
racy
(%)
Levels of map literacy
Fig. 11. The average accuracy score in percentage of males and females for each task. Error bars: ±SEM.
V. Rautenbach et al. / ISPRS Journal of Photogrammetry and Remote Sensing xxx (2016) xxx–xxx 9
There was a slight difference between the experienced andinexperienced participants in terms of accuracy scores for each lit-eracy level (see Fig. 10). However, a one-way ANOVA revealed thatthis difference was not statistically significant, F(1,46) = 0.413,p = .524. Additionally, no statistically significant correlation wasfound between the participants’ experience and their performancefor each task.
Experienced participants took more time to complete the ques-tions in comparison to the inexperienced participants. A one-wayANOVA revealed that this difference was statistically significant,F(1,44) = 6.540, p = .014. The experienced participants generallyalso rated their confidence higher than inexperienced participants,this difference was found to be statistically significant, F(1,46)= 6.677, p = .013.
In terms of gender differences, women achieved a slightlyhigher accuracy than men (Fig. 11), however a one-way ANOVArevealed that this difference was not statistically significantF(1,46) = 2.424, p = .126. Similarly as the experts, women also tookmore time than men to complete the task. However, this was foundto not be statistically significant, F(1,44) = 0.428, p = .516. Wefound that gender had no effect on confidence [F(1,46) = 0.091,p = .764] and task completion time [F(1,46) = 0.424, p = .126].
5. Discussion and conclusion
In this paper, we first presented a map reading task taxonomythat we specifically designed for spatial planning based on the lit-erature, reports, policies, and information we obtained throughqualitative consulting with expert spatial planners. Our overarch-ing goal was to identify geographic visualization (map) types thatare helpful and functional for specific spatial planning tasks (ortask types) when the levels of map literacy vary, and explainwhy these visualizations are fit for the given context and the audi-ence. The specific goal of this paper was to investigate whether ourproposed taxonomy indeed ‘works as expected’ in terms of ourclassification of map literacy levels. To achieve this, we designeda user experiment for a subset of the proposed map reading taxon-omy (Levels 1–4), and tested it with a group of 49 functionally mapliterate participants using a topographic map. We found that theproposed tasks yield results broadly as expected, thus provide agood reference for evaluating topographic map literacy levels.
The results showed that participants’ accuracy scores wereoverall very high in all questions relating to the first two levels(Level 1 and Level 2). It seems that the symbols on a topographicmap are generally easy to identify when provided with a compre-hensive legend: i.e., the average accuracy on questions 1 to 4 (Level1) was above 70%. The complexity of tasks in the proposed taxon-omy increases from Level 1 to Level 4, and we therefore expected
Please cite this article in press as: Rautenbach, V., et al. Development and evaluexperiment with topographic maps. ISPRS J. Photogram. Remote Sensing (2016
the accuracy scores to decrease from Level 1 to Level 4. This wastrue for Level 2 to Level 4, but the participants surprisingly per-formed better in Level 2 compared to Level 1 (discussed below).The average accuracy scores of participants dropped from above70% to below 50% from Level 3 to Level 4.
Four of the map reading tasks were particularly challenging forour participants: (1) Recognise various topographic features in thearea based on symbology or patterns (Task 1.3); (2) Determine theposition at a specific point (Task 3.2); (3) Determine the distancebetween two points or length of a linear feature (4.2); and (4)Determine the area or extent of a region (Task 4.3). The averageconfidence of the participants for these tasks was also lower thanfor the other tasks.
The unexpected increase in the average accuracy score fromLevel 1 to Level 2 appears to be mainly due to the poor perfor-mance in question 6 (Task 1.3). Only 20.4% of participants correctlyindicated the lowest point on the topographic map (question 6,Task 1.3). We believe this is explained mainly by the poor interpre-tation of the contour lines. Chang et al. (1985) suggested that thedevelopment of a 3D mental image of the terrain from contourlines is challenging for most individuals. The result for Task 1.3supports this. The evaluation of the responses for the lowest pointfocused on recognising the correct pattern in the contour lines anda response within an acceptable distance from the lowest pointwas also considered to be correct. Additionally, spot heights onthe map were also printed quite small and the participants mighthave struggled to read the labels. To overcome this challenge, 3Dgeovisualizations could be considered as an alternative, shownside-by-side, or allow interactive change of perspective to obliqueor street level viewing where possible. In some environments orterrains, 3D geovisualizations may simplify tasks relating to topog-raphy, such as identifying the lowest or highest point (Rautenbachet al., 2015; Schobesberger and Patterson, 2008; Popelka andBrychtova, 2013). The opposite question (question 5, Task 1.3) forindicating the highest point was easier, as there was a distinctivepeak with a label on the map and 71.4% of the participants cor-rectly identified ‘‘Saddleback peak” as the highest point on themap. The remaining 28.6% participants indicated one of the otherpeaks in the area as the highest (there were six peaks indicatedon the entire the map). Note that, for the highest point, only ‘‘Sad-dleback peak” was accepted as the correct answer, as the six peakswere displayed with elevation values on the map.
Participants’ accuracy with determining the position at a speci-fic point (Task 3.2) was significantly lower in the questionsrequesting numeric coordinates (questions 11 and 14), than inthe question requesting an alphanumeric grid reference (question10). Participants understandably struggled to accurately estimatethe decimals for the minute in the coordinates.
ation of a specialized task taxonomy for spatial planning – A map literacy), http://dx.doi.org/10.1016/j.isprsjprs.2016.06.013

10 V. Rautenbach et al. / ISPRS Journal of Photogrammetry and Remote Sensing xxx (2016) xxx–xxx
The drastic decline in the average accuracy score from Level 3 toLevel 4 can possibly be explained by the lack of tools, such as a cal-culator, during the experiment. The participants needed to use thescale bar and then calculate distance or area using multiplication.Most of the errors in Level 4 tasks were of an arithmetical natureand related to area calculations. Accuracy in length and distanceestimations was higher, most likely because multiplying or divid-ing by 1600 for length and distance estimates is simpler than mul-tiplying, e.g. 230 with 60, to calculate area. The type of errorsobserved for Level 4 tasks confirms that participants struggledwith complex multiplications but understood the principle of scale,line-of-sight, and slope steepness. That is, participants were overallcompetent on Level 4. Therefore, despite the low average accuracyscores on the four tasks in this level, it can be said that all partic-ipants were competent on all four levels, i.e., the participants inour experiment are functionally map literate. We therefore weconclude that the experiment successfully determined the func-tional map literacy of participants as expected.
We observed a strong negative correlation between the averageaccuracy scores and task completion time. Furthermore, there is acorrelation between performance and confidence: participantsachieved higher accuracy scores and took less time to completethe questions with which they reported higher levels of confidencein their performance. We also observed that experienced partici-pants (consisting of 50% females) and females (51% of all partici-pants) tended to take more time than their counterparts did, andslightly outperformed them. The assumption was that all partici-pants were map literate, and confirming this, we found no statisti-cally significant correlation between the self-rated experience ofparticipants and their performance. Even though there was no sta-tistically significance between self-rated experience and perfor-mance, it does correlate to other research from Furnham et al.(1999), Furnham (2001) and Lloyd and Bunch (2005, 2008). Thefact that the overall performance was high was expected, becausethe experiment included only basic tasks on Level 1 to Level 4, andwe recruited map literate participants who had previous exposureto similar topographic map reading tasks, either at school or atuniversity.
Results of the experiment reported in this paper suggest that ourmap reading task taxonomy is suitable for evaluating topographicmap literacy of a group of map literate individuals. The proposedmap reading task taxonomy was developed based on literatureauthored by scientists from many different countries. We thusargue that the taxonomy we proposed in this paper could be usedas a generalizable reference task taxonomy for evaluatingtopographic map literacy also in other countries. However, thetaxonomy has not yet been tested with participants from othercountries using their local topographic maps. In this analysis, a par-ticipant with an average accuracy of 70% or above was consideredas map literate because with a 70% score most tasks were com-pleted successfully. This being said, map literacy should be consid-ered to be a continuum, rather than discrete or Boolean values. Thisnotion is supported by Lee and Bednarz (2012), who stated thatindividuals might perform well on certain tasks and fail on others.
We plan to repeat the experiment with participants who haveno experience in cartography and geography. If we can demon-strate that the performance by map-illiterate individuals are con-sistently lower than the map literate ones in this study, we willbe able to strengthen the evidence that we created a systematictask taxonomy for evaluating map literacy. Furthermore, becausethe task taxonomy is customized for spatial planning, we will con-duct experiments with spatial planners and support the evaluationprocess also with interviews where the tasks cannot be tested withclose-ended ‘‘survey-type” questions. Last but not least, we plan tofurther refine the map reading task taxonomy and also consideradditional spatial visualizations, such as 3D models.
Please cite this article in press as: Rautenbach, V., et al. Development and evaluexperiment with topographic maps. ISPRS J. Photogram. Remote Sensing (2016
References
Australian Government, 2005. Map Reading Guide: How to use Topographic Maps.Geoscience Australia, Canberra, Australia.
Bachmann, M., 2015. Exploring and addressing functional map illiteracy incommunity college students. Pap. Appl. Geogr. 1 (3), 258–261.
Bayram, S., 2007. Naïve and expert geography students’ perceptions on digital mapliteracy. SIMILE: Stud. Media Inf. Lit. Educ. 5 (4), 1–11.
Biland, J., Çöltekin, A., 2016. An empirical assessment of the impact of the lightdirection on the relief inversion effect in shaded relief maps: NNW is betterthan NW. Cartogr. Geogr. Inf. Sci., 1–15 (in press).
Board, C., 1981. Cartographic communication. Maps in Modern Cartography. In:Guelke, L. (Ed.), . Cartographica Monograph, pp. 42–78.
Board, C., 1978. Map reading tasks appropriate in experimental studies incartographic communication. Cartograph.: Int. J. Geogr. Inf. Geovisual. 15 (1),1–12.
Board, C., Taylor, R.M., 1977. Perception and maps: human factors in map designand interpretation. Trans. Inst. Br. Geogr. 2 (1), 19–36.
Bolstad, P., 2012. GIS Fundamentals: A First Text on Geographic InformationSystems, fourth ed. Eider Press, St. White Bear, MN.
Brychtova, A., Çöltekin, A., 2014. An empirical user study for measuring theinfluence of colour distance and font size in map reading using eye tracking.Cartogr. J. 51 (4).
Brychtova, A., Çöltekin, A., 2015. Discriminating classes of sequential andqualitative colour schemes. Int. J. Cartogr. 1 (1), 62–78.
Brychtová, A., Çöltekin, A., 2016. The effect of spatial distance on thediscriminability of colors in maps. Cartogr. Geogr. Inf. Sci., 1–17
Chang, K.-T., Antes, J., Lenzen, T., 1985. The effect of experience on readingtopographic relief information: analyses of performance and eye movements.Cartogr. J. 22 (December), 88–94.
Clarke, D., 2003. Are you functionally map literate. In: 21th InternationalCartographic Conference. International Cartographic Association, Durban,South Africa, pp. 10–16.
Clarke, D., 2007. Impact of map literacy on development planning in South AfricaPhD Thesis. University of Stellenbosch, South Africa.
Çöltekin, A., Heil, B., Garlandini, S., Fabrikant, S.I., 2009. Evaluating the Effectivenessof Interactive Map Interface Designs: A Case Study Integrating Usability Metricswith Eye-Movement Analysis. Cartogr. Geogr. Inf. Sci 36 (1), 5–17.
Çöltekin, A., Fabrikant, S.I., Lacayo, M., 2010. Exploring the efficiency of users’ visualanalytics strategies based on sequence analysis of eye movement recordings.Int. J. Geo. Inf. Sci. 24 (10), 1559–1575.
Engel, B., 2004. Developing map use skills for planners and implementers of landreform in South Africa. GeoJournal 60, 183–189.
Furnham, A., 2001. Self-estimates of intelligence: culture and gender difference inself and other estimates of both general (g) and multiple intelligences.Personality Individ. Differ. 31 (8), 1381–1405.
Furnham, A., Fong, G., Martin, N., 1999. Sex and cross-cultural differences in theestimated multi-faceted intelligence quotient score for self, parents andsiblings. Personality Individ. Differ. 26 (6), 1025–1034.
Innes, L., 2005. Identifying spatial competence outcomes for South AfricanSecondary Schools. In: Proceedings of the 22nd ICA International CartographicConference. International Cartographic Association, Coruña, Spain, pp. 10–16.
Innes, L., 2003. Maths for map users. In: 21th International CartographicConference. International Cartographic Association, Durban, South Africa, pp.727–738.
Innes, L.M., 1998. Learning to read the South African 1:50,000 topographic map: thedevelopment of a self-instruction method Master’s dissertation. University ofWitwatersrand.
Keates, J.S., 1996. Understanding Maps. Longman, London, United Kingdom.Kent, R.S.G., Cheng, P.C.-H., 2008. Expertise in a map reading task: the role of
schemas in the processing of topographical relief information. In: Proceedingsof the Thirtieth Annual Conference of the Cognitive Science Society, pp. 2298–2303.
Koç, H., Demìr, S., 2014. Developing valid and reliable map literacy scale. Rev. Int.Geograph. Educ. Online 4 (2). Available online at: <http://www.rigeo.org/vol4no2/Number2Summer/RIGEO-V4-N2-3.pdf> (accessed 21 April 2016).
Land Information New Zealand, 2009. Map Reading Guide: How to Use aTopographic Map. Land Information New Zealand, Canberra, Australia.
Lee, J., Bednarz, R., 2012. Components of spatial thinking: evidence from a spatialthinking ability test. J. Geogr. 111 (1), 15–26. http://dx.doi.org/10.1080/00221341.2011.583262.
Lloyd, R.E., Bunch, R.L., 2008. Explaining map-reading performance efficiency:gender, memory, and geographic information. Cartogr. Geogr. Inf. Sci. 35 (3),171–202.
Lloyd, R.E., Bunch, R.L., 2005. Individual differences in map reading spatial abilitiesusing perceptual and memory processes. Cartogr. Geogr. Inf. Sci. 32 (1), 33–46.
Morrison, J.L., 1978. Towards a functional definition of the science of cartographywith emphasis on map reading. Cartogr. Geogr. Inf. Sci. 5 (2), 97–110.
National Geo-Spatial Information, 2013. 1:50,000 Topographical Maps Availablefrom: <http://www.ngi.gov.za/index.php/what-we-do/maps-and-geospatial-information/35-map-products/51-1-50-000-topographical-maps> (accessedFebruary 14, 2016).
Ooms, K., De Maeyer, P., Dupont, L., Van Der Veken, N., Van de Weghe, N.,Verplaetse, S., 2016. Education in cartography: what is the status of youngpeople’s map-reading skills? Cartogr. Geogr. Inf. Sci. 43 (2), 134–153.
ation of a specialized task taxonomy for spatial planning – A map literacy), http://dx.doi.org/10.1016/j.isprsjprs.2016.06.013

V. Rautenbach et al. / ISPRS Journal of Photogrammetry and Remote Sensing xxx (2016) xxx–xxx 11
Ordnance Survey, 2015. Is map reading a forgotten skill? Available online at:<https://wwwordnancesurvey.co.uk/blog/2015/08/is-map-reading-a-forgotten-skill/> (accessed 21 April 2016).
Ordnance Survey, 1992. Map of reading. Anal. Proc. 29 (8), 383.Ordnance Survey, 2014. Map reading made easy peasy. Southampton, UK Available
online at: <https://www.ordnancesurvey.co.uk/docs/leaflets/map-reading-made-easy-peasy.pdf> (accessed 21 April 2016).
Popelka, S., Brychtova, A., 2013. Eye-tracking study on different perception of 2Dand 3D terrain visualisation. Cartogr. J. 50 (3), 240–246.
Rautenbach, V., Bevis, Y., Coetzee, S., Combrinck, C., 2015. Evaluating proceduralmodelling for 3D models of informal settlements in urban design activities. S.Afr. J. Sci. 111 (11/12), 1–10.
Rautenbach, V., Coetzee, S., Çöltekin, A., 2014. Towards evaluating the map literacyof planners in 2D maps and 3D models in South Africa. In: AfricaGEO 2014Conference Proceedings, pp. 1–12.
Rayner, H., 1996. Improving map literacy: the application of Second Languageinstruction views and techniques Master’s dissertation. Wilfrid LaurierUniversity.
Rinner, C., Ferber, S., 2005. The effects of map reading expertise and map type oneye movements in map comparison tasks. In: Spatial Information Theory:International Conference, COSIT 2005, September 14–18, Ellicottville, NY, USA.
Please cite this article in press as: Rautenbach, V., et al. Development and evaluexperiment with topographic maps. ISPRS J. Photogram. Remote Sensing (2016
Saku, J.C., 1990. The impact of teaching cartographic lexicon and of geographicexperience on map use Master’s dissertation. Wilfrid Laurier University.
Schobesberger, D., Patterson, T., 2008. Evaluating the effectiveness of 2D vs. 3dtrailhead maps: a map user study conducted at Zion National Park, UnitedStates. In: 6th ICS Mountain Cartography Workshop, Switzerland, pp. 201–205.
South African Department of Basic Education, 2011. Curriculum and AssessmentPolicy Statement Grades 10–12 Geography. Department of Basic Education,Cape Town, South Africa.
South African Department of Basic Education, 2012. Mind the Gap: GeographyStudy guide Grade 12. Department of Basic Education, Pretoria, South Africa.
South African Department of Education, 2008. National Curriculum StatementGrades 10–12 (General) Learning Programme Guidelines. Department ofEducation.
United States of America Department of the Army, 2001. Map Reading and LandNavigation: Field Manual,, Department of the Army, Washington, D.C..
Wiegand, P., 2006. Learning and Teaching with Maps. Routledge, New York, USA.
ation of a specialized task taxonomy for spatial planning – A map literacy), http://dx.doi.org/10.1016/j.isprsjprs.2016.06.013