Embed Size (px)
Citation preview

Page 1/16
Study on the puri�cation effect of a pediatricisolation bed on the air in general hospital wardsTiantian Liu
Guangdong Pharmaceutical UniversityMei Wang
Guangdong Pharmaceutical UniversityXiaotang Hao
Guangdong Pharmaceutical UniversityYubing Guo
Guangzhou Medical UniversityRong Zhou ( [email protected] )
Guangzhou Medical University
Research article
Keywords: Pediatric isolation bed, puri�cation effect, nosocomial infection, particulate, aerosol, bacteria
Posted Date: December 23rd, 2019
DOI: https://doi.org/10.21203/rs.2.19522/v1
License: This work is licensed under a Creative Commons Attribution 4.0 International License. Read Full License

Page 2/16
AbstractBackground: Patients with acute infectious respiratory illness may emit bio-aerosols containingpathogens capable of infecting susceptible hosts, including other patients and healthcare workers. Thisstudy aimed to evaluate the puri�cation effect of a pediatric isolation bed on aerosols andmicroorganisms in the air in experiment rooms and verify the puri�cation e�ciency in general wards.
Methods: Experiments were carried out in two settings: one with isolation bed and the other with regularbed. Using a dust particle counter to discriminate particles sizes in the air and using Anderson’s six levelsto discriminate S. albicans, the puri�cation rate in the two rooms was evaluated. The concentration ofcigarette particles(size 0.3–0.5 μm,0.5-1.0μm ) and S. albicans in the air was signi�cantly decreased inthe experimental room, indicating that the air was puri�ed. Then detection the aerosol in the room tovilidaty the puri�cation rate.Finally detection of aerosol and sedimentation bacteria in the air of generalwards.
Results: Isolation beds in demonstration ward have a purifying effect on both aerosols andsedimentation bacteria.
Conclusions:Isolation bed can therefore be used in hospitals to reduce the risk of nosocomial infectionand protect the health of doctors, patients, and visiting relatives.
1. BackgroundNosocomial infections occur at high incidence each year and pose a considerable health threat.Infectious diseases that cause community infections can also spread via aerosols in hospitals. Examplesof such infectious diseases include the severe acute respiratory syndrome (SARS) outbreaks in 2003, theEbola virus disease outbreaks in West Africa in 2014–2015, and the Middle East respiratory syndrome(MERS) outbreaks in the Middle East and South Korea in 2014–2015 [1–3]. Nosocomial infections canlead to cross-infection between patients, families, and healthcare workers, and may even spread to thecommunity via infected patients, resulting in increased community medical costs, longer hospital stays,and increased in-patient mortality [4, 5].
Studies have reported that respiratory bacteria can spread through the air as respiratory droplets ordroplet nuclei (aerosols) [6, 7]. During the SARS epidemic, SARS virus spread through the air, causing apublic health crisis [8–10]. Xiao investigated the transmission routes of MERS during the �rst nosocomialoutbreak in the Republic of Korea in May 2015 using a multi-agent modelling framework, and suggestedthat MERS probably spread via the long-range airborne route [11]. In addition to those mentioned above,other respiratory and enteric viruses such as measles virus, varicella-zoster virus, in�uenza viruses,adenovirus, rhino/enterovirus, metapneumovirus, and respiratory syncytial virus, can also causeepidemics in hospitals through airborne transmission, which often leads to serious consequences [12–16]. It is therefore necessary to establish a wide range of systems and individual interventions to try toreduce aerosol transmission in medical settings.

Page 3/16
Hospitals attempt to prevent and control nosocomial infections by a range of methods, includingengineering solutions, strict hand hygiene, and wearing face masks [5, 17–19]. Infection control isparticularly important in intensive care units (ICUs), where the focus is on environmental and aircleanliness to prevent colonization turning to pathogenesis and to enhance pathogen clearance. However,current methods are costly and have limited capacity in the event of an outbreak [6, 20]. Alternativestrategies are therefore needed to protect critically ill patients from infestation with new pathogens or theexacerbation of existing infections. In this study, we propose a new strategy for the control of nosocomialinfections in hospitals that involves a new type of pediatric isolation bed (isolation bed). The isolationbed is connected to a puri�cation device that surrounds the child’s head to prevent the spread ofcontaminants into the room. After the returned air has been puri�ed, the air is blown into the room tocontrol the local environment around the patient and reduce the risk of infection. Compared with directlycontrolling the air quality in the entire room, the isolation bed reduces energy consumption and hasenormous potential for application. The purpose of this research was to study the puri�cation effect ofthe isolation bed on airborne particulate matter and Staphylococcus albicans. The �ltration andpuri�cation effects on particles of 0.3–0.5 μm, 0.5–1.0 μm and S. albicans, were evaluated in aexperiment room. And we also veri�ty the puri�cation effects in Guangzhou chest hospital. The isolationbed could play an active role in the control of nosocomial infections, reducing the risk of respiratoryinfections among patients and healthcare workers.
2. Methods2.1. Material and equipment
Sustained release Staphylococcus albicans was purchased from the Microbiology Institute ofGuangdong (Guangdong, China). Cigarettes (brand: Hongtashan, Yunnan, China) were purchased from alocal retailer. A Y09-301 laser dust particle counter and an Anderson six-level sampler were bothpurchased from Sujin (Jiangsu, China).
2.2. Pediatric Isolation bed
Pediatric Isolation bed (Angelbiosafety, Guangzhou, China) are supplied in three gears: high-gear (thewind speed of the negative pressure port: 0.8 m/s), middle-gear (0.5–0.6 m/s), and low-gear (0.3–0.4m/s), and can be operated closed (0 m/s) as a control. The centrifugal fan works to generate negativepressure and any infectious microorganisms such as bacteria and viruses in the air exhaled by thepatient are captured by the sterilization �lter unit, and the resulting clean air passes through the air outletfrom the bedside cabinet.
2.3. Test the puri�cation effect of the isolate bed in the experiment room.
Two experiment rooms, containing no patients, were set up in the laboratory as the experimental groupand the control group. Each room had the following dimensions: 3.63 × 4.26 × 2.8 m (length, width, andheight; Fig 1). A pediatric isolation bed (left in Fig 1) was placed in the experimental group room, and a
Page 4/16
standard hospital bed was placed in the control room. According to the �ve-point layout method[21], �vesampling points (A,B,C,D,E)were selected that were arranged according to the positions shown in Fig 1A.The horizontal distances from the wall were greater than 1 m, and the vertical distance from the groundwas about 140 cm. All tests were performed at 25°C–26°C, and the doors, windows, and air conditionerswere all closed/off during the test.
2.4. Veri�cation the puri�cation effect of the isolation bed in hospital.
Two general wards were set up in the pediatric ward of Guangzhou Chest Hospital as the model andcontrol wards. The Guangzhou Chest Hospital ward had the following dimensions: 5.7 × 3.3 × 2.8 m(length, width and height; Fig 2). Three pediatric isolation beds (shown in Fig 1B) were placed in themodel ward, and three standard hospital beds were placed in the control ward. According to the �ve-pointlayout method[21], �ve sampling points(A,B,C,D,E) were selected, the positions of which are shown in Fig2A. The horizontal distances from the wall were greater than 1 m, and the vertical distance from theground was about 140 cm. The size, area, layout, and orientation of the control ward and the model wardwere identical.
All tests were performed at 25°C–26°C, and the doors, windows, and air conditioners were all closed/offduring the test.
2.5. Particle puri�cation effect
(1) A cigarette was lit at point C in Fig 1A and left to burn for 15 min. After su�cient inhalable particleshad been produced, the cigarette was extinguished. The electric fan was then turned on, adjusted to lowwind speed, and left for 2 min to evenly distribute the inhalable particles throughout the room. The fanwas then stopped and after a 3-min rest, samples were taken from the �ve sampling points indicated inFig 1A. The Y09-301 laser dust particle counter was used at 2.83 L/min according to the "Test Method forSuspended Particles in the Cleanroom (Zone) of the Pharmaceutical Industry" GB/T16292-1996standard. The �ow rate was measured for the number of particles according to the six size ranges in theair in the room, pumping for 20 s at a time, and each point was continuously sampled three times and theaverage value was taken. Data were recorded every 10 min for 1 h. The total number of particles with adiameter of 0.3- 0.5 μm and 0.5–1.0 μm equated to the number of dust particles of this size. The above-mentioned experiment was carried out in a closed state (as the control), and at high-gear, mid-gear, andlow-gear, and data were recorded for each gear position. Using these data, curves of particle size (0.3–0.5μm and 0.5–1.0 μm) against time were plotted. The particle (0.3–0.5 μm and 0.5–1.0 μm) puri�cationrate for each sampling point for each gear position was calculated separately.
(2)The doors and windows of the room were opened for 24 h to allow for air �ow into the room and theconcentration of particulate matter in the ward stabilized. Then, the doors and windows were closed andthe isolation bed run with low gear, at the same time,using the dust particle counter to sample the air at�ve sampling points with a �ow rate of 2.83 L/min and a sampling time of 20 s. The averageconcentration of particulate matter at each point was based on three consecutive sampling times, and

Page 5/16
one round of sampling was undertaken every 10 min for 2 h of continuous sampling to observe changesin the distribution and concentration of particulate matter of different particle sizes in the room.
2.6. Puri�cation effect following the sustained release of Staphylococcus albicans
(1) Experimental preparation: S. albicans was inoculated into an enriched culture medium and wascultured in an incubator at 37℃ for 24 h to enrich the bacteria. PBS was used for the preparation anddilution of bacteria, and S. albicans bacterial suspensions of known concentration were prepared using aspectrophotometer.
(2) Experimental group: the prepared bacterial suspension was added to the microbial aerosol generatorand placed in the center of the ward to be opened for 15 min. The fan was turned on for 3 min, dispersingindoor microbial aerosols. The fan was then turned off and after a 2-min rest to allow for stabilization ofthe microbial concentration across the room, samples were taken from �ve sampling points set in thediagonal corners and the center of the room (>0.5 m from the wall, and ~1.4 m from the �oor). TheAnderson six-level sampler was used to collect and determine the initial concentration of microorganismsin the room at a �ow rate of 28.3 L/min for 1 min. Samples were taken from room with the isolation gives3 different gear (high-gear, medium-gear, and low-gear) after opening for 30 and 60 min. The sampleplate was placed in an incubator at 37°C for 24 h to count the colonies and calculate the concentration ofmicroorganisms in the air.
(3) Control group experiment: The method is similar to the Experimental group, but with an ordinaryhospital bed.
(4) Data calculation
The microbial/particulate puri�cation rate of the open isolation bed was calculated according to theequation:
[Due to technical limitations, the formula could not be displayed here. Please see the supplementary �lessection to access the formula.]
where, K is the puri�cation rate, C0 is the initial air microbial/particulate concentration, and Ct is the airmicrobial/particulate concentration after opening the isolation bed for min.
2.7. Verify the puri�cation e�ciency in general wards.
(1) Experimental preparation: Prepare two wards which gives the same size, layout and orientation, onefor demonstration ward and the other for control ward. Five sampling points were set up at the diagonalpoints in the ward and the center of the ward, which were more than 0.5 m from the wall horizontally, andabout 1.4 m from the �oor vertically. The indoor temperature and humidity were monitored andmaintained at a constant level.

Page 6/16
(2) Demonstration ward: There are 3 isolation bed in the demonstration ward. The isolation bed runsuninterrupted with a low gear. A child with a respiratory illness lives on each isolation bed, and each childhas an adult caregiver. So there are 3 child patients and 3 adult caregivers in the demonstration ward.The doors and windows of the ward were closed for 2 h before test to allow the stability of the sampling.Samples were taken from �ve sampling points set in the diagonal corners and the center of the room(>0.5 m from the wall, and ~1.4 m from the �oor) (�g 1B).The dust particle counter were used to samplethe air at �ve sampling points with a �ow rate of 2.83 L/min and a sampling time of 20 s. The averageconcentration of particulate matter at each point was based on three consecutive sampling times.
The Anderson six-level sampler was used to collect and determine the initial concentration of settlementbacteria in the room at a �ow rate of 28.3 L/min for 40 min. Repeat three times for each sample. Sampleswere taken from ward with the isolation gives low-gear. The sample plate was placed in an incubator at37°C for 24 h to count the colonies and calculate the concentration of settlement bacteria in the air.
(3) Control experiment: The method is similar to the Experimental group, but with an ordinary hospitalbed.
(4) Data calculation
This followed the same procedure as section 2.6.
2.8. Statistical analysis
Statistical analysis of the result was performed using Prism 7 software (GraphPad). Statistics analysesfor other experiments were performed using t-test. P values (P) less than 0.05 were consideredstatistically signi�cant.
3. Results3.1. Puri�cation effect on Cigarette particles
The results of the experiments to determine the puri�cation effect of the pediatric isolation bed oncigarette particles are shown in Fig 2 and Table 1. The time-dependent curves for both particle sizes, 0.3–0.5 μm and 0.5–1.0 μm, are shown in �g 2. The results are the average of the data from sampling pointsA–E. Compared with the curve for the control group, the results from the experimental group indicatedthat the isolation bed had the effect of reducing the number of dust particles in the air. After 15 min, thepuri�cation effect was evident. Puri�cation effect enhances over time.
The puri�cation rate of the isolation bed for particulate matter of 0.3–0.5 μm at each sampling point over1 h was calculated for the experimental and control groups, as shown in Table 1.From the table,it showsthat the puri�cation rate of the control group gives the low result,almost from 36-38%.But when theisolation bed run, the rate increace very fastly, the low gears gives about 91-92%. The middle gears and

Page 7/16
the high gears gives above 95%. however, no signi�cant differences were detected between the samplingpoints in the high- and mid-range.
3.2. Puri�cation effect on Staphylococcus albicans
The concentration changes in S. albicans within 60 min were compared between the experimental andcontrol groups and revealed that the isolation bed had a puri�cation effect on S. albicans in the air (Fig3). The data represent the average of sampling points A–E. After 30 min, the pediatric isolation bed hadreduced the concentration of S. albicans in the air, and after 60 min, the puri�cation effect in thedemonstration room was above 99%.
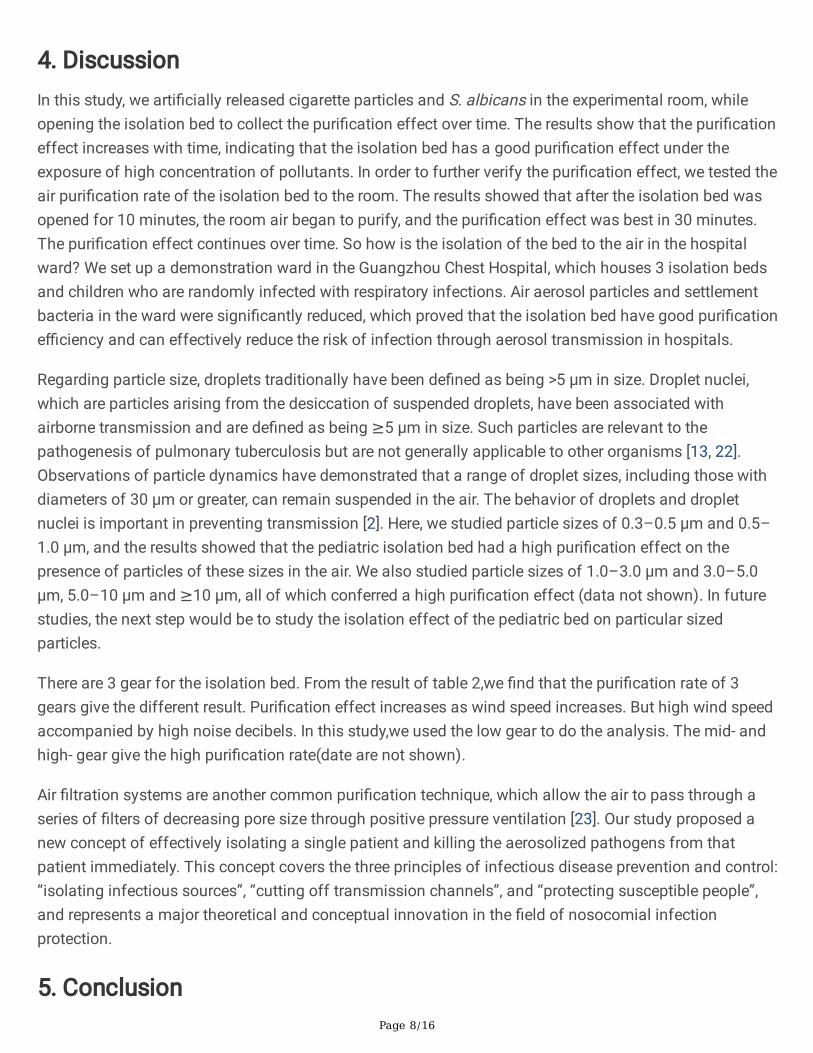
3.3. Puri�cation effect of the isolation bed on particulate matter in the Experiment room.
The results of the experiments to determine the puri�cation effect of the pediatric isolation bed in theroom are presented in Fig 4 and Table 2.
The time-dependent curves for both particle sizes, 0.3–0.5 μm and 0.5–1.0 μm, the low gear data areshown in �g 4. After 10 min,the number of the particulate matter are decrease. After 30 minutes, thenumber of dust particles reached a minimum, after which the number of dust particles in the indoor airremained at this number until 2 hours.
As shown in Table 2.From the table,it shows that the puri�cation rate of the control group gives the lowresult,almost from 9-10%.But when the isolation bed run, the rate increace very fastly, the low gears givesabout 72-79%,the middle gears gives about 86-89%,and the high gears gives above 90-92%. For the threegear and control group, signi�cant differences were detected between the sampling points. For the mid-and low- gear, signi�cant differences were detected. For the high- and low- gear, signi�cant differenceswere detected. For the high- and mid- gear, no signi�cant difference was detected.
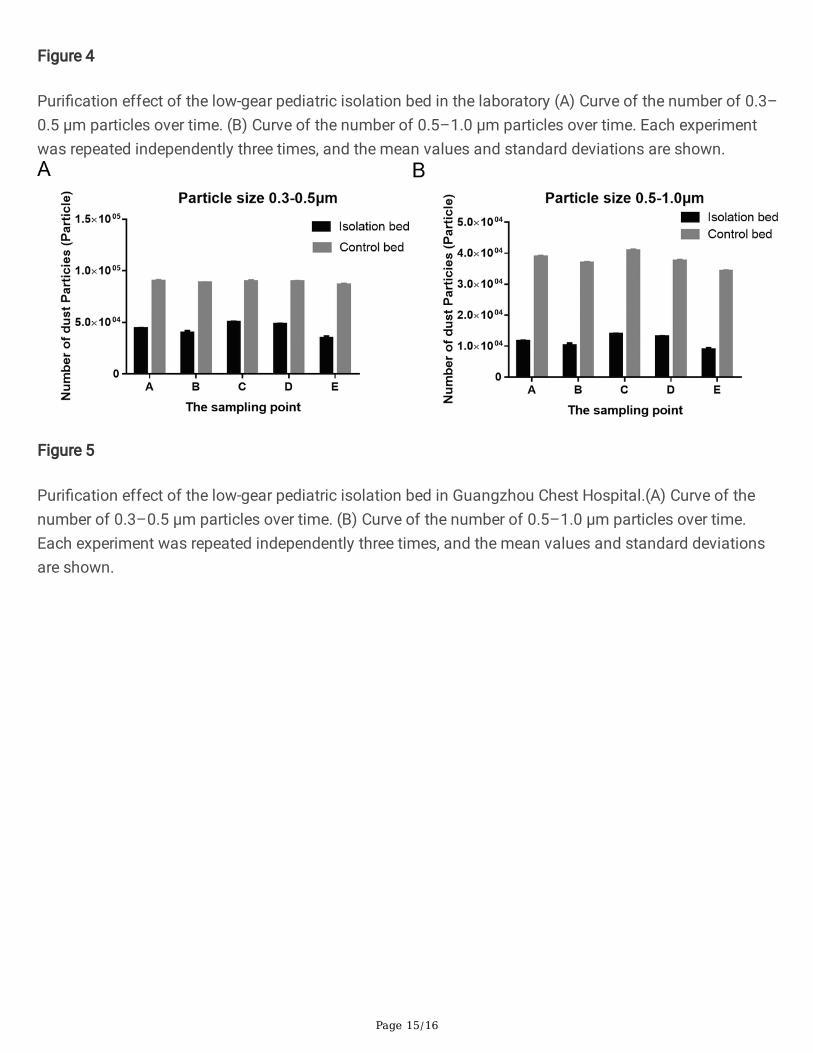
3.4. Puri�cation effect of the isolation bed on the particulate matter and the settlement bacteria in the airof a ward in Guangzhou Chest Hospital
The result of the experiments to determine the puri�cation effects of the pediatric isolation bed inGuangzhou Chest Hospital are shown in Fig 5. We analyzed the particulate matter in both thedemonstration ward and the control ward. Each ward had three beds and three patients, along with threemembers of the patients’ families, in total six people. Compared with the curve for the control group, thedata for the low-gear pediatric isolation bed showed a reduction in the number of dust particles andbacteria in the air. For the low gear and control group, signi�cant differences were detected between thesampling points.No signi�cant difference was detected in each point.
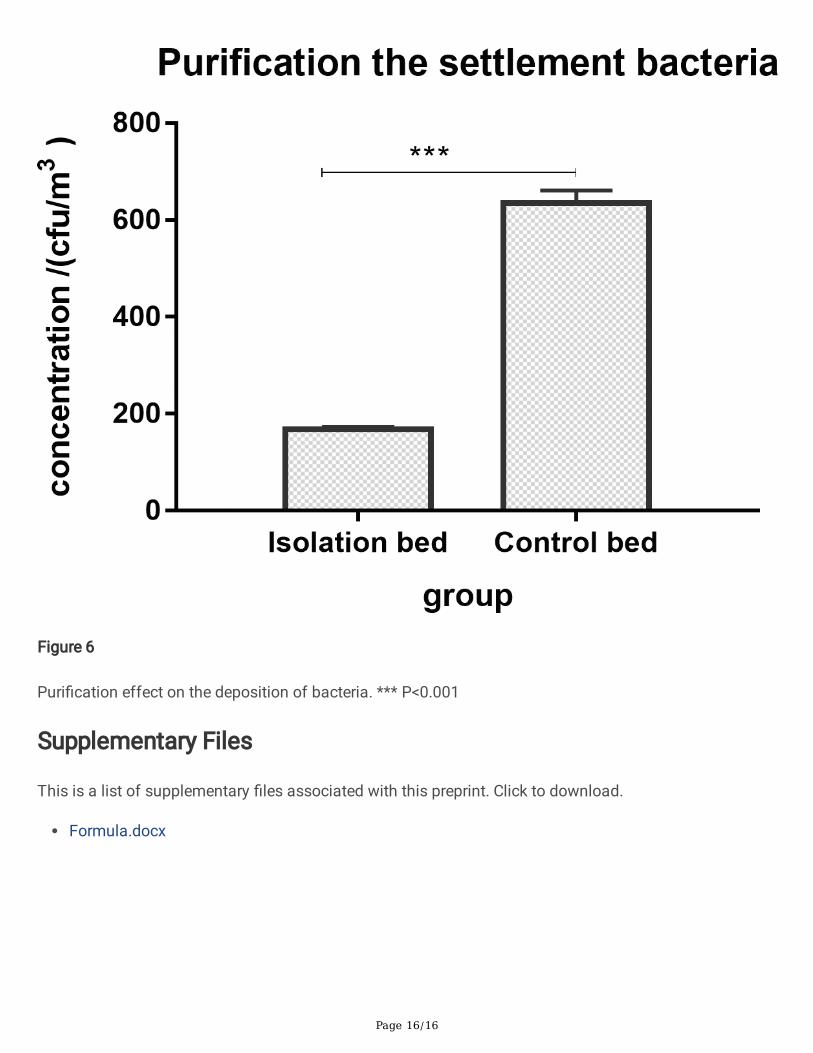
The result of the puri�cation effect on the settlement bacteria are shown in �g 6. We analyzed thecincentration of settlement bacteria in both the demonstration ward and the control ward. For the lowgear and control group, signi�cant differences were detected between the sampling points.
Page 8/16
4. DiscussionIn this study, we arti�cially released cigarette particles and S. albicans in the experimental room, whileopening the isolation bed to collect the puri�cation effect over time. The results show that the puri�cationeffect increases with time, indicating that the isolation bed has a good puri�cation effect under theexposure of high concentration of pollutants. In order to further verify the puri�cation effect, we tested theair puri�cation rate of the isolation bed to the room. The results showed that after the isolation bed wasopened for 10 minutes, the room air began to purify, and the puri�cation effect was best in 30 minutes.The puri�cation effect continues over time. So how is the isolation of the bed to the air in the hospitalward? We set up a demonstration ward in the Guangzhou Chest Hospital, which houses 3 isolation bedsand children who are randomly infected with respiratory infections. Air aerosol particles and settlementbacteria in the ward were signi�cantly reduced, which proved that the isolation bed have good puri�catione�ciency and can effectively reduce the risk of infection through aerosol transmission in hospitals.
Regarding particle size, droplets traditionally have been de�ned as being >5 µm in size. Droplet nuclei,which are particles arising from the desiccation of suspended droplets, have been associated withairborne transmission and are de�ned as being ≥5 µm in size. Such particles are relevant to thepathogenesis of pulmonary tuberculosis but are not generally applicable to other organisms [13, 22].Observations of particle dynamics have demonstrated that a range of droplet sizes, including those withdiameters of 30 µm or greater, can remain suspended in the air. The behavior of droplets and dropletnuclei is important in preventing transmission [2]. Here, we studied particle sizes of 0.3–0.5 μm and 0.5–1.0 μm, and the results showed that the pediatric isolation bed had a high puri�cation effect on thepresence of particles of these sizes in the air. We also studied particle sizes of 1.0–3.0 μm and 3.0–5.0μm, 5.0–10 μm and ≥10 μm, all of which conferred a high puri�cation effect (data not shown). In futurestudies, the next step would be to study the isolation effect of the pediatric bed on particular sizedparticles.
There are 3 gear for the isolation bed. From the result of table 2,we �nd that the puri�cation rate of 3gears give the different result. Puri�cation effect increases as wind speed increases. But high wind speedaccompanied by high noise decibels. In this study,we used the low gear to do the analysis. The mid- andhigh- gear give the high puri�cation rate(date are not shown).
Air �ltration systems are another common puri�cation technique, which allow the air to pass through aseries of �lters of decreasing pore size through positive pressure ventilation [23]. Our study proposed anew concept of effectively isolating a single patient and killing the aerosolized pathogens from thatpatient immediately. This concept covers the three principles of infectious disease prevention and control:“isolating infectious sources”, “cutting off transmission channels”, and “protecting susceptible people”,and represents a major theoretical and conceptual innovation in the �eld of nosocomial infectionprotection.
5. Conclusion

Page 9/16
Isolation beds in demonstration ward have a purifying effect on both aerosols and sedimentationbacteria. Isolation bed can therefore be used in hospitals to reduce the risk of nosocomial infection andprotect the health of doctors, patients, and visiting relatives.This new aerosol isolation and eliminationproduct effectively isolates the patient on site, thereby reducing the possibility of pathogen spread duringthe transportation process. The advantages of this system are low-cost single equipment and mobiledeployment. In addition, new indicators, such as evolutionary e�ciency, are being applied to the productdesign and evaluation procedures to ensure the complete isolation of pathogens from patients’ exhaledair, thereby avoiding the circulation of polluted air and expansion of the infected area. In future studies,the next step will be to study the isolation effects with respect to distance and the transmission risk, andthe effectiveness of this new technology in preventing infections in hospitals.
AbbreviationsSARS: severe acute respiratory syndrome; MERS: the Middle East respiratory syndrome; ICUs: intensivecare units; Isolation bed: pediatric isolation bed. S. albicans: Staphylococcus albicans.
DeclarationsCon�icts of interest:
The authors declare that they have no con�icts of interest.
Declarations:
Ethics approval and consent to participate:
Ethics approval was not required as testing the air of the hospital. As our study did not involveinterventions or additional clinical samples to be collected, no consent to participate was required.
Consent for publication:
The data used to support the �ndings of this study are available from the corresponding author uponrequest.
Availability of data and material:
Not applicable. Our manuscript does not contain any individual person’s data in any form, including anyindividual details, images or videos.
Competing interests:
The authors declare that they have no competing interests.
Funding:

Page 10/16
This study was supported by grants from National Key Research and Development Program of China(2018YFC1200100), Guangdong Medical Science and Technology Research Center Projec (A2019460),Entrepreneurship Leadership Project in Guangzhou Development Zone of China (CY2018-003),Guangzhou science and technology project (201704020225).
Authors' contributions:
Tiantian Liu:Write the paper and do the experiment. Xiaotang Hao, Mei Wang and Yubing Guo: do theexperiment. Rong Zhou:design the experiment.
Acknowledgements:
We thank Prof. Zhengshi Lin for providing advice about our manuscript and editing the English text of adraft of this manuscript. We thaks thanks for Guangzhou chest hospital to provide the hospital ward.
Reference1.Ho PL, Tang XP, Seto WH: SARS: hospital infection control and admission strategies. Respirology 2003,8 Suppl:S41–45.
2.Ansumana R, Keitell S, Roberts GM, Ntoumi F, Petersen E, Ippolito G, Zumla A: Impact of infectiousdisease epidemics on tuberculosis diagnostic, management, and prevention services: experiences andlessons from the 2014–2015 Ebola virus disease outbreak in West Africa. Int J Infect Dis 2017, 56:101–104.
3.Ki M: 2015 MERS outbreak in Korea: hospital-to-hospital transmission. Epidemiol Health 2015,37:e2015033.
4.Giraldi G, Montesano M, Sandor� F, Iachini M, Orsi GB: Excess length of hospital stay due to healthcareacquired infections: methodologies evaluation. Ann Ig 2019, 31(5):507–516.
5.Suleyman G, Alangaden GJ: Nosocomial Fungal Infections: Epidemiology, Infection Control, andPrevention. Infectious disease clinics of North America 2016, 30(4):1023–1052.
6.Su LX, Wang XT, Pan P, Chai WZ, Liu DW, China Critical I, Infection Control A: Infection managementstrategy based on prevention and control of nosocomial infections in intensive care units. Chinesemedical journal 2019, 132(1):115–119.
7.Lopez-Garcia M, King MF, Noakes CJ: A Multicompartment SIS Stochastic Model with Zonal Ventilationfor the Spread of Nosocomial Infections: Detection, Outbreak Management, and Infection Control. RiskAnal 2019, 39(8):1825–1842.
8.Tong TR, Liang C: Evidence of airborne transmission of SARS. N Engl J Med 2004, 351(6):609–611;author reply 609–611.

Page 11/16
9.Yu IT, Li Y, Wong TW, Tam W, Chan AT, Lee JH, Leung DY, Ho T: Evidence of airborne transmission of thesevere acute respiratory syndrome virus. N Engl J Med 2004, 350(17):1731–1739.
10.Christian MD, Loutfy M, McDonald LC, Martinez KF, Ofner M, Wong T, Wallington T, Gold WL, MederskiB, Green K et al: Possible SARS coronavirus transmission during cardiopulmonary resuscitation. Emerginginfectious diseases 2004, 10(2):287–293.
11.Xiao S, Li Y, Sung M, Wei J, Yang Z: A study of the probable transmission routes of MERS-CoV duringthe �rst hospital outbreak in the Republic of Korea. Indoor Air 2018, 28(1):51–63.
12.Chen H, Liu S, Liu J, Chai C, Mao H, Yu Z, Tang Y, Zhu G, Chen HX, Zhu C et al: Nosocomial Co-Transmission of Avian In�uenza A(H7N9) and A(H1N1)pdm09 Viruses between 2 Patients withHematologic Disorders. Emerging infectious diseases 2016, 22(4):598–607.
13.La Rosa G, Fratini M, Della Libera S, Iaconelli M, Muscillo M: Viral infections acquired indoors throughairborne, droplet or contact transmission. Annali dell’Istituto superiore di sanita 2013, 49(2):124–132.
14.Chow EJ, Mermel LA: Hospital-Acquired Respiratory Viral Infections: Incidence, Morbidity, andMortality in Pediatric and Adult Patients. Open forum infectious diseases 2017, 4(1):ofx006.
15.Yang Z, Suzuki A, Watanabe O, Okamoto M, Ohmi A, Huang W, Nishimura H: Outbreak of humanmetapneumovirus infection in a severe motor-and-intellectual disabilities ward in Japan. Japanesejournal of infectious diseases 2014, 67(4):318–321.
16.Herfst S, Bohringer M, Karo B, Lawrence P, Lewis NS, Mina MJ, Russell CJ, Steel J, de Swart RL, MengeC: Drivers of airborne human-to-human pathogen transmission. Current opinion in virology 2017, 22:22–29.
17.Liang Q, Yan C, Xu Z, Huang M: Preemptive isolation and active surveillance in the prevention andcontrol of nosocomial infection reduce the incidence of carbapenem-resistant Enterobacteriaceae.Infectious diseases 2019, 51(5):377–379.
18.Kang Y, Zhu SC: [Prevention of severe infection with the help of nosocomial infection control inintensive care units]. Zhonghua nei ke za zhi 2017, 56(5):335–336.
19.O’Hara LM, Thom KA, Preas MA: Update to the Centers for Disease Control and Prevention and theHealthcare Infection Control Practices Advisory Committee Guideline for the Prevention of Surgical SiteInfection (2017): A summary, review, and strategies for implementation. American journal of infectioncontrol 2018, 46(6):602–609.
20.Segreti J, Parvizi J, Berbari E, Ricks P, Berrios-Torres SI: Introduction to the Centers for Disease Controland Prevention and Healthcare Infection Control Practices Advisory Committee Guideline for Preventionof Surgical Site Infection: Prosthetic Joint Arthroplasty Section. Surgical infections 2017, 18(4):394–400.

Page 12/16
21.Rao NG, Kumar A, Wong JS, Shridhar R, Goswami DY: Effect of a Novel PhotoelectrochemicalOxidation Air Puri�er on Nasal and Ocular Allergy Symptoms. Allergy & rhinology 2018,9:2152656718781609.
22.Siegel JD, Rhinehart E, Jackson M, Chiarello L, Health Care Infection Control Practices Advisory C:2007 Guideline for Isolation Precautions: Preventing Transmission of Infectious Agents in Health CareSettings. American journal of infection control 2007, 35(10 Suppl 2):S65–164.
23.Alonso C, Raynor PC, Davies PR, Morrison RB, Torremorell M: Evaluation of an electrostatic particleionization technology for decreasing airborne pathogens in pigs. Aerobiologia 2016, 32(3):405–419.
TablesTable 1. Puri�cation rate (%) of 0.3–0.5 μm particles at each sampling point within 1 h for the pediatricisolation bed. Each experiment was repeated independently three times, and the mean values andstandard deviations are shown.
A B C D EHigh-gear 95.71 95.84 95.21 94.75 95.30
Middle-gear 96.91 96.82 96.78 97.25 97.52Low-gear 91.37 91.32 91.13 92.04 91.40Control 36.48 36.33 37.24 37.69 37.96
Table 2. Puri�cation rate (%) of 0.3–0.5 μm particles at each sampling point within 2 h with the pediatricisolation bed. Each experiment was repeated independently three times, and the mean values andstandard deviations are shown.
A B C D EHigh-gear 91.91 90.29 90.83 90.81 90.65
Middle-gear 87.80 88.26 87.89 86.82 86.50Low-gear 78.90 77.89 78.54 78.19 72.14
control 9.89 10.73 10.33 10.80 9.30
Figures

Page 13/16
Figure 1
Schematic diagram of the pediatric isolation bed showing the positions of the sampling points A:experiment room. B: General ward.
Figure 2
Puri�cation effect of the low-gear pediatric isolation bed in the laboratory Curve of the number of 0.3–0.5μm particles over time. (B) Curve of the number of 0.5–1.0 μm particles over time. Each experiment wasrepeated independently three times, and the mean values and standard deviations are shown.

Page 14/16
Figure 3
Changes in the Staphylococcus albicans concentration over 60 min with the low-gear isolation bed.Values are expressed as mean ± SE of three replicates. ***,P<0.01.
Page 15/16
Figure 4
Puri�cation effect of the low-gear pediatric isolation bed in the laboratory (A) Curve of the number of 0.3–0.5 μm particles over time. (B) Curve of the number of 0.5–1.0 μm particles over time. Each experimentwas repeated independently three times, and the mean values and standard deviations are shown.
Figure 5
Puri�cation effect of the low-gear pediatric isolation bed in Guangzhou Chest Hospital.(A) Curve of thenumber of 0.3–0.5 μm particles over time. (B) Curve of the number of 0.5–1.0 μm particles over time.Each experiment was repeated independently three times, and the mean values and standard deviationsare shown.
Page 16/16
Figure 6
Puri�cation effect on the deposition of bacteria. *** P<0.001
Supplementary Files
This is a list of supplementary �les associated with this preprint. Click to download.
Formula.docx