Embed Size (px)
Citation preview
©FUNPEC-RP www.funpecrp.com.brGenetics and Molecular Research 14 (4): 18078-18089 (2015)
Isolation and analysis of cell-free fetal DNA from maternal peripheral blood in Chinese women
W.C. Yang1*, L. Zhu1*, Y.M. Qiu1,2*, B.X. Zhou1, J.L. Cheng1, C.L. Wei1,3, H.C. Chen4, L.Y. Li5, X.D. Fu6 and J.J. Fu1,3,6
1Key Laboratory of Epigenetics and Oncology, The Research Center for Preclinical Medicine, Sichuan Medical University, Luzhou City, Sichuan Province, China 2Maternal and Child Health Care Hospital of Zigong, Zigong, Sichuan Province, China3State Key Laboratory of Quality Research in Chinese Medicine, Macau University of Science and Technology, Macau (SAR), China4Department of Biochemistry, School of Life Sciences & the State Key Laboratory of Medical Genetics, Central South University, Changsha, Hunan Province, China 5Institute of Reproduction and Stem Cell Engineering, Central South University Xiangya School of Medicine, Changsha, Hunan Province, China6Department of Obstetrics and Gynecology, First Affiliated Hospital of Sichuan Medical University, Luzhou, Sichuan Province, China
*These authors contributed equally to this study.Corresponding author: J.J. FuE-mail: [email protected] / [email protected]
Genet. Mol. Res. 14 (4): 18078-18089 (2015)Received August 30, 2015Accepted October 24, 2015Published December 22, 2015DOI http://dx.doi.org/10.4238/2015.December.22.34
ABSTRACT. Non-invasive prenatal diagnosis is used to detect the genetic material of the fetus by isolating the cell-free fetal DNA (cffDNA) from maternal peripheral blood. In order to establish an isolation method for
18079Isolation and analysis of cell free fetal DNA
©FUNPEC-RP www.funpecrp.com.brGenetics and Molecular Research 14 (4): 18078-18089 (2015)
cffDNA from maternal peripheral blood in Chinese women, the cffDNA was acquired with a two-step centrifugation using a QlAamp DNA Blood mini kit. The SRY gene of plasma DNA was amplified by polymerase chain reaction (PCR). Real-time quantitative PCR was used to measure the concentration of cffDNA in maternal peripheral blood in different pregnant women. The results of the SRY gene amplification of plasma DNA from pregnant women was the same as that of the amniocyte DNA. The average concentration of cffDNA in maternal peripheral blood of pregnant women in different gestational stages was 0.98 ng/mL (0.26-1.49 ng/mL), 1.43 ng/mL (0.46-2.34 ng/mL), and 1.95 ng/mL (0.65-6.81 ng/mL) from early, middle, and late gestational stages, respectively. The mean of cffDNA from total DNA in plasma in different stages of gestation was 22.28% (9.86-27.81%). The lowest concentration of DNA amplified by nested-PCR in our research was 10-4-10-3 ng/µL. The isolation method for cffDNA from maternal peripheral blood was successfully established and further research into its applications will be conducted.
Key words: Cell-free fetal DNA; Isolation method; Plasma; SRY gene;Non-invasive prenatal diagnosis
INTRODUCTION
Prenatal diagnosis is used to determine whether the fetus will suffer from genetic diseases after birth. Currently, invasive methods of sampling fetal material include amniocentesis (Fu et al., 2001; Cignini et al., 2012; Simões et al., 2013), chorionic villus sampling (Vora et al., 2010; Colah et al., 2011), and umbilical cord blood sampling (Fu et al., 2000; Deka et al., 2012). Non-invasive prenatal diagnosis (NIPD) is capable of detecting the genetic material of the fetus through the isolation of cell-free fetal DNA (cffDNA) from maternal peripheral blood, plasma, or serum. Compared to traditional methods of prenatal diagnosis, using cffDNA in prenatal testing to replace or complement existing invasive methods can greatly reduce the pain and remove or reduce the risk of miscarriage. Therefore, NIPD has great potential as a diagnostic tool.
Herzenberg et al. (1979) first isolated fetal nucleated red blood cells (NRBC) by using flow cytometry (FCM). However, no efficient prenatal diagnostic method was available because of the limited number and stability of NRBC in the blood. NIPD did not become promising until Lo, et al. confirmed that cffDNA exists in maternal peripheral blood (Lo et al., 1997). The concentration of cffDNA is very low in maternal peripheral blood (3-6%) (Wright et al., 2009), so its use has been limited. Researchers are trying to establish effective methods to measure the concentrations of cffDNA at different stages of gestation and optimize NIPD.
The usage of cffDNA in NIPD includes detection of single gene inheritance diseases and aneuploidy by decoding the entire fetal genome from maternal plasma DNA analysis (Boon and Fass, 2013; Chiu and Lo, 2013). It is mainly used in clinics for prenatal sex identification of X-linked disorders including hemophilia, Huntington’s disease (HD), Duchenne muscular dystrophy (DMD), and congenital adrenal cortical hyperplasia (CAH) (Wright et al., 2009; van den Oever et al., 2015; Xu et al., 2015). It is also used for prenatal screening of fetal chromosomal aneuploidy and detection of the Rh factor (Boon and Fass, 2013; Chiu and Lo, 2013; Yang et al., 2015). NIPD provides an opportunity for the use of in utero gene therapy (IUGT) in early pregnancy.
18080W.C. Yang et al.
©FUNPEC-RP www.funpecrp.com.brGenetics and Molecular Research 14 (4): 18078-18089 (2015)
Maternal plasma cell-free DNA is a mixture of maternal and fetal DNA of which fetal DNA represents only a minor population. The SRY gene is a sex-linked gene on the Y chromosome, which only exists in males. Using cffDNA in maternal plasma for fetal gender determination is mainly limited to those Y chromosome sequences absent in the maternal genome, such as the SRY. Thus, the only way to identify these sequences is through male-bearing pregnancies (Wright et al., 2009). Prenatal genetic diagnosis is often used where there is a family history of a sex-linked disease. Most sex-linked diseases are recessive X-linked diseases caused by a particular gene mutation on the X chromosome. The disease is normally manifested only in males, who carry a single X chromosome. In females, the normal allele on the second X chromosome compensates for the diseased allele. The most common X-linked recessive diseases include hemophilia and Duchenne muscular dystrophy, although numerous other diseases can result in severe conditions. Whilst each disease is individually relatively rare, it has been estimated that in combination they occur in around 5 in 10,000 live births (Baird et al., 1988).
Progress remains to be made on the methodology for cffDNA isolation from maternal peripheral blood. Effective isolation protocols need to be established to expand the clinical applications of cffDNA in NIPD. Different groups have shown large variations in the concentration of cffDNA isolated, between 3-20% (Ordoñez et al., 2013; Srinivasan et al., 2013; Benn and Cuckle, 2014).
The purpose of our research is to establish a method for the isolation of cffDNA from maternal peripheral blood and to obtain the concentration of cffDNA at different gestational stages in pregnant Chinese women. Additionally, we use nested-PCR to amplify the cffDNA in maternal peripheral blood plasma and achieve high sensitivity.
MATERIAL AND METHODS
Sample information
The maternal peripheral blood of pregnant women from different gestational stages was collected from women receiving antenatal care at the Department of Obstetrics and Gynecology of the Affiliated Hospital of Sichuan Medical University, and Maternal and Child Health Care Hospital in Zigong, Sichuan, China. This investigation was conducted in accordance with the ethical standards and according to national and international guidelines. The Sichuan Medical University review board has approved the protocol. The pregnant women provided informed consents.
Blood collection and plasma separation
The blood samples, 2-3 mL, were collected in EDTA-K2 anticoagulant tubes. Plasma was separated from the blood sample by centrifugation for 10 min at 1600 g. The supernatant was then centrifuged for 10 min at 16,000 g, and the final supernatant was preserved at -80°C or utilized immediately for cffDNA isolation.
cffDNA isolation from plasma
The cffDNA isolation from plasma was performed according to the protocol from the QIAamp DNA Blood mini kit with a minor modification (Qiagen, Dusseldorf, NRW Germany). First, 20 μL Protease K (20 mg/mL) was added at the bottom of Eppendorf tubes and 200 μL previously prepared plasma was added. This was mixed and centrifuged briefly after adding 200 μL Buffer AL.
18081Isolation and analysis of cell free fetal DNA
©FUNPEC-RP www.funpecrp.com.brGenetics and Molecular Research 14 (4): 18078-18089 (2015)
The solution was incubated in a water-bath at 56°C for 10 min, centrifuged briefly, 200 μL absolute ethyl alcohol was added, mixed, centrifuged briefly, and then transferred to the center of the spin columns (the spin columns were put in 2-mL collection tubes). The spin columns were centrifuged for 1 min at 6000 g, put into new 2-mL collection tubes, 500 μL Buffer AW2 was added at the center of the spin columns, they were centrifuged for 3 min at 20,000 g, and the filtrate was discarded. Next, the spin columns were centrifuged for 1 min at 20,000 g, and DNA was eluted with 60 μL Buffer AE. The solution was placed at room temperature for 5 min, centrifuged for 1 min at 6000 g, aliquoted, and stored at -80°C.
DNA extraction from amniotic fluid
Amniotic fluid DNA extraction was performed as previously described (Fu et al., 2001). Briefly, amniotic fluid was centrifuged for 10 min at 1600 g, the filtrate was discarded, and 200-500 μL Nucleic Lysis Buffer (0.2 mM Tris, pH 8.2, 40 mM NaCl, 0.2 mM EDTA, pH 8.0) was added. This was mixed, 50 μL 20% SDS and 10 μL Protease K (20 mg/mL) were added, and incubated in a water-bath at 56°C for 2 h. An equivalent volume of phenol was added, mixed, and centrifuged for 10 min at 1600 g. The supernatant was retained, an equivalent volume of phenol and chloroform was added, mixed well, and centrifuged for 10 min at 1600 g. The supernatant was retained and 2.5 volume cold absolute ethyl alcohol was added to precipitate the DNA.
DNA extraction from white blood cells
After spinning 3-5 mL blood, we added 10 mL 1X Lysis Buffer, placed it in an ice-bath for 30 min, and centrifuged it for 10 min at 1600 g. The filtrate was discarded, 1 mL Nucleic Lysis Buffer was added and mixed. Next, 100 μL 20% SDS and 10 μL Protease K (20 mg/mL) were added and incubated in a water-bath at 56°C for 4 h. Then, an equivalent volume of phenol was added, mixed, and centrifuged for 10 min at 1600 g. The supernatant was retained, an equivalent volume of phenol and chloroform was added, mixed, and centrifuged for 10 min at 1600 g. Again, the supernatant was retained and 2.5 volume absolute ethyl alcohol was added to precipitate the DNA.
Nested PCR
The amplification primers for the SRY gene (Y chromosomal material) were as follows, SRY-138F: 5'-TACAGGCCATGCACAGAGAG-3' and SRY-138R: 5'-TGTTGTCCAGTTGCACTTCG-3', SRY-116F: 5'-GCACAGAGAGAAATACCCGAAT-3' and SRY-116R: 5'-GCACTTCGCTGCAGAGTACC-3'. The amplification reaction of the first step of the nested PCR was set up in a 10-μL reaction volume. Each reaction contained 2 μL cffDNA solution (control groups: 0.2 ng DNA), 300 nmol primer SRY-138F and SRY-138R, 0.05 μL HotMaster Taq DNA Polymerase (5 PRIME Inc., Gaithersburg, MD, USA), 1 μL 10X HotMaster Taq Buffer, 0.25 μL dNTP Mix (10 mM each), and ddH2O. The PCR program used for the first step was as follows: initial denaturation step at 95°C for 90 s, followed by 20 cycles each consisting of a denaturation step at 94°C for 30 s, annealing at 62°C for 30 s, and an extension step at 65°C for 25 s. This was followed by an extension step at 65°C for 2 min. The amplification reaction for the second step of nested PCR was set up in a 10-μL reaction volume. Each reaction contained 1 μL first step of the PCR amplification product, 600 nmol primer SRY-138F and SRY-138R, 0.05 μL HotMaster Taq DNA Polymerase (5 PRIME Inc., Gaithersburg, MD, USA), 1 μL 10X HotMaster Taq Buffer, and 0.25 μL dNTP Mix (10 mM each) and
18082W.C. Yang et al.
©FUNPEC-RP www.funpecrp.com.brGenetics and Molecular Research 14 (4): 18078-18089 (2015)
ddH2O was added to a total volume of 10 μL. The PCR program for the second step was as follows: initial denaturation step at 95°C for 90 s, followed by 30 cycles each consisting of denaturation step at 94°C for 30 s, annealing at 62°C for 30 s, extension step at 65°C for 25 s, and followed by extension step at 65°C for 2 min.
Amplification of DNA of amniotic fluid
The amplification reaction was set up in a reaction volume of 10 μL (Fu et al., 2001, 2002). Each reaction contained 50 ng DNA, 300 nmol primer XES7 and XES2, 5 μL 2X PCR MasterMix (Tiangen, China) and ddH2O. The following PCR program was used: initial denaturation step at 95°C for 90 s, followed by 34 cycles, each consisting of a denaturation step at 94°C for 30 s, annealing at 65°C for 30 s, an extension step at 72°C for 40 s, followed by a further extension step at 72°C for 2 min.
Electrophoresis and silver staining
The PCR product was resolved on a 2% agarose gel or 8% PAGE. The PAGE coloration was developed by silver staining.
Real-time quantitative PCR
The amplification primers were SRY-71F (5'-CCAGCTAGGCCACTTACCG-3'), SRY-71R (5'-AGCTTTGTCCAGTGGCTGTAG-3'), Q-b-actin55GF (5'-AAGTCCCTTGCCATCCTAAA-3'), and Q-b-actin55GR (5'-ATGCTATCACCTCCCCTGTG-3'). Standard curve was set; the male DNA sample was diluted to 100, 10, 1, and 0.1 ng/μL. The Applied Biosystems® MicroAmp® Optical 96-Well Reaction Plate was used and each reaction contained 1 μL cffDNA solution, 0.5 μL each primer, 5 μL 2X qPCR Taq Mix (Roche, Switzerland), 0.02 μL qPCR probe (Roche), and ddH2O. The following PCR program was used: initial denaturation step at 95°C for 10 min, followed by 45 cycles, each consisting of denaturation step at 94°C for 15 s and annealing at 60°C for 1 min.
Statistical analysis and calculation
Data were analyzed using Microsoft Excel 2007® and all data represented by Ct values were converted to ng/mL. P < 0.05 was considered to be significant.
The concentration of cffDNA was calculated by use of the following equation:
where C = concentration of cffDNA in maternal peripheral blood (ng/mL); Q = quantity (ng) determined by quantitative detection in PCR amplifying SRY gene; V1 = total volume of DNA obtained after extraction, typically 60 μL per Qiagen extraction; V2 = volume of DNA solution used for PCR, typically 2 μL; and V3 = volume of plasma extracted, typically 400 μL.
The percentage of cffDNA in total DNA of maternal peripheral blood was calculated by using the following equation:
(Equation 1)
18083Isolation and analysis of cell free fetal DNA
©FUNPEC-RP www.funpecrp.com.brGenetics and Molecular Research 14 (4): 18078-18089 (2015)
where P = percentage of cffDNA in total DNA of maternal peripheral blood; Q1 = quantity (ng) determined by quantitative detection in PCR amplifying SRY gene; Q2 = quantity (ng) determined by quantitative detection in PCR amplifying b-actin gene.
RESULTS
Isolation of cffDNA from maternal peripheral blood
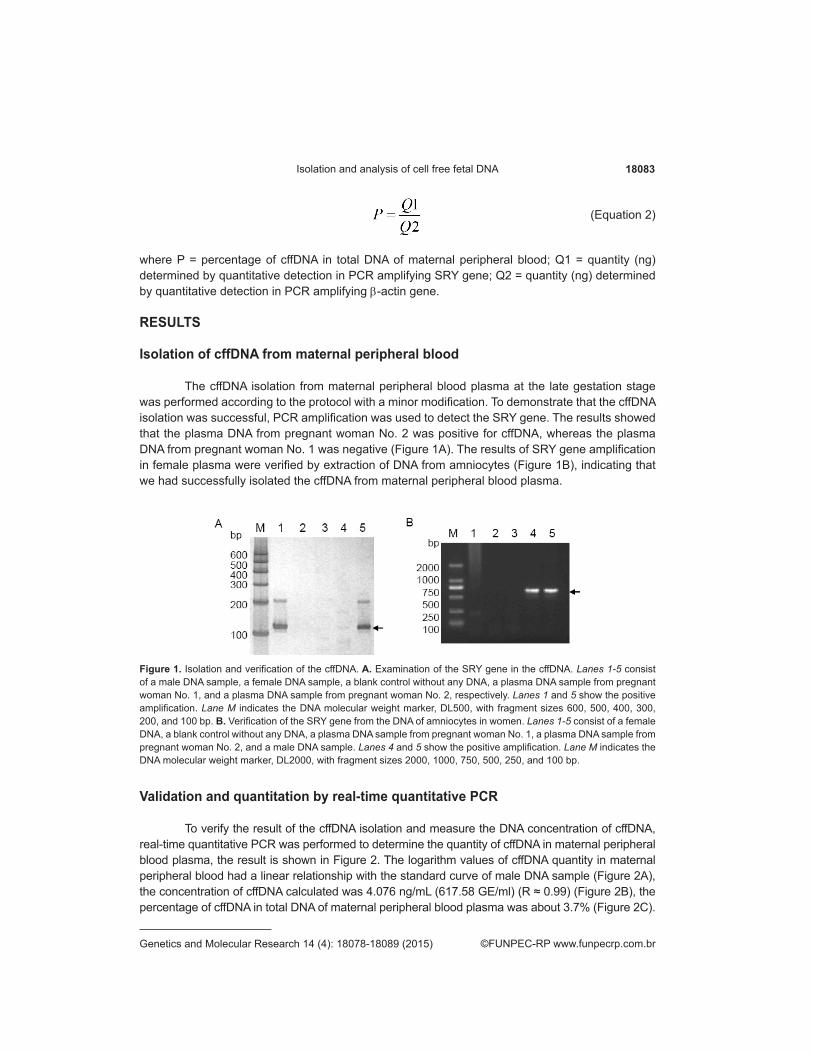
The cffDNA isolation from maternal peripheral blood plasma at the late gestation stage was performed according to the protocol with a minor modification. To demonstrate that the cffDNA isolation was successful, PCR amplification was used to detect the SRY gene. The results showed that the plasma DNA from pregnant woman No. 2 was positive for cffDNA, whereas the plasma DNA from pregnant woman No. 1 was negative (Figure 1A). The results of SRY gene amplification in female plasma were verified by extraction of DNA from amniocytes (Figure 1B), indicating that we had successfully isolated the cffDNA from maternal peripheral blood plasma.
(Equation 2)
Figure 1. Isolation and verification of the cffDNA. A. Examination of the SRY gene in the cffDNA. Lanes 1-5 consist of a male DNA sample, a female DNA sample, a blank control without any DNA, a plasma DNA sample from pregnant woman No. 1, and a plasma DNA sample from pregnant woman No. 2, respectively. Lanes 1 and 5 show the positive amplification. Lane M indicates the DNA molecular weight marker, DL500, with fragment sizes 600, 500, 400, 300, 200, and 100 bp. B. Verification of the SRY gene from the DNA of amniocytes in women. Lanes 1-5 consist of a female DNA, a blank control without any DNA, a plasma DNA sample from pregnant woman No. 1, a plasma DNA sample from pregnant woman No. 2, and a male DNA sample. Lanes 4 and 5 show the positive amplification. Lane M indicates the DNA molecular weight marker, DL2000, with fragment sizes 2000, 1000, 750, 500, 250, and 100 bp.
Validation and quantitation by real-time quantitative PCR
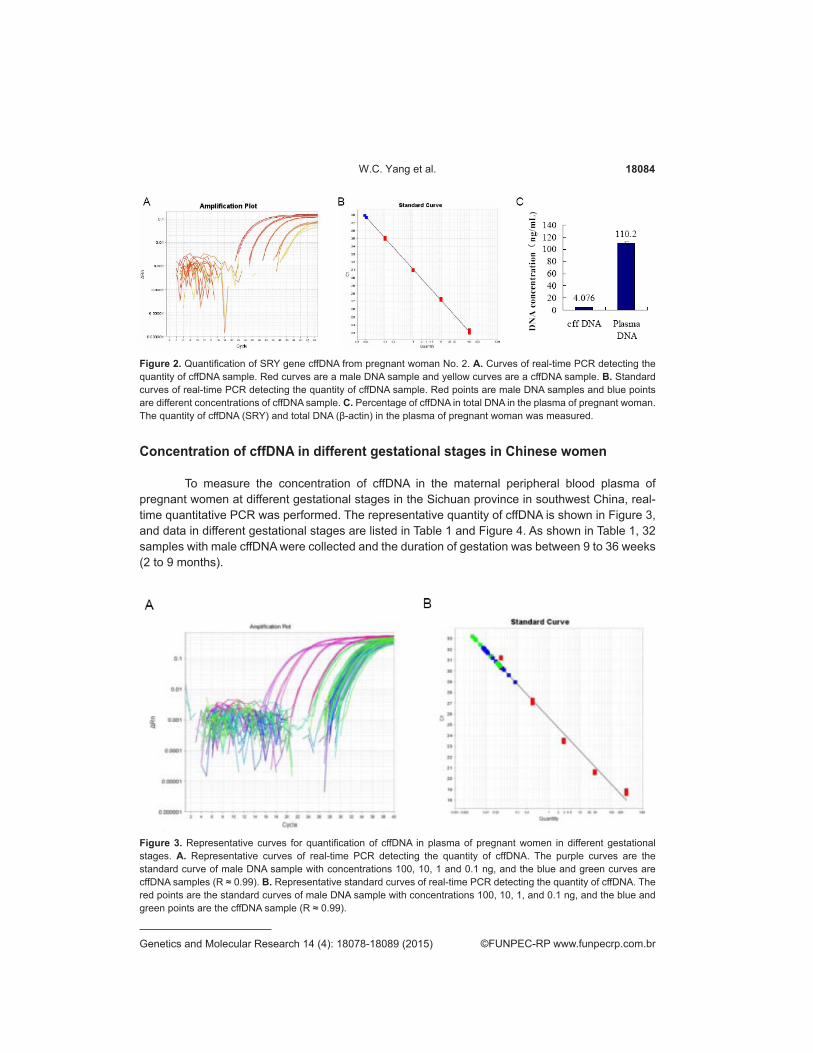
To verify the result of the cffDNA isolation and measure the DNA concentration of cffDNA, real-time quantitative PCR was performed to determine the quantity of cffDNA in maternal peripheral blood plasma, the result is shown in Figure 2. The logarithm values of cffDNA quantity in maternal peripheral blood had a linear relationship with the standard curve of male DNA sample (Figure 2A), the concentration of cffDNA calculated was 4.076 ng/mL (617.58 GE/ml) (R ≈ 0.99) (Figure 2B), the percentage of cffDNA in total DNA of maternal peripheral blood plasma was about 3.7% (Figure 2C).
18084W.C. Yang et al.
©FUNPEC-RP www.funpecrp.com.brGenetics and Molecular Research 14 (4): 18078-18089 (2015)
Figure 2. Quantification of SRY gene cffDNA from pregnant woman No. 2. A. Curves of real-time PCR detecting the quantity of cffDNA sample. Red curves are a male DNA sample and yellow curves are a cffDNA sample. B. Standard curves of real-time PCR detecting the quantity of cffDNA sample. Red points are male DNA samples and blue points are different concentrations of cffDNA sample. C. Percentage of cffDNA in total DNA in the plasma of pregnant woman. The quantity of cffDNA (SRY) and total DNA (β-actin) in the plasma of pregnant woman was measured.
Concentration of cffDNA in different gestational stages in Chinese women
To measure the concentration of cffDNA in the maternal peripheral blood plasma of pregnant women at different gestational stages in the Sichuan province in southwest China, real-time quantitative PCR was performed. The representative quantity of cffDNA is shown in Figure 3, and data in different gestational stages are listed in Table 1 and Figure 4. As shown in Table 1, 32 samples with male cffDNA were collected and the duration of gestation was between 9 to 36 weeks (2 to 9 months).
Figure 3. Representative curves for quantification of cffDNA in plasma of pregnant women in different gestational stages. A. Representative curves of real-time PCR detecting the quantity of cffDNA. The purple curves are the standard curve of male DNA sample with concentrations 100, 10, 1 and 0.1 ng, and the blue and green curves are cffDNA samples (R ≈ 0.99). B. Representative standard curves of real-time PCR detecting the quantity of cffDNA. The red points are the standard curves of male DNA sample with concentrations 100, 10, 1, and 0.1 ng, and the blue and green points are the cffDNA sample (R ≈ 0.99).
18085Isolation and analysis of cell free fetal DNA
©FUNPEC-RP www.funpecrp.com.brGenetics and Molecular Research 14 (4): 18078-18089 (2015)
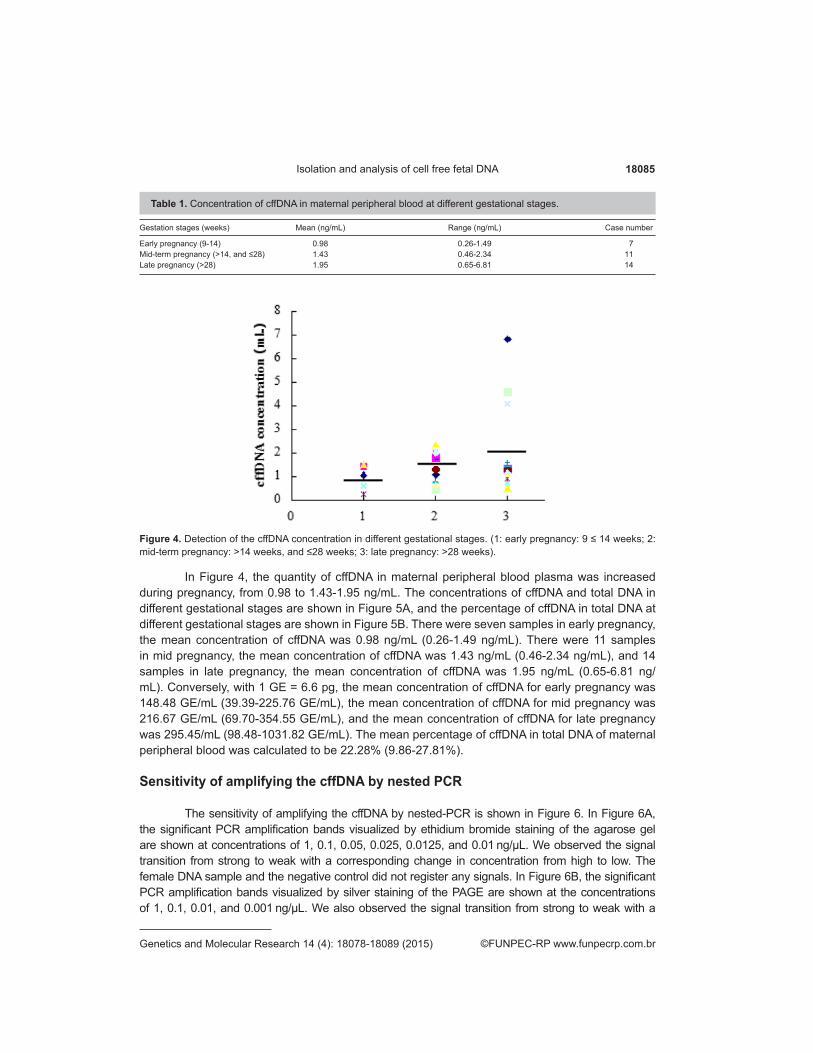
Table 1. Concentration of cffDNA in maternal peripheral blood at different gestational stages.
Gestation stages (weeks) Mean (ng/mL) Range (ng/mL) Case number
Early pregnancy (9-14) 0.98 0.26-1.49 7Mid-term pregnancy (>14, and ≤28) 1.43 0.46-2.34 11Late pregnancy (>28) 1.95 0.65-6.81 14
Figure 4. Detection of the cffDNA concentration in different gestational stages. (1: early pregnancy: 9 ≤ 14 weeks; 2: mid-term pregnancy: >14 weeks, and ≤28 weeks; 3: late pregnancy: >28 weeks).
In Figure 4, the quantity of cffDNA in maternal peripheral blood plasma was increased during pregnancy, from 0.98 to 1.43-1.95 ng/mL. The concentrations of cffDNA and total DNA in different gestational stages are shown in Figure 5A, and the percentage of cffDNA in total DNA at different gestational stages are shown in Figure 5B. There were seven samples in early pregnancy, the mean concentration of cffDNA was 0.98 ng/mL (0.26-1.49 ng/mL). There were 11 samples in mid pregnancy, the mean concentration of cffDNA was 1.43 ng/mL (0.46-2.34 ng/mL), and 14 samples in late pregnancy, the mean concentration of cffDNA was 1.95 ng/mL (0.65-6.81 ng/mL). Conversely, with 1 GE = 6.6 pg, the mean concentration of cffDNA for early pregnancy was 148.48 GE/mL (39.39-225.76 GE/mL), the mean concentration of cffDNA for mid pregnancy was 216.67 GE/mL (69.70-354.55 GE/mL), and the mean concentration of cffDNA for late pregnancy was 295.45/mL (98.48-1031.82 GE/mL). The mean percentage of cffDNA in total DNA of maternal peripheral blood was calculated to be 22.28% (9.86-27.81%).
Sensitivity of amplifying the cffDNA by nested PCR
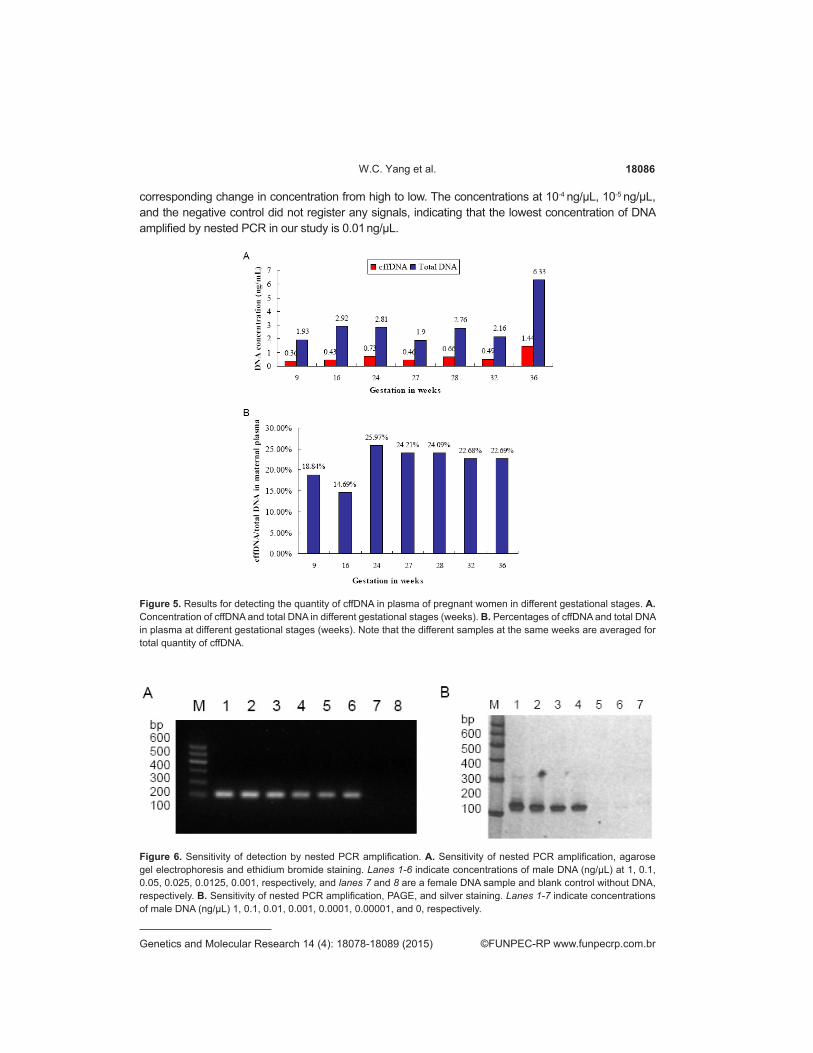
The sensitivity of amplifying the cffDNA by nested-PCR is shown in Figure 6. In Figure 6A, the significant PCR amplification bands visualized by ethidium bromide staining of the agarose gel are shown at concentrations of 1, 0.1, 0.05, 0.025, 0.0125, and 0.01 ng/μL. We observed the signal transition from strong to weak with a corresponding change in concentration from high to low. The female DNA sample and the negative control did not register any signals. In Figure 6B, the significant PCR amplification bands visualized by silver staining of the PAGE are shown at the concentrations of 1, 0.1, 0.01, and 0.001 ng/μL. We also observed the signal transition from strong to weak with a
18086W.C. Yang et al.
©FUNPEC-RP www.funpecrp.com.brGenetics and Molecular Research 14 (4): 18078-18089 (2015)
Figure 6. Sensitivity of detection by nested PCR amplification. A. Sensitivity of nested PCR amplification, agarose gel electrophoresis and ethidium bromide staining. Lanes 1-6 indicate concentrations of male DNA (ng/μL) at 1, 0.1, 0.05, 0.025, 0.0125, 0.001, respectively, and lanes 7 and 8 are a female DNA sample and blank control without DNA, respectively. B. Sensitivity of nested PCR amplification, PAGE, and silver staining. Lanes 1-7 indicate concentrations of male DNA (ng/µL) 1, 0.1, 0.01, 0.001, 0.0001, 0.00001, and 0, respectively.
corresponding change in concentration from high to low. The concentrations at 10-4 ng/μL, 10-5 ng/μL, and the negative control did not register any signals, indicating that the lowest concentration of DNA amplified by nested PCR in our study is 0.01 ng/μL.
Figure 5. Results for detecting the quantity of cffDNA in plasma of pregnant women in different gestational stages. A. Concentration of cffDNA and total DNA in different gestational stages (weeks). B. Percentages of cffDNA and total DNA in plasma at different gestational stages (weeks). Note that the different samples at the same weeks are averaged for total quantity of cffDNA.
18087Isolation and analysis of cell free fetal DNA
©FUNPEC-RP www.funpecrp.com.brGenetics and Molecular Research 14 (4): 18078-18089 (2015)
DISCUSSION
In 1997, scientists discovered cell-free fetal DNA (cffDNA) in maternal peripheral blood during pregnancy. This opened the possibility of early non-invasive prenatal diagnosis for a variety of genetic conditions. The origin of cffDNA is undetermined so far. There are three possibilities to explain existence of cffDNA in maternal peripheral blood. The first possible source is the placenta; cffDNA may arise from apoptosis of chorial trophcytes. The second possible source is the fetal hematopoietic cell; apoptosis of fetal hematopoietic cells releases cffDNA. The third possible source is that cffDNA comes directly into maternal peripheral blood. The cffDNA in maternal peripheral blood comes mainly from apoptosis and the length of the DNA fragment is only about 162 bp, rarely reaching 340 bp (Fan et al., 2010). The cffDNA in maternal peripheral blood consists of small fragments that are unstable, and its concentration reduces at a constant speed after collecting blood because of the activity of DNases. It is difficult to extract cffDNA from maternal peripheral blood after 6 hours (Jensen et al., 2013; Wong et al., 2013). Thus, we isolated the cffDNA immediately after collecting the blood samples to avoid DNA degradation.
In addition to the importance of duration of time between blood collection and cffDNA isolation, the key to cffDNA isolation is centrifugal force. The use high centrifugal force may destroy blood cells and release maternal DNA, subjecting it to the effects of DNases (Fernando et al., 2010). Thus, a two-step centrifugation process was used. The first step in our cffDNA isolation protocol is the lower centrifugal force (usually 1600 g), and the second step is the higher centrifugal force (usually 16,000 g).
cffDNA may be detected from maternal peripheral blood as early as 5-6 weeks of pregnancy (Repiská et al., 2013) and it increases throughout the pregnancy (Lisa et al., 2003). This was confirmed in our study with weeks 9 to 36 of gestation. However, because of the limited sample size from the early stage of pregnancy, we cannot obtain precise data for the early gestational stage. We may continue the study by collecting more samples from weeks 5 to 8.
Some disorders, such as eclampsia, may affect the quantity of cffDNA in maternal peripheral blood. The quantity of cffDNA from the pregnant women suffering from eclampsia is five times larger than that of the normal pregnant women (Sedlackova et al., 2014). The amount of cffDNA is increased in the pregnant women with fetal aneuploidy (Sedlackova et al., 2014). The method of cffDNA isolation we used may also affect the quantity of cffDNA. Because of the risk of miscarriage with traditional prenatal diagnostic methods, which can be invasive, enormous interest has arisen in the field of NIPD. Currently, NIPD is mainly used to detect aneuploidy, RhD group, X-linked genetic diseases, and some single gene inheritance diseases. Although fetal sex can often be determined using an ultrasound scan of the fetus in the second or third trimester, cffDNA isolation in the first trimester will open up new fields for NIPD. Using cffDNA in maternal plasma obtained from pregnant women during weeks 6-10 of their pregnancy will offer required sensitivity, specificity, and accuracy for a non-invasive prenatal testing. Thus, we have successfully isolated cffDNA from maternal peripheral blood and laid the foundation for further practice of NIPD.
Conflicts of interest
The authors declare no conflict of interest.
ACKNOWLEDGMENTS
Research supported partly by the National Natural Science Foundation of China
18088W.C. Yang et al.
©FUNPEC-RP www.funpecrp.com.brGenetics and Molecular Research 14 (4): 18078-18089 (2015)
(#30371493), the Science and Technology Innovation Team of Colleges and Universities of Sichuan Province (#13TD0032), the Research Foundation of the Science and Technology Department of Sichuan Province (#14JC0797, #2015JY0038), and the Luzhou City Special Foundation (#2013LZLY-J10).
REFERENCES
Baird PA, Anderson TW, Newcombe HB and Lowry RB (1988). Genetic disorders in children and young adults: a population study. Am. J. Hum. Genet. 42: 677-693.
Benn P and Cuckle H (2014). Theoretical performance of non-invasive prenatal testing for chromosome imbalances using counting of cell-free DNA fragments in maternal plasma. Prenat. Diagn. 34: 778-783.
Boon EM and Faas BH (2013). Benefits and limitations of whole genome versus targeted approaches for noninvasive prenatal testing for fetal aneuploidies. Prenat. Diagn. 33: 563-568.
Chiu RW and Lo YM (2013). Clinical applications of maternal plasma fetal DNA analysis: translating the fruits of 15 years of research. Clin. Chem. Lab. Med. 51: 197-204.
Cignini P, Dugo N, Giorlandino C, Gauci R, et al. (2012). Prenatal diagnosis of a fetus with a ring chromosome 20 characterized by array-CGH. J. Prenat. Med. 6: 72-73.
Colah RB, Gorakshakar AC and Nadkarni AH (2011). Invasive & non-invasive approaches for prenatal diagnosis of haemoglobinopathies: experiences from India. Indian J. Med. Res. 134: 552-560.
Deka D, Dadhwal V, Roy KK, Malhotra N, et al. (2012). Indications of 1342 fetal cord blood sampling procedures performed as an integral part of high risk pregnancy care. J. Obstet. Gynaecol. of India. 62: 20-24.
Fan HC, Blumenfeld YJ, Chitkara U, Hudgins L, et al. (2010). Analysis of the size distributions of fetal and maternal cell-free DNA by paired-end sequencing. Clin. Chem. 56: 1279-1286.
Fernando MR, Chen K, Norton S, Krzyzanowski G, et al. (2010). A new methodology to preserve the original proportion and integrity of cell-free fetal DNA in maternal plasma during sample processing and storage. Prenat. Diagn. 30: 418-424.
Fu JJ, Li LY, Li XR and Lu GX (2000). Rapid prenatal gene diagnosis for b-thalassemia by amplification refractory mutation system (ARMS). Chin. J. Obstet. Gynecol. 35: 359-360.
Fu JJ, Li LY and Lu GX (2001). Prenatal gene diagnosis of spinal muscular atrophy by combined with the technique of PCR-SSCP, PCR followed by restriction enzyme digestion and linkage analysis. Chin. J. Neurol. 34: 74-78.
Fu JJ, Li LY and Lu GX (2002). Relationship between microdeletion on Y chromosome and patients with idiopathic azoospermia and severe oligozoospermia in the Chinese. Chin. Med. J. 115: 72-75.
Herzenberg LA, Bianchi DW, Schroder J, Cann HM, et al. (1979). Fetal cells in the blood of pregnant women: detection and enrichment by fluorescence-activated cell sorting. Proc. Natl. Acad. Sci. USA 76: 1453-1455.
Jensen TJ, Zwiefelhofer T, Tim RC, Željko D, et al. (2013). High-throughput massively parallel sequencing for fetal aneuploidy detection from maternal plasma. PLoS One 8: 1-8.
Lisa YC, Tse NL, Allen KC, and Tai HL (2003). Serial analysis of fetal DNA concentrations in maternal plasma in late pregnancy. Clin. Chem. 49: 678-680.
Lo YM, Corbetta N, Chamberlain PF, Rai V, et al. (1997). Presence of fetal DNA in maternal plasma and serum. Lancet 350: 485-487.Ordoñez E, Rueda L, Cañadas MP, Fuster C, et al. (2013). Evaluation of sample stability and automated DNA extraction for
fetal sex determination using cell-free fetal DNA in maternal plasma. Biomed. Res. Int. 2013: 195363.Repiská G, Sedláčková T, Szemes T, Celec P, et al. (2013). Selection of the optimal manual method of cell free fetal DNA
isolation from maternal plasma. Clin. Chem. Lab. Med. 51: 1185-1189.Sedlackova T, Repiska G, and Minarik G (2014). Selection of an optimal method for co-isolation of circulating DNA and miRNA
from the plasma of pregnant women. Clin. Chem. Lab. Med. 52: 1543-1548.Simões M, Marques C, Gonçalves A, Pereira AP, et al. (2013). Amniocentesis in HIV pregnant women: 16 years of experience.
Infect. Dis. Obstet. Gynecol. 2013: 914272.Srinivasan A, Bianchi DW, Huang H, Sehnert AJ, et al. (2013). Noninvasive detection of fetal subchromosome abnormalities
via deep sequencing of maternal plasma. Am. J. Hum. Genet. 92: 167-176.van den Oever JM, Bijlsma EK, Feenstra I, Muntjewerff N, et al. (2015). Noninvasive prenatal diagnosis of Huntington disease:
detection of the paternally inherited expanded CAG repeat in maternal plasma. Prenat. Diagn. doi: 10.1002/pd.4593. [Epub ahead of print].
Vora NL, Johnson KL, Peter I, Tighiouar HT, et al. (2010). Circulating cell-free DNA levels increase variably following chorionic villus sampling. Prenat. Diagn. 30: 325-328.
Wong D, Moturi S, Angkachatchai V, Mueller R, et al. (2013). Optimizing blood collection, transport and storage conditions for cell free DNA increases access to prenatal testing. Clin. Biochem. 46: 1099-1104.
18089Isolation and analysis of cell free fetal DNA
©FUNPEC-RP www.funpecrp.com.brGenetics and Molecular Research 14 (4): 18078-18089 (2015)
Wright CF and Burton H (2009). The use of cell-free fetal nucleic acids in maternal blood for non-invasive prenatal diagnosis. Hum. Reprod. Update 15: 139-151.
Xu Y, Li X, Ge HJ, Xiao B, et al. (2015). Haplotype-based approach for noninvasive prenatal tests of Duchenne muscular dystrophy using cell-free fetal DNA in maternal plasma. Genet. Med. doi: 10.1038/gim.2014.207. [Epub ahead of print]
Yang WC, Fu XD and Fu JJ (2015). Progress for cell free fetal DNA from maternal peripheral blood and its application. Int. J. of Genet. 38: 102-107.