Embed Size (px)
Citation preview

Isolated catalyst sites on amorphous supports: A systematic algorithm forunderstanding heterogeneities in structure and reactivityBryan R. Goldsmith, Evan D. Sanderson, Daniel Bean, and Baron Peters Citation: J. Chem. Phys. 138, 204105 (2013); doi: 10.1063/1.4807384 View online: http://dx.doi.org/10.1063/1.4807384 View Table of Contents: http://jcp.aip.org/resource/1/JCPSA6/v138/i20 Published by the AIP Publishing LLC. Additional information on J. Chem. Phys.Journal Homepage: http://jcp.aip.org/ Journal Information: http://jcp.aip.org/about/about_the_journal Top downloads: http://jcp.aip.org/features/most_downloaded Information for Authors: http://jcp.aip.org/authors
Downloaded 10 Oct 2013 to 137.99.26.43. This article is copyrighted as indicated in the abstract. Reuse of AIP content is subject to the terms at: http://jcp.aip.org/about/rights_and_permissions

THE JOURNAL OF CHEMICAL PHYSICS 138, 204105 (2013)
Isolated catalyst sites on amorphous supports: A systematic algorithmfor understanding heterogeneities in structure and reactivity
Bryan R. Goldsmith,1 Evan D. Sanderson,2 Daniel Bean,3 and Baron Peters1,2,a)
1Department of Chemical Engineering, University of California, Santa Barbara, California 93106-5080, USA2Department of Chemistry and Biochemistry, University of California, Santa Barbara,California 93106-9510, USA3College of Creative Studies - Computer Science, University of California, Santa Barbara,California 93106-5070, USA
(Received 20 February 2013; accepted 7 May 2013; published online 29 May 2013)
Methods for modeling catalytic sites on amorphous supports lag far behind methods for modelingcatalytic sites on metal surfaces, zeolites, and other crystalline materials. One typical strategy foramorphous supports uses cluster models with arbitrarily chosen constraints to model the rigid amor-phous support, but these constraints arbitrarily influence catalyst site activity. An alternative strategyis to use no constraints, but this results in catalytic sites with unrealistic flexibility. We present a sys-tematic ab initio method to model isolated active sites on insulating amorphous supports using smallcluster models. A sequential quadratic programming framework helps us relate chemical properties,such as the activation energy, to active site structure. The algorithm is first illustrated on an empiricalvalence bond model energy landscape. We then use the algorithm to model an off-pathway kinetictrap in olefin metathesis by isolated Mo sites on amorphous SiO2. The cluster models were terminatedwith basis set deficient fluorine atoms to mimic the properties of an extended silica framework. Wealso discuss limitations of the current algorithm formulation and future directions for improvement.© 2013 AIP Publishing LLC. [http://dx.doi.org/10.1063/1.4807384]
I. INTRODUCTION
Ab initio models for catalysis have been almost entirelyaimed at understanding catalysis on crystalline materials, e.g.,metal surfaces,1–12 metal oxides,13–21 and zeolites.22–30 Mod-els of a crystalline material can start from the known struc-ture and then make predictions about the chemical proper-ties near defects, dopants, and edges. Tremendous advanceshave come from these studies. By contrast, there is cur-rently no rigorous ab initio framework for modeling cataly-sis on insulating amorphous supports such as SiO2 and silica-alumina. Recent attempts to model catalysis on amorphoussupports includes olefin metathesis by methyltrioxorheniumon silica-alumina,31, 32 olefin metathesis by isolated Mo siteson silica,33–35 and the conversion of methanol to formalde-hyde by isolated vanadate sites supported on silica.36 Thesestudies offer many insights, but one is always left to wonderif the site models are representative. The difficulties associ-ated with modeling catalyst sites on amorphous supports stemfrom the diversity of local site environments and the lack ofstructural information about those environments.
To properly model a solid, one must fix the periph-eral atoms of the cluster model.4, 13, 25, 28, 37–41 The peripheralatoms are located away from the active site and are fixed tomimic the geometric constraints of a solid. For a crystallinematerial, the peripheral atoms are placed in their respectivecrystallographic positions, but there is no general prescriptionfor placement of the peripheral atoms in an amorphous ma-terial. In reality, there is no one location for the peripheral
a)Author to whom correspondence should be addressed. Electronic mail:[email protected]
atoms. Amorphous materials present a distribution of surfacesites and accordingly we should have a distribution of periph-eral atom positions. Efficiently sampling the distribution ofperipheral atom positions is difficult for two reasons. First,in most cases, ab initio calculations are prohibitively expen-sive for Monte Carlo sampling. Second, the distribution is un-known and non-Boltzmann, with quenched disorder from thepreparation history.
A method to sample the quenched disorder distributionof sites was recently developed by Van Ginhoven and co-workers.42 They generated 10 small amorphous silica clustersusing a reactive forcefield and compared the average struc-tural characteristics of these samples to a much bigger system.They show that it is possible to adequately sample the shortand medium range features of the larger system using care-fully chosen smaller amorphous structures. They emphasizethat how one chooses these smaller structures can bias the re-sults. Our work instead aims to generate a representative setof small cluster models via a new ab initio method. The al-gorithm we propose generates the lowest energy site modelat each value of the activation barrier as shown in Figure 1.Each structure generated by the algorithm can be envisionedas a different catalyst site within a larger amorphous system.
As indicated by the shading in Figure 1, we anticipatethat the population of sites at each activation energy, whilenot Boltzmann, is still dominated by lower energy sites. Cer-tainly, sites with energies above the minimum site energy(Esite) vs. activation energy (�E‡) curve will also contributeto the overall reactivity of an amorphous catalyst material.However, even if the entire ensemble of sites, both above andon the minimum Esite vs. �E‡ curve, could be generated, it
0021-9606/2013/138(20)/204105/11/$30.00 © 2013 AIP Publishing LLC138, 204105-1
Downloaded 10 Oct 2013 to 137.99.26.43. This article is copyrighted as indicated in the abstract. Reuse of AIP content is subject to the terms at: http://jcp.aip.org/about/rights_and_permissions

204105-2 Goldsmith et al. J. Chem. Phys. 138, 204105 (2013)
FIG. 1. The proposed algorithm predicts the lowest energy structure for eachvalue of activation energy. A priori knowledge or ad hoc assumptions aboutthe peripheral atom locations are not needed.
would be difficult to weight the different individual sites tocompute average catalyst properties. The assumption that lowenergy sites dominate the population allows us to make someprogress with a relatively simple computational framework.Specifically, the minimum Esite vs �E‡ curve reveals the qual-itative degree of variance in reactivity over the heterogeneouspopulation of sites on the amorphous catalyst. Moreover, byexamining structural differences between active and inactivesites along the minimum Esite vs. �E‡ curve, we can identifystructure-property relationships for isolated catalyst sites onamorphous materials. Structure-property relationships for cat-alysts on amorphous silica and silica-alumina supports haveeluded ab initio computational studies for many years, so thissystematic, albeit approximate, approach represents an impor-tant step forward.
To identify low energy sites with specific activation en-ergies, we must constrain activation energy itself. The con-straint on activation energy involves two completely differ-ent states of the system, the reactant state and the transitionstate. The reactant and transition state geometries themselvesare usually obtained by a constrained optimization with fixedperipheral atoms. In keeping with procedures used on zeolitecluster models, we require that both the reactant and transitionstate share the same peripheral atom positions.13, 25, 28, 37–41
To constrain the activation energy, we constrain the differ-ence between energies in the optimized transition and reactantstates.
The activation energy constraint is actually, as we willshow, a constraint on the allowed locations of peripheralatoms. It is more challenging than familiar constrained op-timization problems that have been encountered in previouscomputational chemistry applications. All electronic struc-ture packages can compute the electron density or wave-function with all atoms fixed in place (e.g., GAUSSIAN,43
GAMESS,44 TURBOMOLE,45 ADF,46 Q-Chem,47 VASP,48–50
DALTON,51 CASTEP,52 and HyperChem53). Many electronicstructure programs can perform constrained optimizationswith fixed atoms, bond lengths, bond angles, and dihedralangles.54–58 Some geometry optimizer software59 and reac-tion path optimization programs60 can utilize holonomic con-straints during energy minimization. Seam minimizations op-
timize the energy at intersections subject to the requirementthat the two energies be the same (e.g., one high spin andone low spin) at one configuration.61–63 The strategy proposedhere is a series of nested constrained optimizations, i.e., theactivation energy is constrained, but the constraint depends onother peripheral atom constraints. We derive the methodologyand illustrate the method using simple examples as a step to-ward systematic ab initio modeling of catalysts on amorphoussupports.
II. SEQUENTIAL QUADRATIC PROGRAMMING (SQP)ALGORITHM FORMULATION
The nested constrained optimizations can be done ef-ficiently with SQP.70, 71 Burger and Yang71 used sequentialquadratic programming in an ab initio reaction path follow-ing algorithm, but the application and implementation in thiswork is quite different.71 We are not following a reaction path,but rather we are systematically generating catalyst sites withdifferent reactivities. Here, we use the superscript “A” to de-note the reactant state and the superscript “‡” for the transitionstate. Additionally, we use a subscript “i” to indicate the flex-ible interior atoms and a subscript “p” for the rigid peripheralatoms. Note that the peripheral atom positions are fixed in thesame location for both the reactant and the transition state.Therefore, the coordinates of the reactant state are (xA
i , xp)and the coordinates of the transition state are (x‡i , xp). We pro-ceed by making second order expansions of the site energy, E,at both locations (xA
i , xp) and (x‡i , xp). At this stage, we do notassume xA
i and x†i are optimized
E(xA
i + �xAi , xp + �xp
) − E(xA
i , xp
)= [
(�xAi )T (�xp)T
][ gAi
gAp
]+ 1
2
[(�xA
i )T (�xp)T]
×[
HAii HA
ip
HApi HA
pp
][�xA
i
�xp
](1)
and
E(x‡i + �x‡i , xp + �xp
) − E(x‡i , xp
)= [
(�x‡i )T (�xp)T
][ g‡ig‡p
]+ 1
2
[(�x‡i )
T (�xp)T]
×[
H‡ii H
‡ip
H‡pi H
‡pp
][�x‡i�xp
]. (2)
Here, gAi is the gradient of the energy with respect to the in-
terior atoms of the reactant state, and gAp is the gradient of
the energy with respect to the peripheral atoms of the reactantstate evaluated at location (xA
i , xp). The Hessian of the reac-tant state is partitioned into four matrices corresponding tothe interior block (HA
ii ), peripheral block (HApp), and coupling
blocks (HAip and HA
pi). Similar notation is used to describethe displacements, gradients, and Hessian matrix elements forthe transition state. Note that in principle gA
i = g‡i = 0 if the
Downloaded 10 Oct 2013 to 137.99.26.43. This article is copyrighted as indicated in the abstract. Reuse of AIP content is subject to the terms at: http://jcp.aip.org/about/rights_and_permissions

204105-3 Goldsmith et al. J. Chem. Phys. 138, 204105 (2013)
FIG. 2. When the peripheral atoms are moved, the interior atoms must alsomove to the new optimal saddle point and reactant minimum configurations.
interior atoms are properly optimized, however, we showthem explicitly in all the expressions.
At this stage, we do not yet know how the peripheralatom positions have been chosen (xp), or how they should bechanged (�xp). Within the second order approximation forexpressions (1) and (2), we can reoptimize the reactant min-imum and saddle point given any �xp by taking the interiorsteps
�xAi = −(
HAii
)−1(gA
i + HAip�xp
)(3)
and
�x‡i = −(H
‡ii
)−1(g‡i + H
‡ip�xp
). (4)
This reoptimization of the interior atoms after a change in theperiphery atom locations is depicted in Figure 2. In practice,these steps may require some refinement. Stiff interior modes(vertical width of ellipses in Figure 2) and strong interior-periphery coupling (steep slope of valley in Figure 2) willrequire steps that are precise and small. Within the secondorder approximation, we can use expressions (1)–(4) to ob-tain reduced variable expressions for both the reactant andthe transition state. By substituting expressions (3) and (4)into expressions (1) and (2), respectively, and then collectingterms that are zeroth, first, and second order in �xp, we ob-tain reduced variable energy expressions for the reactant state
EAred (xp + �xp) = EA
red (xp) + (�xp)T gAred
+1
2(�xp)T HA
red�xp, (5)
where
EAred (xp) = E(xA
i , xp) − 1
2
(gA
i
)T (HA
ii
)−1gA
i , (6)
gAred = gA
p − HApi
(HA
ii
)−1gA
i , (7)
HAred = HA
pp − HApi
(HA
ii
)−1HA
ip, (8)
and for the transition state
E‡red (xp + �xp) = E
‡red (xp) + (�xp)T g‡red
+1
2(�xp)T H
‡red�xp, (9)
where
E‡red (xp) = E(x‡i , xp) − 1
2(g‡i )
T (H ‡ii)
−1g‡i , (10)
g‡red = g‡p − H‡pi(H
‡ii)
−1g‡i , (11)
H‡red = H
‡pp − H
‡pi(H
‡ii)
−1H‡ip. (12)
The system energy is now expressed by a reduced potentialenergy surface (RPES),64–68 which depends only on the pe-ripheral atom positions. We denote the energies, gradients,and Hessian matrices on the RPES with the subscript red. Thereduced Hessian matrices (HA
red and H‡red ) are recognized as
Schur complements69 of the original Hessian matrices. TheSchur complement represents effectively softened force con-stants of a system whose interior atoms adiabatically relax asthe periphery atoms move.
The activation energy, �E‡, at a model site is defined asthe difference between the energy of the transition state andthe reactant state with both states optimized over the interioratoms
�E‡(xp) = E(x‡i , xp) − E(xAi , xp). (13)
On the RPES, the original problem, to find the lowest energycatalyst sites with a given activation energy, now takes thesimpler form
minxpEA
red (xp) subject to �E‡(xp) = �E‡, (14)
where
�E‡(xp) = E‡red (xp) − EA
red (xp). (15)
Now consider a point that simply minimizes EAred (xp) with no
constraint on activation energy. Let the unconstrained mini-mizer be the location xp0 and let the activation energy at theunconstrained minimizer be �E‡(xp0 ) = �E
‡0. Starting from
xp0 we can compute a sequence of configurations at incremen-tally larger or smaller values of the activation energy. Supposethe incremental (desired) change in activation energy betweenconfigurations k and k + 1 is ��E‡. Then in terms of �xp, theperipheral atom step between configurations xp,k and xp,k+1,we have
��E‡
= �E‡(xp,k+1) − �E‡(xp,k)
= E‡red (xp,k+1) − E
‡red (xp,k) − [
EAred (xp,k+1) − EA
red (xp,k)]
= (�xp)T (g‡red − gAred ) + 1
2(�xp)T (H ‡
red − HAred )�xp.
(16)
As long as gAred �= g‡red and as long as ��E‡ is sufficiently
small, the linear term dominates the quadratic term in �xp.Thus, for small steps �xp, and therefore for small increments��E‡, we have the quadratic programming problem
min�xp (�xp)T gAred + 1
2(�xp)T HA
red�xp
subject to (�xp)T �gred = ��E‡, (17)
where�gred = g‡red − gA
red . (18)
Downloaded 10 Oct 2013 to 137.99.26.43. This article is copyrighted as indicated in the abstract. Reuse of AIP content is subject to the terms at: http://jcp.aip.org/about/rights_and_permissions

204105-4 Goldsmith et al. J. Chem. Phys. 138, 204105 (2013)
Using a Lagrange multiplier, λ, for the constraint on theactivation energy increment, we obtain the Karush-Kuhn-Tucker70 matrix[
HAred −�gred
−(�gred )T 0
][�xp
λ
]=
[ −gAred
−��E‡
], (19)
which can be directly solved to obtain the step �xp
�xp = −(HAred )−1(gA
red − λ�gred ). (20)
An expression for λ can be obtained by substituting (20) intothe constraint on activation energy, giving
λ = ��E‡ + (�gred )T (HAred )−1gA
red
(�gred )T (HAred )−1�gred
. (21)
One must adopt internal coordinates to eliminate rota-tional and translational modes from the peripheral atom de-grees of freedom. The transformation to internal coordinatesis important because the Karush-Kuhn-Tucker matrix is sin-gular when rotations and translations remain in the rangespace. Also the generalized inverse72 is not easily identifiedwhen there is inter-mixing between internal, rotational, andtranslational modes. Separating internal modes from the nullspace is difficult here because the transition and reactant stateshave different geometries and therefore different principleaxes of inertia. Therefore, we were unable to make both ge-ometries simultaneously satisfy the Eckart conditions.73 Werecommend a basis of orthonormalized internal vectors tokeep the analysis straightforward.
Small errors in steps occur due to the linearized con-straint function, so after each step with a nonzero ��E‡ itis advisable to refine each step several times with ��E‡ = 0.These refinement steps can be interpreted as a correction dueto imperfect optimization from the previous iteration. Also,prior to each step, we recommend to choose ��E‡ such thatthe linear constraint term is much larger than the quadraticconstraint term (both the linear and quadratic terms inEq. (16)). A nonlinear version of the algorithm can also beimplemented without additional electronic structure calcula-tions, which we outline in Appendix A. The nonlinear algo-rithm allows larger step sizes in activation energy. All of ourresults in Sec. IV are from the nonlinear version of this algo-rithm.
The proposed SQP framework is actually quite versatile– properties of amorphous catalysts other than reactivity canbe studied by simply changing the constraint function andthe minimization objective. First, we note that the �E‡ andEsite need not correspond to the reactant and transition statesfor a single elementary step. It can instead be applied us-ing the rate determining transition state and most abundantintermediate,74, 75 i.e., to the transition state and intermediateswith the most significant degrees of rate control.75 It should bepossible, when multiple steps exert a significant degree of ratecontrol, to incorporate multiple activation energy constraintsand generate a minimum Esite vs. �E
‡1, �E
‡2 manifold. The
structural differences that lead to different selectivities canbe probed by adiabatically following two transition states andconstraining the difference of their activation energies. The al-gorithm would then generate a minimum Esite vs. �E
‡1−�E
‡2
curve where �E‡1−�E
‡2 corresponds to the logarithm of the
ratio of rates for the two competing reactions. Finally, theSQP algorithm can be used to understand the structural dif-ferences between strong and weak Lewis acid sites in amor-phous silica-alumina by using the binding energy to a probeLewis base as a constraint.
III. ALGORITHM IMPLEMENTATION
Here, we briefly describe the sequential quadratic pro-gramming algorithm implementation. The steps are asfollows:
0. Optimize the reactant and transition state geometrieswith no constraint on �E‡. The gradients of theinitial configurations should have the form gA
i = g‡i= gA
p = 0 and g‡p �= 0. Any number of transition statesearch algorithms can be used for this initial step,e.g., dimer method,76, 77 PRFO method,78 or eigenvectorfollowing.79
1. Compute the energy, gradient, and Hessian of both thereactant and transition states.
2. Calculate gAred , HA
red , g‡red , and H‡red using expressions
(7), (8), (11), and (12) respectively.3. Choose the desired step, ��E‡, in activation energy.4. Determine �xp and then calculate �xA
i and �x‡i usingexpressions (20), (21), (3), and (4).
5. Update the reactant and transition state coordinates andrecalculate the energies, gradients, and Hessian matri-ces. If gA
i �= 0 or g‡i �= 0, a corrector step should betaken. For a corrector step, set ��E‡ = 0 and repeatsteps (1), (2), (4), and (5) before returning to step (1)with a nonzero ��E‡.
A flow chart of the algorithm iterations is shown inFigure 3.
At each step, one should calculate the energy of both thereactant and transition states on the reduced landscape usingexpressions (5) and (9). An internal check is that the energyof the reduced landscape should be equal to the energy of
FIG. 3. The SQP algorithm uses ab initio gradients and second derivativesof the energy to systematically generate low energy active sites with suc-cessively lower or higher activation energies. At each activation energy, theperipheral atoms are properly constrained to mimic the solid environmentaround an active site.
Downloaded 10 Oct 2013 to 137.99.26.43. This article is copyrighted as indicated in the abstract. Reuse of AIP content is subject to the terms at: http://jcp.aip.org/about/rights_and_permissions
204105-5 Goldsmith et al. J. Chem. Phys. 138, 204105 (2013)
the full landscape. Also, one can check that gAred is parallel
to �gred , which satisfies the Lagrange multiplier constrainton the change in activation energy. In the SQP algorithm im-plementation, we did not use Hessian updates. We outlinethe cost of generating the results using this SQP approach inthe supplementary material.85 Besides choosing a larger stepsize, to further increase computational efficiency one couldimplement D-BFGS,80 and Bofill updates,81 or potentially re-formulate the algorithm using conjugate gradient.82 Note thatcorrector steps on the RPES are likely to be very small. There-fore, one should use a modified Bofill update for the transitionstate because the symmetric rank 1 (Murtagh-Sargent) updateis prone to error for small steps.65
IV. RESULTS
The SQP algorithm is first illustrated for an empirical va-lence bond model energy landscape with one periphery coor-dinate and one interior coordinate. Next, the SQP algorithm isused to model an off-pathway kinetic trap in olefin metathesisby Mo on amorphous SiO2. We then return to a more com-plicated model energy landscape to understand how physicalcharacteristics of the potential energy surface can cause theSQP algorithm to terminate.
A. Empirical valence bond model energy landscape
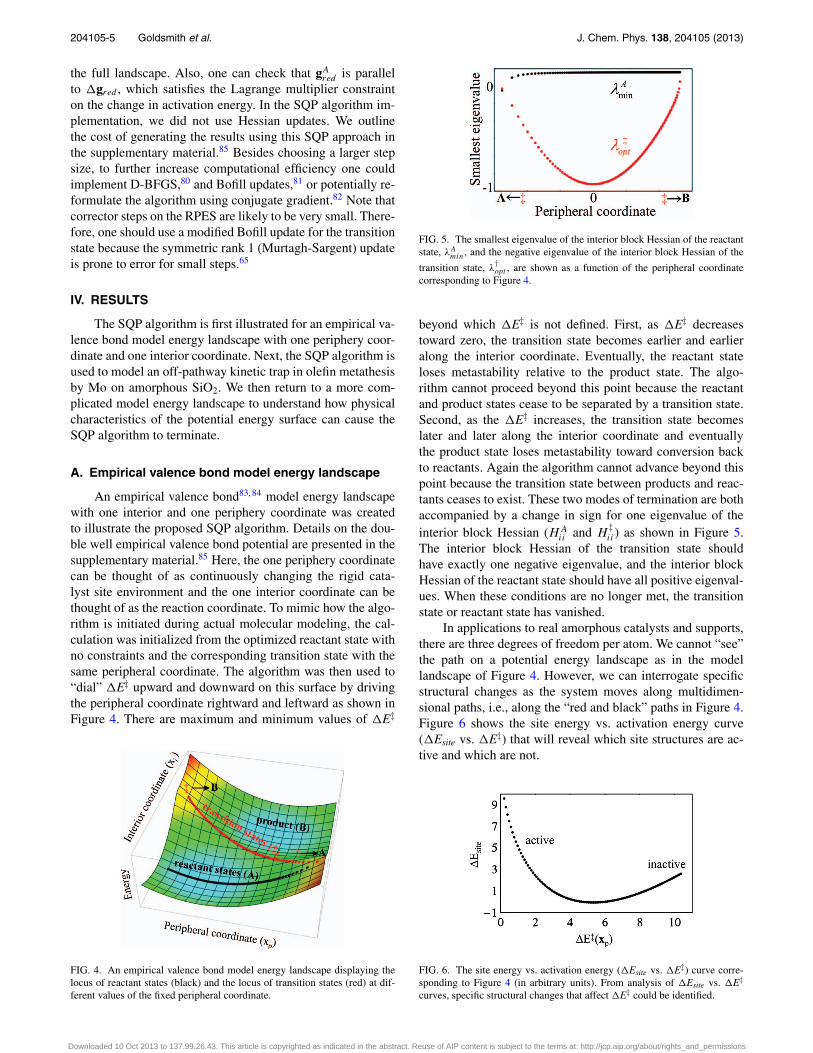
An empirical valence bond83, 84 model energy landscapewith one interior and one periphery coordinate was createdto illustrate the proposed SQP algorithm. Details on the dou-ble well empirical valence bond potential are presented in thesupplementary material.85 Here, the one periphery coordinatecan be thought of as continuously changing the rigid cata-lyst site environment and the one interior coordinate can bethought of as the reaction coordinate. To mimic how the algo-rithm is initiated during actual molecular modeling, the cal-culation was initialized from the optimized reactant state withno constraints and the corresponding transition state with thesame peripheral coordinate. The algorithm was then used to“dial” �E‡ upward and downward on this surface by drivingthe peripheral coordinate rightward and leftward as shown inFigure 4. There are maximum and minimum values of �E‡
FIG. 4. An empirical valence bond model energy landscape displaying thelocus of reactant states (black) and the locus of transition states (red) at dif-ferent values of the fixed peripheral coordinate.
FIG. 5. The smallest eigenvalue of the interior block Hessian of the reactantstate, λA
min, and the negative eigenvalue of the interior block Hessian of the
transition state, λ†opt , are shown as a function of the peripheral coordinate
corresponding to Figure 4.
beyond which �E‡ is not defined. First, as �E‡ decreasestoward zero, the transition state becomes earlier and earlieralong the interior coordinate. Eventually, the reactant stateloses metastability relative to the product state. The algo-rithm cannot proceed beyond this point because the reactantand product states cease to be separated by a transition state.Second, as the �E‡ increases, the transition state becomeslater and later along the interior coordinate and eventuallythe product state loses metastability toward conversion backto reactants. Again the algorithm cannot advance beyond thispoint because the transition state between products and reac-tants ceases to exist. These two modes of termination are bothaccompanied by a change in sign for one eigenvalue of theinterior block Hessian (HA
ii and H‡ii) as shown in Figure 5.
The interior block Hessian of the transition state shouldhave exactly one negative eigenvalue, and the interior blockHessian of the reactant state should have all positive eigenval-ues. When these conditions are no longer met, the transitionstate or reactant state has vanished.
In applications to real amorphous catalysts and supports,there are three degrees of freedom per atom. We cannot “see”the path on a potential energy landscape as in the modellandscape of Figure 4. However, we can interrogate specificstructural changes as the system moves along multidimen-sional paths, i.e., along the “red and black” paths in Figure 4.Figure 6 shows the site energy vs. activation energy curve(�Esite vs. �E‡) that will reveal which site structures are ac-tive and which are not.
FIG. 6. The site energy vs. activation energy (�Esite vs. �E‡) curve corre-sponding to Figure 4 (in arbitrary units). From analysis of �Esite vs. �E‡
curves, specific structural changes that affect �E‡ could be identified.
Downloaded 10 Oct 2013 to 137.99.26.43. This article is copyrighted as indicated in the abstract. Reuse of AIP content is subject to the terms at: http://jcp.aip.org/about/rights_and_permissions

204105-6 Goldsmith et al. J. Chem. Phys. 138, 204105 (2013)
FIG. 7. A six-membered ring Mo/SiO2 cluster model, terminated with basis set deficient fluorine atoms, was used to study an off-pathway kinetic trap in ethenemetathesis.
B. Off-pathway intermediate formation in ethenemetathesis by isolated Mo sites on amorphous SiO2
We apply the SQP algorithm to two different cluster mod-els representing an off-pathway intermediate during olefinmetathesis by isolated Mo sites on amorphous SiO2. The for-mation of the off-pathway intermediate involves a metallacy-cle rotation from a trigonal bipyramidal geometry to a morestable, but inactive, square pyramidal geometry. This exam-ple, using ethene as a model olefin, is based on previouswork by Handzlik.34 To model the distribution of site envi-ronments, Handzlik34 used ten cluster models, all carved fromβ-cristobalite and selected to give various degrees of dehy-droxylation and ring strain. His calculations used a two-layerOur own N-layered Integrated molecular Orbital and molec-ular Mechanics (ONIOM) partitioning scheme87 with 49 or35 Si atoms. We use much smaller cluster models with twoSi atoms as shown in Figures 7 and 9. The cluster models areterminated by basis set deficient fluorine atoms in an effortto mimic the size of oxygen and the electronegativity in anextended silica framework. Here, we use the hybrid B3LYPfunctional,88, 89 the LANL2DZ basis set/effective core poten-tial on the non-fluorine atoms (the same model chemistry usedby Handzlik34),90 and the intentionally deficient 6-31G ba-sis set for the fluorine atoms. We chose the 6-31G basis setfor the fluorine atoms to match the deprotonation energy ofHOSiF3 to the deprotonation energy of silsesquioxane (seeAppendix B for details). Other studies have also terminatedcluster models with fluorine atoms91 or pseudoatoms92 in at-tempts to mimic the size of oxygen and the electronic proper-ties at the cluster periphery.
1. Six-membered ring cluster
The formation of the off-pathway intermediate was firststudied using the cluster model shown in Figure 7. For thisshown cluster model, the four fluorine atoms were designatedas the peripheral atoms. For SQP calculations, the step size inactivation energy, ��E‡, was set to 1 × 10⁻⁴ Ha per iteration.The change in trigonal bipyramidal site energy, �Esite, is ref-erenced to the minimum site energy. The SQP algorithm gen-erated low energy Mo/SiO2 trigonal bipyramidal sites with an�E‡ range between 45 and 50 kJ mol−1 and with �Esite upto 5 kJ mol−1 as seen in Figure 8. Handzlik34 reported barrierheights of approximately 46, 47, and 51 kJ mol−1 for three ofhis ten models. The determined �E‡ for the minimum energy
site of our cluster model is approximately 48 kJ mol−1, sim-ilar to Handzlik’s34 larger models. Using the SQP algorithm,we can calculate an average rate over the distribution of lowenergy catalyst sites. We approximate the distribution of sites,ρ(s), as Boltzmann distributed,
ρ(s) ≈ exp[−β�Esite(s)]∫exp[−β�Esite(s)]ds
, (22)
where contributions to ρ(s) come primarily from the low-est energy sites. Here, s is the arc length along the pathtraveled.93, 94 The reaction rate at each catalyst site can be ap-proximated as
k(s) ≈ k0 exp[−β�E‡(s)], (23)
where k0 is an approximately constant prefactor. The averagerate can be approximated as
〈k(s)〉 =∫
ρ(s)k(s) ds. (24)
If we approximate that the distribution of sites is Boltzmann,then the sites that contribute the most to the rate are whered�Esite/d�E‡ = −1. This point corresponds to the activa-tion energy that maximizes the integrand in expression (24).From Figure 8, this corresponds to sites with an �E‡ around47 kJ mol−1, near the minimum energy site. Numerically av-eraging the rate and taking the ratio with the rate for the min-imum energy site, kmin, gives 〈k〉/kmin ≈ 1.2 at 310 K. Here,the effect of inhomogeneity of surface sites is small becausethe six-membered ring is not easily strained. As shown inthe next example, this effect would become more dramatic asthe energy well depicted in Figure 8 widens.
FIG. 8. The �Esite vs. �E‡ curve for metallacycle rotation using a six-membered ring Mo/SiO2 cluster model. The sites that contribute the most tothe rate assuming a Boltzmann distribution are where d�Esite/d�E‡ = −1.
Downloaded 10 Oct 2013 to 137.99.26.43. This article is copyrighted as indicated in the abstract. Reuse of AIP content is subject to the terms at: http://jcp.aip.org/about/rights_and_permissions

204105-7 Goldsmith et al. J. Chem. Phys. 138, 204105 (2013)
FIG. 9. A minimal Mo/SiO2 cluster model, terminated with basis set deficient fluorine atoms, was used to study an off-pathway kinetic trap in ethene metathesis.
2. Minimal cluster model
Our objective is to use cluster models that make mini-mal structural assumptions about the local structure aroundthe amorphous material around the catalyst site. By a min-imal model, we therefore mean a model that includes onlythose structural elements which can be justified from EXAFSor nuclear magnetic resonance evidence. For example, themodel of Mo on silica in Figure 9 makes no assumptionsabout ring size, hydroxyl group density and locations, andother specific surface topologies. We prefer minimal modelsto models that make more specific and long ranged structuralassumptions because reactivities of the latter models neces-sarily reflect the specific structural assumptions. In this way,specific long range structural assumptions of large models canactually limit the ability to discover how the most proximal(and likely most important) structural features impart inho-mogeneity to the properties of active sites.
The �Esite vs. �E‡ curve is shown in Figure 10.The incremental change in activation energy was againset to 1 × 10⁻⁴ Ha per iteration and the six fluorineatoms were designated as the peripheral atoms. Here, siteswith an �E‡ range of 28–72 kJ mol−1 were generated.The range of activation energies computed is substantiallylarger than what Handzlik’s34 ten larger models represented(46–51 kJ mol−1).34 Two reactant minima exist for this sys-tem, and are differentiated by both the orientation of the fluo-rine atoms and the Si–Si atom distance (SQP algorithm initi-ated from these two separate minima give the black and whitepoints in Figure 10). Here, the �E‡ for the minimum energy
FIG. 10. The �Esite vs. �E‡ curve for metallacycle rotation using a minimalMo/SiO2 cluster model. Two minima were generated for this system, and thetwo corresponding SQP curves are differentiated graphically by the data pointtype. Points to the left of the tick mark had a negative eigenvalue presentin HA
red\ �gred . The sites that contribute the most to the rate assuming aBoltzmann distribution are where d�Esite/d�E‡ = −1.
site is near 46 kJ mol−1, similar to the six-membered ringcluster model and Handzlik’s34 models. Toward decreasingactivation energy, the path followed obtains a negative eigen-value in HA
red . These points are to the left of the tick markpresent in Figure 10. The negative eigenvalue in HA
red often re-mains present even when the local constraint vector on activa-tion energy, �gred , is projected out. We denote this projectedHessian as HA
red \ �gred . The presence of a negative eigen-value in HA
red \ �gred could indicate a ridge.95, 96 Thus, wesought lower energy sites at these particular activation ener-gies below 44 kJ mol−1. However, steepest descent steps per-pendicular to �gred did not generate lower energy sites. Addi-tionally, line searches along the eigenvectors of HA
red\ �gred ,including that with a negative eigenvalue, did not generatelower energy sites. Numerous tests described in the supple-mentary material85 lead us to believe that the negative eigen-value in HA
red\ �gred results from propagation of force con-stant errors through the Schur complement and not an actualridge instability. Further discussion of ridges can be found inSec. IV C.
The sites that contribute the most to the integrand whencomputing the average rate, where d�Esite/d�E‡ = −1, arenear 34 kJ mol−1. Compared to that of the lowest energy cat-alyst site (which is typically the only structure computed),these catalyst site structures have an activation barrier that is12 kJ mol−1 lower and a site energy that is 7 kJ mol−1 higher.For this minimal model, we compute 〈k〉/ kmin ≈20 at 310 K!The distribution of likely catalyst sites is much broader forthis flexible system, compared to the six-membered ring clus-ter above, due to the smaller energetic penalty for perturbingthe periphery atom locations. This illustrates the pronouncedeffect that accounting for site inhomogeneity can have on thecomputed rate.
Other chemical and structural information can also beelucidated from monitoring the reaction energy, �Erxn, vs.�E‡ as shown in Figure 11 and the Si–Si atom distance, rSi–Si,vs. �E‡ as shown in Figure 12. In Figure 11, we observe an in-verse Brønsted–Evans–Polanyi relationship over the distribu-tion of catalyst sites generated. The reaction energy changesroughly 50 kJ mol−1 total, and the least active sites have themost exothermic reaction energies. On the other hand, thesites with the lowest activation barriers give an endothermicreaction. In Figure 12, we monitor the Si–Si atom distance asa function of �E‡. Over the 44 kJ mol−1 activation energyrange, the optimal distance between the two Si atoms changesby almost 2 Å. Using this simple geometrical descriptor, itis observed that stretched catalyst sites are less active thancompressed catalyst sites toward metallacyle rotation. By
Downloaded 10 Oct 2013 to 137.99.26.43. This article is copyrighted as indicated in the abstract. Reuse of AIP content is subject to the terms at: http://jcp.aip.org/about/rights_and_permissions

204105-8 Goldsmith et al. J. Chem. Phys. 138, 204105 (2013)
FIG. 11. The reaction energy (�Erxn) vs. �E‡ for metallacycle rotation us-ing a minimal Mo/SiO2 cluster model. Toward decreasing activation energy,the product state is beginning to lose metastability toward conversion back tothe reactants.
referring to Figure 11, we infer that stretched sites pre-fer square pyramidal geometry, while sites with compressedSi–Si distances prefer the trigonal bipyramidal geometry.
Although we have advocated minimal models, it is im-portant to remember that real sites are embedded in the solidmatrix, not isolated. The surrounding environment can ex-ert both electrostatic and mechanical stresses on an embed-ded site. For example, it is known that small cluster modelsof zeolites have different reactivity than larger clusters thatinclude more of the extended structure.86 Embedding meth-ods like ONIOM87 have been used to embed small quantummechanically modeled parts within larger structures, e.g., ac-tive sites in enzymes and zeolites. The ONIOM strategy isnot applicable for amorphous supports, because the extendedstructure is unknown. It is important that an appropriate biaspotential be constructed from known characteristics of the ex-tended solid matrix. However, in the case of an amorphousmatrix, there are often statistical properties, e.g., pair correla-tion functions, from which a structural bias potential can beconstructed. In the simplest approximation, we can include abias only on pairwise distances between atoms, e.g., by us-ing the reversible work theorem.97 We constructed a bias po-tential based on the reversible work theorem and found thatbiasing had essentially no effect. Therefore, the results pre-sented in this work omit the embedding bias effects. We an-ticipate however, that embedding may be important for somereactions. Therefore, the development of an embedding biasbased on both bond distance and bond angle statistics of theamorphous matrix remains an important direction for futurework.
FIG. 12. The distance between the two Si atoms (rSi–Si) vs. �E‡ for metal-lacycle rotation using a minimal Mo/SiO2 cluster model.
C. A diagnostic example
Unfortunately, the algorithm sometimes terminates unex-pectedly. We have discovered four scenarios that cause termi-nation.
(1) Loss of metastability in the product or reactant state.This should happen and does not represent algorithmfailure. Specifically, some sites can only be perturbedthrough a finite range of activation energies before thereactant or product state merges with the transition stateand then both cease to exist. This mode of termination isoccurring at the left end of Figure 11.
(2) The transition state jumps discontinuously to an ear-lier or later location along pathway. The imaginary fre-quency (in the H
‡ii matrix) can become real, indicating
that the transition state location has moved. Again, thisrepresents a mechanistic change and not algorithm fail-ure. The new location of the transition state must be re-identified so that SQP iterations can continue. Unlike inregular SQP steps, which must only reoptimize a per-turbed transition state, a robust transition state search al-gorithm is needed for locating the transition state after ajump.
(3) At local minima or maxima in the �Esite vs. �E‡ re-lationship, (�gred )T (HA
red )−1�gred vanishes. This oc-curs when �gred becomes its own conjugate through(HA
red )−1.(4) The path along the direction of (HA
red )−1�gred bifur-cates. The SQP algorithm has difficulty navigating thepath bifurcation toward a new stable configuration. Tosurmount this issue, we recommend taking steepest de-scent steps perpendicular to �gred down the ridge, andthen re-starting the SQP algorithm.
Figure 13 illustrates points where the SQP algorithmwould have type-1, type-2, and type-3 termination on a modelenergy landscape. Figure 14 depicts a type-4 termination at abifurcation point.
FIG. 13. A model energy landscape showing the locus of reactant states(black) and the locus of transition states (red) at different fixed peripheralatom positions. Type-1 termination occurs from a loss of metastability in theproduct or reactant state, type-2 termination occurs when the transition statejumps discontinuously along the interior coordinate, and type-3 terminationoccurs when (�gred )T (HA
red )−1�gred vanishes.
Downloaded 10 Oct 2013 to 137.99.26.43. This article is copyrighted as indicated in the abstract. Reuse of AIP content is subject to the terms at: http://jcp.aip.org/about/rights_and_permissions

204105-9 Goldsmith et al. J. Chem. Phys. 138, 204105 (2013)
FIG. 14. A schematic depicting a type-4 termination caused by a bifurcation.
V. CONCLUSION
We developed a systematic ab initio SQP algorithm tofacilitate the modeling of isolated active sites on amorphoussupports using cluster models. The SQP algorithm uses abinitio gradients and second derivatives of the energy to sys-tematically generate low energy active sites with successivelylower or higher activation energies. At each activation en-ergy, the peripheral atoms are properly constrained to mimicthe rigid environment around a solid active site. The algo-rithm was illustrated on an empirical valence bond model en-ergy landscape. The SQP algorithm was then demonstratedon isolated Mo/SiO2 catalyst site models. A calculation of theaverage rate shows that accounting for the inhomogeneousdistribution of catalyst sites on amorphous supports cansignificantly change computed rates. We also showed howstructure-reactivity relationships can be extracted from SQPresults, e.g., stretched Mo/SiO2 were computed to be less ac-tive toward metallacycle rotation than compressed sites. Wethen discussed how physical characteristics of the potentialenergy surface can cause the SQP algorithm to terminate. Thenew SQP approach should enable the systematic discoveryof structure-property relationships for isolated catalysts onamorphous supports.
ACKNOWLEDGMENTS
This work was funded by the Catalysis Science Initia-tive of the (U.S.) Department of Energy (DOE), Basic En-ergy Sciences (DE-FG02-03ER15467). B.R.G. acknowledgesthe PIRE-ECCI program (NSF-OISE 0530268) for a graduatefellowship. Daniel Bean was supported by a summer under-graduate research fellowship (SURF). The authors thank GregMills, Anthony Fong, Brad Chmelka, Peter Ford, and Susan-nah Scott for stimulating discussions.
APPENDIX A: SEQUENTIAL NONLINEARPROGRAMMING ALGORITHM
Each step involves optimization with a single constrainton the activation energy change, ��E‡. Therefore, the non-linear contributions to ��E‡ can be included with minimalextra computation as shown in this appendix. In practice, werecommend using the nonlinear algorithm, because it allows
for larger steps with the same computational cost. The non-linear version is
min�xp (�xp)T gAred + 1
2(�xp)T HA
red�xp
subject to (�xp)T �gred + 1
2(�xp)T �Hred�xp = ��E‡,
(A1)
where
�gred = g‡red − gAred (A2)
and
�Hred = H‡red − HA
red . (A3)
Using the Lagrange multipliers method, with multiplier λ forthe constraint on the activation energy increment, we cansolve expression (A1) to obtain the step �xp and an expres-sion for λ
�xp = −[HA
red − λ�Hred
]−1(gA
red − λ�gred
)(A4)
and
��E‡ = −(gA
red − λ�gred
)[HA
red − λ�Hred
]−1�gred
+ 1
2
(gA
red − λ�gred
)[HA
red − λ�Hred
]−1
�Hred
[HA
red − λ�Hred
]−1(gA
red − λ�gred
).
(A5)
The value for λ must be solved iteratively using expression(A5) for a desired ��E‡. A linearized approximation for λ,the result in Eq. (21), can be used as a starting value in theiterative procedure. Once the value for λ is found, the desiredstep in �xp can be taken using expression (A4).
FIG. 15. The structures of both silsesquioxane and HOSiF3 along with thecorresponding structures after a single deprotonation. The objective is tomatch the HOSiF3 deprotonation energy, �Edeprotonation, to the silsesquiox-ane deprotonation energy, �Etarget.
Downloaded 10 Oct 2013 to 137.99.26.43. This article is copyrighted as indicated in the abstract. Reuse of AIP content is subject to the terms at: http://jcp.aip.org/about/rights_and_permissions
204105-10 Goldsmith et al. J. Chem. Phys. 138, 204105 (2013)
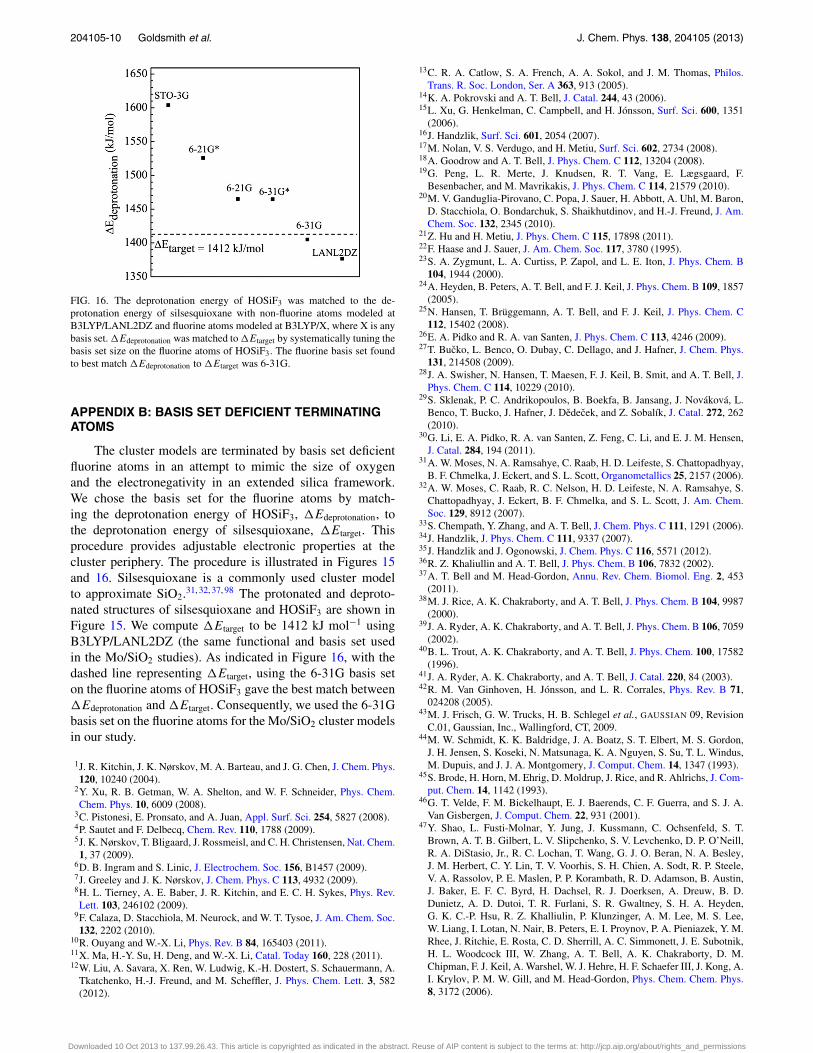
FIG. 16. The deprotonation energy of HOSiF3 was matched to the de-protonation energy of silsesquioxane with non-fluorine atoms modeled atB3LYP/LANL2DZ and fluorine atoms modeled at B3LYP/X, where X is anybasis set. �Edeprotonation was matched to �Etarget by systematically tuning thebasis set size on the fluorine atoms of HOSiF3. The fluorine basis set foundto best match �Edeprotonation to �Etarget was 6-31G.
APPENDIX B: BASIS SET DEFICIENT TERMINATINGATOMS
The cluster models are terminated by basis set deficientfluorine atoms in an attempt to mimic the size of oxygenand the electronegativity in an extended silica framework.We chose the basis set for the fluorine atoms by match-ing the deprotonation energy of HOSiF3, �Edeprotonation, tothe deprotonation energy of silsesquioxane, �Etarget. Thisprocedure provides adjustable electronic properties at thecluster periphery. The procedure is illustrated in Figures 15and 16. Silsesquioxane is a commonly used cluster modelto approximate SiO2.31, 32, 37, 98 The protonated and deproto-nated structures of silsesquioxane and HOSiF3 are shown inFigure 15. We compute �Etarget to be 1412 kJ mol−1 usingB3LYP/LANL2DZ (the same functional and basis set usedin the Mo/SiO2 studies). As indicated in Figure 16, with thedashed line representing �Etarget, using the 6-31G basis seton the fluorine atoms of HOSiF3 gave the best match between�Edeprotonation and �Etarget. Consequently, we used the 6-31Gbasis set on the fluorine atoms for the Mo/SiO2 cluster modelsin our study.
1J. R. Kitchin, J. K. Nørskov, M. A. Barteau, and J. G. Chen, J. Chem. Phys.120, 10240 (2004).
2Y. Xu, R. B. Getman, W. A. Shelton, and W. F. Schneider, Phys. Chem.Chem. Phys. 10, 6009 (2008).
3C. Pistonesi, E. Pronsato, and A. Juan, Appl. Surf. Sci. 254, 5827 (2008).4P. Sautet and F. Delbecq, Chem. Rev. 110, 1788 (2009).5J. K. Nørskov, T. Bligaard, J. Rossmeisl, and C. H. Christensen, Nat. Chem.1, 37 (2009).
6D. B. Ingram and S. Linic, J. Electrochem. Soc. 156, B1457 (2009).7J. Greeley and J. K. Nørskov, J. Chem. Phys. C 113, 4932 (2009).8H. L. Tierney, A. E. Baber, J. R. Kitchin, and E. C. H. Sykes, Phys. Rev.Lett. 103, 246102 (2009).
9F. Calaza, D. Stacchiola, M. Neurock, and W. T. Tysoe, J. Am. Chem. Soc.132, 2202 (2010).
10R. Ouyang and W.-X. Li, Phys. Rev. B 84, 165403 (2011).11X. Ma, H.-Y. Su, H. Deng, and W.-X. Li, Catal. Today 160, 228 (2011).12W. Liu, A. Savara, X. Ren, W. Ludwig, K.-H. Dostert, S. Schauermann, A.
Tkatchenko, H.-J. Freund, and M. Scheffler, J. Phys. Chem. Lett. 3, 582(2012).
13C. R. A. Catlow, S. A. French, A. A. Sokol, and J. M. Thomas, Philos.Trans. R. Soc. London, Ser. A 363, 913 (2005).
14K. A. Pokrovski and A. T. Bell, J. Catal. 244, 43 (2006).15L. Xu, G. Henkelman, C. Campbell, and H. Jónsson, Surf. Sci. 600, 1351
(2006).16J. Handzlik, Surf. Sci. 601, 2054 (2007).17M. Nolan, V. S. Verdugo, and H. Metiu, Surf. Sci. 602, 2734 (2008).18A. Goodrow and A. T. Bell, J. Phys. Chem. C 112, 13204 (2008).19G. Peng, L. R. Merte, J. Knudsen, R. T. Vang, E. Lægsgaard, F.
Besenbacher, and M. Mavrikakis, J. Phys. Chem. C 114, 21579 (2010).20M. V. Ganduglia-Pirovano, C. Popa, J. Sauer, H. Abbott, A. Uhl, M. Baron,
D. Stacchiola, O. Bondarchuk, S. Shaikhutdinov, and H.-J. Freund, J. Am.Chem. Soc. 132, 2345 (2010).
21Z. Hu and H. Metiu, J. Phys. Chem. C 115, 17898 (2011).22F. Haase and J. Sauer, J. Am. Chem. Soc. 117, 3780 (1995).23S. A. Zygmunt, L. A. Curtiss, P. Zapol, and L. E. Iton, J. Phys. Chem. B
104, 1944 (2000).24A. Heyden, B. Peters, A. T. Bell, and F. J. Keil, J. Phys. Chem. B 109, 1857
(2005).25N. Hansen, T. Brüggemann, A. T. Bell, and F. J. Keil, J. Phys. Chem. C
112, 15402 (2008).26E. A. Pidko and R. A. van Santen, J. Phys. Chem. C 113, 4246 (2009).27T. Bucko, L. Benco, O. Dubay, C. Dellago, and J. Hafner, J. Chem. Phys.
131, 214508 (2009).28J. A. Swisher, N. Hansen, T. Maesen, F. J. Keil, B. Smit, and A. T. Bell, J.
Phys. Chem. C 114, 10229 (2010).29S. Sklenak, P. C. Andrikopoulos, B. Boekfa, B. Jansang, J. Nováková, L.
Benco, T. Bucko, J. Hafner, J. Dedecek, and Z. Sobalík, J. Catal. 272, 262(2010).
30G. Li, E. A. Pidko, R. A. van Santen, Z. Feng, C. Li, and E. J. M. Hensen,J. Catal. 284, 194 (2011).
31A. W. Moses, N. A. Ramsahye, C. Raab, H. D. Leifeste, S. Chattopadhyay,B. F. Chmelka, J. Eckert, and S. L. Scott, Organometallics 25, 2157 (2006).
32A. W. Moses, C. Raab, R. C. Nelson, H. D. Leifeste, N. A. Ramsahye, S.Chattopadhyay, J. Eckert, B. F. Chmelka, and S. L. Scott, J. Am. Chem.Soc. 129, 8912 (2007).
33S. Chempath, Y. Zhang, and A. T. Bell, J. Chem. Phys. C 111, 1291 (2006).34J. Handzlik, J. Phys. Chem. C 111, 9337 (2007).35J. Handzlik and J. Ogonowski, J. Chem. Phys. C 116, 5571 (2012).36R. Z. Khaliullin and A. T. Bell, J. Phys. Chem. B 106, 7832 (2002).37A. T. Bell and M. Head-Gordon, Annu. Rev. Chem. Biomol. Eng. 2, 453
(2011).38M. J. Rice, A. K. Chakraborty, and A. T. Bell, J. Phys. Chem. B 104, 9987
(2000).39J. A. Ryder, A. K. Chakraborty, and A. T. Bell, J. Phys. Chem. B 106, 7059
(2002).40B. L. Trout, A. K. Chakraborty, and A. T. Bell, J. Phys. Chem. 100, 17582
(1996).41J. A. Ryder, A. K. Chakraborty, and A. T. Bell, J. Catal. 220, 84 (2003).42R. M. Van Ginhoven, H. Jónsson, and L. R. Corrales, Phys. Rev. B 71,
024208 (2005).43M. J. Frisch, G. W. Trucks, H. B. Schlegel et al., GAUSSIAN 09, Revision
C.01, Gaussian, Inc., Wallingford, CT, 2009.44M. W. Schmidt, K. K. Baldridge, J. A. Boatz, S. T. Elbert, M. S. Gordon,
J. H. Jensen, S. Koseki, N. Matsunaga, K. A. Nguyen, S. Su, T. L. Windus,M. Dupuis, and J. J. A. Montgomery, J. Comput. Chem. 14, 1347 (1993).
45S. Brode, H. Horn, M. Ehrig, D. Moldrup, J. Rice, and R. Ahlrichs, J. Com-put. Chem. 14, 1142 (1993).
46G. T. Velde, F. M. Bickelhaupt, E. J. Baerends, C. F. Guerra, and S. J. A.Van Gisbergen, J. Comput. Chem. 22, 931 (2001).
47Y. Shao, L. Fusti-Molnar, Y. Jung, J. Kussmann, C. Ochsenfeld, S. T.Brown, A. T. B. Gilbert, L. V. Slipchenko, S. V. Levchenko, D. P. O’Neill,R. A. DiStasio, Jr., R. C. Lochan, T. Wang, G. J. O. Beran, N. A. Besley,J. M. Herbert, C. Y. Lin, T. V. Voorhis, S. H. Chien, A. Sodt, R. P. Steele,V. A. Rassolov, P. E. Maslen, P. P. Korambath, R. D. Adamson, B. Austin,J. Baker, E. F. C. Byrd, H. Dachsel, R. J. Doerksen, A. Dreuw, B. D.Dunietz, A. D. Dutoi, T. R. Furlani, S. R. Gwaltney, S. H. A. Heyden,G. K. C.-P. Hsu, R. Z. Khalliulin, P. Klunzinger, A. M. Lee, M. S. Lee,W. Liang, I. Lotan, N. Nair, B. Peters, E. I. Proynov, P. A. Pieniazek, Y. M.Rhee, J. Ritchie, E. Rosta, C. D. Sherrill, A. C. Simmonett, J. E. Subotnik,H. L. Woodcock III, W. Zhang, A. T. Bell, A. K. Chakraborty, D. M.Chipman, F. J. Keil, A. Warshel, W. J. Hehre, H. F. Schaefer III, J. Kong, A.I. Krylov, P. M. W. Gill, and M. Head-Gordon, Phys. Chem. Chem. Phys.8, 3172 (2006).
Downloaded 10 Oct 2013 to 137.99.26.43. This article is copyrighted as indicated in the abstract. Reuse of AIP content is subject to the terms at: http://jcp.aip.org/about/rights_and_permissions

204105-11 Goldsmith et al. J. Chem. Phys. 138, 204105 (2013)
48G. Kresse and J. Furthmüller, Comput. Mater. Sci. 6, 15 (1996).49G. Kresse and J. Hafner, Phys. Rev. B 47, 558 (1993).50G. Kresse and J. Furthmüller, Phys. Rev. B 54, 11169 (1996).51T. Helgaker, H. Jensen, P. Jørgensen, J. Olsen, K. Ruud, H. Agren, A. Auer,
K. Bak, V. Bakken, O. Christiansen, S. Corian, P. Dahle, E. Dalskov, T.Enevoldsen, B. Fernandez, C. Hattig, K. Hald, A. Halkier, H. Heiberg, H.Hettema, D. Jonsson, S. Kirpekan, R. Kobayashi, H. Koch, K. Mikkelsen,P. Norman, M. Packer, T. Pedersen, T. Ruden, A. Sanchez, T. Saue,S. Sauer, B. Schimmelpfennig, K. O. Sylvester-Hvid, P. Taylor, andO. Vahtras, DALTON, a molecular electronic structure program, Release 1.22001.
52S. J. Clark, M. D. Segall, C. J. Pickard, P. J. Hasnip, M. J. Probert, K.Refson, and M. C. Payne, Z. Kristallogr. 220, 567 (2005).
53HyperChemTM Professional 7.51, Hypercube, Inc., 1115 NW 4th Street,Gainesville, Florida 32601, USA.
54H. Taylor and J. Simons, J. Phys. Chem. 89, 684 (1985).55J. Baker, J. Comput. Chem. 13, 240 (1992).56J. Baker and D. Bergeron, J. Comput. Chem. 14, 1339 (1993).57D.-H. Lu and D. G. Truhlar, J. Chem. Phys. 99, 2723 (1993).58H. B. Schlegel, WIREs Comput. Mol. Sci. 1, 790 (2011).59P. H. M. Budzelaar, J. Comput. Chem. 28, 2226 (2007).60J. B. Brokaw, K. R. Haas, and J.-W. Chu, J. Chem. Theory Comput. 5, 2050
(2009).61F. Jensen, J. Am. Chem. Soc. 114, 1596 (1992).62D. R. Yarkony, J. Phys. Chem. 97, 4407 (1993).63J. M. Anglada and J. M. Bofill, J. Comput. Chem. 18, 992 (1997).64P. Scharfenberg, Chem. Phys. Lett. 79, 115 (1981).65J. M. Bofill and J. M. Anglada, Theor. Chem. Acc. 105, 463 (2001).66S. K. Burger and P. W. Ayers, J. Chem. Theory Comput. 6, 1490
(2010).67S. K. Burger and P. W. Ayers, J. Chem. Phys. 132, 234110
(2010).68W. Quapp, J. Chem. Theory Comput. 2, 385 (2003).69F. Zhang, The Schur Complement and Its Applications (Springer, 2005),
Vol. 4.70J. Nocedal and S. J. Wright, Numerical Optimization (Springer,
2006).71S. K. Burger and W. Yang, J. Chem. Phys. 127, 164107 (2007).72P. Pulay and G. Fogarasi, J. Chem. Phys. 96, 2856 (1992).
73E. B. J. Wilson, J. C. Decius, and P. C. Cross, Molecular Vibrations:The Theory of Infrared and Raman Vibrational Spectra (McGraw-Hill,New York, 1955) (reprinted, Dover, New York, 1980).
74J. R. Murdoch, J. Chem. Educ. 58, 32 (1981).75S. Kozuch and S. Shaik, Acc. Chem. Res. 44, 101 (2011).76G. Henkelman and H. Jónsson, J. Chem. Phys. 111, 7010 (1999).77A. Heyden, A. T. Bell, and F. J. Keil, J. Chem. Phys. 123, 224101 (2005).78A. Banerjee, N. Adams, J. Simons, and R. Shepard, J. Phys. Chem. 89, 52
(1985).79J. Baker, J. Comput. Chem. 7, 385 (1986).80M. Powell and G. Watson, A Fast Algorithm for Nonlinearly Constrained
Optimization Calculations (Springer, Berlin, 1978), Vol. 630.81J. M. Bofill, J. Comput. Chem. 15, 1 (1994).82G. Mills, personal communication (2013).83A. Warshel and R. M. Weiss, J. Am. Chem. Soc. 102, 6218 (1980).84F. Jensen and P.-O. Norrby, Theor. Chem. Acc. 109, 1 (2003).85See supplementary material at http://dx.doi.org/10.1063/1.4807384 for dis-
cussion on the used empirical valence bond model energy landscapes andfor numerical tests checking for ridge instabilities on the generated SQPcurve.
86J. Gomes, P. M. Zimmerman, M. Head-Gordon, and A. T. Bell, J. Phys.Chem. C 116, 15406 (2012).
87M. Svensson, S. Humbel, R. D. J. Froese, T. Matsubara, S. Sieber, and K.Morokuma, J. Phys. Chem. 100, 19357 (1996).
88A. Becke, J. Chem. Phys. 98, 1372 (1993).89P. J. Stephens, F. J. Devlin, C. F. Chabalowski, and M. J. Frisch, J. Phys.
Chem. 98, 11623 (1994).90J. Hay and W. Wadt, J. Chem. Phys. 82, 270 (1985).91Ø. Espelid and K. J. Børve, Catal. Lett. 75, 49 (2001).92M. B. Fleisher, L. O. Golender, and M. V. Shimanskaya, J. Chem. Soc.,
Faraday Trans. 87, 745 (1991).93W. Miller, N. Handy, and J. Adams, J. Chem. Phys. 72, 99 (1980).94D. G. Truhlar and B. C. Garrett, Acc. Chem. Res. 13, 440 (1980).95W. Quapp, J. Mol. Struct. 695, 95 (2004).96W. Quapp, M. Hirsch, and D. Heidrich, Theor. Chem. Acc. 112, 40 (2004).97D. A. McQuarrie, Statistical Mechanics (University Science Books, Sausal-
ito, 2000).98B. Civalleri, E. Garrone, and P. Ugliengo, Chem. Phys. Lett. 299, 443
(1999).
Downloaded 10 Oct 2013 to 137.99.26.43. This article is copyrighted as indicated in the abstract. Reuse of AIP content is subject to the terms at: http://jcp.aip.org/about/rights_and_permissions