Embed Size (px)
Citation preview

CLXXI. THE DETERMINATION OF THEISOELECTRIC AND ISOIONIC POINTS OFHAEMOGLOBIN FROM MEASUREMENTS
OF MEMBRANE POTENTIALS.
BY GILBERT SMITHSON ADAIR AND MURIEL ELAINE ADAIR'.From the Physiological and the Biochemical Laboratories and the Low
Temperature Station, Cambridge.
(Received May 31st, 1934.)
HARDY [1899] showed that the electrical charge of protein particles is negativein alkaline solutions and positive in acid solutions. The isoelectric point may bedefined as the effective concentration or activity of hydrogen ions at which theprotein is uncharged or possesses an equal number of positive and negativecharges. Many of the properties of proteins, including solubility, osmoticpressure and cataphoresis, are correlated with the charge on protein ions and havebeen used in measurements of their isoelectric points, recently reviewed by Pauliand Valko [1933].
The suggestion that the isoelectric point of a protein could be determined bymeasurements of membrane potentials has been made by Loeb [1924], Taylor[1924], Adair [1928] and Henriques [1929], but hitherto this has not been realisedin practice. Loeb showed that acid solutions of gelatin are positive, whereasalkaline solutions are negative, but he was unable to obtain a definite value forthe isoelectric point. The difficulties he encountered were partly due to the factthat gelatin is sparingly soluble at the isoelectric point and partly to the very lowbuffer value of the dilute acids and alkalis he used as dialysates. Taylor usedhaemoglobin and reported that the experiments were unsuccessful on accountof precipitation of the protein at the isoelectric point. His solutions wereacidified by the direct addition of acids. Adair [1928] obtained haemoglobin atthe isoelectric point without precipitation by dialysis against buffer mixturesand stated that the isoelectric point in phosphate buffers is on the acid side of theisoionic point, defined by S0rensen et al. [1927] as the activity of hydrogen ionsat which the protein neither gives off nor takes up hydrogen ions.
According to Henriques [1929] the "Donnan potential" of haemoglobin iszero at PH 5 5, a figure much more acid than the value PH 6-8 determined by themethod of cataphoresis [Michaelis and Davidsohn, 1912]. Theoretical con-clusions based on this work [Bolam, 1932] are of doubtful significance, asHenriques did not determine the equilibrium concentrations of phosphates andbases or the isoionic point of the protein, and the material used, a mixture ofcorpuscles and saponin, dialysed for 24 hours, was probably not strictly com-parable with more highly purified preparations. There is a discrepancy betweenHenriques' experimental data and the results obtained by Adair [1928] and byRoche et al. [1932].
1 Beit Memorial Research Fellow.

ISOELECTRIC AND ISOIONIC POINTS OF HAEMOGLOBIN 1231
The sources of error in measurements of membrane potentials have beenstudied by Adair and Adair [1934], who devised a method adapted for systemswith small potentials. The experiments described in the present communicationshow that it is possible to determine the isoelectric point of a protein by a similarmethod, and by correlating the measurements of membrane potentials withstudies of the distributions of diffusible ions, made by chemical methods, theisoelectric point may be compared with the isoionic point of the protein.
1. Preparation of CO-haemoglobin.Horse CO-haemoglobin was crystallised by a modification of the method of
Ferry [1923], based on the fact that this protein is sparingly soluble at theisoelectric point. The haemoglobin of the sheep, like that of man and of the ox, ishighly soluble at the isoelectric point and is therefore adapted for experimentswhich require a wide range of protein concentrations. In the preparation ofproteins for measurements of isoelectric or isoionic points, a high degree ofpurification is advisable, but impurities must be removed under conditions whichcause minimum changes in the protein molecule. In the present investigation,comparisons of preparations of sheep CO-haemoglobin, made by differentmethods, have been made, in order to reduce the risks of error due to impuritiesand denaturation products.
Method 1. This depends on the use of freshly purified ether and of sodiumchloride to separate haemoglobin from the stroma-proteins and from lipins.Laboratory ether generally contains peroxides which cause methaemoglobinformation; the removal of peroxides can usually be effected by five extractionswith N/10 sodium hydroxide, followed by four extractions with water. Evenwith purified ether, it is necessary to cool the mixture to 00 as soon as possibleand to remove the ether by dialysis, as described below. The disadvantagesattending the use of ether are compensated by a much more complete removal ofstroma-proteins and of lipins than is accomplished by alternative methods basedon the use of alumina cream [Walker and Williamson, 19201, centrifuging orcertain processes of crystallisation.
For the preparation of sheep CO-haemoglobin, defibrinated blood was satur-ated with pure carbon monoxide and cooled for an hour at 00. The plasma-proteins were removed by four centrifugings, 1-5 % NaCl being used to washthe corpuscles. A rubber-tipped glass rod was used to mix the corpuscles adherentto the bottom of the centrifuge-tube with the salt solution. The volume of thecorpuscles was estimated, and for each 100 ml., 30 ml. of distilled water were usedto wash the corpuscles into a flask, where laking was completed by the additionof 30 ml. of purified ether in the course of about 3 minutes' shaking. 13 g. ofNaCl were then added, to shrink the swollen stromata, and the mixture wasshaken until the salt had dissolved. After centrifuging (for about 10 minutes at3000 r.p.m.) the stromata rise to the top in the form of a solid cake, and the clearsolution of haemoglobin can be removed by means of a pipette. If contaminationby stroma proteins occurs, it may be removed by filtration through cotton wool.
The haemoglobin solution was then placed in collodion membranes anddialysed against distilled water at 00, the water being changed about 6 times atintervals of one hour on the first day and at three hour intervals on subsequentdays. Overnight, the membranes were left in a volume of water at least 10 timesas great as the volume of the membrane. In order to concentrate the solutions,the membranes were connected with reservoirs of air or carbon monoxide, undera positive pressure of about 700 mm. Hg. After dialysis against distilled water
79-2

G. S. ADAIR AND M. E. ADAIR
for 3 days, the protein was dialysed against buffer solutions, as described in thefollowing section.
Method 2. The corpuscles were laked with an equal volume of distilled water,without using ether, and 1 % NaCl was then added. A part of the stroma-protein could be removed by centrifuging, and further purification could beeffected by pressure dialysis against distilled water, when a gelatinous precipitateformed on the membrane. It was generally necessary to change the membraneseveral times to ensure efficient dialysis and approximately complete removal ofstromata.
Method 3. The solution freed from stromata and from ether and salt bymethod 1 was crystallised by the addition of ammonium sulphate at 00. A 22 %solution of CO-haemoglobin was mixed with an equal volume of M/15 Na2HP04,since a slightly alkaline reaction inhibits methaemoglobin formation; conditionsfavourable for crystallisation were then determined by trials with samplescontaining from 1-02 to 1-2 ml. of saturated ammonium sulphate per ml. of thediluted protein solution. Thin layers of the mixture exposed to the air usuallycrystallise within an hour or two, and these crystals can be used to seed thesamples. The stock solution was then crystallised in a bottle containing carbonmonoxide, with the addition of the determined amount of ammonium sulphateand about 5 ml. of previously crystallised solution. The mixture was shaken atintervals, and if necessary, after crystallisation had started, the yield of crystalswas increased by the addition of more ammonium sulphate. The crystals couldbe separated from the mother-liquor by filtration through a Biichner funnel;they were then washed with a mixture of 110 ml. saturated ammonium sulphateand 100 ml. M/15 Na2HP04 or (NH4)2HP04, saturated with carbon monoxide.The crystals were then dissolved in the minimum volume of water and dialysed.All the above operations were carried out at 00. The yield was about 60 % of thetotal haemoglobin. Recrystallisation was brought about by the same procedure.
Method 4. The mother-liquor from the crystals prepared by method 3 wasplaced in large membranes and concentrated by dialysis against distilled waterunder a pressure of about 600 mm. Hg.
2. Experimental methods for the determination of the isoelectric point frommeasurements of membrane potential.
The apparatus for the measurement of membrane potentials, includingcollodion membranes and saturated calomel KCI electrodes, has been describedin a previous paper [Adair and Adair, 1934]. In determinations of the isoelectricpoint, a series of membranes was prepared, filled with protein solution and placedin pyrex tubes or beakers containing a series of buffer solutions at different pHvalues, exemplified by the lists of solutions in Tables IV and V. The solutionsand electrodes were kept in a room at 0° + 0-2. The increase in the stability of theproteins and the inhibition of bacterial action at low temperatures made itpossible to continue equilibration for 10 days or more, with repeated changes ofbuffer mixtures, and to make rigorous tests of equilibrium. If the membraneswere fitted to manometers, osmotic equilibrium was determined as described byAdair [1925, 2]; if the membranes were stoppered with rubber bungs, the mem-brane potentials were determined at intervals until constant readings wereobtained. Large volumes of dialysate were required for concentrated proteinsolutions equilibrated with dilute buffers.
By dialysis with repeated changes of buffer mixtures, it is possible to make aseries of experiments with varyingPE and constant phosphate concentration, orat a constant ionic strength. In the experiments of Loeb [1924], of Taylor [1924]
1232

ISOELECTRIC AND ISOIONIC POINTS OF HAEMOGLOBIN 1233
and of Henriques [1929], which were carried out at room temperature, a singlesample of dialysate was used, in order to reduce the time of equilibration, butthe equilibrium concentrations of the salts in the dialysate in such cases maydifferquite markedly from the initial concentrations, and the relationship between themembrane potentials and the PH values is more difficult to interpret, if the saltconcentrations are independent variables. Comparative studies of the membranepotentials of different protein preparations in equilibrium with the same dialysateare moreover facilitated by methods in which the dialysate is renewed repeatedly.This procedure has the additional advantage that traces of acidic and basicimpurities are removed more rapidly by dialysis with solutions of electrolytesthan with pure water.
After equilibrium has been established, two procedures are available for thedetermination of the isoelectric point
1. The PH values of the protein solutions and the dialysates are determinedby the Clark hydrogen electrode or by other methods. In the more acid solutions,the PH of the protein solution exceeds that of the dialysate; in the more alkalinesolutions, the PH of the protein is lower, as shown in Table XV, and it is possibleto determine by interpolation the isoelectric point I, where both PH values areequal, according to the definition suggested by Adair [1928].
2. The membrane potential E and the PH of the dialysate are determined foreach of the systems, and the point where E= 0 is found by interpolation, asshown in Fig. 1. If the protein concentrations are not identical, a correction canbe applied, based on the observation that the ratio E/IC is approximately con-stant, when E is small [Adair and Adair, 1934].
Theoretically, the two methods should give the same results, since themembrane potentials and the PH values of the protein solution and the dialysate,symbolised pH' and p1,,, are correlated by a thermodynamical formula due toDonnan and Allmand [1914], equivalent to formula 1 below, in the case ofmeasurements at 00, as stated by Adair and Adair [1934]:
E=54 16 (PH'-PH") )......M
E= membrane potential in millivolts at 00.In this equation and in all the formulae and tables given below where it is
necessary to distinguish between the protein solution and the dialysate, the samenotation is used. The symbols with two accents refer to the dialysate. Method 2is preferable in the case of haemoglobin solutions on account of the difficultiesof hydrogen electrode measurements in the protein solutions. Both methods arebased on the assumption that a saturated solution of potassium chloride annulsthe liquid junction potentials, and therefore the results may be regarded as con-ventional rather than as absolute values.
In special cases where the volume of the solution available is very small,approximate determinations may be made by a third method, in which theprotein is equilibrated with a dialvsate at a reaction close to the isoelectric point.The hydrogen ion concentration of the protein solution is estimated by formula 1,and the apparent valence np by formula 9, and if np, be not equal to zero, acorrection is applied, based on the observations recorded in Section 9, whichshow that over a limited range of PH, the rate of change of valence with the PHis approximately constant.
The membrane potentials plotted against PH, shown in Figs. 1 and 2, lie onsmooth curves, and the point of intersection where E=0 can be determined withan accuracy which compares not unfavourably with alternative methods for theestimation of the isoelectric point. The degree of accuracy obtainable is increased

G. S. ADAIR AND M. E. ADAIR
by the use of concentrated protein solutions, although the gain is not directlyproportional to the protein concentration, since certain errors, including thosedue to liquid junction potentials, tend to increase with the protein concentration.In buffered solutions where the ionic strength is low (0.01-0.02), but not so lowthat traces of carbon dioxide from the air and alkalis from the glass vessels causesignificant changes in the PH of the dialysate, it seems possible to estimate theisoelectric point of a given preparation with an accuracy of 001 PH unit. If theionic strength of the buffer be 0*1 or more, the error may be 0 05PH unit oreven greater, as the potentials are small in concentrated salt solutions.
Measurements of isoelectric point are of little value without precise specifica-tion of the experimental conditions, including the composition of the solutionsand the standardisation of the electrometric measurements. All the PH valuesof the dialysates, given below, were measured with a Clark hydrogen electrode,rocked for 1 hour at 00, and a saturated calomel electrode. In order to obtainmeasurements on buffer solutions at 00 comparable with figures for highertemperatures, standardised as suggested bv Clark [1928], the calomel electrodewas standardised on the conventional assumptions that thePH of a solution of0.01 N HCI plus0O09 N KCI is 2-04, and that a saturated solution of KCI annulsthe liquid junction potentials.
The protein concentration has been determined by the method of Kjeldahl,supplemented by measurements of densities and of refractions, as described byAdair and Robinson [1930, 1] and by Roche et al. [1932]. In order to calculatethe percentage concentration of the protein, symbolised C, in g. dry protein per100 ml. solution, the nitrogen content of sheep CO-haemoglobin was determinedas 16-75 + 0 05 % for crystallised and for uncrystallised protein. The percentageconcentration C is directly proportional to the difference between the densitiesof the protein solution and the dialysate, symbolised D' andD' in the formulaD'-D=kdC, wherekd is an empirical constant, equal to 0-00257 at00 and0-00251 at 180, in the case of solutions of sheep haemoglobin in equilibrium withdilute phosphate buffers. The refractive indices of the protein solution and of thedialysate, symbolisedR' andRJ, are correlated with C by the empirical formulaR'-R=CX'C, whereoc' is equal to 0-001945+0-000005.
The carbon monoxide capacity of the solutions of haemoglobin after equili-bration was determined by the method of Van Slyke and Hiller [1928]. Estima-tions of diffusible substances present in the protein solutions and dialysates,namely phosphates, chlorides, ammonia and bicarbonates were made by methodsreferred to by Adair and Adair [1934]. Sodium was determined by electro-dialysis [Adair and Keys, 1934]. The estimations of small amounts of bases,including ammonium and sodium, in the presence of large amounts of proteinare subject to appreciable errors. Determinations of the ammonia content ofthe protein solution by nesslerisation gave in some cases higher values than thoseobtained by the micro-Kjeldahl method or by electrodialysis, some of which areincluded in Table VIII.
The results of analyses are usually expressed in g. mols. per litre of solution.The corrected concentrations, expressed in g. mols. perlitre of solvent, may becalculated by formula 2, as described by Adair and Adair [1934]:
m,=cpx 100/(100-V1C); [NH4],'=[NH4]' x100/(100-V1C)...... (2),mp= corrected concentration of the protein, of molecular weight 67,000;CD= protein concentration in g. mols. perlitre of solution; (100 VC) = volumeof solvent in ml. per 100 ml. of protein solution; C=g. dry protein per 100 ml.;V1 = effective volume per g. dry protein, approximately0x965 ml. The difference
1 234

ISOELECTRIC AND ISOIONIC POINTS OF HAEMOGLOBIN 1235
between this figure and the specific volume of dry protein, O.75 ml., is attributedto water combined with the protein. [NH4],' = corrected concentration ofammonium ions; [NH4]' = concentration of ammonium ions in g. mols. per litreof protein solution. In the dialysates, which are free from protein, the correctedconcentration is the same as the observed concentration, [NH4]".
In addition to the measurements in which chemical analyses of proteinsolutions and dialysates were made for the purpose of comparing isoelectric andisoionic points, a number of determinations of isoelectric point were made by asimpler procedure, in which the measurements made included the membranepotentials, the refractive indices of the protein solutions and dialysates and thePH of the dialysates. If the protein solutions have been equilibrated withsuccessive changes of dialysate, and the refractive indices and PH values of thefinal dialysate agree with those of the standard buffer mixture, it may be assumedthat the composition of the dialysate is the same as that of the standard solution.
3. The determination of the isoionic point of haemoglobin.S0rensen et al. [1927] have given a detailed description of the determination
of the isoionic point of a protein in a form applicable to solutions of all proteinconcentrations. If, however, concentrated solutions are avaiiable, the estimationof the isoionic point can be made by simpier methods, since calculations givenbelow show that there is little difference between the isoionic point and thehydrogen ion concentration of a concentrated solution of the protein in purewater, or in a solution containing equivalent amounts of crystalloid acids andbases.
Theoretically, such a solution is neither isoionic nor isoelectric, because theaddition of a pure protein such as egg-albumin to water increases the acidity, sothat the protein may lose hydrogen ions. In the case of egg-albumin, where thePH of pure solutions is approximately 4-8, the concentration of hydrogen ionsgiven off is of the order of 2 x 10⁻⁵ equivaient per litre, or 0 01 equivalent permol. of protein, if the protein concentration be 0-002 M. The titration curves ofS0rensen et al. [1927] show that egg-albumin is a protein with a relatively highbuffer value, since one molecule (34,500 g.) gives off more than 8 hydrogen ions,if the PH of the solution be increased by 1 unit by the addition of alkali.
The loss of 0 01 equivalent of hydrogen ions per moi. corresponds to anincrease of 0-0012 unit in the PH' and therefore the PH of the pure solution mayexceed the isoionic point by 0-0012 unit, a correction which can be disregardedin comparison with the experimental errors. At low protein concentrations,where the differences between the isoionic point and the PH value of the pureprotein solution are more important, the correction cannot be estimated in thesimple manner referred to above, and the determination must be made by themethod of S0rensen.
The determinations of the isoionic point of haemoglobin made by previousworkers have been obtained at various temperatures; the values may be reduced to00, using the temperature coefficient of0-018PH unit per degree [Adair et al., 1929;Stadie and Martin, 1924]. The titration curves of Hastings, Van Slyke et al. [1924]show that the reduced haemoglobin of the horse has an isoionic point of 6-81 at380 (7-495 at 0°), and the values for oxyhaemoglobin are 6-70 at 38° (7.385 at 00),with a maximum deviation of 0 07 PH unit. Terroux [1931], who used the glasselectrode, obtained the figure 6-79 at 220 (7-176 at 00) for sheep haemoglobin;Errera and Hirschberg [1933] give 6-55 at 18-20° (6-87-6-91 at 00) for horsehaemoglobin. The results of different workers are thus not in agreement. The

G. S. ADAIR AND M. E. ADAIR
data of Hastings, Van Slyke et al. [1924] are of special value as they refer toanaJysed solutions of known CO2 and oxygen content.
In the present investigation, three methods have been used for the determina-tion of the isoionic point. By method A, a number of measurements were madeby a procedure similar to that of S0rensen et al. [1927] and of Van Slyke et al.[1922]. A concentrated solution of sheep CO-haemoglobin was dialysed for aweek against distilled water, then against water containing CO2 for one or twodays, to remove bases combined with the protein, and finally re-dialysed againstdistilled water. Samples of the solution were then mixed with water, dilute HCIand dilute NaOH, and the PH values were determined with the Clark hydrogenelectrode. The CO2 contents of samples equilibrated with hydrogen were thenmeasured. The calculations of the acid or base in combination with the proteinwere then made by formula 3, as described by Van Slyke et al. [1922] andHastings, Van Slyke et al. [1924]. Within the range of concentrations of theprotein and of electrolytes used in this work, the calculations of the acid boundmade by these methods are in agreement with the more rigorous methods de-scribed by S0rensen et al. [1927]:
P CP = [Total anions] - [Total cations] ...... (3).
A,=equivalents of acid, i.e. hydrogen ions combined with one molecule of theprotein. cp,=molar concentration of the protein. The terms in square bracketsdenote the total concentrations of anions and cations in equivalents. Whereanions are present in excess, as in mixtures of sodium chloride and proteinchloride, AP is positive; where cations are present in excess, as in sodium pro-teinate, A, is negative, since the protein gives off hydrogen ions in alkalinesolution.
Observations made by this method, recorded in Table XII and Fig. 6, indicatethat the isoionic point, or more exactly, the PE value where A,=0, is approxi-mately 7-4 at O.
In method B, devised to facilitate comparisons of isoionic and isoelectricpoints under the same conditions, the calculations of the acid bound are basedon chemical analyses of the dialysate and of the protein solution, samples of thelatter being removed from the membrane just before the measurement of thepotentials. Experiments were carried out with a range of buffers, so that thepoint where Ap= 0 could be determined by interpolation, as shown in Fig. 5.
In calculations of A, for solutions of haemoglobin buffered with ammoniumphosphates, it must be remembered that the analytical results are obtained interms of total ammonia and total phosphoric acid. Appreciable amounts ofun-ionised ammonium hydroxide are present if the PH is greater than 7-7 at O.Ammonium hydroxide in the dialysate is estimated from measurements of thetotal ammonia and of the pH bv the application of the law of mass action, and itis assumed that the corrected concentrations, defined by formula 2, are the samein the protein solutions and in the dialysates. The total phosphoric acid in thepH range from 6 to 8 exists mainly in the form of the univalent ion H2PO4 andthe bivalent HPO4; the concentrations of free acid and of the trivalent ion canbe neglected. The acid combined with protein can then be calculated withoutserious error by formula 4:
mpAp= 2 [HPO4]C + [H2PO4]C- [NH4C' = [PO4]c' (1 + x') - [NH4]C'...... (4).
The symbol [PO4]C' is used to represent the corrected coneentration of totalphosphate in the protein solution, in mols. per litre of solvent. x' = the fraction of
1 236

ISOELECTRIC AND ISOIONIC POINTS OF HAEMOGLOBIN 1237.
the total phosphate in the protein solution in the bivalent form; an estimate of x'can be obtained by the procedure below.
In the first place, x", the proportion of the bivalent ion in the dialysate com-posed of the pure salts NH4H2PO4 and (NH4)2HP04, may be estimated by theapplication of the law of mass action to the measurements of hydrogen ionactivities, or the concentrations of the ions HPO4 and H2P04 may be calculated
Table I. Ion distributions and acid combined with haemoglobin.Sheep CO-haemoglobin, equilibrated with 0*02 M ammonium phosphate at 0°. Exp. 654.
Osmotic pressure =92-9 mm. Hg. Membrane potential = - 0-57 mv. PH" =7-008, PH' (calc.) =6-998. C= 19 68. m,,=0-003628. x'=0-50. A =4-96. f'/f", the ratio of the activity coefficients,computed by formula f'. [NH4],'=rjf". [NH4]". In the dialysate [HPO4]"=[NH]" -[P04]", and[H2PO4]" =[P04]" - [HP04]". x" = 0 505.
Protein solution
Corrected CorrectedDialysate Ideal distri- concen- Concen- concen-concen- bution tration, tration, tration,
Ion species tration ratio ri ideal observed observed f'/f"NH4 0 03020 1/1-024 0 03093 0-02651 0-0327 0-945P04 (mol) 0*02007 0-01935 0-02748 0 0339 0-571HPO4 (mO') 0-01013 1/1-05 0 00965 0-0169H2PO4 (mO') 0 00994 1/1-024 0 00970 - 0-0170P04 (equivalent) 0 03020 - 0 02900 - 0-0507
from analytical determinations of total ammonia and phosphoric acid, as shownin Table I, where the value of x" is estimated by the formula
[NH4]"= (1 +x") [P04]".The theoretical distribution ratio for each ion is then calculated by formula 5, amodification of the formula of Donnan and Ailmand [1914] discussed by Adairand Adair [1934]:
ri = antilog [-n E/54.16] ...... (5),ri= ideal distribution ratio = ai'/ai", where ai' and ai" denote the activities oreffective concentrations of the diffusible ions in the protein solution and in thedialysate respectively; ni = the valence of the ion (negative for anions). The idealconcentration of each ion in the protein solution is then calculated by formula 6,
[NH4],' (ideal) = r [NH4]" ...... (6).The same notation is used in application of formula 6 to the other diffusible ions.x' is estimated from these "ideal" concentrations, as shown in Table I. Calcula-tions ofA. based on these assumptions cannot be exact, but it is unlikely that theerror is serious, since the titration curve obtained by this method agrees withresults obtained by method A, as show-n in Fig. 6.
In practical applications of formula 4, it is advisable to use solutions inwhich the protein concentration, C, exceeds 20 g. per 100 ml. solution, since anerror of 0*00032 mol. per litre in the estimation of ammonia may cause an errorof 0 01 pTH unit in the determination of the isoionic point of a solution in whichC,=26*8 and mp=0*004, whereas in a solution where C,=2 68, the same errorin the analyses causes a tenfold increase in the errors in the estimation of A,, andof the isoionic point.
Gasometric analyses showed that the protein solutions dialysed againstammonium phosphate buffers may contain from 0.0001 to 0*0002 mol. of CO2 perlitre, concentrations which are too low to cause serious errors in the estimation of

1238 G. S. ADAIR AND M. E. ADAIR
the isoionic point of solutions where CQ exceeds 20. In similar solutions dialysedagainst distilled water, the CO2 content may be as much as 0-004 mol. per litre.
Method C is based on the hypothesis that if inorganic salts cause a differencebetween isoionic and isoelectric points, either by the combination of ions withthe protein or by their effects on interionic forces, such differences must diminishas the salt concentration is reduced. A series of measurements of the isoelectricpoint was made and plotted against /,u, the square root of the ionic strength ofthe dialysate, as shown in Fig. 7. If a straight line be drawn through the pointsand extrapolated to zero salt concentration, the pH1 value obtained is not farremoved from the isoionic point determined by method B.
4. The comparison of different preparations of haemoglobin.In order to determine whether the proteins prepared from the bloods of
different individuals are identical [Barcroft, 1928], a number of preparations ofCO-haemoglobin were made from sheep's blood by method 1 and equilibratedwith ammonium phosphate buffer mixtures. Seven preparations gave a valuefor the isoelectric point of PH 7-06 + 0-01 at 00. The values for the remainingpreparations ranged from 7-0 to 7-14, with one exception, which gave the value6-75; this material had been exposed to high temperatures during centrifuging.
Table II. Comparison of preparations of sheep CO-haemoglobin, made bymethod 1.
Osmotic pressures in mm. Hg and membrane potentials in mv. at 00, extrapolated for proteinconcentration C=21-29, C,, =26-8 and m, =0.004, and for dialysate (NH1)2HPO4=0-005 M +NH4H2PO4 =0-005 M, PH =7-09 at 00. Isoelectric points for 001 M ammonium phosphates.Isoionic points estimated by method B, Section 3, except Exps. 594-601 and 613-622 by method C.
Osmotic Membrane Isoelectric IsoionicExp. no. pressure potential point point
311 - -0-40 7-05 7-50331-337 105 -0-20 7 07 7.39451-462 103 -0 40 7 05 7-41467-477 102 -0-85 7 00 7.37559-570 109 +0 50 7*14577-588 109 +0*40 7-13 7-42594-601 107 -0 35 7*05 7-56613-622 101 - 2-93 6-75 7.34
623 - -0-20 7*07654, 655 107 -0-20 7-06 7-63
641 107 -0-20 7-06N.H. 106 +0-30 7-11 7.56
S. 107 +0-30 7-13 7-56
The experimental determinations of the isoelectric and isoionic pointsrepresent the total protein present in the preparations, which contain traces ofother derivatives in addition to CO-haemoglobin. Oxyhaemoglobin is present inall solutions containing dissolved air, but the titration curves ofHastings, Sendroyet al. [1924] and measurements of cataphoresis [Svedberg, 1933] indicate thatreplacement of oxygen by carbon monoxide causes no change in the isoelectricor isoionic points. The isoionic point is affected by reduction, but the concentra-tion of reduced haemoglobin is very' small in the presence of carbon monoxide at00. Methaemoglobin or other derivatives which do not combine reversibly withoxygen and carbon monoxide are formed during the preparation of haemoglobin.The uncrystallised haemoglobin made by method 1 combined with 1*27 + 0 03 ml.CO per g. protein; crystalline haemoglobin prepared by method 3, combined with

ISOELECTRIC AND ISOIONIC POINTS OF HAEMOGLOBIN 1239
1-21 + 0 04 ml. CO per g. protein. If the difference between these figures and thetheoretical value of 1-34 ml. per g. be attributed to methaemoglobin, the pro-portion of this protein is about 5 % in the uncrystallised and 10 % in thecrystallised preparations. If the protein be completely changed into methaemo-globin, the isoelectric point is increased from PH 6-92 to 7 04 [Svedberg, 1933],whereas the isoionic point is increased by 015 + 0.05 PH unit [Hastings et at.,1924]. The variations in isoelectric and isoionic points attributable to theformation of 10 % of methaemoglobin are 0-006 and 0-015 PH unit respectively.
Unpublished experiments have shown that the denaturation of haemoglobinmay yield products that are more acidic or more basic than native haemoglobin,and it is conceivable that the formation of soluble derivatives of a type inter-mediate between native and denatured protein might account for the va.riationsin the isoionic points of haemoglobin shown in Table II and by other workers.The possibility that there are slight irreversible changes in the protein is indi-cated furthermore by the observation that a preparation kept at 00 for 16 monthsshowed an increase in isoelectric point from 7 00 to 7 07, without appreciablechange in the CO capacity. It is possible that the anomaly in the isoelectricbehaviour of gelatin described by Pauli and Valko [1933] can be accounted forby differences in individual preparations.
It is unlikely that the solutions used in this work contained appreciableamounts of completely denatured haemoglobin, since the protein was highlysoluble at the isoelectric point and formed a wholly crystalline solid phase onaddition of ammonium sulphate. The osmotic pressures, moreover, were allwithin 4 % of the mean value of 105-5 mm. at 00 for a solution with mp = 0 004,without making corrections for the variations of pressure with the charge on theprotein ions, which would reduce the differences observed.
Comparison of crystallised and uncrystallised haemoglobin prepared fromthe same blood, recorded in Table III, shows that the isoelectric point of thecrystallised preparations is at a more alkaline PH. No appreciable difference
Table III. Isoelectric points of crystallised and uncrystallised haemoglobinof sheep.
Dialysates, ammonium phosphates at 00. Each number refers to blood of a different individual.
Molarity Total Crystallised Recrystallised Mother-No. of buffer haemoglobin haemoglobin haemoglobin liquor1 0-01 7-03 7*122 0.01 7-14 7-18 7-18 7-193 0.02 6X86 6.91 - 6-91
could be detected in measurements of nitrogen content, hydration, osmoticpressure, refraction or density. In the crystallised preparations made bymethod 3, described above, the amount of methaemoglobin formed, as estimatedby the fall in CO capacity after crystallisation, is about 5 %; the variations inisoelectric point, ranging from 0 04 to 0 1, exceed the changes attributable tomethaemoglobin. It is unlikely that the change is due to the existence of twodifferent forms of haemoglobin, or to the removal of an acidic impurity bycrystallisation, since preparations of concentrated mother-liquor appear to havethe same isoelectric point as crystallised or recrystallised protein, as shown inTable III. If fractionation takes place, the acidic substances should be moreconcentrated in the mother-liquor than in the total protein or the crystallinefraction. From these experiments and from the observation that solutions ofcrystallised haemoglobin may yield traces of precipitate at 00, it may be inferred

G. S. ADAIR AND M. E. ADAIR
that the change in isoelectric points is due to the action of ammonium sulphateon the protein.
Dr K. 0. Pedersen kindly examined two solutions, Exp. 2, total and crystal-lised haemoglobin in Table III (sent to Upsala in ice in a thermos flask) andfound that the bulk of the protein, with a light absorption of wave-length5-600 m,u, was homogeneous [Pedersen, 1933]. A trace of a substance with adifferent mobility was detected, a Jarger amount of this being present in thecrystallised than in the uncrystallised material. The isoelectric point was atPH 7 09 for both preparations, measured by cataphoresis at 20° with KH2PO4-Na2HPO4 buffers of 0-02 ionic strength. In view of Dr Pedersen's results, itseems that the haemoglobins made by methods 1 and 3 are much more nearlyhomogeneous than the preparations obtained by Geiger [1931], who reported thepresence of relatively large amounts of two different fractions, isolated by themethod of cataphoresis.
Measurements were made to determine whether ether has an injurious effecton the protein. The isoelectric points of preparations made with and withoutether are not identical, but the mean difference found of 0 05 PE unit is notexcessive. It is probable that the preparations made with ether give a betterapproximation to a pure, unaltered protein, since the material obtained withoutthe use of ether was kept at room temperature for a longer time, in efforts toremove stroma-protein by centrifuging. Measurements of the carbon dioxidedissociation curves of human haemoglobin showed no evidence of irreversiblechanges in the protein caused by the addition of ether during the process oflaking [Adair, 1925, 1].
The comparisons of different preparations of sheep CO-haemoglobin havenot been restricted to the measurements given in Tables II and III. Theevidence as a whole has shown that although the absolute values of the isoelectricand isoionic points are affected by the methods of preparation, there are pro-perties of the protein which are practically constant, including the changes in themembrane potentials and the valences with the PH, the effects of salts on theisoelectric point and the effects of the protein on the activities of the diffusibleions. In the following sections, which are concerned with the properties whichare more nearly constant, detailed comparisons of different preparations havenot been recorded.
It is possible that the variations in the isoelectric and isoionic points ofindividual preparations of sheep haemoglobin would be less marked in the caseof ox haemoglobin, since the globin moiety of this protein is more stable.
5. Haemoglobin and ammonium phosphate.In the investigation of the equilibrium of sheep CO-haemoglobin and
ammonium phosphate buffers, recorded in Tables IV, V, VI, VII and V'III, asingle preparation of protein was used in each series of experiments, in order toobtain comparable results in studies of the effects of hydrogen ions and salts onthe membrane potentials. If a curve be constructed from data obtained withmore than one preparation, allowances must be made for differences betweenthe preparations, referred to in Section 4. With the exception of the experimentswith crystalline haemoglobin, given in Table VIII, the haemoglobin wasprepared by method 1. Estimations of the isoelectric points of the preparationsare included in Table II.
The solutions of ammonium phosphates NH4H2PO4 and (NH4)2HP04, usedin the dialysis fluids, were prepared from recrystallised salts or from an analysedsample of A.R. (NH4)2HP04, which gave theoretical values for ammonium and
1240
ISOELECTRIC AND ISOIONIC POINTS OF HAEMOGLOBIN 1241
phosphoric acid. Glass-distilled and boiled-out water was used and the solutionswere stored at 00. In estimations of the ionic strength and other calculations, ithas been assumed provisionally that the salts are fully ionised in accordance withrecent work on strong electrolytes [Debye and Hiickel, 1923]. On this assump-tion, the ionic strength u, defined as half the sum of the concentrations of theions in the dialysate, multiplhed by the squares of their valences, is equal to[NH4H2PO4]Y + 3[(NH4)2HP04]".
Table IV gives the experimental data required for the determination of theisoelectric point by interpolation (method 2, Section 2) as shown in Fig. 1, in
Table IV. CO-haemoglobin and ammonium phosphate buffers of constantmolarity.
Exps. 451-462, preparation 1931, 4, isoelectric point 7 05. Exps. 467-477, preparation 1931, 5,isoelectric point 7 00. Dialysates 0.01 M ammonium phosphates. C =g. dry protein in 100 ml.solution. p=osmotic pressure in mm. Hg at 0°. PH"=PH value of dialysate. E=membranepotential in mV. at 00. [NH4]"=total ammonia in mols. per litre in dialysate. [NH4]'=totalammonia in protein solution. [P04]" = total phosphoric acid in dialysate. [P04]' = total phosphoricacid in protein solution.
Exp. no. C P PH" E [NH4]" [P04]" [NH4] [P04]'451 20 6 142-6 6 30 + 7-93 0-0133 0 00997 0 0089 0*02663452 21-2 107-2 6-94 +1-03 0-0136 0 00969 0-0131 0-01739454 21-0 100-7 7-10 -0-38 0-0150 0-00997 0-0155 0-01497455 21-4 103-4 7-11 -0-39 0-0154 0-01000 0-0152 0-01505456 21F6 98-9 7-26 -1-83 0-0161 0 00999 0-0152 0-01366458 20-2 93-8 7-42 -2 70 0-01010 0-0182 0-01126459 20 7 100-9 7-59 - 3-67 0-0167 0.01000 0-0193 0-00930460 20*7 98-5 7-53 - 3-35 0-0176 0-01005 - -461 19-9 99-6 7-68 - 4-57 0-0183 0-01010 0 0239 0*00861462 19-3 152-7 8-44 - 9-75 0-0215 0-01007 0-0331 0*00452467 21-4 124-0 6-67 +3-17 0-0121 0 00984 0-0102 0-02180469 21-5 109-7 6-94 +0 62 0-0141 0 00980 0-0141 0-01706471 21-9 107-1 7 09 -0-88 0-0145 0-00982 0-0142 0-01510473 21-8 105-6 7-26 - 1-98 0-0152 0 00999 0-0147 0-01348474 20-8 96-9 7.37 - 2-45 0-0166 0 00996 0-0170 0-01190475 21-8 105-4 7 40 - 3 07 0-0160 0 00993 0-0181 0-01123476 21-8 110-8 7-54 - 3-93 0-0182 0-01006 0-0199 0-01008477 21-7 166-9 8-23 - 9-20 0-0224 0*00990 0-0301 0-00506
-s8-O00
0.~+4-C0 ~ __
5+20
Isoelectric+00
0T
-4-C0
S-6-0 - -6-2 6-4 6-6 6-8 7-0 7-2 7-4 7-6 7-8
PH of dialysatesFig. 1. Isoelectric point of sheep CO-haemoglobin, method 2, Section 2. Dialysates 0-01 M
ammonium phosphates. Membrane potentials for 21-29 % protein solutions (min=,=0004);extrapolated from data in Table IV. Circles, preparation 1931, 4; crosses, preparation 1931, 5.

1242 G. S. ADAIR AND M. E. ADAIR
systems in which the molarity ofthe dialysate is kept constant. The measurementsof the concentration of ammonia and phosphoric acid included in this table wereused in the calculations of the acid bound by the protein, the valence of theprotein (formula 9) and the isoionic point (method B, Section 3), shown inFig. 5. Values of the ratio of the activity coefficients f'If'po4, based on data inTable IV, are recorded in Table XV. This ratio represents a mean value for theions HPO4 and H2PO4, computed from the formula
f'If"PO = [P04]6' (ideal)/[PO4],' (observed).Similar values were obtained with other preparations. In the case of ammoniumions, the results for f'/f"NI,, computed from Table IV, are more irregular andsmaller than values computed from Table VIII. It is probable that the differenceis due to errors in the determinations of ammonia included in Table IV. In allcases the protein causes a much greater diminution in the activities of theanions than of the cations. Slight differences in the same direction have beenobserved by Hastings et al. [1927] and by Adair [1928], but their experimentswere made at a higher salt concentration, under conditions less favourable forthe demonstration of specific effects due to the protein.
The effects of variation in the hydrogen ion concentration with buffers ofconstant ionic strength are shown in Table V. The buffer value of the solutions of
Table V. Effects of variations of PH at constant ionic strength.Sheep CO-haemoglobin and ammonium phosphate buffers at 0°. Exps. 559-570, preparation
1932, 1; Exps. 577-588, preparation 1932, 4. Isoelectric points for both preparations are 7-34,6-46 and 6 15 with dialysates of ionic strengths 0 01, 0 10 and 0-20 and phosphate concentrations of0 04, 0-072 and 0-138 respectively.
Ionic MolarityExp. no. strength PO4 PH" C p E E*
559 0 01 0-008 6-40 19-8 147-1 +9-25 +9 10560 ,, 0006 6-90 20-7 121-8 +5a0 +5.05561 ,, 0005 7-13 20-8 109-8 +2-9 +2-80562 ,, 0-004 7-42 20-5 94-7 - 1-44563 0 10 0-08 6-00 21-2 117-9 +0-63564 ,, 0-06 6-58 20-7 101-5 -0-2 -0-12565 ,, 0-05 6*89 20-9 102-7 - 0-7566 ,, 0 04 7-36 20-8 103-5 - 1-25 - 1-40567 0 20 0-16 5-85 21-2 115-4 +0-08 +005568 ,, 0-12 6-45 20-8 108-0 -0-18 -0 10569 ,, 0 10 6-77 20-6 103-0 -0 40570 ,, 0-08 7-27 21-1 108-6 - 1.00 -0-80577 0*01 0-008 6-33 20-8 169-5 +9-56578 ,, 0-006 6-82 21-5 132-5579 ,, 0005 7-11 21-6 116-4 +247 -580 ,, 0004 7-47 21-7 106-0 - 2-26581 0 10 0-08 6-00 21-5 120-8 +0-75582 ,, 0-06 6-57 21-5 111-5 -0-23 -583 ,, 0-05 6-88 21-5 109-3 - 0-65584 ,, 0-04 7-37 20-5 102-3 - 1-44585 0-20 0-16 5-84 21-4 116-5 +0 4586 ,, 0-12 6-43 21-1 109-4 -0 37587 ,, 0.10 6-77 21-0 108-0 -0-60588 ,, 0-08 7-28 21-0 108-4 -0 93
E*. Supplementary experiments with stoppered membranes, at the same PH and proteinconcentration.
ionic strength 0.01 is low, and the final PH values of the dialysates and thestandard solutions are not identical; analyses are given in Table VI. The pro-
ISOELECTRIC AND ISOIONIC POINTS OF HAEMOGLOBIN 1243
Table VI. Concentrations of ions in protein solution and dialysate.
Exp. no.577579580
[NH4]"0-01020 00760 0067
[P04]10-008710 004960 00393
[NH4]0 006760 007030 00932
[POJ'0 024000*010440*00560
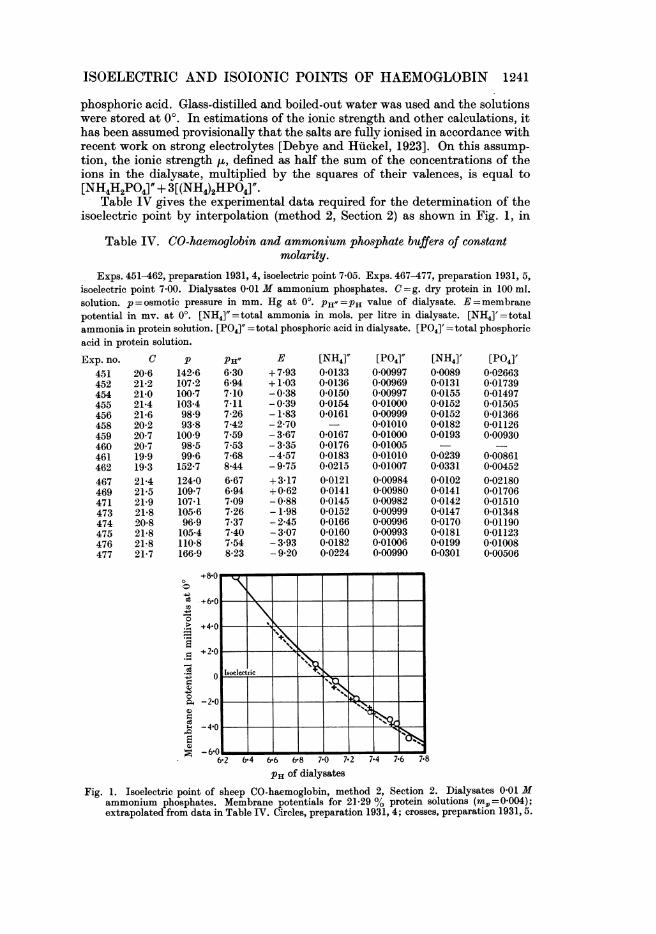
portions of the total phosphate in the buffer solution in the bivalent form x" canbe computed bythe formula ,u= [P04]" (1+ 2x"), from the values given in Table V.
0~~10
~~~~~~~~~~~0~~~~ ~ ~ ~ .I2
5.8 . 62 6-6 7-0 7.4 7.8
PH of dialysateFig. 2. Isoelectric point of sheep CO-haemoglobin. Dialysates ammonium phosphate buffers of
ionic strengths 0 01, 0.10 and 0-20. Membrane potentials for protein solutions of m,=0.004,extrapolated from data in Table V.
The membrane potentials recorded in Fig. 2 show that an increase in saltconcentration displaces the isoelectric point towards the acid side, and reducesthe slopes of the curves, in accordance with formula 8, a result which indicatesthat the membrane potential varies inversely as the ionic strength of thedialysate. The intersections of the curves shown in Fig. 2 are eliminated whenthe apparent valences are calculated as shown in Fig. 6.
In order to obtain values of the isoelectric point at a greater number of saltconcentrations with each preparation of haemoglobin, series of experiments

1244 G. S. ADAIR AND M. E. ADAIR
were made by method 3, Section 2. The results for two preparations are given inTable VII. It will be seen that if the molarities exceed 0 01, there is littledifference between the plH values of the stock buffers and those of the final
Table VII. Effects of increasing salt concentration on the isoelectric point.
Sheep C0-haemoglobin, dialysates ammonium phosphates at 0°. Exps. 594-601, preparation1932, 8; Exps. 613-622, preparation 1932, 10; isoelectric points estimated by method 3, Section 2,on the approximate assumption that the ionic strengths of the dialysates are equal to those of thestandard buffer solutions, which contained equal proportions of (NH4)2HP04 and NH4H2PO4.
Standard buffer solution
Ionic Molarity Dialysate IsoelectricExp. no. strength P04 PH PH" C p E point
594 0.01 0*005 7-11 7-23 21-2 103-4 0 00 7-23595 0-01 0 005 7-11 7-16 21-04 109-6 +1*46 7-27596 0 02 0-010 7 09 7-10 20 5 101-6 -0-47 7-03597 0-02 0-010 7 09 7-13 21-6 108-4 -0-23 7.10600 0 04 0 020 7 02 7 03 21-4 106-7 - 0*57 6 90601 0 04 0 020 7 02 7-01 21-08 105-6 - 0 69 6-85614 0-01 0.005 7-11 7 20 20 3 92*5 - 3-23 6-97615 0 02 0-010 7 09 7-13 20 2 92-2 - 2-92 6-76616 0 02 0-010 7 09 7-12 20-4 93-7 - 2-77 6-77617 0 04 0 020 7 02 7 04 20-1 94 0 - 2-22 6-51619 0 07 0 035 6-95 6-96 20 3 94-9 - 1-69 6-28620 0 07 0-035 6-95 6-95 20-3 95-2 - 1-72 6-26621 0-10 0 050 6-89 6-89 20*3 - 1-38 6*11622 0-10 0.050 6-89 6-89 20 3 - 1-32 6-14
dialysates. Although the absolute values of the isoelectric points for preparation1932, 10 differ from normal values by 0 3 PH unit, the changes caused by anincrease in the concentration ofphosphates are very similar to the results obtainedwith other preparations.
Measurements ofthe distribution ofions in solutions with increasing phosphateconcentrations are given in Table VIII. Calculations of the ratio f'/f"po, based on
Table VIII.. Membrane potentials and ion distributions at different saltconcentrations.
Sheep CO-haemoglobin and ammonium phosphates at 00. Exps. 598, 599, crystallised proteinpreparation 1932, 8; Exps. 642, 645, 646, crystallised preparation 1932, 6 B. Remaining Exps.,uncrystallised haemoglobin from 6 preparations. Exps. C 23 and C 24, from same blood asExps. C 3 and C 6, Table X. f'/f"N 4 usualy exceeds 0 95.
Exp.no. C P PH" E [NH4]" [POJ' [NH4]' [P04]'
598 21-02 104-8 7 08 +0-61 0-01500 0-01000 -599 21-16 108-9 7 09 +0 97 0-01500 0-01000645 21*40 110-2 7 08 +0 68 0.01510 0 00996 - 0-01730642 21-67 108-1 7 02 -0 47 0 02993 0-02010 0 0269 0 02770646 21-92 109-1 6-95 -0-69 0.05150 0.03440 0 0426 0 04370NH 6 19-38 7 08 +0 63 0-01503 0 00999 0-0126 0.01559NH 47 21-10 - 7 08 +0 69 0-01503 0 00999 0-0117 0-01601C 23 20 20 98*4 7 08 +0 33 0-01485 0 00990 0-0116 0-01540C 24 19-90 95-5 7 08 +0 30 0-01520 0.01010 0-0124 0-01610640 21-94 113-1 7 05 -0 86 0-03057 0-01993 0 0255 0-02940655 19-70 91-4 7 02 -0-61 0 03030 0 02000 0-0261 0 02750641 21-90 110.9 7 04 -0-81 0 03053 0-01970 0 0278 0 02930326 16-50 73.9 6-76 -0.10 0-22390 0-13830 0-1952 0-14500611 20 30 124-0 6 30 - 1-48000 0-99100 1-1700 0 80730

ISOELECTRIC AND ISOIONIC POINTS OF HAEMOGLOBIN 1245
these measurements for crystalline and for uncrystallised haemoglobin are almostidentical. It may be noted that the phosphate determinations in Exps. 640 and641 are less reliable than in Exp. 655.
6. Haemoglobin and sodium phosphates.Preliminary measurements of the effects of sodium salts on the isoelectric
points of two preparations of sheep CO-haemoglobin are given in Table IX. In
Table IX. Effects of different cations and anions on the isoelectric point ofsheep CO-haemoglobin at 00.
Molarities of anions in dialysates; HPO4, 0-005; H2PO4, 0.005; Cl 0-05. Isoionic points,preparation 1933, 11 =7 55; preparation 1934, 1 =758; preparation 1934, 2=7-57.
Isoelectric point
Cation Cation Preparation Preparation Preparationspecies molarity Anion species 1933, 11 1934, 1 1934, 2NH4 0-015 HPO4, H2PO4 7-15 7X13Na 0015 HPO4, H2PO4 7-05 7-10Na 0-065 HPO4, H2PO4, Cl 6-93 7-01Na+K 0-015 HPO4, H2PO4 7-10
the second experiment (Jan. 1934), equilibration was carried out for a prolongedperiod during which slight changes took place in the protein. The final COcapacities were from 93 to 95-4 % of the theoretical values. From these results,the isoelectric point with 0.01 M sodium phosphates appears to be slightly onthe acid side of that obtained with ammonium phosphates.
The addition of 0 05 mol. of sodium chloride to the sodium phosphate buffer,increasing the ionic strength from 0*02 to 0 07, alters the isoelectric point to amore acid reaction. The difference of 0 09 to 0-12 pH unit is in the same directionas that observed when the ionic strengths of ammonium phosphate buffers areincreased over the same range, but the change in isoelectric point with am-monium phosphates is about 0-46 PH unit. There is little doubt that this dif-ference between the effects of chlorides and phosphates on the isoelectric point iscorrelated with the observation that the diminution of the activities of the ionscaused by haemoglobin is greater for phosphates than for chlorides, as shown byAdair [1928] and by the measurements recorded in Table X, which includes some
Table X. Membrane equilibrium of sodium, chloride and phosphate ions.Sheep CO-haemoglobin at 0°. Exps. B, C, E, F, preparation 1933, 11, dialysate sodium
phosphates. Exps. C 3, C 6, preparation 1934, 2 S, dialysate 0-005 M Na2HPO4 + 0 005 MKH2PO4. Values for total base under heading Na. Concentrations of ions in mols. per 1.
Exp. no. B C E F C6 C3[Cl]" 0 0 0 0499 0*0500 0 0[PO4r- 0 00996 0*00986 0 00998 00099 0 00975 0 0099[Na]" 00149 0-0171 0-0618 0 0647 0-0147 0-0146[Cl]' 0 0 0 0480 0-0460 0 0[P04]' 0*01577 0.01168 0-0126 0-0113 0.0152 0.0146[Na]' 0-01156 0-0154 00479 0-0521 0-0125 00126C 22-4 23-6 23-9 22-23 20 04 17-75p 115-6 125.8 134*4 115-8 94.9 76 0PH" 7-116 7.444 6.949 7-288 7-127 7-132E -0 65 - 3*05 -0 07 -0 98 -0 08 -0-31f'/f Na 1-04 0 97 0.99 1-03 0 96 0 97f'/f"po4 0 48 0 53 0-61 0 65 0 52 0-55f'/f"cl - 0 80 0 82 -Biochem. 1934 xxvni 80

G. S. ADAIR AND M. E. ADAIR
approximate estimates of the effects of the protein on the activity of the sodiumions, subject to an error of not less than 5 %.
The continuous line marked P04 0.01 in Fig. 3 is constructed from theresults of experiments with 0 01 M ammonium phosphates (Nos. 467-477), byadding 0-13 PH unit to the pH values in Table IV, to faciiitate comparisons with
+5-0~~~~~0
+2-5
6-5 7-0 7.5 8-0PH of dialysates
Fig. 3. Effect of sodium salts on membrane potentials. Sheep CO-haemoglobin at 0° andmj,=0 004, preparation 1934, 1. Circles, dialysate 0-01 M sodium phosphates; squares0.01 M sodium phosphates + 0-05 M sodium chloride. Continuous curve, results withammonium phosphates with a constant correction applied to the PH values.
the membrane potentials with sodium phosphates. The observed points are closeto the calculated curve, and it seems that the general forms of the curves givenby sodium and by ammonium phosphates are almost identical over the rangeinvestigated. The broken line, marked NaCl, shows that the addition of 0.05 mol.Of sodium chloride to the dia]ysate diminishes the slope of the curves.
7. Equilibrium of protein cry8tats, protein 8olUtion and dialysate.
S0rensen [1917] showed that crystals of egg-albumin may contain anamount of combined ammonia or sulphuric acid approximately equal to theamounts combined with the protein solution. His method gives the differencebetween the ammonia and sulphuric acid, but it caunot give the absoluteamounts of acids or bases present in the crystals. The method described belowwas devised in order to study the absolute amounts. A protein sparingly solublein the region of the isoelectric point, such as horse CO-haemoglobin, wascrystallised by dialysis against 0-01 M ammonium phosphate buffer for about14 days at 00. A 5 ml. density bottle was fitted to a 10 ml. tube of hard glass,and the vessel so obtained was filled with the crystal suspension and left tosediment at 00. A sample of mother-liquor was obtained from the tube andifiltered if necessary. After sufficient time had been allowed for sedimentation,
1246

ISOELECTRIC AND ISOIONIC POINTS OF HAEMOGLOBIN 1247
the density bottle, containing both crystals and mother-liquor, was stopperedand weighed, and the contents were washed out into a 100 ml. volumetric flask.If necessary, sodium hydroxide was added to facilitate dissolution of the proteincrystals, care being taken that the alkalinity was not sufficient to cause theevolution of ammonia. Analyses were made for protein, ammonia and phos-phoric acid content. The corrected concentrations have been calculated byformula 2, and the composition of the crystals estimated by graphical methods.
In an indirect analysis of this type, necessitated by the fact that the crystalscannot be separated from their mother-liquor without alteration in theircomposition, the experimental errors may be considerable, and the number ofobservations recorded in Table XI is insufficient for the establishment of definiteformulae, but it is evident that of the three hypotheses that the crystals arecomposed of pure protein, pure protein salt, or protein plus acid plus ammonia,
Table XI. Equilibrium of crystals, mother-liquor and dialysate. HorseCO-haemoglobin.
The phase designated crystal is a mixture of crystals and mother-liquor.
Exp. no. Phase MP [NHJ8c [P04C5B 5 Dialysate 0-0167 0-0101
Filtrate 0{00065 0-0189 0-0108Crystal 0{00500 - 0-0179
SB 3 Dialysate 0-0173 0-0097,, Filtrate 0-00131 0-0207 0-0117,,.1 Crystal 0-00229 0-0240 0-0142,, Pressed crystals 0-00850 0-0283
SB 2 Dialysate - 00099,, Filtrate 0-00160 0-0177Si, Crystal 0-00225 - 0-0148
SB 1 Dialysate - 0-0145 0-0096Filtrate 0-00221 0-0167 0-0165Crystals 0-00382 0-0225 0-0213
SB 4 Dialysate - 0-0100,, Filtrate 0-0024 0-0140 0-0109,, Crystals 0-0061 0-0196 0-0250
as stated in formula 7, the third is correct. Cohn and Prentiss [1927] measuredthe solubility of haemoglobin in more concentrated buffers, of ionic strength0-04 to 1-0, and state that their results suggest the identity of the "saturatingbody " in the systems studied.
Pr (H2O)w (NH4)b (PO4)a (7).The terms a and b appear to be of the same order of magnitude for both dis-solved and crystalline protein, and both vary with the hydrogen ion concentra-tion. It has been assumed that w= 800 mol. of water per 67,000 g. dry protein.The higher value for hydration given by S0rensen and S0rensen [1933] wouldyield larger values for a and b. In the isoionic region (pH 7-4) the term a isnearly 2 mols. of phosphoric acid per mol. of haemoglobin.
Evidence for the presence of water in the crystalline phase was obtained frommeasurements of density. The specific volume of anhydrous haemoglobin at 200,determined by the method used by Svedberg [1930], is 0-75 ml., and the density1-333. Direct measurements made in this work showed that the crystals remainedin suspension in media of densities from 1-267 to 1-269 at 200. Mixtures of half-saturated ammonium sulphate and sucrose were used for these experiments,rather than the solutions including calcium chloride usually employed to
80-2

G. S. ADAIR AND M. E. ADAIR
determine the density of crystals by this method, in order to reduce the risks ofalterations in the protein.
The value 1-259 is calculated on the assumption based on chloride distribu-tion measurements [Adair, 1928] that 1 g. dry protein combines with 0-2145 g.water and that 1F2145 g. protein hydrate occupies the sum of the volumes0 75 ml. +0 215 ml. attributed to the dry protein and the water respectively.The difference between the values 1-268 + 0 001 and 1-259 may be accounted forby the effect of the sucrose and ammonium sulphate on the vapour pressure ofwater and the hydration of the protein.
Svedberg's calculations of molecular weights of proteins from ultracentrifugalmeasurements are based on the specific volume of the dry protein; recalculationsbased on the density 1-259 give considerably higher values, but there is nofundamental discrepancy because the lower density refers to the protein hydrate.It may be noted that in the cases of haemoglobin and serum-albumin, estimationsof the "molar friction" (or of the radius of the particles) from the sedimentationvelocities and from the molecular weights [Svedberg, 1930] are in much closeragreement if the results are expressed in terms of the mass and density of theprotein hydrate.
In order to minimise the risk of error due to imperfect equilibration, someexperiments on the salt distribution in crystals were made by a modified method,in which pure crystals were first formed by dialysis against distilled water;dialysis was then continued against buffer solutions. It was found that the sameexcess of ammonia and phosphate was present in the crystalline phase as in thesystems in which crystallisation was brought about by dialysis against buffersolution.
8. Relationship between osmotic pressure and isoionic and isoelectric points.In solutions of haemoglobin equilibrated with distilled water, containing
only slight traces of electrolytes such as ammonia and carbon dioxide, theisoelectric and isoionic points and the minimum of osmotic pressure should bealmost identical. At the minimum of pressure published by Adair [1928], theuncorrected pH of the dialysate, measured colorimetrically at room temperature,is 6-8+0-2.
In systems of this type, measurements of hydrogen ion concentration aremore reliable if they are made on the protein solution rather than on thedialysate, which is an unbuffered solution of low conductivity. Table XIIrecords measurements made on haemoglobin solutions at 00, using the hydrogenelectrode. The observations are incomplete, since measurements of the C02content of the protein solution before electrometric measurements are required,
Table XII. Osmotic pressures, PH values, C02 content and isoionic point ofhaemoglobin.
Sheep CO-haemoglobin, preparation 1931, 1. Dialysate distilled water at 0°. p =extrapolatedosmotic pressures [or m =0-0035. CO2 in millimols per 1.
IsoionicExp. no. PH' p C p observed C02 point
554 6.83 163-0 16-08 132-3 -551 7-24 112-2 18-65 108-7 2-8 7.37479 7-27 112-0 20-70 124-0 -553 7-32 103-7 18-58 100-3 1-9 7 40552 7.34 98*5 18-50 94.5 2-8 7.45550 7*35 94.5 18-90 93.2 - -
1248

ISOELECTRIC AND ISOIONIC POINTS OF HAEMOGLOBIN 1249
as well as those made after equilibration with hydrogen, but the results indicatethat the minimum pressure is not atpn 6 8 but in the region of the isoionic point,pHU 7A4+O01.
In solutions containing salts, for which the isoionic point differs from theisoelectric point, the determination of the minimum osmotic pressure is difficulton account of the relatively small changes in pressure caused by alterations inthe hydrogen ion concentration in the region ofthe isoelectric point. Experimentswith 0.01 M phosphate buffers shown in Fig. 4 indicate a minimum value at
bo
W.,
0
.0
W
Go
6b0 6-2 6-4 6-6 6-8 7-0 7.2 7.4PH of dialysates
7-6 7.8 8'0 8-2 8X4
Fig. 4. Minimum osmotic pressure of sheep CO-haemoglobin, dialysates 0 01 M ammoniumphosphates at 00. Pressures extrapolated for m,=0-004, from data in Table IV. Circles,series 451-462; crosses 467-477; crosses enclosed in circles, mean values for both preparations.
Table XIII. Osmotic pressures with ammonium phosphate buffers of differentPH values.
Sheep CO-haemoglobin. Osmotic pressures for mi, =0 004, extrapolated from data in Table V.Pressures for preparation 1932, 4 asterisked.
Ionic strength 0 01
PH" P
6-33 173.4*6-40 169-26-82 130.0*6-90 128*27*13 113-57-11 113-5*7*42 100*67*46 102-27-48 102-6*
Ionic strength 0.10
PH" P
6*00 118-26 00 118.6*6-57 109.5*6*58 106-26-88 107-5*6*89 105-87*36 107*37.37 109.1*
Ionic strength 0-20
PH" P
5-84 115.2*5-85 116-76-43 115.0*6*45 113-26-77 110.4*6*77 109-17*27 110*27*28 111-4*
p11 7-27 + 0.15, a value intermediate between the isoelectric point 7-06 and theisoionic point, 7.4 + 0-05, in the preparations referred to in Table IV. Table XIIIgives provisional estimates of the pressures for solutions containing 0 004 mol.
190
180 - -
170 -
160 L-
150 -
1400 --__ __
130 __ -- _ _
12 0 - N
110 -el - - --
100-
90 - - - --I - Inilni IE IEE E

G. S. ADAIR AND M. E. ADAIR
of protein per litre of solvent, calculated from data in Table V, on the assumptionthat pressures and concentrations are related by the empirical formula
p =RTm2,+ k1RTm.2.In solutions of 0.01 ionic strength, where the phosphate is approximately
0 004 M the minimum pressure seems to be near pg 7-4. The minimum in moreconcentrated buffers appears to be at more acid reactions. It may be noted thatin the more alkaline solutions, the change in pressure with pg may be smallerthan that calculated for the changes in the ion pressure difference by theformulae given by Adair [1929] and by Adair and Robinson [1930, 2].
9. Relationship between the buffer value PH and the valence increment fin.The buffer value fiH is defined as the increase in the acid bound by one mole-
cule (67,000 g.) of haemoglobin, divided by the increase in the PH. Hastings,Van Slyke et al. [1924] showed that in solutions of reduced horse haemoglobinat 380, containing 0 03, 0 05 and 0-145 equivalents of sodium ions, the buffervalues are 10 0, 10-6 and 11-3 respectively. The buffer value of oxyhaemoglobinvaried with the pE. Human haemoglobin has a lower buffer value of 9-2[Adair, 1925, 1]. In the case of sheep oxyhaemoglobin, the value of fiEg=8 isestimated from CO. dissociation curves [Adair et al., 1929] and fIg[= 7-35-9-3from measurements made by means of the glass electrode by Terroux [1931]. Inthe present investigation similar measurements on sheep CO-haemoglobin madewith the hydrogen electrode at 0°, shown in Fig. 6, give a buffer value of 7-7 inthe region of the isoelectric point.
The estimation of buffer values from studies of membrane equilibria presentsgreater technical difficulties than the earlier methods, but for the purpose of thiswork, the method is of use as a means of comparing the buffer value and thevalence increment fin, defined as the change of valence perPH unit; fn cannot bedetermined by the earlier methods except in the special case of very dilute mix-tures of protein and hydrochloric acid, referred to by Pauli and Valko [1933].
The estimation of the valence np, from measurements ofmembrane potentialsin buffer solutions, has been described by Adair and Adair [1934] who have giventhe formula
np =0-0085 ,uM (E/)o ...... (8).M= mol. wt.; ut= ionic strength; C =g. protein per 100 ml. solvent; (EIQ)O = thelimiting value of the ratio (E/0Q) when C=0.
In experiments in which this ratio has not been determined, approximateestimates of n2, have been made by formula 9:
m,n = [free anions],'- [free cations]j' ...... (9).The terms in square brackets represent the sums of the corrected equivalentconcentrations of free anions and free cations, estimated on the approximateassumption that concentrations of ions uncombined with proteins are the sameas the "ideal " concentrations, defined by formula 6. The values of np estimatedby formula 9 are used in approximate calculations of the isoelectric point I bythe empirical formula nP=fin (I-Pg). A similar formula Ig=PH+AA,/fiH is ofservice in estimates of the isoionic point IH. The range over which fig and finare approximately constant is shown in Figs. 5 and 6.
Table XIV gives a series of determinations of fig and fin for sheep CO-haemo-globin equilibrated with ammonium phosphate buffers of constant ionic strength,or with a constant molarity. The values of fin recorded are based on approximateestimates of n, made by application of formula 9, from the measurements of
1250

ISOELECTRIC AND ISOIONIC POINTS OF HAEMOGLOBIN 1251
membrane potential, some of which are given in Tables IV, V and X. In systemsin which E is below 2 millivolts, formula 9 gives the same results as formula 8,
.80
C)
0
*C)
Ca
80:
75.54.0
,0Q
100
0
0S-
+
+2F
64 N.....IC??Ce. _ A S _ A A a A
7H07o 27p 47s67ot 8
PH Of protein solutionsFig. 5. Acid bound and valence of sheep CO-haemoglobin, dialysates 0.01 M ammoniumphosphates at 00; calculated from Exps. 452-462, Table IV. Isoionic point at A,,=0.
+8
8 5
60 7A8
,S +64
+4~~~~
+2 OO
0
0 ,0 )0~~~~~
-56-0 ~~7.0 8-0
PH of protein solutionsFig. 6. Valence of sheep CO-haemoglobin, calculated from data in Table V. Dialysates ammonium
phosphate buffers at 0°. Broken line, acid bound by haemoglobin; crosses, A,, in mixturescontaining Na, Cl and HCO,; squares, AD in ammonium phosphates, calculated from data inTables V and VI. (Crosses, calculated by method A; squares, method B, section 3).
but if E exceeds 5 millivolts, there are appreciable differences, as shown by thecurves given by Adair and Adair [1934]. In the experiments with buffers ofionic strength 0.01, where the potentials with 20 % solutions may exceed
6-6 6;8 8-0 8-2

1252 G. S. ADAIR AND M. E. ADAIR
9 millivolts, the value of/3 estimated by formula 9 is 3-6, as shown in Table XIV,whereas that estimated by formula 8 is approximately 4-6. Although a numberof the values in Table XIV may be subject to correction, there seems to be littledoubt that P. is quite markedly less than PH. This difference, discussed inSection 11, is of importance in the theoretical interpretation of the mobilities ofproteins; Abramson [1933], in the absence of direct measurements, assumes thatflH and & are identical.
Table XIV. Buffer values and valence increments of haemoglobin.Sheep CO-haemoglobin, dialysates phosphate buffers at 00. Mean values of PH and BBn over the
same PH range. Concentrations of proteins and salts given in Tables IV, V, VI and X, exceptseries 331-337, which is comparable with series 451-462. Asterisked figures show that fln and PHboth vary with the PH, and that the difference between them is greater in more acid solutions.
Isoelectric PHSeries Notes point range Pn PH577-580 Ionic strength=0 01 7-42 6-5-7-5 3-6 7.74581-584 ,, =0 10 6*47 6-0-7-3 3-6585-588 ,, =0-20 6*18 5.8-7.3 3-8331-337 Molarity =0.01 7-06 6-7-7-5 4-2 6*9451-462 ,, ,, 7-05 6-7-7*5 3-7 7X8467-477 ,, ,, 7 00 6X7-7X5 3X9 7-8467-477 ,, ,, 700 6X7-7X0* 3X3* 7X8*467-477 7 00 7-08-0* 4-6* 8.4*Na-PO4 ,, 7-05 70-7-6 3.7 8-6Na-C1-PO4 ,, P04 0-01 6-93 6-9-7*2 4.5 -
Cl 0.05S
10. Effects of salts on the isoelectric points of proteins.The results recorded in Fig. 7 indicate that as the salt concentration is
increased, thepH of the isoelectric point of haemoglobin at 00 becomes more acid.Michaelis and Davidsohn [1912] measured the cataphoresis of haemoglobin at
X,7K175_1a)
"avw
0-
040
4)
4)00
*S
750L \
7-25 _
675
--I- -I I-- DN
0 0o1 0*2 0 3 0.4Square root of ionic strength of dialysates
Fig. 7. Variation in isoelectric point of sheep CO-haemoglobin caused by ammonium phosphates.Circles, crystalline haemoglobin, calculated from data in Table VIII; squares, preparation1932, 4, Table V. C =isoionic point by extrapolation, B=isoionic point determined fromchemical analyses.
room temperature and concluded that the isoelectric point is independent of saltconcentration. In view of this discrepancy, the evidence obtained by differentmethods as to the constancy of the isoelectric point may be briefly summarised.
m

ISOELECTRIC AND ISOIONIC POINTS OF HIAEMOGLOBIN 1253
The point of maximum precipitation of globulin is shifted to the acid side bythe addition of neutral salts, as shown by Hardy [1905], and it may be noted thatPrzy1gcki [1931] regards an effect of salts on precipitation as a proof that saltschange the isoelectric point, but in view of the more critical work of Hardy andof Cohn [1922], who discusses the work of Michaelis and Szent-Gyorgyi [1920]and of Hopkins and Savory [1911], it appears that the point of maximum pre-cipitation depends upon a number of factors. It may be noted that in the case ofhaemoglobin there is a marked discrepancy between the isoelectric point and theminimum solubility, in that the isoelectric point varies by approximately0 45 PH unit over a range of 250 [Stadie and Martin, 1924], whereas the minimumsolubility of horse haemoglobin at 250 recorded by Green [1931] is the same asthe value of 6*6 at 00 given by Cohn and Prentiss [1927]. Green concluded thatsalts alter the apparent dissociation constants and presumably the isoelectricpoint of haemoglobin. A minimum solubility can be obtained where haemoglobinis not isoelectric, as shown by S0rensen and S0rensen [1933], who published acurve with two minima, at p1 5-4 and at PH 6-6.
The point of minimum swelling of gelatin may be altered by the addition ofsalts [Kuntzel, 1929], but here again it can be shown that the evidence is in-decisive. Swelling is correlated with osmotic pressure, which in the case of aprotein, can be regarded as the sum of two terms, namely pi, the pressure due tothe diffusible ions, and pp, the partial pressure of the protein [Adair, 1928; 1929].The term pi is zero at the isoelectric point and, if p, is unaffected by hydrogenions, minimum osmotic pressure and swelling should correspond with the iso-electric point, but if hydrogen ions alter the state of aggregation of the protein,or the forces between the particles, the observed minimum is a function of twovariables and not necessarily equal to the isoelectric point.
Although the measurements of Michaelis and his colleagues showed noevidence for an effect of salts on the isoelectric point, the more accurate apparatusdevised by Tiselius [1930] gave an isoelectric point of PH 4*55 for egg-albuminin acetate buffers of 0-02 ionic strength, containing 0-02 mol. of sodium acetateper litre, whereas the isoionic point is at p11 4-76. Abramson [1933] supports theview that the isoelectric point can be changed by the addition of salts. Themeasurement made by Tiselius is of greater importance as evidence for a changeof isoelectric point than are the results obtained from observations of maximumprecipitation and swelling, as the movement of protein particles in an electricfield should be more directly correlated with the electric charge on the particles,but the evidence cannot be regarded as an unqualified proof, in view of theobservations of Loeb [1924] and of Freundlich [1930] that the cataphoresis of airbubbles is greatly affected by the addition of electrolytes, which suggests thatsuspended particles are surrounded by a film of water, containing an excess ofone species of ion, usually the anion, which moves with the particle. It followsthat the addition of electrolytes may cause an uncharged particle to move in anelectric field. The theory that a sheath of solution moves with the particle is ofinterest in connection with the differences between the results of Michaelis andthose obtained in the present work. In measurements of membrane potentials,the diffusible ions surrounding the protein are in a state of thermodynamicequilibrium, unaffected by an external electric field.
Loeb [1924] made a series of comparisons of the cataphoric potential ;, andof the membrane potential, and concluded that salts with tri- or quadri-valentions may reverse 4, but only bring the membrane potentials to zero. In thepresent investigation, where the membrane potential measurements have beenmore closely spaced, it is evident that there is a limited range of PH values,
G. S. ADAIR AND M. E. ADAIR
shown in Fig. 2, where an increase in phosphate concentration can alter the signof the membrane potential.
The evidence for a variation in isoelectric point with salt concentration,obtained by measurements of membrane potentials, is of interest as it seemsprobable that the electric charge or valence of protein ions is correlated with themembrane potentials by the simple formula 8, discussed by Adair and Adair[1934]. It is possible, however, that the results may require correction, as theyare based on the approximate assumption that a saturated solution of potassiumchloride annuls the liquid junction potentials. The curves in Fig. 2 show that theaddition of a small constant correction of 0*3 mv. to the observed potentialstends to diminish the distance between the isoelectric points at different ionicstrengths.
The hypothesis that the changes in the isoelectric point caused by salts are
entirely due to theliquid junction potentials may be advanced in order to recon-
cile the results with the conclusion of Michaelis, but it is necessary to postulatethe existence of specific effects of haemoglobin on the liquid junction potentialsranging from 1*5 to 3 mv. at different salt concentrations. In the absence ofindependent evidence, it seems difficult to accept this hypothesis. No evidenceof the existence of marked differences between theliquid junctions potentials,due to the unequal concentrations of diffusible ions in the protein solution andthe dialysate, was obtained in the comparison of the membrane potentials ofhaemoglobin with ammonium phosphate and with sodium phosphate buffers,shown in Fig. 3. In systems where the diffusion potentials play an importantpart in the observed potentials, the replacement of sodium by an ion of highermobility, such as potassium or ammonium, may alter the potentials by severalmillivolts [Bjerrum and Unmack, 1929]. Theexperiments show that there is notmuch difference between the values of dEIdpH measured with sodium and withammonium phosphates.
11. Chemicalsignificance ofthe difference between isoelectric and isoionicpoints.
The curves in Figs. 5, 6 and 7 show that in the presence of salts, the isoelectricpoint of haemoglobin is on the acid side of the isoionic point, at which the proteinappears to have a negative charge. The values of the isoelectric points in 0-01Mammonium phosphate buffers, obtained with different preparations of haemo-globin, are not identical, but they all agree in showing a difference of about04 pH unit from the isoionic points of the preparations in the same buffermixture. The results may require corrections, referred to in Section 10, but itseems probable that the effects of salts on the isoelectric point are mainly dueeither to the formation of a compound between the protein and the negativelycharged phosphate ions, or to the formation round the particle of a layer,containing an excess of phosphate ions. On both of these hypotheses, the proteinmay diminish not only the activity coefficient of the phosphate ions, a conclusionin accordance with the data in Table XV, but also the mean activity coefficientof the ammonium and phosphate ions, symbolised f±, which can be investigatedby chemical methods, without using cells withliquid junctions. In the case ofExp. 654, given in Table I, where the products of the corrected concentrations ofthe ions NH4+ and H2PO4- in the protein solution and in the dialysate are
0-000556 and 00003 respectively, the protein diminishes the mean activitycoefficient of the ions by 26-5 %.
Calculations based on the data for 0.01M buffers, given in Table IV, showthat the protein may cause even greater diminutions in f±. Similar effects are
1254

ISOELECTRIC AND ISOIONIC POINTS OF HAEMOGLOBIN 1255
obtained for sodium phosphates, but the effect of the protein on the meanactivity coefficient of sodium chloride is smaller (approximately 10 %, in thecase of Exps. E and F in Table X), in accordance with the relatively smallchange in the isoelectric point caused by sodium chloride. Stadie and Sunderman[1931] measured the freezing-points of mixtures of haemoglobin and salts andconcluded that the protein causes no change in the mean activity coefficient, buttheir observations were not made under the most favourable conditions, namelya high concentration of protein and a low concentration of salts.
The discrimination between the effects of interionic attraction and ofchemical combination is a difficult problem. The suggestion that proteins formcompounds with heavy metals and with alkaline earths has been made by anumber of investigators, referred to by Pauli and Valk6 [1933], who have givenan extensive list of references to papers bearing on the alternative hypothesisthat proteins attract ions. The existence of compounds between proteins andthe simpler ions Na+, C1- and HC03- has been postulated to account for theeffects of salts on the solubility of proteins [Kondo and Hayashi, 1928], but inview of the lack of discrimination between combination and attraction, and theabsence of quantitative data as to the composition of the supposed compounds,their existence is generally discredited.
Evidence in favour of the existence of interionic attractions and repulsionshas been obtained in measurements of the osmotic pressure of haemoglobin[Adair, 1928] and of the solubility of haemoglobin [Cohn and Prentiss, 1927].In the present investigation, certain consequences of the interionic attractiontheory have been compared with the data recorded in Table XV.
Table XV. Effect of variation in the valence of haemoglobin ions on theactivities of phosphate ions.
Sheep CO-haemoglobin, dialysates 0.01 M ammonium phosphates. Concentrations of proteinsand ofsalts given in Table IV. Exps. 467, 469, 475 and 477, PHI' measured with hydrogen electrode,remaining values calculated by Formula 1. b =apparent combination in equivalents of phosphateper mol. haemoglobin. Corrected concentrations of ions in mols. per 1. solvent.
Exp. [P04]C' [P04]C'no. PH" PH ideal observed b x' fIf"PO n,467 6-67 6-71 0-01164 0-02760 4 9 0-26 0-42 + 1F0469 6-94 6*94 0-01018 002177 4-1 0 45 0 47 +0-2471 7 09 7 07 0 00930 001913 3*6 0.47 0 49 - 0.4473 7.26 7-22 0-00880 0-01710 3 0 0'50 0.51 -0.8474 7.37 7-32 0-00838 0*01490 2-7 0-63 0-56 - 1.1475 7.40 7*32 0*00806 0-01429 2-4 0-64 0-56 - 1-3476 7*54 7.47 0*00748 0-01275 2-2 0-76 0.59 - 2-0477 8.23 8-09 0-00465 0*00640 0.8 0-92 0 73 - 5.0
In the first place, an increase in the valence of the protein, positive or nega-tive, increases the ionic strength of the solution, and according to the theory ofDebye and Hiickel [1923] the activity coefficient of the ions is reduced. Theexperiments recorded in Table XV show that over the range of valences from+1 to -5, protein causes the smallest change in f'If"po4 not at n, =0 but atn= -5. In the second place, bivalent ions are affected more strongly thanunivalent ions, according to the theory, but an increase in x', the fraction of thetotal phosphate in the bivalent form, is correlated with an increase rather than adiminution in f'/f"po . In the third place, evidence for and against the existenceof compounds can be obtained by examining the equilibrium of crystals andmother-liquor, recorded in Table XI; it will be noted that there is an excess of
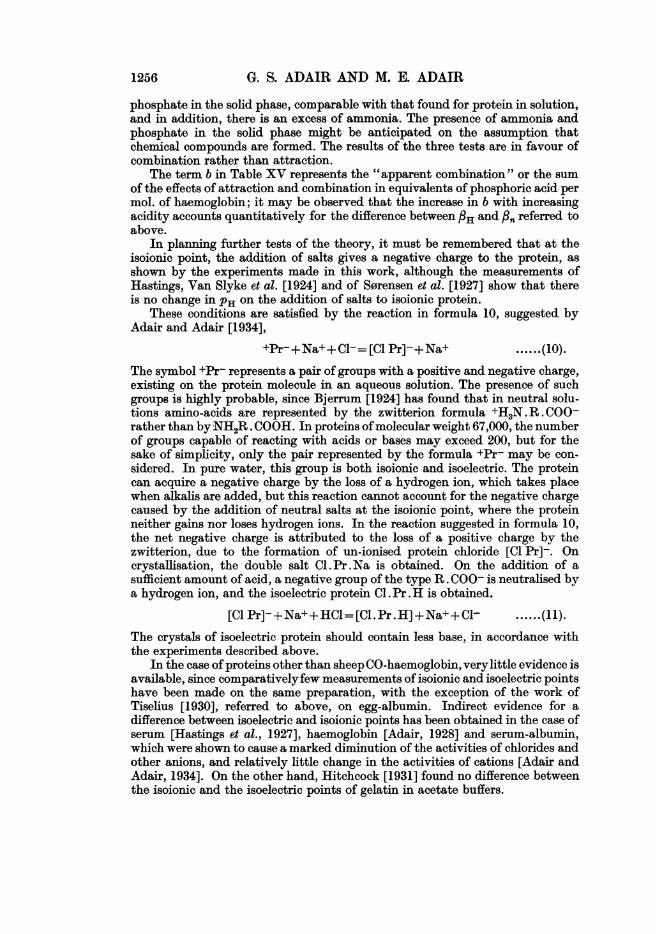
G. S. ADAIR AND M. E. ADAIR
phosphate in the solid phase, comparable with that found for protein in solution,and in addition, there is an excess of ammonia. The presence of ammonia andphosphate in the solid phase might be anticipated on the assumption thatchemical compounds are formed. The results of the three tests are in favour ofcombination rather than attraction.
The term b in Table XV represents the "apparent combination" or the sumof the effects of attraction and combination in equivalents of phosphoric acid permol. of haemoglobin; it may be observed that the increase in b with increasingacidity accounts quantitatively for the difference between PH and fln referred toabove.
In planning further tests of the theory, it must be remembered that at theisoionic point, the addition of salts gives a negative charge to the protein, asshown by the experiments made in this work, although the measurements ofHastings, Van Slyke et al. [1924] and of S0rensen et al. [1927] show that thereis no change in PH on the addition of salts to isoionic protein.
These conditions are satisfied by the reaction in formula 10, suggested byAdair and Adair [1934],
+Pr-+Na++Cl-= [Cl Pr]-+Na+ ...... (10).The symbol +Pr- represents a pair of groups with a positive and negative charge,existing on the protein molecule in an aqueous solution. The presence of suchgroups is highly probable, since Bjerrum [1924] has found that in neutral solu-tions amino-acids are represented by the zwitterion formula +H3N.R.COO-rather than byNH2R . COOH. In proteins ofmolecular weight 67,000, the numberof groups capable of reacting with acids or bases may exceed 200, but for thesake of simplicity, only the pair represented by the formula +Pr- may be con-sidered. In pure water, this group is both isoionic and isoelectric. The proteincan acquire a negative charge by the loss of a hydrogen ion, which takes placewhen alkalis are added, but this reaction cannot account for the negative chargecaused by the addition of neutral salts at the isoionic point, where the proteinneither gains nor loses hydrogen ions. In the reaction suggested in formula 10,the net negative charge is attributed to the loss of a positive charge by thezwitterion, due to the formation of un-ionised protein chloride [Cl Pr]-. Oncrystallisation, the double salt Cl. Pr.Na is obtained. On the addition of asufficient amount of acid, a negative group of the type R . COO- is neutralised bya hydrogen ion, and the isoelectric protein Cl. Pr. H is obtained.
[ClPr]-+Na++HCl=[Cl.Pr.H]+Na++CCl ......h(11).The crystals of isoelectric protein should contain less base, in accordance withthe experiments described above.
In the case of proteins other than sheep CO-haemoglobin, verylittle evidence isavailable, since comparativelyfew measurements of isoionic and isoelectric pointshave been made on the same preparation, with the exception of the work ofTiselius [1930], referred to above, on egg-albumin. Indirect evidence for adifference between isoelectric and isoionic points has been obtained in the case ofserum [Hastings et al., 1927], haemoglobin [Adair, 1928] and serum-albumin,which were shown to cause a marked diminution of the activities of chlorides andother anions, and relatively little change in the activities of cations [Adair andAdair, 1934]. On the other hand, Hitchcock [1931] found no difference betweenthe isoionic and the isoelectric points of gelatin in acetate buffers.
1256

ISOELECTRIC AND ISOIONIC POINTS OF HIAEMOGLOBIN 1257
SUMMARY.The possibility of determining the isoelectric point from measurements of
membrane potentials has been investigated. It seems that the most accurateresults are obtained under conditions where concentrated solutions of protein areequilibrated with dilute buffer solutions at 00.
In order to facilitate comparisons of the isoelectric point with the isoionicpoint, at which the protein neither gives off nor takes up hydrogen ions, methodshave been developed for the estimation of the isoionic point from the distributionof salts across membranes.
A study has been made of methods for the preparation of sheep CO-haemoglobin, a protein which is highly soluble at the isoelectric point. Slightalterations in the protein may take place on crystallisation, and different pre-parations are not always identical, but comparative results can be obtained on agiven preparation.
At 0°, the isoionic point of crystallised haemoglobin was atpH 7-6. Uncrystal-lised protein gave lower values of 7-45 + 0 1. In ammonium phosphate buffers,of ionic strengths 0-02, 0-04 and 0 07, the isoelectric points of the crystallisedprotein were 7*16, 6-91 and 6-70 respectively. Seven preparations of uncrystal-lised material, with buffers of ionic strength 0-02, gave an isoelectric point7-06 + 0-01. The isoelectric points become more acid as the salt concentration isincreased; the effects of increasing concentrations of chlorides are less than thoseof phosphates.
There are slight but measurable differences between the results obtained withsodium and with ammonium phosphate buffers.
In sodium as in ammonium phosphate buffers, the increase in the valence ofthe protein correlated with increasing hydrogen ion concentration is smaller thanthe increase in the acid bound by the protein.
The minimum of osmotic pressure appears to be at p]E values between theisoionic and isoelectric points.
The distribution ofammonia and of phosphoric acid between protein crystals,protein solution and dialysate has been investigated.
Experiments have been made to test the hypotheses that the proteins com-bine with ions, or that they attract the ions in their neighbourhood, and it issuggested that the effects of salts on the isoelectric point, and the effects ofproteins on the activities of diffusible ions may be due to a reaction of the type+Pr-+Na++ Cl-= [Cl Pr]-+ Na+, where +Pr- represents a zwitterion.
REFERENCES.
Abramson (1933). J. Gen. Physiol. 16, 593.Adair (1925, 1). J. Biol. Chem. 63, 493.
(1925, 2). Proc. Roy. Soc. Lond. A 108, 627.(1928). Proc. Roy. Soc. Lond. A 120, 537.(1929). Proc. Roy. Soc. Lond. A 126, 16.
- and Adair (1934). Biochem. J. 28, 199.Cordero and Shen (1929). J. Physiol. 67, 288.
- and Keys (1934). J. Phy8iol. 81, 162.and Robinson (1930, 1). Biochem. J. 24, 993.
(1930, 2). Biochem. J. 24, 1864.Barcroft (1928). The respiratory function of the blood. Part 2. Haemoglobin. (Cambridge.)Bjerrum (1924). Z. physikal. Chem. 110, 656.
and Unmack (1929). Kgl. Danske. Vid. Sel8k. Mat. Fys. Med. (9), 1.

1258 G. S. ADAIR AND M. E. ADAIR
Bolam (1932). The Donnan equilibrium. (London.)Clark (1928). The determination of hydrogen ions. (Baltimore.)Cohn (1922). J. Gen. Phy8iol. 4, 697.
- and Prentiss (1927). J. G(en. Phy8iol. 8, 619.Debye and Huickel (1923). Physik. Z. 24, 185.Donnan and Allmand (1914). J. Chem. Soc. 105, 1941.Errera and Hirschberg (1933). Biochem. J. 27, 764.Ferry (1923). J. Biol. Chem. 57, 819.Freundlich (1930). Kapillar Chemie. 1. (Leipzig.)Geiger (1931). Proc. Roy. Soc. Lond. B 107, 368.Green (1931). J. Biol. Chem. 93, 517.Hardy (1899). J. Phy8iol. 24, 288.
(1905). J. Phy8iol. 33, 251.Hastings, Van Slyke, Neill,'Heidelberger and Harington (1924). J. Biol. Chem. 60, 89.
Salvesen, Sendroy and Van Slyke (1927). J. Gfen. Phy8iol. 8, 701.Sendroy, Murray and Heidelberger (1924). J. Biol. Chem. 61, 317.
Henriques (1929). Ergebn. Phy8iol. 28, 625.Hitchcock (1931). J. Gen. Phy8iol. 14, 685.Hopkins and Savory (1911). J. Phy8iol. 42, 189.Kondo and Hayashi (1928). Memoirs of the College of Agriculture, Kyoto, No. 5, 32.Kuntzel (1929). Biochem. Z. 209, 326.Loeb (1924). Proteins and the theory of colloidal behaviour. (New York.)Michaelis and Davidsohn (1912). Biochem. Z. 41, 102.
- Szent-Gyorgyi (1920). Biochem. Z. 103, 178.Pauli and Valko (1933). Kolloidchemie der Eiweisskorper. (Dresden.)Pedersen (1933). Kolloid. Z. 63, 268.Przy]Vcki (1931). Biochem. J. 25, 713.Roche, Roche, Adair and Adair (1932). Biochem. Z. 26, 1811.S0rensen (1917). Compt. Rend. Lab. Carlsberg, 13, No. 5.- Linderstr0m-Lang and Lund (1927). J. Gen. Physiol. 8, 543.
and S0rensen (1933). Compt. Rend. Lab. Carl8berg, i9, 11.Stadie and Martin (1924). J. Biol. Chem. 60, 191.
-- Sunderman (1931). J. Biol. Chem. 91, 227.Svedberg (1930). Kolloid. Z. 5i, 10.
(1933). J. Biol. Chem. iO3, 311.Taylor (1924). Proc. Roy. Soc. Lond. B 96, 383.Terroux (1931). J. Physiol. 7i, 323.Tiselius (1930). Nova Acta Reg. Soc. Sci. Upsaliensis, Ser. 4, 7, No. 4.Van Slyke, Hastings, Heidelberger and Neill (1922). J. Biol. Chem. 54, 481.
and Hiller (1928). J. Biol. Chem. 78, 807.Walker and Williamson (1920). J. Biol. Chem. 41, 75.


![CALCULATION OF ISOELECTRIC POINTS. · 808 Calculation of Isoelectric Points Except in the special case where the isoelectric point is at the “neutral” point of water [H+] does](https://img.dokumen.tips/doc/110x75/5f0a52187e708231d42b1422/calculation-of-isoelectric-808-calculation-of-isoelectric-points-except-in-the.jpg)


![[Group 5] electrochemistry, electrophoresis, isoelectric focusing](https://img.dokumen.tips/doc/110x75/55c5bdefbb61eb5a3b8b458a/group-5-electrochemistry-electrophoresis-isoelectric-focusing.jpg)