Embed Size (px)
Citation preview

Fund Manager Reportof Shariah Compliant Schemes
April 2018
Islamic Savings
NBP FUNDSManaging Your Savings
AM1 Rated (Highest rating in Pakistan)
Managing over Rs. 11,000 Crores of investors’ money
Investment can be encashed at any time without penalty
Largest Retail / Branch Network in Pakistan
InceptionDateFund
InitialMaturity
Date Fund Pro�t Benchmark
NAFA Islamic PrincipalProtected Fund-I*
NAFA Islamic PrincipalProtected Fund-II*
NAFA Islamic PrincipalPreservation Fund**
5-Mar-2014 4-Mar-2016 10.9% 6.9%
27-Jun-2014 27-Jun-2016 11.1% 10.0%
9-Jan-2015 9-Jan-2017 11.2% 9.9%
AnnualizedReturn***
Historical Performance of Similar Funds
Category: Shariah Compliant Fund of Fund; All funds mentioned are based on Constant Proportion Portfolio Insurance (CPPI) methodology; Benchmark: Daily weighted return of KMI-30 index & Islamic Bank deposits based on Fund’s actual allocation; Since Inception annualized returns of Nafa Islamic Principal Protected Fund-I is 13.4% vs benchmark return of 9.5% (till fund close on Nov 16, 2017) and return of Nafa Islamic Principal Protected Fund-II & Nafa Islamic Principal Preservation Fund are 13.7% and 8.2%, respectively vs benchmark return of 10.9% and 7.1%, respectively (till March 30, 2018); *Shariah Compliant Capital Protected Fund CPPI; **Shariah Compliant - Fund of Funds CPPI Based; ***Since inception till initial maturity.
IPO
for Limited
Time
Halal Munafa - Mehfooz Sarmaya20% Tax Ki Bachat Ke Saath
Note: Tax Credit available as per section 62 of the Income Tax Ordinance, 2001; Performance is based on dividend reinvestment gross of withholding Taxes, excluding cost of frontend load. Taxes apply as per current income tax law.Disclaimer: All investments in mutual funds are subject to market risks. The investors are advised in their own interest to carefully read the contents of the Offering Document in particular the Investment Policies mentioned in Clause 2 and Risk Factors mentioned in Clause 2.4 and Warnings in clause 9 before making any investment decision. Past performance is not necessarily indicative of the future results. Capital preservation only applies to unit holders who hold their investments until initial maturity of two years.
Call : 0800-20002 SMS: INVEST to 9995 [email protected] /nbpfunds
Formerly: NBP Fullerton Asset Management Limited (NAFA)NBP Fund Management Limited
Rated by PACRAAM1
NAFA Islamic Capital Preservation Plan-III

Table of Contents
Pg. 04NAFA Riba Free Savings Fund
Pg. 06NAFA Islamic Money Market Fund
Pg. 07NAFA Islamic Asset Allocation Fund
Pg. 03Capital Market Review
Pg. 02CEO’s Write-up
Pg. 01Performance Summary of Shariah Compliant Funds
NAFA Islamic Income Fund Pg. 05
NAFA Islamic Pension Fund Pg. 10
NAFA Islamic Stock Fund Pg. 08
NAFA Islamic Principal Protected Fund-II (NIPPF-II) Pg. 11
NAFA Islamic Principal Preservation Fund (NIPPF) Pg. 12
NAFA Islamic Active Allocation Plan-I (NIAAP-I) Pg. 13
NAFA Islamic Active Allocation Plan-II (NIAAP-II) Pg. 14
NAFA Islamic Active Allocation Plan-III (NIAAP-III) Pg. 15
NAFA Islamic Active Allocation Plan-IV (NIAAP-IV) Pg. 16
NAFA Islamic Active Allocation Plan-V (NIAAP-V) Pg. 17
NAFA Islamic Active Allocation Plan-VI (NIAAP-VI) Pg. 18
NAFA Islamic Active Allocation Plan-VII (NIAAP-VII) Pg. 19
NAFA Islamic Active Allocation Plan-VIII (NIAAP-VIII) Pg. 20
NAFA Active Allocation Riba Free Savings Fund Pg. 23
NAFA Islamic Active Allocation Equity Fund Pg. 24
NAFA Islamic Capital Preservation Plan-I (NICPP-I) Pg. 21
NAFA Islamic Capital Preservation Plan-II (NICPP-II) Pg. 22
NAFA Islamic Energy Fund Pg. 09
Islamic Savings
NBP FUNDSManaging Your SavingsTable of Contents

Disclaimer: This publication is for informational purpose only and nothing herein should be construed as a solicitation, recommendation or an offer to buy or sell the fund. All investments in mutual funds and pension funds are subject to market risks. Past Performance is not necessarily indicative of future results. Please read the Offering Document to understand investment policies and the risks involved.
April 2018Islamic Mutual Funds - Collective Investment Schemes (CISs)
Fund Size(Rs. In Crore)
StabilityRating
InceptionDate
NAFA Riba Free Savings Fund
Benchmark
NAFA Islamic Income Fund
Benchmark
NAFA Islamic Asset Allocation Fund
Benchmark
NAFA Islamic Stock Fund
Benchmark
1,244
812
26-Oct-07
09-Jan-15
345
401
A (f)
A- (f)
20-Aug-10
26-Oct-07
14.7%
10.5%
14.2%
12.3%
7.7%
6.0%
6.5%
5.9%
SinceInception
22.2%
17.7%
n/a
n/a
7.8%
6.7%
13.6%
6.5%
FY2014
36.3%
28.9%
n/a
n/a
8.7%
7.3%
6.8%
7.0%
FY2013
33.8%
12.1%
n/a
n/a
7.4%
6.7%
9.2%
6.6%
FY2015
13.1%
9.2%
12.9%
15.5%
5.5%
4.9%
7.4%
4.8%
FY2016
20.3%
11.9%
32.5%
18.8%
5.9%
3.1%
5.4%
3.9%
FY2017
(4.6%)
0.3%
(6.9%)
(2.0%)
5.1%
2.5%
5.0%
2.5%
April2018 FYTD
(7.8%)
(4.1%)
(12.8%)
(8.8%)
5.2%
2.4%
5.2%
2.4%
Rolling12 Months
Fund Name
Islamic Income Funds Annualized Returns
Equity Related Islamic Funds Cumulative Returns AnnualizedReturn
NIPF - Money Market Sub-fund
NIPF - Debt Sub-fund
32
37
02-Jul-13
02-Jul-13
5.0%
4.9%
NIPF - Equity Sub-fund 101 02-Jul-13 26.5%
Annualized ReturnsFund Name
Cumulative Returns
6.2%
5.6%
51.5%
n/a
n/a
n/a
n/a
n/a
n/a
3.9%
3.8%
16.9%
3.4%
3.0%
(9.1%)
3.8%
3.9%
35.8%
3.4%
2.5%
(4.9%)
(0.1%)
0.1%
(0.2%)
0.1%
5.6%
2.3%
5.9%
2.3%
3.9%
4.8%
(0.3%)
AnnualizedReturn
ISLAMIC PENSION FUND (NIPF) - Voluntary Pension Scheme (VPS)
Low
est R
isk
Mod
erat
e Ri
skH
igh
Risk
NRF
SFN
IAAF
NIS
FN
IIF
Low
Ris
kH
igh
Risk
Ris
k Pr
o�le
Ris
k Pr
o�le
Notes: 1) Performance is net of management fee and all expenses. The calculation of performance does not include cost of front-end load. For mutual funds the performance reported is based on dividend reinvestment (gross of with-holding tax where applicable). 2) Tax credit also available as per section 62 & 63 of the Income Tax Ordinance, 2001. 3) Taxes apply.
n/a = Not applicable. Asset Manager Rating: AM1 by PACRA (Very High Quality)
Page 01
Islamic Savings
NBP FUNDSManaging Your SavingsPerformance Summary of Key Shariah Compliant Funds

Page 02
Islamic Savings
NBP FUNDSManaging Your Savings
Disclaimer: This publication is for informational purpose only and nothing herein should be construed as a solicitation, recommendation or an offer to buy or sell the fund. All investments in mutual funds and pension funds are subject to market risks. The price of units may go up as well as down. Past Performance is not necessarily indicative of future results.
Federal Budget FY2018-19 - Implications for the Economy and Capital Markets
PML-N government recently announced its sixth and the last budget. As expected, the budget was somewhat populist and
ambitious as it tried to offer relief to all the sectors of the economy and the broader society. The budget envisages boost to
economic growth by placing emphasis on development projects, expanding agriculture sector output, stimulating industrial
sector by lowering tax burden and sustaining robust consumption by offering tax relief to individuals. What remains laudable
about the budget is that the government is making it dif�cult for the non-�lers by placing restriction on acquisition of immovable
assets and automobiles and thereby forcing them to come into the tax net. Similarly, provision has been made to reduce the
steep gap between the real estate’s market rates and the DC rates, which is an important and bold step in addressing the
perennial issue of documenting the economy.
FY18 marked the continued improvement in economic growth as GDP growth is expected to clock in at 5.8%, the highest pace
of growth in the last 13 years. The impressive growth is achieved on account of strong performance of agriculture, industry, and
services sectors, which grew by 3.8%, 5.8% and 6.4%, respectively supported by low interest rates and benign in�ation. The
tailwind to the robust growth is provided by improved energy supplies, unprecedented ongoing investment activity under
China-Pakistan Economic Corridor, strong credit growth, and buoyed investor & consumer con�dence. However, due to the
exchange rate adjustment during the year, the per capita income remained nearly �at at USD1,641.
The economic growth has picked up in the last couple of years, however the imbalances have re-emerged on both the internal
front and especially, on the external side. As per the provisional budget estimates, the government is targeting �scal de�cit at
5.5% during FY18, which will likely be revised upwards in our view due to lower than projected provincial surplus and other
�scal slippages. The current account de�cit stands at USD12 billion during 9MFY18 and the government is expecting it to reach
USD15 billion for the full year 2018. In response to the declining SBP foreign exchange reserves, the government enacted
various policy measures such as an exports rebate package, controlled PKR devaluation, and hike in import duties. The above
policy actions have started yielding some initial results as March 2018 exports showed a healthy 12% growth on a YoY basis.
In�ows from the recently promulgated amnesty scheme remain critical in providing much needed relief on the external front
given lumpy external debt repayments and a still large current account de�cit. Nonetheless, we feel that Pakistan will enter into
a fresh IMF program in FY2019, which will be critical in reducing its external account concerns. In�ation is expected to rise to
near 6% in the next �scal year due to gradual rise in food and commodity prices (notably oil), incessant government’s �scal
�nancing, and measured currency devaluation. Rise in in�ation is also expected to result in increase in interest rates next year.
Tightening of monetary, trade and �scal policies in FY19 is expected to slow down the economic growth rate.
3.7% 4.
1%
4.1% 4.
5%
5.4% 5.
8%
5.0%
2.5%3.0%3.5%4.0%4.5%5.0%5.5%6.0%
FY13 FY14 FY15 FY16 FY17 FY18p FY19fSource: Economic Survey, NBP Funds
Real GDP maintaining its bullish momentum
7.4%
8.6%
4.5%
2.9%
4.1%3.7%
6.0%
2.0%
3.0%
4.0%
5.0%
6.0%
7.0%
8.0%
9.0%
FY13 FY14 FY15 FY16 FY17 FY18p FY19f
Inflation to rise in FY19
Source: PBS, NBP Funds Research

Page 03
Islamic Savings
NBP FUNDSManaging Your Savings
Disclaimer: This publication is for informational purpose only and nothing herein should be construed as a solicitation, recommendation or an offer to buy or sell the fund. All investments in mutual funds and pension funds are subject to market risks. The price of units may go up as well as down. Past Performance is not necessarily indicative of future results.
For the stock market and listed corporate sector, the budget is mainly positive. Though, contrary to expectations, two key
proposals, removal of inter-corporate dividends taxation and rationalization of Capital Gain Tax were not enacted in the budget,
other steps were favorable for the stock market and mutual fund industry such as: (i) abolition of 5% tax on issuance of bonus
shares (for both corporates and mutual funds); (ii) gradual reduction in corporate tax rate (barring banking sector) from 30% to
25% by FY2023; (iii) phasing out of super tax from currently applicable rate of 3% on non-banks and 4% on banks in three years
time; (iv) lowering of mandatory payout ratio from 40% to 20%, reduction of incremental tax on non-compliance from 7% to
5%; and (v) enhancement of investment limit for tax credit on shares and mutual funds from PKR1.5 million to PKR2 million.
For sectors, the budget is a mixed bag. It is positive for the Textile sector as the government has pledged to clear the refunds over
the next 12-months, and reassured to clear new refunds on a monthly basis. The budget also mentions a new export package
(for value added and non conventional markets) details of which will be given later. Fertilizer sector is also a bene�ciary of the
budgetary measures as the government rationalized sales tax rate on fertilizers to 2%, reduced sales tax from 10% to 5% on
supply of feedstock gas, and raised the agri credit target to PKR1.1 trillion. The budget is marginally positive or a non-event for
the Banking, Oil and Gas Marketing, Power Generation & Distribution, and Flat Rolled Steel sectors. It is negative for a few
sectors such as Auto Assemblers as non-�lers are now barred from buying new automobiles; Cement as FED has been raised
from PKR62.5 per bag to PKR75 per bag; and Long Rolled Steel producers as sales tax on electricity has been raised by PKR2.5
per kWh to PKR15 per kWh.
8.0%
5.5% 5.3%4.6%
5.8%6.5%
6.0%
3.0%
4.0%
5.0%
6.0%
7.0%
8.0%
9.0%
FY13 FY14 FY15 FY16 FY17 FY18p FY19f
Fiscal Deficit as % of GDP
Source: MoF, NBP Funds Research
1.1% 1.3% 1.0%1.7%
4.1%
5.0%
4.0%
0.0%
1.0%
2.0%
3.0%
4.0%
5.0%
6.0%
FY13 FY14 FY15 FY16 FY17 FY18p FY19f
Current Account Deficit as % of GDP
Source: SBP, NBP Funds Research

Page 04
Capital Market ReviewIslamic Savings
NBP FUNDSManaging Your Savings
April 2018
Stock Market Review
Money Market Review
Our ContactsContact our Investment Consultant for free Investment advice
Disclaimer: This publication is for informational purposes only and nothing herein should be construed as a solicitation, recommendation or an offer to buy or sell any fund. All investments in mutual funds are subject to market risks. Past performance is not necessarily indicative of future results. Please read the Offering Documents to understand the investment policies and the risks involved.
Call 0800-20002 SMS INVEST to 9995 www.nbpfunds.com [email protected]
In anticipation of favorable tax measures for the capital market in the recently announced federal budget FY2018-19, the stock market started the month on a positive note with the benchmark KMI 30 Index advancing to a recent high of 79,313 on April 10, 2018, translating into an increase of 3.0%. However, the momentum lost steam and the market surrendered nearly all the gains of the �rst week, to �nish the month at �attish level. The promulgation of tax amnesty scheme for declaration of foreign and domestic assets with the objective to address the external account woes and documentation of the economy was welcomed by the market participants. Investors’ optimism around the favorable taxation measures for the capital market in the federal budget reached a fervent point at the beginning of the month. However, the ongoing corporate result season with mixed earnings reports failed to provide any trigger to the market. Despite some of late improvements post the recent devaluation of the currency and other regulatory measures on the non-essential imports, �nancing of the ballooning external de�cit remained investors’ main wall of worry. The market is pinning hopes on the tax amnesty scheme to fetch some amount to help manage the external account imbalance to some extent. We believe that the announcement of schedule of upcoming national elections and the caretaker set-up will ease political uncertainty surrounding the continuation of democratic process in the country. During the month, Foreign Investors, Banks/DFIs, Companies, and Insurance Companies were net sellers, whereas Mutual Funds and Individuals remained net buyers in the market.
During the month, Automobile Assemblers, Chemicals, Fertilizer, Glass & Ceramics, Oil & Gas Marketing, and Pharmaceuticals sectors performed better than the market while, Cement, Commercial Banks, Engineering, Paper & Board, and Textile Composite sectors lagged behind. Healthy earnings announcements in the ongoing corporate results season led to the out-performance of the Automobile Assemblers sector. Chemical sector outshone the market on account of improving pro�t margins and better earnings announcements. Investors accumulated position in the Fertilizer sector in anticipation of favorable budgetary measures in the federal budget FY19. Robust earnings announcement resulted in out-performance of the Glass & Ceramics sector. Better performance of the OMC sector is attributable to above expected earnings announcement by the select companies and expectation of positive developments on resolution of circular debt issue. Despite healthy volumetric growth, subdued pro�tability driven by shrinking pro�t margins resulted in lagged performance of the Cement sector. Drag on earnings from one-off provisioning of pension liabilities, SBP’s decision to keep policy rate unchanged in its last review, and tightening regulatory requirements resulted in the subdued performance of the Banking sector. The Textile Composite sector under-performed the market on account of dismal performance of a select stock amid disappointing earnings announcement. In spite of better than forecasted earnings announcement, expectation of unfavorable policy measures in the budget led to lagged performance of the Engineering sector.
Going forward, market may remain choppy amid rising noise in the domestic politics ahead of national elections and developments on the Pak-US relations. That being said, we hold sanguine view on the stock market given: (i) attractive valuations as captured in Price–to-Earnings multiples of 10.3; (ii) Low in�ation & still benign interest rates; (iii) plentiful market liquidity; (iv) paltry yield on the alternative investment avenues; and (v) expectation of resumption of foreign portfolio in�ows in due course of time.
After recording 3.2% YoY in March 2018, in�ation as measured by the CPI for April 2018 increased to 3.7%. The monthly CPI reading came in above expectation and is the highest MoM rise in 53 months. Reiterating our view, we expect in�ation to further pick-up from these levels amid second round impact of the recent PKR depreciation, partial pass-through of the recent increase in the global oil prices, and reversal of base effect. During the month, sovereign yields came off slightly as against the market expectation of 25-50 bps increase, the central bank kept the policy rate unchanged in its bi-monthly monetary policy review at the end of March 2018. Foreseeing upside risks to in�ation and interest rates, investors’ preference remained tilted towards the short tenor government securities. Through Open Market Operation (OMO), the State Bank of Pakistan managed the weighted average overnight repo rate at 6.02%. SBP’s foreign exchange reserves remained under pressure, declining by USD685 million to USD10.9 billion as per the last reported number on 20th April.
During the outgoing month, SBP held two T-Bill auctions with a combined target of Rs. 1,900 billion against the maturity of Rs. 2,299 billion. In the ¬�rst T-Bill auction, an amount of Rs. 1,897 billion was accepted at a cut-off yield of 6.24% for 3 months tenor and 6.35% for 6 months tenor, however no bids were received in 12 months tenor. In the second T-Bill auction an amount of Rs. 1,477 billion was accepted at a yield of 6.26% for 3 months tenor and at a 6.35% yield for 6 months tenor. Again no bids were received for 12 months tenor. Besides, in the PIB auction, bids worth Rs. 88 billion for 3 years, 5 years and 10 years tenor were received against the target of Rs. 100 billion and maturity of Rs. 31 billion wherein an amount of Rs. 35 billion was accepted at a cut-off yield of 7.20%, 8.03% and 8.50%, respectively, while, no bid was received in 20 years tenor. The bid pattern remained skewed towards 10 years tenor.
We have calibrated the portfolio of our money market and income funds based on our interest rate outlook and remain alert to any developments that may in�uence our investment strategy.

Page 05
NAFA Riba Free Savings Fund (NRFSF)Islamic Savings
NBP FUNDSManaging Your Savings
Disclaimer: This publication is for informational purposes only and nothing herein should be construed as a solicitation, recommendation or an offer to buy or sell any fund. All investments in mutual funds are subject to market risks. Past performance is not necessarily indicative of future results.Please read the Offering Document to understand investment policies and the risks involved.
Dr. Amjad Waheed, CFASajjad Anwar, CFA
Muhammad Ali Bhabha, CFA, FRMHassan Raza, CFA
April 2018
GOP Ijara Sukuks Commercial Paper (Islamic) Bank Deposits Others including receivables Total Leverage
31-Mar-182.9%4.3%
91.7%1.1%
100.0%Nil
2.9%4.2%
91.8%1.1%
100.0%Nil
30-Apr-18Asset Allocation (% of Total Assets)
Sindh Workers' Welfare Fund (SWWF)
Unit Price (30/04/2018): Rs. 10.6229
Launch Date: August 20, 2010Fund Size: Rs. 3,449millionType: Open-end – Shariah Compliant Income FundDealing Days: Daily – Monday to SaturdayDealing Time: (Mon - Thr) 9:00 A.M to 5:00 P.M (Friday) 9:00 A.M to 5:30 P.M (Saturday) 9:00 A.M to 1:00 P.MSettlement: 2-3 business daysPricing Mechanism: Forward PricingLoad:*** Front End Load (Individual): without life Takaful 0.5%, with life Takaful 3% (Nil on investment above Rs. 26 million) Front End Load (Other): 0.5% (Nil on investment above Rs. 16 million) Back End Load: NILManagement Fee: 10% of Net Income (Min 0.5% p.a., Max 1.25% p.a.)Total Expense Ratio: 1.13% p.a.(including 0.26% government levies) Risk Pro�le: Very LowFund Stability Rating: "A(f)" by PACRAListing: Pakistan Stock ExchangeCustodian & Trustee: Central Depository Company (CDC)Auditors: Deloitte Yousuf Adil Chartered AccountantsBenchmark:** 6-month average deposit rates of three A rated Islamic Banks/Islamic windows of conventional banks as selected by MUFAPFund Manager: Muhammad Ali Bhabha CFA,FRMMinimum Growth Unit: Rs. 10,000/-Subscription: Income Unit: Rs. 100,000/-Asset Manager Rating: AM1 by PACRA (Very High Quality)
To provide preservation of capital and earn a reasonable rate of return along with a high degree of liquidity by investing in short-term Shariah Compliant banks and money market / debt securities.
The Fund generated an annualized return of 5.6% for the month of April 2018 versus the Benchmark return of 2.3% thus registering an outperformance of 3.3% p.a. This reported return is net of management fee and all other expenses.
The Fund aims to consistently provide better return than the pro�t rates offered by Islamic Banks / Islamic windows of commercial banks, while also providing easy liquidity along with a high quality credit pro�le. The Fund is allowed to invest in short-term Shariah Compliant money market securities of up to six months maturity rated AA- or better. The Fund is not authorized to invest in corporate debt securities and Equities.
The allocation of the Fund in GOP Ijarah Sukuks is around 2.9% of net assets. Around 92% of net assets of the portfolio are invested in bank deposits which enhance the liquidity pro�le of the Fund. The weighted average time to maturity of the Fund is 9 days.
We will rebalance the allocation of the Fund proactively based on the capital market outlook.
The scheme has maintained provisions against Sindh Workers' Welfare Fund's liability to the tune of Rs. 4,348,799/-. If the same were not made the NAV per unit/last one year return of scheme would be higher by Rs. 0.0134/0.13%. For details investors are advised to read note 5 of the �nancial statements of the Scheme for the period ended March 31, 2018.
* Annualized Return Based on Morning Star Methodology All other returns are Annualized Simple Return
The performance reported is net of management fee & all other expenses and based on dividend reinvestment gross of with-holding tax where applicable.
Performance Period
Performance %Apr2018
5.6%
2.3%
FYTD2018
5.1%
2.5%
5.2%
2.4%
7.4%
6.7%
FY2014
7.8%
6.7%
FY2015
5.9%
3.1%
FY2017
5.5%
4.9%
FY2016
8.7%
7.3%
FY2013
5.6%
3.7%
Last 3years*
6.4%
4.9%
Last 5years*
7.7%
6.0%
Since LaunchAugust 20, 2010*
NAFA Riba Free Savings Fund
Benchmark**
Notes: 1) The calculation of performance does not include cost of front end load. 2) Taxes apply. Further, tax credit also available as per section 62 of the Income Tax Ordinance, 2001.
Credit Quality of the Portfolio as of April 30, 2018 (% of Total Assets)
GOP Ijarah Sukuk (AAA rated)AAAAA+AAAA-A+A-Others including receivablesTotal
2.9%40.5%0.2%1.0%4.4%1.0%48.9%1.1%
100.0%
** effective from September 01, 2016; Previously Average 6-month deposit rate of A- and above rated Islamic Banks*** effective from January 02, 2017
Rolling12 months

Page 06
NAFA Islamic Income Fund (NIIF)Islamic Savings
NBP FUNDSManaging Your Savings
Disclaimer: This publication is for informational purposes only and nothing herein should be construed as a solicitation, recommendation or an offer to buy or sell any fund. All investments in mutual funds are subject to market risks. Past performance is not necessarily indicative of future results. Please read the Offering Document to understand investment policies and the risks involved. The scheme holds certain non-compliant investments. Before making any investment decision, investors should review the latest monthly Fund Manager Report and Financial Statements. The reported returns may include provisioning and reversal of provisioning against some debt securities.
Details of Non-Compliant Investments
Particulars
New Allied Electronics (Sukuk I)
New Allied Electronics (Sukuk II)
Total
SUKUK
SUKUK
110,000,000
4,905,437
114,905,437
110,000,000
4,905,437
114,905,437
-
-
-
-
-
0.0%
-
-
0.0%
Type ofInvestment
Value of Investments
before Provision
Value of Investments
after Provision
% of Net
Assets
% ofGrossAssets
Provisionheld
General Information
Top Sukuk Holdings (as at April 30, 2018)
Name of the Members of Investment Committee
Sindh Workers' Welfare Fund (SWWF)
Investment Objective
Fund Manager Commentary
Dr. Amjad Waheed, CFASajjad Anwar, CFA
Muhammad Ali Bhabha, CFA, FRMHassan Raza, CFA
Asset Allocation (% of Total Assets) 30-Apr-18 30-Mar-18Sukuks GOP Ijara Sukuks - Govt. Backed Certi�cate of Musharakah (COM) Bank Deposits Commercial Papers (Islamic) Others including receivables Total Leverage
6.5%9.8%4.9%
74.0%3.7%1.1%
100.0%Nil
7.0%10.4%5.3%
72.3%3.9%1.1%
100.0%Nil
Launch Date: October 26, 2007Fund Size: Rs. 4,012 millionType: Open-end – Shariah Compliant Income FundDealing Days: Daily – Monday to FridayDealing Time: (Mon - Thr) 9:00 A.M to 5:00 P.M (Friday) 9:00 A.M to 5:30 P.MSettlement: 2-3 business daysPricing Mechanism: Forward PricingLoad:*** Front End Load (Individual): without life Takaful 1%, with life Takaful 3% (Nil on investment above Rs. 26 million) Front End Load (Other): 1% (Nil on investment above Rs. 16 million) Back End Load: NILManagement Fee: 10% of Net Income (Min 0.5% p.a., Max 1.0% p.a.)Total Expense Ratio: 1.10% p.a. (including 0.27% government levies)Risk Pro�le: Low to MediumFund Stability Rating: "A-(f)" by PACRAListing: Pakistan Stock ExchangeCustodian & Trustee: Central Depository Company (CDC)Auditors: Deloitte Yousuf Adil Chartered AccountantsBenchmark:** 6-month average deposit rates of three A rated Islamic Banks/Islamic windows of conventional banks as selected by MUFAPFund Manager: Muhammad Ali Bhabha, CFA, FRMMinimum Growth Unit: Rs. 10,000/-Subscription: Income Unit: Rs. 100,000/-Asset Manager Rating: AM1 by PACRA (Very High Quality)
To earn a reasonable rate of return in a Shariah Compliant manner by investing in Shariah Compliant debt securities, money market instruments and bank deposits.
During the month under review, the Fund posted an annualized return of 5.9% as compared to the Benchmark return of 2.3% thus registering an outperformance of 3.6% p.a. This outperformance is net of management fee and all other expenses.
The allocation in corporate Sukuks stood at around 6.6% of the net assets. Around 75% of net assets of the portfolio are allocated in bank deposits. The higher allocation in bank deposits is due to better yields as compared to other authorized alternative investment avenues.
The weighted average Yield-to-Maturity (YTM) of the Sukuk portfolio is around 6.4% p.a. and weighted average time to maturity is 3.1 years. The weighted average time to maturity of the Fund is 189 days.
We will rebalance the allocation of the Fund proactively based on the capital market outlook.
Name of Sukuk
Dubai Islamic Bank - Sukuk 14-JUL-17 14-JUL-27Pak Elektron Limited - Sukuk 19-FEB-18 19-MAY-19K-Electric AZM Sukuk Limited - 5 Years 19-MAR-14 19-MAR-19
Total
% of Total Assets
3.3%2.5%0.7%6.5%
MONTHLY REPORT (MUFAP's Recommended Format)Unit Price (30/04/2018): Rs. 9.9002 April 2018
The scheme has maintained provisions against Sindh Workers' Welfare Fund's liability to the tune of Rs. 6,117,481/-. If the same were not made the NAV per unit/ last one year return of scheme would be higher by Rs. 0.0151/0.16%. For details investors are advised to read note 5 of the �nancial statements of the Scheme for the period ended March 31, 2018.
* Annualized Return Based on Morning Star Methodology All other returns are Annualized Simple Return
The performance reported is net of management fee & all other expenses and based ondividend reinvestment gross of with-holding tax where applicable.
Performance Period
Performance %Apr2018
13.6%
6.5%
FY2014
FY2015
5.9%
2.3%
FYTD2018
5.0%
2.5%
5.2%
2.4%
9.2%
6.6%
FY2016
7.4%
4.8%
FY2017
5.4%
3.9%
6.8%
7.0%
FY2013
6.2%
3.9%
Last 3years*
8.3%
5.0%
Last 5years*
6.5%
6.0%
Last 10years*
6.5%
5.9%
Since Launch October 26,
2007*
NAFA Islamic Income Fund
Benchmark**
Notes: 1) The calculation of performance does not include cost of front end load.2) Taxes apply. Further, tax credit also available as per section 62 of the Income Tax Ordinance, 2001.
Credit Quality of the Portfolio as of April 30, 2018 (% of Total Assets)
GOP Ijarah Sukuk (AAA rated)AAAAA+AAAA‐A+A‐Others including receivablesTotal
9.8%25.5%5.0%0.7%6.3%4.5%47.1%1.1%
100.0%
** effective from March 14, 2017; Previously 1-year average deposit rates of three A rated Islamic Banks/Islamic windows of conventional banks as selected by MUFAP*** effective from January 02, 2017
Rolling12 months

Page 07
NAFA Islamic Money Market Fund (NIMMF)Islamic Savings
NBP FUNDSManaging Your Savings
Disclaimer: This publication is for informational purposes only and nothing herein should be construed as a solicitation, recommendation or an offer to buy or sell any fund. All investments in mutual funds are subject to market risks. Past performance is not necessarily indicative of future results. Please read the Offering Document to understand investment policies and the risks involved.
April 2018
To provide competitive return with maximum possible capital preservation by
investing in low risk and liquid Shariah Compliant authorized instruments.
The Fund generated an annualized return of 4.6% for the month of April 2018 versus the Benchmark return of 2.6% thus registering an outperformance of 2.0% p.a. This reported return is net of management fee and all other expenses.
The Fund aims to consistently provide better return than the pro�t rates offered by Islamic Banks / Islamic windows of commercial banks. Minimum eligible rating is AA, while the Fund is not allowed to invest in any security exceeding six months maturity. The weighted average time to maturity of the Fund cannot exceed 90 days while also providing easy liquidity along with a high quality credit pro�le.
The allocation of the Fund in bank deposits is around 99% of net assets which enhances the liquidity pro�le of the Fund. The weighted average time to maturity of the Fund is 1 day.
We will rebalance the allocation of the Fund proactively based on the capital market outlook.
Unit Price (30/04/2018): Rs. 10.0749MONTHLY REPORT (MUFAP's Recommended Format)
Launch Date: February 28, 2018Fund Size: Rs. 1,639 millionFund Size (excluding Rs. 12 millioninvestment by Fund of Funds) Type: Open-end – Shariah Compliant Money Market FundDealing Days: Daily – Monday to SaturdayDealing Time: (Mon - Thr) 9:00 A.M to 5:00 P.M (Friday) 9:00 A.M to 5:30 P.M (Saturday) 9:00 A.M to 1:00 P.MSettlement: 2-3 business daysPricing Mechanism Forward PricingLoad: Front End Load:0.5%Back End Load: NILManagement Fee: 1.00% p.a.Total Expense Ratio: 1.62% p.a. (including 0.31% government levies)Risk Pro�le: Very LowListing: Pakistan Stock ExchangeCustodian & Trustee: Central Depository Company (CDC)Auditors: Deloitte Yousuf Adil Chartered AccountantsBenchmark: Three months average deposit rates of three (3) AA rated Islamic Banks or Islamic windows of Conventional Banks as selected by MUFAP.Fund Manager: Muhammad Ali Bhabha, CFA, FRMMinimum Growth Unit: Rs. 10,000/-Subscription: Income Unit: Rs. 100,000/-Asset Manager Rating: AM1 by PACRA (Very High Quality)
Bank Deposits Others including receivables Total Leverage
Asset Allocation (% of Total Assets)
Sindh Workers' Welfare Fund (SWWF)
99.4%0.6%
100.0%Nil
31-Mar-1898.9%1.1%
100.0%Nil
30-Apr-18
4.5%
2.6%
Since LaunchFebruary 28, 2018*
4.6%
2.6%
Apr2018
*Simple Annualized Return The performance reported is net of management fee & all other expenses
NAFA Islamic Money Market Fund
Performance Period
The scheme has maintained provisions against Sindh Workers' Welfare Fund's liability to the tune of Rs. 244,702/-. If the same were not made the NAV per unit/since inception return of scheme would be higher by Rs. 0.0015/0.09%. For details investors are advised to read note 9.1 of the �nancial statements of the Scheme for the period ended March 31, 2018.
Dr. Amjad Waheed, CFASajjad Anwar, CFA
Muhammad Ali Bhabha, CFA, FRMHassan Raza, CFA
Notes: 1) The calculation of performance does not include cost of front end load.2) Taxes apply. Further, tax credit also available as per section 62 of the Income Tax Ordinance, 2001.
Performance %
Credit Quality of the Portfolio as of April 30, 2018 (% of Total Assets)
AAAAA+A-Others including receivablesTotal
81.2%17.6%0.1%1.1%
100.0%
Note: Amount invested by fund of funds is Rs. 1,627 million

Page 08
NAFA Islamic Asset Allocation Fund (NIAAF)Islamic Savings
NBP FUNDSManaging Your Savings
Top Five Sectors (% of Total Assets) (as on April 30, 2018)
Oil & Gas Exploration Companies Cement Fertilizer Oil & Gas Marketing Companies Power Generation & Distribution Others
15.1%6.6%6.3%4.9%4.6%
15.5%
Disclaimer: This publication is for informational purposes only and nothing herein should be construed as a solicitation, recommendation or an offer to buy or sell any fund. All investments in mutual funds are subject to market risks.Past performance is not necessarily indicative of future results. Please read the Offering Documents to understand the investment policies and the risk involved. The scheme holds certain non-compliant investments. Before making any investment decision, investors should review the latest monthly Fund Manager Report and Financial statements. The reported return may include provisions and reversal of provisions against some debt securities.
‘s
April 2018
30-Apr-18Asset Allocation (% of Total Assets)
Sindh Workers' Welfare Fund (SWWF)
Top Ten Holdings (as on April 30, 2018)
Details of Non-Compliant Investments
Equities / Stocks Cash Others including receivables Total Leverage
53.0%46.2%0.8%
100.0%Nil
51.2%48.2%0.6%
100.0%Nil
30-Mar-18
PER10.410.5
NIAAFPBV2.22.0
DY4.5%4.6%
Unit Price (30/04/2018): Rs. 16.2045
Launch Date: October 26, 2007Fund Size: Rs. 12,438 million Fund Size: (Excluding investmentby fund of funds) Rs. 12,423 millionType: Open-end-Shariah Compliant -Asset Allocation FundDealing Days: Daily – Monday to FridayDealing Time: (Mon-Thr) 9:00 A.M to 4:30 P.M (Friday) 9:00 A.M to 5:00 P.MSettlement: 2-3 business daysPricing Mechanism: Forward PricingLoad:*** Front End Load (Individual): 3%, (Nil on investment above Rs. 101 million) Front End Load (Other): 3% (Nil on investment above Rs. 50 million) Back End Load: NILManagement Fee: 2% per annum Total Expense Ratio (%) 3.07% p.a (including 0.37% government levies)Selling & Marketing Expenses 0.4% per annum Risk Pro�le: Moderate Listing: Pakistan Stock ExchangeCustodian & Trustee: Central Depository Company (CDC)Auditors: Deloitte Yousuf Adil Chartered AccountantsBenchmark:** Daily weighted return of KMI-30 Index & 6-month average deposit rates of three A rated Islamic Banks/Islamic windows of conventional banks as selected by MUFAP, based on Fund's actual allocation.Fund Manager: Taha Khan Javed, CFAMinimum Growth Unit: Rs. 10,000/-Subscription: Income Unit: Rs. 100,000/-Asset Manager Rating: AM1 by PACRA (Very High Quality)
To generate capital appreciation by investing in Shariah Compliant equity and equity related securities and income by investing in Shariah Compliant bank deposits, debt & money market securities.
During the month under review, unit price (NAV) of NAFA Islamic Asset Allocation Fund (NIAAF) decreased by 0.1%, whereas the Benchmark increased by 0.1%, thus an underperformance of 0.2% was recorded. Since inception your Fund has posted 14.7% p.a return, versus 10.5% p.a by the Benchmark. Thus, to-date the outperformance of your Fund stands at 4.2% p.a. This outperformance is net of management fee and all other expenses.
NIAAF started off the month with an allocation of around 51% in equities, which increased to around 53% towards the end of the month. NIAAF underperformed the Benchmark in April as the Fund was underweight in select Fertilizer sector stocks which outperformed the market and overweight in select Textile Composite, Engineering, and Cement sectors stocks which underperformed the market. During the month, the allocation was increased primarily in Oil & Gas Exploration Companies, Power Generation & Distribution Companies, Fertilizer, and Oil & Gas Marketing Companies sectors, whereas it was reduced primarily in Cement & Automobile Assembler sectors.
Pakistan Oil�elds Ltd
Pak Petroleum Ltd
Mari Petroleum Company Ltd
Oil & Gas Dev Co Ltd
Engro Corporation Ltd
Eden Housing (Sukuk II)
Total
4,921,875
4,921,875
4,921,875
4,921,875
-
-
-
-
Hub Power Company Ltd
Nishat Mills Ltd
Engro Fertilizer Ltd
Pakistan State Oil Co. Ltd
Indus Motor Company Ltd
-
-
SUKUK
Equity
Equity
Equity
Equity
Equity
2.9%
2.6%
2.4%
1.8%
1.7%
Equity
Equity
Equity
Equity
Equity
3.9%
3.9%
3.7%
3.6%
3.6%
% of TotalAssets
% of TotalAssets
The Scheme has maintained provisions against worker’s welfare Fund’s liability to the tune of Rs. 60,862,273/- if the same were not made the NAV Per unit/return of the Scheme would be higher by Rs. 0.0793/0.45%. For details investors are advised to read the note 5 of the Financial Statements of the Scheme for the period ended March 31, 2018.
Dr. Amjad Waheed, CFASajjad Anwar, CFA
Muhammad Ali Bhabha, CFA, FRMTaha Khan Javed, CFA
Hassan Raza, CFA
* Annualized ReturnAll Other returns are Cumulative
The performance reported is net of management fee & all other expenses and based on dividendreinvestment gross of with-holding tax where applicable.
Performance Period
Performance %Apr2018
(0.1%)
0.1%
FYTD2018
(4.6%)
0.3%
(7.8%)
(4.1%)
22.2%
17.7%
36.3%
28.9%
FY2014
33.8%
12.1%
FY2015
13.1%
9.2%
FY2016
20.3%
11.9%
FY2017
FY2013
10.1%
7.7%
Last 3Years*
18.7%
11.4%
Last 5Years*
15.3%
10.6%
Last 10Years*
14.7%
10.5%
Since LaunchOctober 26, 2007*
Benchmark**
NAFA Islamic Asset Allocation Fund
Note:** Effective from September 01, 2016; Previously average of (i) average 3-month Islamic banks deposit rate (ii) 6-month KIBOR or its Shariah Compliant equivalent (iii) KMI 30 Index** KSE-30 is used as equity component for the Benchmark before June 30, 2008, the launch date of KMI-30 Index. The fund category was changed to Islamic Asset Allocationfrom Islamic Balanced with effect from April 22, 2014. Consequently, allowed equity range is now 0% to 90% which previously was 30% to 70%. Previous benchmark was50% KMI-30 Index & 50% Islamic Bank Deposit.
Notes: 1) The calculation of performance does not include cost of front end load.2) Taxes apply. Further, tax credit also available as per section 62 of the Income Tax Ordinance, 2001.
*** effective from January 02, 2017
Note: Amount invested by fund of funds is Rs 15 million.
Rolling12 months
NIAAF, 33.6%
Benchmark **25.0%
-10.0%
0.0%
10.0%
20.0%
30.0%
40.0%
50.0%
60.0%
30-A
pr-1
5
31-Ju
l-15
31-O
ct-1
5
31-Ja
n-16
30-A
pr-1
6
31-Ju
l-16
31-O
ct-1
6
31-Ja
n-17
30-A
pr-1
7
31-Ju
l-17
31-O
ct-1
7
31-Ja
n-18
30-A
pr-1
8
NIAAF Benchmark **Annualized Return 10.1% 7.7%Risk (Std. Deviation) 10.1% 8.8%
Relative Performance of NAFA Islamic Asset Allocation Fund (NIAAF)for the Last Three Years
Cum. Return
**** Based on NBP Funds estimates

Page 09
NAFA Islamic Stock Fund (NISF)Islamic Savings
NBP FUNDSManaging Your Savings
Disclaimer: This publication is for informational purposes only and nothing herein should be construed as a solicitation, recommendation or an offer to buy or sell any fund. All investments in mutual funds are subject to market risks. Past performance is not necessarily indicative of future results. Please read the Offering Document to understand the investment policies and the risks involved.
Top Ten Holdings (as on April 30, 2018)
Pak Petroleum Ltd
Engro Corporation Ltd
Oil & Gas Dev Co Ltd
Pakistan Oil�elds Ltd
Engro Fertilizer Ltd
Nishat Mills Ltd
Hub Power Company Ltd
Pakistan State Oil Co Ltd
Mari Petroleum Company Ltd
International Steel Ltd
4.7%
4.5%
3.7%
3.5%
3.3%
7.6%
7.0%
6.5%
5.5%
4.8%
% of TotalAssets
% of TotalAssets
* Annualized ReturnAll Other returns are Cumulative
The performance reported is net of management fee & all other expenses and based on dividendreinvestment gross of with-holding tax where applicable.
‘
Launch Date: January 9, 2015Fund Size: Rs. 8,125 million Fund Size: (Excludinginvestment by fund of funds) Rs. 8,116 million Type: Open-end-Shariah Compliant-Equity FundDealing Days: Daily – Monday to FridayDealing Time: (Mon-Thr) 9:00 A.M to 4:30 P.M (Friday) 9:00 A.M to 5:00 P.MSettlement: 2-3 business daysPricing Mechanism Forward Pricing Load:** Front End Load (Individual):3% (Nil on investment above Rs. 101 million) Front End Load (Other): 3% (Nil on investment above Rs. 50 million) Back End Load: NILManagement Fee: 2% per annumTotal Expense Ratio (%) 3.20% p.a.(including 0.37% government levies)Selling & Marketing Expenses 0.4% per annumRisk Pro�le HighListing: Pakistan Stock ExchangeCustodian & Trustee: Central Depository Company (CDC)Auditors: A. F. Ferguson & Co. Chartered AccountantsBenchmark: KMI-30 IndexFund Manager: Sajjad Anwar, CFAMinimum Growth Unit: Rs. 10,000/-Subscription: Income Unit: Rs. 100,000/-Asset Manager Rating: AM1 by PACRA (Very High Quality)
The objective of the Fund is to provide investors with long term capital growth
from an actively managed portfolio of Shariah Compliant listed equities.
During the month under review, NAFA Islamic Stock Fund’s (NISF) unit price (NAV) decreased by 0.2%, whereas the Benchmark increased by 0.1%, thus an underformance of 0.3% was recorded. Since inception on January 9, 2015 your Fund has posted 14.2% p.a return, versus 12.3% p.a by the Benchmark. Thus, to-date the outperformance of your Fund stands at 1.9% p.a. This outperformance is net of management fee and all other expenses.
NISF started off the month with an allocation of around 86% in equities, which increased to around 91% towards the end of the month. NISF underperformed the Benchmark in April as the Fund was underweight in select Oil & Gas Exploration Companies, Oil & Gas Marketing Companies, and Fertilizer sectors stocks which outperformed the market and overweight in select Cement, Engineering, and Pharmaceuticals sectors stocks which underperformed the market. During the month, the allocation was increased primarily in Oil & Gas Exploration Companies, Technology & Communication, Fertilizer, and Oil & Gas Marketing Companies sectors, whereas it was reduced primarily in Automobile Assembler and Cement sectors.
April 2018
Since Launch*January 09, 2015
14.2%
12.3%
Apr2018
(0.2%)
0.1%
FYTD2018
(6.9%)
(2.0%)
(12.8%)
(8.8%)
FY2016
12.9%
15.5%
Last 3Years*
12.7%
11.7%
FY2017
32.5%
18.8%
NAFA Islamic Stock Fund
Performance Period
Equities / Stocks Cash Equivalents Others including receivables Total Leverage
PER10.310.5
NISFKMI-30
PBV2.02.0
DY4.3%4.6%
Dr. Amjad Waheed, CFASajjad Anwar, CFA
Taha Khan Javed, CFAHassan Raza, CFA
30-Mar-1890.7%8.3%1.0%
100.0%Nil
86.3%13.0%0.7%
100.0%Nil
30-Apr-18Asset Allocation (% of Total Assets)
Characteristics of Equity Portfolio***
Unit Price (30/04/2018): Rs.12.1634
The Scheme has maintained provisions against Sindh worker’s welfare Fund’s liability to the tune of Rs. 44,440,040/- if the same were not made the NAV Per unit/last one year return of the Scheme would be higher by Rs. 0.0665/0.48% age.For details investors are advised to read the Note 6 of the Financial Statements of the Scheme for the period ended March 31, 2018.
Sindh Workers' Welfare Fund (SWWF)
Notes: 1) The calculation of performance does not include cost of front end load.2) Taxes apply. Further, tax credit also available as per section 62 of the Income Tax Ordinance, 2001.
Performance %
Top Five Sectors (% of Total Assets) (as on April 30, 2018)
Oil & Gas Exploration Companies Fertilizer Cement Oil & Gas Marketing Companies Power Generation & Distribution Others
23.0%12.4%11.4%7.6%6.6%
29.7%
** effective from January 02, 2017
Note: Amount invested by fund of funds is Rs 9 million.
Rolling12 months
**** Based on NBP Funds estimates
NISF, 43.2%Benchmark, 39.5%Peers Avg., 29.5%
-25%
0%
25%
50%
75%
100%
30-A
pr-1
5
31-J
ul-1
5
31-O
ct-1
5
31-J
an-1
6
30-A
pr-1
6
31-J
ul-1
6
31-O
ct-1
6
31-J
an-1
7
30-A
pr-1
7
31-J
ul-1
7
31-O
ct-1
7
31-J
an-1
8
30-A
pr-1
8
NISF Benchmark Peers Avg.
Relative Performance of NAFA Islamic Stock Fund (NISF)for the Last Three Years Cumulative
Return
Annualized Return 12.7% 11.7% 8.9%Risk (Std. Deviation) 15.3% 17.1% 15.8%

Page 10
NAFA Islamic Energy Fund (NIEF)Islamic Savings
NBP FUNDSManaging Your Savings
Notes: 1) The calculation of performance does not include cost of front end load.2) Taxes apply. Further, tax credit also available as per section 62 of the Income Tax Ordinance, 2001.
Top Ten Holdings (as on April 30, 2018)
Pak Petroleum Ltd
Oil & Gas Dev.Co
Pakistan Oil�elds Ltd
Mari Petroleum Company Ltd
Pakistan State Oil Co. Ltd
Hub Power Company Ltd
Sui Northern Gas Ltd
Attock Petroleum Ltd
Hascol Petroleum Ltd
Sui Southern Gas Co. Ltd
6.5%
6.0%
5.2%
4.8%
4.5%
13.6%
10.1%
10.0%
9.4%
7.4%
% of TotalAssets
% of TotalAssets
PER10.310.5
NIEFKMI-30
PBV2.42.0
DY4.0%4.6%
Disclaimer: This publication is for informational purposes only and nothing herein should be construed as a solicitation, recommendation or an offer to buy or sell any fund. All investments in mutual funds are subject to market risks.Past performance is not necessarily indicative of future results. Please read the Offering Documents to understand the investment policies and the risks involved.
* Annualized ReturnAll Other returns are Cumulative
The performance reported is net of management fee & all other expenses and based on dividend reinvestmentgross of with-holding tax where applicable.
‘
Launch Date: April 21, 2016Fund Size: Rs. 1,911 millionType: Open Ended Shariah Compliant Equity SchemeDealing Days: Daily – Monday to FridayDealing Time: (Mon - Thr) 9:00 A.M to 4:30 P.M (Friday) 9:00 A.M to 5:00 P.MSettlement: 2-3 business daysPricing Mechanism Forward PricingLoad:** Front End Load (Individual): 3% (Nil on investment above Rs. 101 million) Front End Load (Other): 3% (Nil on investment above Rs. 50 million) Back End Load: NILManagement Fee: 2% p.aTotal Expense Ratio (%) 3.36% p.a (including 0.41% government levies)Selling & Marketing Expenses 0.4% per annum Risk Pro�le HighListing: Pakistan Stock ExchangeCustodian & Trustee: Central Depository Company (CDC)Auditors: A. F. Ferguson & Co. Chartered AccountantsBenchmark: KMI-30 IndexFund Manager: Taha Khan Javed, CFAMinimum Growth Unit: Rs. 10,000/-Subscription: Income Unit: Rs. 100,000/-Asset Manager Rating: AM1 by PACRA ( Very High Quality)
The objective of NAFA Islamic Energy Fund is to provide investors with long term capital growth from an actively managed portfolio of Shari’ah Compliant listed equities belonging to the Energy Sector.
NBP Funds launched its third open-end Islamic Equity Fund namely NAFA Islamic Energy Fund (NIEF) in April, 2016. The aim of the Fund is to provide growth to the investment of Unit holders over the long-term in approved Shariah compliant energy stocks.
NIEF started off the month with an allocation of around 84% in equities, which increased to around 92% towards the end of the month. NIEF outperformed the Benchmark in April as the Fund was overweight in select Energy sectors stocks which outperformed the market. During the month, the allocation was increased primarily in Oil & Gas Marketing Companies sector and Oil & Gas Exploration Companies sectors, whereas it was reduced primarily in Power Generation & Distribution Companies sector.
April 2018
Since Launch*April 21, 2016
21.1%
14.1%
Apr2018
1.8%
0.1%
FYTD2018
1.8%
(2.0%)
FY2017
32.2%
18.8%
Rolling12 months
(4.3%)
(8.8%)
NAFA Islamic Energy Fund
Performance Period
Equities / Stocks Cash Equivalents Others including receivables Total Leverage
84.1%14.8%1.1%
100.0%Nil
30-Mar-1892.4%5.9%1.7%
100.0%Nil
30-Apr-18Asset Allocation (% of Total Assets)
Unit Price (30/04/2018): Rs. 13.3283
%
Dr. Amjad Waheed, CFASajjad Anwar, CFA
Taha Khan Javed, CFAHassan Raza, CFA
Sectors (% of Total Assets) (as on April 30, 2018)
Oil & Gas Exploration Companies Oil & Gas Marketing Companies Power Generation & Distribution Re�nery
43.0%34.4%12.6%2.4%
**effective from January 02, 2017
The Scheme has maintained provisions against sindh worker’s welfare Fund’s liability to the tune of Rs. 14,763,020/- if the same were not made the NAV Per unit/return of the Scheme would be higher by Rs 0.1030/0.74%. For details investors are advised to read the note 6 of the Financial Statements of the Scheme for the period ended March 31, 2018.
Sindh Workers' Welfare Fund (SWWF)
*** Based on NBP Funds estimates
NIEF, 47.3%
KMI-30, 30.6%
0.0%
20.0%
40.0%
60.0%
80.0%
22-A
pr-1
6
22-M
ay-1
6
22-J
un-1
6
22-J
ul-1
6
22-A
ug-1
6
22-S
ep-1
6
22-O
ct-1
6
22-N
ov-1
6
22-D
ec-1
6
22-J
an-1
7
22-F
eb-1
7
22-M
ar-1
7
22-A
pr-1
7
22-M
ay-1
7
22-J
un-1
7
22-J
ul-1
7
22-A
ug-1
7
22-S
ep-1
7
22-O
ct-1
7
22-N
ov-1
7
22-D
ec-1
7
22-J
an-1
8
22-F
eb-1
8
22-M
ar-1
8
22-A
pr-1
8
NIEF KMI-30Annualized Return 21.1% 14.1%Risk (Std. Deviation) 16.1% 17.7%
Relative Performance of NAFA Islamic Energy Fund (NIEF)Since Launch on April 21, 2016
Cum. Return
30-A
pr-1
8

Page 11
NAFA Islamic Pension Fund (NIPF)Islamic Savings
NBP FUNDSManaging Your Savings
NIPF-Equity Sub-fund
NIPF-Debt Sub-fund
NIPF-Money Market Sub-fund
313.9923
126.9619
127.8172
1,007.6
368.8
317.9
The performance reported is net of management fee & all other expenses.* Cumulative Returns All Other returns are annualized
(0.3%)*
4.8%
3.9%
26.5%
4.9%
5.0%
NAV Per Unit (Rs.)April 30, 2018
Apr2018
(4.9%)*
2.5%
3.4%
FYTD2018
(9.1%)*
3.0%
3.4%
Rolling12 Months
51.5%*
5.6%
6.2%
FY2015
16.0%
3.5%
3.8%
Last 3Years
16.9%*
3.8%
3.9%
FY2016
35.8%*
3.9%
3.8%
FY2017
Since LaunchJuly 02, 2013
Fund Size
(Rs. in mln)
Performance %
Disclaimer: This publication is for informational purposes only and nothing herein should be construed as a solicitation, recommendation or an offer to buy or sell any Pension fund. All investments in Pension funds are subject to market risks. Past performance is not necessarily indicative of future results. Please read the Offering Documents to understand the investment policies and the risks involved.
General Information Investment Objective
Fund Manager’s Commentary
To provide a secure source of savings and regular income after retirement tothe Participants.
MONTHLY REPORT (MUFAP's Recommended Format) April 2018
Name of the Members of Investment Committee
Asset Allocation (% of Total Assets)
30-Apr-18 30-Mar-18Equity Sub-fund
Credit Quality of the Portfolio (as on 30 April, 2018)
EquityCash EquivalentsOthers including receivablesTotal
95.1%3.3%1.6%
100.0%
93.1%5.8%1.1%
100.0%30-Apr-18 30-Mar-18Debt Sub-fund
Cash EquivalentsGOP Ijara SukukCommercial Papers (Islamic)OthersTotal
65.7%30.6%2.4%1.3%
100.0%
65.9%30.5%2.4%1.2%
100.0%30-Apr-18 30-Mar-18Money Market Sub-fund
Cash EquivalentsOthersTotal
99.3%0.7%
100.0%
99.1%0.9%
100.0%
30.6%26.2%3.1%1.7%
20.4%16.7%1.3%
100.0%
Government Securities (AAA rated)AAAAA+AAAA-A+OthersTotal
-36.2%0.9%9.4%
35.5%17.3%0.7%
100.0%
Debt Money Market
During the month of April:
NIPF Equity Sub-fund unit price decreased by 0.3% as compared to 0.1% increase in KMI-30 Index. The Sub-fund was around 95% invested in equities with major weights in Oil & Gas Exploration Companies, Fertilizer and Cement sectors. Equity Sub-fund maintains exposure of atleast 90% in listed equities on average. Last 90 days average allocation in equity was 94% of net asset.
NIPF Debt Sub-fund generated annualized return of 4.8%. The Sub-fund was invested primarily in GoP Ijara Sukuks and Islamic bank deposits. Debt Sub-fund maintains a minimum combined exposure of 50% in Islamic Government Securities (25% minimum) and A+ rated Islamic banks / AA rated Islamic windows. Weighted Average Maturity of Sub-fund is 0.5 year.
NIPF Money Market Sub-fund generated annualized return of 3.9%. The Sub-fund was invested primarily in Islamic bank deposits. Money Market Sub-fund average maturity cannot exceed 1 year. Weighted Average Maturity of Sub-fund is 1 day.
Pak Petroleum LtdEngro Corporation LtdOil & Gas Dev Co LtdPakistan Oil�elds Ltd Engro Fertilizer Ltd
7.4%7.2%5.7%5.5%5.2%
(% of Total Assets)
4.8%4.7%4.4%3.8%3.5%
Nishat Mills Ltd Hub Power Company LtdPakistan State Oil Co LtdMari Petroleum Company LtdLucky Cement Ltd
(% of Total Assets)
Top Ten Holdings of Equity Sub-fund (as on 30 April, 2018)
Total amountProvided
Rs
Sindh Workers' Welfare Fund (SWWF)NIPF has maintained provisions against Sindh Workers’ Welfare Fund’s liability inindividual Sub-funds as stated below:
For details investors are advised to read the Note 5 of the Financial Statementsof the Scheme for the period ended March 31, 2018.
Equity Sub-fund
Debt Sub-fund
Money Market Sub-fund
6,827,479
668,652
490,452
2.1276
0.2302
0.1972
0.61%
0.19%
0.16%
Last One Yearreturn would
otherwise have
been higher by:
Amount Per
Unit
Rs
Notes: 1) The calculation of performance does not include cost of front-end load.2) Taxes apply. Further, tax credit also available as per section 63 of the Income Tax Ordinance, 2001.
Top Five Sectors (% of Total Assets) (as on 30 April, 2018)
Oil & Gas Exploration Companies Fertilizer Cement Oil & Gas Marketing Companies Textile Composite Others
22.4%13.7%11.4%8.4%6.3%32.9%
Launch Date: July 2, 2013Fund size: Rs. 1,694 millionType: Open-end – Shariah Compliant Voluntary Pension SchemeDealing Days: Daily – Monday to FridayDealing Time: (Mon-Thr) 9:00 A.M to 5:00 P.M (Friday) 9:00 A.M to 5:30 P.M Pricing Mechanism Forward PricingFront end Load: Upto 3% on ContributionsBack end Load: 0%Management Fee: On average Annual Net Assets of each Sub-Fund. Equity, Debt, Money Market 1.50% p.a. Equity 2.07% p.a. (including 0.25% government levies)Total Expense Ratio (%) Debt 2.03% p.a. (including 0.30% government levies) Money Market 2.07% p.a. (including 0.31% government levies)Risk Pro�le Investor dependentCustodian & Trustee: Central Depository Company (CDC)Auditors: KPMG Taseer Hadi & Co. Chartered AccountantsFund Manager: Sajjad Anwar, CFAMinimum Initial: Rs. 10,000/-Subscription: Subsequent: Rs. 1000/-Asset Manager Rating: AM1 by PACRA (Very High Quality)Leverage Nil
Dr. Amjad Waheed, CFASajjad Anwar, CFA
Taha Khan Javed, CFA,Muhammad Ali Bhabha, CFA,
Hassan Raza, CFA

Page 12
NAFA Islamic Principal Protected Fund-II (NIPPF-II)Islamic Savings
NBP FUNDSManaging Your Savings
Disclaimer: This publication is for informational purposes only and nothing herein should be construed as a solicitation, recommendation or an offer to buy or sell any fund. All investments in mutual funds are subject to market risks. Past performance is not necessarily indicative of future results.Please read the Offering Documents to understand the investment policies and the risk involved. Capital protection only applies to unit holders who hold their investments until initial maturity of two years.
‘
Launch Date: June 27, 2014Fund Size: Rs. 129 millionType: Open-end Shariah Compliant -Capital Protected FundDealing Days: Daily – Monday to FridayDealing Time: (Mon-Thr) 9:00 A.M to 4:30 P.M (Friday) 9:00 A.M to 5:00 P.M Settlement: 2-3 business daysPricing Mechanism: Forward PricingLoad: Back end: 0%Management Fee: Equity component 2% per annum Others: 12% of Net Income (Min 0.5% p.a., Max 1.0% p.a.)Total Expense Ratio (%) 2.23% p.a (including 0.27% government levies)Risk Pro�le: LowListing: Pakistan Stock ExchangeCustodian & Trustee: Central Depository Company (CDC)Auditors: A. F. Ferguson & Co. Chartered AccountantsBenchmark: Daily weighted return of KMI-30 index & Islamic Bank Deposits based on Fund’s actual allocation.Fund Manager: Sajjad Anwar, CFAAsset Manager Rating: AM1 by PACRA (Very High Quality)
The objective of NAFA Islamic Principal Protected Fund-II is to earn a potentially high return through dynamic asset allocation between Shariah Compliant Equities and Money Market investment avenues, while providing principal protection.
Since inception, NIPPF-II has generated a return of 13.3% p.a versus benchmark return of 10.7% p.a. The current equity exposure stands at around 31%. During the month, multiplier remained at 0.7. Key holdings of the Fund belong to Oil & Gas Exploration Companies, Fertilizer and Cement.
April 2018
Since LaunchJune 27, 2014*
13.3%
10.7%
NAFA Islamic Principal Protected Fund-II
Performance Period
Equities / Stocks Cash Equivalents Others including receivables Total Leverage
31.3%65.0%3.7%
100.0%Nil
PER10.710.5
NIPPF-IIKMI-30
PBV2.02.0
DY4.7%4.6%
Dr. Amjad Waheed, CFASajjad Anwar, CFA
Muhammad Ali Bhabha, CFA, FRMTaha Khan Javed, CFA
Hassan Raza, CFA
30-Mar-1831.1%65.9%3.0%
100.0%Nil
30-Apr-18Asset Allocation (% of Total Assets)
Unit Price (30/04/2018): Rs. 104.3370
The scheme has maintained provision against Sindh Workers’ Welfare Fund’s liability to the tune of Rs 3,661,711/-If the same were not made the NAV per unit/ last one year return of scheme would be higher by Rs 2.9511/2.89%. For details investors are advised to read the Note 6 of the Financial Statements of the Scheme for the period ended March 31, 2018.
Sindh Workers' Welfare Fund (SWWF)
Top Ten Holdings (as on 30 April, 2018)
Nishat Mills Ltd
Engro Corporation Ltd
Hub Power Company Ltd
Engro Fertilizer Ltd
Oil & Gas Dev Co Ltd
Pakistan State Oil Co. Ltd
Pak Petroleum Ltd
Mari Petroleum Company Ltd
Lucky Cement Ltd
Pakistan Oil�elds Ltd
Equity
Equity
Equity
Equity
Equity
1.7%
1.6%
1.6%
1.5%
1.2%
Equity
Equity
Equity
Equity
Equity
3.0%
2.6%
2.4%
2.1%
1.9%
% of TotalAssets
% of TotalAssets
Apr2018
(0.1%)
0.2%
FYTD2018
2.7%
3.9%
FY2017
25.8%
16.1%
2.7%
3.7%
FY2015
21.0%
12.2%
Last 3Years*
10.6%
10.5%
FY2016
3.3%
8.9%
* Annualized Return All Other returns are Cumulative
The performance reported is net of management fee & all other expenses and based ondividend reinvestment gross of with-holding tax where applicable.
Notes: 1) The calculation of performance does not include cost of front end load.2) Taxes apply. Further, tax credit also available as per section 62 of the Income Tax Ordinance, 2001.
Top Five Sectors (% of Total Assets) (as on 30 April, 2018)
Oil & Gas Exploration Companies Fertilizer Cement Power Generation & Distribution Textile Composite Others
6.3%4.6%4.5%3.6%3.2%8.9%
Rolling12 months
** Based on NBP Funds estimates
NIPPF-II, 61.9%KMI-30, 64.2%
Islamic Bank Deposit12.5%
-20.0%
0.0%
20.0%
40.0%
60.0%
80.0%
100.0%
27-J
un-1
4
7-Se
p-14
18-N
ov-1
4
29-J
an-1
5
11-A
pr-1
5
22-J
un-1
5
2-Se
p-15
13-N
ov-1
5
24-J
an-1
6
5-A
pr-1
6
16-J
un-1
6
27-A
ug-1
6
7-N
ov-1
6
18-J
an-1
7
31-M
ar-1
7
11-J
un-1
7
22-A
ug-1
7
2-N
ov-1
7
13-J
an-1
8
26-M
ar-1
8
NIPPF-II KMI-30 Islamic Bank Deposit CumulativeReturn
Annualized Return 13.3% 13.8% 3.1%Annualized STDEV (Risk) 7.9% 17.0% 0.05%
Relative Performance of NAFA Islamic Principal Protected Fund-II (NIPPF-II)Since Inception on June 27, 2014
30-A
pr-1
8
%

Page 13
NAFA Islamic Principal Preservation Fund (NIPPF)Islamic Savings
NBP FUNDSManaging Your Savings
Disclaimer: This publication is for informational purposes only and nothing herein should be construed as a solicitation, recommendation or an offer to buy or sell any fund. All investments in mutual funds are subject to market risks. Past performance is not necessarily indicative of future results.Please read the Offering Documents to understand the investment policies and the risk involved. Principal Preservation only applies to unit holders who hold their investments until initial maturity of two years.
* Annualized Return All Other returns are Cumulative
The performance reported is net of management fee & all other expenses and based ondividend reinvestment gross of with-holding tax where applicable.
‘
Launch Date: January 9, 2015Fund Size: Rs. 54 millionType: Open End Shariah Compliant Fund of FundsDealing Days: Daily – Monday to FridayDealing Time: (Mon-Thr) 9:00 A.M to 4:30 P.M (Friday) 9:00 A.M to 5:00 P.M Settlement: 2-3 business daysPricing Mechanism: Forward PricingBack end Load: 1% in year 1, 0.5% in year 2 and no load beyond 2 yearsManagement Fee: 1) On invested amount in NAFA fund, no additional fee. 2) Cash in Bank account: 12% of Net Income (Min 0.5% p.a., Max 1.0% p.a.)Total Expense Ratio (%) 1.66% p.a (including 0.26% government levies)Listing: Pakistan Stock ExchangeRisk Pro�le: LowCustodian & Trustee: Central Depository Company (CDC)Auditors: A. F. Ferguson & Co. Chartered AccountantsBenchmark:** Combination of benchmarks of underlying schemes on the basis of actual investment i.e. NISF: KMI-30 Index NIAAF: Daily weighted return of KMI-30 Index & 6-month average deposit rates of three A rated Islamic Banks/Islamic windows of conventional banks as selected by MUFAP Cash: 6-month average deposit rates of three A rated Islamic Banks/Islamic windows of conventional banks as selected by MUFAP Fund Manager: Sajjad Anwar, CFAAsset Manager Rating: AM1 by PACRA (Very High Quality)
The objective of NAFA Islamic Principal Preservation Fund is to earn a potentially high return through dynamic asset allocation between Shariah Compliant Equity related, and Shariah Compliant Income/ Money Market Collective Investment Schemes, while providing principal preservation.
Since inception, NIPPF has generated a return of 7.9% p.a versus benchmark return of 6.9% p.a. The current exposure in equity/asset allocation funds stands at 35.4%. During the month, maximum multiplier stood a 1.4 whereas minimum multiplier was 1.1.
April 2018
Since LaunchJanuary 09, 2015*
7.9%
6.9%
Apr2018
(0.01%)
0.02%
FYTD2018
2.4%
2.7%
FY2017
15.1%
12.1%
FY2016
4.0%
3.6%
Last 3Years*
7.5%
6.8%
2.5%
2.4%
NAFA Islamic Principal Preservation Fund
Performance Period
Islamic Asset Allocation Fund Islamic Stock Fund Cash Others including receivables Total Leverage
PER10.410.310.5
NIAAFNISFKMI-30
PBV2.22.02.0
DY4.5%4.3%4.6%
NAFA Islamic Asset Allocation Fund NAFA Islamic Stock Fund Total
21.8%13.6%35.4%
Dr. Amjad Waheed, CFASajjad Anwar, CFA
Taha Khan Javed, CFAHassan Raza, CFA
Muhammad Ali Bhabha, CFA, FRM
17.8%11.1%69.8%1.3%
100.0%Nil
30-Mar-1821.8%13.6%63.9%0.7%
100.0%Nil
30-Apr-18Asset Allocation (% of Total Assets)
Top Holdings (%age of total assets)(as on 30 April, 2018)
Unit Price (30/04/2018): Rs. 104.7095
The scheme has maintained provision against Sindh Workers’ Welfare Fund’s liability to the tune of Rs 4,034,727/-If the same were not made the NAV per unit/ last one year return of scheme would be higher by Rs 7.7658/7.56%. For details investors are advised to read the Note 6 of the Financial Statements of the Scheme for the period ended March 31, 2018.
Sindh Workers' Welfare Fund (SWWF)
%
Notes: 1) The calculation of performance does not include cost of front end load.2) Taxes apply. Further, tax credit also available as per section 62 of the Income Tax Ordinance, 2001.
** effective from September 01, 2016; Previously daily weighted return of KMI-30 index & Islamic Bank Depositsbased on Fund's actual allocation.
Rolling12 Months
*** Based on NBP Funds estimates
NIPPF, 28.8%
KMI-30, 46.9%
Islamic Bank Deposit9.6%
-20.0%
0.0%
20.0%
40.0%
60.0%
80.0%
9-Ja
n-15
23-M
ar-1
5
4-Ju
n-15
16-A
ug-1
5
28-O
ct-1
5
9-Ja
n-16
22-M
ar-1
6
3-Ju
n-16
15-A
ug-1
6
27-O
ct-1
6
8-Ja
n-17
22-M
ar-1
7
3-Ju
n-17
15-A
ug-1
7
27-O
ct-1
7
8-Ja
n-18
22-M
ar-1
8
NIPPF KMI-30 Islamic Bank DepositCumulative
Return
Relative Performance of NAFA Islamic Principal Preservation Fund (NIPPF)Since Inception on January 9, 2015
Annualized Return 7.9% 12.3% 2.8%Annualized STDEV (Risk) 4.3% 17.3% 0.03%
30-A
pr-1
8

Page 14
NAFA Islamic Active Allocation Plan-I (NIAAP-I)Islamic Savings
NBP FUNDSManaging Your Savings
The performance reported is net of management fee & all other expenses and based on dividendreinvestment gross of with-holding tax where applicable.
PER10.410.5
NIAAEFKMI-30
PBV2.12.0
DY4.2%4.6%
NAFA Islamic Active Allocation Equity FundNAFA Active Allocation Riba Free Savings FundTotal
59.2%32.0%91.2%
Top Holdings (%age of total assets)(as on 30 April, 2018)
* Annualized ReturnAll Other returns are Cumulative
‘
Launch Date: January 15, 2016Fund Size: Rs. 394 millionType: Open Ended Shariah Compliant Fund of FundsDealing Days: Daily – Monday to FridayDealing Time: (Mon - Thr) 9:00 A.M to 4:30 P.M (Friday) 9:00 A.M to 5:00 P.MSettlement: 2-3 business daysPricing Mechanism Forward PricingBack end Load: Nil 1) On invested amount in NAFA funds, noManagement Fee: additional fee. 2) Cash in Bank account: 1.25% p.a.Total Expense Ratio (%) 0.47% p.a (including 0.12% government levies)Risk Pro�le Low to moderateListing: Pakistan Stock ExchangeCustodian & Trustee: Central Depository Company (CDC)Auditors: A. F. Ferguson & Co. Chartered AccountantsBenchmark:** Daily weighted return of KMI-30 Index & 6-month average deposit rates of three A rated Islamic Banks/Islamic windows of conventional banks as selected by MUFAP, based on Fund's actual allocation (which is combination of benchmarks of underlying schemes)Fund Manager: Sajjad Anwar, CFAAsset Manager Rating: AM1 by PACRA (Very High Quality)
The objective of the Fund is to provide investors an opportunity to earn attractive return from an actively managed portfolio of Shari’ah Compliant Equity Fund and Income Fund.
NBP Funds launched its NAFA Islamic Active Allocation Plan-I (NIAAP-I) in January, 2016 which is the �rst plan under NAFA Islamic Active Allocation Fund-I. The Active Allocation Plan is dynamically managed between dedicated equity related and income schemes managed by NBP Funds based on the Fund Manager’s outlook of the authorized asset-classes. The Plan is presently closed for new subscription. NIAAP-I has an initial maturity of two years. Since inception, NIAAP-I has generated a return of 10.6% p.a versus benchmark return of 11.8% p.a. The current exposure in Equity Fund and Income Fund stands at 59.2% & 32.0%, respectively. The Plan can invest up to 100% in equity funds. We are con�dent that the Plan will generate good returns considering the improved macroeconomic and political outlook and dynamic equity allocation mechanism of the Fund.
April 2018
Since Launch*January 15, 2016
10.6%
11.8%
Apr2018
(0.03%)
0.1%
FYTD2018
(8.5%)
(4.3%)
FY2017
24.3%
16.3%
Rolling12 months
(12.6%)
(9.6%)
NAFA Islamic Active Allocation Plan-I
Performance Period
Shariah Compliant Funds Cash Equivalents Others including receivables Total Leverage
90.4%9.4%0.2%
100.0%Nil
30-Mar-1891.2%8.8%
-100.0%
Nil
30-Apr-18Asset Allocation (% of Total Assets)
Unit Price (30/04/2018): Rs. 121.2553
Dr. Amjad Waheed, CFASajjad Anwar, CFA
Muhammad Ali Bhabha, CFA, FRMTaha Khan Javed, CFA
Hassan Raza, CFA
Disclaimer: This publication is for informational purposes only and nothing herein should be construed as a solicitation, recommendation or an offer to buy or sell any fund. All investments in mutual funds are subject to market risks.Past performance is not necessarily indicative of future results. Please read the Offering Documents to understand the investment policies and the risks involved.
%
Notes: 1) The calculation of performance does not include cost of front end load.2) Taxes apply. Further, tax credit also available as per section 62 of the Income Tax Ordinance, 2001.
** effective from September 01, 2016; Previously daily weighted return of KMI-30 index & 6 month deposit rateof A- and above rated Islamic banks and windows based on actual investment.
The scheme has maintained provision against Sindh Workers’ Welfare Fund’s liability to the tune of Rs 4,843,029/-If the same were not made the NAV per unit/ last one year return of scheme would be higher by Rs 1.4905/1.07%. For details investors are advised to read the Note 5 of the Financial Statements of the Scheme for the period ended March 31, 2018.
Sindh Workers' Welfare Fund (SWWF)
*** Based on NBP Funds estimates

NAFA Islamic Active Allocation Plan-II (NIAAP-II)Islamic Savings
NBP FUNDSManaging Your Savings
Page 15
The performance reported is net of management fee & all other expenses and based on dividendreinvestment gross of with-holding tax where applicable.
PER10.410.5
NIAAEFKMI-30
PBV2.12.0
DY4.2%4.6%
NAFA Islamic Active Allocation Equity FundNAFA Active Allocation Riba Free Savings FundTotal
54.4%39.0%93.4%
Top Holdings (%age of total assets)(as on 30 April, 2018)
* Annualized ReturnAll other returns are cumulative
‘
Launch Date: March 04, 2016Fund Size: Rs. 450 millionType: Open Ended Shariah Compliant Fund of FundsDealing Days: Daily – Monday to FridayDealing Time: (Mon - Thr) 9:00 A.M to 4:30 P.M (Friday) 9:00 A.M to 5:00 P.MSettlement: 2-3 business daysPricing Mechanism Forward PricingBack end Load: Nil 1) On invested amount in NAFA funds, noManagement Fee: additional fee. 2) Cash in Bank account: 1.25% p.a.Total Expense Ratio (%) 0.49% p.a (including 0.12% government levies)Risk Pro�le Low to moderateListing: Pakistan Stock ExchangeCustodian & Trustee: Central Depository Company (CDC)Auditors: A. F. Ferguson & Co. Chartered AccountantsBenchmark:** Daily weighted return of KMI-30 Index & 6-month average deposit rates of three A rated Islamic Banks/Islamic windows of conventional banks as selected by MUFAP, based on Fund's actual allocation (which is combination of benchmarks of underlying schemes)Fund Manager: Sajjad Anwar, CFAAsset Manager Rating: AM1 by PACRA (Very High Quality)
The objective of the Fund is to provide investors an opportunity to earn attractive return from an actively managed portfolio of Shari’ah Compliant Equity Fund and Income Fund.
NBP Funds launched its NAFA Islamic Active Allocation Plan-II (NIAAP-II) in March 2016 which is the second plan under NAFA Islamic Active Allocation Fund-I. The Active Allocation Plan is dynamically managed between dedicated equity related and income schemes managed by NBP Funds based on the Fund Manager’s outlook of the authorized asset-classes. The Plan is presently closed for new subscription. NIAAP-II has an initial maturity of two years.
Since inception, NIAAP-II has generated a return of 9.8% p.a versus benchmark return of 10.0% p.a. The current exposure in Equity Fund and Income Fund stands at 54.4% & 39.0%, respectively. The Plan can invest up to 100% in equity funds. We are con�dent that the Plan will generate good returns considering the improved macroeconomic and political outlook and dynamic equity allocation mechanism of the Fund.
April 2018
Apr2018
0.01%
0.1%
FYTD2018
(7.9%)
(4.0%)
FY2017
23.6%
15.9%
Rolling12 months
Since Launch*March 04, 2016
9.8%
10.0%
(12.1%)
(9.5%)
NAFA Islamic Active Allocation Plan-II
Performance Period
Shariah Compliant Funds Cash Equivalents Others including receivables Total Leverage
91.1%8.7%0.2%
100.0%Nil
30-Mar-18
93.4%6.6%
-100.0%
Nil
30-Apr-18Asset Allocation (% of Total Assets)
Unit Price (30/04/2018): Rs. 113.3115
Dr. Amjad Waheed, CFASajjad Anwar, CFA
Muhammad Ali Bhabha, CFA, FRMTaha Khan Javed, CFA
Hassan Raza, CFA
Disclaimer: This publication is for informational purposes only and nothing herein should be construed as a solicitation, recommendation or an offer to buy or sell any fund. All investments in mutual funds are subject to market risks.Past performance is not necessarily indicative of future results. Please read the Offering Documents to understand the investment policies and the risks involved.
Notes: 1) The calculation of performance does not include cost of front end load.2) Taxes apply. Further, tax credit also available as per section 62 of the Income Tax Ordinance, 2001.
** effective from September 01, 2016; Previously daily weighted return of KMI-30 index & 6 month deposit rateof A- and above rated Islamic banks and windows based on actual investment.
The scheme has maintained provision against Sindh Workers’ Welfare Fund’s liability to the tune of Rs 3,957,147/-If the same were not made the NAV per unit/ since inception return of scheme would be higher by Rs 0.9958/0.77%. For details investors are advised to read the Note 5 of the Financial Statements of the Scheme for the period ended March 31, 2018.
Sindh Workers' Welfare Fund (SWWF)
%
*** Based on NBP Funds estimates

NAFA Islamic Active Allocation Plan-III (NIAAP-III)Islamic Savings
NBP FUNDSManaging Your Savings
Page 16
The performance reported is net of management fee & all other expenses and based on dividendreinvestment gross of with-holding tax where applicable.
PER10.410.5
NIAAEFKMI-30
PBV2.12.0
DY4.2%4.6%
NAFA Islamic Active Allocation Equity FundNAFA Active Allocation Riba Free Savings FundTotal
47.5%44.6%92.1%
Top Holdings (%age of total assets)(as on 30 April, 2018)
* Annualized ReturnsAll other returns are cumulative
‘
Launch Date: June 28, 2016Fund Size: Rs. 716 millionType: Open Ended Shariah Compliant Fund of FundsDealing Days: Daily – Monday to FridayDealing Time: (Mon - Thr) 9:00 A.M to 4:30 P.M (Friday) 9:00 A.M to 5:00 P.MSettlement: 2-3 business daysPricing Mechanism Forward PricingBack end Load: Nil 1) On invested amount in NAFA funds, noManagement Fee: additional fee. 2) Cash in Bank account: 1.25% p.a.Total Expense Ratio (%) 0.47% p.a (including 0.12% government levies)Risk Pro�le Low to moderate Listing: Pakistan Stock ExchangeCustodian & Trustee: Central Depository Company (CDC)Auditors: A. F. Ferguson & Co. Chartered AccountantsBenchmark:** Daily weighted return of KMI-30 Index & 6-month average deposit rates of three A rated Islamic Banks/Islamic windows of conventional banks as selected by MUFAP, based on Fund's actual allocation (which is combination of benchmarks of underlying schemes)Fund Manager: Sajjad Anwar, CFAAsset Manager Rating: AM1 by PACRA (Very High Quality)
The objective of the Fund is to provide investors an opportunity to earn attractive return from an actively managed portfolio of Shari’ah Compliant Equity Fund and Income Fund.
NBP Funds launched its NAFA Islamic Active Allocation Plan-III (NIAAP-III) in June 2016 which is the third plan under NAFA Islamic Active Allocation Fund-I. The Active Allocation Plan is dynamically managed between dedicated equity related and income schemes managed by NBP Funds based on the Fund Manager’s outlook of the authorized asset-classes. The Plan is presently closed for new subscription. NIAAP-III has an initial maturity of two years. Since inception, NIAAP-III has generated a return of 6.7% p.a versus benchmark return of 6.3% p.a. The current exposure in Equity Fund and Income Fund stands at 47.5% & 44.6%, respectively. The Plan can invest up to 100% in equity funds. We are con�dent that the Plan will generate good returns considering the improved macroeconomic and political outlook and dynamic equity allocation mechanism of the Fund.
April 2018
Since Launch*June 28, 2016
6.7%
6.3%
Apr2018
0.05%
0.1%
FYTD2018
(6.2%)
(2.0%)
FY2017
20.0%
13.4%
(10.5%)
(7.6%)
NAFA Islamic Active Allocation Plan-III
Performance Period
Shariah Compliant Funds Cash Equivalents Others including receivables Total Leverage
91.1%8.8%0.1%
100.0%Nil
30-Mar-18
92.1%7.9%
-100.0%
Nil
30-Apr-18Asset Allocation (% of Total Assets)
Unit Price (30/04/2018): Rs. 109.7384
Dr. Amjad Waheed, CFASajjad Anwar, CFA
Muhammad Ali Bhabha, CFA, FRMTaha Khan Javed, CFA
Hassan Raza, CFA
Disclaimer: This publication is for informational purposes only and nothing herein should be construed as a solicitation, recommendation or an offer to buy or sell any fund. All investments in mutual funds are subject to market risks.Past performance is not necessarily indicative of future results. Please read the Offering Documents to understand the investment policies and the risks involved.
%
Notes: 1) The calculation of performance does not include cost of front end load.2) Taxes apply. Further, tax credit also available as per section 62 of the Income Tax Ordinance, 2001.
** effective from September 01, 2016; Previously daily weighted return of KMI-30 index & 6 month deposit rateof A- and above rated Islamic banks and windows based on actual investment.
The scheme has maintained provision against Sindh Workers’ Welfare Fund’s liability to the tune of Rs 3,817,847/-If the same were not made the NAV per unit/ last one year return of scheme would be higher by Rs 0.5853/0.48%. For details investors are advised to read the Note 5 of the Financial Statements of the Scheme for the period ended March 31, 2018.
Sindh Workers' Welfare Fund (SWWF)
Rolling12 months
*** Based on NBP Funds estimates

NAFA Islamic Active Allocation Plan-IV (NIAAP-IV)Islamic Savings
NBP FUNDSManaging Your Savings
Page 17
PER10.410.5
NIAAEF**KMI-30
PBV2.12.0
DY4.2%4.6%
NAFA Islamic Active Allocation Equity FundNAFA Active Allocation Riba Free Savings FundTotal
58.1%34.7%92.8%
Top Holdings (%age of total assets)(as on 30 April 2018)
* Annualized ReturnAll Other returns are Cumulative
‘
Launch Date: September 30, 2016Fund Size: Rs. 565 millionType: Open Ended Shariah Compliant Fund of FundsDealing Days: Daily – Monday to FridayDealing Time: (Mon - Thr) 9:00 A.M to 4:30 P.M (Friday) 9:00 A.M to 5:00 P.MSettlement: 2-3 business daysPricing Mechanism: Forward PricingBack end Load: NilManagement Fee: 1) On invested amount in NAFA funds, no additional fee. 2) Cash in Bank account: 1.25% p.a.Total Expense Ratio (%): 0.49% p.a (including 0.12% government levies)Risk Pro�le: Low to moderateListing: Pakistan Stock ExchangeCustodian & Trustee: Central Depository Company (CDC)Auditors: A. F. Ferguson & Co. Chartered AccountantsBenchmark: Daily weighted return of KMI-30 Index & 6-month average deposit rates of three A rated Islamic Banks/Islamic windows of conventional banks as selected by MUFAP, based on Fund's actual allocation (which is combination of benchmarks of underlying schemes)Fund Manager: Sajjad Anwar, CFAAsset Manager Rating: AM1 by PACRA (Very High Quality)
The objective of the Fund is to provide investors an opportunity to earn attractive return from an actively managed portfolio of Shari’ah Compliant Equity Fund and Income Fund.
NBP Funds launched its NAFA Islamic Active Allocation Plan-IV (NIAAP-IV) in September, 2016 which is the fourth plan under NAFA Islamic Active Allocation Fund-I. The Active Allocation Plan is dynamically managed between dedicated equity related and income schemes managed by NBP Funds based on the Fund Manager’s outlook of the authorized asset-classes. The Plan is presently closed for new subscription. NIAAP-IV has an initial maturity of two years.
Since inception, NIAAP-IV has generated return of 3.5% p.a versus the benchmark return of 5.7% p.a. The current exposure in Equity Fund and Income Fund stands at 58.1% & 34.7%, respectively. The Plan can invest up to 100% in equity funds. We are con�dent that the Plan will generate good returns considering the improved macroeconomic and political outlook and dynamic equity allocation mechanism of the Fund.
April 2018
Since Launch*September 30, 2016
3.5%
5.7%
Apr2018
(0.02%)
0.1%
FYTD2018
(5.9%)
(1.5%)
(10.2%)
(7.1%)
NAFA Islamic Active Allocation Plan-IV
Performance Period
Shariah Compliant Funds Cash Equivalents Others including receivables Total Leverage
90.9%8.9%0.2%
100.0%Nil
30-Mar-18
92.8%7.2%
-100.0%
Nil
30-Apr-18Asset Allocation (% of Total Assets)
Unit Price (30/04/2018): Rs. 101.5590
Dr. Amjad Waheed, CFASajjad Anwar, CFA
Muhammad Ali Bhabha, CFA, FRMTaha Khan Javed, CFA
Hassan Raza, CFA
Disclaimer: This publication is for informational purposes only and nothing herein should be construed as a solicitation, recommendation or an offer to buy or sell any fund. All investments in mutual funds are subject to market risks.Past performance is not necessarily indicative of future results. Please read the Offering Documents to understand the investment policies and the risks involved.
%
Notes: 1) The calculation of performance does not include cost of front end load.2) Taxes apply. Further, tax credit also available as per section 62 of the Income Tax Ordinance, 2001.
The scheme has maintained provision against Sindh Workers’ Welfare Fund’s liability to the tune of Rs 1,740,100/-If the same were not made the NAV per unit/ last one year return of scheme would be higher by Rs 0.3130/0.28%. For details investors are advised to read the Note 5 of the Financial Statements of the Scheme for the period ended March 31, 2018.
Sindh Workers' Welfare Fund (SWWF)
Rolling12 months
The performance reported is net of management fee & all other expenses and based on dividendreinvestment gross of with-holding tax where applicable.
** Based on NBP Funds estimates

NAFA Islamic Active Allocation Plan-V (NIAAP-V)Islamic Savings
NBP FUNDSManaging Your Savings
Page 18
[Returns are net of management fee & all other expenses]
PER10.410.5
NIAAEF**KMI-30
PBV2.12.0
DY4.2%4.6%
NAFA Islamic Active Allocation Equity FundNAFA Active Allocation Riba Free Savings FundTotal
59.5%33.8%93.3%
Top Holdings (%age of total assets)(as on 30 April, 2018)
* Annualized Return All Other returns are Cumulative
‘
Launch Date: January 12, 2017 Fund Size: Rs. 1,094 million Type: Open Ended Shariah Compliant Fund of Funds Dealing Days: Daily – Monday to FridayDealing Time: (Mon - Thr) 9:00 A.M to 4:30 P.M (Friday) 9:00 A.M to 5:00 P.MSettlement: 2-3 business days Pricing Mechanism Forward Pricing Back end Load: Nil Management Fee: 1) On invested amount in NAFA funds, no additional fee. 2) Cash in Bank account: 1.25% p.a.Total Expense Ratio (%) 0.46% p.a (including 0.12% government levies) Risk Pro�le Low to moderate Listing: Pakistan Stock Exchange Custodian & Trustee: Central Depository Company (CDC)Auditors: A. F. Ferguson & Co. Chartered AccountantsBenchmark: Daily weighted return of KMI-30 Index & 6-month average deposit rates of three A rated Islamic Banks/Islamic windows of conventional banks as selected by MUFAP, based on Fund's actual allocation (which is combination of benchmarks of underlying schemes)Fund Manager: Sajjad Anwar, CFA Asset Manager Rating: AM1 by PACRA (Very High Quality)
The objective of the Fund is to provide investors an opportunity to earn attractive return from an actively managed portfolio of Shari’ah Compliant Equity Fund and Income Fund.
NBP Funds launched its NAFA Islamic Active Allocation Plan-V (NIAAP-V) in January, 2017 which is the �fth plan under NAFA Islamic Active Allocation Fund-I. The Active Allocation Plan is dynamically managed between dedicated equity related and income schemes managed by NBP Funds based on the Fund Manager’s outlook of the authorized asset-classes. The Plan is presently closed for new subscription. NIAAP-V has an initial maturity of two years. Since inception unit price of NIAAP-V has decreased by 5.3% p.a versus the benchmark decline of 4.3% p.a. The current exposure in Equity Fund and Income Fund stands at 59.5% & 33.8%, respectively. The Plan can invest up to 100% in equity funds. We are con�dent that the Plan will generate good returns considering the improved macroeconomic and political outlook and dynamic equity allocation mechanism of the Fund.
April 2018
Apr2018
(0.05%)
0.04%
FYTD2018
(5.6%)
(0.6%)
Rolling12 Months
(9.6%)
(5.6%)
Since Launch*January 12 , 2017
(5.3%)
(4.3%)
NAFA Islamic Active Allocation Plan-V
Performance Period
Shariah Compliant Funds Cash Equivalents Others including receivables Total Leverage
90.9%8.9%0.2%
100.0%Nil
30-Mar-18
93.3%6.7%
-100.0%
Nil
30-Apr-18Asset Allocation (% of Total Assets)
Unit Price (30/04/2018): Rs.93.1562
Dr. Amjad Waheed, CFASajjad Anwar, CFA
Muhammad Ali Bhabha, CFA, FRMTaha Khan Javed, CFA
Hassan Raza, CFA
Disclaimer: This publication is for informational purposes only and nothing herein should be construed as a solicitation, recommendation or an offer to buy or sell any fund. All investments in mutual funds are subject to market risks.Past performance is not necessarily indicative of future results. Please read the Offering Documents to understand the investment policies and the risks involved.
%
Notes: 1) The calculation of performance does not include cost of front end load.2) Taxes apply. Further, tax credit also available as per section 62 of the Income Tax Ordinance, 2001.
** Based on NBP Funds estimates

NAFA Islamic Active Allocation Plan-VI (NIAAP-VI)Islamic Savings
NBP FUNDSManaging Your Savings
Page 19
[Returns are net of management fee & all other expenses]
PER10.410.5
NIAAEF**KMI-30
PBV2.12.0
DY4.2%4.6%
NAFA Islamic Active Allocation Equity FundNAFA Active Allocation Riba Free Savings FundTotal
58.7%34.7%93.4%
Top Holdings (%age of total assets)(as on 30 April, 2018)
* Cumulative Returns
‘
Launch Date: May 26, 2017 Fund Size: Rs. 482 million Type: Open Ended Shariah Compliant Fund of Funds Dealing Days: Daily – Monday to FridayDealing Time: (Mon - Thr) 9:00 A.M to 4:30 P.M (Friday) 9:00 A.M to 5:00 P.MSettlement: 2-3 business days Pricing Mechanism Forward Pricing Back end Load: Nil Management Fee: 1) On invested amount in NAFA funds, no additional fee. 2) Cash in Bank account: 1.25% p.a.Total Expense Ratio (%) 0.57% p.a (including 0.12% government levies) Risk Pro�le Low to moderate Listing: Pakistan Stock Exchange Custodian & Trustee: Central Depository Company (CDC)Auditors: KPMG Taseer Hadi & Co. Chartered AccountantsBenchmark: Daily weighted return of KMI-30 Index & 6-month average deposit rates of three A rated Islamic Banks/Islamic windows of conventional banks as selected by MUFAP, based on Fund's actual allocation (which is combination of benchmarks of underlying schemes)Fund Manager: Sajjad Anwar, CFA Asset Manager Rating: AM1 by PACRA (Very High Quality)
The objective of the Fund is to provide investors an opportunity to earn attractive return from an actively managed portfolio of Shari’ah Compliant Equity Fund and Income Fund.
NBP Funds launched its NAFA Islamic Active Allocation Plan-VI (NIAAP-VI) in May, 2017 which is the �rst plan under NAFA Islamic Active Allocation Fund-II. The Active Allocation Plan will be dynamically managed between dedicated equity related and income schemes managed by NBP Funds based on the Fund Manager’s outlook of the authorized asset-classes. The plan is presently closed for new subscription. NIAAP-VI has an initial maturity of two years. Since inception, unit price of NIAAP-VI has decreased by 9.5% versus the benchmark decline of 6.9%. The current exposure in Equity Fund and Income Fund stands at 58.7% & 34.7%, respectively. The Plan can invest up to 100% in equity funds. We are con�dent that the Plan will generate good returns considering the improved macroeconomic and political outlook and dynamic equity allocation mechanism of the Fund.
April 2018
Apr2018
(0.03%)
0.04%
Rolling6 Months
6.1%
9.8%
FYTD2018
(4.2%)
0.6%
Since LaunchMay 26 , 2017
(9.5%)
(6.9%)
NAFA Islamic Active Allocation Plan-VI
Performance Period
Shariah Compliant Funds Cash Equivalents Others including receivables Total Leverage
91.0%8.8%0.2%
100.0%Nil
30-Mar-18
93.4%6.6%
-100.0%
Nil
30-Apr-18Asset Allocation (% of Total Assets)
Unit Price (30/04/2018): Rs. 90.4601
Dr. Amjad Waheed, CFASajjad Anwar, CFA
Muhammad Ali Bhabha, CFA, FRMTaha Khan Javed, CFA
Hassan Raza, CFA
Disclaimer: This publication is for informational purposes only and nothing herein should be construed as a solicitation, recommendation or an offer to buy or sell any fund. All investments in mutual funds are subject to market risks.Past performance is not necessarily indicative of future results. Please read the Offering Documents to understand the investment policies and the risks involved.
%*
Notes: 1) The calculation of performance does not include cost of front end load.2) Taxes apply. Further, tax credit also available as per section 62 of the Income Tax Ordinance, 2001.
** Based on NBP Funds estimates

NAFA Islamic Active Allocation Plan-VII (NIAAP-VII)Islamic Savings
NBP FUNDSManaging Your Savings
Page 20
[Returns are net of management fee & all other expenses]
PER10.410.5
NIAAEF**KMI-30
PBV2.12.0
DY4.2%4.6%
NAFA Islamic Active Allocation Equity FundNAFA Active Allocation Riba Free Savings FundTotal
57.3%35.7%93.0%
Top Holdings (%age of total assets)(as on 30 April, 2018)
* Cumulative Returns
‘
Launch Date: June 29, 2017 Fund Size: Rs. 207 million Type: Open Ended Shariah Compliant Fund of FundsDealing Days: Daily – Monday to Friday Dealing Time: (Mon - Thr) 9:00 A.M to 4:30 P.M (Friday) 9:00 A.M to 5:00 P.MSettlement: 2-3 business days Pricing Mechanism Forward Pricing Back end Load: Nil Management Fee: 1) On invested amount in NAFA funds, no additional fee. 2) Cash in Bank account: 1.25% p.a. Total Expense Ratio (%) 0.60% p.a (including 0.13% government levies) Risk Pro�le Low to moderate Listing: Pakistan Stock Exchange Custodian & Trustee: Central Depository Company (CDC) Auditors: KPMG Taseer Hadi & Co. Chartered Accountants Benchmark: Daily weighted return of KMI-30 Index & 6-month average deposit rates of three A rated Islamic Banks/Islamic windows of conventional banks as selected by MUFAP, based on Fund's actual allocation (which is combination of benchmarks of underlying schemes) Fund Manager: Sajjad Anwar, CFA Asset Manager Rating: AM1 by PACRA (Very High Quality)
The objective of the Fund is to provide investors an opportunity to earn attractive return from an actively managed portfolio of Shari’ah Compliant Equity Fund and Income Fund.
NBP Funds launched its NAFA Islamic Active Allocation Plan-VII (NIAAP-VII) in June, 2017 which is the second plan under NAFA Islamic Active Allocation Fund-II. The Active Allocation Plan will be dynamically managed between dedicated equity related and income schemes managed by NBP Funds based on the Fund Manager’s outlook of the authorized asset-classes. The Plan is presently closed for new subscription. NIAAP-VII has an initial maturity of two years. Since inception, unit price of NIAAP-VII has decreased by 2.9% versus the benchmark increase of 0.8%. The current exposure in Equity Fund and Income Fund stands at 57.3% & 35.7%, respectively. The Plan can invest up to 100% in equity funds. We are con�dent that the Plan will generate good returns considering the improved macroeconomic and political outlook and dynamic equity allocation mechanism of the Fund.
April 2018
Apr2018
(0.03%)
0.1%
Rolling6 Months
5.9%
9.6%
FYTD2018
(2.9%)
1.4%
Since LaunchJune 29 , 2017
(2.9%)
0.8%
NAFA Islamic Active Allocation Plan-VII
Performance Period
Shariah Compliant Funds Cash Equivalents Others including receivables Total Leverage
92.0%8.0%
-100.0%
Nil
30-Mar-18
93.0%6.8%0.2%
100.0%Nil
30-Apr-18Asset Allocation (% of Total Assets)
Unit Price (30/04/2018): Rs.97.1187
Dr. Amjad Waheed, CFASajjad Anwar, CFA
Muhammad Ali Bhabha, CFA, FRMTaha Khan Javed, CFA
Hassan Raza, CFA
Disclaimer: This publication is for informational purposes only and nothing herein should be construed as a solicitation, recommendation or an offer to buy or sell any fund. All investments in mutual funds are subject to market risks.Past performance is not necessarily indicative of future results. Please read the Offering Documents to understand the investment policies and the risks involved.
%*
Notes: 1) The calculation of performance does not include cost of front end load.2) Taxes apply. Further, tax credit also available as per section 62 of the Income Tax Ordinance, 2001.
** Based on NBP Funds estimates

NAFA Islamic Active Allocation Plan-VIII (NIAAP-VIII)Islamic Savings
NBP FUNDSManaging Your Savings
Page 21
[Returns are net of management fee & all other expenses]
PER10.410.5
NIAAEF**KMI-30
PBV2.12.0
DY4.2%4.6%
NAFA Islamic Active Allocation Equity FundNAFA Active Allocation Riba Free Savings FundTotal
59.9%36.1%96.0%
Top Holdings (%age of total assets)(as on 30 April, 2018)
* Cumulative Returns
‘
Launch Date: November 3, 2017 Fund Size: Rs. 643 million Type: Open Ended Shariah Compliant Fund of FundsDealing Days: Daily – Monday to Friday Dealing Time: (Mon - Thr) 9:00 A.M to 4:30 P.M (Friday) 9:00 A.M to 5:00 P.MSettlement: 2-3 business days Pricing Mechanism Forward Pricing Back end Load: Nil Management Fee: 1) On invested amount in NAFA funds, no additional fee. 2) Cash in Bank account: 1.25% p.a. Total Expense Ratio (%) 0.46% p.a (including 0.19% government levies) Risk Pro�le Low to moderate Listing: Pakistan Stock Exchange Custodian & Trustee: Central Depository Company (CDC) Auditors: KPMG Taseer Hadi & Co. Chartered Accountants Benchmark: Daily weighted return of KMI-30 Index & 6-month average deposit rates of three A rated Islamic Banks/Islamic windows of conventional banks as selected by MUFAP, based on Fund's actual allocation (which is combination of benchmarks of underlying schemes) Fund Manager: Sajjad Anwar, CFA Asset Manager Rating: AM1 by PACRA (Very High Quality)
The objective of the Fund is to provide investors an opportunity to earn attractive return from an actively managed portfolio of Shari’ah Compliant Equity Fund and Income Fund.
NBP Funds launched its NAFA Islamic Active Allocation Plan-VIII (NIAAP-VIII) in November, 2017 which is the third plan under NAFA Islamic Active Allocation Fund-II. The Active Allocation Plan will be dynamically managed between dedicated equity related and income schemes managed by NBP Funds based on the Fund Manager’s outlook of the authorized asset-classes. The Plan is presently closed for new subscription. NIAAP-VIII has an initial maturity of two years.
Since inception, unit price of NIAAP-VIII has increased by 4.2% versus the benchmark increase of 6.3%. The current exposure in Equity Fund and Income Fund stands at 59.9% & 36.1%, respectively. The Plan can invest up to 100% in equity funds. We are con�dent that the Plan will generate good returns considering the improved macroeconomic and political outlook and dynamic equity allocation mechanism of the Fund.
April 2018
Apr2018
(0.02%)
0.06%
Since LaunchNovember 03 , 2017
4.2%
6.3%
NAFA Islamic Active Allocation Plan-VIII
Performance Period
Shariah Compliant Funds Cash Equivalents Others including receivables Total Leverage
91.1%8.8%0.1%
100.0%Nil
30-Mar-18
96.0%3.9%0.1%
100.0%Nil
30-Apr-18Asset Allocation (% of Total Assets)
Unit Price (30/04/2018): Rs. 104.2192
Dr. Amjad Waheed, CFASajjad Anwar, CFA
Muhammad Ali Bhabha, CFA, FRMTaha Khan Javed, CFA
Hassan Raza, CFA
Disclaimer: This publication is for informational purposes only and nothing herein should be construed as a solicitation, recommendation or an offer to buy or sell any fund. All investments in mutual funds are subject to market risks.Past performance is not necessarily indicative of future results. Please read the Offering Documents to understand the investment policies and the risks involved.
%*
Notes: 1) The calculation of performance does not include cost of front end load.2) Taxes apply. Further, tax credit also available as per section 62 of the Income Tax Ordinance, 2001.
The scheme has maintained provision against Sindh Workers’ Welfare Fund’s liability to the tune of Rs 582,007/-If the same were not made the NAV per unit/ since inception return of scheme would be higher by Rs 0.0944/0.09%. For details investors are advised to read the Note 5 of the Financial Statements of the Scheme for the period ended March 31, 2018.
Sindh Workers' Welfare Fund (SWWF)
** Based on NBP Funds estimates

NAFA Islamic Capital Preservation Plan-I (NICPP-I)Islamic Savings
NBP FUNDSManaging Your Savings
Page 22
[Returns are net of management fee & all other expenses]
PER10.410.5
NIAAEF**KMI-30
PBV2.12.0
DY4.2%4.6%
NAFA Islamic Money Market FundNAFA Islamic Active Allocation Equity FundTotal
77.8%18.2%96.0%
Top Holdings (%age of total assets)(as on 30 April, 2018)
* Cumulative Returns
‘
Launch Date: February 28, 2018Fund Size: Rs. 2,052 millionType: Open Ended Shariah Compliant Fund of FundsDealing Days: Daily – Monday to FridayDealing Time: (Mon-Thr) 9:00 A.M to 4:30 P.M (Friday) 9:00 A.M to 5:00 P.MSettlement: 2-3 business daysPricing Mechanism Forward PricingBack end Load: NilManagement Fee: 1) On invested amount in NAFA funds, no additional fee. 2) Cash in Bank account: 1.0% p.a.Total Expense Ratio (%) 0.17% p.a (including 0.07% government levies)Risk Pro�le Low Listing: Pakistan Stock ExchangeCustodian & Trustee: Central Depository Company (CDC)Auditors: KPMG Taseer Hadi & Co. Chartered Accountants Benchmark: Daily Weighted Return of KMI-30 Index and 3-months average deposit rate of three AA rated Islamic Banks or Islamic windows of Conventional Banks as selected by MUFAP, on the basis of actual investment by the Plan in equity and money market schemes.Fund Manager: Sajjad Anwar, CFA Asset Manager Rating: AM1 by PACRA (Very High Quality)
The objective of NAFA Islamic Capital Preservation Plan-I is to earn a potentially high return through dynamic asset allocation between Shariah Compliant Dedicated Equity and Money Market based Collective Investment Schemes and /or Shariah Compliant savings accounts / Shariah Compliant term deposits, while providing Capital Preservation of the Initial Investment Value including sales load at completion of twenty four months and beyond.
NBP Funds launched its NAFA Islamic Capital Preservation Plan-I (NICPP-I) in February, 2018 which is the fourth plan under NAFA Islamic Active Allocation Fund-II. The Plan is dynamically allocated between the Equity Component and Money Market Component by using the Constant Proportion Portfolio Insurance (CPPI) Methodology. Allocation to Equity Component is generally increased where equity market is rising, while allocation to the Money Market Component is generally increased when the equity market declines. The Plan is presently closed for new subscription. NICPP-I has an initial maturity of two years. Since inception, unit price of NICPP-I has increased by 0.8% inline with the benchmark. The current exposure in Money Market Fund and Equity Fund stands at 77.8% & 18.2%, respectively. During the month, maximum multiplier stood a 3.8 whereas minimum multiplier was 2.4.
April 2018
April2018
0.1%
0.03%
Since LaunchFebruary 28 , 2018
0.8%
0.8%
NAFA Islamic Capital Preservation Plan-I
Performance Period
Shariah Compliant Funds Cash Equivalents Others including receivables Total Leverage
94.0%5.9%0.1%
100.0%Nil
30-Mar-18
96.0%3.9%0.1%
100.0%Nil
30-Apr-18Asset Allocation (% of Total Assets)
Unit Price (30/04/2018): Rs. 100.7682
Dr. Amjad Waheed, CFASajjad Anwar, CFA
Muhammad Ali Bhabha, CFA, FRMTaha Khan Javed, CFA
Hassan Raza, CFA
Disclaimer: This publication is for informational purposes only and nothing herein should be construed as a solicitation, recommendation or an offer to buy or sell any fund. All investments in mutual funds are subject to market risks.Past performance is not necessarily indicative of future results. Please read the Offering Documents to understand the investment policies and the risks involved. Capital preservation only applies to unit holders who hold their investments until initial maturity of two years.
%*
Notes: 1) The calculation of performance does not include cost of front end load.2) Taxes apply. Further, tax credit also available as per section 62 of the Income Tax Ordinance, 2001.
The scheme has maintained provision against Sindh Workers’ Welfare Fund’s liability to the tune of Rs 336,105/-If the same were not made the NAV per unit/ since inception return of scheme would be higher by Rs 0.0165/0.02%. For details investors are advised to read the Note 5 of the Financial Statements of the Scheme for the period ended March 31, 2018.
Sindh Workers' Welfare Fund (SWWF)
** Based on NBP Funds estimates

NAFA Islamic Capital Preservation Plan-II (NICPP-II)Islamic Savings
NBP FUNDSManaging Your Savings
Page 23
The scheme has maintained provision against Sindh Workers’ Welfare Fund’s liability to the tune of Rs 7,781/-If the same were not made the NAV per unit/ since inception return of scheme would be higher by Rs 0.0008/0.00%.
Sindh Workers' Welfare Fund (SWWF)
[Returns are net of management fee & all other expenses]* Cumulative Returns
‘
Launch Date: April 27, 2018Fund Size: Rs. 932 millionType: Open Ended Shariah Compliant Fund of FundsDealing Days: Daily – Monday to FridayDealing Time: (Mon-Thr) 9:00 A.M to 4:30 P.M (Friday) 9:00 A.M to 5:00 P.MSettlement: 2-3 business daysPricing Mechanism Forward PricingBack end Load: NilManagement Fee: 1) On invested amount in NAFA funds, no additional fee. 2) Cash in Bank account: 1.0% p.a.Total Expense Ratio (%) 0.30% p.a (including 0.06% government levies)Risk Pro�le Low Listing: Pakistan Stock ExchangeCustodian & Trustee: Central Depository Company (CDC)Auditors: KPMG Taseer Hadi & Co. Chartered Accountants Benchmark: Daily Weighted Return of KMI-30 Index and 3-months average deposit rate of three AA rated Islamic Banks or Islamic windows of Conventional Banks as selected by MUFAP, on the basis of actual investment by the Plan in equity and money market schemes.Fund Manager: Sajjad Anwar, CFA Asset Manager Rating: AM1 by PACRA (Very High Quality)
NBP Funds launched its NAFA Islamic Capital Preservation Plan-II (NICPP-II) in April, 2018 which is the fourth plan under NAFA Islamic Active Allocation Fund-II. The Plan is dynamically allocated between the Equity Component and Money Market Component by using the Constant Proportion Portfolio Insurance (CPPI) Methodology. Allocation to Equity Component is generally increased where equity market is rising, while allocation to the Money Market Component is generally increased when the equity market declines. The Plan is presently closed for new subscription. NICPP-II has an initial maturity of two years.
Since inception, unit price of NICPP-II has increased by 0.04% versus the benchmark increase of 0.02%.
April 2018
Since LaunchApril 27 , 2018
0.04%
0.02%
NAFA Islamic Capital Preservation Plan-II
Performance Period
Shariah Compliant Funds Cash Equivalents Others including receivables Total Leverage
- 99.9%0.1%
100.0%Nil
30-Apr-18Asset Allocation (% of Total Assets)
Unit Price (30/04/2018): Rs. 100.0403
Dr. Amjad Waheed, CFASajjad Anwar, CFA
Muhammad Ali Bhabha, CFA, FRMTaha Khan Javed, CFA
Hassan Raza, CFA
Disclaimer: This publication is for informational purposes only and nothing herein should be construed as a solicitation, recommendation or an offer to buy or sell any fund. All investments in mutual funds are subject to market risks.Past performance is not necessarily indicative of future results. Please read the Offering Documents to understand the investment policies and the risks involved. Capital preservation only applies to unit holders who hold their investments until initial maturity of two years.
%*
The objective of NAFA Islamic Capital Preservation Plan-II is to earn a potentially high return through dynamic asset allocation between Shariah Compliant Dedicated Equity and Money Market based Collective Investment Schemes and/or savings accounts / term deposits, while providing Capital Preservation of the Initial Investment Value including sales load at completion of twenty four months and beyond.
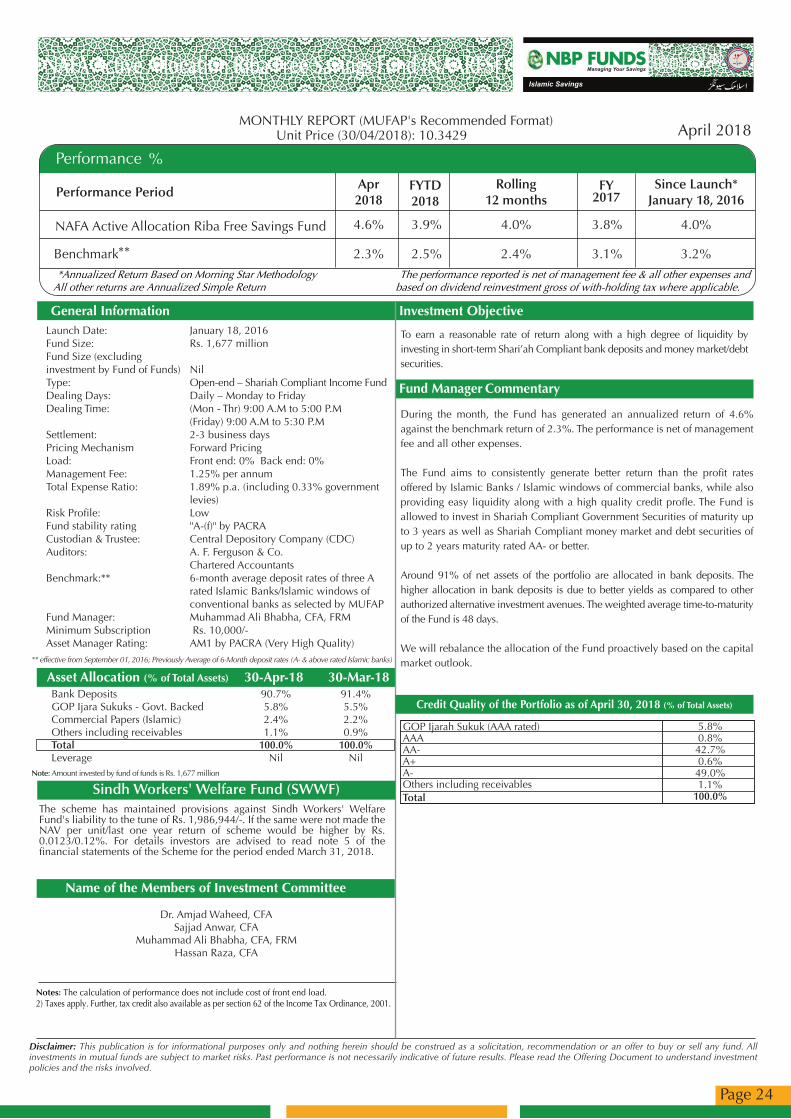
NAFA Active Allocation Riba Free Savings Fund (NAARFSF)Islamic Savings
NBP FUNDSManaging Your Savings
Page 24
Disclaimer: This publication is for informational purposes only and nothing herein should be construed as a solicitation, recommendation or an offer to buy or sell any fund. All investments in mutual funds are subject to market risks. Past performance is not necessarily indicative of future results. Please read the Offering Document to understand investment policies and the risks involved.
*Annualized Return Based on Morning Star MethodologyAll other returns are Annualized Simple Return
The performance reported is net of management fee & all other expenses andbased on dividend reinvestment gross of with-holding tax where applicable.
Launch Date: January 18, 2016Fund Size: Rs. 1,677 millionFund Size (excludinginvestment by Fund of Funds) Nil Type: Open-end – Shariah Compliant Income FundDealing Days: Daily – Monday to FridayDealing Time: (Mon - Thr) 9:00 A.M to 5:00 P.M (Friday) 9:00 A.M to 5:30 P.MSettlement: 2-3 business daysPricing Mechanism Forward PricingLoad: Front end: 0% Back end: 0%Management Fee: 1.25% per annumTotal Expense Ratio: 1.89% p.a. (including 0.33% government levies) Risk Pro�le: LowFund stability rating "A-(f)" by PACRACustodian & Trustee: Central Depository Company (CDC)Auditors: A. F. Ferguson & Co. Chartered AccountantsBenchmark:** 6-month average deposit rates of three A rated Islamic Banks/Islamic windows of conventional banks as selected by MUFAPFund Manager: Muhammad Ali Bhabha, CFA, FRMMinimum Subscription Rs. 10,000/-Asset Manager Rating: AM1 by PACRA (Very High Quality)
To earn a reasonable rate of return along with a high degree of liquidity by investing in short-term Shari’ah Compliant bank deposits and money market/debt securities.
During the month, the Fund has generated an annualized return of 4.6% against the benchmark return of 2.3%. The performance is net of management fee and all other expenses.
The Fund aims to consistently generate better return than the pro�t rates offered by Islamic Banks / Islamic windows of commercial banks, while also providing easy liquidity along with a high quality credit pro�e. The Fund is allowed to invest in Shariah Compliant Government Securities of maturity up to 3 years as well as Shariah Compliant money market and debt securities of up to 2 years maturity rated AA- or better.
Around 91% of net assets of the portfolio are allocated in bank deposits. The higher allocation in bank deposits is due to better yields as compared to other authorized alternative investment avenues. The weighted average time-to-maturity of the Fund is 48 days.
We will rebalance the allocation of the Fund proactively based on the capital market outlook.
April 2018
Since Launch*January 18, 2016
Apr2018
4.6%
2.3%
FYTD2018
3.9%
2.5%
Rolling12 months
4.0%
2.4%
3.8%
3.1%
4.0%
3.2%
NAFA Active Allocation Riba Free Savings Fund
Performance Period
Bank Deposits GOP Ijara Sukuks - Govt. Backed Commercial Papers (Islamic) Others including receivables Total Leverage
91.4%5.5%2.2%0.9%
100.0%Nil
30-Mar-1890.7%5.8%2.4%1.1%
100.0%Nil
30-Apr-18Asset Allocation (% of Total Assets)
Unit Price (30/04/2018): 10.3429
Notes: The calculation of performance does not include cost of front end load.2) Taxes apply. Further, tax credit also available as per section 62 of the Income Tax Ordinance, 2001.
Dr. Amjad Waheed, CFASajjad Anwar, CFA
Muhammad Ali Bhabha, CFA, FRMHassan Raza, CFA
Credit Quality of the Portfolio as of April 30, 2018 (% of Total Assets)
GOP Ijarah Sukuk (AAA rated)AAAAA-A+A-Others including receivablesTotal
5.8%0.8%42.7%0.6%49.0%1.1%
100.0%
** effective from September 01, 2016; Previously Average of 6-Month deposit rates (A- & above rated Islamic banks)
Note: Amount invested by fund of funds is Rs. 1,677 million
The scheme has maintained provisions against Sindh Workers' Welfare Fund's liability to the tune of Rs. 1,986,944/-. If the same were not made the NAV per unit/last one year return of scheme would be higher by Rs. 0.0123/0.12%. For details investors are advised to read note 5 of the �nancial statements of the Scheme for the period ended March 31, 2018.
Sindh Workers' Welfare Fund (SWWF)
FY2017
%

NAFA Islamic Active Allocation Equity Fund (NIAAEF)Islamic Savings
NBP FUNDSManaging Your Savings
Page 25
Notes: 1) The calculation of performance does not include cost of front-end load.2) Taxes apply. Further, tax credit also available as per section 62 of the Income Tax Ordinance, 2001.
Top Ten Holdings (as on 30 April, 2018)
Pak Petroleum Ltd
Engro Corporation Ltd
Oil & Gas Dev Co Ltd
Pakistan Oil�elds Ltd
Nishat Mills Ltd
Hub Power Company Ltd
Engro Fertilizer Ltd
Mari Petroleum Company Ltd
Pakistan State Oil Co. Ltd
International Steel Ltd
4.5%
4.4%
4.2%
3.7%
3.2%
7.3%
6.8%
6.2%
5.0%
4.7%
% of TotalAssets
% of TotalAssets
PER10.410.5
NIAAEFKMI-30
PBV2.12.0
DY4.2%4.6%
Note: Amount invested by fund of funds is Rs 2,992 million.
Disclaimer: This publication is for informational purposes only and nothing herein should be construed as a solicitation, recommendation or an offer to buy or sell any fund. All investments in mutual funds are subject to market risks.Past performance is not necessarily indicative of future results. Please read the Offering Documents to understand the investment policies and the risks involved.
* Annualized ReturnAll Other returns are Cumulative
‘
Launch Date: January 18, 2016Fund Size: Rs. 2,992 millionFund Size: (Excludinginvestment by fund of funds) NilType: Open Ended Shariah Compliant Equity SchemeDealing Days: Daily – Monday to FridayDealing Time: (Mon - Thr) 9:00 A.M to 4:30 P.M (Friday) 9:00 A.M to 5:00 P.MSettlement: 2-3 business daysPricing Mechanism Forward PricingLoad: Front end-0% Back end-0%Management Fee: 2% p.aRisk Pro�le HighTotal Expense Ratio (%) 3.31% p.a. (including 0.37% government levies)Selling & Marketing Expenses 0.4% per annum
Custodian & Trustee: Central Depository Company (CDC)Auditors: A. F. Ferguson & Co. Chartered AccountantsBenchmark: KMI-30 IndexFund Manager: Taha Khan Javed, CFAAsset Manager Rating: AM1 by PACRA (Very High Quality)
The objective of the Fund is to provide investors with long term capital growth from an actively managed portfolio of Shari’ah Compliant listed equities.
NBP Funds launched its second open-end Islamic Equity Fund namely NAFA Islamic Active Allocation Equity Fund (NIAAEF) in January, 2016. The aim of the Fund is to provide growth to the investment of Unit holders over the long-term in approved Shariah Compliant equities.
NIAAEF started off the month with an allocation of around 85% in equities, which increased to around 90% towards the end of the month. NIAAEF underperformed the Benchmark in April as the Fund was underweight in equities which rose during the month. During the month, the allocation was increased primarily in Fertilizer, Oil & Gas Exploration Companies, and Oil & Gas Marketing Companies sectors, whereas it was reduced primarily in Automobile Assembler, and Cement sectors.
April 2018
Since Launch*January 18, 2016
16.6%
18.6%
Apr2018
(0.2%)
0.1%
FYTD2018
(8.1%)
(2.0%)
FY2017
30.1%
18.8%
Rolling12 months
(13.4%)
(8.8%)
NAFA Islamic Active Allocation Equity Fund
Performance Period
Equities / Stocks Cash Equivalents Others including receivables Total Leverage
84.7%13.7%1.6%
100.0%Nil
30-Mar-1889.9%7.9%2.2%
100.0%Nil
30-Apr-18Asset Allocation (% of Total Assets)
Unit Price (30/04/2018) Rs. 12.1412
Dr. Amjad Waheed, CFASajjad Anwar, CFA
Taha Khan Javed, CFAHassan Raza, CFA
%
Top Five Sectors (% of Total Assets) (as on 30 April, 2018)
Oil & Gas Exploration Companies Fertilizer Cement Oil & Gas Marketing Companies Power Generation & Distribution Others
22.7%12.0%11.4%9.4%6.5%
27.9%
The performance reported is net of management fee & all other expenses and based on dividend reinvestmentgross of with-holding tax where applicable.
The scheme has maintained provision against Sindh Workers’ Welfare Fund’s liability to the tune of Rs 29,057,183/-If the same were not made the NAV per unit/ last one year return of scheme would be higher by Rs 0.1179/0.84%. For details investors are advised to read the Note 5 of the Financial Statements of the Scheme for the period ended March 31, 2018.
Sindh Workers' Welfare Fund (SWWF)
** Based on NBP Funds estimates
NIAAEF42.0%
KMI-3047.5%
-20.0%
0.0%
20.0%
40.0%
60.0%
80.0%
19-J
an-1
6
19-F
eb-1
6
19-M
ar-1
6
19-A
pr-1
6
19-M
ay-1
6
19-J
un-1
6
19-J
ul-1
6
19-A
ug-1
6
19-S
ep-1
6
19-O
ct-1
6
19-N
ov-
16
19-D
ec-1
6
19-J
an-1
7
19-F
eb-1
7
19-M
ar-1
7
19-A
pr-1
7
19-M
ay-1
7
19-J
un-1
7
19-J
ul-1
7
19-A
ug-1
7
19-S
ep-1
7
19-O
ct-1
7
19-N
ov-
17
19-D
ec-1
7
19-J
an-1
8
19-F
eb-1
8
19-M
ar-1
8
19-A
pr-1
8
NIAAEF KMI-30Annualized Return 16.6% 18.6%Risk (Std. Deviation) 14.8% 17.3%
Relative Performance of NAFA Islamic Active Allocation Equity Fund (NIAAEF)Since Launch on January 18, 2016
Cum. Return
30-A
pr-1
8

Formerly: NBP Fullerton Asset Management Limited (NAFA)7th Floor Clifton Diamond Building, Block No. 4, Scheme No. 5, Clifton Karachi, Pakistan.
NBP Fund Management Limited
Call : 0800-20002 SMS: INVEST to 9995 [email protected] /nbpfunds