Embed Size (px)
Citation preview

116
Kyoto Bulletin of Islamic Area Studies 3-2 (March 2010)
Islamic Investment vs Unrestricted Investment: An Unlevel Playing Field?
Mohd Rahimie Abd Karim*
I. Introduction
Why do people invest? Indeed, when the current disposable income is committed into certain investment instrument, one would naturally expect that such sacrifices would yield greater return in future. Notwithstanding however, there are various reasons for people to invest hence return is merely one of the many objectives of investment. More often than not, investment motives that goes beyond return and risk consideration would likely involve trade-off between potential return and the need to uphold the social, ethical, religious or other socially responsible investment (SRI) causes.
This study attempts to investigate the impact of imposing religious criterion on investment performance based on analysis on hypothetical portfolios comprising entirely of Malaysian listed companies’ equities. The study is motivated by the tremendous growth of the Islamic finance and banking industry in the global market, in general, and in Malaysia, in particular. Despite the success however, there is a concern that the Shariah restrictions on securities selection would render Islamic-based portfolio becoming sub-optimal and hence, unable to compete with conventional or market portfolios.
II. Objectives of the Study
The primary objective of the study is to determine the characteristics of Islamic-based investment portfolio and to examine whether the religious-based portfolio has unique return and risk characteristics as compared to conventional portfolio. The concern arises as the cost-of-discipleship hypothesis (see Mueller, 1994; Schwab, 1996) implies that investing with socially-related consciousness may compromise potential return since various restrictions imposed by socially-oriented portfolio in keeping with its pre-stated social objectives would effectively restrict the universe of assets available for selection by the portfolio. Consequently, it would be rather difficult for socially-oriented portfolio to maximise the benefit of diversification or to become a mean-variance efficient portfolio amidst the social constraints.
In Malaysia, the number of Shariah-approved stocks listed on Bursa Malaysia Berhad, the country’s official stock exchange, far outnumbered the non Shariah-approved stocks at a ratio of 6-to-1. Table 2.1 shows that 85 percent of the total companies listed on the Malaysian
イスラーム世界研究 第 3巻 2号(2010 年 3 月)116‒142 頁
Kyoto Bulletin of Islamic Area Studies, 3-2 (March 2010), pp. 116–142
* University of Durham, UK
08sp05_rahimi.indd 116 2010/04/16 15:35:52

117
Islamic Investment vs Unrestricted Investment: An Unlevel Playing Field?
stock exchange are Shariah-compliant. With exception of Mining, Hotels and Closed-end Fund sectors, halal securities can be found in almost every industry including the Finance sector. Hence, despite the Shariah restrictions, the Malaysian stock market still offers considerable options of investable securities for Islamic-based portfolio.
With such a vast selection of securities, the Malaysian stock market provides an appropriate avenue for testing the cost-of-discipleship hypothesis to determine the impact of religious screening towards future return. Since there are numerous Shariah-approved stocks available, an Islamic-based portfolio in Malaysia is arguably not lacking the potential securities and should be able to find alternative securities to any non Shariah-approved stock that would yield equivalent return with similar risk exposure. Therefore, holding other factors constant, the performance of an Islamic-based portfolio comprising entirely of Shariah-approved stocks is not poised to be significantly different from the performance of an unrestricted portfolio.
Table 2.1: Shariah-Compliant Securities Listed on Bursa Malaysia BerhadMain Board / Second
Board / MESDAQ MarketShariah-Compliant
SecuritiesTotal Securities Percentage of Shariah-
Compliant SecuritiesConsumer Products 122 133 92
Industrial Products 280 298 94
Mining Nil 1 Nil
Construction 51 55 93
Trading / Services 168 204 82
Properties 72 92 78
Plantation 38 45 84
Technology 101 104 97
Infrastructure (IPC) 6 8 75
Finance 5 42 12
Hotels Nil 5 Nil
Closed-end Fund Nil 1 Nil
Total 843 988 85
Source: Securities Commission of Malaysia (SC)
The actual performance of Shariah-approved stocks is illustrated by the performance of the Shariah indices as shown in Figure 2.1 below. The price trends indicate that the performance of Shariah-approved stocks mirrored the performance of the Kuala Lumpur Composite Index (KLCI), thus suggesting a significant correlation level between the main benchmark index and the Shariah indices. The correlation is particularly due to certain KLCI component stocks —— excluding gaming and liquor as well as most of the major finance and conglomerate stocks —— are Shariah-compliant securities. It also signifies that the main
08sp05_rahimi.indd 117 2010/04/16 15:36:49

118
Kyoto Bulletin of Islamic Area Studies 3-2 (March 2010)
benchmark index provide significant lead to the Shariah indices’ movement.
Figure 2.1: Daily Price Movement of Selected IndicesSource: Bursa Malaysia Berhad
III. Background of the Study
This study is particularly motivated by the huge interest towards Islamic finance and banking industry worldwide. Despite being a relatively new industry and is significantly outsized by the conventional finance and banking industry, some estimates have indicated that the value of the industry is very significant, nonetheless. The Standard and Poor’s (S&P) has estimated the value of Shariah-compliant assets at US$500 billion with a 10 percent annual growth rate over the past decade and is potentially to reach US$4 trillion. Moody’s put the value of the global Islamic finance industry at US$700 billion whilst McKinsey & Co. anticipates that by 2010, the assets of Islamic finance industry (excluding Iran) will be around US$1 trillion (see IFR 2008/09; 30). At present, there are about 300 Islamic banking and finance (IBF) institutions operating in 75 countries with an estimated annual growth of around 15 to 20 percent (IFR 2008/09; 41). By 2012, value of the Islamic finance industry is expected to reach US$1.6 trillion as compared to US$660 billion at the end of 2007 (IFR 2009/10; 56). The substantial growth in the asset value is accompanied by the expansion in the Islamic banking and finance services from the traditional activities into Takaful (insurance), Sukuk (fixed income securities or bonds) as well as fund management services. Ayub (2007) reported that the Islamic fund management industry has expanded from only 29 funds with total assets
80
90
110
120
130
140
150
Index points (rebarsed to 100)
Jan 07
Feb 07
Mar 07
Apr 07
May 07
Jun 07
Aug 07
Sep 07
Oct 07
Nov 07
Jul 07
Dec 07
Jan 08
Feb 08
Mar 08
KLCI FBM EMAS Shariah IndexFBM Hijrah Shariah Index
Performance of KLCI vs Shariah Indices
08sp05_rahimi.indd 118 2010/04/16 15:36:50

119
Islamic Investment vs Unrestricted Investment: An Unlevel Playing Field?
worth US$800 million in 1996 to 98 funds with nearly US$5 billion worth of assets in the early 2000.
The Malaysian unit trust or mutual fund industry has also recorded impressive growth on the back of the strong performance of the Malaysian stock market. The net asset value (NAV) of the industry grew by an average of 21.2 percent per year during 1992 to 1999. As at end of 1999, the total NAV of the Malaysian unit trust industry stood at RM43.3 billion representing 7.8 percent of the total market capitalisation of the Bursa Malaysia. During 2000 to 2007, the industry grew by an average of 19.2 percent annually, with its total NAV nearly quadruplet to RM169.4 billion at the end of 2007 comprising of 15.3 percent of the total market capitalisation of Bursa Malaysia. The growth of the industry is illustrated in Figure 3.1 below.
Figure 3.1: Total NAV of Unit Trust Funds vs Bursa Malaysia Market Capitalisation
Source: Modified data from Federation of Malaysian Unit Trust Managers (FMUTM)
0.00
200.00
400.00
600.00
800.00
1000.00
1200.00
1992
1993
1994
1995
1996
1997
1998
1999
2000
2001
2002
2003
2004
2005
2006
2007
RM
bln
Bursa Malay Market Cap. NAVYear
08sp05_rahimi.indd 119 2010/04/16 15:36:52

120
Kyoto Bulletin of Islamic Area Studies 3-2 (March 2010)
Table 3.1: Summary Statistics of the Malaysian Unit Trust Fund Industry12/2004 1282005 12/2006 12/2007 07/2008
No. of Management Companies 36 36 38 39 40No. of Approved Funds*� Conventional� Islamic-based
29122071
34025783
416316100
521387134
565421144
No. of Launched Funds� Conventional� Islamic-based
27320865
32324479
39229795
495367128
536398138
Units in Circulation (in billion)� Conventional� Islamic-based
118.627105.47213.155
139.386120.76218.624
154.067135.52218.545
208.342171.99536.347
233.009186.78646.223
No. of Accounts (in '000) #� Conventional� Islamic-based
10,4259,998
427
10,86110,221
640
11,16410,398
766
12,27511,0251,250
12,76511,1971,568
Total NAV (in RM billion)� Conventional� Islamic-based
87.38580.6246.761
98.48589.9988.487
121.762112.591
9.171
169.414152.55316.861
159.874142.07117.803
Total Bursa Malaysia Market Cap (in RM billion) 722.04 695.27 848.70 1,106.15 876.13% of NAV to Bursa Malaysia Market Cap 12.10 14.17 14.35 15.32 18.25
Average funds managed per company 8 9 10 13 13Average units per company (in billion) 3.30 3.87 4.05 5.34 5.83Average NAV per company (in RM billion) 2.43 2.74 3.20 4.34 4.00Average NAV per unit (RM) 0.74 0.71 0.79 0.81 0.69Average NAV per unit (RM) - Conventional 0.76 0.75 0.83 0.89 0.76Average NAV per unit (RM) - Islamic 0.51 0.46 0.49 0.46 0.39* - Includes funds approved but not yet launched.# - Not including unit holders account at IUTA that operates nominee account system.Source: Modified data from Securities Commission of Malaysia (SC)
Table 3.1 above provides further evidence of the growing popularity of Islamic unit trusts or mutual funds in Malaysia. During the four years period from 2004 to 2008, Islamic-based unit trust funds outperformed the conventional funds in terms of the number of funds launched, the total units in circulation, the total number of accounts as well as the total net asset value (NAV). Reflecting a growing demand for Islamic-based funds, the number of units in circulation grew three-fold from 13.2 billion units to 46.2 billion units. During the same period, the number of conventional unit trust funds in circulation only grew by 77 percent to 186.8 billion units. Close inspection on the data reveals that demand for Islamic-based funds was particularly high in 2007 when the number of accounts increased 63 percent to 1.3 million accounts whilst the total units in circulation doubled to 36.4 million units from 18.6 million units. The rising demand is attributed to the better stock market performance and growing interest towards unit trust and mutual fund investment as well as aggressive marketing strategy as reflected from the number of newly approved and launched funds in 2007. Nevertheless, with its total NAV only accounts for 11.1 percent of the total NAV of the industry, Islamic-based funds is indeed still relatively small in comparison to conventional
08sp05_rahimi.indd 120 2010/04/16 15:36:54

121
Islamic Investment vs Unrestricted Investment: An Unlevel Playing Field?
unit trust funds. In terms of the NAV, the average value of Islamic unit trust is about half the value of conventional unit trust. Collectively, the total NAV of the Malaysian unit trust fund industry as a proportion to the total market capitalisation of Bursa Malaysia has increased steadily from 12.1 percent in 2004 to 18.3 percent in 2008. The actual performance of unit trust funds in Malaysia is shown in Table 3.2 below.
Table 3.2: Average Performance of Malaysian Unit Trust Funds as at July 9, 2009Fund Name Cumulative Performance 5-yr annual
return3-mths 6-mths 1-year 3-year 5-yearMalaysia Equity 15.08 16.77 -3.27 24.15 29.60 4.96Malaysia Islamic Equity 11.75 14.27 -4.71 19.37 17.06 2.92Malaysia Equity - Smallcap:KLSE Composite IndexFTSE BM Emas IndexFTSE BM 2nd Board
16.10190.917.84
15.9519.2918.13
-6.50-5.32
-12.10
15.1418.90-24.25
24.7822.82-40.11
4.534.20-9.75
Malaysia Islamic Equity - Smallcap 20.08 21.20 -7.58 29.36 -5.42 -1.13Malaysia Bond 1.34 1.82 1.82 6.99 8.35 -0.12Malaysia Islamic Bond 1.20 2.14 5.53 7.95 9.84 1.79Malaysia Money Market 0.34 -3.38 -2.61 -0.57 -0.37 -0.42Malaysia Islamic Money Market 0.16 0.47 1.13 1.87 -4.24 -5.58Source: The Edge Malaysia, 13 July 2009
The above table reveals that the Malaysian Islamic-based funds generally underperformed its conventional counterparts particularly on a long-term basis. The 5-year average annual return for Islamic-based equity funds of 2.9 percent is far below the average return of the conventional equity funds. The performance of Islamic-based smaller capitalised equity funds and money market funds were even more disappointing with the former posted a negative return on 1.1 percent whilst the latter suffered 5.6 percent losses. The Islamic-based bond funds however, did particularly well with an average annual return of 1.8 percent compared to 0.1 percent loss by conventional bond funds. On a short term basis however, Islamic-based smaller capitalised stock funds did extremely well with an average return of 20.1 percent for 3-months and 21.2 percent for 6-months up to July 2009, respectively, thus outperforming the other types of unit trust funds either Islamic-based or conventional. The encouraging performance is attributable to the strong recovery by the Malaysian stock market in the early 2009 after a rather dismal performance the previous year. The past record also provides evidence for the small firm effect since majority of Shariah-compliant stocks comprise of smaller size stocks. It is worth mentioning that the table clearly highlights the superiority of large capitalised stocks particularly on a long-term basis as indicated by the consistent performance of the KL Composite Index (KLCI), for which, its component stocks comprises mainly of high yielding conglomerates from various industries.
08sp05_rahimi.indd 121 2010/04/16 15:36:55

122
Kyoto Bulletin of Islamic Area Studies 3-2 (March 2010)
All the statistics presented reveal that Islamic-based funds have been gaining popularity among Malaysian investors on the back of the strong stock market performance and growing interest towards unit trust or mutual fund as a viable investment alternative. The actual record however, implies that the performance of Islamic-based funds is generally lower than conventional funds. Depending on the overall market performance, Islamic-based funds could outperform conventional funds in a short-term period but is unlikely to sustain the performance on a long-term basis. In view that portfolio performance depends largely on the collective return of its component stocks, a comprehensive study is necessary to determine the general characteristics of an Islamic-based portfolio. Several studies have been undertaken in the past to investigate the performance of Islamic-based funds in Malaysia.
IV. Literature Review
Past studies on the performance of Malaysian unit trust funds is rather limited, unfortunately. The findings were generally inconclusive as some have claimed that unit trust funds performed better than the market index whilst some have stated otherwise. Similar findings were also derived when comparison is made between Islamic-based funds and conventional funds. Studies by Leong and Lian (1998) found that unit trust funds produce superior return than the market portfolio. In addition, Chuan (1995), Leong and Lian (1998), and Huson Joher (2007) claimed that most unit trust funds have a well diversified portfolio, indicating that fund managers do possess some valuable investment skills. Chuan (1995), Shamser and Annuar (1995), Fauziah and Mansor (2007), Huson Joher (2007), and Low (2007), however, argued that Malaysian unit trust funds were generally unable to outperform both the market portfolio and the simple buy-and-hold strategy. Apart from the underperformance, fund managers were also claimed to be lacking both the timing and stock selection skills and were unable to forecast security prices accurately. With regards to Islamic-based fund performance, Mohd Hasimi and Noor Azuddin (2002), Mohd Azlan et al. (2004) and Fikriyah et al. (2007) found that Islamic-based funds have outperformed the market benchmark or conventional funds based on data at the beginning of this decade. A recent study by Nik Maheran and Masliza (2008) using more recent data however, has concluded otherwise. Another interesting observation is the tendency of Islamic-based funds to beat conventional funds only when market is in a downtrend but underperform when market is in an uptrend as reported by Fikriyah et al. (2007) and Abdullah et al. (2002; cited in Nik Maheran and Masliza, 2008). The performance trend reflects the nature of Islamic-based funds that avoid companies with excessive leverage or involve in finance, banking, gambling and other prohibitive activities which are particularly sensitive to the changing economic or business cycles.
08sp05_rahimi.indd 122 2010/04/16 15:36:55

123
Islamic Investment vs Unrestricted Investment: An Unlevel Playing Field?
In view of the limited studies that have been undertaken in the past, it would be premature to conclude that Islamic-based funds are superior to conventional or market portfolio. The disagreement is attributed to numerous differences pertaining to research methodologies, the price data and the time period used by the studies. Although various methods have been employed in the past, past studies suffered several shortcomings that may compromise their results. Since majority of the pervious studies used actual Islamic or conventional unit trust funds and employed conventional portfolio performance measurement models, the studies are vulnerable to certain statistical problems particularly related to joint hypotheses testing. In this case, any outperformance or underperformance observed cannot be attributed to a single factor as it could be caused by their fund managers’ superior investment skills, the general market condition, or the appropriateness of the portfolio valuation model or market benchmark used. The published data such as in Table 3.2 signifies that market timing is particularly important as the prevailing market condition during which a study is being undertaken could affect its finding significantly. In addition, any outperformance would tend to be a short-term phenomenon and would not be persistent in view that a continuously superior performance to the market index or the simple buy-and-hold strategy would contradict the notion of the efficient market hypothesis (EMH).
V. Data and Methodology
This study is based on samples of price-weighted hypothetical portfolios comprising entirely of equities of Malaysian listed companies. Hypothetical portfolio or portfolio simulation has been used to study portfolio performance such as by Draper and Paudyal (1997), Mohd Hasimi and Noor Azuddin (2002) as well as Cowell (2002). For the purpose of this study, the use of hypothetical portfolio is arguably more appropriate when the primary objective is to identify any distinguishing factor in the return and risk characteristics between Islamic-based portfolio vis-à-vis an unrestricted portfolio. The rationale for using hypothetical portfolios instead of actual unit trust funds is that the performance of the hypothetical portfolios would be determined solely by the general market condition without undue influence from external factors such as fund investment policies or fund managers’ skills as would be the case if using the existing unit trust funds.
All secondary time series data including the end-of-year stock prices, the KL Composite Index (KLCI) and the FTSE Bursa Malaysia Shariah Index (FBMSHA) as well as the Malaysian 3-month Treasury bills (T-bills) rates as proxy for risk-free rate investment instrument were obtained from the Datastream. The data covers a 20-year period from 1989 to 2008 whereas the period is divided into three sub-periods namely the Market Rally Period (1989-1997), the Crisis Period (1998-2003) and the Post Crisis Period (2003-2008). The
08sp05_rahimi.indd 123 2010/04/16 15:36:56

124
Kyoto Bulletin of Islamic Area Studies 3-2 (March 2010)
periodic classification is required to examine the long-run behaviour of performance and to capture the impact of changing market environment during the period.
Three groups of hypothetical portfolios were constructed namely the Conventional Portfolio (CP), the Shariah-approved Portfolio (SAP), and the Non Shariah-approved Portfolio (NSAP). For the purpose of this study, CP is deemed as proxy for ‘conventional’ or ‘unrestricted’ portfolio by virtues that it contains both Shariah-compliant and non Shariah-compliant stocks. The SAP and NSAP are specialised portfolios with SAP merely comprises of Shariah-approved stocks whilst NSAP is exclusively for non Shariah-approved stocks. The three classifications of portfolios are required in order to examine the different traits and cross relationships between the portfolios. The Shariah-compliant stocks were identified based on the list of Shariah-approved securities provided by the Securities Commission of Malaysia (SC) issued on 28th November 2008. The list comprises of 855 Shariah-compliant stocks, representing 87 percent from the total of 980 securities listed on the Malaysian stock market.
The portfolio is constructed by assuming that one unit of share is purchased from all listed companies and held in the respective portfolio throughout the period. Hence, the number of securities in each portfolio is poised to increase every year as new companies are listed and included in the portfolio. To be qualified for inclusion into the portfolio, the stock must have been listed for a complete one-calendar year and has maintained its listing status throughout the respective year. Therefore, a new stock which is listed in a particular year will not be immediately included into the portfolio in the same year when it is listed but will be included in the following year. Similarly, any suspended stock will be excluded from the portfolio and will be included back into the portfolio in the following year after its listing status is resumed.
The holding period return for each stock is calculated as follows:
����� � �� � � � (Eq. 5-1)
where;
� � � � is the yearly return in log normal form.
The portfolio return is calculated based on the return contribution of each individual stock in the portfolio determined by their respective weight (wi) with the total weights in every portfolio adding up to 100 percent. The portfolio return is calculated as:
����� � �������� (Eq. 5-2)
where;
08sp05_rahimi.indd 124 2010/04/16 15:36:57

125
Islamic Investment vs Unrestricted Investment: An Unlevel Playing Field?
�������� is the total return from each stock in the portfolio based on their respective weight.
The risk of individual securities is determined based on their variance or standard deviation as follows:
��� � ������ � ����� (Eq. 5-3)
where;
xi� is the return on security i; andx is the arithmetic mean return.
Subsequently, the standard deviation is obtained from the square root of the variance as follows:
� � ���� (Eq. 5-4)
The beta, �, measure systematic risk for each stock and is calculated as follows:
�� ����� !"# !$�
%$& (Eq. 5-5)
where;
mR� is the return on the market index;
iR� is the return on security i; and2m� is the variance of the market returns.
However, due to the huge amount of data involved which makes the calculation of correlation and covariation of the component stocks becoming rather complex, Strong (2003) and Bodie et al. (2008) have suggested that beta for a portfolio can be calculated using a single index regression model as follows:
'� � (� ) ���* ) +� (Eq. 5-6)
where;yp is the portfolio return;�i is the intercept term;xm is the market return; and�i is the error term.
It is worth mentioning that prior to conducting the single index regression model of Equation 5-6, the time series data were tested for their stationarity to ensure that the data are stationary.
08sp05_rahimi.indd 125 2010/04/16 15:37:00

126
Kyoto Bulletin of Islamic Area Studies 3-2 (March 2010)
VI. Data Analysis
Summary of the hypothetical portfolios’ performance is shown in Table 6.1. Value of the Shariah-approved portfolio (SAP) stood at RM1,078.2 million as at end of 2008 which is 36 percent lower than the initial value of RM1,674.5 million in 1990. The number of Shariah-compliant stocks grew from 109 to 770 companies. On contrary, value of the non Shariah-approved portfolio (NSAP) increased two-fold from RM101.9 million to RM306.8 million but the total number of securities in the NSAP only grew moderately from 50 stocks to 120 stocks during the same period. Accordingly, the average per unit value for the SAP stocks dropped to RM1.40 from RM15.36 whilst the per unit value for the NSAP stocks rose to RM2.56 from RM2.04. Considering that majority of Malaysian listed companies are Shariah-compliant, the conventional portfolio (CP) shows a performance similar to the SAP. During the same period, the benchmark KL Composite Index (KLCI) which represents the overall market return for the Malaysian stock market increased from 592.92 to 1,376.62, rising 132 percent. The rather similar performance between the KLCI and the NSAP signifies a close correlation between the benchmark index and the non Shariah-approved portfolio since both share similar component stocks particularly large capitalised finance and conglomerate stocks. Hence, the NSAP is arguably possessing quality stocks superior to the SAP as reflected by the strong performance over the 20 years period.
Closer inspection on the performance within the different market cycles indicates that the SAP performed exceptionally well during the market rally period due particularly to the inclusion of large capitalised stocks in 1993 and 1994. Value of the SAP increased from RM1,674.5 million in 1990 to RM6,639.1 million in 1997 and was once topped at RM17,034.4 million in 1994. Although the total number of Shariah-compliant stocks of 314 securities in 1997 is three times bigger than 109 securities in 1990, the average per unit price was higher at RM21.14 against RM15.36 originally. The NSAP also benefited from the market rally with its value rising to RM724.0 million with 87 stocks from RM101.9 million with 50 stocks initially. The average per unit value for the NSAP stock is RM8.32 in 1997 against RM2.04 in 1990. With the KLCI value in 1997 of 1,259.44 was only twice the index value in 1990, both the SAP and the NSAP have outperformed the market performance during the market rally period. The spectacular growth in the value of the portfolios indicates that the major beneficiaries of the market rally were non-KLCI component stocks which consist primarily of medium- and smaller-sized capitalised stocks. During the crisis period, the SAP underperformed both the NSAP and the overall market as Shariah-compliant stocks suffered the biggest losses with an average loss of 18.3 percent annually as compared to an average loss of 10.7 percent for the NSAP and 3.4 percent for the KLCI. Fortunately, all the portfolios regained much of their losses as the overall market recovered in the post crisis period from
08sp05_rahimi.indd 126 2010/04/16 15:37:03
127
Islamic Investment vs Unrestricted Investment: An Unlevel Playing Field?
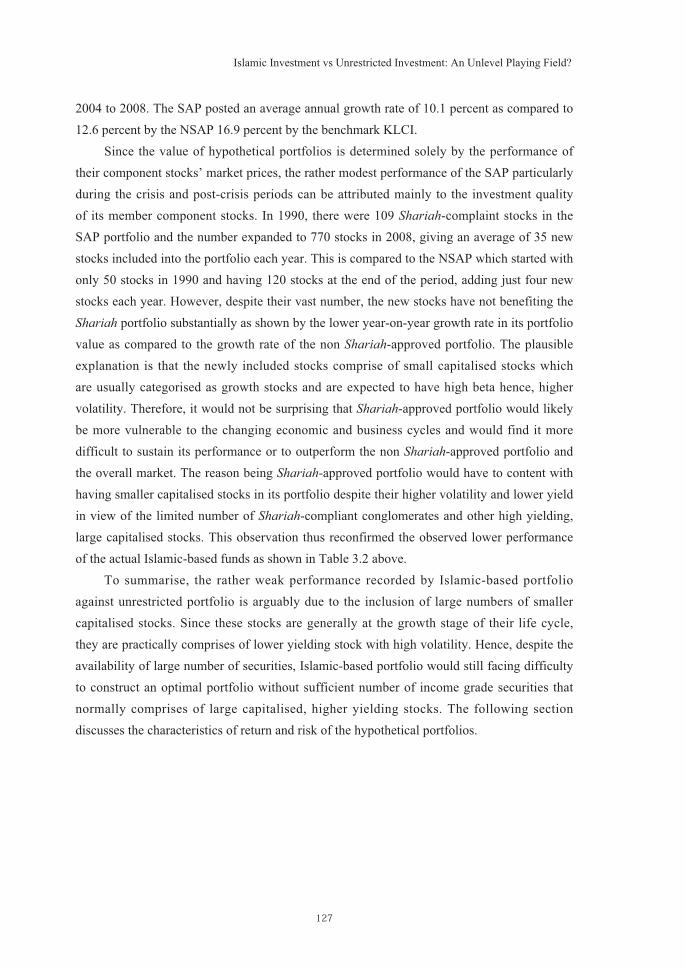
2004 to 2008. The SAP posted an average annual growth rate of 10.1 percent as compared to 12.6 percent by the NSAP 16.9 percent by the benchmark KLCI.
Since the value of hypothetical portfolios is determined solely by the performance of their component stocks’ market prices, the rather modest performance of the SAP particularly during the crisis and post-crisis periods can be attributed mainly to the investment quality of its member component stocks. In 1990, there were 109 Shariah-complaint stocks in the SAP portfolio and the number expanded to 770 stocks in 2008, giving an average of 35 new stocks included into the portfolio each year. This is compared to the NSAP which started with only 50 stocks in 1990 and having 120 stocks at the end of the period, adding just four new stocks each year. However, despite their vast number, the new stocks have not benefiting the Shariah portfolio substantially as shown by the lower year-on-year growth rate in its portfolio value as compared to the growth rate of the non Shariah-approved portfolio. The plausible explanation is that the newly included stocks comprise of small capitalised stocks which are usually categorised as growth stocks and are expected to have high beta hence, higher volatility. Therefore, it would not be surprising that Shariah-approved portfolio would likely be more vulnerable to the changing economic and business cycles and would find it more difficult to sustain its performance or to outperform the non Shariah-approved portfolio and the overall market. The reason being Shariah-approved portfolio would have to content with having smaller capitalised stocks in its portfolio despite their higher volatility and lower yield in view of the limited number of Shariah-compliant conglomerates and other high yielding, large capitalised stocks. This observation thus reconfirmed the observed lower performance of the actual Islamic-based funds as shown in Table 3.2 above.
To summarise, the rather weak performance recorded by Islamic-based portfolio against unrestricted portfolio is arguably due to the inclusion of large numbers of smaller capitalised stocks. Since these stocks are generally at the growth stage of their life cycle, they are practically comprises of lower yielding stock with high volatility. Hence, despite the availability of large number of securities, Islamic-based portfolio would still facing difficulty to construct an optimal portfolio without sufficient number of income grade securities that normally comprises of large capitalised, higher yielding stocks. The following section discusses the characteristics of return and risk of the hypothetical portfolios.
08sp05_rahimi.indd 127 2010/04/16 15:37:04

128
Kyoto Bulletin of Islamic Area Studies 3-2 (March 2010)
POR
TFO
LIO
SIZ
E A
ND
VA
LUE
MA
RK
ET R
ALL
Y P
ERIO
DC
RIS
IS P
ERIO
DPO
ST C
RIS
IS P
ERIO
D19
9019
9119
9219
9319
9419
9519
9619
9719
9819
9920
0020
0120
0220
0320
0420
0520
0620
0720
08
POR
TFO
LIO
VA
LU
E (R
M M
IL)
1C
P17
76.3
916
26.4
319
60.2
171
13.7
917
568.
9710
797.
0154
97.7
273
63.1
122
19.5
015
39.9
826
92.8
011
10.5
510
70.9
790
4.57
1219
.71
1141
.81
1044
.27
1407
.40
1384
.98
N15
916
919
323
026
029
935
740
147
253
455
557
460
963
168
875
983
089
089
0%
chg
y-o-
y-8
.44
20.5
226
2.91
146.
97-3
8.55
-49.
0833
.93
-69.
86-3
0.62
74.8
6-5
8.76
-3.5
6-1
5.54
34.8
4-6
.39
-8.5
434
.77
-1.5
9A
VE
11.1
79.
6210
.16
30.9
367
.57
36.1
115
.40
18.3
64.
702.
884.
851.
931.
761.
431.
771.
501.
261.
581.
56
2SA
P16
74.5
315
30.9
318
59.7
268
83.3
517
034.
4010
356.
6050
24.2
566
39.0
919
43.5
513
36.9
423
38.4
290
7.56
857.
4271
8.06
956.
9587
5.59
802.
3910
73.8
010
78.2
1N
109
116
133
163
186
222
277
314
377
435
456
471
503
525
579
645
714
770
770
%ch
g y-
o-y
-8.5
821
.48
270.
1314
7.47
-39.
20-5
1.49
32.1
4-7
0.73
-31.
2174
.91
-61.
19-5
.52
-16.
2533
.27
-8.5
0-8
.36
33.8
30.
41A
VE
15.3
613
.20
13.9
842
.23
91.5
846
.65
18.1
421
.14
5.16
3.07
5.13
1.93
1.70
1.37
1.65
1.36
1.12
1.39
1.40
3N
SAP
101.
8695
.50
100.
4923
0.44
534.
5744
0.41
473.
4772
4.02
275.
9520
3.04
354.
3820
2.99
213.
5518
6.51
262.
7626
6.22
241.
8833
3.60
306.
77N
5053
6067
7477
8087
9599
9910
310
610
610
911
411
612
012
0%
chg
y-o-
y-6
.24
5.23
129.
3213
1.98
-17.
617.
5152
.92
-61.
89-2
6.42
74.5
4-4
2.72
5.20
-12.
6640
.88
1.32
-9.1
437
.92
-8.0
4A
VE
2.04
1.80
1.67
3.44
7.22
5.72
5.92
8.32
2.90
2.05
3.58
1.97
2.01
1.76
2.41
2.34
2.09
2.78
2.56
IND
EX
1K
LCIR
E00
592.
9156
1.13
600.
6663
8.19
1124
.11
953.
7910
77.3
212
59.4
474
5.36
542.
2310
02.6
271
1.29
703.
9265
2.44
879.
2490
3.51
928.
6612
37.0
813
76.6
2%
chg
y-o-
y-5
.36
7.04
6.25
76.1
4-1
5.15
12.9
516
.90
-40.
82-2
7.25
84.9
1-2
9.06
-1.0
4-7
.31
34.7
62.
762.
7833
.21
11.2
82
KLS
YR
E00
0.00
0.00
0.00
0.00
0.00
0.00
0.00
0.00
0.00
0.00
160.
5010
8.23
106.
4099
.56
133.
7713
2.09
132.
7317
8.07
0.00
%ch
g y-
o-y
-32.
57-1
.69
-6.4
334
.36
-1.2
60.
4834
.16
Tab
le 6
.1: S
umm
ary
of H
ypot
hetic
al P
ortf
olio
Per
form
ance
08sp05_rahimi.indd 128 2010/04/16 15:37:05

129
Islamic Investment vs Unrestricted Investment: An Unlevel Playing Field?
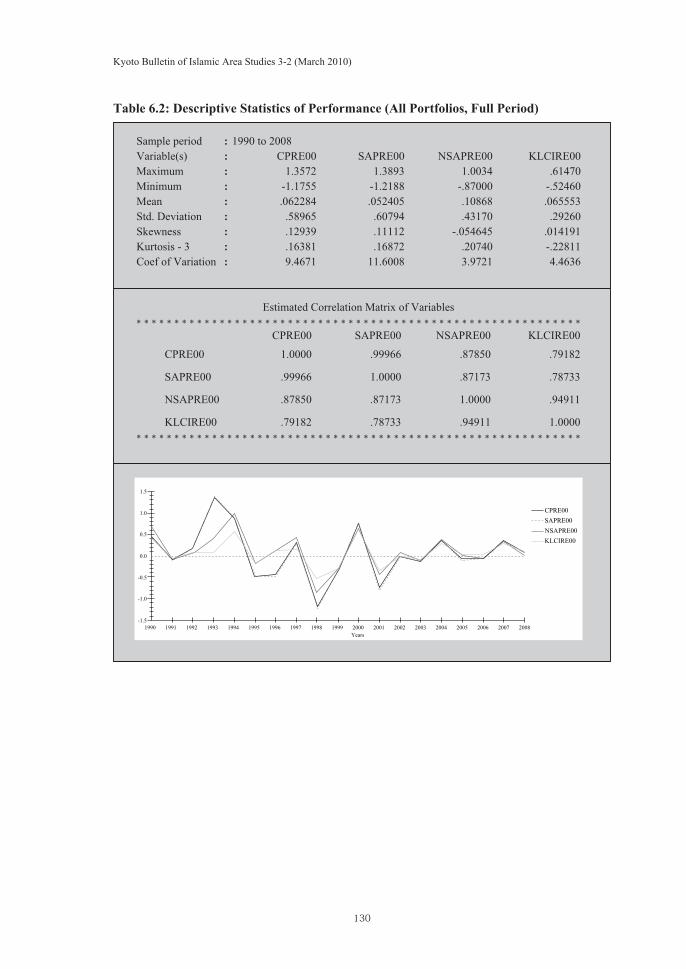
Table 6.2 below shows the long-run performance of all three hypothetical portfolios as well as the KLCI throughout 1990 to 2008. The top section of the table reveals that SAP recorded the lowest return as shown by the mean return of 5.2 percent as compared to NSAP (10.9 percent), CP (6.2 percent) and the KLCI (6.6 percent). The SAP also has the widest dispersion of return as measured by the maximum and minimum value, the kurtosis and the standard deviation. Of the three portfolios, NSAP is the best performing and the least volatile. The correlation matrix shown in the middle section of the table indicates that the SAP has a strong correlation with conventional portfolio but has a relatively lower correlation with the KLCI. The correlation levels explain why the performance of SAP closely resembles the performance of the conventional portfolio. It also explains why SAP was unable to outperform the benchmark as most of the KLCI main components comprises of non Shariah-compliant stocks. On the other hand, the NSAP has the highest correlation with the KLCI thus, explaining the ability of the non Shariah-approved portfolio to match the KLCI performance. The third section of the table provides the graphical trend of the return performance of the three hypothetical portfolios and the market index. The chart reveals a strong mean reversion trend in the portfolios return over the long term period.
Table 6.3 highlights the performance of the hypothetical portfolios during the market rally period from 1990 to 1997. Reflecting the buoyant market performance, all the hypothetical portfolios outperformed the KLCI in terms of return with the NSAP posted the highest gained of nearly 30 percent during the period followed by the CP (27.1 percent) and the SAP (26.4 percent). The higher performance of the hypothetical portfolios signifies that smaller and medium capitalised stocks were the main beneficiary of the market rally. In relation to risk, NSAP enjoys the lowest risk amongst the portfolios whilst SAP is the most risky portfolio. There were not much different in terms of correlation level between the Market Rally Period and the Full Period whereby return of the SAP remained the least correlated with the KLCI and the opposite is true for the NSAP. Reflecting the strong albeit volatile market performance, the chart exhibits that the portfolios’ returns are moving away from their mean during the market rally period.
08sp05_rahimi.indd 129 2010/04/16 15:37:06
130
Kyoto Bulletin of Islamic Area Studies 3-2 (March 2010)
Table 6.2: Descriptive Statistics of Performance (All Portfolios, Full Period)
Sample period : 1990 to 2008Variable(s) : CPRE00 SAPRE00 NSAPRE00 KLCIRE00Maximum : 1.3572 1.3893 1.0034 .61470Minimum : -1.1755 -1.2188 -.87000 -.52460Mean : .062284 .052405 .10868 .065553Std. Deviation : .58965 .60794 .43170 .29260Skewness : .12939 .11112 -.054645 .014191Kurtosis - 3 : .16381 .16872 .20740 -.22811Coef of Variation : 9.4671 11.6008 3.9721 4.4636
Estimated Correlation Matrix of Variables* * * * * * * * * * * * * * * * * * * * * * * * * * * * * * * * * * * * * * * * * * * * * * * * * * * * * * * * * * *
CPRE00 SAPRE00 NSAPRE00 KLCIRE00
CPRE00 1.0000 .99966 .87850 .79182
SAPRE00 .99966 1.0000 .87173 .78733
NSAPRE00 .87850 .87173 1.0000 .94911
KLCIRE00 .79182 .78733 .94911 1.0000* * * * * * * * * * * * * * * * * * * * * * * * * * * * * * * * * * * * * * * * * * * * * * * * * * * * * * * * * * *
1990 1991 1992 1993 1994 1995 1996 1997 1998 1999 2000 2001 2002 2003 2004 2005 2006 2007 2008-1.5
-1.0
-0.5
0.0
0.5
1.0
1.5
Years
CPRE00SAPRE00NSAPRE00KLCIRE00
08sp05_rahimi.indd 130 2010/04/16 15:37:06

131
Islamic Investment vs Unrestricted Investment: An Unlevel Playing Field?
Table 6.3 : Descriptive Statistics of Performance (All Portfolio, Market Rally)
The return performance during the crisis period is shown in Table 6.4. Among the three hypothetical portfolios, SAP is the worst performing when it suffered a mean loss of 29 percent against NSAP (-16.9 percent) and the benchmark index (-11 percent). The SAP is also the most risky portfolio. The benchmark index is the safest investment at a time of crisis since the index posted the lowest losses and the lowest risk as well. The possible explanation is that since the KLCI component stocks comprises of large capitalised stocks with high or sustainable income potential, value of these stocks are expected to remain stable and the downside risk is limited despite the poor stock market performance. The high correlation level among the portfolios and the benchmark index during the crisis period implies that the benchmark index becomes the main factor that lead the other securities. The close correlation between the hypothetical portfolios and
Sample period : 1990 to 1997Variable(s) : CPRE01 SAPRE01 NSAPRE01 KLCIRE01Maximum : 1.3572 1.3893 1.0034 .56610Minimum : -.48400 -.49710 -.17610 -.16430Mean : .27136 .26431 .29895 .14456Std. Deviation : .63668 .65394 .39901 .23705Skewness : .40725 .41320 .56230 .61583Kurtosis - 3 : -.86279 -.81679 -.80816 -.57930Coef of Variation : 2.3463 2.4741 1.3347 1.6398
Estimated Correlation Matrix of Variables* * * * * * * * * * * * * * * * * * * * * * * * * * * * * * * * * * * * * * * * * * * * * * * * * * * * * * * * * * *
CPRE01 SAPRE01 NSAPRE01 KLCIRE01
CPRE01 1.0000 .99972 .72451 .52474
SAPRE01 .99972 1.0000 .71134 .50869
NSAPRE01 .72451 .71134 1.0000 .95136
KLCIRE01 .52474 .50869 .95136 1.0000* * * * * * * * * * * * * * * * * * * * * * * * * * * * * * * * * * * * * * * * * * * * * * * * * * * * * * * * * * *
1990 1991 1992 1993 1994 1995 1996 1997-1.5-0.5
0.0
0.5
1.0
1.5
Years
CPRE01SAPRE01NSAPRE01KLCIRE01
08sp05_rahimi.indd 131 2010/04/16 15:37:08
132
Kyoto Bulletin of Islamic Area Studies 3-2 (March 2010)
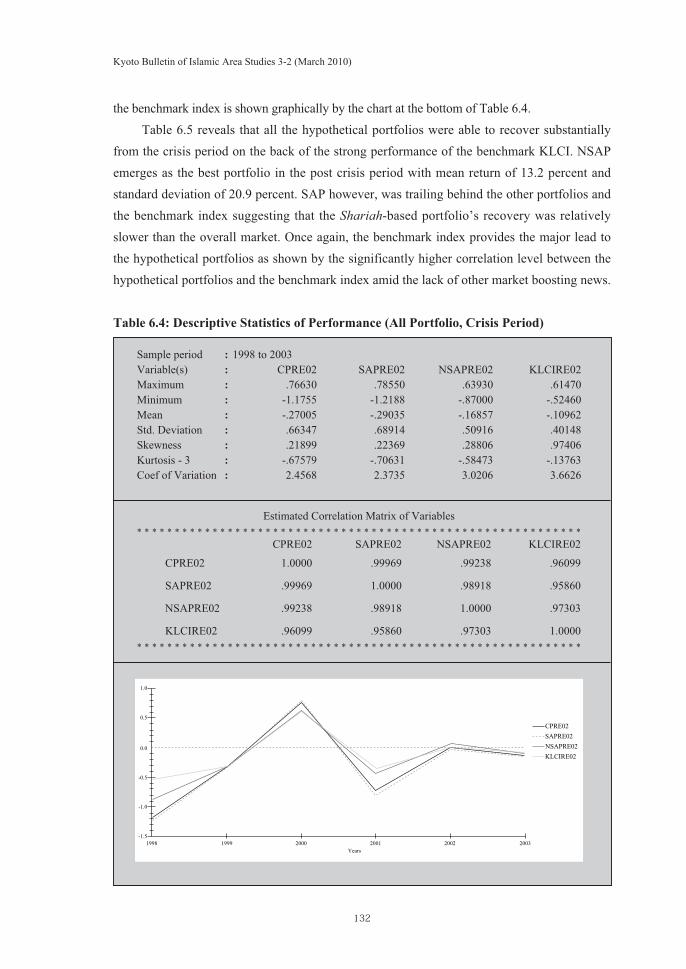
the benchmark index is shown graphically by the chart at the bottom of Table 6.4.Table 6.5 reveals that all the hypothetical portfolios were able to recover substantially
from the crisis period on the back of the strong performance of the benchmark KLCI. NSAP emerges as the best portfolio in the post crisis period with mean return of 13.2 percent and standard deviation of 20.9 percent. SAP however, was trailing behind the other portfolios and the benchmark index suggesting that the Shariah-based portfolio’s recovery was relatively slower than the overall market. Once again, the benchmark index provides the major lead to the hypothetical portfolios as shown by the significantly higher correlation level between the hypothetical portfolios and the benchmark index amid the lack of other market boosting news.
Table 6.4: Descriptive Statistics of Performance (All Portfolio, Crisis Period)
Sample period : 1998 to 2003Variable(s) : CPRE02 SAPRE02 NSAPRE02 KLCIRE02Maximum : .76630 .78550 .63930 .61470Minimum : -1.1755 -1.2188 -.87000 -.52460Mean : -.27005 -.29035 -.16857 -.10962Std. Deviation : .66347 .68914 .50916 .40148Skewness : .21899 .22369 .28806 .97406Kurtosis - 3 : -.67579 -.70631 -.58473 -.13763Coef of Variation : 2.4568 2.3735 3.0206 3.6626
Estimated Correlation Matrix of Variables* * * * * * * * * * * * * * * * * * * * * * * * * * * * * * * * * * * * * * * * * * * * * * * * * * * * * * * * * * *
CPRE02 SAPRE02 NSAPRE02 KLCIRE02
CPRE02 1.0000 .99969 .99238 .96099
SAPRE02 .99969 1.0000 .98918 .95860
NSAPRE02 .99238 .98918 1.0000 .97303
KLCIRE02 .96099 .95860 .97303 1.0000* * * * * * * * * * * * * * * * * * * * * * * * * * * * * * * * * * * * * * * * * * * * * * * * * * * * * * * * * * *
1998 1999 2000 2001 2002 2003
-0.5
-1.0
-1.5
0.0
0.5
1.0
Years
CPRE02SAPRE02NSAPRE02KLCIRE02
08sp05_rahimi.indd 132 2010/04/16 15:37:09

133
Islamic Investment vs Unrestricted Investment: An Unlevel Playing Field?
Table 6.5 : Descriptive Statistics of Performance (All Portfolio, Post-Crisis Period)
Table 6.6 to 6.9 present the results of the single index regression model employed to determine the hypothetical portfolios’ beta, �p, as per Equation 5-6. The results indicate that the Shariah-based portfolio in general is the most volatile as compared to its conventional and non Shariah-approved counterparts. Beta for the SAP was higher from the other portfolios for the full period, the crisis period and the post crisis period samples. All results are statistically significant below 5 percent significance level. Although beta for the SAP is lower compared to the NSAP during the market rally period, the result however, is not statistically significant. The R2 value which indicates the appropriateness of the model is high for most regressions particularly in the crisis and post crisis periods, indicating that the performance of the
Sample period : 2004 to 2008Variable(s) : CPRE03 SAPRE03 NSAPRE03 KLCIRE03Maximum : .37470 .37630 .36870 .29830Minimum : -.070400 -.094400 -.067500 .027200Mean : .12656 .12466 .13176 .14934Std. Deviation : .21612 .22048 .20931 .13477Skewness : .24704 .17472 .34861 .25070Kurtosis - 3 : -1.7507 -1.7272 -1.7847 -1.7726Coef of Variation : 1.7077 1.7687 1.5885 .90242
Estimated Correlation Matrix of Variables* * * * * * * * * * * * * * * * * * * * * * * * * * * * * * * * * * * * * * * * * * * * * * * * * * * * * * * * * * *
CPRE03 SAPRE03 NSAPRE03 KLCIRE03
CPRE03 1.0000 .99780 .97173 .99937
SAPRE03 .99780 1.0000 .95393 .99634
NSAPRE03 .97173 .95393 1.0000 .97410
KLCIRE03 .99937 .99634 .97410 1.0000* * * * * * * * * * * * * * * * * * * * * * * * * * * * * * * * * * * * * * * * * * * * * * * * * * * * * * * * * * *
2004 2005 2006 2007 2008-0.1
0.1
0.0
0.2
0.3
0.4
Years
CPRE02SAPRE02NSAPRE02KLCIRE02
08sp05_rahimi.indd 133 2010/04/16 15:37:10

134
Kyoto Bulletin of Islamic Area Studies 3-2 (March 2010)
hypothetical portfolios were very much influenced by the KLCI as the main driving factor that lead the market movement. The DW-statistics indicate that the regressions are not suffered from any autocorrelation. The results confirm the previous analysis that shows SAP possesses higher risk as compared to the NSAP and KLCI.
Table 6.6: Full Period Portfolio Beta Based on Single Index ModelCP = – 0.0423
(t = – 0.4851)R2 = 0.62698
+ 1.5957 KLCI (t = 5.3456)F = 28.5740
+ �
DW = 1.8843SAP = – 0.0548
(t = – 0.6039)R2 = 0.6199
+ 1.6359 KLCI(t = 5.2653)F = 27.7236
+ �
DW = 1.8877NSAP = 0.0169
(t = 0.5128)R2 = 0.9008
+ 1.4003 KLCI(t = 12.4256)F = 154.3944
+ �
DW = 2.0027
Table 6.7: Market Rally Period Portfolio Beta Based on Single Index ModelCP = 0.0676
(t = 0.2737)R2 = 0.2754
+ 1.4094 KLCI(t = 1.5099)F = 2.2798
+ �
DW = 1.7444SAP = 0.0614
(t = 0.2394)R2 = 0.2589
+ 1.4033 KLCI(t = 1.4473)F = 2.0946
+ �
DW = 1.7236NSAP = 0.0675
(t = 1.2038)R2 = 0.9051
+ 1.6014 KLCI(t = 7.5644)F = 57.2207
+ �
DW = 2.5255
Table 6.8: Crisis Period Portfolio Beta Based on Single Index ModelCP = – 0.0959
(t = – 1.0978)R2 = 0.9235
+ 1.5881 KLCI(t = 6.9491)F = 48.2902
+ �
DW = 2.5882 SAP = – 0.1200
(t = – 1.1765)R2 = 0.9189
+ 1.6454 KLCI (t = 6.7331)F = 45.3353
+ �
DW = 2.5996NSAP = – 0.0333
(t = – 0.5951)R2 = 0.9468
+ 1.2340 KLCI(t = 8.4354)F = 71.1564
+ �
DW = 2.2183
08sp05_rahimi.indd 134 2010/04/16 15:37:12

135
Islamic Investment vs Unrestricted Investment: An Unlevel Playing Field?
Table 6.9: Post Crisis Period Portfolio Beta Based on Single Index ModelCP = – 0.1129
(t = – 17.8672)R2 = 0.9987
+ 1.6027 KLCI(t = 48.7277)F = 2374.4
+ �
DW = 1.8559SAP = – 0.1188
(t = – 7.6667)R2 = 0.9927
+ 1.6300 KLCI (t = 20.1934)F = 407.7715
+ �
DW = 2.4909 NSAP = – 0.0942
(t = – 2.4199)R2 = 0.9489
+ 1.5129 KLCI(t = 7.4610)F = 55.6663
+ �
DW = 1.6789
VII. Results Discussion
The statistical data reveals that interest towards Islamic-based unit trust funds in Malaysia has increased tremendously particularly over the last three years with almost all major mutual fund companies have their own Islamic-based funds in respond to the growing demand. Unfortunately however, the funds have not been performing particularly on a long-term basis. This study found that return on Islamic-based portfolio is generally lower than both the conventional and non Shariah-based portfolio. This is in line with the performance of actual Islamic-based funds as reported by various published data. The Shariah-approved portfolio suffered heavy losses during the mid-1990s financial crisis period consistent with its high risk level, and is trailing behind both the non Shariah-approved portfolio and the overall market during the recovery period. One possible reason to explain the Shariah-approved portfolio’s underperformance is that the portfolio is characterised mainly by medium and small capitalised stocks. As these stocks are predominantly at the growth stage of their business life cycle, the potential earnings both in terms of dividend and stock price performance would be rather unstable whilst volatility is usually high for these stocks. Therefore, the portfolio is more vulnerable to the impact of changes in economic cycle and is not supported by large capitalised, higher yielding stocks. This gives evidence linking the firm size effect to the return and risk performance of Islamic-based funds. On the other hand, non Shariah-approved stocks performed significantly better than Shariah-approved stocks judging from the substantial increase in the value of non Shariah-approved investment portfolio. The ability of this portfolio to sustain its performance is attributed mainly to the large capitalised stocks particularly companies that involved in conventional finance, cash-rich gaming and conglomerates with diversified business interest as these securities enjoy more sustainable earnings that provide good cushion to the changing market environment. The investment quality of these stocks also make them attractive particularly for institutional and long-term investors thus ensuring high market demand for these stocks which, in turn, help to limit the downside potential of their price.
08sp05_rahimi.indd 135 2010/04/16 15:37:13

136
Kyoto Bulletin of Islamic Area Studies 3-2 (March 2010)
The fact that demand towards Islamic-based unit trust funds remain strong and fund management companies continues to offer Islamic-based investment products amid the lower return signifies that the real motivation to invest in Islamic-based funds is not entirely driven by monetary gain but also other non-pecuniary motives. This study however, is not intended to investigate the behavioural reason for investing in Islamic-based funds. Nevertheless, this study has proven that religious constraints could affect potential return adversely hence, supporting the cost-of-discipleship hypothesis which argues that investing with religious or ethical consciousness does entail cost. In portfolio construction perspective, the Shariah constraints have effectively restricted Islamic-based funds from investing in companies involved in conventional finance, gaming, liquor, tobacco and diversified conglomerate despite they are large capitalised, higher yielding stocks. Therefore, although the number of Shariah-approved stocks far exceeded the number of non Shariah-approved stocks, the numerical advantage does not necessarily benefiting the Shariah-based portfolio amid the lack of quality investment-grade securities. In view of this, it is rather difficult for Islamic-based portfolio to construct an optimal portfolio. Another significant disadvantage is that Islamic-based funds inadvertently incur additional cost in having to engage Shariah scholars to provide them with Shariah advisory services, thus increasing the administrative costs of Islamic-based funds.
The strong mean reversion trend over the long-term period as shown by the chart of the portfolio return indicate that the best trading strategy for Malaysian-based unit trust funds is perhaps the “passive” or the simple “buy-and-hold” strategy. This is particularly due to the higher cost incurred if fund managers embarked into active trading strategy by frequently buying or selling securities in their portfolio. This observation is supported by an independent test which reveals that frequent rebalancing of investment portfolio does not necessarily lead to superior return. The result which is reproduced in Table 7.1 below implies that annual rebalancing of portfolio produces higher profit and hence, topped the rank. Indeed, the performance of an actual unit trust funds subject to various factor ranging from portfolio components, the fund managers’ skills in asset allocation and securities selection, the market timing as well as the overall economic and market condition.
Table 7.1: Performance Ranking by Rebalancing PeriodRebalancing Period Average RankAnnual 1.0Quartery 2.5Sem-annual 2.7Weekly 4.0Monthly 4.8
Source: Fundsupermart, 3QTR, 2009; pg. 100-103.
08sp05_rahimi.indd 136 2010/04/16 15:37:14

137
Islamic Investment vs Unrestricted Investment: An Unlevel Playing Field?
VIII. Conclusion
Although statistical results show that the return of Islamic-based portfolio is not significantly different from conventional portfolio, there are strong indications that its risk is relatively higher and its return is somewhat affected by investment quality of its component stocks due to high proportion of smaller size stocks. Non Shariah-approved portfolio is poised to outperform Islamic-based funds since the fund is able to invest in large capitalised, higher yielding companies particularly those involved in conventional finance, gaming, tobacco and diversified conglomerate sectors. Instead, Islamic-based funds would have to content with limited selection of high investment grade and are flush with smaller capitalised stocks that have limited earnings potential and high market price volatility. Therefore, it can be argued that Shariah ruling on securities selection has restricted the asset selection universe of Islamic-based portfolio thus, affecting its future profit potential. This study provides evidence supporting the cost-of-discipleship hypothesis which implies that investing with religious or ethical consciousness does entail cost. Although there are more Shariah-approved stocks available, the limited number of high income, large capitalised stocks and the exclusion of certain profitable but prohibited industries has restrict the future income potential for Islamic-based portfolio. The growing demand on Islamic-based funds despite the lower earnings potential signifies that the reason for investing in Islamic-based unit trust is not entirely motivated by monetary gains but also some other non-pecuniary motives. In this perspective, prospect for Islamic funds is poised to remain bright in view of its relatively small size as compared to conventional funds, and its substantial growth supported by increasing public demand and the growing number of Islamic-based unit trust products.
As a way forward, an in-depth study on the operations of fund management companies and fund managers offering Islamic-based unit trusts is recommended in order to ensure the integrity and purity of the Islamic fund management industry. This is in view that the current practice of Islamic fund management in Malaysia is arguably confined within regulatory requirements pertaining to asset selection and operations of Shariah-compliant funds. Most of fund management companies in Malaysia are offering both conventional and Shariah-compliant funds and these funds are managed and marketed by similar personnel who may have very little knowledge about the Shariah itself. Therefore, there is considerable lack of appreciation towards the Islamic philosophical needs such as the real intention of the fund management companies to offer Islamic funds, the underlying motives and objectives of the funds in relation to enhancing the well being of the society, the Islamic contractual requirements in designing and drafting the funds as well as the ethics involved in marketing and promotion of the funds.
Also, in the interest of expanding the knowledge on Islamic finance as well as supporting
08sp05_rahimi.indd 137 2010/04/16 15:37:15

138
Kyoto Bulletin of Islamic Area Studies 3-2 (March 2010)
the growing industry, it is recommended that an alternative portfolio valuation technique specifically for measuring the performance of Islamic and ethical funds be developed. Past studies analysing the performance of Islamic-based funds have conveniently assumed that such funds are similar with conventional funds. Consequently, past studies have relied solely on return performance when analysing Islamic-based funds. This approach has not given proper recognition to the fact that Islamic-based funds is fundamentally different from conventional funds considering the ultimate objectives of Islamic-based funds is not merely to achieve the highest profit but also to attain non-pecuniary motives. In addition, apart from Islamic-based funds have to forego certain stocks or industries due to Shariah constraints regardless of their profit potential, Islamic-based funds also incurred additional administrative costs as it needs to engage qualified Shariah scholars as advisors. The higher operating cost signifies that Islamic-based funds are bound to incur relatively lower profit as compared to conventional fund and hence, lower NAV per unit. Therefore, there could be serious bias against Islamic-based fund when a study is based on the existing funds available in the market. While the existing portfolio valuation models is suitable to measure the performance of conventional funds, the measurement models may not be appropriate to be applied on Islamic-based in view of the inability of the conventional portfolio valuation models to incorporate non-monetary motives into its variables. Hence, this provides a justification for the need to develop alternative portfolio valuation model specifically for measuring the performance of Islamic-based funds.
Bibliography
Abramson, L. and Chung, D. (2000). “Socially Responsible Investing: Viable for Value Investors?”, Journal of Investing, 9(3), pp. 73–81.
Anand, P. and Cowton, C. J. (1993). “The Ethical Investor: Exploring Dimensions of Investment Behaviour”, Journal of Economic Psychology, 14, pp. 377–385.
Arnott, R. D. (2003). “Ethics, Earnings and Equity Valuation”, The Journal of Portfolio Management, Spring, pp. 8–16.
Ayub, M. (2007). Understanding Islamic Finance. England: John Wiley & Sons Ltd.Bauer, R., Koedijk, K. and Otten, R. (2005). “International Evidence on Ethical Mutual Fund
Performance and Investment Style”, Journal of Banking & Finance, 29, pp. 1751–1767.Beal, D. J., Goyen, M. and Phillips, P. (2005). “Why Do We Invest Ethically?”, The Journal
of Investing, Fall, pp. 66–77.Bello, Z. Y. (2005). “Socially Responsible Investing and Portfolio Diversification”, The
Journal of Financial Research, 28(1), pp. 41–57.
08sp05_rahimi.indd 138 2010/04/16 15:37:15

139
Islamic Investment vs Unrestricted Investment: An Unlevel Playing Field?
Boasson, E., Boasson, V. and Cheng, J. (2006). “Investment Principles and Strategies of Faith-Based Funds”, Managerial Finance, 32(10), pp. 837–845.
Bollen, N. P. B. and Cohen, M. A. (2004). Mutual Fund Attributes and Investor Behaviour. Working Paper, Vanderbilt University.
Chuan, T. H. (1995). “The Investment Performance of Unit Trust Funds in Malaysia”, Capital Markets Review, 3(2), pp. 21–50.
Cowell, F. (2002). “Simulation as a Means of Portfolio Performance Evaluation”, in Knight, J. and Satchell, S. (eds.), Performance Measurement in Finance: Firms, Funds and Managers. Oxford: Elsevier Science Ltd.
Cowton, C. J. (2004). “Managing Financial Performance at an Ethical Investment Fund”, Accounting, Auditing & Accountability Journal, 17(2), pp. 249–275.
Cullis, J. G., Lewis, A. and Winnett, A. (1992). “Paying to be Good? UK Ethical Investments”, KYKLOS, 45, pp. 3–24.
D’Antonio, L., Johnsen, T. and Hutton, B. (2000). “Socially Responsible Investing and Asset Allocation”, Journal of Investing, 9(3), pp. 65–72.
Davis, R. (1996). “Ethics – Marketing Ploy, or Just the Best Business Proposition?”, Managing Service Quality, 6(2), pp. 6–10.
Draper, P. and Paudyal, K. (1997). “Microstructure and Seasonality in the UK Equity Market”, Journal of Business Finance and Accounting, 24(7 & 8), pp. 1177–1204.
Elgari, M. A. (2002). “Islamic Equity Investment”, in Simon Archer and Rifaat Ahmed Abdel Karim (eds.), Islamic Finance: Innovation and Growth. London: Euromoney Books.
Fauziah, M. T. and Mansor, I. (2007). “Malaysian Unit Trust Aggregate Performance”, Managerial Finance, 33(2), pp. 102–121.
Fikriyah, A., Taufiq, H. and Shamser, M. (2007). “Investigation of Performance of Malaysian Islamic Unit Trust Funds: Comparison with Conventional Unit Trust Funds”, Managerial Finance, 33(2), pp. 142–153.
Ghoul, W. and Karam, P. (2007). “MRI and SRI Mutual Funds: A Comparison of Christian, Islamic (Morally Responsible Investing), and Socially Responsible Investing (SRI) Mutual Funds”, Journal of Investing, 16(2), pp. 96–102.
Gregory, A., Matatko, J. and Luther, R. (1997). “Ethical Unit Trust Financial Performance: Small Company Effects and Fund Size Effects”, Journal of Business Finance & Accounting, 24(5), pp. 705–724.
Hardie, A. R. and Rabooy, M. (1991). “Risk, Piety and the Islamic Investor”, British Journal of Middle Eastern Studies, 18(1), pp. 52–66.
Haigh, M. (2006). “Camouflage Play: Making Moral Claims in Managed Investments”, Accounting Forum, 30, pp. 267–283.
08sp05_rahimi.indd 139 2010/04/16 15:37:16

140
Kyoto Bulletin of Islamic Area Studies 3-2 (March 2010)
Huson Joher, A. A. (2007). “Malaysia Unit Trust Performance: Comparative Analysis of Single and Multi Index Model”, European Journal of Economics, Finance and Administrative Sciences, 7, pp. 22–31.
Hussein, K. and Omran, M. (2005). “Ethical Investment Revisited: Evidence From Dow Jones Islamic Indexes”, The Journal of Investing, Fall, pp. 105–124.
IFR (Islamic Financial Review), 2007/08, 2008/09, 2009/10. Euromoney.Kreander, N. and McPhail, K. (2004). “God’s Fund Managers: A Critical Study of Stock
Market Investment Practices of the Church of England and UK Methodists”, Accounting, Auditing & Accountability Journal, 17(3), pp. 408–441.
Kreander, N., Gray, R. H., Power, D. M. and Sinclair, C. D. (2005). “Evaluating the Performance of Ethical and Non-Ethical Funds: A Matched Pair Analysis”, Journal of Business Finance & Accounting, 32(7) & (8), pp. 1465–1493.
Kurtz, L. (2005). “Answers to Four Questions”, The Journal of Investing, Fall, pp. 125–139.Leong, C. T. and Lian, K. K. (1998). “Performance of Unit Trusts in an Emerging Market: A
Case Study of Malaysia”, Capital Markets Review, 6(1&2), pp. 1–17.Lewis, A. and Cullis, J. (1990). “Ethical Investments: Preference and Morality”, The Journal
of Behavioral Economics, 19(4), pp. 395–411.Low, S. W. and Noor Azlan, G. (2007). “The Price Linkages between Malaysian Unit Trust
Funds and the Stock Market: Short Run and Long Run Interrelationships”, Managerial Finance, 33(2), pp. 89–101.
Luther, R. G. and Matatko, J. (1994). “The Performance of Ethical Unit Trusts: Choosing an Appropriate Benchmark”, British Accounting Review, 26, pp. 77–89.
Luxton, P. (1992). “Ethical Investment in Hard Times”, The Modern Law Review, 55(4), pp. 587–593.
Lydenberg, S. (2007). “Universal Investors and Socially Responsible Investors: A Tale of Emerging Affinities”, Corporate Governance, 15(3), pp. 467–477.
Mackenzie, C. (1998). “The Choice of Criteria in Ethical Investment”, Business Ethics: A European Review, 7(2), pp. 81–86.
Mackenzie, C. and Lewis, A. (1999). “Morals and Markets: The Case of Ethical Investing”, Business Ethics Quarterly, 9(3), pp. 439–452.
Mallin, C. A., Saadouni, B. and Briston, R. J. (1995). “The Financial Performance of Ethical Investment Funds”, Journal of Business Finance and Accounting, 22(4), pp. 483–496.
Metwally, M. M. (1997). “Economic Consequences of Applying Islamic Principles in Muslim Societies”, International Journal of Social Economics, 24(7–9), pp. 941(17).
Mian, K. M. A. (2008). “Shariah Screening and Islamic Equity Indexes”, in Ali, R. (ed.), Islamic Finance: A Practical Guide. United Kingdom: Globe Business Publishing Ltd.
Mohd Azlan S. Z., Zulkefly A. K. and Zurina K. (2004). “The Performance of Islamic Unit
08sp05_rahimi.indd 140 2010/04/16 15:37:17

141
Islamic Investment vs Unrestricted Investment: An Unlevel Playing Field?
Trust Funds in Malaysia: Does Persistence Exists?”, The Journal of Muamalat and Islamic Finance Research, 1(1), pp. 39–64.
Mohd Hasimi Y. and Noor Azuddin Y. (2002). “Portfolio Formation Using Islamic-Approved Stocks in Malaysia”, Capital Markets Review, 10(1), pp. 67–86.
Mueller, S. A. (1994). “Investment Returns on an Islamic-Principled Mutual Fund in the United States: Further Evidence for the Cost-of-Discipleship Hypothesis”, Sociology of Religion, 55(1), pp. 85–87.
Nik Maheran N. M. and Masliza M. (2008). “Islamic Equity Mutual Fund Performance in Malaysia: Risk and Return Analysis”, Proceedings of the Malaysian Finance Association (MFA) Conference 2008.
O’Rourke, A. (2003). “The Message and Methods of Ethical Investment”, Journal of Cleaner Production, 11, pp. 683–693.
Ormerod, R. J. (1999). “Ethical Dilemmas”, The Journal of the Operational Research Society, 50(5), pp. 546–548.
Porter, B. E. and Steen, T. P. (2006). “Investing in Stocks: Three Models of Faith Integration”, Managerial Finance, 32(10), pp. 812–821.
Sauer, D. A. (1997). “The Impact of Social-Responsibility Screens on Investment Performance: Evidence from the Domini 400 Social Index and Domini Equity Mutual Fund”, Review of Financial Economics, 6(2), pp. 137(13).
Schlegelmilch, B. B. (1997). “The Relative Importance of Ethical and Environmental Screening: Implications for the Marketing of Ethical Investment Funds”, International Journal of Bank Marketing, 15(2), pp. 48–53.
Schröder, M. (2007). “Is There a Difference? The Performance Characteristics of SRI Equity Indices”, Journal of Business Finance & Accounting, 34(1) & (2), pp. 331–348.
Schwab, B. (1996). “A Note on Ethics and Strategy: Do Good Ethics Always Make for Good Business?”, Strategic Management Journal, 17(6), pp. 499–500.
Securities Commission (2006). Quarterly Bulletin of Malaysian Islamic Capital Market. Vol. 1. No. 1. May 2006. Malaysia: Kuala Lumpur.
Shamsher M. and Annuar M. N. (1995). “The Performance of Unit Trusts in Malaysia: Some Evidence”, Capital Markets Review, 3(2), pp. 51–69.
Sparkes, R. (1995). The Ethical Investor. London: HarperCollinsPublishers.
――――. (2001). “Ethical Investment: Whose Ethics, Which Investment?”, Business Ethics: A European Review, 10(3), pp. 194–205.
Statman, M. (2000). “Socially Responsible Mutual Funds”, Financial Analysis Journal, 56(3), pp. 30–39.
――――. (2005). “The Religions of Social Responsibility”, The Journal of Investing, Fall, pp. 14–22.
08sp05_rahimi.indd 141 2010/04/16 15:37:18

142
Kyoto Bulletin of Islamic Area Studies 3-2 (March 2010)
Taylor, R. (2001). “Putting Ethics Into Investment”, Business Ethics: A European Review, 10(1), pp. 53–60.
Webley, P., Lewis, A. and Mackenzie, C. (2001). “Commitment Among Ethical Investors: An Experimental Approach”, Journal of Economic Psychology, 22, pp. 27–42.
Wilson, R. (1997). “Islamic Finance and Ethical Investment”, International Journal of Social Economics, 24(11), pp. 1325–1342.
Zaher, T. S. and Hassan, M. K. (2001). “A Comparative Literature Survey of Islamic Finance and Banking”, Financial Markets, Institutions & Instruments, 10(4), pp. 155–199.
08sp05_rahimi.indd 142 2010/04/16 15:37:19