Embed Size (px)
Citation preview

1
ISAPS International Survey on Aesthetic/Cosmetic Procedures Performed in 2015 Methodology: Survey participants completed a questionnaire that primarily focused on the number of specific surgical and non-surgical procedures performed in 2015, along with some ancillary questions related to medical tourism. The International Society of Aesthetic Plastic Surgery (ISAPS) issued an invitation to participate in the study to approximately 35,000 Plastic Surgeons whose contact information is housed in its proprietary database. In addition, a request was made that all National Societies encourage their members/constituents to take part in the survey. Data from a total of 1,398 plastic surgeons were compiled for this survey. Final figures have been projected to reflect international statistics and are exclusively based on the estimated number of Plastic Surgeons in each country and the respondent sample. This International Survey is focused on physicians who are board certified (or national equivalent) Plastic Surgeons. To aid in tallying the world-wide estimate of plastic surgeons, representatives from National Societies provided recent counts for over 96% of the 40,000 total estimated plastic surgeons. For those cases in which the National Society did not provide its country’s total, a simple regression equation was used to estimate the number of plastic surgeons in the country based on its population size and Gross Domestic Product. Studies such as this must often address outlying responses. Though the outlying values may be legitimate, their presence can distort the averages, which provide the basis of the estimated projections. Significant outliers in this survey were adjusted in order to protect the reasonableness of the extrapolated values. Additional standard data editing procedures were followed to ensure responses met survey guidelines. All reported data values have been analyzed for statistical reasonableness. Country-specific data are only shown for those countries that provided a sufficient survey response for the figures to be considered valid. No adjustments other than standard data editing procedures were applied to country-specific results. The International Survey on Aesthetic/Cosmetic Procedures Performed in 2015 was compiled, tabulated, and analyzed by Industry Insights, Inc. (www.industryinsights.com), an independent research firm based in Columbus, OH. The survey leader was Scott Hackworth, a CPA and data scientist who along with his firm has conducted various forms of research on trends in Aesthetic Plastic Surgery for nearly 20 years.

2
International Study on Aesthetic/Cosmetic Procedures Performed in 2015
World-Wide Totals USA Brazil
South Korea India Mexico Germany Colombia France Italy
TOTAL PROCEDURES
Surgical Procedures
Face & Head
Brow Lift 243,140 28,535 31,405 16,437 5,827 14,214 5,714 7,315 4,446 3,584 Ear Surgery 252,718 16,250 42,240 6,472 18,060 10,323 10,052 7,192 6,375 4,544 Eyelid Surgery 1,264,702 141,505 143,165 101,985 29,434 48,329 54,907 27,959 35,473 19,960 Facelift 411,529 75,920 48,840 28,116 7,783 16,585 10,801 8,503 12,474 4,544 Facial Bone Contouring 108,250 11,115 7,480 8,143 4,666 11,269 2,092 4,921 323 2,200 Fat Grafting-face 591,894 49,660 51,645 63,326 27,649 27,652 21,877 15,827 11,847 11,216 Neck Lift 232,606 32,695 31,405 7,093 7,826 16,151 7,498 8,294 7,724 2,984 Hair Transplantation 134,019 7,605 9,075 7,436 39,625 992 1,167 3,088 2,651 984 Rhinoplasty 730,287 49,855 65,120 72,562 44,290 39,897 12,717 24,852 20,055 9,984 Total Face & Head Procedures 3,969,147 413,140 430,375 311,571 185,158 185,411 126,824 107,949 101,365 60,000 Breast
Breast Augmentation— saline 64,674 36,140 275 3,365 366 0 385 171 447 0 Breast Augmentation—silicone 1,311,129 255,060 158,950 44,039 23,865 57,552 46,242 44,888 37,354 21,744 Breast Augmentation—fat
transfer 113,189 18,785 7,205 3,150 5,375 4,061 6,749 1,644 4,123 1,656 Breast Implant Removal 153,476 37,115 12,705 6,300 1,742 5,952 5,967 6,090 6,004 2,744 Breast Lift 512,248 106,535 80,520 8,101 9,052 21,902 15,271 16,321 14,421 7,160 Breast Reduction 423,093 67,080 72,600 5,165 16,491 14,198 17,121 11,381 18,953 3,672 Gynecomastia 212,328 25,545 26,400 4,757 25,091 6,960 9,876 4,142 4,351 4,216 Total Breast Procedures 2,790,138 546,260 358,655 74,876 81,980 110,624 101,611 84,636 85,652 41,192 Body & Extremities
Abdominoplasty 758,590 137,605 131,120 7,993 32,401 39,634 17,682 29,317 22,924 5,384 Buttock Augmentation—implants
only 30,916 1,560 8,140 514 710 2,945 385 2,423 124 344 Buttock Augmentation—fat
transfer 258,107 21,255 55,605 2,572 4,752 29,528 3,336 23,038 3,021 2,344 Buttock Lift 30,905 4,095 4,125 471 1,935 2,945 848 561 646 360 Liposuction 1,394,588 240,565 182,765 39,753 88,193 70,773 40,065 51,623 29,450 20,784 Lower Body Lift 56,169 6,955 7,700 429 3,677 3,286 2,092 2,632 2,850 728 Penile Enlargement 11,703 325 440 1,222 1,484 78 319 665 228 440 Thigh Lift 70,672 8,775 10,505 86 2,967 3,317 3,160 2,613 3,876 1,328

3
International Study on Aesthetic/Cosmetic Procedures Performed in 2015
World-Wide Totals USA Brazil
South Korea India Mexico Germany Colombia France Italy
Upper Arm Lift 102,588 17,810 12,595 707 5,074 5,069 4,437 2,546 5,330 2,160 Upper Body Lift 22,634 2,600 2,805 0 1,333 1,674 1,563 1,017 124 616 Labiaplasty 95,010 10,855 12,870 2,186 3,935 3,441 5,296 3,259 3,097 1,872 Vaginal Rejuvenation 50,086 2,535 6,600 2,764 6,859 2,821 639 2,508 523 1,312 Total Body & Extremities
Procedures 2,881,968 454,935 435,270 58,697 153,317 165,509 79,823 122,199 72,191 37,672 Total Surgical Procedures 9,641,253 1,414,335 1,224,300 445,144 420,454 461,544 308,258 314,783 259,208 138,864 Non-Surgical Procedures Injectables Botulinum Toxin 4,627,752 1,141,595 359,865 279,019 85,334 161,355 148,459 76,000 91,751 110,400 Calcium Hydroxylapatite 173,492 59,930 13,805 4,415 215 7,208 4,833 580 3,525 5,344 Hyaluronic Acid 2,865,086 580,320 195,030 198,378 60,050 86,320 129,852 41,002 92,103 109,288 Poly-L-Lactic Acid 64,134 24,050 9,350 1,672 151 93 1,277 0 979 2,272 Total Injectables 7,730,464 1,805,895 578,050 483,482 145,749 254,975 284,421 117,582 188,357 227,304 Facial Rejuvenation Chemical Peel 489,344 101,010 86,295 7,779 58,093 8,339 2,092 5,852 5,026 12,112 Full Field Ablative 169,098 30,290 30,800 4,329 11,610 6,247 1,277 3,629 323 5,616 Micro-Ablative Resurfacing 217,593 45,175 25,190 22,009 16,942 5,549 0 4,142 105 2,656 Dermabrasion 51,882 8,385 2,365 1,436 3,225 2,000 4,085 2,119 779 712 Microdermabrasion 365,587 111,150 33,330 16,801 19,135 19,329 209 14,317 0 1,744 Nonsurgical Skin Tightening 340,609 56,550 31,240 36,088 11,202 28,350 6,000 6,973 6,451 3,784 Photo Rejuvenation 568,672 122,850 78,155 48,860 6,816 24,521 0 13,965 6,099 2,688 Polymethylmethacrylate 36,017 7,605 10,890 2,722 0 264 0 0 0 0 Total Injectables 2,238,803 483,015 298,265 140,024 127,022 94,597 13,663 50,996 18,782 29,312 Other Cellulite Treatment 283,598 12,480 67,155 10,136 16,534 33,480 1,453 5,396 6,251 5,240 Hair Removal 1,099,053 174,590 106,205 45,217 154,650 30,008 4,118 30,077 7,201 4,928 Nonsurgical Fat Reduction 425,315 119,470 17,655 19,330 32,293 17,066 4,151 23,646 8,921 4,712 Tattoo Removal 128,218 12,740 11,770 12,772 24,209 6,696 352 2,698 0 1,512 Treatment of Leg Veins 73,190 7,800 14,245 43 9,052 2,682 66 1,492 0 1,088 Sclerotherapy 76,778 12,285 6,600 86 5,526 6,867 925 1,967 0 5,800 Total Other 2,086,152 339,365 223,630 87,584 242,262 96,798 11,065 65,275 22,373 23,280 Total Non-Surgical Procedures 12,055,418 2,628,275 1,099,945 711,090 515,033 446,369 309,150 233,852 229,511 279,896 Total Procedures 21,696,671 4,042,610 2,324,245 1,156,234 935,487 907,913 617,408 548,635 488,718 418,760

4
Total Face & Head Procedures Rank * Country: % of World-Wide Total
1 Brazil 430,375 10.8% 2 USA 413,140 10.4% 3 South Korea 311,571 7.8% 4 Mexico 185,411 4.7% 5 India 185,158 4.7% 6 Germany 126,824 3.2% 7 Colombia 107,949 2.7% 8 France 101,365 2.6% 9 Italy 60,000 1.5%
Total Breast Procedures
Rank * Country: % of World-Wide
Total
1 USA 546,260 19.6% 2 Brazil 358,655 12.9% 3 Mexico 110,624 4.0% 4 Germany 101,611 3.6% 5 France 85,652 3.1% 6 Colombia 84,636 3.0% 7 India 81,980 2.9% 8 South Korea 74,876 2.7% 9 Italy 41,192 1.5%
Total Body & Extremities
Rank * Country: % of World-Wide
Total
1 USA 454,935 15.8% 2 Brazil 435,270 15.1% 3 Mexico 165,509 5.7% 4 India 153,317 5.3% 5 Colombia 122,199 4.2% 6 Germany 79,823 2.8% 7 France 72,191 2.5% 8 South Korea 58,697 2.0% 9 Italy 37,672 1.3%
Total Surgical Procedures
Rank * Country: % of World-Wide
Total
1 USA 1,414,335 14.7% 2 Brazil 1,224,300 12.7% 3 Mexico 461,544 4.8% 4 South Korea 445,144 4.6% 5 India 420,454 4.4% 6 Colombia 314,783 3.3% 7 Germany 308,258 3.2% 8 France 259,208 2.7% 9 Italy 138,864 1.4%
* Rankings are based solely on those countries from which a sufficient survey response was received and data were considered to be representative.

5
Total Injectibles Rank * Country: % of World-Wide Total
1 USA 1,805,895 23.4% 2 Brazil 578,050 7.5% 3 South Korea 483,482 6.3% 4 Germany 284,421 3.7% 5 Mexico 254,975 3.3% 6 Italy 227,304 2.9% 7 France 188,357 2.4% 8 India 145,749 1.9% 9 Colombia 117,582 1.5%
Total Facial Rejuvenation Rank * Country: % of World-Wide Total
1 USA 483,015 21.6% 2 Brazil 298,265 13.3% 3 South Korea 140,024 6.3% 4 India 127,022 5.7% 5 Mexico 94,597 4.2% 6 Colombia 50,996 2.3% 7 Italy 29,312 1.3% 8 France 18,782 0.8% 9 Germany 13,663 0.6%
Total Non-Surgical Procedures Rank * Country: % of World-Wide Total
1 USA 2,628,275 21.8% 2 Brazil 1,099,945 9.1% 3 South Korea 711,090 5.9% 4 India 515,033 4.3% 5 Mexico 446,369 3.7% 6 Germany 309,150 2.6% 7 Italy 279,896 2.3% 8 Colombia 233,852 1.9% 9 France 229,511 1.9%
Total Other Non-Surgical Procedures Rank * Country: % of World-Wide Total
1 USA 339,365 16.3% 2 India 242,262 11.6% 3 Brazil 223,630 10.7% 4 Mexico 96,798 4.6% 5 South Korea 87,584 4.2% 6 Colombia 65,275 3.1% 7 Italy 23,280 1.1% 8 France 22,373 1.1% 9 Germany 11,065 0.5%

6
Total Procedures Rank * Country: % of World-Wide Total
1 USA 4,042,610 18.6% 2 Brazil 2,324,245 10.7% 3 South Korea 1,156,234 5.3% 4 India 935,487 4.3% 5 Mexico 907,913 4.2% 6 Germany 617,408 2.8% 7 Colombia 548,635 2.5% 8 France 488,718 2.3% 9 Italy 418,760 1.9%
* Rankings are based solely on those countries from which a sufficient survey response was received and data were considered to be representative.

7
Countries Ranked by Estimated Number of Plastic Surgeons (Top 30) Rank Country Plastic Surgeons Percent of Total Plastic Surgeons
1 USA 6,500 16.0%
2 Brazil 5,500 13.5%
3 China 2,800 6.9%
4 Japan 2,225 5.5%
5 South Korea 2,150 5.3%
6 India 2,150 5.3%
7 Russia 2,000 4.9%
8 Mexico 1,550 3.8%
9 Turkey 1,200 2.9%
10 Germany 1,100 2.7%
11 Colombia 950 2.3%
12 France 950 2.3%
13 Spain 945 2.3%
14 United Kingdom 865 2.1%
15 Italy 800 2.0%
16 Chinese Taipei 600 1.5%
17 Canada 575 1.4%
18 Venezuela 500 1.2%
19 Egypt 400 1.0%
20 Peru 380 0.9%
21 Argentina 350 0.9%
22 Australia 320 0.8%
23 Thailand 320 0.8%
24 Greece 275 0.7%
25 Netherlands 270 0.7%
26 South Africa 265 0.7%
27 Belgium 265 0.7%
28 Iran 240 0.6%
29 Saudi Arabia 230 0.6%
30 Poland 200 0.5%
8
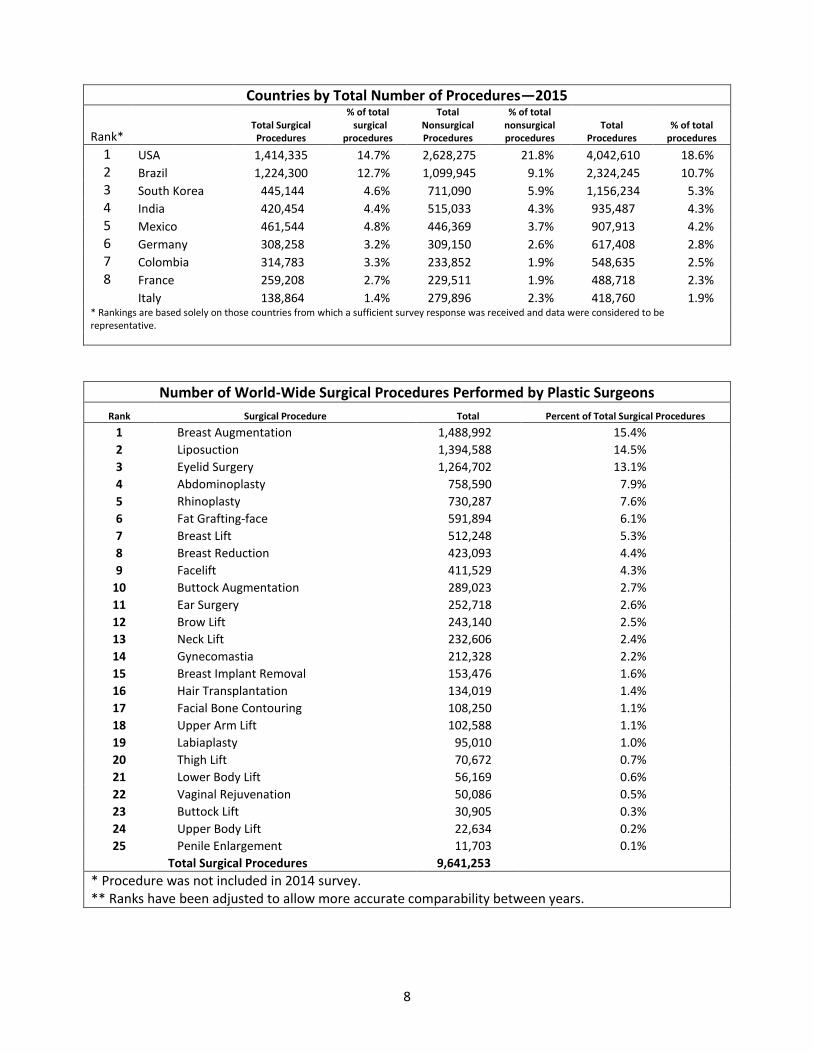
Countries by Total Number of Procedures—2015
Rank* Total Surgical
Procedures
% of total surgical
procedures
Total Nonsurgical Procedures
% of total nonsurgical procedures
Total Procedures
% of total procedures
1 USA 1,414,335 14.7% 2,628,275 21.8% 4,042,610 18.6%
2 Brazil 1,224,300 12.7% 1,099,945 9.1% 2,324,245 10.7%
3 South Korea 445,144 4.6% 711,090 5.9% 1,156,234 5.3%
4 India 420,454 4.4% 515,033 4.3% 935,487 4.3%
5 Mexico 461,544 4.8% 446,369 3.7% 907,913 4.2%
6 Germany 308,258 3.2% 309,150 2.6% 617,408 2.8%
7 Colombia 314,783 3.3% 233,852 1.9% 548,635 2.5%
8 France 259,208 2.7% 229,511 1.9% 488,718 2.3%
Italy 138,864 1.4% 279,896 2.3% 418,760 1.9% * Rankings are based solely on those countries from which a sufficient survey response was received and data were considered to be representative.
Number of World-Wide Surgical Procedures Performed by Plastic Surgeons
Rank Surgical Procedure Total Percent of Total Surgical Procedures
1 Breast Augmentation 1,488,992 15.4%
2 Liposuction 1,394,588 14.5%
3 Eyelid Surgery 1,264,702 13.1%
4 Abdominoplasty 758,590 7.9%
5 Rhinoplasty 730,287 7.6%
6 Fat Grafting-face 591,894 6.1%
7 Breast Lift 512,248 5.3%
8 Breast Reduction 423,093 4.4%
9 Facelift 411,529 4.3%
10 Buttock Augmentation 289,023 2.7%
11 Ear Surgery 252,718 2.6%
12 Brow Lift 243,140 2.5%
13 Neck Lift 232,606 2.4%
14 Gynecomastia 212,328 2.2%
15 Breast Implant Removal 153,476 1.6%
16 Hair Transplantation 134,019 1.4%
17 Facial Bone Contouring 108,250 1.1%
18 Upper Arm Lift 102,588 1.1%
19 Labiaplasty 95,010 1.0%
20 Thigh Lift 70,672 0.7%
21 Lower Body Lift 56,169 0.6%
22 Vaginal Rejuvenation 50,086 0.5%
23 Buttock Lift 30,905 0.3%
24 Upper Body Lift 22,634 0.2%
25 Penile Enlargement 11,703 0.1%
Total Surgical Procedures 9,641,253
* Procedure was not included in 2014 survey. ** Ranks have been adjusted to allow more accurate comparability between years.

9
Number of World-Wide Nonsurgical Procedures Performed by Plastic Surgeons
Rank Nonsurgical Procedure Total
Percent of Total Nonsurgical Procedures
1 Botulinum Toxin 4,627,752 38.4%
2 Hyaluronic Acid 2,865,086 23.8%
3 Hair Removal 1,099,053 9.1%
4 Photo Rejuvenation 568,672 4.7%
5 Chemical Peel 489,344 4.1%
6 Nonsurgical Fat Reduction 425,315 3.5%
7 Microdermabrasion 365,587 3.0%
8 Nonsurgical Skin Tightening 340,609 2.8%
9 Cellulite Treatment 283,598 2.4%
10 Micro-Ablative Resurfacing 217,593 1.8%
11 Calcium Hydroxylapatite 173,492 1.4%
12 Full Field Ablative 169,098 1.4%
13 Tattoo Removal 128,218 1.1%
14 Sclerotherapy 76,778 0.6%
15 Treatment of Leg Veins 73,190 0.6%
16 Poly-L-Lactic Acid 64,134 0.5%
17 Dermabrasion 51,882 0.4%
18 Polymethylmethacrylate 36,017 0.3%
Total Nonsurgical Procedures 10,591,506

10
Countries Performing Most Popular Surgical Procedures Rank * Country Number of Procedures Percentage of Total
Breast Augmentation 1 USA 309,985 20.8% 2 Brazil 166,430 11.2% 3 Mexico 61,613 4.1% 4 Germany 53,376 3.6% 5 South Korea 50,553 3.4% 6 Colombia 46,702 3.1% 7 France 41,924 2.8% 8 India 29,606 2.0% 9 Italy 23,400 1.6%
Liposuction 1 USA 240,565 17.2% 2 Brazil 182,765 13.1% 3 India 88,193 6.3% 4 Mexico 70,773 5.1% 5 Colombia 51,623 3.7% 6 Germany 40,065 2.9% 7 South Korea 39,753 2.9% 8 France 29,450 2.1% 9 Italy 20,784 1.5%
Eyelid Surgery 1 Brazil 143,165 11.3% 2 USA 141,505 11.2% 3 South Korea 101,985 8.1% 4 Germany 54,907 4.3% 5 Mexico 48,329 3.8% 6 France 35,473 2.8% 7 India 29,434 2.3% 8 Colombia 27,959 2.2% 9 Italy 19,960 1.6%
Abdominoplasty 1 USA 137,605 18.1% 2 Brazil 131,120 17.3% 3 Mexico 39,634 5.2% 4 India 32,401 4.3% 5 Colombia 29,317 3.9% 6 France 22,924 3.0% 7 Germany 17,682 2.3% 8 South Korea 7,993 1.1% 9 Italy 5,384 0.7%
Rhinoplasty 1 South Korea 72,562 9.9% 2 Brazil 65,120 8.9% 3 USA 49,855 6.8% 4 India 44,290 6.1% 5 Mexico 39,897 5.5% 6 Colombia 24,852 3.4% 7 France 20,055 2.7% 8 Germany 12,717 1.7% 9 Italy 9,984 1.4%

11
2015 Gender Distribution for Cosmetic Procedures
The following list includes both surgical and nonsurgical cosmetic procedures.
Procedure
FEMALE (Number of Procedures)
Percent of Total
Rank within Category (Surgical/
Nonsurgical)
MALE (Number of Procedures)
Percent of Total
Rank within Category (Surgical/
Nonsurgical)
Surgical Procedures:
Abdominoplasty 703,361 92.7% 4 55,229 7.3% 9
Breast Augmentation— saline 64,483 99.7% 20 191 0.3% 24
Breast Augmentation—fat transfer 112,222 99.1% 15 967 0.9% 22
Breast Augmentation—silicone 1,299,793 99.1% 1 11,336 0.9% 15
Breast Implant Removal 151,815 98.9% 14 1,661 1.1% 21
Breast Lift 512,248 100.0% 6 dna dna dna
Breast Reduction 423,093 100.0% 8 dna dna dna
Brow Lift 204,622 84.2% 11 38,518 15.8% 11
Buttock Augmentation—fat transfer 246,695 95.6% 10 11,412 4.4% 14
Buttock Augmentation-implants only 30,474 98.6% 23 442 1.4% 23
Buttock Lift 28,022 90.7% 24 2,883 9.3% 20
Ear Surgery 161,210 63.8% 13 91,508 36.2% 7
Eyelid Surgery 988,620 78.2% 3 276,082 21.8% 1
Facelift 353,791 86.0% 9 57,738 14.0% 8
Facial Bone Contouring 79,646 73.6% 18 28,604 26.4% 12
Fat Grafting-face 499,584 84.4% 7 92,311 15.6% 6
Gynecomastia dna dna dna 212,328 100.0% 3
Hair Transplantation 26,409 19.7% 25 107,611 80.3% 5
Labiaplasty 95,010 100.0% 17 dna dna dna
Liposuction 1,181,074 84.7% 2 213,514 15.3% 2
Lower Body Lift 47,425 84.4% 22 8,744 15.6% 16
Neck Lift 188,390 81.0% 12 44,216 19.0% 10
Penile Enlargement dna dna dna 11,703 100.0% 13
Rhinoplasty 534,523 73.2% 5 195,764 26.8% 4
Thigh Lift 66,997 94.8% 19 3,675 5.2% 18
Upper Arm Lift 99,073 96.6% 16 3,516 3.4% 19
Upper Body Lift 18,550 82.0% 26 4,084 18.0% 17
Vaginal Rejuvenation 50,086 100.0% 21 dna dna dna
Totals - Surgical Procedures 8,167,217 84.7% 1,474,036 15.3%

12
2015 Gender Distribution for Cosmetic Procedures
The following list includes both surgical and nonsurgical cosmetic procedures.
Procedure
FEMALE (Number of Procedures)
Percent of Total
Rank within Category (Surgical/
Nonsurgical)
MALE (Number of Procedures)
Percent of Total
Rank within Category (Surgical/
Nonsurgical)
Non-Surgical Procedures:
Botulinum Toxin 4,003,837 86.5% 1 623,914 13.5% 1
Calcium Hydroxylapatite 152,165 87.7% 11 21,327 12.3% 13
Cellulite Treatment 259,515 91.5% 9 24,084 8.5% 12
Chemical Peel 431,040 88.1% 5 58,304 11.9% 6
Dermabrasion 41,191 79.4% 17 10,691 20.6% 15
Full Field Ablative 144,243 85.3% 12 24,855 14.7% 11
Hair Removal 928,171 84.5% 3 170,882 15.5% 3
Hyaluronic Acid 2,523,631 88.1% 2 341,454 11.9% 2
Micro-Ablative Resurfacing 181,810 83.6% 10 35,783 16.4% 10
Microdermabrasion 311,322 85.2% 7 54,265 14.8% 7
Nonsurgical Fat Reduction 350,289 82.4% 6 75,025 17.6% 5
Nonsurgical Skin Tightening 297,284 87.3% 8 43,325 12.7% 9
Photo Rejuvenation 481,703 84.7% 4 86,968 15.3% 4
Poly-L-Lactic Acid 55,275 86.2% 16 8,859 13.8% 17
Polymethylmethacrylate 30,400 84.4% 18 5,617 15.6% 18
Sclerotherapy 66,444 86.5% 14 10,334 13.5% 16
Tattoo Removal 74,312 58.0% 13 53,906 42.0% 8
Treatment of Leg Veins 61,659 84.2% 15 11,531 15.8% 14
Totals - Non-Surgical Procedure 10,394,293 86.2% 1,661,126 13.8%
TOTALS ALL PROCEDURES 18,561,509 85.6% 3,135,162 14.4%
dna = Does not apply

13
Most Common Procedures by Country
Total
USA
Surgical Procedures
Breast Augmentation 309,985
Liposuction 240,565
Eyelid Surgery 141,505
Abdominoplasty 137,605
Breast Lift 106,535
Non-Surgical Procedures
Botulinum Toxin 1,141,595
Hyaluronic Acid 580,320
Hair Removal 174,590
Photo Rejuvenation 122,850
Nonsurgical Fat Reduction 119,470
Brazil
Surgical Procedures
Liposuction 182,765
Breast Augmentation 166,340
Eyelid Surgery 143,165
Abdominoplasty 131,120
Breast Lift 80,520
Non-Surgical Procedures
Botulinum Toxin 359,865
Hyaluronic Acid 195,030
Hair Removal 106,205
Chemical Peel 86,295
Photo Rejuvenation 78,155
South Korea
Surgical Procedures
Eyelid Surgery 101,985
Rhinoplasty 72,562
Fat Grafting-face 63,326
Breast Augmentation 50,553
Liposuction 39,753
Non-Surgical Procedures
Botulinum Toxin 279,019
Hyaluronic Acid 198,378
Photo Rejuvenation 48,860
Hair Removal 45,217
Nonsurgical Skin Tightening 36,088

14
Most Common Procedures by Country
Total
India
Surgical Procedures
Liposuction 88,193
Rhinoplasty 44,290
Hair Transplantation 39,625
Abdominoplasty 32,401
Eyelid Surgery 29,434
Non-Surgical Procedures
Hair Removal 154,650
Botulinum Toxin 85,334
Hyaluronic Acid 60,050
Chemical Peel 58,093
Nonsurgical Fat Reduction 32,293
Mexico
Surgical Procedures
Liposuction 70,773
Breast Augmentation 61,663
Eyelid Surgery 48,329
Rhinoplasty 39,897
Abdominoplasty 39,634
Non-Surgical Procedures
Botulinum Toxin 161,355
Hyaluronic Acid 86,320
Cellulite Treatment 33,480
Hair Removal 30,008
Nonsurgical Skin Tightening 28,350
Germany
Surgical Procedures
Eyelid Surgery 54,907
Breast Augmentation 53,376
Liposuction 40,065
Fat Grafting-face 21,877
Abdominoplasty 17,682
Non-Surgical Procedures
Botulinum Toxin 148,459
Hyaluronic Acid 129,852
Nonsurgical Skin Tightening 6,000
Calcium Hydroxylapatite 4,833
Nonsurgical Fat Reduction 4,151

15
Most Common Procedures by Country
Total
Colombia
Surgical Procedures
Liposuction 51,623
Breast Augmentation 46,702
Abdominoplasty 29,317
Eyelid Surgery 27,959
Rhinoplasty 24,852
Non-Surgical Procedures
Botulinum Toxin 76,000
Hyaluronic Acid 41,002
Hair Removal 30,077
Nonsurgical Fat Reduction 23,646
Microdermabrasion 14,317
France
Surgical Procedures
Breast Augmentation 41,924
Eyelid Surgery 35,473
Liposuction 29,450
Abdominoplasty 22,924
Rhinoplasty 20,055
Non-Surgical Procedures
Hyaluronic Acid 92,103
Botulinum Toxin 91,751
Nonsurgical Fat Reduction 8,921
Hair Removal 7,201
Nonsurgical Skin Tightening 6,451
Italy
Surgical Procedures
Breast Augmentation 23,400
Liposuction 20,784
Eyelid Surgery 19,960
Fat Grafting-face 11,216
Rhinoplasty 9,984
Non-Surgical Procedures
Botulinum Toxin 110,400
Hyaluronic Acid 109,288
Chemical Peel 12,112
Sclerotherapy 5,800
Full Field Ablative 5,616

16
Countries Performing Most Popular Non-Surgical Procedures
Rank* Country Number of Procedures Percentage of Total
Botulinum Toxin
1 USA 1,141,595 24.7%
2 Brazil 359,865 7.8%
3 South Korea 279,019 6.0%
4 Mexico 161,355 3.5%
5 Germany 148,459 3.2%
6 Italy 110,400 2.4%
7 France 91,751 2.0%
8 India 85,334 1.8%
9 Colombia 76,000 1.6%
Hyaluronic Acid
1 USA 580,320 20.3%
2 South Korea 198,378 6.9%
3 Brazil 195,030 6.8%
4 Germany 129,852 4.5%
5 Italy 109,288 3.8%
6 France 92,103 3.2%
7 Mexico 86,320 3.0%
8 India 60,050 2.1%
9 Colombia 41,002 1.4%
Hair Removal
1 USA 174,590 15.9%
2 India 154,650 14.1%
3 Brazil 106,205 9.7%
4 South Korea 45,217 4.1%
5 Colombia 30,077 2.7%
6 Mexico 30,008 2.7%
7 France 7,201 0.7%
8 Italy 4,928 0.4%
9 Germany 4,118 0.4%
Photo Rejuvenation
1 USA 122,850 21.6%
2 Brazil 78,155 13.7%
3 South Korea 48,860 8.6%
4 Mexico 24,521 4.3%
5 Colombia 13,965 2.5%
6 India 6,816 1.2%
7 France 6,099 1.1%
8 Italy 2,688 0.5%
9 Germany 0 0.0%

17
Countries Performing Most Popular Non-Surgical Procedures
Rank* Country Number of Procedures Percentage of Total
Chemical Peel
1 USA 101,010 20.6%
2 Brazil 86,295 17.6%
3 India 58,093 11.9%
4 Italy 12,112 2.5%
5 Mexico 8,339 1.7%
6 South Korea 7,779 1.6%
7 Colombia 5,852 1.2%
8 France 5,026 1.0%
9 Germany 2,092 0.4% * Rankings are based solely on those countries from which a sufficient survey response was received and data were considered to be representative.

18
Surgical Procedure Group Ranking by Country
Rank Country Total % of Total
USA
1 Total Breast Procedures 546,260 38.6%
2 Total Body & Extremities Procedures 454,935 32.2%
3 Total Face & Head Procedures 413,140 29.2%
Brazil
1 Total Body & Extremities Procedures 435,270 35.6%
2 Total Face & Head Procedures 430,375 35.2%
3 Total Breast Procedures 358,655 29.3%
South Korea
1 Total Face & Head Procedures 311,571 70.0%
2 Total Breast Procedures 74,876 16.8%
3 Total Body & Extremities Procedures 58,697 13.2%
India
1 Total Face & Head Procedures 185,158 44.0%
2 Total Body & Extremities Procedures 153,317 36.5%
3 Total Breast Procedures 81,980 19.5%
Mexico
1 Total Face & Head Procedures 185,411 40.2%
2 Total Body & Extremities Procedures 165,509 35.9%
3 Total Breast Procedures 110,624 24.0%
Germany
1 Total Face & Head Procedures 126,824 41.1%
2 Total Breast Procedures 101,611 33.0%
3 Total Body & Extremities Procedures 79,823 25.9%
Colombia
1 Total Body & Extremities Procedures 122,199 38.8%
2 Total Face & Head Procedures 107,949 34.3%
3 Total Breast Procedures 84,636 26.9%
France
1 Total Face & Head Procedures 101,365 39.1%
2 Total Breast Procedures 85,652 33.0%
3 Total Body & Extremities Procedures 72,191 27.9%
Italy
1 Total Face & Head Procedures 60,000 43.2%
2 Total Breast Procedures 41,192 29.7%
3 Total Body & Extremities Procedures 37,672 27.1%
* Percentage reflects portion of countries total surgical procedures

19
Non-Surgical Procedure Group Ranking by Country
Rank Country Total % of Total
USA
1 Total Injectables Procedures 1,805,895 68.7%
2 Total Facial Rejuvenation Procedures 483,015 18.4%
3 Total Other Procedures 339,365 12.9%
Brazil
1 Total Injectables Procedures 578,050 52.6%
2 Total Facial Rejuvenation Procedures 298,265 27.1%
3 Total Other Procedures 223,630 20.3%
South Korea
1 Total Injectables Procedures 483,482 68.0%
2 Total Facial Rejuvenation Procedures 140,024 19.7%
3 Total Other Procedures 87,584 12.3%
India
1 Total Other Procedures 242,262 47.0%
2 Total Injectables Procedures 145,749 28.3%
3 Total Facial Rejuvenation Procedures 127,022 24.7%
Mexico
1 Total Injectables Procedures 254,975 57.1%
2 Total Other Procedures 96,798 21.7%
3 Total Facial Rejuvenation Procedures 94,597 21.2%
Germany
1 Total Injectables Procedures 284,421 92.0%
2 Total Facial Rejuvenation Procedures 13,663 4.4%
3 Total Other Procedures 11,065 3.6%
Colombia
1 Total Injectables Procedures 117,582 50.3%
2 Total Other Procedures 65,275 27.9%
3 Total Facial Rejuvenation Procedures 50,996 21.8%
France
1 Total Injectables Procedures 188,357 82.1%
2 Total Other Procedures 22,373 9.7%
3 Total Facial Rejuvenation Procedures 18,782 8.2%
Italy
1 Total Injectables Procedures 227,304 81.2%
2 Total Facial Rejuvenation Procedures 29,312 10.5%
3 Total Other Procedures 23,280 8.3%
* Percentage reflects portion of countries total non-surgical procedures

20
2015 Age Distribution for Certain Cosmetic Procedures
18 years old or
younger 19-34 years old 35-50 years old 51-64 years old 65 years old or
older
Breast augmentations 45,116 3.0% 898,904 60.4% 460,843 31.0% 74,747 5.0% 9,381 0.6%
Liposuction 32,494 2.3% 628,262 45.1% 563,693 40.4% 149,639 10.7% 20,500 1.5%
Rhinoplasty 55,064 7.5% 474,686 65.0% 165,045 22.6% 30,453 4.2% 5,039 0.7%
Botulinum Toxin 29,155 0.6% 1,048,186 22.7% 2,312,950 50.0% 1,027,361 22.2% 210,100 4.5%
Nonsurgical Fat Reduction 10,633 2.5% 126,318 29.7% 176,080 41.4% 89,741 21.1% 22,542 5.3%
2015 Percent of Cosmetic Procedures by Location
World-Wide Brazil Colombia France Germany India Italy Mexico
South Korea USA
An office facility 32.7% 33.9% 20.6% 21.4% 35.1% 24.4% 36.3% 25.9% 60.4% 41.6%
A hospital 46.7% 56.1% 56.3% 60.4% 53.0% 54.4% 26.1% 54.1% 34.0% 18.6% A free-standing surgicenter 19.8% 9.8% 22.5% 18.2% 11.9% 20.1% 37.0% 19.9% 5.7% 39.5%
Other 0.8% 0.2% 0.7% 0.0% 0.0% 1.1% 0.6% 0.1% 0.0% 0.3%
Breast Augmentations for Women 17 Years Old or Younger - 2015
World-Wide Brazil Colombia France Germany India Italy Mexico
South Korea USA
Percentage of Plastic Surgeons who performed breast augmentation procedures on women 17 years old or younger in 2015 8.0% 19.0% 18.6% 13.9% 6.7% 2.6% 0.0% 9.3% 2.2% 4.6%
Reasons they were performed:
Congenital absent breast (i.e., Poland’s syndrome) 12.8% 8.9% 0.6% 0.0% 0.0% * * 22.6% * 14.6%
Severe asymmetry 18.1% 15.5% 23.8% 27.4% 37.5% * * 15.0% * 17.1%
Congenital micromastia 12.0% 11.6% 0.3% 36.2% 0.0% * * 10.1% * 9.3%
Tubular breast 21.4% 20.0% 55.3% 32.4% 62.5% * * 7.6% * 11.8% Purely cosmetic bilateral augmentation 31.2% 37.9% 19.8% 4.0% 0.0% * * 44.7% * 41.8%
Other 4.5% 6.0% 0.4% 0.0% 0.0% * * 0.0% * 5.4%
Medical Tourism - 2015 What percentage of your patients are from other countries?
World-Wide Brazil Colombia France Germany India Italy Mexico
South Korea USA
Median 5.0% 1.0% 20.0% 5.0% 5.0% 10.0% 5.0% 10.0% 2.5% 2.0%
Average 12.2% 7.5% 24.7% 9.3% 8.3% 13.5% 10.5% 17.0% 8.7% 6.4%
Top 3 Countries from which Patients Travel:
1 USA Spain Belgium Russia USA Russia USA China Canada
2 Portugal USA Italy Austria UK Romania Canada Japan Mexico
3 England Canada England Switzerland UAE Switzerland Colombia Russia England