Embed Size (px)
Citation preview

Raman Spectroscopy in Biogeology
Isabelle Daniel Laboratoire de Géologie de Lyon, France

Outline
• Quan+ta+ve Raman spectroscopic analysis of microbial metabolic ac+vity
• Raman spectroscopy for probing live cells
• Measurements of minute amount of biological and bio+c products

Quan+ta+ve Raman spectroscopic analysis of microbial metabolic ac+vity
The fermenta+on by the baker yeast Saccharomyces cerevisiae
as a func+on of pressure
5 µm

• The eukaryotic model for high-pressure studies
• No metabolic data for S. cerevisiae under high pressure
• Alcoholic fermentation well constrained at ambient pressure
• Ethanol easily detectable by Raman spectroscopy
• Arrest of alcoholic fermentation predicted at ca. 50 MPa (Abe et al. 2004)
The yeast S. cerevisiae at high hydrostatic pressure
0.1 MPa Optimal growth pressure
20-50 MPa Cell cycle arrest
40-60 MPa Internal acidification Induction of stress
transcriptional factors
70-200 MPa Induction of stress
transcriptional profile
≥220 MPa Death
Fernandes, et al., 2007

Symmetric C-‐-‐-‐C stretching mode of ethanol @ 883 cm-‐1
Characterization of alcoholic fermentation by Raman spectroscopy
Raman spectrum glucose
Raman spectrum ethanol

… in the low-‐fluorescence culture medium Calibra+on of the normalised intensity of νs ethanol
as a func+on of ethanol +tra+on
[Eth]= 0.218(2) Ieth/Isulf
Experimental details: -‐ Jobin Yvon® HR800 spectrometer -‐ Ar laser, 514.53 nm, 40-‐50 mW -‐ 10x20 s acquisi+ons
Quantification of ethanol by Raman spectroscopy
Etha
nol
Etha
nol
Etha
nol
Ieth, 883 / Isulf, 980

Fermentation of S. cerevisiae, at ambient pressure
Etha
nol
Etha
nol
Etha
nol
Star+ng from 0.15 mol/l glucose
First order kine+c reac+on [Eth] = 2[Glc](1-‐e-‐kt)
[Eth]f = 0.27 mol/l
k = 0.152(10) h-‐1
Picard, A. et al., 2007. Extremophiles

Raman spectroscopy in a ‘low’-pressure DAC
Diamond window 0.4 -‐ 0.6 mm thick Ni gasket, 0.3 mm thick, 0.5 mm across
Diamond anvil 2.2 mm thick, 1.4 mm culet
Pressure and temperature range 1.5 GPa 300 °C
sample 60 nl
Coll. with J.C. Chervin, at IMPMC, Paris

Fermentation of S. cerevisiae in the DAC, as a function of pressure
Observa+ons : ambient to 10 MPa
• reac+on twice-‐thrice faster • yield almost at the theore+cal limit
yield 95% k = 0.152(10) h-‐1
yield 98% k = 0.345(22) h-‐1
Picard, A. et al., 2007. Extremophiles
Interpreta+on
• enhanced uptake of glucose • enhanced ac+vity of one/several enzymes of the glycolysis and/or fermenta+on pathways. • no measurable lag phase tends to exclude pressure-‐induced increase in protein synthesis. • more efficient expella+on ethanol from the cell under pressure, due to an increase of passive diffusion.
0
0.05
0.1
0.15
0.2
0.25
0.3
0 5 10 15 20 25 30
0.1 MPa10 MPa
Etha
nol c
once
ntra
tion
(mol
/l)
Time (h)
5 MPa

Fermentation of S. cerevisiae in the DAC, as a function of pressure
Observa+ons : above 10 MPa,
• yield decreases • reac+on rate almost constant
At 40 MPa, yield of 68%
similar to Abe & Horikoshi (1997)
Alcoholic fermenta+on stops between 65 and 100 MPa
yield 95% k = 0.152(10) h-‐1
yield 28% k = 0140(21) h-‐1
Picard, A. et al., 2007. Extremophiles
0
0.05
0.1
0.15
0.2
0.25
0.3
0 5 10 15 20 25 30
0.1 MPa
30 MPa
Etha
nol c
once
ntra
tion
(mol
/l)
Time (h)
40 MPa
20 MPa
55 MPa
65 MPa
100 MPa

0
0,05
0,1
0,15
0,2
0,25
0,3
0 20 40 60 80 100
Etha
nol c
once
ntra
tion
(mol
/l)
Pressure (MPa)
Fermentation of S. cerevisiae in the DAC, as a function of pressure
0-10 MPa Activated steps of ethanol fermentation: - Increased glucose import? - Activation of glycolysis or fermentation pathway enzymes? - Facilitated excretion of ethanol?
20-87 MPa Decrease of final ethanol production: - Loss of only 1 log after 24 hours at 70 MPa - Progressive inhibition of enzymes?
37 MPa higher than the predicted value by Abe et al. (2004) and than pressure limit for growth
Maximal pressure for ethanol fermentation calculated at 87±7 MPa
Uncoupling of growth and metabolism

Raman spectroscopy for probing live cells
• E-‐CARS Coherent an+-‐Stokes Raman Scajering
• Resonant Raman Scajering
• SERS Surface Enhanced Raman Scajering
For 2D mapping

Coherent anti-Stokes Raman Scattering
CARS microscopy provides label-free imaging
A simple CARS microscope. A beamsplitter splits pulses from an isolated femto-second Ti:sapphire laser. Half goes to a photonic crystal fiber to generate the Stokes pulses, followed by a bandpass filter, before being recombined on a dichroic mirror.
http://www.photonics.com/Article.aspx?AID=40014

Analysis of cytochrome distribu+on
The cytochrome distribution in hyphal tip cells of the fungi Schizophyllum commune
Walter et al. 2010, Analyst

Raman spectra of a hyphal tip cell of S. commune
• 2924 cm-‐1
asymmetric CH-‐stretching vibra+on of methylene groups from all cell cons+tuents
• 1652 cm-‐1 protein, lipid and polysaccharide vibra+ons
• 1573, 1299, 1114, 735 cm-‐1 cytochrome vibra+ons
-‐ Spa+al resolu+on 0.7 µm - λ0 = 532 nm resonant with the electronic absorp+on of cytochrome
R1573 cm-‐1/R1652cm-‐1
Walter et al. 2010, Analyst

CARS images of the fungal hyphae
@1572 cm-‐1
cytochrome marker band spec. resolu+on 20 cm-‐1
@1552 cm-‐1under non resonant condi+ons
@2990 cm-‐1, CH vibra+on spa+al resolu+on 30x30 nm2 spec. resolu+on 110 cm-‐1
Walter et al. 2010, Analyst In less than 25 s

Measurements of minute amount of biological and bio+c products
SERS & SERRS EM enhancement when the incident laser excites surface plasmons, x104 up to 1011
CT enhancement when transfer of electrons between the analyte and metal, x10-‐100 resonance enhancement if the laser wavelength falls near an absorp+on wavelength of the sample
Halvorson et al. 2010, Environ. Sci. Technol. Smith-‐Palmer et al. 2010, Vibra+onal Spectroscopy

Halvorson et al. 2010, Environ. Sci. Technol. ; Banholzer et al. 2008 Chem. Soc. Rev.
Components of a SERS measurement

SER spectra of bacteria @332 cm-1
Halvorson et al. 2010, Environ. Sci. Technol. Jarvis & Goodacre, 2008, Chem. Soc. Rev.
Flavin Adenine Dinucleo+de

SERS-‐based immunoassay planorms
Porter et al. 2008, Chem. Soc. Rev.
with extrinsic Raman labels (ERLs)
With femtomolar detec+on of the analyte
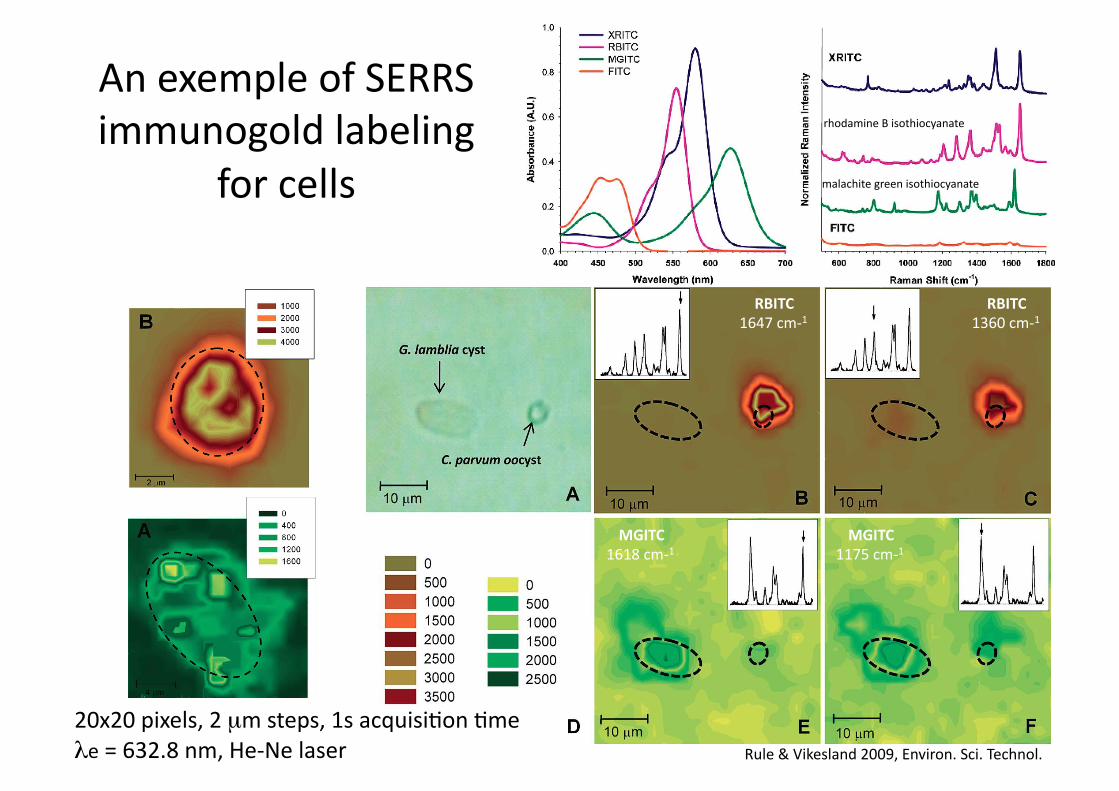
An exemple of SERRS immunogold labeling
for cells
20x20 pixels, 2 µm steps, 1s acquisi+on +me λe = 632.8 nm, He-‐Ne laser Rule & Vikesland 2009, Environ. Sci. Technol.
RBITC 1647 cm-‐1
RBITC 1360 cm-‐1
MGITC 1618 cm-‐1
MGITC 1175 cm-‐1
rhodamine B isothiocyanate
malachite green isothiocyanate

SERS on single-‐stranded DNA Van Lierop et al. 2011, Anal. Chem.
Blank SERS primer + 1nm target DNA +1 nM non-‐target DNA
3x 1s
DL = 1 nM
triplicates

A SERRS hybridiza+on assay for ds DNA
R6G HEX
Rupicapra rupicapra Capra hircus
Feuillie et al. 2012, Anal. Bioanal. Chem.

Simultaneous detec+on of 2 species
Identification of both sequences Total DNA amount = 5 10-8 M
DL = 4 10-10 M Quantification of their relative amount
1x 10 s

On a Lab-‐on-‐a-‐chip device…
Highly reproducible SER spectra of a strain of E. coli
Walter et al. 2011, Lab Chip
Time table for data of one strain for database (1200 spectra for SERS and Raman)