Embed Size (px)
Citation preview

1
1
2
3
Is There Room for Privacy in the Compact City? 4
5
Morag Lindsay1*, Katie Williams
2, Carol Dair
3 6
7
8
1. Department of Architecture 9
Oxford Brookes University 10
Headington Campus 11
Gipsy Lane 12
Oxford OX3 0BP 13
14
2. Centre for Environment and Planning 15
Department of Planning and Architecture 16
University of the West of England 17
Frenchay Campus 18
Coldharbour Lane 19
Bristol, BS16 1QY 20
21
3. Department of Architecture 22
Oxford Brookes University 23
Headington Campus 24
Gipsy Lane 25
Oxford OX3 0BP 26
27
* corresponding author: [email protected] 28
29

2
Abstract: Compact city theory has been embraced by the UK Government and, 1
consequently, is embedded in planning policies seeking to deliver sustainable 2
outcomes. New housing and mixed use developments are now being built that reflect 3
the change in policy, for example, urban brownfield sites are being developed at 4
higher densities with larger proportions of flats than previously. However, whilst the 5
environmental, economic and increasingly the social, benefits of urban compaction 6
have been promoted, there has been little discussion of its impact on quality of urban 7
life and in particular on levels of privacy. This paper begins to address this gap by 8
reporting the results of research into the effects of the design of compact, sustainable 9
housing on privacy in the home. The Privacy Study investigated the impact of a 10
number of design and location features of new housing developments on residents’ 11
perceptions of overlooking and noise in their homes. The results suggest that in 12
certain types of dwellings, such as flats, noise from neighbours is heard more often. 13
The size of dwellings and plots influence residents’ perceptions of overlooking of 14
their homes and private open spaces. Overlooking of private outdoor space (but not 15
indoor space) tends to be less in larger homes on bigger plots. Given the potential 16
roles of noise and overlooking in modulating interactions between neighbours, this 17
study suggests that further research is warranted on the impacts of compact design on 18
privacy and, consequently, on aspects of social sustainability. 19
20
21
3
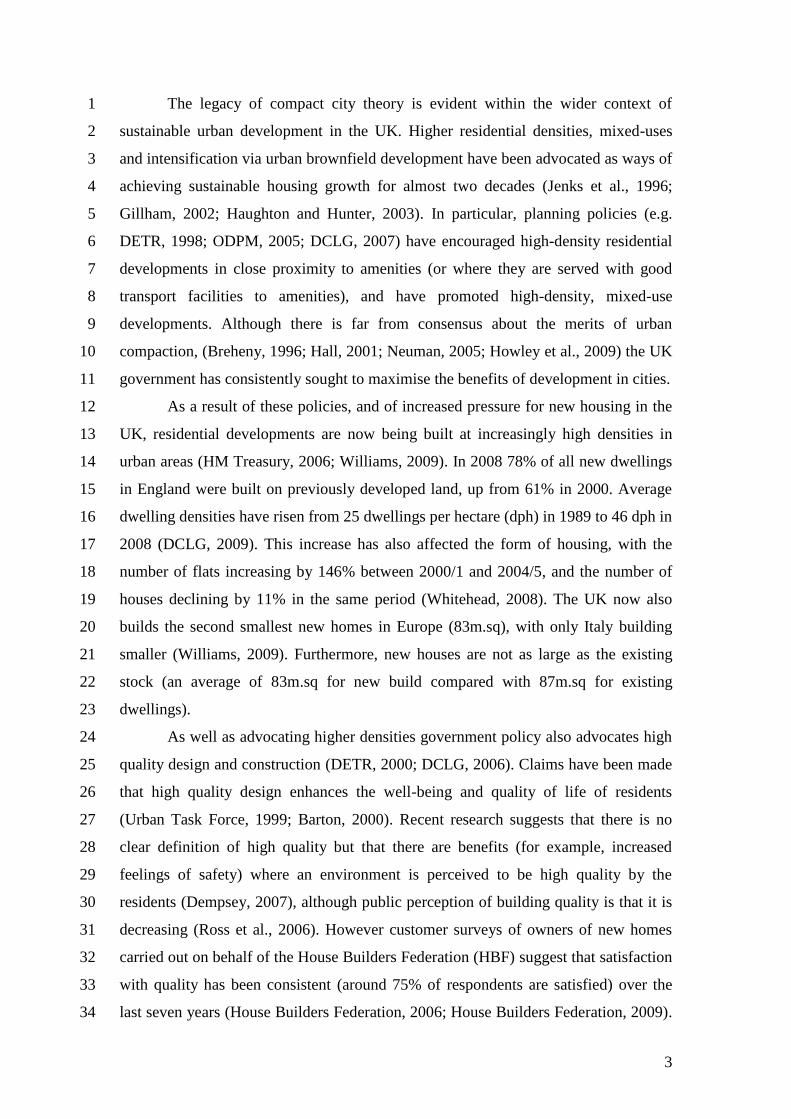
The legacy of compact city theory is evident within the wider context of 1
sustainable urban development in the UK. Higher residential densities, mixed-uses 2
and intensification via urban brownfield development have been advocated as ways of 3
achieving sustainable housing growth for almost two decades (Jenks et al., 1996; 4
Gillham, 2002; Haughton and Hunter, 2003). In particular, planning policies (e.g. 5
DETR, 1998; ODPM, 2005; DCLG, 2007) have encouraged high-density residential 6
developments in close proximity to amenities (or where they are served with good 7
transport facilities to amenities), and have promoted high-density, mixed-use 8
developments. Although there is far from consensus about the merits of urban 9
compaction, (Breheny, 1996; Hall, 2001; Neuman, 2005; Howley et al., 2009) the UK 10
government has consistently sought to maximise the benefits of development in cities. 11
As a result of these policies, and of increased pressure for new housing in the 12
UK, residential developments are now being built at increasingly high densities in 13
urban areas (HM Treasury, 2006; Williams, 2009). In 2008 78% of all new dwellings 14
in England were built on previously developed land, up from 61% in 2000. Average 15
dwelling densities have risen from 25 dwellings per hectare (dph) in 1989 to 46 dph in 16
2008 (DCLG, 2009). This increase has also affected the form of housing, with the 17
number of flats increasing by 146% between 2000/1 and 2004/5, and the number of 18
houses declining by 11% in the same period (Whitehead, 2008). The UK now also 19
builds the second smallest new homes in Europe (83m.sq), with only Italy building 20
smaller (Williams, 2009). Furthermore, new houses are not as large as the existing 21
stock (an average of 83m.sq for new build compared with 87m.sq for existing 22
dwellings). 23
As well as advocating higher densities government policy also advocates high 24
quality design and construction (DETR, 2000; DCLG, 2006). Claims have been made 25
that high quality design enhances the well-being and quality of life of residents 26
(Urban Task Force, 1999; Barton, 2000). Recent research suggests that there is no 27
clear definition of high quality but that there are benefits (for example, increased 28
feelings of safety) where an environment is perceived to be high quality by the 29
residents (Dempsey, 2007), although public perception of building quality is that it is 30
decreasing (Ross et al., 2006). However customer surveys of owners of new homes 31
carried out on behalf of the House Builders Federation (HBF) suggest that satisfaction 32
with quality has been consistent (around 75% of respondents are satisfied) over the 33
last seven years (House Builders Federation, 2006; House Builders Federation, 2009). 34

4
There is concern that construction quality may be affected by a skills shortage in the 1
building trade due to a lack of investment in training (Egan, 2004; Ross et al., 2006). 2
This is further compounded by procurement being based on a lowest tender/fixed cost 3
system which results in high standards of quality being hard to maintain and measure 4
(Ross et al., 2006). Construction quality is important across all types and densities of 5
housing, however in the case of high density development the quality of construction 6
could make a significant difference to the quality of life of residents. 7
Perhaps surprisingly, there has been little research into the impacts of the 8
changing profile of new housing in the UK on quality of life. However, what work has 9
been done suggests that people tend to: prefer lower to higher density housing 10
Howley, 2008 #1231]; feel that new housing is too dense and does not provide enough 11
space; and prefer houses over flats (HATC, 2006). In particular, some of this research 12
suggests that new housing is not providing individuals enough privacy in their homes, 13
as indoor spaces get smaller and neighbouring dwellings are built closer. Yet, 14
negative impacts on privacy could be detrimental to some social sustainability 15
objectives, such as liveability, as privacy is closely related to the concept of ‘the 16
home’ in UK culture. 17
This paper investigates the relationship between the design features of new 18
compact housing developments and residents’ perceptions of privacy in the home, in 19
terms of overlooking and noise. Design features specifically related to higher density 20
housing, mixed-use development and urban brownfield locations are assessed for their 21
potential impact on overlooking and noise. 22
23
The importance of privacy in the UK 24
In the UK, the home is widely viewed as a space that offers individuals 25
privacy from the public domain (Ariès, 1962; Weintraub, 1997; Madanipour, 2003). A 26
desire for privacy of the individual and of the home is not unique to England or the 27
UK; however the form and impact privacy has varies greatly between cultures. The 28
design of dwellings reflects these differences; in England the detached house is 29
perceived as being the only dwelling type that can provide adequate privacy whereas 30
flats are regarded as inferior. In other countries flats are not seen as inferior types of 31
dwellings and living in them is successfully combined with sufficient levels of 32
privacy. 33

5
Privacy is an important aspect of western culture and has been shown to have 1
an impact on peoples’ mental health (Goffman, 1961; Evans et al., 1989; Halpern, 2
1995). Insufficient privacy can lead to social withdrawal through the reduction of 3
social interaction and an increase in solitary pursuits (Evans et al., 1989). Goffman 4
has argued the case for a dramaturgical perspective; in order for a person to perform 5
in public they need a private backstage where they can remove their public mask 6
(Goffman, 1959). The home provides the individual with the backstage area where 7
they can recover and readjust after being in public (Goffman, 1959). For the home to 8
be a successful backstage it must be in the control of the individual(s) who live there: 9
control of the space ensures the individual has control of information about the self 10
and interactions with other people (Westin, 1967; Altman, 1975). Control of space is 11
recognised as an environmental and culturally based mechanism people use to control 12
access to themselves (Altman, 1975). Being in control of the home enables the 13
individual to seek out different types of privacy appropriate for particular situations 14
(Westin, 1967). Types of privacy include solitude, intimacy with others, anonymity 15
and reserve (Westin, 1967; Marshall, 1974; Pedersen, 1979). Using these various 16
types of privacy enables an individual to balance their social public life with their 17
private life of the home. 18
19
The potential impacts of the ‘compact city’ policies on privacy in the home 20
As suggested above, compaction policies have had a significant affect on 21
housing design in the UK. These changes could have consequences for peoples’ 22
experiences of privacy in residential settings through the design of dwellings and their 23
surroundings, including the street and neighbourhood (Newman, 1972; Hall, 2006). A 24
number of aspects of compaction policy could affect privacy. 25
First, the drive to increase the number of mixed-use urban infill developments 26
may lead to dwellings being built next to facilities and amenities rather than other 27
housing (Jacobs, 1961; Sherlock, 1991; Rudlin and Falk, 1999). Depending on the 28
use, this may have a negative or positive impact on privacy for residents. For 29
example, a dwelling next to a park or playground may be more private than one next 30
to retail units (DCLG, 2006). 31
Second, smaller plot sizes and an increase in the number of flats could result in 32
reduced private outdoor space (POS) This could be detrimental as POS’s that are 33
protected from overlooking are seen as places of retreat that provide residents with a 34
6
sense of privacy (Bhatti and Church, 2004). POS’s can also provide a view of nature 1
rather than a view of other homes (Day, 2000), and can act as buffer zones, 2
particularly to the front of homes where they provide space between the street and the 3
dwelling (Hall, 2006). 4
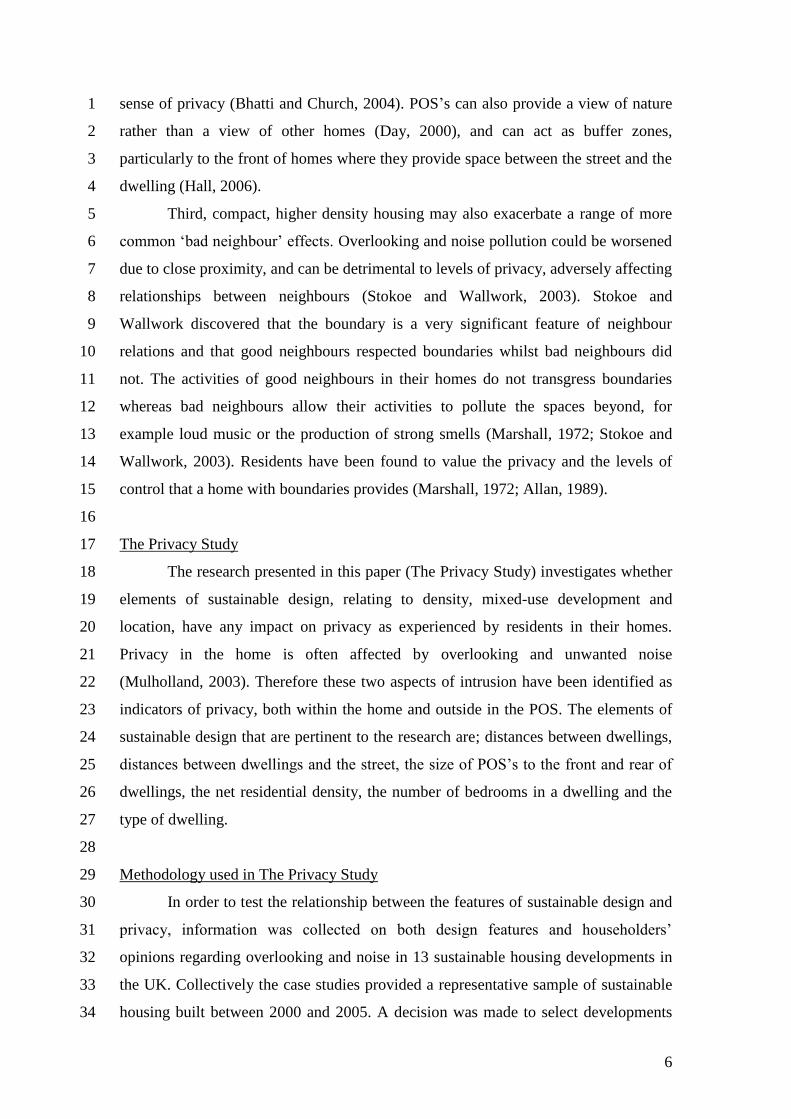
Third, compact, higher density housing may also exacerbate a range of more 5
common ‘bad neighbour’ effects. Overlooking and noise pollution could be worsened 6
due to close proximity, and can be detrimental to levels of privacy, adversely affecting 7
relationships between neighbours (Stokoe and Wallwork, 2003). Stokoe and 8
Wallwork discovered that the boundary is a very significant feature of neighbour 9
relations and that good neighbours respected boundaries whilst bad neighbours did 10
not. The activities of good neighbours in their homes do not transgress boundaries 11
whereas bad neighbours allow their activities to pollute the spaces beyond, for 12
example loud music or the production of strong smells (Marshall, 1972; Stokoe and 13
Wallwork, 2003). Residents have been found to value the privacy and the levels of 14
control that a home with boundaries provides (Marshall, 1972; Allan, 1989). 15
16
The Privacy Study 17
The research presented in this paper (The Privacy Study) investigates whether 18
elements of sustainable design, relating to density, mixed-use development and 19
location, have any impact on privacy as experienced by residents in their homes. 20
Privacy in the home is often affected by overlooking and unwanted noise 21
(Mulholland, 2003). Therefore these two aspects of intrusion have been identified as 22
indicators of privacy, both within the home and outside in the POS. The elements of 23
sustainable design that are pertinent to the research are; distances between dwellings, 24
distances between dwellings and the street, the size of POS’s to the front and rear of 25
dwellings, the net residential density, the number of bedrooms in a dwelling and the 26
type of dwelling. 27
28
Methodology used in The Privacy Study 29
In order to test the relationship between the features of sustainable design and 30
privacy, information was collected on both design features and householders’ 31
opinions regarding overlooking and noise in 13 sustainable housing developments in 32
the UK. Collectively the case studies provided a representative sample of sustainable 33
housing built between 2000 and 2005. A decision was made to select developments 34

7
that tended to be seen as characteristic of the type of new housing being built at the 1
time. Some of the developments are wholly owned by Registered Social Landlords 2
whilst others were built by private housing developers and the dwellings have been 3
sold on the open market. The selection criteria involved design features of the 4
developments such as residential density, level of mixed-use and sustainable design 5
features, as well as a classification of either a brownfield or greenfield location (see 6
(Williams and Lindsay, 2007) for a fuller discussion). The selection criteria did not 7
include information relating to the processes used to develop a site, or the aspirations 8
(sustainability or others) of the designers for the developments. 9
A site survey checklist was developed to measure and analyse the physical 10
features of the developments. The checklist was based on a theoretical framework of 11
features of sustainable housing developments developed through an extensive 12
literature review of empirical research, policy and design guidance. The checklist is a 13
combination of original measures and some measures from previously developed 14
checklists (Housing Corporation, 2000; Llewelyn-Davies, 2000; BRE, 2004; Burton 15
et al., 2005). 16
A household questionnaire was used to measure residents’ privacy. The 17
household questionnaire also contained questions pertaining to social and economic 18
data in order that these could be controlled for in the analyses. Responses to questions 19
were primarily on Likert Scales with opportunities given for respondents to add their 20
own comments at the end of questions. The questionnaires were posted to residents 21
and collected in person by the researchers. The overall return rate was 34%, (659 22
questionnaires). The relationships between the measures of physical features in the 23
site survey checklist and the questionnaire responses were analysed using regression 24
models in SPSS v14. The analysis was carried out across the entire dataset because 25
the focus of the research was on all the design features not the specific combinations 26
of the individual developments. Therefore the developments are not compared with 27
one another. 28
29
The Sample 30
The case studies range in location from the north-east of England to the south 31
of England and Wales. Density levels vary across the developments as does the size in 32
terms of number of units (see table 1). A range of densities was sought in order that 33
the impact of higher density housing could be compared to that of lower levels of 34

8
housing densities. There is a variety of dwelling types across most of the 1
developments; a combination of flats, terraced townhouses and detached houses is 2
common (figure 1). The developments are situated in rural, urban edge or city centre 3
locations and are a mixture of greenfield and brownfield development. All the 4
developments are primarily residential and some of them have other uses within their 5
boundaries. 6
INSERT FIGURE 1 HERE 7
Figure 1: Examples of the different dwelling types across the thirteen case studies 8
(photos taken by Morag Lindsay and Carol Dair) 9
10
Four of the case studies have been designed in keeping with the architectural 11
style and character of the local area. In particular, Ingress Park has been designed 12
around the topography of the site and the influence of traditional house designs of 13
Kent is clear. Some of the case studies can only be described as generic in terms of 14
the design and style of the housing; there are no allowances for local or post-modern 15
characteristics or styles. A third group of the case studies have been designed 16
differently; for example, the design of Alpine Close is impacted by site and ecological 17
considerations. Greenwich Millennium Village and The Staiths South Bank are post-18
modern and materials and colours are used in innovative ways on the facades of the 19
buildings. The street layout of the majority of the developments tend to be curvilinear 20
with culs-de-sac, although some of the layouts of the case studies are deformed grids 21
(figure 2). 22
INSERT FIGURE 2 HERE 23
Figure2. Plans showing the layouts of the thirteen case studies 24
© Crown Copyright/database right 2007. An Ordnance Survey/EDINA supplied 25
service. 26
27

9
Name of 'Sustainable' development
Gra
ng
e F
arm
, M
ilto
n K
eyn
es
(Bel
lwa
y H
om
es)
Am
ersh
am
Ro
ad
, R
ead
ing
(Ca
taly
st H
ou
sin
g G
rou
p)
Th
e W
ate
rw
ay
s, O
xfo
rd
(Ber
kel
ey G
rou
p)
Alp
ine
Clo
se,
Ma
iden
hea
d
(Ma
iden
hea
d &
Dis
tric
t H
A)
Th
e C
ou
rty
ard
s, n
r H
ors
ha
m
(En
gli
sh C
ou
rty
ard
Ass
oc.
)
Gre
at
No
tley
Ga
rden
Vil
lage,
Bra
intr
ee (
Co
un
try
sid
e P
rop
s)
Gre
enw
ich
Mil
len
niu
m V
illa
ge,
Lo
nd
on
(E
ng
lish
Prt
)
Ing
ress
Pa
rk,
Gre
enh
ith
e (
Cre
st
Nic
ho
lso
n)
La
nsd
ow
ne
Ga
rden
s, C
ard
iff
(Ta
ff H
A/
Red
row
Ho
mes
)
New
cast
le G
rea
t P
ark
,
New
cast
le-u
po
n-T
yn
e (c
on
sort
)
Wes
toe
Cro
wn
Vil
lag
e,
So
uth
Sh
ied
ls (
Geo
rge
Wim
pey
)
Th
e S
tait
hs
So
uth
Ba
nk
,
Ga
tesh
ead
(G
eorg
e W
imp
ey)
Co
op
er R
oa
d,
Ry
e
(Ro
ther
Ho
mes
)
General profile data
No of units 39 172 291 27 104 265 303 216 215 175 122 159 68
Dwellings per hectare
(net)
26.0 27.1 42.0 42.0 32.5 28.0 153.0 32.0 38.7 29.1 87.1 55.0 29.9
Greenfield/brownfield G B B B G G B B B G B B G
Rural/edge/centre E C E C R R C E C E C C E/R
Total no of uses1 1 5 2 2 2 3 5 2 2 2 2 3 1
Uses
No. parks/play areas 4 5 4 4 0 1 4 4 1 4 6 4 2
No. cafes, pubs, etc 0 2 2 2 0 1 5 4 6 1 9 1 4
No of schools2 1 1 6 6 0 3 2 2 4 3 8 2 2
No of local shops 0 1 1 1 0 1 2 2 3 2 2 2 1
Tenure
% private homes 100 36 87 87 85 89 85 100 75 100 100 100 0
% RSL homes3 0 64 13 13 15 11 15 0 25 0 0 0 100
Notes:
1. This is simple a count of the number of different uses. Categories were: schools, health facilities, place of worship
or community halls, local store (e.g. post office, newsagent or food store), shopping centre or high street, social
space (e.g. public house, restaurant, café'), indoor leisure/sports facility, park and public open space. This count is
for uses in the development (i.e. within the boundary of the case study area) and nearby (within a 500m radius of
the development boundary)
2. This includes pre-school, primary and secondary in the development or within 500m of the boundary.
3. RSL: Registered Social Landlord
Table 1: An overview of some of the characteristics of the case studies 1
2
Table 2 shows a profile of the sample households and the type of 3
accommodation they inhabit. Over half the sample population have lived in their 4
current homes for over two years and the majority live in households of 2 or more 5
people. Twelve percent are retired and 41% live with dependent children. 6
Approximately three quarters of the sample are over 30 years old and 63 % of the 7
respondents are female. There is a fairly even spread across accommodation types; 8
18% of respondents live in detached housing, 28% are in semi-detached, terraced 9
housing accommodates 32% of respondents and 22% of respondents live in purpose-10
built flats. Many respondents have mortgages (48%) with the majority of the rest 11
renting from Registered Social Landlords or private landlords. Respondents tend to be 12

10
from the managerial or professional socio-economic categories and less so from the 1
routine occupation categories. 2
Description of
data
Categories Percentages
(%)
Length of residence Less than 2 years 40
2 years or more 60
Household size 1 person 18
2 39
3 20
4 18
5 or more 6
Household type
Non-retired couple with no dependent children 25
Retired couple with no dependent children 7
Couple with dependent children 33
Lone parent with dependent children 8
Other multi-person household 9
One non-retired person 13
One retired person 5
Gender of
respondent
Male 37
Female 63
Age of respondent
Less than 30 years old 21
30 - 40 years old 33
Over 40 years old 46
Household
accommodation
type
Detached house or bungalow 18
Semi-detached house or bungalow 28
Terraced house 32
Purpose built flat 22
Tenure
Outright owner of property 16
Buying it with the help of a mortgage or loan 48
Pay part rent and part mortgage (shared ownership) 4
Rent from private landlord 14
Rent from a Registered Social Landlord 16
Live here rent-free 2
Socio-economic
class
Higher managerial and professional occupations 24
Lower managerial occupations 38
Intermediate occupations 10
Small employers and own account workers 5
Lower supervisory and technical occupations 5
Semi-routine occupations 7
Routine occupations 3
Unclassified 8
Table 2: Summary of the characteristics of the sample 3
Results - introduction 4
Multiple regression models were developed to predict the outcome for each of 5
the four aspects of privacy; comfort with overlooking of living area, comfort with 6
overlooking of private open space, frequency with which neighbour noise is heard in 7
home, and frequency with which neighbour noise is heard in private open space. The 8
initial models investigated the impact of all density, mixed use and socio-economic 9
features. The four final models contain the variables representing the elements of 10
sustainable design that have a significant effect on the different aspects of privacy, as 11

11
well as any socio-economic features that are significant. Only the co-efficients with a 1
significant effect are listed in the results tables. 2
Density and the design features of sustainable housing that density may impact 3
on were measured. The net residential density was measured for each development. 4
The range of net residential densities across the case studies ranged from 26 dph to 5
153 dph. To reduce the risk of any one case study having an undue influence on the 6
results the case studies were divided into three bands measuring net residential 7
density; low (30dph and below), medium (31-50dph) and high (51dph and above). 8
From a review of literature it was concluded that building at higher densities may 9
impact on several aspects of the design of housing developments (Rudlin and Falk, 10
1999; Day, 2000; DTLR and CABE, 2001; Crawley Borough Council). The size of 11
dwellings is of interest but due to a variety of reasons the data for these was not 12
available. Residents were asked for the number of bedrooms in their dwelling to give 13
some indication of the size of the dwelling. Features external to the dwelling were 14
measurable and those identified as being affected by higher densities were the 15
distance between dwellings to the front, rear and sides, the setback distance from the 16
street, area of POS’s to the front and rear of the dwelling and type of dwelling. 17
Mixed-use was measured using a variable identifying the land uses to the rear 18
and front of the dwellings. The overall number of uses in each of the case studies was 19
not deemed to be relevant because the privacy measures are specific to households 20
and their immediate neighbours. A dichotomous variable was used to measure 21
whether the development was on a brownfield or a greenfield site. Developments 22
were identified with a variable as being rural, urban-edge or citycentre. The previous 23
two indicators are included to ensure that a full representation of the sites is 24
incorporated in the analysis. The variables measuring socio-economic effects were 25
age, tenure, household type, gender, number of people resident in the dwelling, the 26
length of time the respondent has been in residence and socio-economic class. Each of 27
these variables have been shown to have an impact on attitudes and behaviours and 28
are therefore relevant to The Privacy Study. The length of time a respondent has been 29
in residence is measured dichotomously; either less than, or more than, two years. 30
People's perceptions of a development can change with the length of time they have 31
lived there (Coulthard et al., 2002; Groves et al., 2003). The two year criterion was 32
chosen for practical reasons. It allowed residents of new developments sufficient time 33

12
to become familiar with the development and the local area, and to form social 1
relations. 2
3
Feature of compact city design
(& socio-economic measures)
Name of indicator Unit of measurement or name
of categories used
High density development Size of POS to rear Area measured as m2
Size of POS to front Area measured as m2
Setback distance between front
of dwelling & street
Distance measured in metres
Distance from dwelling to
dwelling at front
Distance measured in metres
Distance from dwelling to
dwelling at rear
Distance measured in metres
Distance from dwelling to
dwelling to right
Distance measured in metres
Distance from dwelling to
dwelling to left
Distance measured in metres
Number of bedrooms Integer
Net residential density Low (< 30dph), Medium (31-
50dph), High (>50dph)
Mixed-use development Feature to front of dwelling Buildings; gardens; communal
space; public open space; public
open green space; fields;
industrial/commercial; schools
& grounds
Feature to rear of dwelling Buildings; gardens; communal
space; public open space; public
open green space; fields;
industrial/commercial; schools
& grounds
Urban brownfield site Brownfield or greenfield site Dichotomous variable
Urban, rural or urban-edge
location
Urban; urban-edge; rural
Socio-economic measures
(intervening variables)
Age 3 bands (under 30, 30-40, 41
and over)
Tenure Outright owner; mortgage; part
rent/part mortgage; rent private
landlord; rent RSL; no rent
Household type Non-retired couple, no
dependents; retired couple, no
dependents; couple, dependents;
lone parent, dependents;
multiperson; single, non-
retired; single retired
Gender Male; female
Number of people Integer
Length of time in residency Less than two years; more than
two years
Socio-economic class Higher managerial and
professional occupations; lower
managerial occupations;
Intermediate occupations; small
employers and own account
workers; lower supervisory and
technical occupations; semi-
routine occupations; routine
occupations; unclassified

13
Table 3: Indicators of (a) the features of compact city design and (b) the socio-1
economic measures used in the analyses 2
3
Results – descriptive analyses 4
Preliminary analyses were carried out to gauge the relationships between 5
density and the other indicators, and dwelling types and the other indicators. Cross-6
tabulations were used to ascertain whether variables were associated. Density and 7
dwelling type were chosen as these are key indicators within The Privacy Study (table 8
4). 9
The analyses of density with the other indicators revealed some interesting 10
trends. The proportion of people under 30 years old living in high density 11
developments was substantially higher than the proportions living at low and medium 12
densities. It was discovered that a higher percentage of people rent in high density 13
developments than in either medium or low density developments. However, across 14
the three levels of density buying a dwelling with a mortgage was the most common 15
type of tenure. Interestingly, the residents in the high density developments are more 16
likely to have lived there for less than two years compared to those in the low and 17
medium density developments where residents are likely to have lived there for two or 18
more years. 19
The residents in the high density developments tend to be living alone or as 20
couples but without dependents, whereas those with dependents tend to live in the low 21
and medium density developments. Most retired people (couples and single residents) 22
live in the low density developments. The cross-tabulation between density and the 23
number of people in the household suggest a similar trend; the highest proportion of 24
single households and couples are in the high density developments and those 25
households with four or more members are more likely to live in the low and medium 26
density developments. There are likely to be numerous reasons for these ratios 27
however one reason may be the number of bedrooms in the dwellings. The analysis 28
indicates that three quarters of the dwellings in the high density developments have 29
one or two bedrooms. In contrast, two thirds of the dwellings in the low and medium 30
density developments are three and four bedroom properties. A substantial proportion 31
of the dwellings in the low density developments are likely to be detached or semi-32
detached houses whereas in the high density developments the greatest proportion of 33
dwellings are flats. 34

14
The analyses for the front and rear land uses revealed that the feature to the 1
front of properties tends to be public open space. Dwellings in low and medium 2
density developments are likely to have gardens to the rear. Communal space is the 3
rear land use for over three-quarters of the dwellings in the high density 4
developments. 5
The second set of cross-tabulations dealt with dwelling type. Residents who 6
live in detached homes are more likely to own their properties outright or have 7
mortgages than rent. There is a more even distribution between renting and owning 8
for flat dwellers. Residents in flats tend to not be retired or have dependents whereas 9
detached dwellings are more likely to have families living in them. There is a less 10
skewed distribution of household types in semi-detached and terraced housing. These 11
relationships are confirmed by the cross-tabulation with the number of people in the 12
household. Flats tend to house one or two residents, detached dwellings two to four 13
but the range for terraced housing is from one resident to eight. One explanation for 14
the varying household sizes across dwelling types may be the number of bedrooms in 15
the dwellings. Almost 95% of flats have either one or two bedrooms and over half of 16
detached dwellings have four bedrooms. The majority of terraced and semi-detached 17
dwellings have two to four bedrooms and the spread is relatively even. 18
The most common dwelling type in the high density developments is the flat 19
and in low density developments it is detached and semi-detached housing. Terrace 20
housing is the most common form of dwelling overall and is the major dwelling type 21
in medium density developments. As with the density cross-tabulations the most 22
likely front feature across all dwelling types is public open space. The greatest 23
proportion of houses have gardens to the rear whereas flats are more likely to have 24
communal spaces to the rear. 25
26
Indicator Density Dwelling type
Category Low Med High Det Semi Terr Flat
Age 30 and under (%) 18.3 12.9 37.7 9.3 16 20.1 36.4
31 – 40 33.6 32.7 32.7 33.3 33 34.5 30.7
41 and over 48 54.4 29.6 57.4 51 45.4 32.9
TOTAL (number) 229 263 159 108 100 284 140
Tenure Outright owner (%) 13.5 21.8 8.8 26.8 7 18 7.1
Buying with mortgage 43.7 50 50.3 66.7 42 47 42.9
Part rent, part mortgage 7.9 2.3 2.5 0 9 4.6 2.9
Rent, private landlord 3.9 17.6 23.9 2.8 8 13.8 30
Rent, RSL 30.1 6.1 13.2 3.7 33 14.8 14.3
Live for free but not owner 0.9 1.9 0.6 0 1 1.4 2.1
Other 0 0.4 0.6 0 0 0.4 0.7

15
TOTAL (number) 229 262 159 108 100 283 140
Household
type
Non-retired couple, no
dependents
16.2 26.1 36.9 25.9 15 24 33.8
Retired couple, no
dependents
10.1 7.7 3.1 7.4 13 7.1 4.3
Couple, dependents 39 37.5 17.5 49.1 39 35.7 12.9
Lone parent, dependents 14.5 5 4.4 6.5 8 11 2.2
Other multi-person 7 8 11.3 2.8 10 9.5 9.4
One non-retired person 6.6 11.1 25.6 3.7 6 9.2 35.3
One retired person 6.6 4.6 1.3 4.6 9 3.5 2.2
TOTAL (number) 228 261 160 108 100 100 139
Gender Female (%) 29.8 36.5 48.4 30.8 38 31.4 52.5
Male 70.2 63.5 51.6 69.1 62 68.6 47.5
TOTAL (number) 228 263 159 107 100 283 141
No. of
residents
1 (%) 13.2 16.4 27.7 8.3 16 12.4 39.6
2 36 35.5 48.4 30.6 39 38.2 45.4
3 21.5 19.8 17 28.7 12 21.9 12.9
4 21.9 23.3 2.5 27.8 23 21.2 0.7
5 or more 7.4 5 4.4 4.6 10 6.5 1.4
TOTAL (number) 228 262 159 108 100 283 139
Length of
residency
Less than 2 years (%) 29.3 36.7 62.5 25.9 22.3 42.7 61.2
2 or more years 70.7 63.3 37.5 74.1 77.7 57.3 38.8
TOTAL (number) 232 264 160 100 103 286 139
Socio-
economic
class
Higher managerial and
professional occupations
(%)
16.3 28.2 28.8 22.2 25.2 23.3 29.1
Lower managerial
occupations
37.8 38.7 38.1 45.4 33 38.3 34.8
Intermediate occupations 11.2 10.2 8.1 10.2 3.9 12.2 9.9
Small employers and own
account workers
3.9 6 5.6 3.7 5.8 4.5 7.8
Lower supervisory and
technical occupations
5.2 4.5 4.4 4.6 3.9 5.6 4.3
Semi-routine occupations 9.4 3.4 8.1 3.7 12.6 5.2 5
Routine occupations 6 2.3 0.6 3.7 5.8 2.1 2.8
Unclassified 10.3 6.8 6.3 6.5 9.7 8.7 6.4
TOTAL (number) 233 266 160 108 103 287 141
Density Low (0-30dph) % - - - 63 64.1 28.9 2.1
Medium (31-50dph) - - - 37 34 50.5 27.7
High (51 and over dph) - - - 0 1.9 20.6 70.2
TOTAL (number) - - - 108 103 287 141
Dwelling
type
Detached or detached-link
house or bungalow
30.9 15.5 0 - - - -
Semi-detached 30 13.5 1.3 - - - -
terrace 37.7 56 36.9 - - - -
flat 1.4 15.1 61.9 - - - -
TOTAL (number) 220 259 160 - - - -
Front
feature
Buildings (%) 0.9 1.5 0.6 0.9 1.9 1.4 0
Gardens 2.7 0 0 1.9 0 1 0.7
communal space 11.7 29.9 0 10.3 17.5 20.6 11.3
public open space 74 57.1 74.4 70.1 70.9 67.9 60.3
Public open green space 9.4 11.5 23.1 94.1 9.7 8 27.7
Schools & grounds - - - 1.9 0 11 0
TOTAL (number) 223 261 160 107 103 287 141
Rear
Feature
Buildings (%) 11.2 8.8 3.8 11.1 9.7 10.1 1.4

16
Gardens 61.6 37.5 1.3 59.3 51.5 38.7 6.4
communal space 10.3 18.4 76.9 13.9 13.6 24 67.4
public open space 4.9 13.4 0 5.6 3.9 8.4 7.1
Public open green space 4 13.8 11.3 3.7 12.6 10.1 11.3
Fields 1.8 4.2 0 2.8 0 4.2 0
industrial/commercial 0.9 2.7 6.9 0.9 0 3.5 6.4
schools & grounds 5.4 1.1 0 2.8 8.7 1 0
TOTAL (number) 224 261 160 108 103 287 141
No. of
bedrooms
1 bedroom (%) 3.1 3.8 25.3 1.9 6 0 35.3
2 bedrooms 26.9 19.5 51.3 0.9 28 26.7 59
3 bedrooms 30.4 30.9 17.7 25.9 28 38.1 4.3
4 bedrooms 31.7 42.7 5.1 54.6 36 32.7 1.4
5+ bedrooms 7.9 3.1 0.6 16.7 2 2.5 0
TOTAL (number) 227 262 158 108 100 281 139
Table 4: results of cross-tabulation analyses for density and dwelling type 1
2
Results – responses to privacy questions 3
The regression analysis is based on the responses to questions about 4
overlooking and noise in the living areas of the home and POS's. Five point likert 5
scales were used and table 3 shows the responses. The majority of people were very 6
uncomfortable or uncomfortable with the level of overlooking of the living area of 7
their home. In comparison the majority of people were comfortable or very 8
comfortable with the level of overlooking of their POS. The frequency with which 9
people could hear their neighbours was consistent for being in the home and for being 10
in the POS. The majority of respondents said they could hear their neighbours either 11
‘quite often’ or ‘hardly ever.’ 12
13
Level of Comfort with overlooking/ Frequency noise from neighbours is heard
Variable Very
comfortable
(%)
Comfortable
(%)
Neither
comfortable or
uncomfortable
(%)
Uncomfortable
(%)
Very
uncomfortable
(%)
View into
living area 7.8 18.6 15.7 34.2 23.7
View into POS 22.3 39.8 18.0 12.7 7.2
Not at all (%) Hardly ever
(%)
Quite often (%) Much of the time
(%)
Constantly (%)
Noise heard in
the home 9.4 49.7 25.2 11.0 4.7
Noise heard in
POS 7.5 46.1 29.6 10.6 6.2
Table 3: Summary of the responses to questions regarding privacy 14
Results – comfort with view into living area 15
Three variables have a significant effect on residents’ levels of comfort with 16
the view into the living area. The results show that as the size of the POS to the front 17

17
of a dwelling increases the respondents are slightly less comfortable with the view 1
into the living area of their home (table 4). The higher the number of bedrooms in the 2
dwelling the less comfortable the respondents are with the view into the living area of 3
their home. The third variable that has a significant impact on levels of comfort with 4
the view into the living area is the gender of the respondent. Females are slightly more 5
comfortable with the view into the living area of their dwellings than males are. The 6
model only explains 5.3% of the variance in the level of comfort with the view into 7
the living area. 8
9
Unstandardised
Coefficient
Standardised Coefficient
Beta
Collinearity Statistics
Predictor Variables B SE Significance Tolerance VIF
Constant 3.096 .153 .000
size of POS to front -.003 .001 -.096 .017 .983 1.017
number of bedrooms -.216 .046 -.188 .000 .980 1.021
gender .237 .103 .092 .022 .990 1.010
N = 607 R = .231, R2 = .053, adjusted R
2 = .049 10
Table 4: Comfort with view into living area 11
12
Results – comfort with view into POS 13
The second analysis identified which sustainable design features and socio-14
economic data had a significant impact on resident’s level of comfort with the view 15
into their POS (table 5). The three features included in the model account for 6.8% of 16
the variance in residents’ comfort. As the number of bedrooms in a dwelling increases 17
so the respondent’s comfort with the view into the private open space of the dwelling 18
increases by a small proportion. Tenure, particularly various forms of renting, has a 19
significant influence on the levels of comfort with the view into the POS. Compared 20
to respondents who own their homes outright, respondents who rent from Registered 21
Social Landlords, private landlords or have a part rent/part mortgage tend to be less 22
comfortable with the view into their POS, whereas those who live for free (they do 23
not pay rent nor do they own the property) are more comfortable with the view into 24
their POS. Living in a development for more than two years had a negative impact on 25
the level of comfort with the views into the POS. 26
Unstandardised
Coefficient
Standardised Coefficient
Beta
Collinearity Statistics

18
Predictor Variables B SE Significance Tolerance VIF
Constant 3.649 .225 .000
number of bedrooms .122 .054 .105 .023 .838 1.193
rent/mortgage -.698 .271 -.124 .010 .776 1.289
rent private landlord -.548 .201 -.158 .007 .541 1.850
rent RSL -.422 .186 -.131 .024 .543 1.840
no rent .842 .427 .088 .049 .910 1.099
Length of time -.310 .115 -.130 .007 .783 1.277
N = 525 R = .261, R2 = .068, adjusted R
2 = .054 1
Table 5: Comfort with view into POS 2
3
Results – frequency neighbour noise is heard in the home 4
The relationship between the frequency with which neighbours’ noise is heard 5
in the home and the sustainable design features and socio-economic data was 6
analysed. 15.6% of the variance in the frequency with which neighbour noise is heard 7
in the home was explained by the three variables included in the final model (table 6). 8
The distance between the front of the dwelling and the dwelling facing has a very 9
small but negative impact on the frequency neighbour noise is heard in the home. An 10
increase in the distance leads to an increase in the frequency with which respondents 11
can hear their neighbours. Living in a detached-linked or a detached dwelling reduces 12
the frequency with which respondents hear their neighbours. As with the previous 13
model, tenure has a substantial effect. Renting from an RSL or part renting/part 14
mortgaging means that respondents hear their neighbours more frequently than if they 15
do not rent. Being retired, either as a couple or single, has a positive effect; 16
respondents hear their neighbour’s noise less often than those who are not retired. 17
Respondents who have lived in the development for more than two years are likely to 18
hear their neighbour’s noise in the home more often than those who have lived in the 19
development for less than two years. 20
Unstandardised
Coefficient
Standardised Coefficient
Beta
Collinearity Statistics
Predictor Variables B SE Significance Tolerance VIF
(Constant) 3.927 .160 .000
distance from dwelling
to dwelling to front
-2.40E-
005 .000 -.125 .002 .841 1.189
detached linked .515 .206 .105 .012 .786 1.273
detached .366 .145 .128 .012 .535 1.869
rent/mortgage -.446 .207 -.094 .032 .718 1.393
rent RSL -.520 .142 -.196 .000 .481 2.079
retired, no dependents .366 .160 .101 .022 .705 1.418
single, retired .560 .206 .114 .007 .781 1.280

19
Length of time -.283 .084 -.145 .001 .733 1.365
N = 633, R = .395, R2 = .156, adjusted R
2 = .131 1
Table 6: Frequency neighbour noise is heard in the home 2
3
Results – frequency neighbour noise is heard in the POS 4
Table 7 shows the results for influences on the frequency neighbour noise is 5
heard in the POS. Renting from an RSL increases the frequency neighbour noise is 6
heard outside whereas being single and retired reduces the frequency with which 7
respondents can hear their neighbours. Respondents who have lived in the 8
development for more than two years hear their neighbour in the POS less often than 9
those who have lived in the development for less than two years. The model explains 10
11.2% of the variance in the frequency neighbour noise is heard. 11
Unstandardised
Coefficient
Standardised Coefficient
Beta
Collinearity Statistics
Predictor Variables B SE Significance Tolerance VIF
Constant 3.726 .137 .000
rent RSL -.425 .145 -.160 .004 .529 1.892
single, retired .565 .216 .117 .009 .787 1.271
Length of time -.273 .091 -.136 .003 .773 1.293
N = 574, R = .334, R2 = .112, adjusted R
2 = .091 12
Table 7: Frequency neighbour noise is heard in POS 13
14
Discussion – design features 15
The findings from the analyses suggest that density has an effect on privacy in 16
the home, in terms of overlooking and noise disturbance. The size of the POS to the 17
front of a dwelling had a negative impact on the levels of comfort with the view into 18
the living area. It may be that residents in bigger dwellings, with bigger plots, 19
anticipate more privacy from overlooking than those who live in smaller homes. This 20
expectation may also be reflected in the negative influence the number of bedrooms 21
has on levels of comfort with the view into the living area. In contrast, the number of 22
bedrooms had a positive influence on levels of comfort with the view into the POS. 23
Residents in larger dwellings may have a more secluded POS due to being shielded 24
by their own, and adjacent, larger dwellings. 25
The frequency with which respondents could hear neighbour noise in their 26
homes was affected by the distance to the nearest dwelling to the front of their 27
residence and whether their dwelling was detached or not. The higher the distance 28

20
between the dwellings the more frequently respondents could hear noise from their 1
neighbours. An increase in distances at the front of dwellings may not mean an 2
increase in distances between the rear, or sides, of dwellings, therefore residents may 3
be in closer proximity to some of their neighbours, particularly in blocks of flats. 4
Living in a detached dwelling meant respondents heard their neighbours less often 5
than those who do not. The space afforded detached dwellings seems to provide a 6
sufficient barrier to noise. 7
8
Discussion – socio-economic features 9
Although not a design feature, tenure impacted on noise and overlooking. In 10
particular, respondents who rented their properties tended to be less comfortable with 11
the views into their living areas and POS’s, and more likely to hear noise from their 12
neighbours more often. This finding is not a result of bias in the sample, as the 13
majority of all respondents live in flats or terraced housing, i.e. there is no difference 14
between housing types in different tenures in the survey. Retired respondents also 15
tend to be less aware of the noise made by their neighbours. This may be because they 16
are grouped together in social housing or choose to live in areas with other older 17
residents. 18
19
Conclusion 20
The aim of the Privacy Study was to investigate the impact of ‘compact city’ 21
policies, in terms of design features, on privacy in the home. The features of ‘compact 22
city’ policy under scrutiny were higher densities, mixed-use development and location 23
(whether sites were urban or rural and greenfield or brownfield). The location of a 24
development had no implications for perceptions of overlooking and noise in the 25
home. It might be expected that siting homes adjacent to facilities or amenities would 26
have had an impact on privacy in the home, however, there was no indication of any 27
effect. However, some design features related to higher densities did have an impact 28
on perceptions of overlooking and noise. The influential design features are: 29
the area of the POS to the front of a dwelling; 30
the distance from the front of the dwelling to the street; 31
the number of bedrooms in a dwelling; 32
detached housing. 33
34

21
It is important to emphasise that the focus of the Privacy Study is the impact of 1
design features. Other factors are likely to influence residents’ privacy and it is 2
important to bear these in mind. Construction quality could impact on privacy, 3
particularly if insufficient insulation is used in terraced housing and flats. Factors 4
relating to the residents rather than the buildings are also likely to be influential; the 5
personal characteristics of individuals may account for their tolerance of visual and 6
acoustical intrusion not the design of the built environment. 7
However, it may be of benefit to individuals if future housing developments 8
were designed with some consideration for the results of this study. The likelihood of 9
new developments only containing detached homes with a large number of bedrooms 10
is very low. However there may be ways, through the use of good design, of creating 11
developments of terraced and semi-detached homes with the levels of privacy 12
associated with large detached homes. The space to the front of the dwellings and the 13
relationship between the dwelling and the street would have to be considered carefully 14
to ensure that these did not impair the residents’ perceptions of privacy. For example, 15
ensuring that high density developments dwellings are laid out in a way that 16
minimises overlooking without jeopardising the level of active frontages on streets. 17
These considerations for privacy would need to be balanced with the environmental, 18
economic and social sustainability goals of ‘compact city’ policy. In particular, 19
privacy in the home may have an important relationship with social sustainability that 20
would be worthy of further investigation. 21
22
References 23
24
Allan, G. (1989) Insiders and outsiders: Boundaries around the home. G. Allan and G. 25
Crow Home and family: Creating the domestic sphere. Basingstoke: Palgrave: 26
141-158. 27
Altman, I. (1975) The environment and social behavior: Privacy, personal space, 28
territory, crowding. Monterey, Ca.: Brooks/Cole. 29
Ariès, P. (1962) Centuries of childhood: A social history of family life. New York: 30
Vintage. 31
Barton, H., Ed. (2000) Sustainable communities: The potential for eco-32
neighbourhoods. London: Earthscan Publications Ltd. 33
Bhatti, M. and A. Church (2004) Home, the culture of nature and meanings of gardens 34
in late modernity. Housing Studies, 19,(1): 37-51. 35
BRE (2004). Ecohomes – the environmental rating for homes: The guidance - 2005. 36
Watford: BRE. 37

22
Breheny, M. (1996) Centrists, decentrists and compromisers: Views on the future of 1
urban form. M. Jenks, E. Burton and K. Williams The compact city: A 2
sustainable urban form? London: E & FN Spon: 13-35. 3
Burton, E., S. Weich, M. Blanchard and M. Prince (2005) Measuring physical 4
characteristics of housing: The built environment site survey checklist (bessc). 5
Environment and Planning B-Planning & Design, 32: 265-280. 6
Coulthard, M., A. Walker and A. Morgan (2002). People's perceptions of their 7
neighbourhood and community involvement: Results from the social capital 8
module of the general household survey 2000. London: Office for National 9
Statistics. 10
Crawley Borough Council (2008). Standards for private outdoor space: 11
Supplementary planning guidance: Note 4. P. a. E. S. Department: Crawley 12
Borough Council. 13
Day, L. L. (2000) Choosing a house: The relationship between dwelling type, 14
perception of privacy, and residential satisfaction. Journal of Planning 15
Education and Research, 19,(3): 265-275. 16
DCLG (2006). Planning policy statement 3 (pps3): Housing. London: The Stationery 17
Office. 18
DCLG (2007). Homes for the future: More affordable, more sustainable. Department 19
for Communities and Local Government. London: HMSO. 20
DCLG (2009). Land use change statistics (england) 2008 - provisional estimates (may 21
2009). Department for Communities and Local Government. 22
Dempsey, N. (2007). The influence of the quality of the built environment on social 23
cohesion in english neighbourhoods: Oxford Brookes University. PhD thesis. 24
DETR (1998). Planning for sustainable development: Towards better practice. 25
London: HMSO. 26
DETR (2000). Our towns and cities: The future: Delivering an urban renaissance. 27
London: The Stationery Office. 28
DTLR and CABE (2001). Better places to live by design: A companion guide to 29
ppg3. London: DTLR,. 30
Egan, S. J. (2004). The egan review: Skills for sustainable communities. London: 31
Office for the Deputy Prime Minister. 32
Evans, G. W., M. N. Palsane, S. J. Lepore and J. Martin (1989) Residential density 33
and psychological health: The mediating effects of social support. Journal of 34
Personality and Social Psychology, 57,(6): 994-999. 35
Gillham, O. (2002) The limitless city: A primer on the urban sprawl debate. 36
Washington, D.C.: Island Press. 37
Goffman, E. (1959) The presentation of self in everyday life. New York: Anchor 38
Books. 39
Goffman, E. (1961) Asylums: Essays on the social situation of mental patients and 40
other inmates. New York: Anchor Books. 41
Groves, R., A. Middleton, A. Murie and K. Broughton (2003) Neighbourhoods that 42
work : A study of the bournville estate, birmingham. Bristol: Policy Press. 43
Hall, P. (2001) Sustainable cities or town cramming? A. Layard, S. Davoudi and S. 44
Batty Planning for a sustainable future. London: Spon: 101-114. 45
Hall, T. (2006) A plea for front gardens. Urban Design (97): 14-15. 46
Halpern, D. (1995) Mental health and the built environment: More than bricks and 47
mortar? London: Taylor & Francis. 48
HATC (2006). Housing space standards: A report by hatc limited for the greater 49
london authority. London: Greater London Authority. 50

23
Haughton, G. and C. Hunter (2003) Sustainable cities. London: Routledge. 1
HM Treasury (2006). Barker review of land use planning: Final report - 2
recommendations. London: HM Treasury. 3
House Builders Federation (2006). New home customer satisfaction: Hbf national 4
new home customer satisfaction survey. London: House Builders Federation. 5
House Builders Federation (2009). New home customer satisfaction: Hbf national 6
new home customer satisfaction survey. London: House Builders Federation. 7
Housing Corporation (2000). Housing quality indicators form (version 2). 8
Howley, P., M. Scott and D. Redmond (2009) Sustainability versus liveability: An 9
investigation of neighbourhood satisfaction. Journal of Environmental 10
Planning and Management, 52,(6): 847-864. 11
Jacobs, J. (1961) The death and life of great american cities. New York: Random 12
House. 13
Jenks, M., E. Burton and K. Williams, Eds. (1996) The compact city: A sustainable 14
urban form? London: E & FN Spon. 15
Llewelyn-Davies (2000) Urban design compendium. London: English Partnerships. 16
Madanipour, A. (2003) Public and private spaces of the city. London: Routledge. 17
Marshall, N., J. (1972) Privacy and environment. Human Ecology, 1,(2): 93-110. 18
Marshall, N., J. (1974) Dimensions of privacy preferences. Multivariate Behavioral 19
Research, 9: 255-271. 20
Mulholland, H. (2003). Perceptions of privacy and density in housing. London: 21
Mulholland Research and Consulting: 67. 22
Neuman, M. (2005) The compact city fallacy. Journal of Planning Education and 23
Research, 25,(1): 11-26. 24
Newman, O. (1972) Defensible space: Crime prevention through urban design. New 25
York: MacMillan. 26
ODPM (2005). Sustainable communities: Homes for all. London: ODPM,. 27
Pedersen, D., M. (1979) Dimensions of privacy. Perceptual and Motor Skills, 48: 28
1291-1297. 29
Ross, K., P. Cartwright and O. Novakovic (2006). A guide to modern methods of 30
construction. Amersham: National House Building Council. 31
Rudlin, D. and N. Falk (1999) Building the 21st century home: The sustainable urban 32
neighbourhood. Oxford: Architectural Press. 33
Sherlock, H. (1991) Cities are good for us: The case for close-knit communities, local 34
shops and public transport. London: Paladin (an imprint of HarperCollins 35
Publishers). 36
Stokoe, E. H. and J. Wallwork (2003) Space invaders: The moral-spatial order in 37
neighbour dispute discourse. British Journal of Social Psychology, 42,(4): 38
551-569. 39
Urban Task Force (1999) Towards an urban renaissance. London: E & FN Spon. 40
Weintraub, J. (1997) The theory and politics of the public/private distinction. J. 41
Weintraub and K. Kumar Public and private in thought and practice: 42
Perspectives on a grand dichotomy. Chicago: University of Chicago Press. 43
Westin, A. F. (1967) Privacy and freedom. New York: Atheneum. 44
Whitehead, C. (2008) The density debate: A personal view. London: East Thames 45
Housing Group. 46
Williams, K. (2009) Space per person in the uk: A review of densities, trends, 47
experiences and optimum levels. Land Use Policy, 26: 83-92. 48
Williams, K. and M. Lindsay (2007) The extent and nature of sustainable building in 49
england: An analysis of progress. Planning Theory & Practice, 8,(1): 31-49. 50

24
1
2