Embed Size (px)
Citation preview
Is there a relationship between the NBT, NSC and first year performance in selected problematic service courses?
An analysis of the 2011, 2012 and 2013 first year cohorts.
15/11/02
1

Presentation outline
´ Objectives.
´ Background.
´ Methodology.
´ Results.
´ Discussion.
´ Conclusion.
´ Opportunities for future research.
15/11/02
2
Objectives
´ To assess the nature of the relationship between NBT/NSC performance and first year performance.
´ To develop regression models which predict course outcomes for students enrolled in the problematic service courses.
´ To recommend suggestions for improving the course outcomes in the problematic service courses.
15/11/02
3
Background
´ Previous academic performance is known to be the most significant predictor of University performance (Mckenzie and Schweitzer, 2010).
´ UCT uses NBTs and NSC results for selection and placement of students.
´ Not much attention has been paid to analysing the problematic service courses at UCT.
15/11/02
4

Methodology
´ Data analysis software packages used: ´ STATA 14.
´ MS Excel.
´ Statistical tests used: ´ Multiple linear regression.
´ Chi square test of association.
´ Box and Whisker plots.
´ Regression model diagnostics were done using the following: ´ Linktest.
´ Omitted Variable Test.
´ Residual Plots.
´ Variance Inflation Factors.
15/11/02
5

Results: Data description
´ 38 courses with consistently poor pass rates across 2011, 2012 and 2013 academic years were selected for the study.
´ 29067 student final course marks from 38 courses.
´ Of the 38 courses, 1 course with the highest number of students per faculty was selected for regression analysis.
15/11/02
6

Results: Scatter Plot: NSC Aggregate and Course Mark
15/11/02
7
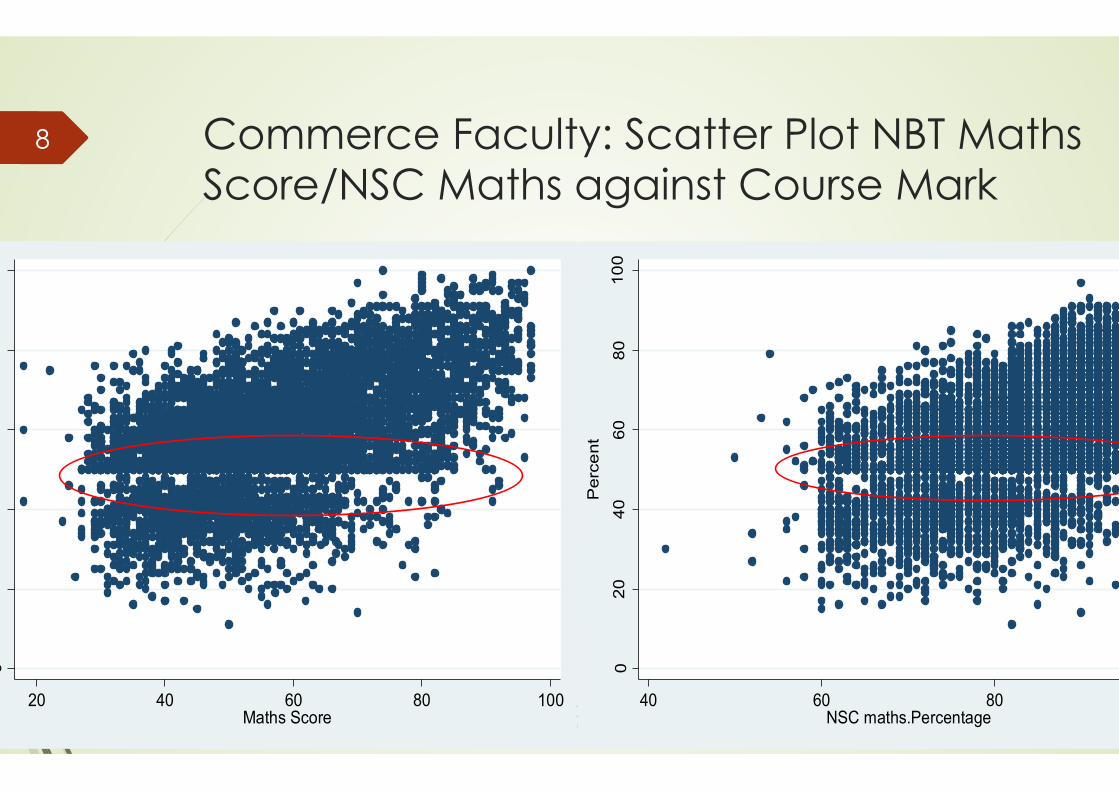
Commerce Faculty: Scatter Plot NBT Maths Score/NSC Maths against Course Mark
020
4060
8010
0P
erce
nt
20 40 60 80 100Maths Score
15/11/02
8
020
4060
8010
0P
erce
nt
40 60 80 100NSC maths.Percentage

Results: Overall Performance by Population Group (Using the median and std deviation)
15/11/02
9
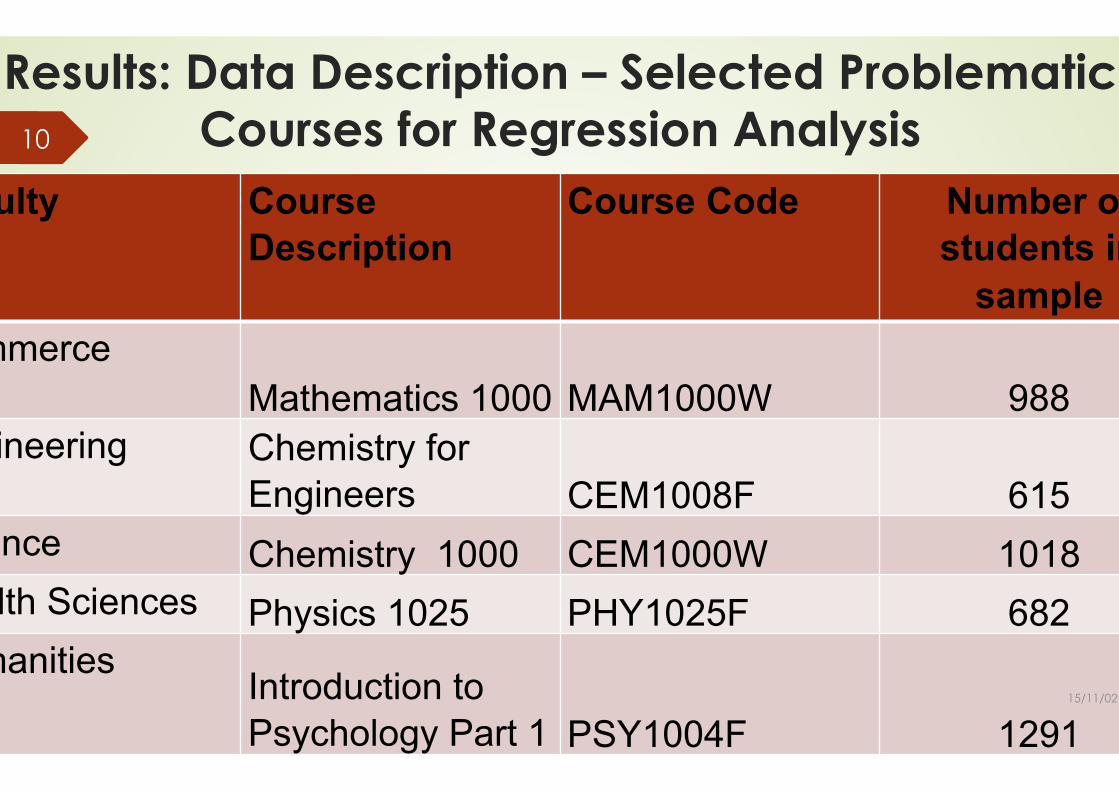
Results: Data Description – Selected Problematic Courses for Regression Analysis
Faculty Course Description
Course Code Number of students in
sample Commerce
Mathematics 1000 MAM1000W 988 Engineering Chemistry for
Engineers CEM1008F 615 Science Chemistry 1000 CEM1000W 1018 Health Sciences Physics 1025 PHY1025F 682 Humanities
Introduction to Psychology Part 1 PSY1004F 1291
15/11/02
10

Regression Models: Variables Used Variable Description
Alscore NBT Academic Literacy Score.
Qlscore NBT Quantitative Literacy Score.
Mathsscore NBT Mathematics Literacy Score.
NSC maths National Senior Certificate Mathematics Score.
NSC English National Senior Certificate English Score.
Aggregate National Senior Certificate Score.
Regfac Faculty of registration.
Population group
Population group e.g. Black, White, Indian, Coloured, Chinese, Unknown/Not Applicable (International).
15/11/02
11

Regression Model Output
Faculty All Faculties
Commerce Engineering
Science Health Humanities
Models Model 1 MAM1000W
CEM1008F CEM1000W PHY1025F PSY1004F
Observations 23,086 812 525 599 644 310
Adjusted R-squared
0.294 0.453 0.342 0.434 0.552 0.441
15/11/02
12
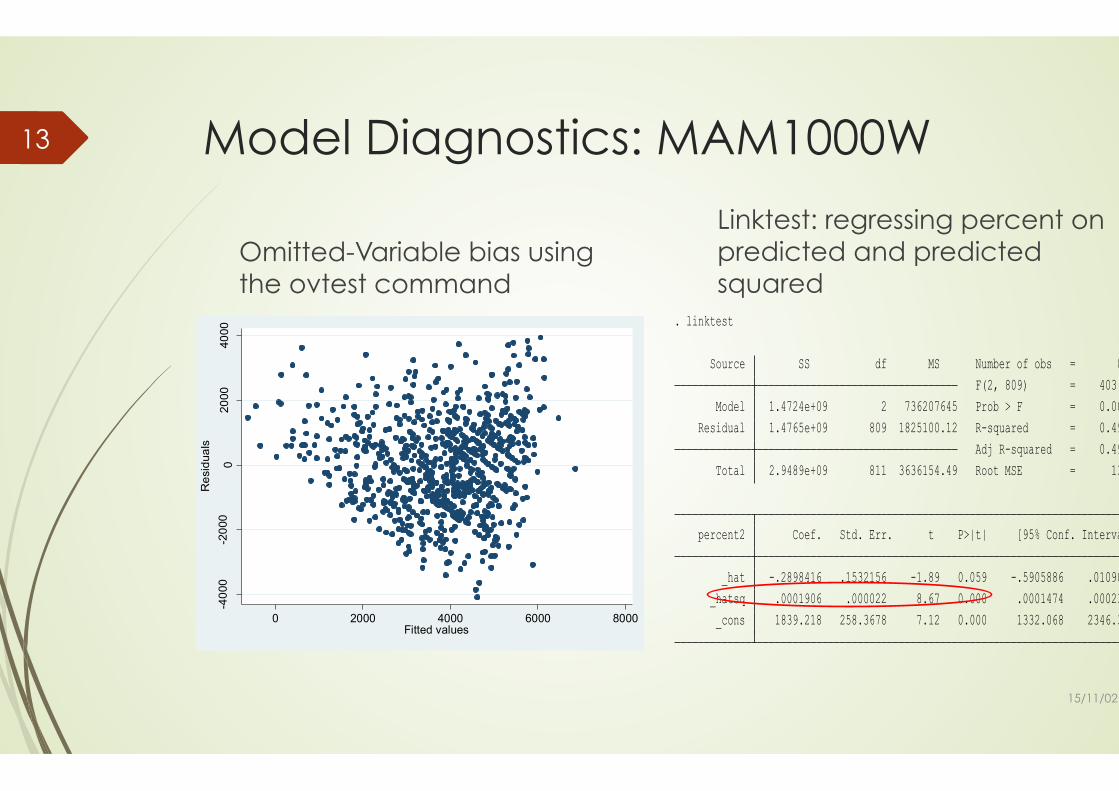
Model Diagnostics: MAM1000W
Omitted-Variable bias using the ovtest command
-400
0-2
000
020
0040
00
Res
idua
ls
0 2000 4000 6000 8000Fitted values
Linktest: regressing percent on predicted and predicted squared
_cons 1839.218 258.3678 7.12 0.000 1332.068 2346.368 _hatsq .0001906 .000022 8.67 0.000 .0001474 .0002337 _hat -.2898416 .1532156 -1.89 0.059 -.5905886 .0109054 percent2 Coef. Std. Err. t P>|t| [95% Conf. Interval]
Total 2.9489e+09 811 3636154.49 Root MSE = 1351 Adj R-squared = 0.4981 Residual 1.4765e+09 809 1825100.12 R-squared = 0.4993 Model 1.4724e+09 2 736207645 Prob > F = 0.0000 F(2, 809) = 403.38 Source SS df MS Number of obs = 812
. linktest
15/11/02
13

Regression Model Output
´ Mathematics 1000 (MAM1000W), Chemistry for Engineers (CEM1008F) and Chemistry (CEM1000W) models showed that NBT Mathematics, NSC Mathematics and the NSC Aggregate have statistically significant positive relationships with the course mark (p<0.01).
´ Physics 1025 model showed that Quantitative Literacy, NBT Mathematics, NSC Mathematics and the NSC Aggregate have statistically significant positive relationships with the course exam mark (p<0.01).
´ Intro to Psychology Part 1 (PSY1004F) regression model showed that NSC English and NSC Aggregate Score had statistically significant positive relationships (p<0.01) with the course outcome.
´ NSC Aggregate showed a statistically positive relationship for all 5 courses assessed.
15/11/02
14

Results: Predicted Course Marks for MAM1000W
020
4060
80
20 40 60 80 100Maths Score
course_mark Fitted values
Taking 55% as the significant pass mark, the predicted exam mark from the MAM1000W regression model showed that students with an NBT maths score of less than 65% are more likely to fail.
15/11/02
15
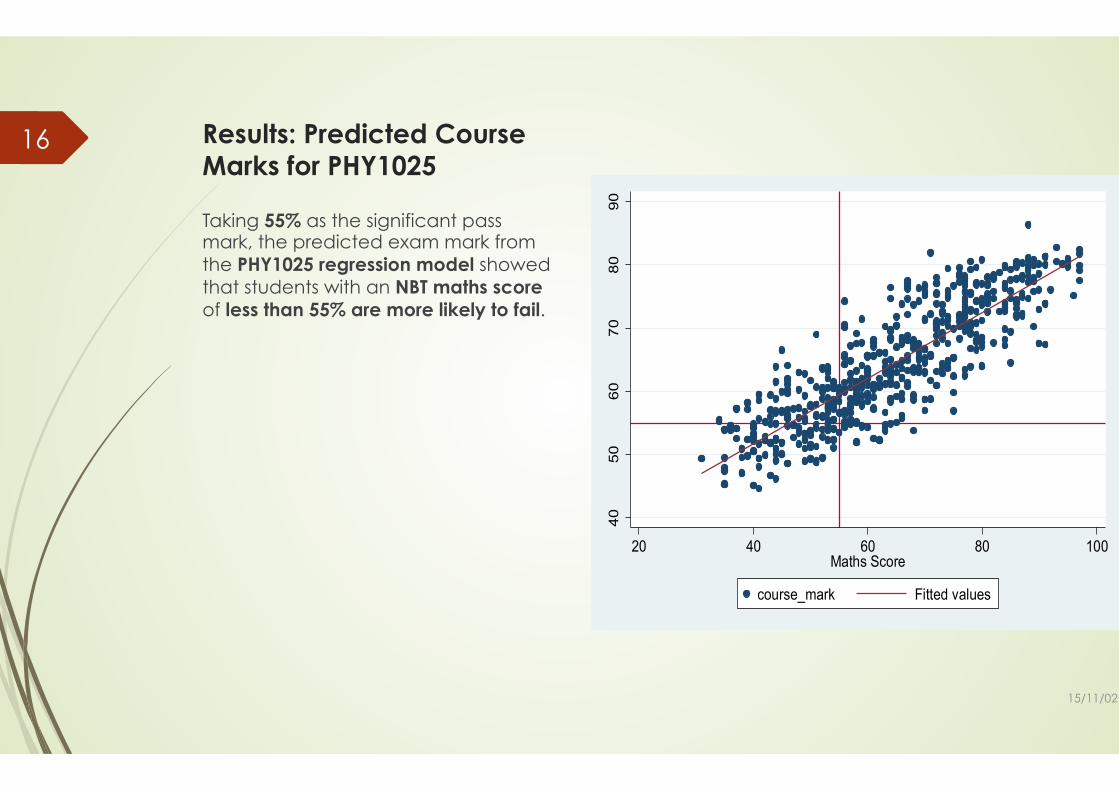
Results: Predicted Course Marks for PHY1025
4050
6070
8090
20 40 60 80 100Maths Score
course_mark Fitted values
Taking 55% as the significant pass mark, the predicted exam mark from the PHY1025 regression model showed that students with an NBT maths score of less than 55% are more likely to fail.
15/11/02
16

Results: Predicted Course Marks for CEM1008F
Taking 55% as the significant pass mark, the predicted exam mark from the CEM1008F regression model showed that students with an NBT maths score of less than 60% are more likely to fail.
15/11/02
17
3040
5060
7080
20 40 60 80 100Maths Score
course_mark Fitted values

Results: Predicted Course Marks for PSY1004F
Taking 55% as the significant pass mark, the predicted exam mark from the PSY1004F regression model showed that students with an NBT AL score of less than 60% are more likely to fail.
15/11/02
18
4050
6070
80
20 40 60 80 100AL Score
course_mark Fitted values

Results: Predicted Course Marks for CEM1000W
Taking 55% as the significant pass mark, the predicted exam mark from the CEM1000W regression model showed that students with an NBT maths score of less than 50% are more likely to fail.
15/11/02
19
4050
6070
80
20 40 60 80 100Maths Score
course_mark Fitted values
Discussion
´ NBT Maths and NSC Maths are important predictors of performance in problematic in Commerce, Science and Engineering Faculty service courses.
´ Students with less than 60% (or NBT proficiency level) in NBT/ NSC maths should be discouraged from taking these challenging courses.
´ Regression models could explain about 40% of the variation in course mark suggesting that other social variables needed in all the models.
15/11/02
20

Conclusion
´ There is a strong relationship between NBT, NSC and First year performance in problematic courses.
´ Performance in NBT Mathematics and NSC Mathematics is a useful predictor of first year performance in selected quantitative service courses.
´ Additional social variables such as integration into university, self-efficacy, and employment responsibilities need to be investigated to broaden the understanding of student performance in problematics courses.
´ Students with poor NBT and NSC scores should be encouraged to enrol in foundation extended degree programmes and/or slower paced versions of courses such as Mathematics 1.
15/11/02
21

Areas for further research
´ Include social variables such as integration into university, self-efficacy, and employment responsibilities.
´ Use a short survey or focus group discussion with students in theses courses.
´ Course combinations for students doing these problematic courses need to be investigated to see if they have an effect on the performance trends observed.
´ Curriculum review.
15/11/02
22

The End Questions
15/11/02
23