Embed Size (px)
Citation preview

Page i
Is there a correlation between the CEO compensation
and the firm wealth after the financial crisis of 2007?
Empirical Evidence from the Stock exchange index CAC 40 (2008-2010)
Authors: Mathieu Angibaud
Jérémy Buan
Supervisor: Janne Äijö
Student
Umeå School of Business Spring Semester 2012
Master Thesis, One-Year, 15 hp

Page ii
Acknowledgements
We would like to express our gratitude to all the people who contributed to the realization
of this research. Firstly, we would like to thank our families and friends for their support
and encouragement during all the process of writing this paper. Secondly, we would like to
thank our supervisor Janne Äijö from the University of Vaasa in Finland, who guided us
through this thesis. The achievement of this paper would not have been possible without his
expertise and precious advice. Finally, we are thankful for all the support and knowledge
we get from the University of Umeå and especially Umeå School of Business and
Economics.
Mathieu Angibaud
Jérémy Buan

Page iii
Abstract
Date 28-May-2012
Authors: Mathieu Angibaud
Jérémy Buan
Degree/Education: Master Thesis in Finance
Supervisor: Janne Äijö
Title: Is there a correlation between the CEO compensation and the firm wealth after the
financial crisis of 2007? Empirical Evidence from the Stock exchange index CAC 40
(2008-2010)
Problem: Do CEO compensation have an impact on the firm performance?
Purpose: To evaluate whether there is a link between remuneration of the CEOs from the
CAC 40 companies and the performance of their companies.
Method: Quantitative study, covering the CAC 40 index (40 companies) during the period
from 2008 until 2010. Empirical study leaded through a regression analysis of the data.
Conclusions:
The empirical results indicate a strong positive link between three important elements: the
duration as CEO, the market capitalization of the company and the non-executive
ownership. Our findings also indicate an important but negative impact of two variables on
the CEO compensation: the institutional and block holder shareholders. We also observed
that there is no CEO pay-performance elasticity for the Total and base salary: the control
variables do not have a significant impact on changes in CEO compensation.
These results are in line with the ones of Ozkan (2011, p. 260-285). Those elements would
demonstrate the active monitoring of these investors on the top management and especially
on their remuneration. Those are also consistent with the paper of Khan et al. (2002, p.
1078-1088), which demonstrates the negative impact on CEO compensation of institutional
ownerships when they are concentrated.
Our study didn’t find a strong correlation between the other variables as the board size or
sales for example and the level of remuneration of the CEO. That would mean that the
number of member of the board doesn’t significantly impact the discussion about the CEO
remuneration.
Key words: “CEO compensation”, “firm performance”, “France” and “CAC 40”
Total amount of pages: 64

Page iv
Table of Contents
ACKNOWLEDGEMENTS .............................................................................................................. II
ABSTRACT ..................................................................................................................................... III
LIST OF TABLES ........................................................................................................................... VI
LIST OF FIGURES ....................................................................................................................... VII
1. INTRODUCTION ..................................................................................................................... 1
1.1. Purpose of the study ....................................................................................................................... 2
1.2. Structure of the study ..................................................................................................................... 2
1.3. Limitations of the Study .................................................................................................................. 3
2. METHODOLOGY OF THE STUDY ...................................................................................... 4
2.1. Methodological assumptions .......................................................................................................... 5
2.2. Research Design .............................................................................................................................. 6
2.3. Research Strategy............................................................................................................................ 7
2.4. Specific data collection methods ..................................................................................................... 7
2.5. Quality Criteria ................................................................................................................................ 8
2.6. Ethical considerations ..................................................................................................................... 9
3. INSTITUTIONAL FRAMEWORK AND CEO COMPENSATION IN FRANCE .......... 11
3.1 Economic situation of France (2008-2010) ..................................................................................... 11
3.1.1. Gross Domestic Product ............................................................................................................. 11
3.1.2. The unemployment .................................................................................................................... 12
3.1.3. The inflation rate ........................................................................................................................ 12
3.1.4. The balance of trade ................................................................................................................... 13
3.1.5. The public debt ........................................................................................................................... 13
3.2 Details of the index CAC 40 ........................................................................................................... 14
3.3 Literature about CEO compensation in France .............................................................................. 16

Page v
3.4 Taxation of high-income in France ................................................................................................ 17
4. LITERATURE REVIEW ...................................................................................................... 19
4.1. Background for CEO compensation strategies ............................................................................... 19
4.2. Firm Performance.......................................................................................................................... 22
4.3. Relationship between CEO compensation and firm wealth ........................................................... 23
5. VARIABLES ........................................................................................................................... 27
5.1. Independent Variables .................................................................................................................. 27
5.1.1. Market Capitalization ................................................................................................................. 27
5.1.2. Sales ............................................................................................................................................ 28
5.1.3. Shareholders return .................................................................................................................... 28
5.2. Dependent Variables ..................................................................................................................... 28
5.2.1. Base salary .................................................................................................................................. 28
5.2.2. Bonuses ...................................................................................................................................... 29
5.2.3. Benefits in kind ........................................................................................................................... 29
5.3. Control Variables ........................................................................................................................... 29
5.3.1. Institutional investors ................................................................................................................. 29
5.3.2. Board of director characteristics ................................................................................................ 31
5.3.3. CEO age and horizon problem .................................................................................................... 33
6. DATA ...................................................................................................................................... 34
7. MODEL SPECIFICATION AND ESTIMATION ............................................................... 37
7.1. The relation between level of CEO compensation and firm performance ...................................... 37
7.2. CEO pay-performance elasticity .................................................................................................... 45
8. CONCLUSION ........................................................................................................................ 48
8.1. Research Question ........................................................................................................................ 49
8.2. Research Contribution ................................................................................................................... 50
8.3. Future Research Recommendation ............................................................................................... 50
REFERENCES ................................................................................................................................ 52

Page vi
List of Tables
Table 1: Inflation rate in France
Table 2: French Trade balance CIF-FOB
Table 3: Details of the CAC 40 index
Table 4: Descriptive statistics about the sample’s CEO compensation
Table 5: Descriptive statistics about the sample’s control variable
Table 6: Descriptive statistics about the sample’s other component
Table 7: Linear regression between CEO’s base compensation part and firm-specific
characteristics
Table 8: Ranking Comparison of some sample’s companies, part 1
Table 9: Linear regression between CEO’s bonus compensation part and firm-specific
characteristics
Table 10: Linear regression between CEO’s Total compensation part and firm-specific
characteristics
Table 11: Ranking Comparison of some sample’s companies, part 2
Table 12: Ranking Comparison of some sample’s companies, part 3
Table 13: Ranking Comparison of some sample’s companies, part 4
Table 14: CEO pay-performance elasticity for total direct compensation (Base salary)
Table 15: CEO pay-performance elasticity for total direct compensation (Total salary)

Page vii
List of Figures
Figure 1: quantitative study process
Figure 2: French GDP’s growth and its components
Figure 3: French unemployment rate
Figure 4: French governmental debt
Figure 5: the ratios of levy for the secondary revenues for the ten richest centiles in France
Figure 6: Income tax rate in France in 2009
Figure 7: The structure of American CEOs compensation
Figure 8: Median total compensation and cash compensation in the US ranked by deciles
Figure 9: ROA based compensation curve
Figure 10: ROA of American non-financial industries

Page 1
1. Introduction
All around the world, CEO compensation has always been a serious problematic. This
problematic becomes even more important in crisis time. Indeed, the remuneration of the
top management seems to be less flexible than the financial performance of the companies.
The amount of compensation for the CEO can be so scandalous and non-understandable for
the public.
The high level of the CEO wage can be easily understandable; according to Simon (1957,
p. 279) organizations have to keep differential levels of salary according to the different
management levels. This fact has a direct consequence: the more there are different
management levels the higher is the salary of the chief executive officer. Nowadays, with
the globalization, the multi-national companies have multiplied the number of
management’s levels. Moreover the study of Mahoney (1979, p. 349-375) shows that a
difference of two levels of management is equivalent to a difference of 30 or 40 in term of
salary. Thus, we can well understand the increasing difference of salary between a regular
employee and a chief executive officer.
However, for a CEO the wage is only a part of his income. The incentives, in several kinds
(bonus or stock option) are also an important part of the income of the chief executive
officer. These incentives are mandatory for a good matching between management and
shareholders’ interests. Indeed many studies showed, in particular the one by Berle and
Meane (1932), that even if the shareholders had legal control of a company, the real control
would be held by the management. So the incentives are the best way to align the interests
of top management and shareholders.
Capitalism is the doctrine that governs almost all countries in the world; it is a concept at
the same time economical, sociological and political. It is a system based on private
ownership, the means of production and the free movement of people and capital. This
doctrine has allowed a quick development of many countries around the world and has got
out of poverty millions of people. But in the same time, the inequalities have grown
considerably. Indeed, in 1985 the average ratio of CEO pay relative to the one of the
average employee was 40 to 1 in the US. According to research firm Equilar, the median
salary of a CEO of S&P 500 is $ 1.025 million, or 25 times the average pay of an
employee's private amounting to 40,174 dollars. Taking the total compensation, which
includes variable elements, stock options, etc.., they earn $ 7.5 million, 187 times the
average total compensation of an employee. In France the problem is the same; in 2009,
CEOs of the CAC 40 companies shared a total compensation of € 79.5 million, up 4% from
the previous year. In addition there are stock options and dividends and directors' fees in
large boards; the expansion reaches € 100 million euros in 2009, an average gain of € 2.5
million. It is 90 times the average French wage.
The recent scandals, like Enron or Worldcom, as well as the financial crisis of 2007 have
been an eye opener on the limits and on the drifts of the capitalism. The multi-million
bonuses for the traders and/or the top management were routine. It is in this logic, that the
movement of Indignados was born. It is the opposition of 99% of the population working
for survival and the 1% which is increasingly enriched.

Page 2
The main purpose is not to study the appropriateness of the CEOs remuneration but more to
at least verify if there is a link/correlation between the compensation of the CEO and the
performance/wealth of his company. Furthermore, even if the literature about this topic is
large, never this kind of study has been done in France.
1.1. Purpose of the study
This quantitative study examines the link and the correlation between the CEO salary and
the economic and financial performance of the firm he is responsible. This paper analyses
the main salary of the CEO but also the different incentives that can be set up in each
company in order to be sure of the entire involvement of the CEO (stock options, perks
etc…).
The empirical testing is carried out using the data of the French stock exchange index CAC
40 for the period from 2008 to 2010. This period is really interesting because all the
companies had to deal with a global recession and so had to define a new strategy to get
through the financial crisis. We don’t want to compare the results before and after the
crisis. We want to take a special event, a starting point and analyze the data after this date.
We decided to focus on this stock index because it’s composed of similar sized companies
(the index is composed of almost all the biggest French companies) but also because their
social status force those firms to publish annually the salary of their CEO.
The purpose of the research is not to compare the salary of the different Chief Executive
Officer, the ones with the others, but it is to estimate the CEOs annual compensation
(salary, bonus and the market value of stock and options…). We also analyze the economic
and financial performance of their companies and examine if there is a correlation between
these two elements. It is the main question of the research design which is a cross-sectional
one. We explain further in this paper the different required steps to conduct this kind of
study.
To conduct the analysis, we chose three different variables: Institutional investors, Board of
director characteristics and the CEO age. As we explain further in this paper, these three
variables are important in the remuneration of the CEOs in France. The data are collected in
the legal and annual publication of the CAC 40 and the correlation is revealed by statistic
software (SPSS) in order to be able to do some re-treatment (depending of the sector, size
of the company etc.) to have the most accurate data possible.
1.2. Structure of the study
For this paper we decided to follow the same structure as the one of Ozkan (2011, p. 260-
285). The Ozkan’s paper is a recent and serious study, which deals approximately the same
topic as ours in a different country (UK).

Page 3
Our paper contains two major parts: a theoretical and an empirical one. These two parts are
linked. Indeed the main purpose of the theoretical part is to sum up and explain the research
already done in this field until now, and so to explain the concept of management control,
salary, incentive and financial efficiency and company performance.
The first chapter provides general information about the subject and does an introduction
about the research issue. In the second chapter, we focus on methodology we used
throughout our paper. It defines the assumptions we took, the design we used, the strategy
followed, the method of data collection employed, the quality criteria to respect and the
ethical considerations we kept in mind to write our paper. France is a specific country; the
rules and taxation are quite unique in the world, that’s why we decided to focus the third
chapter on the “situation” of the French CEOs. The chapter number four, called the
literature review, highlights the different hypotheses, the different papers which deal about
this topic. This chapter is divided into three parts: The different CEO compensation
strategies, the literature about the firm performance and the relationship between CEO
remuneration and firm wealth.
To deal with a problematic it’s important to find accurate variables. We explain and define
the several variables we chose in the chapter number five. This chapter is split into three
parts: dependent variables, independent variables and control variables.
The second part is the empirical part of the paper. The data are presented in the chapter six.
The seventh chapter is called model specification and estimation; it shows the different
results and analyses we obtained with the data we collected. This chapter is split in two
parts: The relation between level of CEO compensation and firm performance and CEO
pay-performance elasticity. The last chapter is the global conclusion of our paper.
1.3. Limitations of the Study
The limitations of our paper are pretty clear. The amount of data used, we took the data
from the CAC 40 index from the period 2008-2010. Thus the sample size is limited. In
addition we used a quantitative approach of the problem. This approach doesn’t allow us to
understand the phenomenon but just to quantify it.
The principal variables we decided to use are based on the previous literature so our paper
is not really innovative on this point. The limited time, approximately two months, to write
this thesis, represents another main limitation. That didn’t allow us to go further, to widen
our scope/sample. That also didn’t permit us to make international comparisons which
could be interesting.
More generally, the very limited time, approximately two months, to produce this thesis,
represents as limitation in its own right and thus prevents us from broadening the scope of
the study further, such as for instance compare companies from two countries or similar
approaches.

Page 4
2. Methodology of the study
Our research design is based on a quantitative study; the graph below is summarizing the
different steps to take into consideration to fulfill all the requirements. We decided to
conduct a quantitative study because of plenty reasons. We wanted to quantify the
phenomenon and not enquiry on the reasons of this one, even if we consider that people
have a direct influence on this point. We needed to use measurements and data
quantifications in our paper. We also decided to use a deductive research approach; this
method is totally suitable with a quantitative study.
Figure 1: quantitative study process
Source: Bryman and Bell, 2011, p. 151
This description gives us the important lines to follow to be as precise/accurate as possible.
The 5 important and required steps are:
- Determine the research problem and hypotheses to be tested. The decision of
choosing this problematic is due to the actuality and the different debates about the
remuneration and the “over remuneration” of the CEOs of the biggest companies all
around the world. We decided to focus on the French market as a result of the lack
of literature about this topic in France. Many studies have been done on this topic,
especially in the US and in the UK, but none in France. These are the two main
reasons, the current problem and the lack of literature in France, why we decided to
study further this subject.

Page 5
- Select the variables to be used in the study. This step is also really important. Prima
facie, we took the same control variables as the paper of Ozkan (2011, p. 260-285)
namely the presence and the proportion of institutional investors, the characteristics
of the board of directors and the CEO age and tenure. The reason why we took the
same control variables is because they fit particularly well with the situation of
CEOs in France. We also fixed dependent and independent variables to support our
study.
- Collect the data. To collect the data we read all the annual reports for the 40
companies and took all the useful information we needed. We took as much
possible primary information. Indeed, a new regulation imposes to the companies to
publish the global remuneration of the CEOs and the main components. But we also
took much information from the website “Boursorama”. It’s a leading financial
portal in France which proposes much news, stock index analyses, the main
quotations etc… The data from this website are considered as reliable.
- Analyze the data. To analyze the data we used the software SPSS which is one of
the most used software in the world for the analysis of data. This software is easy to
use and allows many restatements. We thought it was the easiest and the quickest
way for us to analyze our data.
- Interpret the results. This is probably the most important part of the paper; it is
using the data collected and analyzed to put into perspective. With the data, the
interpretation leads us to draw conclusions and to link the paper to the existent
literature.
Another part of the paper not mentioned above is the study of the existent literature. In fact,
the study of the previous literature leaded us for the building of our paper. This also gave us
a lot of useful information, a lot of useful theories that we kept in mind in the redaction of
our study.
2.1. Methodological assumptions
The first component of the methodological assumption is the epistemological orientation.
The main question here is: do researchers consider that natural sciences can’t be analyzed
in a scientific way? There are two main currents of thought: positivism and interpretivism.
Positivist approach puts equal social sciences and natural sciences and so they have to be
analyzed with the same processes; data are quantified to prove or build theories. Searchers
collect data in accordance with the existing theories, with these data they develop and test
hypothesis. This process leads to the creation of new knowledge. Interpretivist approach is
the opposition of the previous one. Natural sciences methods can’t be used to interpret
social sciences actions because social sciences are based on human actions and not object.
The researchers who follow that approach tries to understand the subjective meaning of
social actions (Bryman and Bell, 2011, p. 15).

Page 6
After examining these two approaches, we decided to adopt a positivist one. The first
reason is that we used the previous theories about CEOs compensation and firm
performance. Then we collected data from the annual reports and from the website
Boursorama. These data can’t be influenced by any kind of social actors. Our hypothesis is
tested with data which leads to a credible building of knowledge. This method leads us to
natural science methods that correspond to a positivist approach.
The second component of the methodological assumption is the ontological orientation.
The main question here is: social phenomena are independent of humans or are they linked
to human activities? There are two main currents of thought: objectivism and
constructivism. Objectivist theory considers that all social phenomena are independent
from social actors, they can exist by themselves. Constructivist theory considers social
phenomena as totally influenced by human beings and they are in constant evolution due to
the changes of humans’ interactions. Each approach gets its own advantages and
disadvantages (Bryman and Bell, 2011, p. 20).
For our study, we chose the objectivist approach as an ontological consideration. The main
reason is CEO remuneration and firm performance are two independent elements and one
or several social actors can’t influence them. We don’t need subjective interpretation to
analyze these elements. In addition, our sample made of 40 listed French companies can’t
be changed / impacted by a single social actor. We want to discover the relations between
CEO compensation and firm performance since there are certain strategies (such as
incentives) that can have an impact on firm performance.
Therefore, there is a logical link between ontological and epistemological orientations.
Positivist approach, in most of the case, is linked to an objectivist orientation and vice
versa. That’s why in our paper we used objectivism because it best suits to the approach of
our problematic and positivism as explain above.
2.2. Research Design
There are 4 main types of research designs: case study, experimental, longitudinal and
cross-sectional design (Bryman and Bell, 2011, p. 35-58). Case study design leads to the
empirical study and analysis of a single case. Empirical design is generally used for natural
science researches but some searchers started to use it for social science researches. The
main goal of this design is to find links/relationships between variables by making many
experiments. This is more useful in “explanatory” research when someone tries to answer
the questions “how and why”. This is a design which requires many steps for data
collection which may take months. Bryman and Bell (2011, p. 35-58) precise that an
important element is to create two different groups, one is the experimental group and one
is the control group. The purpose of that is to compare the differences between these two
groups.
Longitudinal design purpose is to provide (casual) influences on phenomena and study the
changes on those phenomena. This design is not really used in business and management

Page 7
because it takes too much time and money. Cross-sectional design, the data are collected
and analyzed for several cases at a defined period of time. The purpose is to gather
quantitative and quantifiable data with several variables to detect patterns of association.
After studied these different kinds of research design, we thought that the cross-sectional
one was the most suitable to our study. The most decisive element in our choice was that
our thesis employs quantitative data and comparisons between variables and data collected
at a same period of time. A successful cross-sectional research gives researchers a clearer
picture of the important variables in a research topic: what is the problem, what to measure,
the conditions or contexts of occurrence that must be monitored.
2.3. Research Strategy
In research processes, there are two main approaches used by the searchers: deductive and
inductive. Each method has its own specificities and has to be used according of which kind
of results the searchers want to find. The logical strategy for our paper is the deductive one.
The deductive approach is the most used/common one. In this approach, theories and
hypotheses are the bases of the research and all the processes depend on them. Researchers
deduce hypotheses from the knowledge they get about a particular topic and the theoretical
considerations. Once hypotheses are well defined, they have to be tested and checked to
prove or not if they are working. There is a step, after the data collection and analysis,
where searchers perform a feedback of all the findings and realized surveys. That will lead
to a deductive hypothesis on the topic, different to the original one. The last step allows the
searchers to either confirm the primary made hypothesis or to amend it.
The second one is inductive approach which is quite different that the deductive one.
Inductive researches begin with the collection of observation and end with a general,
always applicable, laws. Theory is created as a product of the research and creates a new
vision of a scientific approach.
Our research topic is focusing on the link between CEO compensation and firm
performance. Our preliminary researches allowed us to find several different theories on the
topic. Our main goal was to confirm or invalidate these previous theories through a
quantitative research and try to highlight some important elements on the French market. In
this way, our paper follows a deductive approach and the final goal is to confirm or
invalidate the existing theories on this topic.
2.4. Specific data collection methods
The choice of the sample is really important because it has to be representative; it is one of
the major concerns for the searchers. We have already given some explanations on the

Page 8
reasons why we chose the CAC 40 index for the period 2008-2010. One of the reasons is
the easy access of the financial information. Indeed, the French regulations oblige the
companies listed in France, to publish an annual report with all, or almost, the data we
needed for our study, the financial results, the composition of the board of directors, the
structure of the ownership, the age and tenure of the CEO and his remuneration. All these
reports are available on internet, for free and in English. The main advantage of these data
is they are primary data.
The second main reason to choose this sample is the gap in the literature. Indeed, during
our researches we didn’t find another paper with the same topic as ours. There was plenty
about the US market or the UK but not even one for France.
The third reason is the similarity of the companies inside of the CAC 40. In fact, this index
gathers almost all the biggest French companies. Even, if some companies as Total have a
higher weight in the index than some smaller ones, the data are reliable. Thus, the
conclusions we reached were not biased by the difference of size.
We are aware that nor the sample is that large neither the period of the study but we
preferred to focus on companies we were sure to be able to obtain reliable data than on
smallest firms for which we would have to take more secondary data. We are sure that the
conclusions reached with this sample are trustworthy.
2.5. Quality Criteria
During the process of research, data collection is one of the fundamental steps in the
writing of an academic research. It is necessary for the searchers to be sure that the data
collected are suitable and reliable for the topic. That is one of the reasons why it is better to
use primary data instead of secondary ones. There are two main aspects that have to be
checked: the reliability of the survey and the repeatable of the survey. That means that if a
data collection is well done, is reliable, researchers could reproduce the study and find the
same results with the same tested sample.
For our study, these two elements are respected. Indeed, we used financial data, this kind of
data is really trustworthy because we can’t modify them, and it’s written in the reports. Our
sample is pretty clear and stable in the time. An error is possible of course, a miscalculation
for example, but with the utilization of the software: Excel and SPSS, this risk is highly
reduced. We also tried as much as possible to take primary information from the annual
reports or from the website of the companies to be sure there was no error in the data.
There are three important factors that have to be taken into consideration to verify if a
research process is reliable. The first element is the stability, searchers have to be sure that
the measures are stable, that means the results would be similar (or almost) if another
person wanted do the same survey in a similar situation. The second element is the internal
reliability that refers to the fact that all the indicators are related to each other. One way to
test this factor is to split the collected data into two groups, make the total value for each

Page 9
group and realize the correlation between both amounts. The third element to take into
consideration is the inter-observer consistency. Human beings are not always rational and
the possibility of making misunderstandings exists, searchers must find solution to reduce
the risk of inappropriate results. The first solution is used if the measurement made by
searchers is based on different categories. Thus, it can be checked by analyzing which
categories are the most chosen by raters. For example, if on a sample of 1,000 raters, 780
pick up a certain category; we can conclude that the inter-observer consistency is to 78%.
The second solution is to do a continuous measure between two raters. Searchers have to
check, every minute for example, the correlation between ratings of those two raters to
determine the closeness of the results and check the reliability in the results.
A searcher, who checks these three elements above, decreases significantly the risk of
reliability mistakes inside of his results. As we explained above we don’t have any problem
of stability because of the kind of data we collected. The data are stable in the time. For the
two other elements, they don’t apply to our paper. In a way to obtain useful results,
searchers have to check the validity of their surveys. We didn’t use this kind of data
collection so we don’t develop more this point.
2.6. Ethical considerations
According to Diener and Crandall (1978, p. 178-180), there are four main ethical issues for
a researcher to keep in mind:
- Whether there is harm to participants
- Whether there is a lack of informed consent
- Whether there is an invasion of privacy
- Whether deception is involved.
What is harm to participants? Diener and Crandall (1978, p. 178-180) define the different
facets of harm: physical harm; harm to participant’s development or self-esteem; stress;
harm to career prospects or future employment; and inducing subjects to perform
reprehensible acts.
Concerning our paper, this kind of nuisance is really limited. In fact, we conducted a
quantitative study with only publicly available data. We just put the data into perspective,
and may be that could harm few CEOs but the impact is really restricted. Another important
element is that we don’t make any comparison between the CEOs compensation. We just
want enquiry the relation/correlation of CEOs remuneration and firms’ wealth. In that way
no single CEO could feel targeted by our study. We don’t consider that our paper could
have an impact on the career prospects of any person, quote in this study.
What is lack of informed consent? To summarize the entire definition, it is given as much
information as possible to the prospective participants to give them the possibility to choose
to participate at the study or not.
Once again, we don’t have that problem in our paper. We don’t conduct any interview, we
just analyze financial data. The same analysis can be done by everybody with an internet

Page 10
connection. Thus, this paper will not create any problem of this kind. We don’t need any
consent to perform this study.
What is an invasion of privacy? This problem is linked to the degree to which invasions of
privacy can be condoned.
What is the deception involved? It’s the fact that the researchers present their study as
something different than what it really is.
For these two last elements there is no particular issue for our paper. In our quantitative
study, there is no invasion of privacy of any kind. We just took public available data and
we didn’t enquiry on the private life of any CEO. We think that the abstract and the title of
our study present well the work we did. We didn’t try to present in a different way that it
really is.
In our paper we also avoided plagiarism by making the right reference to the give honor to
the authors of the articles and books cited all along our work. We made also proper
quotations when we quoted a passage/chapter/definition from any book, article or website.
We followed the Harvard system recommendations for all the quotations made in this
paper. We mentioned all our sources in the reference list, with the correct reference. We
didn’t try to hide any kind of sources. We followed all the recommendations of our
supervisor and the Business School of the University of Umeå.
Another important issue is the problem of conflicts of interest. It is general accepted that
affiliation can have an indirect influence on the way that researches are leaded and the
results presented. We certify to not have any relationship of any kind whatsoever with one
or several companies quoted, directly or indirectly, in this paper.

Page 11
3. Institutional Framework and CEO compensation in France
3.1 Economic situation of France (2008-2010)
As of 2010, France is the fifth largest economy (behind the US, China, Japan and Germany)
by nominal figures and the ninth largest economy by Purchasing Power Parity (PPP)
figures. It’s the second largest economy in nominal figures in Europe behind Germany
which is also its main economic partner.
To well understand the economic situation of France during the period 2008-2010, we
decided to focus on some indicators:
- the Gross Domestic Product and all its components
- the unemployment
- the inflation rate
- the balance of trade
- the public debt
In the following chapters, we used data from the INSEE. INSEE is the French National
Institute for statistics and Economic Studies. It publishes regularly information, analyzes
about the French society but also the French economy. Those data can clearly be
considered as reliable for our paper.
3.1.1. Gross Domestic Product
According to investopedia, the gross domestic product is defined as: “The monetary value
of all the finished goods and services produced within a country's borders in a specific time
period, though GDP is usually calculated on an annual basis. It includes all of private and
public consumption, government outlays, investments and exports less imports that occur
within a defined territory.”
The figure number 2 shows the evolution of the French GDP over the period 2008-2010.
This graph illustrates the direct impact of the financial crisis on the GDP. Indeed, the
GDP’s growth started to be negative at the end of the first quarter of 2008 and it stayed
negative until the second of 2009. The fiscal stimulus had a direct impact on the final
consumption. This component is the main element of the French GDP; it’s the only
component that had always been a positive impact on the GDP over the study perido. The
GDP’s growth in 2009 and 2010 stayed relatively low.

Page 12
Figure 2: French GDP’s growth and its components
Source: INSEE and official statistics, 2011a.
3.1.2. The unemployment
The unemployment in France has always been relatively high compared to the other
countries of the OECD. The financial crisis of 2007 had a significant impact on the
unemployment rate. Indeed, this rate was at 7.7% at the beginning of 2008 and little below
10% at the end of 2010. The curve of unemployment is represented in the figure 3.
Figure 3: French unemployment rate
Source: INSEE and official statistics, 2012a.
3.1.3. The inflation rate
The inflation rate is defined by the website investopedia as: “The rate at which the general
level of prices for goods and services is rising, and, subsequently, purchasing power is
falling. Central banks attempt to stop severe inflation, along with severe deflation, in an
attempt to keep the excessive growth of prices to a minimum.” Most central banks try to
sustain the inflation rate between 2 and 3%.
The table below shows an important inflation in 2008 due to the rising price of oil and raw
materials in general. In 2009 and 2010, because of the economic problems as the
unemployment the inflation stayed calm.

Page 13
Table 1: Inflation rate in France
2008 2009 2010
Inflation 2.8% 0.9% 1.8%
Source: INSEE and official statistics, 2011b.
3.1.4. The balance of trade
Investopedia defines the balance of trade as: “The difference between a country's imports
and its exports. Balance of trade is the largest component of a country's balance of
payments. Debit items include imports, foreign aid, domestic spending abroad and
domestic investments abroad. Credit items include exports, foreign spending in the
domestic economy and foreign investments in the domestic economy.”
The crisis had a negative impact on the French exportations and also importations, but the
increase of oil prices palliated the decrease of the importations. The year 2008, is famous
for the history record of French deficit of trade balance. France suffers from a too
expensive labor cost and this element impacts the exportations of the country. Indeed, labor
costs in France are one of the highest in the world. The board below represents the balance
of trade CIF-FOB of France for the years 2008-2009-2010. CIF and FOB are two
International Commercial Terms used to evaluate the amount of trades across countries.
CIF refers as: Cost, Insurance and Freight. A trade is expressed as CIF; it means its price
includes costs necessary to transport to the border. In that case, it is used to evaluate the
imports of France. In contrary, a commodity is bought or sold FOB (Free On Board) when
it is purchased without transportation costs and other fees and charges relating thereto and
without insurance for the goods.
Table 2: French Trade balance CIF-FOB
2008 -67,30
2009 -53,49
2010 -64,28
Source: INSEE and official statistics, 2011c.
3.1.5. The public debt
As shows the following graph, the French government debt is increasing for many years
and the crisis has a direct impact on the financial situation of France. The curve shows
stagnation, and even a little decrease, of the government debt before the crisis of 2007.
Indeed, the debt was around 64% of GDP in 2007. In 2010, it is more than 81% and the
debt is still growing in the following years.

Page 14
Figure 4: French governmental debt
Source: INSEE and official statistics, 2011d.
All these elements indicate the difficult economic and finance situation of France after the
financial crisis of 2007. France had to make a Keynesian stimulus to not live again the great
depression of the 30s, but the debt at the end of 2010 represents more than 82% of the
annual GDP and the ratio is still increasing. In this period of difficulties a national effort
had been requested to restore the public accounts and the competitiveness of the French
companies. Thus we could expect the same kind of effort from the highest income in
France, like the sportsmen, the artists and the CEO of the biggest French companies.
3.2 Details of the index CAC 40
The CAC 40 (Continuous Assisted Quotation) is the benchmark stock index in France. The
CAC 40 index is determined from the stock prices of forty shares traded continuously on
the market among the first one hundred companies whose trade is the most abundant on
Euronext Paris. Euronext Paris is as part of Euronext, the first European stock exchange.
These companies, representing different branches of activities, in principle reflect the
overall trend of the French economy. The composition of the index is reviewed regularly to
maintain that representation.
The CAC 40 is almost exclusively composed of French-domiciled companies (except of
Arcelor-Mittal) but about 45% of the shares of those firms are owned by foreign investors.
This rate is the highest among the main European indexes. The reason is that CAC 40 firms
are more international, two thirds of their business is outside of France, than the other ones
from European markets.
The table below illustrates the composition of the CAC 40 index. If we take a look at this
board we can notice several interesting things:
- The 40 companies represent well all the French branches of economy. There are
no more than three companies of the same branch in the index (three banks).
- Even if (almost) all the biggest companies are in this index, we can notice the
difference of weight of each firm. Indeed, Sanofi, the pharmaceutical company
and Total the oil company weigh respectively 11.14% and 14.13% of the total

Page 15
index. Contrary, for example PSA Peugeot-Citroen represents only 0.33% of the
global index.
- All the companies are at least in the top 10 of their own branch, except of
Renault which is ranked 13th
in the automobile but with the partnership with
Nissan is ranked in the top 5. 14 firms are ranked first of their branch, that
demonstrates the quality of the French companies and their international
positions.
- The 2010 turnovers are also highly different. Total is the leader of this category
with a turnover of almost € 160 billion. The second one is AXA with solely € 91
billion. The smallest firm in term of turnover is Essilor with € 3.9 billion.
- An interesting fact is that all the companies of this index have a positive
earning. The most profitable is Total with more than € 10 billion of profit.

Page 16
Table 3: Details of the CAC 40 index
3.3 Literature about CEO compensation in France
The literature about CEO compensation, in France, is quite recent and not really developed.
Indeed, few papers, whether in English or French, have been written on this subject. The
CEO compensation is increasingly debated in France, especially by the politicians in this
year of elections. To well understand the CEOs’ situation in France, it’s important to be
aware of the superstars’ literature. This literature analyses the increase of CEO stars’
compensation (for example: Carlos Ghosn, CEO of Renault-Nissan; Bernard Arnault, CEO
of LVMH) in a competitive context (Rosen, 1981, p. 845-858). The bonus of the CEO of
Publicis (an advertising group) received in 2012 is €16 million and created a huge scandal
in France. The “talent” is relevant to analyze high earnings in fields like sport and arts; can
we attribute such talent to the CEOs? Schoar and Bertrand (2003, p. 1169-1208) underlined
the effect of the presence of a CEO on the performance of large US companies. In the
Company Sector Index weighting world rank in the sectorTurnover 2010
(billion of euros)
net earnings 2010
(billion of euros)
Accor hotels 0.49 top 5 5.9 3.6
Air Liquide commodity chemicals 4.64 1 13.5 1.4
Alcatel-Lucent telecommunications equipment 0.47 / 16.0 0.3
Alstom industrial machinery 0.83 1 (trains) 19.6 1.2
ArcelorMittal steel 2.05 1 58.9 2.2
AXA full line insurance 3.21 1 91.0 2.7
BNP Paribas banks 5.01 5 43.9 7.8
Bouygues heavy construction 0.80 2 31.2 1.1
Capgemini computer services 0.65 5 8.7 0.3
Carrefour food retailers and wholesalers 1.75 2 90.1 0.4
Crédit Agricole banks 0.74 10 34.2 1.3
EADS aerospace 1.70 2 45.8 0.6
EDF electricity 0.9 3 65.2 1.0
Essilor medical supplies 1.91 1 3.9 0.5
France Télécom fixed line telecommunications 3.96 6 45.5 4.9
GDF Suez gas distribution 4.41 2 84.5 4.6
Groupe Danone food products 4.73 6 17.0 1.9
L'Oréal personal products 3.41 1 19.5 2.2
Lafarge building materials and fixtures 0.86 1 16.2 0.8
Legrand electrical components and equipment 0.94 1 (switches/ outlets) 3.9 0.4
LVMH clothing and accessories 4.84 1 20.3 3.0
Michelin tires 1.40 1 17.9 1.0
Pernod Ricard distillers and vintners 2.28 2 7.1 1.0
PSA Peugeot Citroën automobiles 0.33 9 56.1 1.1
PPR broadline retailers 1.47 2 14.6 1.0
Publicis media agencies 0.83 3 5.4 0.5
Renault automobiles 0.88 13 39.0 3.4
Safran aerospace 0.90 / 11.0 0.2
Saint-Gobain building materials and fixtures 1.99 1 40.1 1.1
Sanofi pharmaceuticals 11.14 4 30.4 5.5
Schneider Electric electrical components and equipment 3.36 1 19.6 1.7
Société Générale banks 1.98 9 26.4 3.9
STMicroelectronics semiconductors 0.48 top 5 7.8 0.6
Technip oil equipment and services 1.33 top 5 6.1 0.4
Total integrated oil and gas 14.13 5 159.3 10.6
Unibail-Rodamco real estate investment trusts 2.14 / 1.3 2.2
Vallourec industrial machinery 0.79 2 4.5 0.4
Veolia Environnement water 0.53 1 34.8 0.6
Vinci heavy construction 2.60 1 31.2 1.8
Vivendi broadcasting and entertainment 3.27 10 28.9 2.2

Page 17
actual competitive situation, Gabaix and Landier (2008, p. 49-100) explain that the talent
has to be spread but also concentrated in the highest talents. They explain that the
perception of differences between CEOs is less homogeneous in France than in the US.
Llense (2010, p. 165-191) in her paper look at the size elasticity of CEOs remuneration in
France and at the cost to create an upper limit. She concludes at a size elasticity of CEOs
remuneration of 0.5 and so justifies a large range of compensations.
Hamouda (2010, p. 149-167) examines the utilization of stock options in France from 1997
to 2003 for the companies listed in the SBF 120. Indeed, stock options are became one of
the most used elements of remuneration of the CEOs. The most interesting point of this
study is the comparison made between the high technology firms and the other ones. He
demonstrates that for the “new economy” companies the utilization of stock options is more
important than the other ones.
Another interesting study is the one leaded by Vigliano and Barré (2010, p. 97-109) about
the effect of the network structure of the manager on his remuneration. In France, the
private network is an important element. Indeed, Many CEOs sit on the board of other
companies, thus some links can be created between them especially on the remuneration’s
subject. The study mentioned above, on 103 CEOs from the SBF 120, demonstrates the
importance of the network on the amount of the remuneration of the CEOs in France.
A study found on the website “Stratégie et Management” (2009), describes the average
percentage of each element of the remuneration of the French CEOs. Thus, the main
elements are: The fixed salary (33% of the global remuneration), the stock options (28%)
and the bonuses (22%). This French remuneration’s structure is quite different than the
other ones among the OECD. Indeed, the different tax rates are different in all the
countries. The utilization of Stock options for example, is more common in the Anglo-
Saxon countries. We detailed the differences later in this paper.
3.4 Taxation of high-income in France
The following graph (Figure 5) is particularly interesting. It shows the ratios of levy for the
secondary revenues for the ten richest centiles in France.
The overall tax rate on high incomes is almost constant at the 90th percentile P99.9, from
37% to 38.5%. Then, there is a significant drop in the tax rate from the 99th percentile. The
tax rate in effect amounted to 32.5% for 0.001% of the wealthiest individuals. Finally, we
note that until the 98th percentile, the weight of the different taxes paid by taxpayers is
relatively similar. The tax rate under the social security contributions and payroll tax is
about 12 percentage points of overall tax rate. Indirect taxes represent about one third of
their overall taxation. The final third consists of income taxes, payroll taxes and capital
taxes. The part of social contributions in the secondary income rises from 12% for P97-98
to 1.5% for 0.001% of individuals with the highest incomes. This is due to the strong
decrease of the part of wage income and non-wage income in total from the 98th percentile.
It goes from 81% for P97-98 to 7% for 0.001% of the wealthiest individuals.

Page 18
Figure 5: the ratios of levy for the secondary revenues for the ten richest centiles in France.
Another important point to well understand the situation of the CEOs is to take a look at the
taxation system in France. If we just focus on the income tax for individuals we get the
figure 6.
Figure 6: Income tax rate in France in 2009
Source: Wikipedia.com, 2012.
This figure shows us that the remuneration of CEOs is taxed at a rate of 41%. This rate is
quite high compare to the other OECD countries. There are plenty other taxes, like a health
tax or social tax, thus CEOs in France are among the most taxed ones in the world. The
taxation has a direct impact on the CEO compensation.
The new French president, François Hollande, would like to create a new level of tax of
75% for the people who earn more than 1 million euros per year.

Page 19
4. Literature review
4.1. Background for CEO compensation strategies
The directors of such [joint-stock] companies, however, being the
managers rather of other people’s money than of their own, it cannot well
be expected, that they should watch over it with the same anxious
vigilance with which the partners in a private copartnery frequently
watch over their own. Like the stewards of a rich man, they are apt to
consider attention to small matters as not for their master’s honour, and
very easily give themselves a dispensation from having it. Negligence and
profusion, therefore, must always prevail, more or less, in the
management of the affairs of such a company.
— Adam Smith (1776)
The previous extract from “An Inquiry into the Nature and Causes of the Wealth of
Nations” (Smith, 1776) shows us that the problem of directors’ compensation is almost as
old as the creation of corporations. Indeed, the separation of shareholders and management
leads to a problem known as the principal-agent problem or shortly agency problem and the
globalization of the economy has increased this separation and then the agency cost. This
problem formulated and solved by Grossman and Hart (1983, p. 7-45) is one of the biggest
issues for the shareholders. Kevin Murphy is also one of the most famous economists who
tried to solve this problem. He devoted plenty articles and books to the chief executives’
compensation and to the different incentives to solve the principal-agent problem. In an
article wrote with Michael Jensen (1990, p. 225-264), they suggest that the remuneration of
the CEO is intended to reconcile the shareholders’ interests, i.e. the value creation, and his
own interests, sometimes conflicting. The CEOs might have “personal” projects that
wouldn’t create any or few value for the stockholders: acquisition of a private jet,
unnecessary acquisitions to satisfy the ego of the CEO (J-M Messier with Vivendi
Universal for example) etc.
The problem of the remuneration of the CEO is straightly linked to the agency theory
explained, among others, by Jensen and Meckling (1976, p. 305-360). The agency problem
is a contract by which one or several people (the principal) hire a person (the agent) to
execute on his behalf some tasks with delegation of a certain decision-making power at the
agent. Therefore, all contractual relationship between two people leads to an agency
problem due to the divergence of interests and asymmetry of information between both
parties. These divergences generate different costs: monitoring cost, opportunity cost or
insurance cost. It’s necessary for the shareholders to minimize these costs.
In the article, Performance Pay and Top-Management Incentives (1990, p. 225-264), Jensen
and Murphy demonstrate that the sensitivity of the CEO remuneration to the financial
performance of the firm is relatively low. Indeed, a value creation for the stockholders on
the order of $ 1,000 only increases the remuneration of the CEO of 3.25$. This global
remuneration includes the stock-options, the fixed salary, the variable pay and also an
Page 20
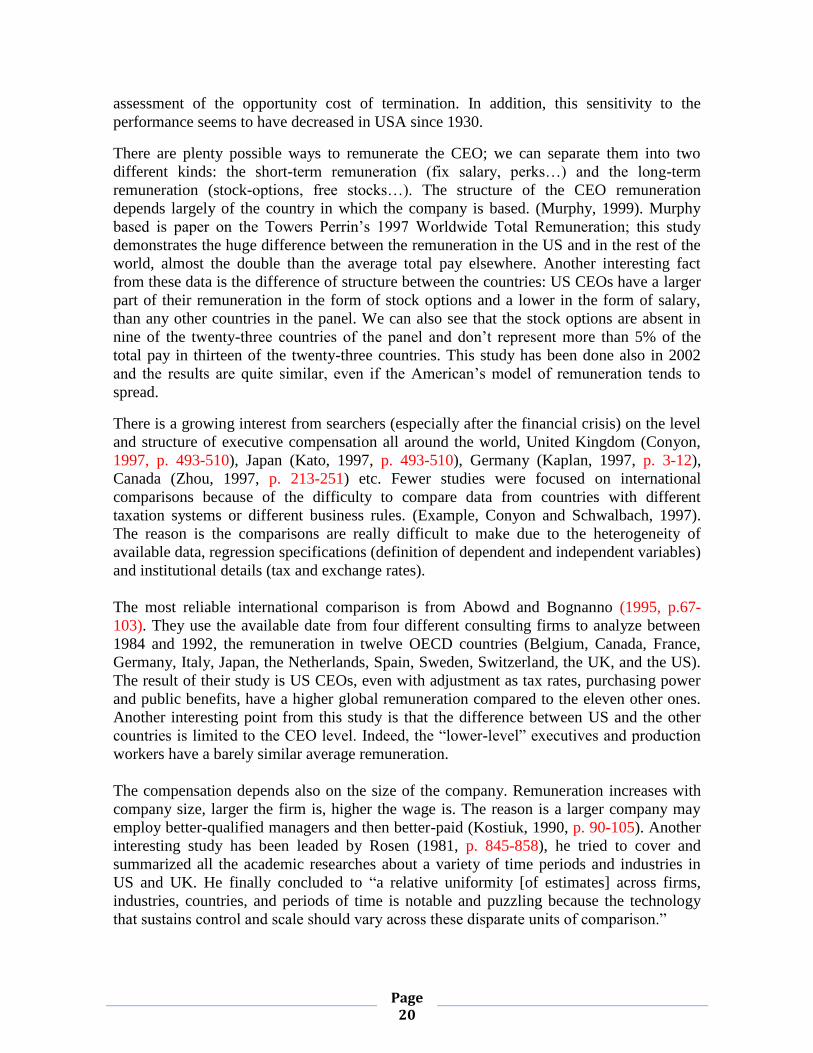
assessment of the opportunity cost of termination. In addition, this sensitivity to the
performance seems to have decreased in USA since 1930.
There are plenty possible ways to remunerate the CEO; we can separate them into two
different kinds: the short-term remuneration (fix salary, perks…) and the long-term
remuneration (stock-options, free stocks…). The structure of the CEO remuneration
depends largely of the country in which the company is based. (Murphy, 1999). Murphy
based is paper on the Towers Perrin’s 1997 Worldwide Total Remuneration; this study
demonstrates the huge difference between the remuneration in the US and in the rest of the
world, almost the double than the average total pay elsewhere. Another interesting fact
from these data is the difference of structure between the countries: US CEOs have a larger
part of their remuneration in the form of stock options and a lower in the form of salary,
than any other countries in the panel. We can also see that the stock options are absent in
nine of the twenty-three countries of the panel and don’t represent more than 5% of the
total pay in thirteen of the twenty-three countries. This study has been done also in 2002
and the results are quite similar, even if the American’s model of remuneration tends to
spread.
There is a growing interest from searchers (especially after the financial crisis) on the level
and structure of executive compensation all around the world, United Kingdom (Conyon,
1997, p. 493-510), Japan (Kato, 1997, p. 493-510), Germany (Kaplan, 1997, p. 3-12),
Canada (Zhou, 1997, p. 213-251) etc. Fewer studies were focused on international
comparisons because of the difficulty to compare data from countries with different
taxation systems or different business rules. (Example, Conyon and Schwalbach, 1997).
The reason is the comparisons are really difficult to make due to the heterogeneity of
available data, regression specifications (definition of dependent and independent variables)
and institutional details (tax and exchange rates).
The most reliable international comparison is from Abowd and Bognanno (1995, p.67-
103). They use the available date from four different consulting firms to analyze between
1984 and 1992, the remuneration in twelve OECD countries (Belgium, Canada, France,
Germany, Italy, Japan, the Netherlands, Spain, Sweden, Switzerland, the UK, and the US).
The result of their study is US CEOs, even with adjustment as tax rates, purchasing power
and public benefits, have a higher global remuneration compared to the eleven other ones.
Another interesting point from this study is that the difference between US and the other
countries is limited to the CEO level. Indeed, the “lower-level” executives and production
workers have a barely similar average remuneration.
The compensation depends also on the size of the company. Remuneration increases with
company size, larger the firm is, higher the wage is. The reason is a larger company may
employ better-qualified managers and then better-paid (Kostiuk, 1990, p. 90-105). Another
interesting study has been leaded by Rosen (1981, p. 845-858), he tried to cover and
summarized all the academic researches about a variety of time periods and industries in
US and UK. He finally concluded to “a relative uniformity [of estimates] across firms,
industries, countries, and periods of time is notable and puzzling because the technology
that sustains control and scale should vary across these disparate units of comparison.”

Page 21
Numerous studies have focused on the CEO remuneration in different kind of industries,
we can quote for example, Carroll and Ciscel (1982, p. 505-509), Rose and Wolfram (1997)
on executive compensation in electric utilities, Barro and Barro (1990, p. 448-481),
Hubbard and Palia (1995, p. 105-130) in banking industries. Murphy (1999) compared all
the different industries between each other and came to the conclusion that CEOs in electric
utilities earn less than their counterparts in the other industries, while directors in financial
companies earn more. Murphy has also studied the evolution of the remunerations between
industries between 1992 and 1996. In manufacturing firms, the median pay level increased
55% to $3.2 million in 1996. In financial area, median pay increased 53% to $4.6 million.
In utilities companies, median pay increased 34% to $1.5 million. In the same study
Murphy, showed that the increase is mainly due to the appreciation of stock options.
The website salary.com gives us some information about the salaries of the American
CEOs nowadays. The average total compensation for the CEOs is $1,436,763 and the
structure of this remuneration is represented in the following graph.
Figure 7: The structure of American CEOs compensation.
Source: Colleman, B., Salary.com, 2011.
The following graph, number 8, provided by the website executive insight, represents the
median total compensation and the median total cash compensation for the CEOS in the US
in 2009. The data are classified by deciles. We can notify that among the deciles there is a
huge heterogeneity. Indeed, the median compensation for the first decile is “only” $ 87.8
thousand and for the tenth decile the median compensation is equal to $ 10.2 million.
That’s why when one speak about CEOs compensation it’s really important to separate well
the CEOs form the biggest companies and the CEOs from the small and medium firms.

Page 22
Figure 8: Median total compensation and cash compensation in the US ranked by deciles.
Source: executive insight blog, 2010.
4.2. Firm Performance
The problem of how to evaluate the financial performance of a company is a current topic.
Indeed, the different and recent financial scandals (Worldcom, Enron…) light the
accounting manipulations and thus the problems of the control systems. The two above-
mentioned companies were two of the biggest American companies in the end of the 1990s.
The similarity between them is a willingness of the top-management to hide, to manipulate
the financial statements in order to not reflect the correct situation of the company. We
won’t discuss these problems in this paper but we thought it was important to mention them
and to show how easy is to manipulate the accountancy of a company.
The book Financial Reporting and Statement analysis written by Stickney et al. (2004, p.
83-102) explains us how to analyze the financial statements of a company. There are three
levels of analyzing the situation of a company. Firstly, the balance sheet measures the
financial position of the company. Secondly, the income statement measures the operating
performance. Finally, the cash flows analysis separates in operating, financing and
investing cash flows.
Still according to this book to value a firm, it’s important to compare a company to other
ones with similarities (size, turnover, area…) and more important to use ratios. There are
two main kinds of ratios: the profitability ratios and the risk ratios. The first category
contains ratios as earnings per share (EPS) who is the most commonly encountered ratio.
Another useful ratio is the return on capital employed (ROCE). ROA is an indicator of how
profitable a company is relative to its total assets. The second category contains ratios as
the leverage ratio, the interest coverage ratio or the debt to equity ratio. The reason why the
ratios are important is they are used, at least in part, to calculate the end of the year bonus
of the CEOs.
The decisions of a CEO may have an impact for various performance outcomes, firm value
in the stock markets, financial situation and firm’s market position (Sorescu and Spanjol,

Page 23
2008, p. 114-132). Firm value refers to both current and future gains evaluated by the
market (Tobin’s q, market-to-book ratio, market capitalization etc...) (Rust et al., 2004, p.
76-89). Financial situation refers to the elements as return on assets (ROA), return on
investment (ROI), and return on equity (ROE). These ratios represent the cost of firm’s
activities. Firm’s market position represents the revenue of the firm as sales, sales growth
and market share.
Many scholars focused on the link between multinationality and the performance but it was
inconclusive (Bausch and Krist, 2007, p. 1-29). The searchers found positive and negative
effects between these two variables.
4.3. Relationship between CEO compensation and firm wealth
The range of researches about the executive compensation is rather large, since the 1980s
there is the emergence of the modern view with the acceptance of the agency theory. The
former studies in this area focused more on the relation between executives’ compensation
and company performance (Coughlan and Schmidt, 1985, p. 43-66; Abowd, 1990, p. 52-
73). Some other studies enquired on the sanction of the CEO in case of bad financial
performance. (Weisbach, 1988, p. 461-480; Warner et al., 1988, p. 461-492). Some studies
were focused on the link between CEO remuneration and market or industry competitors
(Antle and Smith, 1986, p. 1-39; Gibbons and Murphy, 1990, p. 30-51).
As explained above, on the past decades, the literature on CEO compensation and agency
theory has showed that CEO incentives should be linked to firm performance. This problem
is become particularly sensitive after the financial crisis of the last years. The politicians,
from different political parties, but also the media argued that the top-executives’
compensations, and their excess, push employees to privilege short-term risks without any
regard for the long-term effects of these decisions. That’s why, mainly in Europe,
regulatory proposals proposed, among others things, to increase the delayed remuneration
and the long-term incentives. The delayed remuneration is based on current performance,
perfectly known, but paid several years later. For example, a retirement plan. Long-term
incentives are based on a result that depends on current action but is fully observed until
several years later. Stock-options, restricted stocks are the perfect example.
The purpose of these remunerations is to bind the CEOs interests with the ones of the
shareholders. This implies a positive relationship between long-term incentives and future
firm performances. There are plenty papers that focus on connections between CEO
remuneration and future accounting performance (Leonard, 1990, p. 13-29; Hayes and
Schaefer, 2000, p. 279-293). Some other researchers, like Cooper et al. (2008, p. 1609-
1651) tried to study the link between CEO incentives and future stocks’ performances. In
that case, incentive compensation is understood as restricted stocks, options and other
forms of long-term compensation.
The sensitivity of CEO compensations is discussed in several papers, Leone et al. (2006, p.
167-192) showed a higher sensitivity to negative stock returns than to positive stock
returns. That would result to the willing of the boards of directors to privilege an ex post

Page 24
settling up on CEOs. According to the paper of Shaw and Zhang (2010, p. 1065-1093), the
results would be totally contrary and the CEO wouldn’t be punished for poor firm
performance. Baker et al. (1988, p. 593-622), for their part, studied the relation between
firm sales from 1973 to 1983 and the CEOs remuneration. This study demonstrated
negative pay-sales elasticity. Indeed, a firm 10% larger than the average pays its CEO only
3% more.
For Fich and Shivdasani (2005, p. 2229-2254), there is an implicit assumption if the
markets are efficient when the incentive remunerations become public, then investors will
capitalize the present value of future performance increases into the stock price. But there
are several reasons to think that information about CEO incentive remunerations don’t
immediately affect the stock price.
First, CEO compensations incorporate public and non-public information, like the
measurement of economic performance. If un-observable measures are correlated with
future firm performance, then unexplained variation in current compensation should predict
future variation in firm performance (Hayes and Schaefer, 2000, p. 279-293). This suggests
positive relationship between remuneration and future earnings. Second, incentives are not
totally transparent; indeed there is a huge volume of non-cash components of pay. There is
a lot of different papers on that topic, for Bebchuk et al. (2002, p. 751-846), the managers
use the incentive compensation to facilitate the extraction of rents from shareholders. Hayes
and Schaefer (2009, p. 280-290) developed a model in which no firm wants to admit having
a CEO who is below average. Firms with highly paid CEO are the wealthiest firms, with
the best returns. (Core et al., 1999, p. 371-406). Third, a highly paid CEO can become too
confident and may engage the company in wasteful activities and in an empire building
(Ben-David et al., 2008).
The end-year earnings are the most common criterion to measure the performance of a firm
and so calculate the ex-ante bonus of the CEO. Murphy (1999) used survey data to illustrate
that among 125 large industrial firms, 40% used a single performance measure, and 88% of
these firms used a measure based on earnings and none were using stock price as a
performance measure. All of the remaining 75 firms included financial earnings as a
measure of performance, while only five firms used stock price as one of the measures. It is
important to note that, according to Healy (1985, p. 85-107) and Holthausen et al. (1995, p.
29-74) and others, the majority of CEO bonus contract contain both a lower and an upper
bounds. Indeed, the last searchers mentioned, created an interesting graph, the “ROA-based
compensation curve” in Figure 9. This graph illustrates the amount of bonus obtained by
the CEO in terms of the firm performance reached. The CEO receives a bonus equal to 7%
of salary if the performance reaches the lower bound, the average target bonus is set at 55%
of salary and once the upper bound is reached, the bonus of the CEO is equal to 88% of
salary and doesn’t increase anymore.

Page 25
Figure 9: ROA based compensation curve
Source: Homemade figure with the data from Holthausen et al. (1995, p. 29-74).
The following graph illustrates an important element. The largest firms have a higher ROA
than the medium and the small ones. This fact is important because as we explained just
above there is a correlation between ROA and bonuses, even if there are lower and higher
boundaries. We can also learn from this graph that the ROA over the period 1989-1998 for
Canadian companies that the ROA is globally increasing over the period 1991 and 1998.
Figure 10: ROA of American non-financial industries.
Source: Hamilton, E., statcan.gc.ca, 1999.
It seems also important to look at the impact of stock returns in CEO compensation.
Holmstrom (1979, p. 74-91) demonstrates that when both accounting earnings and stock
returns are relevant about the evaluation of the activity of the CEO, both should be used to
determine his compensation. Sloan (1993, p. 55-100) illustrates this theory in his paper by
concluding that there is a positive relation between stock returns and CEO remuneration.
The compensation committee, at the end of the year, has all the financial informations

Page 26
(stock returns, earnings) available, and then is able to gauge the performance of the CEO.
Thus, the committee can punish the CEO for poor earnings except if these results derived
from investment decisions (for example: research and development, restructuring) because
these investments are supposed to create positive future returns. For Barclay et al. (2005, p.
1-25) poor results suggest that the future returns will also be poor, because returns are the
reflection of both delivered and expected performances.
Another field of study in the literature, focused on both cash and equity-based elements of
CEO compensation. Conyon and Murphy (2000, p. 640-671) compare the differences of the
wage of the CEO and incentives in the US and in the UK. Their study concludes of a higher
level of remuneration in the US than in the UK based on these elements for 1997. Ozkan
(2007, p. 349–364), after an examination of CEOs compensation for 414 UK firms for
2003, concludes that the financial performance of the firms (for this sample) doesn’t have
an important impact on CEOs remuneration, whereas board and ownership structures may
impact (positively and negatively) the CEOs compensation. But one of the biggest
problems of these studies is that they are limited at a one-year study of the situation, and
this may affect their results (Murphy, 1985, p. 11-42)
This paper will contribute to the literature by using a panel data set of 40 French firms from
the CAC 40 for the period 2008-2010 to empirically look at the link between CEO
compensation and financial performance of the company.

Page 27
5. Variables
The choice of the control variables early quoted is the result of different elements. Foremost, it’s based on the existing literature and on the specificity of the French way of business. In fact many scholars focused on the relation between CEO remuneration and firm wealth, but none in France. The second element, in the choice of those variables, is the simplicity of access to the data. In France, it’s mandatory for many years to publish information as the members of the board of director or the CEO remuneration. All these data are free-access and available in Internet for many past years. Searchers investigated different corporate governance mechanisms as proportion of institutional shareholders, numbers of executive and non-executive directors, board characteristics or age of the CEO. In this paper, we explore other ways, as the impact of corporate governance variables including structure of ownership and board characteristics on the CEO remuneration. We also examine the pay performance-relation for CEOs in French firms. The purpose of this thesis is to empirically investigate relationships between CEO compensation and the firm performance of 40 French companies during the period 2008-2010. We want to find relation relations between these two elements, that’s why we decided to use a regression analysis. Our variables are divided into three groups: dependent, independent and control variables. Considering all the elements, we thought that the firm performance would be dependent variables; measurements of CEO compensation would be independent variables. The control variables are used to control the dependent variable, that’s why we chose the institutional investors, the board characteristics and the age horizon of the CEO as control variables. Our paper participates to the literature on CEO compensation by investigating the link
between CEO remuneration and firm wealth for a sample of French firms for the period
2008-2010. The analysis is controlling for institutional investors’ share ownership, block
holder ownership and board structure variables.
5.1. Independent Variables
To evaluate the firm performance, we decided to choose three dependent variables: the
market capitalization, the sales and the shareholders return.
5.1.1. Market Capitalization
The market capitalization is the total value of the shares, publicly available, of a traded
company. The calculation to obtain this value, is the share price times the number of shares
outstanding. Preferred stocks are, generally, not included in the calculation.

Page 28
We used the stock prices at the end of each year (31st December) and the number of shares
outstanding provided by the annual reports to calculate the data for this variable. The data
collected are presented in the chapter number 6.
5.1.2. Sales
In finance and accounting, sales or net sales are generally characterized as the revenues
earned by a company when it sells its products or services. The sales can be (almost)
considered as the turnover of a company and are reported in the income statement.
To obtain the data we simply took the financial report of each company for each year and
we compute the data in a board. The data are available in the chapter 6.
5.1.3. Shareholders return
Shareholders return or total shareholder return (TSR) is a ratio used to compare the
financial performance of different companies and especially their stocks. This ratio is the
combination of share prices movement and dividends paid and at the end show the return
obtained by the shareholders. The TSR varies with stock markets but it mainly reflects the
perception by the market, the investors of the overall performance of this company
compares to a reference industry for example.
With TSR = Total Shareholder Return, Price t = stock price at beginning of period, Price (t-
1) = stock price at end of period and Div = dividends paid over the period
The data are collected for the financial reports for each year and each company. They are
presented in the chapter 6.
5.2. Dependent Variables
We took several elements to evaluate the CEO compensation: base salary, bonuses and
Attendance fees and Benefits in kind. The new French regulation obliges all the listed
companies to publish all these elements.
5.2.1. Base salary
The base salary is the fixed amount of money paid to the CEO in return for his work
performed. It does not include the benefits in kind, the bonuses and all the other kind of
compensations.

Page 29
We simply took the information from the annual reports. The data are available in chapter
6.
5.2.2. Bonuses
The bonuses are all the cash and non-cash elements that the CEO can receive in terms of
his goals achievement. We can quote some as:
- The profit sharing. The remuneration committee sets a predetermined amount of
payroll as bonus. The main purpose of profit sharing is to encourage the CEO to
improve the company’s profitability.
- Sign-on bonuses. As professional footballers, some CEOs receive a bonus when
they sign a contract with a new company.
- Spot bonus award. The CEOs can receive a bonus if the stock price of the
company achieves a certain price.
We took the available data from the annual reports, but the main problem is that they don’t
separate the bonuses and the stock-options. Thus the data we provide in the chapter 6
include the different bonuses and the stock-options. The French regulation doesn’t enforce
such distinction.
5.2.3. Benefits in kind
Benefits in kind are defined as all the elements (goods and services) provided by the
company for free or at reduce costs to its CEO. This includes car, chauffeur, cellphone,
laptop etc…
The fees are compensation paid to members of the board of directors of limited companies.
This remuneration is normally shared between the directors according to the attendance at
these committees. The total amount is fixed by the shareholders at a general meeting.
These elements are specified in the annual reports and are reported in the chapter 6.
5.3. Control Variables
5.3.1. Institutional investors
The definition of institutional investors providing by the website investopedia is: “A non-
bank person or organization that trades securities in large enough share quantities or dollar
amounts that they qualify for preferential treatment and lower commissions. Institutional
investors face fewer protective regulations because it is assumed that they are more
knowledgeable and better able to protect themselves”. We can quote as examples: the
pension funds; Insurance companies; Hedge funds; sovereign wealth funds.

Page 30
The globalization of the economy, leads to a dominant position of the institutional investors
in financial markets. The Rockefeller foundation estimates the total assets own by the
institutional investors at over $20 trillion. Even if the North-American pension funds stay
an important investors (with more than 25% of total amount invested), new actors as the
middle-eastern or Asian sovereign funds became more and more important after the
financial crisis of 2007. For example, the Qatar sovereign fund owns significant
participation in many big French companies as Total (3% of the total amount of stocks),
Vinci (between 5 and 8%), Véolia (5%) or Lagardère (10%). These significant
shareholdings allow institutional investors to exert a substantial role on the managerial
control. The sovereign funds and the pension funds are generally appreciated by the
companies because they are less aggressive than the hedge funds and they invest in
companies with long-term objectives. Gillan and Starks (2003, p. 4-22) made an interesting
survey of the institutional investor activism.
In the United-States, institutional investors play an active role in the process of fixing the
executive remuneration (Hartzell and Starks, 2003, p. 2351-2374). Sapp (2008, p. 710-746)
corroborates this survey, with a paper on the influence of institutional investors on the
executive compensation for a sample of publicly listed Canadian firms. In a previous study,
Ozkan (2007, p. 349–364) demonstrates the negative impact of institutional ownership on
the CEO compensation for a sample of British firms. The main problem with this paper is
that it is based only on one year data. Such kind of studies hasn’t been done for France.
A new word appeared some years ago about the institutional investors’ literature it’s:
activism. Indeed, many recent studies demonstrate the evolution of the behavior of the large
institutional shareholders to a more active way (e.g. Monaco and Finet, 2011). Thus, this
variable is an important element to take into account for analyzing the CEOs compensation
in France.
The ease of access to information (Bushee and Goodman, 2007, p. 45) is a paramount
consideration in their choices of participation (Golec, 2004, p. 44; Chen and Hong, 2006, p.
2471-2488). Thus, the institutional investors avoid those firms for which the level of
information asymmetry is high. Following this logic, these investors privilege the listed
companies than the non-listed ones, because the market is more liquid and the portfolio is
easier to evaluate. Ferreira and Matos (2008, p. 499-533) showed a preference for the
American institutional investors for the large sized companies whereas the non-American
ones prefer the cross-listed companies.
Thus, we think the institutional investors are an important variable that they can influence
the strategic and financial decisions of the companies, the market valuation, the risks taken
etc. All of these elements are totally linked to the CEO compensation. The information
about the institutional investors come from the different annual reports.
Our paper will be part of the literature by investigating on the CEO pay-performance
sensitivity and the impact of institutional investors’ shareholding on it.

Page 31
5.3.2. Board of director characteristics
According to investopedia, a board of directors is: “A group of individuals that are elected
as, or elected to act as, representatives of the stockholders to establish corporate
management related policies and to make decisions on major company issues. Such issues
include the hiring/firing of executives, dividend policies, options policies and executive
compensation. Every public company must have a board of directors”.
As we explained, the separation of ownership and control is the basis of the agency theory.
The literature on this topic is quite large and supports the fact that is important for the
companies to align the interests of the directors and the ones of the shareholders. The
theory explains that if the director ownership is increased, the directors would be less likely
to waste resources in non-profitable projects. Thus, there is a negative relationship between
directors’ ownership and CEO remuneration. There are some problems with this situation.
Indeed, if the directors’ ownership is too high, their decision power will be too important
and the outside investors will have problems to monitor them. Another problem is the
entrenchment of the directors if they have too much control of the firm. All these elements
lead to a reduction of the effectiveness of the internal control. Berle and Means (1932)
affirm that a weak managerial propriety and a dispersion of shareholders lead the
management to use the assets of the company for their own interests.
Le Maux (2004, p. 195-231) studies the French structure of ownership and shows that the
dominant shareholders and the management form a control coalition and jointly affect the
decisions of the board of directors. This study corroborates the one of Charreaux and Pitol-
Belin (1987), they examine a sample of French firms and discover that the propositions of
nomination come generally from the board of directors and then the proposed persons are
approved by the general meeting of shareholders. That’s why Le Maux (2004, p. 195-231)
proposes that the enquiry of conflicts between economic agents must be leaded in the board
and not in the general meeting because it’s the strategic decision unit of the companies. Le
Maux also defines what he calls a control coalition with the following elements:
- Access to all tools and mechanisms for management and control. This access is
impossible for outside shareholders.
- Extensive information about the company controlled: the coalition control has
better access to information compared to all partners of the firm.
The analysis of the structure of board of directors by Fama (1980, p. 288-307)
demonstrated that the executive directors highly influence the decisions of the board of
directors. Furthermore, they have an important impact on the deliberations of the board.
The presence of internal directors in the board allows better information of the board and
better transfer of information between the members and the external directors. Given the
role that the board is expected to play, the existence of administrators involved in the
management does not allow it to fulfill its oversight functions effectively. Fama and Jensen
(1993, p. 195-235) recommend the presence of independent directors to improve the
operating efficiency of the Board and participate in decisions that involve serious agency
problems between shareholders and managers. The independent directors would be
encouraged to act in the interests of shareholders and deterred from collusion with
management since their reputation is at stake.

Page 32
Our paper participates to the literature by investigating the impact of executive and non-
executive directors on the CEO compensation for a sample of 40 French companies.
5.3.2.1. Executive ownership
Executive ownership, also called executive directors, has been a largely developed topic.
The theory suggests that managers’ and shareholders’ interests are not totally aligned. That
refers to the agency theory that reduces firm value. This theory predicts that a presence of
shareholdings of executives helps to connect the different interests in the company (Jensen
and Meckling, 1976, p. 305-360). Moreover, the managerial ownership would lead to better
decision making and so would lead to a better corporate performance (Morck et al., 1988,
p. 293-315).
However, the literature also suggests that after a certain level, the increase of management
ownership could have a negative impact on firm value. In fact, the possession of “too
many” shares would provide managers sufficient wealth to pursue their own benefits. But
when managerial ownership is really high, the alignment of interests of managers and
shareholders is nearly perfect. Several searchers as Cho (1998, p. 103-121) demonstrated
the non-linear relationship between executive ownership and firm value.
Another element demonstrates by (Fama and Jensen, 1983, p. 195-235) is that managers
with a high ownership tend to get entrenched. Thus, that would exacerbate the agency
problem. Jensen and Meckling (1976, p. 305-360) suggested that managerial shareholding
would create another conflict in the company, a conflict between the shareholders and the
bondholders. Shareholders have an incentive to try to expropriate the value from the
bondholders. Executives’ ownerships are responsible of the investment decisions and
would modify the financial structure of the company for their own privileges. For example,
they could increase the lever of the company, decide to invest in riskier project or increase
the amount of the dividends.
To conclude, executive ownership is at the same time good for the company, by the
alignment of interests between management and shareholders but also bad for it because of
the different problem of entrenchment or risk-shifting problem. The percentages of
executive ownership come from the annual reports.
5.3.2.2. Non-executive ownership and shareholder
A non-executive director, generally called outside directors is a member of the board of
directors of a company but who are not a member of the executive management. He is not
an employee of the company.
Unlike the non-executive ownership, a non-executive shareholder is not member of the
executive management and and is not also in the board but has some share of the company.
So different member can compose this category: block holder (share but neither member of
the board or the executive management), institutional shareholder or the family owner
(Bouygues or Peugeot Family etc.).

Page 33
In the last years, and the scandals as Enron and Worldcom, many new rules or
recommendations have been edited on how to increase the effectiveness of the board of
directors and on the active role of non-executive directors. These outside directors are
considered as one of the best solution to avoid this kind of problem (Daily et al., 2003, p.
371-382). Depending on the country the recommendations are not the same. In the UK for
example, the recommendation is to nominate at least independent non-executive directors
for at least half of the seats.
The non-executive directors have two main tasks: control the activity of the board and the
activity of the executive directors (Cadbury 1992). To fully accomplish this mission, there
are three important elements for the non-executive directors to take into account: the time,
the remuneration and the reputation. The time, generally they work part time and for
several companies, so it’s quite complicated for theme to be really effective in the control
mission. The remuneration, the directors’ fees are relatively less important than the
executive directors. The reputation, indeed they care about their own reputations which
provide an important incentive to be effective in the monitoring.
The studies lead in the UK, such as Cadbury (1992), focused on the board monitoring role
and on the impact of non-executive directors on this role. On a sample of US firms, Core
and Guay (1999, p. 151-184) find that less numerous the independent outside directors are,
greater the CEO compensation is. This result is corroborated by the study of Coakley and
Iliopoulou (2006, p. 609-631), which find that less independent and larger boards grant
higher CEO bonuses and salary after a Merger and acquisition for one hundred completed
bids in the UK.
In her previous research, Ozkan (2007, p. 349–364) determinates that the proportion of
non-executive directors has a direct and positive impact on CEO remuneration and thus,
these directors wouldn’t play their monitoring role. In our paper, we analyze the impact on
CEO compensation of two different elements: the proportion of non-executive shareholder
and share ownership by the executive. The board size will be one of our control variables,
and this board size will contain the executive and non-executive directors.
5.3.3. CEO age and horizon problem
The literature about the relation between CEO age and firm performance is quite inexistent.
That’s why in our paper we decided to use the CEO age and his tenure, i.e. the number of
years he has been CEO as variables. These two elements might be favorable for the CEO.
Indeed, older the CEO and longer the tenure are, more power to negotiate his package the
CEO have. Thus, the pay-performance would be less elastic for older CEOs and longer
CEOs tenure.
This paper will be part of the literature by the innovative approach we used. Except in the
paper of Ozkan, the age variable hasn’t really been studied. This study of the French most
important index would be useful for many researchers. Generally, the CEO age or tenure of
the different companies is publically known. Otherwise, these data are in the annual reports.

Page 34
6. Data
The sample covers the years 2008, 2009 and 2010 for the 40 companies of the French index
CAC40. We have a panel of data with 2005 firm-year observations. These data, usually,
come from the yearly annual reports and the French document called « document de
reference ». This last one is a mandatory paper published by each French quoted company
and which gives explanation about the activity, the financial situation or the forecast for the
company. Since the French financial market authority has to verify the documents,
reliability can be assumed.
For each company, we collected salary information from the remuneration section of the
annual reports. The salary elements are in Euro (€) and include the base salary, the annual
attendance fees, the benefits in kind and the bonuses. The bonus part contains the bonus in
cash and the stock options. Unlike British and US companies, the French companies do not
have the obligation to publish the amount and the number of stock-option given to the
CEO. The data collected about CEO’s stock option can are either unreliable or inexistent;
therefore we decided to induce the global bonus amount, which contain the bonus in cash
and also in stock option.
Data concerning the age and the tenure of the CEO were taken from the companies’
website. The tenure of the CEO is the duration as CEO in the company. For the ownership
structure we collected the required information in the reference document, in the
“shareholder part”, especially in the structure of the capital part. So for each company we
noted the proportion of institutional Ownership (financial company, pension fund and also
the long-term shareholder company), block holder ownership (owner who is not in the
management and non-member of the board, usually it’s the shareholder called “public” in
the reference document). We also decided to calculate the proportion of executive directors
and non-executive shareholders for each company, (see part 5.3.2.2. for more details about
these variables). The proportion of executive director is computed from the total number of
directors and the number of executive director found in the annual report in the board part.
The proportion of non-executive shareholder is also extracted from the Annual report, in
the capital structure part: this number is the proportion of shareholder of the company
neither member of the executive management or of the board.
In this part, a table explains the composition of the capital in percentage and also the
percentage of voting right for each shareholder.
Table 4 reports descriptive statistics for components of CEO compensation for the test
period. We can observe that there has been an increase in average base salary and
especially about the bonus which is the largest increase with around 35% of increase
between 2009 and 2010 with an average bonus of 1,357,641€ in 2010. Furthermore, it’s
interesting to note that the attendance fees (presence during a board session) and the
benefits in kind (driver and/or car, corporate apartment etc.) have dropped by 36 % between
2009 and 2010, to reach the average sum of 38, 246 € by CEO in 2010.

Page 35
Table 4: Descriptive statistics about the sample’s CEO compensation
Table 5 shows descriptive statistics for the variables, ownership and board structure. As
explained in the theoretical part, we decided to compute the impact of the kind of
shareholder on the CEO compensation.
The results show that the average of institutional investor and block holder ownership
increases between 2009 and 2010 meanwhile the executive ownership average drops by 21
% during this period. Furthermore the standard deviation dropped by 30%.Thus it can be
concluded that the spread of executive ownership dropped considerably around the average
of 4.63% among the companies of the CAC40.
That illustrates also that the institutional ownership is as important as the block holder
ownership. This can be explained by the fact that CAC 40 index contains the forty biggest
French companies. Thus, it contains many old state companies who became private but the
French state has kept shares and interests of them (for example 91% of the shareholders of
France telecom are institutional investors).

Page 36
Table 5: Descriptive statistics about the sample’s control variable
The next table for the descriptive statistics contains information about the companies and
the shareholder return for each company. This return was computed by the financial
website “Boursorama”, which use the annual report of these companies, and includes the
dividends reinvested. The market capitalization was calculated by the multiplication of the
number of share by the price of one share at the 31/12/2010. All monetary variables are in
kilo-Euro.
Table 6: Descriptive statistics about the sample’s other component

Page 37
7. Model Specification and Estimation
In this paper we try to compute the link between CEO compensation and firm performance.
Therefore we used different methods that have been used and described in the
compensation literature. In section 7.1, we used a regression model which attempts to
explore the relation between the level of CEO compensation and firm performance after
controlling for corporate governance variables and other firm-specific characteristics.
Furthermore In section 7.2, we focus on the elasticity of CEO compensation in order to
further test the relation between CEO compensation and firm performance. We used a
regression model similar to the one from Conyon and Murphy (2000, p. 640-671).
7.1. The relation between level of CEO compensation and firm
performance
In this part, we focus our analysis on the CEO compensation and try to give an explanation
about the link between the compensation and the firm performance, after a first check about
firm size, the corporate governance variable, the level of sales etc.
It is possible to use a model to compute the relationship between two or several data in
statistic. This tool is called linear regression, when there is one explanatory variable it’s
called a simple regression, when there is more than one explanatory variable it’s called
multiple regression.
This statistic tool refers commonly to a model in which the conditional mean of Y given the
value of X is an affine function of X. That means that given a variable y and a number of
variables X1, ..., Xp which can be related to y, the linear regression analyzes if it is possible
to quantify the strength of the relationship between y and the Xj, but also assess
which Xj may have no relationship with y at all, and additionally identify which subsets of
the Xj contain redundant information about y. We can obtain the general formula for a
multiple linear regression:
Where is the coefficient of regression and is called the error term.
Nevertheless to use the linear regression, some assumptions have to be respected (linearity,
constant variance etc.). After a check that our data respect these assumptions, we deduce
than we can use this model:
ln (compensationit) performance
it ∑ k
m
k 1
corporate governance variablei,t
∑ j
n
j 1
control variablei,t it

Page 38
where it is the error term, and the dependent variable, ln(compensation) is the log of
compensation, which is measured by either cash compensation (the sum of salary and
bonus) or total direct compensation (the sum of base salary, bonus, and benefit in kind).
Thanks to this relationship we can use a linear regression model for each of the right term
of this equation. A linear regression is an approach to model the relationship between two
variables. Through the software SPSS, we could realize a multiple linear regression (more
than one explanatory variable), and so obtain the coefficient of correlation between the
compensation and the firm variables.
Nevertheless, unfortunately numbers of our variables are statistically insignificant
(coefficient of significant more than 10%). This problem could have many reasons. The
first one could be the number of the sample. Indeed our study focuses on three year and
about forty companies, therefore we have only forty observations for each year, we can
assume than with a sample more important the variables would be significantly better. But
it is not sure and other reasons could also explain this problem. Indeed the financial crisis
period could be another and possible explanation: these three years were really tumultuous
on a financial plan, so many decisions or facts were illogical or irrational and lead to the
difficulties to obtain variables statistically significant.
Table 7: Linear regression between CEO’s base compensation part and firm-specific
characteristics
This table shows coefficients from the regression of the CEO base compensation against
firm size (sales), firm performance (shareholder return), board size, proportion of non-
executive shareholder, percentage of total institutional share ownership, proportion of
block holders’ ownership, executive and non-executive directors’ share ownership. As we
explained in the sixth part the data come from or are computed from the document called
“Annual Report”, the shareholder return data is calculated from the end of year return
index (which includes the dividends reinvested) provided by Boursorama. For more details
about the data used, see the Data part (section 6). All monetary variables are in Euro. The
linear regression was calculate trough the software SPSS to a level of confidence of 5%. T-
statistics (underline in grey) are calculated using also through SPSS and ∗∗∗, ∗∗ and ∗
indicate that the coefficient is significant at the 1, 5 and 10% level, respectively.
2008 2009 2010
Age of the CEO -0,024 -0,026 0,055
-0,122 -0,117 0,28
duration as CEO 0,341* 0,099 0,072
1,764 0,497 0,381
Institutionnal Ownership -0,674* -0,895*** -1,032**
-1,875 -2,303 -3,046
Block holder ownership -0,961*** -0,907*** -0,951***
-2,79 -2,406 -3,021
Executive Ownership 0,214 -0,008 -0,242

Page 39
0,46 -0,018 -1,608
Non Executive shareholder 0,546 0,309 -
1,157 0,653 -
Board size -0,039 0,193 0,041
-0,217 1,101 0,27
Market Capitalisation -0,125 0,422* 0,427**
-0,581 1,956 2,283
Sales 0,311 -0,025 0,138
1,348 -0,114 0,687
Shareholder return 0,201 -0,043 -0,048
1,071 -0,207 -0,263
Number of observation 40 40 40
R2 0,366 0,387 0,504
In this chart we can read for each year the variables, which have a positive or negative
impact on the base salary of the CEOs. Thus we can conclude for the three years of the
study that the block holder ownership and the institutional ownership have an important
link to the diminution of the Base salary. If we put it in other words: in 2008, 2009 and
2010 the more there are institutional and block holder ownership in the CAC 40 companies,
the less important the base salary of the CEO is.
Moreover, in 2009 and 2010, there is a link between the market capitalization and the base
compensation salary of the CEO. This variable has a positive impact on the compensation
but it is not a strong one (coefficient of only 0.422 and 0.427 in 2009 and 2010). We cannot
do conclusion about the year 2008 since the data are not statistically significant.
Furthermore, the variable of the tenure as CEO in 2008 is statistically significant and has a
link with the base salary compensation; however the data of the other years are statistically
insignificant so we cannot do correct statement about this variable.
The other variables, and for all the years, are statistically insignificant so it is impossible to
conclude definitively about a potential link between them, even if they “seem” to have a
coefficient close to 0, that can lead to any correct conclusion.
To check our results we have selected the ten first base salaries of the CEOs and compare
these data with the ranking of their company in term of institutional and block holder
shareholder and in term of market capitalization. The result is similar to our calculation.
We can see that usually the highest base salary is obtained in a company with a low
institutional and block holder shareholder (the first and second company are 36 and 39 on
40 in this ranking). It’s also interesting to see that companies in the top ten of market
capitalization give the first five base salaries. There is a strange situation of the CEO of
Capgemini who has the 6th best base salary whereas his company has the worst market
capitalization. This situation could have some explanation: the actual crisis affected the
market capitalization differently in function of the sector: therefore some industrials or
service companies could be affected or not by the drop of the financial market. This could
be a reason of the bad capitalization ranking of some companies (i.e.: the capitalization of

Page 40
General Motor during the financial crises of 2008 was less than the value of its stock).
Some CEOs prefer to have a strong base salary and a weak bonus part (i.e: the bonus part
for 2010 for the CEO of Capgemini is ranked 29/40).
Table 8: Ranking Comparison of some sample’s companies, part 1

Page 41
Table 9: Linear regression between CEO’s bonus compensation part and firm-specific
characteristics
This table shows coefficients from the regression of the CEO bonus compensation against
firm size (sales), firm performance (shareholder return), board size, proportion of non-
executive shareholder, percentage of total institutional share ownership, proportion of
block holders’ ownership, executive and non-executive directors’ share ownership. As we
explained in the sixth part the data come from or are computed from the document called
“Annual Report”, the shareholder return data is calculated from the end of year return
index (which includes the dividends reinvested) provided by Boursorama. For more details
about the data used, see the Data part (section 6). All monetary variables are in Euro. The
linear regression was calculate trough the software SPSS to a level of confidence of 5%. T-
statistics (underline in grey) are calculated using also through SPSS and ∗∗∗, ∗∗ and ∗
indicate that the coefficient is significant at the 1, 5 and 10% level, respectively.
2008 2009 2010
Age of the CEO 0,156 0,005 -0,027
0,791 0,028 -0,106
Duration as CEO 0,604*** 0,601*** 0,361
3,173 3,451 1,47
Institutionnal Ownership 0,039 -0,231 -0,024
0,109 -0,678 -0,054
Block holder ownership 0,08 -0,031 0,022
0,234 -0,095 0,055
Executive Ownership 0,256 0,318 -0,136
0,558 0,774 -0,691
Non Executive Shareholder 0,355 0,461 -
0,764 1,108 -
Board size -0,26 -0,023 -0,181
-1,471 -0,148 -0,908
Market Capitalisation 0,039 0,278 0,199
0,184 1,47 0,815
Sales 0,184 0,131 0,042
0,807 0,677 0,162
Shareholder return -0,018 0,231 -0,067
-0,095 1,271 -0,278
Number of observation 40 40 40
R2 0,384 0,529 0,154

Page 42
Only the tenure of the CEO for the year 2008 and 2009 (coefficient of 0.604 and 0.601) are
statistically significant and can be analyzed. The coefficient of this variable has a quite
strong link with the bonus salary. The Market Capitalization, the Board and the non-
Executive Ownership could be linked to the bonus compensation of the CEO but the
coefficient of regression is not enough significant to be used.
Therefore, because of the same problem of statistically insignificant variables we cannot
conclude a real link with the six other variables.
It is difficult to conclude with these data since almost all of them are insignificant. The
main reason of these statistically insignificant data is the fact that the bonus data contains
the cash bonus but also the stock options (see part 5 about the data). So the incapacity to get
precise data does not allow us to use correctly the linear regression method and therefore
get significant data.
Table 10: Linear regression between CEO’s Total compensation part and firm-specific
characteristics
This table shows coefficients from the regression of the CEO bonus compensation against
firm size (sales), firm performance (shareholder return), board size, proportion of non-
executive shareholder, percentage of total institutional share ownership, proportion of
blockholders’ ownership, executive and non-executive directors’ share ownership. As we
explained in the sixth part the data come from or are computed from the document called
“Annual Report”, the shareholder return data is calculated from the end of year return
index (which includes the dividends reinvested) provided by Boursorama. For more details
about the data used, see the Data part (section 6). All monetary variables are in Euro. The
linear regression was calculate trough the software SPSS to a level of confidence of 5%. T-
statistics (underline in grey) are calculated using also through SPSS and ∗∗∗, ∗∗ and ∗
indicate that the coefficient is significant at the 1, 5 and 10% level, respectively.

Page 43
2008 2009 2010
Age of the CEO 0,143 -0,006 -0,014
0,762 -0,03 -0,064
Duration as CEO 0,623*** 0,526*** 0,385*
3,455 3,093 1,827
Institutionnal Ownership -0,335 -0,542 -0,47
-0,999 -1,631 -1,237
Block holder ownership -0,286 -0,358 -0,382
-0,89 -1,111 -1,083
Executive Ownership 0,28 0,222 -0,25
0,645 0,554 -1,485
Non Executive ownership 0,483 0,482 -
1,098 1,188 -
Board size -0,209 0,054 -0,136
-1,249 0,36 -0,794
Market Capitalisation 0,216 0,378** 0,361*
1,076 2,046 1,724
Sales 0,101 0,1 0,12
0,468 0,531 0,535
Shareholder return 0,101 0,161 -0,133
0,576 0,905 -0,647
Number of observation 40 40 40
R2 0,448 0,551 0,377
In this table only the duration as CEO for the three years of the study and the market
capitalization for the years 2009 and 2010 are enough significant to be used. Thus, we can
conclude that there is a positive link between the total CEO compensation and the duration
as CEO, however, we can see in this table that the strength of this link decreases with the
years. The coefficient of this variable falls from 0.623 in 2008 to 0.385 in 2010.
Like the previous chart, the other variables cannot be used since they are statistically
insignificant. But if we try to sum up this chart we can put the variable in three categories
depending of the importance of their link with the CEO compensation.
The first category of variables has a strong link with the CEO compensation and is
statistically significant. We can say that they have a “positive” impact on the CEO
compensation. According to this table, there is a strong but decreasing link with the
duration as CEO (coefficient between 0.623 in 2008 and 0.385 in 2010.), and the market
capitalization (only for the year 2009 and 2010) with the compensation of the CEO. We can
thus conclude that the longer the duration as CEO and bigger the Market
Capitalization are, the higher the CEO compensation will be. Like for the bonus
compensation, the non-Executive Ownership could be also one of a variable with a strong
link but the data of 2010 cannot be calculate by the linear regression because they are not
enough significant.

Page 44
If we focus on the last tenth biggest CEO total compensations, we can see that the result is
relevant. Indeed, we can see that there is a link between these three variables, apart some
exceptions, the average ranking for the duration is 23 (on 40) and the average of market
capitalization is 25. It could be less clear or relevant with the most important compensation
because of the bonuses which have an obscure attribution and are hard to explain.
Table 11: Ranking Comparison of some sample’s companies, part 2
The second category of variables also has a strong link with the total CEO compensation
but has a “negative” impact on the CEO compensation. But this second category is not
statically significant so we can only assume this conclusion.
The variables of this category have a coefficient below - 0.3. Therefore, we can conclude
that there could be a strong link about the proportion of institutional shareholder
(coefficient average of -0.449 on the three years), and the block holder shareholder
(coefficient average of - 0.382 on the three years) with the compensation of the CEO. We
can assume that the more institutional and block holder shareholder there is, the less
the CEO compensation will be.
If we take the same sample, we can see that this link is less accurate. If we calculate the
average of the institutional and block holder shareholder ranking we get 19, so just under
the median raking. So as we said, this variable as a “negative” impact but the link is less
important than for the duration as CEO or market capitalization.
Table 12: Ranking Comparison of some sample’s companies, part 3

Page 45
The third category is still not statistically significant but they seem do not have a strong
link with the total CEO compensation and so could have a “neutral” impact on the CEO
compensation. The coefficients of the variables of this category are between 0.3 and -0.3.
According to this method, five of these variables have a weak coefficient. The age of the
CEO has a coefficient really low and close to zero (-0,014 in 2010 and -0,06 in 2009) and
hence we can assume to a non-impact of this variable on the total CEO compensation. The
executive management and the board size also seem to have a weak link with the total
compensation (respectively -0.25 and -0.136 in 2010). The variables related to the firm
which are the sales and the shareholder return seems, do not impact the total CEO
compensation too (coefficient of 0.12 and 0.133 in 2010). We can assume that these
variables do not influence the CEO compensation significantly.
With the same sample, we can see that there is no link between these three elements, the
ranking are different each time.
Table 13: Ranking Comparison of some sample’s companies, part 4
7.2. CEO pay-performance elasticity
In this part, we follow the approach by Conyon and Murphy (2000, p. 640-671) and
Murphy (1999) and we will try to estimate pay-performance elasticity for bonus
compensation and total compensation. The regression model is as follows:
∑
∑
Where , the change in log shareholder value, is equal to the rate of
return on common stock and is the elasticity of cash compensation with respect to
shareholder value.
Company CEONameTotalCompensation
CEO2010
Ranking
compensationCEO2010
Sales2010(K€) Rankingsale2010Shareholderreturn
2010
Shareholder
returnranking2010
Alstom PatrickKron 1170794 40 20923000 19 2,62% 21
Renault CarlosGhosn 1242655 39 38971000 12 0,00% 37
Vallourec PhilippeCrouzet 1384344 38 4491272 37 2,42% 23Legrand GillesSchnepp 1395000 37 3890000 39 3,11% 16
Safran Jean-PaulHerteman 1406294 36 11028000 30 1,71% 31
VeoliaEnvironnement AntoineFrérot 1552255 35 34786600 13 6,24% 4
EDF HenriProglio 1554820 34 65165000 5 3,24% 14Vinci XavierHuillard 1614846 33 34003000 14 3,97% 11
FranceTélécom StéphaneRichard 1658729 32 45503000 9 9,15% 1
STMicroelectronics CarloBozotti 1717392 31 7941987 32 1,41% 34

Page 46
The table 14 shows coefficient estimates for equation below. In using a regression model
with the dependent variable we can observe that these control variables
do not have a significant impact on changes in CEO compensation. Therefore the value for
CEO pay-performance elasticity for cash compensation stays approximately the same.
Table 14: CEO pay-performance elasticity for total direct compensation (base salary)
This table reports coefficient estimates for equation below using ln (base salary) as the
dependent variable. The base salary is the regular salary; Shareholder return is calculated
from the end of year return index (which includes the dividends reinvested) provided by
Boursorama. Board size is measured as the total number of executive and non-executive
board members and sales is the average on the three year. Executive management
shareholder is the proportion of the member of management who have share in the
company. All monetary variables are in Euro. The linear regression was calculate trough
the software SPSS to a level of confidence of 5%. T-statistics (underline in grey) are
calculated using also through SPSS and ***, ** and * indicate that the coefficient is
significant at the 1, 5 and 10% level, respectively.
The table 15 shows coefficient estimates for the same equation. In using the still the same
regression model but with the dependent variable we can observe that
these control variables still do not have a significant impact on changes in CEO
compensation. Again the explanatory power of the regression model is not increase by the
addition of these control variables.
Table 15: CEO pay-performance elasticity for total direct compensation (Total salary)
This table reports coefficient estimates for equation below using ln (Total salary) as the
dependent variable. The Total salary is the base salary and the bonus. Shareholder return
is calculated from the end of year return index (which includes the dividends reinvested)
provided by Boursorama. Board size is measured as the total number of executive and non-
executive board members and sales is the average on the three year. Executive
ln (1+shareholder return) 0,199
0,815
ln (sales) 0,08
0,234
Board size 0,039
0,109
Executive management shareholder
-0,031
-0,095
Number of observation 120
R2 0,087

Page 47
management shareholder is the proportion of the member of management who have share
in the company. All monetary variables are in Euro. The linear regression was calculate
trough the software SPSS to a level of confidence of 5%. T-statistics (underline in grey) are
calculated using also through SPSS and ∗∗∗ , ∗∗ and ∗ indicate that the coefficient is
significant at the 1, 5 and 10% level, respectively.
ln (1+shareholder return)
0,222
0,554
ln (sales) 0,143
0,762
Board size -0,078
0,59
Executive management shareholder
0,054
0,36
Number of observation 120
R2 0,087

Page 48
8. Conclusion
The communication agency Euro RSCG realized a study on the financial data of the CAC
40 companies between 2006 and 2011. This etude illustrates the increasing gap between the
CEOs and the employees. Euro RSCG highlights some important data in the period 2006-
2011:
- increase of operational margins: 23%
- increase of benefits: 10%
- increase of cash flows: 22%
- increase of presidents’ remuneration: 34%
- increase of salaries’ remuneration: 13%
- decrease of the index CAC 40: 30%
- more than one third of the jobs are precarious
This study gives us several useful inputs. Firstly, the international companies, like the ones
member of the CAC 40, didn’t suffer so much after the financial crisis of 2007. Secondly,
the remunerations of the CEOs increased a little bit less than 3 times the one of the
employees. Thirdly, even after a global decrease of the stocks prices, which is generally a
bad news for the shareholders, the CEOs remuneration increased.
Given those results one could think that the shareholders are not really active in the fixation
of the CEOs remuneration but it’s important to note that on the same period the dividends
increase of more than 21%. There was no limit for the CEOs remuneration as long as the
shareholders received an important amount of dividends. But many recent events show a
fed up of the abuses in the CEOs compensation. The most famous is the invalidation of
CEO compensation of Citigroup by 55% of the shareholders the 17th April 2012. The
shareholders used their right to vote on the remuneration of executives, thanks to the rule
called “say on pay”. This rule that appeared in 2000 after the Enron scandal takes aim at
reducing the agency theory. “say on pay” gives the power to the shareholders to ensure that
board members fulfill their fiduciary duty.
Another interesting case of changing attitudes on the subject of CEOs compensation is the
public apologies made by the president of Barclays to the stockholders about the annual
bonus of the general manager of the firm. Indeed, he was to receive a bonus of 17.7 million
pounds (almost 22 million euros) for 2011 despite a fall of the financial results of the
company. In France, a similar debate appeared in April 2012, the CEO of Publicis received
16 million euros of bonus for the period 2003-2011 while he asked to the employees to
make a global effort to deal with the financial crisis. Cynically, the same CEO wrote a letter
with other French CEOs to ask to be more taxed. In the midst of elections, this case created
a scandal.
The first data that we have about the CEOs remuneration in 2011, given by the business
newspaper “Les Echos”, show mixed results. Indeed, 19 CEOs have an increase of their
compensation compared to the data of 2010, 18 a decrease and 3 have a stable
remuneration. Without analyzing too much these data, we can highlight the automotive
sector. Carlos Ghosn, the CEO of Renault, got an increase of his global compensation in
136% compared to 2010. The reason of this spectacular rise is due to the fact that he

Page 49
abandoned all of his bonuses in 2010 and not in 2011. Philippe Varin, the CEO of PSA, got
a decrease of 60% of his remuneration due to the fact that he didn’t get any bonuses in
2011.
Our paper participates to the literature by inquiring the correlation between CEO
compensation and the firm performance in France for a sample of 40 French companies
from the CAC 40 index for the period 2008-2010.
8.1. Research Question
The empirical results indicate, for the three years a strong positive link between three
important elements: the duration as CEO, the market capitalization of the company and the
non-executive ownership. Duration as CEO has a positive impact of 0.534 (average of the
three years), but the coefficient drop over the period of study. The capitalization of the
company has for its part a positive impact especially for 2009 and 2010. These ratios mean
that when the duration as CEO and/or the market capitalization of the firm increase, the
CEO compensation increases too. Those results are rather logical. Indeed, that suggests that
a larger company pay its CEO a higher compensation than a smaller one. One could
interpret that as a willing for the companies to attract the best CEOs and because a larger
company would be more difficult to manage than a smaller one. Moreover the tenure of the
CEO has an impact on his compensation like for any other employee: the more you stay in
a company the easier it is to negotiate your compensation. Indeed it is easier to negotiate a
salary after several years in the same company, you are fully efficient and you know really
well the company and its key success factors, it is also easier to require an increase of the
compensation since it will be very difficult for the company to find a substitute as efficient
as you. Finally this finding is also logical since the more you stay in a company the easier it
is to proof your value and deserve a rise of your compensation. Nevertheless, the findings
about CEO tenure are not really consistent with the ones of Ozkan (2011, p. 260-285).
Indeed, in her paper she didn’t find any correlation between CEO tenure and CEO
remuneration. Her results about this variable were really close to 0. Thus, this element
would have more impact in France than in the UK. But it is important to keep in mind that
the samples are different and the periods of study too.
Our findings also indicate an important but negative impact of many variables on the CEO
compensation. However, as we saw, many of the variables are not statistically significant so
we can only assume this result. The first significant result is the average negative impact (-
0.449) of institutional shareholders on CEO compensation. The block holder shareholders
have also a negative impact (-0.382) on CEO compensation. These results are in line with
the ones of Ozkan (2011, p. 260-285). Those elements would demonstrate the active
monitoring of these investors on the top management and especially on their remuneration.
Those are also consistent with the paper of Khan et al. (2002, p. 1078-1088) which
demonstrates the negative impact on CEO compensation of institutional ownerships when
they are concentrated. They also illustrated that the dispersion of institutional ownerships
has a positive impact on the level of CEO remuneration. This study was conducted in the
US.

Page 50
Our study didn’t find a strong correlation between the other variables as the board size or
sales for example and the level of remuneration of the CEO. That would mean that the
number of member of the board doesn’t significantly impact the discussion about the CEO
remuneration. In our study, the board size has an impact negative or close to zero while
Ozkan (2011, p. 260-285) found a promiscuous positive correlation between these two
elements. The findings about other variables are approximately similar.
Like in the Ozkan paper, we observed that there is no CEO pay-performance elasticity for
the Total and base salary: the control variables do not have a significant impact on changes
in CEO compensation.
8.2. Research Contribution
With this paper and the results we got, we believe that we contribute to the literature of
corporate finance and especially the problem of correlation between CEOs compensation
and firm performance in France.
The gap in the literature of CEOs compensation in France, allows us to enquiry this
particular topic and to provide evidences. As explained above, several elements impact,
positively or negatively, the CEOs compensation. Our findings are not exactly the same as
the one of Ozkan (2011, p. 260-285), which proves that the differences in countries as UK
and France and in periods provide different empirical results. France has several economic
and social specificities that can explain the differences between this Anglo-Saxon country
and the European one. We believe that the recent events mentioned above, as the non-
approval of the remuneration of the CEO of Citigroup or Sarbanes–Oxley Act of 2002, will
change the way of calculation and the level of the remuneration of the CEOs.
Thus, our findings are meaningful for this specific period and for this specific country. The
results leaded in another country or another period of time would be different than the ones
we got. Nevertheless, this study provides useful information for this period of after crisis.
The same kind of study could be leaded in other countries, following the same structure, the
same goals as ours. An international comparison could be interesting to conduct.
8.3. Future Research Recommendation
During the writing of this research, we figured that there were still several gaps in the
research literature:
- The literature about French companies and French CEOs are not that large.
- A qualitative research could be leaded to understand the motivations of each
person involved in the determination of the level of the CEO compensation.
- A qualitative research could be conducted on the impact of the CEO
remuneration on the employee’s feelings, work etc…

Page 51
- A study on smaller companies could be interesting to conduct.
- A study focused on the French index SBF 120, in order to have more accurate
results.
- Someone could make a study on the same topic as us but with different
variables as employee stock ownership.
- The same thesis subject but in other countries and/or times.

Page 52
References
Abowd, J. (1990). Does Performance-Based Managerial Compensation Affect Corporate
Performance?. Industrial and Labor Relations Review, 43(3), 52-73.
Abowd, J. and Bognanno M. (1995). International Differences in Executive and Managerial
Compensation. in R. Freeman, and L. Katz, ed., Differences and Changes in Wage
Structures, Chicago: The University of Chicago Press, 67-103.
Antle, R. and Smith A. (1986). An Empirical Investigation of the Relative Performance
Evaluation of Corporate Executives. Journal of Accounting Research, 24(1), 1-39.
Baker, G., Jensen, M. and Murphy, K. (1988). Compensation and Incentives: Practice vs
Theory. The Journal of Finance,18, 593-622.
Barclay, M., Gode D. and S. P. Kothari. (2005). Matching delivered performance. Journal
of Contemporary Accounting & Economics, 1, 1–25.
Barro, R. and Barro J. (1990). Pay, Performance, and Turnover of Bank CEOs. Journal of
Labor Economics, 8(4), 448-481.
Bausch, A. and Krist, M. (2007). The effect of context related moderators on the
internationalization-performance relationship: Evidence from meta-analysis. Management
International Review, 47, 1-29.
Bebchuk, L., Fried J. and Walker D. (2002). Managerial power and rentextraction in the
design of executive compensation, University of Chicago Law Review 69, 751-846.
Ben-David, I., Graham J. and Harvey C. (2008). Managerial overconfidence and corporate
policies, unpublished working paper.
Berle, A. and Gardiner M. (2009). The modern Corporation and private property. 10th
edition. New Brunswick: Transaction Publishers.
Berle A. and Means G. (1932). the modern corporation and private property. 2e edition,
1956, Mac Milan.
Bryman A. and Bell E. (2011). Business Research Methods. 3rd
edition. Oxford: University
Press
Bushee B. and Goodman T. (2007). Which Institutional Investors Trade Based on Private
Information about Earnings and Returns ?. Journal of Accounting Research, 45.
Cadbury, A. (1992). Report of the Committee on the Financial Aspects of Corporate
Governance. London: Gee & Co.

Page 53
Carroll, T. and Ciscel D. (1982). The Effects of Regulation on Executive Compensation,
The Review of Economics and Statistics, 64, 505-509
Charreaux G. et Pitol-Belin J.-P. (1990). Le conseil d’administration, Vuibert Gestion.
Chen A. and Hong B. (2006). Institutional ownership changes and returns around analysts’
earnings forecast release events: Evidence from Taiwan. Journal of Banking and Finance,
30, 2471-2488.
Cho, M. (1998). Ownership Structure, Investment, and the Corporate Value: An Empirical
Analysis. Journal of Financial Economics, 47, 103-121.
Coakley, J. and Iliopoulou, S. (2006). Bidder CEO and other executive compensation in
UK M&As. European Financial Management, 12, 609–31.
Colleman, B., (2011). Executive Compensation. Salary.com
<http://www.salary.com/advice/layouthtmls/advl_display_Cat14_Ser69_Par147.html>
[Retrieved 2012-05-22]
Conyon, M. (1997). Corporate Governance and Executive Compensation. International
Journal of Industrial Organization, 15(4), 493-510.
Conyon, M. and Murphy, K. (2000). The prince and the pauper? CEO pay in the United
states and United Kingdom. Economic Journal, 110, 640–71.
Conyon, M. and Schwalbach J. (1997). European Differences in Executive Pay and
Corporate Governance, Warwick Business School.
Cooper, M., Gulen H., and Schill M. (2008). Asset growth and the cross-section of stock
returns, Journal of Finance, 63, 1609-1651.
Core, J. and Guay, W. (1999). The use of equity grants to manage optimal equity incentive
levels. Journal of Accounting and Economics, 28, 151–84.
Core, J., Holthausen, R. and Larcker, D. (1999) Corporate governance, chief executive
officer compensation, and firm performance, Journal of Financial Economics, 51, 371-
406.
Coughlan, A. and Schmidt R. (1985). Executive Compensation, Management Turnover,
and Firm Performance: An Empirical Investigation. Journal of Accounting and Economics,
7(1-3), 43-66.
Daily, C., Dalton, D. and Cannella, A. (2003). Corporate governance: decades of dialogue
and data, Academy of Management Review, 28, 371-382
Diener, E. and Crandall, R. (1978). Ethics in social and behavioral research. Chicago:
University of Chicago press.

Page 54
Executive insight blog, (2010). The 2010 U.S. Top Executive Compensation Report
Published.Executiveinsight.typepad.com
<http://executiveinsight.typepad.com/executive_insight/2010/11/the-2010-us-top-
executive-compensation-report-published.html> [Retrieved 2012-05-13]
Fama E. (1980). Agency problems and the theory of the Firm. Journal of Political
Economy, 88 (21), 288-307.
Fama E. and Jensen M. (1983). Separation of ownership and control. Journal of Law and
Economics, 26, 195-235.
Ferreira M. and Matos P. (2008). The colors of investors’ money : The role of institutional
investors around the world. Journal of Financial Economics, 88, 499-533
Fich, M. and Shivdasani A. (2005). The impact of stock-option compensation for outside
directors on firm value. Journal of Business, 78, 2229-2254.
Gabaix, X. and Landier A. (2008). Why has CEO Pay Increase so Much?. Quarterly
Journal of Economics, 123, 49–100.
Gibbons, R. and Murphy, K. (1990). Relative Performance Evaluation for Chief Executive
Officers. Industrial and Labor Relations Review, 43(3), 30-51.
Gillan, S. and Starks, L. (2003). Corporate governance, corporate ownership, and the role
of institutional investors: A global perspective. Journal of Applied Finance, 13, 4–22.
Golec J. (2004). Are the insider trades of a large institutional investor informed ?. Finance
Department School of Business University of Connecticut Working Paper, 44.
Grossman, S. and Hart, O. (1983). An Analysis if the Principal-Agent
Problem. Econometrica, 51, 7-45
Hamilton, E., (1999). Financial performance indicators for Canadian business. statcan.gc.ca
< http://www.statcan.gc.ca/daily-quotidien/991115/dq991115a-eng.htm> [Retrieved 2012-
05-19]
Hamouda, M. (2010). Le bilan des stock-options en France de 1997 à 2003 (appraisal of
stock options in France from 1997 to 2003). Management et Avenir, 22, 149-167
Hartzell, J. and Starks, L. (2003). Institutional investors and executive compensation.
Journal of Finance, 58, 2351–74.
Hayes, R. and Schaefer, S. (2000). Implicit contracts and the explanatory power of top
executive compensation for future performance. Rand Journal of Economics, 31, 279-293.
Hayes, R. and Schaefer, S. (2009). CEO pay and the Lake Wobegon effect, Journal of
Financial Economics, 94, 280-290.

Page 55
Healy, P. (1985). The effect of bonus schemes on accounting decisions, Journal of
Accounting and Economics, 7, 85-107
Holmstrom, B. (1979). Moral hazard and observability. The Bell Journal of Economics, 10,
74–91.
Holthausen, R., Larcker D. and Sloan R. (1995). Annual bonus schemes and the
manipulation of earnings. Journal of Accounting and Economics, 19, 29–74.
Hubbard, R. and Palia D. (1995). Executive Pay and Performance: Evidence from the US
Banking Industry. Journal of Financial Economics, 39(1), 105-30.
INSEE and official statistics. (2011a). Quarterly national accounts - First results Q4 2010.
<http://www.insee.fr/en/themes/info-rapide.asp?id=26&date=20110215/> [Retrieved 2012-
05-18]
INSEE and official statistics. (2011b). Price index. < http://www.insee.fr/en/themes/info-
rapide.asp?id=29&date=20120112> [Retrieved 2012-05-18]
INSEE and official statistics. (2011c). Trade balance by product group.
<http://www.insee.fr/en/themes/tableau.asp?reg_id=0&ref_id=nattef08403&id=232>
[Retrieved 2012-05-18]
INSEE and official statistics. (2011d). The general government debt according to the
Maastricht definition. <http://www.insee.fr/en/themes/info-rapide.asp?id=40> [Retrieved
2012-05-18]
INSEE and official statistics. (2012a). The unemployment rate.
<http://www.insee.fr/en/themes/info-rapide.asp?id=14&date=20120301> [Retrieved 2012-
05-18]
Jensen, M. and Murphy, K. (1990). Performance Pay and Top-Management Incentives.
Journal of Political Economics, 98, 225-64
Jensen, M. and Meckling W. (1976). Theory of the Firm: Managerial Behavior, Agency
Costs and Ownership Structure. Journal of Financial Economics, 3 (4), 305-360
Kaplan, S. (1997). Top Executive Incentives in Germany, Japan, and the US: A
Comparison. In : Carpenter, J. and Yermack, D. (Eds.): Executive compensation and
Shareholder Value. Theory and Evidence. Kluwer: Dordrecht, 3-12.
Kato, T. (1997). Chief Executive Compensation and Corporate Groups in Japan: New
Evidence from Micro Data. International Journal of Industrial Organization, 15(4), 493-
510.
Khan, R., Dharwadkar, R. and Brandes P. (2002). Institutional ownership and CEO
compensation: a longitudinal examination. Journal of Business Research, 58, 1078-1088

Page 56
Kostiuk, P. (1990). Firm Size and Executive Compensation. Journal of Human Resources,
25(1), 90-105.
Le Maux J. (2004). Les déterminants de l’ampleur des bénéfices privés : Un test sur les
données françaises. Finance Contrôle Stratégie, 7(2), 195-231.
Leonard, J. (1990). Executive pay and firm performance. Industrial and Labor Relations
Review, 43, 13-29.
Leone, A., Wu J. and Zimmerman J. (2006). Asymmetric sensitivity of CEO cash
compensation to stock returns. Journal of Accounting and Economics, 42, 167–192.
Llense F. (2010). French CEOs’ Compensations: What is the Cost of a Mandatory Upper
Limit?. CESifo Economic Studies, 56(2), 165–191
Mahoney, M. (1979). Psychology of the scientist: An evaluative review. Social Studies of
Science, 9, 349-75.
Monaco, C. and Finet, A. (2011). L’activisme des investisseurs institutionnels sur la
gouvernance et le mode de gestion des entreprises : Le cas de Wendel au sein du groupe
Saint-Gobain (Activity of institutional investors on the firms’ governance and the
management method : Study case Wendel in the group Saint-Gobain). Université de Mons
Morck, R., Shleifer, A. and Vishny R. (1988). Management ownership and market
valuation: an empirical analysis. Journal of Financial Economics, 20, 293-315
Murphy, K. (1985). Corporate performance and managerial remuneration: n empirical
investigation. Journal of Accounting and Economic, 7, 11–42.
Murphy, K. (1999). Executive compensation. University of southern California.
Ozkan, N. (2007). Do corporate governance mechanisms influence CEO compensation? An
empirical investigation of UK companies. Journal of Multinational Financial Management,
17(5), 349–64.
Ozkan, N. (2011). CEO compensation and Firm Performance: An empirical investigation of
UK panel data. European Financial Management, 17, 260-285.
Rose, N. and Wolfram C. (1997). Regulating CEO Pay: Assessing the Impact of the Tax-
Deductibility Cap on Executive Compensation. MIT (December).
Rosen, S. (1981). The Economics of Superstars. The American Economic Review, 71, 845–
858.
Rust, R., Ambler T., Carpenter C., Kumar V. and Srivastava R. (2004). Measuring
Marketing Productivity: Current Knowledge and Future Directions. Journal of Marketing,
68, 76–89.

Page 57
Sapp, S. (2008). The impact of corporate governance on executive compensation. European
Financial Management, 14, 710–46.
Schoar, A. and Bertrand M. (2003). Managing with Style: The Effect of Managers on Firm
Policies. The Quaterly Journal of Economics, 118, 1169–1208.
Shaw, K. and Zhang, M. (2010). Is CEO Cash Compensation Punished for Poor Firm
Performance?. The accounting review, 85(3), 1065-1093
Simon, H. (1957). Models of Man: Social and Rational. New York: John Wiley and Sons,
Inc, 279.
Sloan, R. (1993). Accounting earnings and top executive compensation. Journal of
Accounting and Economics, 16, 55–100.
Smith, A. (1776). An Inquiry into the Nature and Causes of the Wealth of Nations. London:
W. Strahan and T. Cadell.
Sorescu, A. and Spanjol J., (2008). Innovation’s Effect on Firm Value and Risk: Insights
from Consumer Packaged Goods. Journal of Marketing, 72, 114–32.
Stickney, C. Brown, P. and Wahlen J., ed. (2004). Financial Reporting and Statement
Analysis. 5th
edition. Mason: Thomson South-western.
Stratégie et Management (2009). Les composantes de la rémunération du dirigeant (The
elements of the CEO remuneration). http://strategie-management.blogspot.se
Towers Perrin. (1997). Worldwide Total Remuneration. Stamford: Towers Perrin.
Towers Perrin. (2002). Worldwide Total Remuneration. Stamford: Towers Perrin.
Vigliano M-H. and Barré G. (2010). L’effet de la structure du réseau du dirigeant sur sa
rémunération (the effect of the network structure of the manager's on his remuneration).
Revue française de gestion, 202, 97-109.
Warner, J., Watts R. and Wruck K. (1988). Stock Prices and Top Management Changes.
Journal of Financial Economics, 20, 461-92.
Weisbach, M. (1988). Outside Directors and CEO Turnover. Journal of Financial
Economics, 20(1-2), 461-80.
Wikipedia.com, (2012). Taxation in France.
< http://en.wikipedia.org/wiki/Taxation_in_France#Taxes_on_incomes> [Retrieved 2012-
04-28]
Zhou, X. (1997). CEO Pay, Firm Size, and Corporate Performance: Evidence from Canada.
Canadian Journal of Economics, 33, 213-251