Embed Size (px)
Citation preview

Is the Meta-Analysis of Correlation Coefficients Accurate WhenPopulation Correlations Vary?
Andy P. FieldUniversity of Sussex
One conceptualization of meta-analysis is that studies within the meta-analysis are sampledfrom populations with mean effect sizes that vary (random-effects models). The conse-quences of not applying such models and the comparison of different methods have beenhotly debated. A Monte Carlo study compared the efficacy of Hedges and Vevea’s random-effects methods of meta-analysis with Hunter and Schmidt’s, over a wide range of conditions,as the variability in population correlations increases. (a) The Hunter–Schmidt methodproduced estimates of the average correlation with the least error, although estimates fromboth methods were very accurate; (b) confidence intervals from Hunter and Schmidt’s methodwere always slightly too narrow but became more accurate than those from Hedges andVevea’s method as the number of studies included in the meta-analysis, the size of the truecorrelation, and the variability of correlations increased; and (c) the study weights did notexplain the differences between the methods.
Keywords: meta-analysis, random-effects model, correlation coefficients
Meta-analysis is a statistical technique for assimilatingresearch findings that was developed because of the failureof discursive reviews to provide objective assessments ofthe substantive importance of empirical effects (see Wolf,1986). Although its objectivity can also be limited (e.g., bythe selective inclusion of studies and the difficulty in in-cluding all relevant studies because of unpublished researchfindings), Field (2001, 2003a, 2003b) reports a remarkableincrease in its usage since Glass (1976); Hedges and Olkin(1985); Rosenthal and Rubin (1978); Schmidt and Hunter(1977); Hunter, Schmidt, and Jackson (1982), and Hunterand Schmidt (1990a) made their groundbreaking contribu-tions. However, meta-analysis is not without controversyand recent debate has centered on the appropriate applica-tion of meta-analytic methods (e.g., Field, 2003a, 2003b;Hunter & Schmidt, 2000) and comparisons of different
methods (Field, 2001; Hall & Brannick, 2002; Johnson,Mullen, & Salas, 1995; Schulze, 2004). This article reviewsthese controversies before presenting empirical data com-paring two different methods over a wide range ofconditions.
Methods of Meta-Analysis
In meta-analysis, effect-size estimates from differentstudies are combined to try to estimate the true size of theeffect in the population. Although several effect-size esti-mates are available (e.g., the Pearson product–moment cor-relation coefficient, r; Cohen’s effect-size index, d; oddsratios; risk rates; and risk differences), they, at some level,represent the same thing and in some cases can be convertedinto one of the other metrics (see Rosenthal, 1991; Wolf,1986).1 The general meta-analytic framework is similar forall of these metrics: The population effect size is estimatedby taking effect sizes for individual studies, convertingthem to a common metric, and then calculating a weightedaverage effect size that has an associated standard error. Theweight given to a particular study is often based on thesample size for that study (usually the sampling variance ofthe effect size), which is an indicator of the samplingaccuracy of that particular study. Confidence intervals canbe constructed around the weighted average and its signif-icance can be determined from a z test. Meta-analysis can
1 These conversions can have statistical implications.
I am grateful to Steven Hall and Michael Brannick for theircooperation in discussing their simulation methods and to Huy Lefor doing an independent check of my simulation code. FrankSchmidt provided reviews that were constructive, detailed andeducational; he has been extremely generous with his time, ideasand technical and theoretical advice. This paper and my under-standing of meta-analysis have improved, r � 1, because of hisaltruism.
Correspondence concerning this article should be addressed toAndy P. Field, Department of Psychology, University of Sussex,Falmer, Brighton, East Sussex BN1 9QH, United Kingdom. E-mail: [email protected]
Psychological Methods2005, Vol. 10, No. 4, 444–467
Copyright 2005 by the American Psychological Association1082-989X/05/$12.00 DOI: 10.1037/1082-989X.10.4.444
444

also be used to assess the similarity of effect sizes acrossstudies using tests of homogeneity (Hedges & Olkin, 1985)or variance estimates (Hunter & Schmidt, 1990a, 2004).
Fixed- and Random-Effects Methods
One controversy within the meta-analysis literature is theappropriate application of methods (Field, 2003a, 2003b;Hunter & Schmidt, 2000). In essence, there are two ways toconceptualize meta-analysis: fixed- and random-effectsmodels (see Hedges, 1992; Hedges & Vevea, 1998; Hunter& Schmidt, 2000).2 The fixed-effect conceptualization as-sumes that studies in the meta-analysis are sampled from apopulation with a fixed effect size or one that can bepredicted from a few predictors; in the simplest case, theeffect size in the population is constant for all studiesincluded in a meta-analysis (Hunter & Schmidt, 2000). Thealternative is to assume that population effect sizes varyrandomly from study to study; that is, studies in a meta-analysis come from populations of effect sizes that arelikely to have different means. Population effect sizes can,therefore, be thought of as being sampled from a universe ofpossible effects—a “superpopulation” (Becker, 1996;Hedges, 1992).
Which of the two conceptualizations to use is controver-sial and this issue hinges on both the assumptions that canrealistically be made about the populations from whichstudies are sampled, and the types of inferences that re-searchers wish to make from the meta-analysis. On theformer point, there has been support for the position thatreal-world data are likely to have variable population pa-rameters (Field, 2003a; Hunter & Schmidt, 1990b, 2000;National Research Council, 1992; Osburn & Callender,1992) and empirical data have shown that real-world datado not conform to the assumption of fixed population pa-rameters (Barrick & Mount, 1991). Figure 1 shows thedistribution of between-studies standard-deviation estimatescalculated (where data were available) for all meta-analyticstudies using correlation coefficients published in Psycho-logical Bulletin during 1997–2002.3 These estimates arebased on the Hunter-Schmidt method (they are the squareroot of Equation 15, described later). This histogram showsthat the meta-analytic studies typically give rise to between-studies standard deviation estimates ranging from 0 to 0.3,with values of 0 being very common. However, wheneffect-size variability is present, it is most frequently in theregion of 0.10–0.16 (which is broadly consistent with Bar-rick & Mount, 1991), and values as high as 0.3 are relativelyinfrequent.
With regard to the latter point, Hedges and Vevea (1998)suggested that the choice of model depends on the type ofinferences that the researcher wishes to make: Fixed-effectmodels are appropriate for inferences that extend only to thestudies included in the meta-analysis (conditional infer-ences) whereas random-effects models allow inferences that
generalize beyond the studies included in the meta-analysis(unconditional inferences). Psychologists typically wish tomake generalizations beyond the studies included in themeta-analysis and so random-effects models are more ap-propriate (Field, 2003a; Hunter & Schmidt, 2000).
This debate has been exacerbated by the fact that fixed-and random-effects meta-analytic methods are frequentlyincorrectly applied. Despite some good evidence that real-world data support a random-effects conceptualization, psy-chologists routinely apply fixed-effects meta-analytic meth-ods to their data. For example, Hunter and Schmidt (2000)listed 21 recent examples of meta-analytic studies usingfixed-effects methods in the major review journal for psy-chology (Psychological Bulletin) compared to none usingrandom-effects models. The theoretical consequence, ac-cording to Hunter and Schmidt (2000), is that the signifi-cance tests of the average effect size should not control the
2 A mixed-effects model exists too in which population effectsizes differ but their variability is explained by a moderator vari-able that is treated as “fixed” (see Overton, 1998) and also includesadditional random heterogeneity.
3 Several studies provided multiple values because each studytypically involved several meta-analyses conducted on differentpredictors or outcomes.
Figure 1. Histogram showing the frequency of different levels ofvariability between effect sizes in meta-analytic studies usingcorrelation coefficients published in Psychological Bulletin, 1997–2002. The estimate of the population standard deviation was cal-culated using Hunter and Schmidt’s method (the square root ofEquation 15).
445META-ANALYSIS OF CORRELATION COEFFICIENTS

Type I error rate: They predicted inflated error rates ofbetween 11 and 28%. In fact, Field (2003a) has shown usingMonte Carlo simulations that Type I error rates are inflatedfrom 5% to anywhere between 43 and 80%. So, of the 21meta-analyses reported by Hunter and Schmidt (2000) any-where between 9 and 17 of them are likely to have reportedsignificant effects when in reality no true effect may haveexisted within the population (see Field, 2003a).
One function of the homogeneity of effect-size measuresmentioned earlier is to ascertain whether population effectsizes are likely to be fixed or variable, through inferencefrom the variability in sample effect sizes (Hedges & Olkin,1985). The rationale is that if homogeneity tests yield non-significant results then sample effect sizes are roughlyequivalent and so population effect sizes are likely to behomogenous (and hence the assumption that they are fixedis reasonable). Even if we overlook the fact that researchersoften ignore these tests (e.g., 17 of the 21 meta-analyseslisted by Hunter & Schmidt, 2000, used fixed-effect meth-ods despite significant homogeneity tests), the tests them-selves can be misleading because they sometimes have beenclaimed to have low power to detect genuine variation inpopulation effect sizes (Hedges & Pigott, 2001; Sackett,Harris, & Orr, 1986; but see Field, 2001, who showed thattheir power is high). Consequently, researchers can be mis-led into concluding that population effect sizes are fixedwhen they are, in fact, variable.
Comparing Methods
Since the early work of Glass (1976) two methods ofmeta-analysis have remained popular: the methods devisedby Hedges and colleagues, and those of Hunter and Schmidt(1990a, 2004).4 Hedges and colleagues (Hedges, 1992;Hedges & Olkin, 1985; Hedges & Vevea, 1998) have de-veloped both fixed- and random-effects models for combin-ing effect sizes, whereas Hunter and Schmidt (and Hunter,Schmidt, & Jackson, 1982) label their method a random-effects model (see Hunter & Schmidt, 2004; National Re-search Council, 1992; Schmidt & Hunter, 1999) although inearlier writings they were less explicit in defining it in theseterms (Hunter & Schmidt, 1990a). The second main con-troversy in the meta-analysis literature is which of these twomethods should be applied. This article looks at methods forcombining effect sizes expressed as correlation coefficients, r.
Hedges and colleagues’ method (Hunter & Schmidt,1990a; H-V). In this method, correlations are first con-verted into a standard normal metric (using Fisher’s r-to-Ztransformation) before calculating a weighted average ofthese transformed scores. Fisher’s (1921) r-to-Z transforma-tion is given in Equation 1 in which ri is the correlationcoefficient from study i
Zri�
1
2Loge�1 � ri
1 � ri� (1)
which has an approximate normal distribution with mean z��,and variance 1/(ni–3), where ni is the number of cases orpairs of data in the study. The transformation back to ri issimply
ri �e �2zi� � 1
e�2zi� � 1(2)
The transformed effect sizes are then used to calculate aninitial average in which each correlation is weighted by theinverse of the within-study variance of the study from whichit came (for Fisher zr values the sample size, ni, minusthree)— see Equation 35, and where k is the number ofstudies in the meta-analysis (Hedges & Olkin, 1985, p. 231):
Zr �
�i�1
k
wizri
�i�1
k
wi
�
�i�1
k
�ni � 3� zri
�i�1
k
�ni � 3�
(3)
This average is then used to calculate a test of the homo-geneity of correlations: The squared difference betweeneach study’s observed transformed r and the mean trans-formed r (from Equation 3), weighted by the within-studyvariance, is used. This gives us the statistic Q in Equation(4), which has a chi-square distribution with k – 1 degreesof freedom under the null hypothesis of homogenous effectsizes (Hedges & Olkin, Equation 16, p. 235):
Q � �i�1
k
�ni � 3�� zri� z� r�
2. (4)
To calculate the random-effects average correlation, theweights use a variance component that incorporates bothbetween-studies variance and within-study variance. Thebetween-studies variance is denoted by �2 and an estimateof it (� 2) is simply added to the within-study variance. Theweighted average in the zr metric is (based on Hedges &Vevea, 1998, Equation 12)
Z*r �
�i�1
k
w*izri
�i�1
k
w*i
, (5)
4 A third method developed by Rosenthal and Rubin (seeRosenthal, 1991) is popular but exists only in a fixed-effect formand differs from Hedges’ method only in how the significance ofthe mean weighted effect size is calculated (see Field, 2001).
5 This is the average effect size used in the fixed-effects model.
446 FIELD

in which the weights �w*i � are defined as (based on Hedges& Vevea, 1998, Equation 14)
w*i � � 1
ni � 3� � 2��1
. (6)
The between-studies variance can be estimated in severalways (see Friedman, 2000; Hedges & Vevea, 1998; Over-ton, 1998; Takkouche, Cadarso-Suarez, & Spiegelman,1999), however, Hedges and Vevea (1998, Equation 10) useEquation 7, which is based on Q (the weighted sum ofsquared errors in Equation 4), k, and a constant, c, such that
� 2 �Q � �k � 1�
c, (7)
where the constant, c, is defined as
c � �i�1
k
wi �
�i�1
k
�wi�2
�i�1
k
wi
, (8)
and for correlations, because wi � ni – 3, c is
c � �i�1
k
�ni � 3� �
�i�1
k
�ni � 3�2
�i�1
k
�ni � 3�
. (9)
If the estimate of between-studies variance, � 2, yields anegative value then it is set to zero (because the variancebetween-studies cannot be negative). The estimate, � 2, issubstituted in Equation 6 to calculate the weight for aparticular study, and this in turn is used in Equation 5 tocalculate the average correlation. This average correlation isthen converted back to the r metric using Equation 2 beforebeing reported.
The sampling variance of the untransformed average cor-relation is the reciprocal of the sum of weights and thestandard error of this average correlation is the square rootof this sampling variance. Bearing in mind that the weightsare calculated using Equation 6 the standard error is (seeHedges & Vevea, 1998, p. 493)
SE�z*r� � � 1
�i�1
k
w*i
. (10)
Hedges and Olkin (1985) recommend constructing a con-fidence interval around the average effect size, which is
easily done using the standard error and z�/2, the two-tailedcritical value of the normal distribution (which is 1.96 forthe most commonly used 95% confidence interval). Theupper and lower bounds are calculated by taking the averageeffect size from Equation 5 and adding or subtracting itsstandard error multiplied by 1.96:
CIUpper � z*r � 1.96SE�z*r�,
CILower � z*r � 1.96SE�z*r� (11)
These values are again transformed back to the r metricusing Equation 2 before being reported.
Hunter and Schmidt method. This method emphasizesthe need to isolate and correct for sources of error such assampling error and reliability of measurement scales. Al-though these recommended corrections are undoubtedly themethod’s great strength, this study deals only with themethod in its simplest form. Hunter and Schmidt (2004, p.81) recommend using untransformed effect-size estimates,ri, to calculate the weighted mean correlation, and theweight used is simply the sample size, ni:
r� �
�i�1
k
niri
�i�1
k
ni
. (12)
Hunter and Schmidt (2004) argue that the variance acrosssample correlations will be made up of the variance ofcorrelations in the population and the sampling error; there-fore, to estimate the variance in population correlations wehave to correct the variance in sample correlations by thesampling error. The variance of sample correlations is thefrequency weighted average squared error. Equation 13,from Hunter and Schmidt (2004, p. 81, 89), shows this:
�r2 �
�i�1
k
ni�ri � r��2
�i�1
k
ni
. (13)
The sampling error variance is calculated using the aver-age correlation, r�, and the average sample size, N� , (seeHunter & Schmidt, 2004, p. 88):
�e2 �
�1 � r�2�2
N � 1. (14)
It is a simple matter to estimate the variance in populationcorrelations by subtracting the sampling error variance from
447META-ANALYSIS OF CORRELATION COEFFICIENTS

the variance in sample correlations (see Hunter & Schmidt,2004, p. 88):
��2 � �r
2 � �e2. (15)
Hunter and Schmidt recommend correcting this estimatefor artifacts (see Hunter & Schmidt, 2004, or Hall & Bran-nick, 2002 for details) and then constructing what they callcredibility intervals. These intervals are based on taking theaverage correlation (see Equation 12) and adding to orsubtracting from it the square root of the estimated popula-tion variance in Equation 15 multiplied by z�/2 (1.96 for a95% interval):
Credibility IntervalUpper � r� � 1.96���2,
Credibility IntervalLower � r� � 1.96���2. (16)
If confidence intervals are required (rather than credibilityintervals) these can be obtained by using the standard errorof the mean correlation. To obtain this standard error simplydivide the variance of sample correlations (given in Equa-tion 13) by the number of studies in the meta-analysis, k,and take the square root:
CIUpper � r� � 1.96��r2
k,
CILower � r� � 1.96��r2
k. (17)
Differences between methods. If we take the bare bonesversion of the Hunter-Schmidt method (described above),which does not correct for research artifacts other thansampling error, then the differences between this methodand Hedges’ random-effects method are (a) the use oftransformed or untransformed correlation coefficients, and(b) the difference in study weighting (which in turn createsdifferences in the estimates of the sampling error varianceof the mean).
The evidence on whether or not it is better to transform rhas been inconsistent. For example, although Silver andDunlap (1987) claimed that meta-analysis based on Fishertransformed correlations is always less biased than whenuntransformed correlations are used, they ignored the effectof the number of studies in the analysis: They did not reportresults for when different numbers of correlation coeffi-cients were being combined, nor did they report how manycorrelation coefficients were combined for the data pre-sented. Strube (1988) went on to demonstrate that as thenumber of studies increased there was no discernible dif-ference between the biases resulting from using Fishertransformed or untransformed correlations. In addition,transformed correlations were less biased than untrans-formed ones only when 3 or fewer studies were included in
the meta-analysis and sample sizes were 20 or less (whichwould be rare in the application of meta-analysis). How-ever, this study too was limited to the scenario in which amaximum of 20 studies were included in the meta-analysis.Schulze (2004) in a set of extensive simulations recentlyconcluded that computations based on z transformed valueswould invariably differ from those based on untransformed rs.
The second difference is in the study weighting.6 Hedgesand Vevea (1998) have argued that Hunter and Schmidt’smethod assumes that the between-studies variance is small;therefore, when between-studies variance is not small, thepractice of weighting studies by ni (see Equation 12) in theHunter–Schmidt (H-S) method should produce an inaccu-rate mean correlation (Hedges & Vevea, 1998). However,although both methods have estimates of the between-stud-ies variance that are truncated at zero (if computed valuesare negative, they are set to zero), unlike the H-S method,the Hedges–Vevea (H-V) method (Hedges and Vevea,1998) uses the estimate of between-studies variance as partof the study weights. Consequently, the accuracy of theaverage correlation is biased in this method too—especiallywhen the number of studies in the meta-analysis is small(see Hedges & Vevea, 1998).
Several recent studies have attempted to compare thesetwo methods. Johnson et al. (1995) compared the Hedges–Olkin (fixed-effect), Rosenthal–Rubin, and H-S meta-ana-lytic methods by manipulating a single data set to look at theeffects of the number of studies compared, the mean corre-lation of studies, the mean number of participants per studyand the range of effect sizes within the database. Theyconcluded that the methods converged in terms of the meancorrelation and estimates of the heterogeneity of effectsizes, but the significance of the mean correlation differedsubstantially across the methods: The H-S method reachedmore conservative estimates of significance than the othertwo methods and Johnson et al. concluded that it should beused only with caution.
Although this study was a good starting point, Schmidtand Hunter (1999) claimed that Johnson et al. (1995) usedthe wrong estimate of the standard error of the mean cor-relation and showed that, theoretically, when a correctedestimate was used, their method was comparable to theHedges–Olkin and Rosenthal–Rubin methods. Field (2001)also pointed out that Johnson et al. applied Hedges andOlkin’s method for d (by first converting each correlationcoefficient from r to d) rather than using the methods fordirectly combining rs (without converting to d), that the use
6 In both methods these different study weights consequentlyaffect the estimates of the standard error: In the H-V method thestandard error is clearly related to the study weights (see Equation10) and in the H-S method, the standard error (in Equation 17) isbased on the variance of observed correlations (Equation 13),which is also a function of the study weights.
448 FIELD

of a single database limited the generality of the findings,and that the H-S method had not been compared withHedges’ random-effects counterpart. Field (2001) rectifiedsome of these concerns by conducting a series of MonteCarlo simulations comparing the performance of the H-Sand Hedges and Olkin (fixed- and random-effects) methodsboth when population correlations were fixed, and whenthey were variable. The number of studies in the meta-analysis, the average sample size, and the size of the cor-relation in the population were systematically varied. Fieldfound that when comparing random-effects methods theH-S method yielded the most accurate estimates of popula-tion correlation across a variety of situations. However,neither the H-S nor Hedges and colleagues’ method con-trolled the Type I error rate when 15 or fewer studies wereincluded in the meta-analysis, and the method described byHedges and Vevea (1998) controlled the Type I error ratebetter than the H-S method when 20 or more studies wereincluded. Hall and Brannick (2002) conducted a similarstudy but looking at the methods within the context of testvalidation and found that the H-S method provided the mostaccurate estimates of the population correlation. Schulze(2004) has also done extensive simulation studies and basedon these findings recommends against using Fisher’s ztransform and suggests that the “optimal” study weightsused in the H-V method can, at times, be suboptimal inpractice. However, Schulze based these conclusions on us-ing the fixed-effects version of Hedge’s method (he did notexamine the method described by Hedges & Vevea, 1998)
The Current Study
Although Field (2001) and Hall and Brannick (2002) haveused simulation techniques to compare these two methodsunder a wider variety of situations than earlier researchers,their findings are still limited. Field restricted his simula-tions to a single degree of variability between effect sizesand extended his simulations only to when meta-analyses of30 studies were included (relatively few in real terms). Halland Brannick used a fairly restricted range of populationcorrelation variances. Furthermore, neither study systemat-ically investigated the source of the differences betweenmethods. Schulze (2004) took a different approach in hissimulations and used discrete distributions of the true cor-relation and it is unclear how much the simulation processitself contributes to the conclusions drawn about the relativemerits of the two methods. He also did not explicitly inves-tigate Hedges and Vevea’s (1998) random-effects method.As such, the current study aims to extend Field’s (2001);Hall and Brannick’s (2002) and Schulze’s (2004) work by(a) comparing two random-effects methods across a morediverse array of situations than Field and Hall and Brannick,(b) investigating whether technical aspects of the simula-tions affect the conclusions drawn, and (c) investigatingwhether the weights in the two methods are responsible for
the differences observed. A few general predictions can bemade:
1. Confidence intervals and estimates of the mean corre-lation from the H-V method should be less accurate whensmall numbers of studies are included in the meta-analysisand variability between effect sizes is small. This is becausethe study weights are based on estimates of between-studiesvariance that are truncated at zero.
2. If Hunter and Schmidt’s method utilizes sub optimalweights that do not take account of the variability betweenpopulation effect sizes (Hedges & Vevea, 1998), then esti-mates of the average correlation and its variability willbecome less accurate as the variability between populationeffect sizes increases.
3. A related prediction is that if the weights are respon-sible for the differences between the methods, the estimatesfrom the H-S method should improve if the H-V “optimal”weights are used (conversely, the H-V method should be-come less accurate if the weights are replaced with thosefrom the H-S method).
4. If the z transformation is a useful procedure then theH-S method should become less accurate (especially forsmall samples) as the correlation and standard deviation inthe superpopulation increases (because as these parametersincrease, the resulting population distribution becomes non-normal: negatively skewed and platykurtic). Conversely,Hedges’ method, because it uses Fisher’s transformation,should become relatively more accurate when the popula-tion distributions are skewed. However, if, as Schulze(2004) suggests, the Fisher’s z transformation is unneces-sary then the skew of the distribution of rs will not ad-versely affect H-S estimates.
5. Simulating meta-analysis using a superpopulation ofz-transformed values should favor the H-V method whereasa superpopulation based on r should favor the H-S method.
Monte Carlo Simulations General Method
The rationale behind all of the simulations in this articleis simple: If data are sampled from a population which itselfis sampled from a superpopulation with a known mean andstandard deviation, the accuracy of random-effects methodscan be ascertained by comparing the mean correlationagainst the known mean in the superpopulation. The stan-dard deviation within the superpopulation can also be ma-nipulated to look at how variability between populationeffect sizes influences the accuracy of different meta-ana-lytic methods (in terms of their average correlation and theconfidence intervals around that average).
The general approach was as follows: A distribution ofcorrelations with a known average and standard deviationwas created to act as a superpopulation, from which thepopulation correlation for each study in a meta-analysis wassampled. A sample of a given size was taken from a par-ticular population and the correlation coefficient calculated
449META-ANALYSIS OF CORRELATION COEFFICIENTS

and stored. Once a specified number of samples (represent-ing the number of studies in the meta-analysis) had beentaken from the populations, the two random-effects meta-analytic techniques were applied (the average correlationand 95% confidence intervals were calculated). The numberof samples in the meta-analysis, the relative size of thosesamples, and the standard deviation of superpopulation cor-relations were varied systematically to look at whether thesefactors influenced the accuracy of the methods. Also, bylooking at the average correlation across many trials it waspossible to ascertain the boundaries within which 95% ofaverage correlations fell. As such, a population confidenceinterval for the average correlation could be calculated bydiscarding the lower and upper 2.5% of estimated averagecorrelations from 100,000 trials.
The Superpopulation
All simulations were run using GAUSS for Windows 4.0(1984). A distribution of possible correlations was created(a superpopulation) from which the population correlationfor each study in a meta-analysis was sampled. Althoughthis distribution was theoretically normal, the exact shape ofthe distribution of �s sampled from this distribution de-pended on the values of the mean and standard deviation.This is discussed in due course (and in Figure 3). The meaneffect size of the superpopulation (��) was initially set to be0 and was then systematically changed to represent a small(�� � .1), medium (�� � .3), large (�� � .5), and a huge effectsize (�� � .8) based on Cohen’s (1988, 1992) guidelines forcorrelation coefficients.
As the mean correlations and their standard deviations getlarger, values in the superpopulation will begin to exceed 1(the upper bound of the correlation coefficient). To preventthis, two methods were used to define this superpopulation:
1. The superpopulation was treated as a distribution ofz-transformed correlations (see Equation 1), which are notconstrained to be less than 1. So, the z transformation wasfirst used to transform the mean correlation (0, .1, .3, .5 or.8), then a normal distribution with this mean and a specifiedstandard deviation (0.04, 0.08, 0.16 or 0.32)7 was created. Acorrelation was sampled from this distribution and wasback-transformed (see Equation 1) to create the correlationin the population (which would be less than 1).
2. The superpopulation was treated as a distribution of �s,but with a correction to prevent inadmissible values. Themean correlation (0, .1, .3, .5 or .8) and standard deviation(0.04, 0.08, 0.16 or 0.32) of correlation was set as before,and then a normal distribution with this mean was created.A correlation was sampled from this distribution but if itsvalue was greater than 1 or less than �1, it was rejected anda new correlation was sampled.
Once the mean correlation for the population had beensampled from the superpopulation, it was necessary to sim-ulate the process of “sampling” the sample correlation from
this population. This was achieved using the A matrixprocedure described by Mooney (1997) in which the corre-lation between two randomly generated normally distrib-uted variables is set using the Choleski decomposition of afixed correlation matrix. The correlation matrix contained asingle value, �, and pairs of normally distributed scores forni cases were then generated (ni was manipulated as de-scribed below) using this value and the A matrix procedurealready described. The correlation between these two vari-ables was then calculated and represented the samplecorrelation.
For each Monte Carlo trial a set number of studies wastaken from a given population and the average correlationand its confidence interval were calculated using both meth-ods. The proportion of these confidence intervals containingthe effect size in the superpopulation was calculated over100,000 Monte Carlo trials, and population confidence in-tervals were constructed (defined earlier).
The Mean and Standard Deviation of PopulationCorrelations
When the superpopulation was treated as a distribution of�s, the mean correlation of the superpopulation (��) wasinitially set to be 0 and was then systematically changed torepresent a small (�� � .1), medium (�� � .3), large (�� � .5),and a huge correlation (�� � .8). The standard deviation ofthe superpopulation was systematically varied to be 0.04,0.08, 0.16, and 0.32. These were set based on values of theestimates of standard deviation of population correlationsreported in Psychological Bulletin during 1997–2002 (seeFigure 1). The end result is a set of population standarddeviations that represent situations that range from almostno variability (0.04) through frequently reported variability(0.04 to 0.16) to around the largest reported variability(0.32). The intention was to present a full range of situationsso that data can fully inform real-world situations includingvalues at the very extreme of what could be found (i.e.,0.32).
When the superpopulation was treated as a distribution ofz-transformed correlations, the same values for the meansand standard deviations were used but were applied to thedistribution of zs; therefore, the actual means and standarddeviations of the back-transformed distribution (the distri-bution of �s) were smaller. Values of the actual means andstandard deviations for all combinations used in the mainstudy were estimated using the data simulation function ofExcel with 10000 data points generated for each cell. Theresulting values can be found in Table 1.
7 In this case the correlation standard deviation will be smallerthan these values, because it was applied to a distribution of zsrather than rs (see Table 1).
450 FIELD

Number of Studies
The number of studies, k, used in the meta-analysis wasmanipulated by varying it from 5 to 160, with 6 values: 5,10, 20, 40, 80 and 160. Field (2001) varied the number ofstudies in the meta-analysis only from 5 to 30, so the rangeof numbers of studies in the present simulation is much wider.
Average Sample Size
The average size of each sample in the meta-analysis wasalso varied. In most real-life meta-analyses study samplesizes are not equal; so to model reality sample sizes weredrawn from a normal distribution of possible sample sizes,with the mean of this distribution being systematically var-ied. Sample sizes were randomly taken from a distributionwith a fixed mean (20, 40, 80 or 160) and a standarddeviation of a quarter of that mean. Although by takingsample size values from a population an additional source ofvariance is introduced into the simulations, this approachwas taken because in real-life meta-analyses study samplesizes do vary (otherwise there would be no point in weight-ing studies based on their sampling accuracy). As such thismethod more accurately represents what happens in realitythan if sample sizes were held constant (Field, 2003a, 2001,and Hall & Brannick, 2002 used similar methods).
Values of the average sample size, n� , were set usingestimates of the sample size necessary to detect small,medium and large effects in the population based on a singlestudy. The sample sizes needed to detect a small, medium orlarge effect in a single study with power � .8 are approx-imately 150, 50, 25, respectively (see Cohen, 1988). Assuch, values were set at n � 20, 40, 80 and 160. The onerestriction was that any sample sizes less than 4 werediscarded and replaced because Hedges’ method of meta-analysis requires a sample size of at least this size.
Design
In all simulations the design was a four factor, 5 (meansuperpopulation correlation: 0, .1, .3, .5, .8) � 4 (standarddeviation of superpopulation: 0.04, 0.08, 0.16, 0.32) � 4(average sample size: 20, 40, 80, 160) � 6 (number ofstudies: 5, 10, 20, 40, 80, 160), design. For each level ofthese 480 combinations 100,000 Monte Carlo trials wereused (100 times as many as the minimum recommended byMooney, 1997). Each cell of the design contained 100,000cases of data (48,000,000 samples of data were simulated inall).
Having said this, the results for certain combinations ofthe mean superpopulation correlation and standard devia-tions were omitted because they represent unrealistic situa-tions. In reality, values of � in the superpopulation wouldnever reach their maximum value of 1 because of themeasurement error that is always present in whatever mea-sures are used. Even assuming extremely high reliability ofmeasures (e.g., .9), and the maximum possible correlationbetween constructs of 1, the maximum value of � in thesuperpopulation would be
�.9�.9��1/ 2 � 1 � .9.
As such, values above .9 in the superpopulation are un-realistic.8 By converting .9 to a z-score and using tables ofthe normal distribution (e.g., Field, 2005) it is clear, forexample, that in a superpopulation with a mean correlationof .8 and a standard deviation of 0.32 that (z � (.9-.8)/0.32 � 0.31) 37.83% of �s in the superpopulation will beabove .9. Results are reported for situations in which lessthan 5% of �s in the superpopulation fall above .9; so, alllevels of the standard deviation are reported for mean cor-relations up to .3 (maximum number of �s above .9 �3.04%), but only standard deviation values up to 0.16 arereported for a superpopulation mean of .5 and only a stan-dard deviation value of 0.04 is reported for the maximumsuperpopulation mean of .8 (in both cases only 0.62% of �swould fall above .9).
Results
Simulation 1: Comparing the Methods
The first simulation compared the average correlationsand their confidence intervals when the superpopulation wasconstructed using z-transformed values (described as method 1above). Figure 2 shows the estimated average correlation andthe boundaries between which 95% of average correlationsfrom the Monte Carlo simulations fell; both are expressed interms of the deviation from the true correlation (values ofwhich are in Table 1) and so can be directly compared acrossthe different parameters of the simulation.
8 I am grateful to Frank Schmidt for pointing this out.
Table 1Actual Means and Standard Deviations of the Distributions of �Simulated by an Fz Transformation
Simulated ��
SD(Fz)
0.04 0.08 0.16 0.32
Actual mean of distribution
.0 .0000 .0000 .0000 .0002
.1 .0995 .09900 .0972 .0912
.3 .2909 .2900 .2848 .2679
.5 .4615 .4598 .4531
.8 .6634
Actual standard deviation of distribution
.0 0.0399 0.0795 0.1561 0.2932
.1 0.0395 0.0787 0.1547 0.2910
.3 0.0366 0.0729 0.1440 0.2749
.5 0.0315 0.0629 0.1253
.8 0.0224
451META-ANALYSIS OF CORRELATION COEFFICIENTS

(Figure 2)
452 FIELD

The H-V method yielded average correlations within .031of the actual correlation in all conditions (the maximumdeviation being when the superpopulation correlation was .3and the standard deviation of the superpopulation was large(0.32)—in all other conditions average correlations werewithin .015 of the actual correlation. These results areinconsistent with Field (2001) who found that the H-Vmethod substantially overestimated the mean correlation.The H-S method generally produced more accurate averagecorrelations than the H-V method with the maximum devi-ation being –.010 (which occurred when the actual correla-tion was at the extreme value of .80). Although thesefindings are in line with Hedges and Vevea’s (1998) beliefthat because Hunter and Schmidt’s method does not weightstudies using the between study variance it will underesti-mate the average correlation, these underestimations wereminimal and less than the overestimation produced by theH-V method. When the mean superpopulation correlationwas zero the H-S estimates were always accurate, when thesuperpopulation correlation increased to .1, .3, .5, and .8, theunderestimation ranged from .000 to .003, .000 to .007, .000to .010, and .001 to .010, respectively.
Figure 2 also shows the population confidence intervalsfor the two methods: These are empirically determinedlimits within which 95% of observed population effect sizeestimates fell. These population confidence intervals werefairly comparable across methods. Generally, the confi-dence intervals became tighter around the average as thenumber of studies in the meta-analysis increased but be-came wider as the standard deviation of superpopulationcorrelations increased. For example, when there was noeffect in the superpopulation, average correlations rangedfrom, in their extreme, �.35 to �.35 when the standarddeviation of superpopulation correlations was extreme(�� � 0.32) and the number of studies in the meta-analysiswas small (k � 5). For both methods, when the standarddeviation of superpopulation correlations was large (�� �0.16 to 0.32) it was possible to obtain erroneously small tomedium average correlations unless about 40 (�� � 0.16) or80 (�� � 0.32) studies were included in the meta-analysis.However, when the standard deviation of superpopulationcorrelations was small (�� � 0.04 to 0.08) small to medium
average correlations were obtained only when 20 or fewerstudies were included in the meta-analysis. When there wasa nonzero effect in the superpopulation, to keep averagecorrelation estimates within .1 of the true value, then 40 ormore studies needed to be included if the mean effect in thesuperpopulation was small to medium (�� � .1 or .3), and thestandard deviation of correlations, ��, was greater than orequal to 0.16. If the correlation in the superpopulation waslarge (�� � .5), or if the standard deviation of correlationswas smaller (�� � 0.08) only 10–20 or more studies wererequired to keep estimates within .1 of the true value.However, when the standard deviation of superpopulationcorrelations was small (�� � 0.04) population confidenceintervals were fairly tight even with only 5 studies in themeta-analysis. There was also a relationship between theaverage sample size of studies and the standard deviation ofeffect sizes: At large standard deviations (�� � 0.32) theconfidence intervals were relatively unaffected by differ-ences in study sample sizes, but as the standard deviation ofeffect sizes got smaller, the confidence intervals becamewider as study sample sizes decreased.
Simulation 2: Does the Shape of theSuperpopulation Influence the Results?
As the mean correlation in the superpopulation increasesand as the standard deviation of this population increases,the distribution of correlations becomes skewed becausecorrelation coefficients cannot exceed 1, and so there will bea build up of sample correlations just below 1. One way tomodel this is as in the first simulation: The superpopulationwas treated as a population of z-transformed correlations(see Equation 1), which are not constrained to be less than1. For the H-S method the sampled correlations were back-transformed to a correlation coefficient (see Equation 1)before any calculations were carried out. Regardless of therelative performance of the H-S and H-V methods, thissimulation method has the potential to make the H-V esti-mates better (because they are based on z-transformed cor-relation coefficients), and the H-S estimates worse, thanthey actually are. Simulation 2 sought to test this possibilityby rerunning simulation 1, but using a different superpopu-lation. In this simulation, the superpopulation was made upof r values (as described in method 2 above), but inadmis-sible correlations were rejected and a new correlation sam-pled until one was found with a value between �1 and 1.
The effect of these two methods of simulation can be seenin Figure 39, which shows the frequency distribution ofcorrelations in the population (when the superpopulation is
9 A smoothing routine was used to plot the curves of thedistributions and this resulted in the curves dropping below 0 inplaces and some other irregularities. Of course frequencies werenever below 0, but these curves give an overall impression of theshape of the distribution.
Figure 2. The deviation from the true value of average correla-tions (circles) and the lower and upper boundaries of the 95%confidence interval (triangles) from Hedges–Vevea (left panels)and Hunter–Schmidt (right panels) methods of meta-analysis whenthe superpopulation is based on z-transformed values. The averagesample sizes of studies in the meta-analysis are shown by the sizeof circles and triangles (smaller circles and triangles representsmaller average sample sizes). Average correlations and confi-dence intervals were compared to the values in Table 1. Valuesalong the x-axis indicate the number of studies in themeta-analysis.
453META-ANALYSIS OF CORRELATION COEFFICIENTS

(Figure 3)
454 FIELD

based on zr values, these values have been transformed backinto r for these graphs) as the mean correlation and itsassociated standard deviation in the superpopulationchanges. The main difference is what happens as the meancorrelation in the superpopulation becomes large or huge��� � .5 or greater): When the superpopulation containsz-transformed values, the distribution becomes leptokurtic,whereas when raw r-values are used, the distribution retainsa shape similar to that for smaller effects. As the standarddeviation of correlations increases to 0.16 or more, thedistributions start to deviate from normal distributions (notjust for large mean correlations). Table 2 shows the valuesof skew and kurtosis for each of these distributions andwhether the associated z test is significant.10
Another thing to note from Figure 3 is that when thesuperpopulation is based on r (as in the current simulation),the distributions become slightly truncated. One conse-quence of this truncation is that the true mean correlation forthese populations will not be the value set in the simulations(i.e., the true effects will not be 0, .1, .3, .5 and .8).Therefore, to evaluate the accuracy of the estimates from theH-V and H-S methods of meta-analysis it is important wecompare these estimates to the truncated mean of the su-perpopulation and not the value set in the simulation.Schmidt, Hunter, and Urry (1976) present equations forcalculating the mean and standard deviation of a truncatednormal distribution. For this example (using correlationstruncated at the top end of the distribution) the true mean ofthe distribution is given by Equation 18 in which pdfn(x) isthe Normal probability density function (pdf) of x, cdfn(x) isthe cumulative distribution function (cdf) of the Normaldistribution at x, and �� and �� are the mean and standarddeviation respectively of the distribution before truncation.Throughout this simulation, mean correlations from theH-V and H-S methods were compared to the true effect inthe superpopulation based on Equation 18.
�� Truncated � � pdfn�1 � ��
���
1 � cdfn�1 � ��
��� � ��� � �� (18)
Figure 4 shows the estimates of the average correlationand the boundaries between which 95% of average corre-
lations from the Monte Carlo simulations fell expressed asdeviations from the true effect in the superpopulation. Forthe H-V method, the results were, as predicted, worse thanthose of simulation 1: The profile of results was similar tosimulation 1 in that this method still tended to overestimatethe true correlation, but these overestimations were largerthan simulation 1. As the mean superpopulation correlation(before truncation) increased from 0, .1, .3, .5 to .8 theoverestimations ranged from .000 to .002, .000 to .018, .001to .052, .002 to .031, and .004 to .012, respectively. The H-Smethod performed relatively similarly under these simula-tion conditions to those in simulation 1. As the mean su-perpopulation correlation (before truncation) increased from0, .1, .3, .5 to .8 the deviations ranged from .000 to .002,.000 to –.003, .000 to –.007, –.001 to –.011, and .000 to–.008, respectively.
Confidence Intervals From Simulations 1 and 2
Table 3 shows the proportion of confidence intervalscalculated using the H-V equations that contained the truecorrelation from the superpopulation (the values in Table 1).These proportions ranged from .814 to .962. When thestandard deviation of correlations was small (�� � 0.04) theproportion of confidence intervals containing the true effectsizes was between .83 and .96. The vast majority of pro-portions fall between .94 and .96 (within .01 of the desired.95), the only exceptions were when the number of studiescombined was large (k � 160) and the true correlation was.3 or .5, and when 40 or more studies were combined andthe true correlation was .80. As the standard deviation ofcorrelations increased to 0.08, more confidence intervalsfailed to include the true correlation. When the true corre-lation was small (�� � 0 or .1), most proportions werebetween .94 and .96, however, for larger population corre-lations proportions fell between .94 and .96 only whenaverage sample sizes were less than 40 and fewer than 80studies were combined. When the standard deviation ofcorrelations was 0.16, confidence intervals included the truecorrelation on 94–96% of occasions only when the truecorrelation was small (�� � 0 or .1) and 40 or more studieswere combined. In all other situations less than 94% ofconfidence intervals contained the true correlation. Finally,when the standard deviation of correlations was large (�� �0.32), fewer than 94% of confidence intervals contained thetrue correlation except when the true effect was zero andmore than 40 studies were combined.
Table 4 shows the proportion of confidence intervalscalculated using equations based on H-S’s methodology thatcontain the true correlation from the superpopulation (based
10 These significance values need to be treated cautiously be-cause these distributions are based on large samples and, as Field(2005) notes, this results in low standard errors and, therefore,large values of z.
Figure 3. Frequency of population correlations as the averagecorrelation in the superpopulation and its standard deviation varies.Graphs are shown when z-transformed values of r were used tomodel the superpopulation (right panels) and when the superpopu-lation was based on values of r but with inadmissible valuesreplaced (left panels). Mean effect size in superpopulation isindicated as follows: Filled circles � 0.0; diamonds � 0.1; trian-gles � 0.3; inverted triangles � 0.5; squares � 0.8. Values alongthe x-axis indicate the effect size in the population.
455META-ANALYSIS OF CORRELATION COEFFICIENTS

on Table 1). It is worth remembering that H-S advocate theuse of artifact-corrected credibility intervals, and not theconfidence intervals constructed here (which have beenused because they are comparable to the H-V confidenceintervals). Nevertheless, the proportions for the H-S modelwere lower than the H-V model in general (they rangedfrom .830 to .949). The proportions were above .94 onlywhen 80 or more studies were included in the meta-analysisand when the true correlation was .3 or less. When the truecorrelation was .3 or less, the proportions got closer to thedesired .95 as the number of studies in the meta-analysisincreased; however, when the true correlation was .5 orlarger this was true only up to 40 studies included in themeta-analysis, with proportions dropping away from .95 asmore studies were included. There was no condition forwhich the proportion reached the desired .95 suggesting thatconfidence intervals were too narrow.
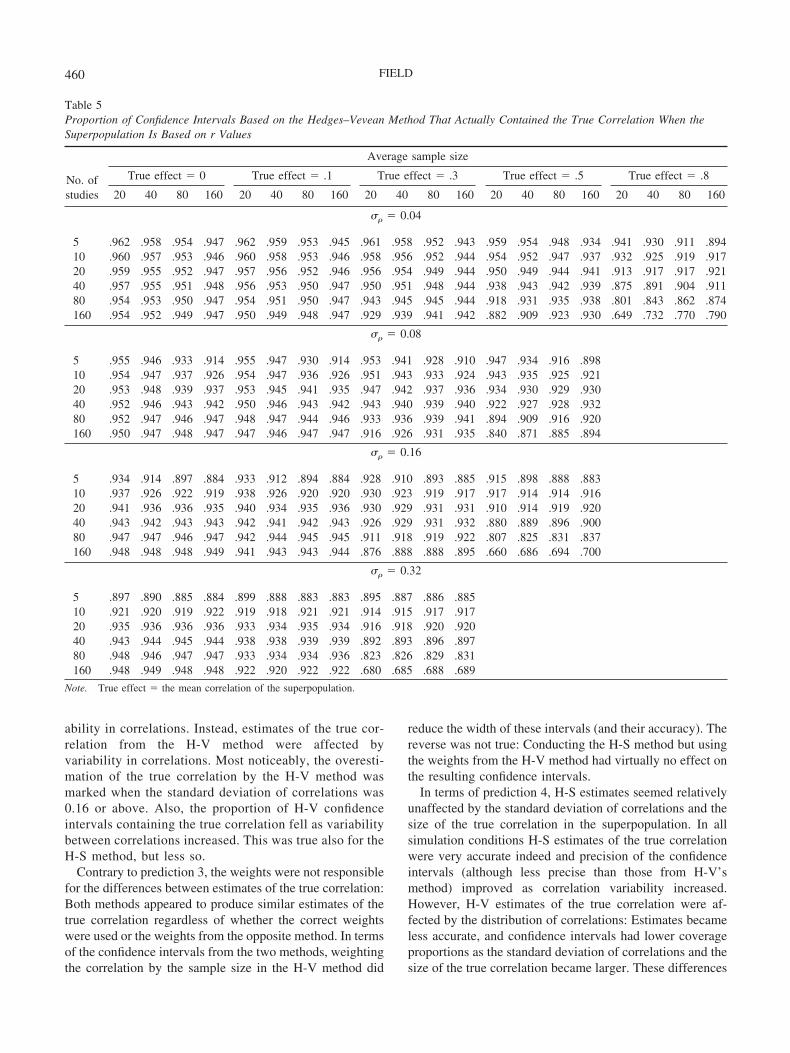
Tables 5 (H-V) and 6 (H-S) show the same information asTables 3 and 4 but when the superpopulation was based onvalues of r (in these cases the true correlations are thosecalculated using Equation 18). For the H-V method, theresults are broadly similar using this different superpopula-tion. The main differences are that proportions are lowerusing a superpopulation based on r when the true correlationwas .5 or more, 80 or more studies were in the meta-analysisand the standard deviation of correlations was 0.08 or less.When the standard deviation of correlations was 0.16, theproportions were lower using a superpopulation based on r
in all conditions when the true correlation was .3 or larger.When the standard deviation of correlations was 0.32, theproportions were lower using a superpopulation based on rwhen the true correlation was .1 or larger and 80 or morestudies were included in the meta-analysis. For the H-Smethod the results when the simulation was based on asuperpopulation of r values were virtually identical to whenthe superpopulation was based on z-transformed values. Assuch, the method of simulating the superpopulation made aslight difference for the H-V method (which performedslightly better when the superpopulation contained z-trans-formed values), but made very little difference in how wellthe H-S method performed.
To sum up, coverage proportions for H-S’s method werealways too low: These confidence intervals did not capturethe true effect in the superpopulation as often as theyshould. Coverage proportions from the H-V method weregenerally on target; however, when the variability of effectsizes was large the coverages were sometimes much lowerthan for H-S.
Simulations 3 and 4: The Effect of the Weights
One suggestion has been that the H-S method uses sub-optimal weights and so is inaccurate in random-effectssituations. Although the results shown in Figures 2 and 4 donot support this suggestion, simulations 3 and 4 tested thispossibility in another way by replicating simulations 1 and 2,but calculating each method using the weights from the oppo-site method. For the H-V method this entailed replacing the w*iin Equations 5 and 10, with ni. For the H-S method, thisentailed replacing ni with w*i in Equations 12 and 13. Thisprocess was used to try to tease apart the effect (if any) that theweights have on the accuracy of estimates of the mean corre-lation— it is not recommended for typical practice.
Figure 5 shows the estimates of the average correlationand the boundaries between which 95% of average corre-lations from the Monte Carlo simulations fell expressed asdeviations from the true size of the correlation. The resultswere virtually identical to simulation 1 (compare Figures 2and 5): The change in weights had virtually no effect on theestimates of the true correlation.
Table 7 shows the proportion of confidence intervalscalculated using the H-V equations that contain the true
Table 2Values of Skew and Kurtosis in Population Distributions
�� ��
Superpopulation
Based on r Based on z
Skew Kurtosis Skew Kurtosis
0.04 .0 0.012 �0.009 �0.010 0.012.1 0.000 �0.025 �0.032 �0.016.3 0.008 �0.062 �0.067* �0.008.5 �0.002 0.024 �0.110* 0.023.8 0.004 �0.017 �0.167* 0.021
0.08 .0 �0.004 �0.043 �0.002 �0.047.1 0.013 0.047 �0.029 �0.070*.3 0.013 0.033 �0.141* 0.032.5 �0.002 0.009 �0.214* 0.027
0.16 .0 �0.021 0.003 0.005 �0.184*.1 0.010 0.002 �0.096* �0.159*.3 �0.007 0.010 �0.247* �0.068.5 �0.024 �0.076* �0.412* 0.127*
0.32 .0 �0.001 �0.136* �0.005 �0.512*.1 �0.051* �0.142* �0.133* �0.468*.3 �0.165* �0.260* �0.388* �0.292*
* The associated z-test is significant at p .001, SESkew � .011, SEKurtosis
� .022 throughout.
Figure 4. The deviation from the true value of average correla-tions (circles) and the lower and upper boundaries of the 95%confidence interval (triangles) from Hedges–Vevea (left panels)and Hunter–Schmidt (right panels) methods of meta-analysis whenthe superpopulation is based on r values. The average sample sizesof studies in the meta-analysis are shown by the size of circles andtriangles (smaller circles and triangles represent smaller averagesample sizes). Values along the x-axis indicate the number ofstudies in the meta-analysis.
456 FIELD

(Figure 4)
457META-ANALYSIS OF CORRELATION COEFFICIENTS

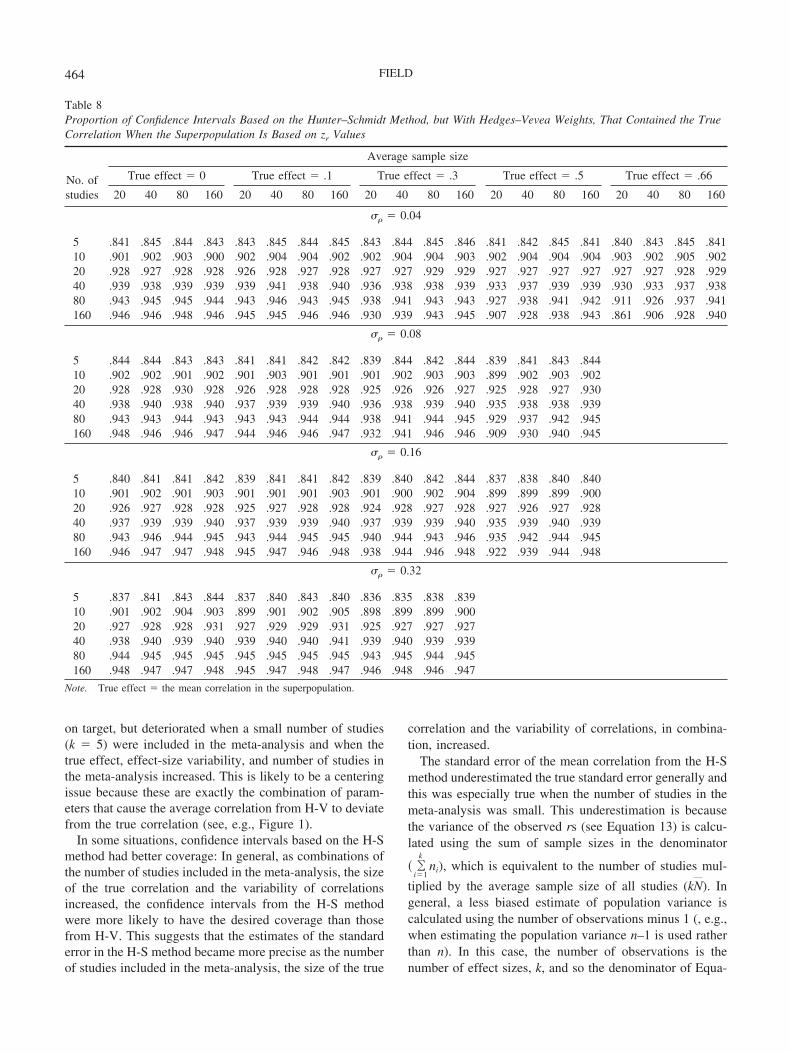
correlation from the superpopulation. In all cases the use ofH-S weights reduced the proportions to well below theexpected .95 (compare Tables 7 and 3). Also, the extent ofthis bias became greater as the population standard devia-tion increased and as the number of studies in the meta-analysis and the sample sizes of those studies increased. This isnot surprising because the H-S weights will be larger than theH-V weights, therefore, when they are replaced in Equation 10the resulting standard error of the mean z-transformed corre-lation will be smaller, and so too will be the resulting confi-dence intervals. This difference between the weights will in-crease as the between-studies variability estimate (� 2)increases, and as sample sizes increase. Given that the H-Sweights reduce the accuracy of the H-V confidence intervals,the next question is whether the H-V weights improve the H-Sconfidence intervals. Table 8 shows these results. It is clear
from comparing this table to Table 4, that using the H-Vweights in the H-S confidence intervals makes virtually nodifference: They show the same precision as before.
When the simulation was repeated but using a superpopu-lation based on r values, the findings were comparable toSimulation 211: Using the wrong weights made little differ-ence to the average correlation from each method, however,using ni in the H-V method dramatically reduced the pro-portion of confidence intervals that contained the true cor-relation (more so than when the superpopulation was basedon z-transformed values), and using w*i in the H-S methodhad no noticeable effect on the proportion of confidence
11 To save space, the results for this simulation are not presented(but are available from Andy P. Field).
Table 3Proportion of Confidence Intervals Based on the Hedges–Vevea Method That Actually Contained the True Correlation When theSuperpopulation Is Based on zr Values
No. ofstudies
Average sample size
True effect � 0 True effect � .1 True effect � .3 True effect � .5 True effect � .66
20 40 80 160 20 40 80 160 20 40 80 160 20 40 80 160 20 40 80 160
�� � 0.04
5 .962 .958 .955 .945 .962 .959 .954 .946 .962 .958 .954 .946 .960 .959 .955 .944 .958 .957 .954 .94510 .959 .957 .954 .945 .959 .958 .954 .945 .959 .956 .954 .947 .956 .957 .952 .947 .954 .955 .951 .94520 .958 .956 .952 .947 .957 .956 .952 .946 .955 .954 .953 .947 .952 .953 .950 .945 .946 .949 .949 .94440 .957 .953 .950 .947 .956 .955 .950 .947 .952 .951 .949 .946 .943 .948 .947 .945 .928 .939 .943 .94080 .954 .953 .950 .947 .954 .953 .949 .947 .944 .946 .946 .945 .927 .938 .942 .942 .896 .922 .932 .937160 .953 .951 .950 .947 .951 .949 .948 .947 .930 .939 .943 .944 .896 .922 .933 .937 .833 .889 .912 .924
�� � 0.08
5 .955 .947 .933 .914 .955 .946 .932 .914 .954 .947 .933 .914 .953 .944 .932 .91410 .955 .946 .936 .926 .954 .947 .936 .925 .952 .946 .936 .926 .950 .944 .935 .92620 .954 .948 .942 .936 .952 .947 .940 .936 .949 .944 .938 .934 .944 .942 .936 .93440 .951 .948 .943 .944 .950 .947 .943 .943 .945 .943 .940 .941 .934 .937 .934 .93680 .950 .947 .946 .945 .949 .946 .946 .945 .936 .938 .940 .942 .916 .924 .929 .933160 .952 .948 .947 .948 .946 .946 .946 .947 .922 .931 .935 .938 .876 .902 .915 .921
�� � 0.16
5 .936 .915 .895 .883 .935 .915 .896 .884 .934 .913 .895 .885 .931 .912 .894 .88110 .938 .926 .919 .917 .937 .927 .919 .918 .936 .923 .917 .918 .929 .919 .912 .91120 .940 .935 .935 .934 .939 .935 .934 .934 .933 .932 .930 .930 .925 .922 .922 .92340 .943 .942 .943 .943 .942 .941 .941 .942 .931 .932 .933 .933 .910 .916 .918 .91880 .946 .947 .945 .947 .944 .944 .945 .945 .920 .925 .926 .928 .879 .890 .896 .899160 .948 .948 .948 .949 .942 .943 .942 .945 .897 .907 .910 .911 .814 .837 .845 .851
�� � 0.32
5 .897 .886 .879 .879 .896 .883 .880 .875 .894 .878 .874 .87310 .921 .918 .919 .918 .918 .916 .917 .918 .910 .908 .907 .90920 .936 .935 .935 .938 .933 .934 .933 .936 .917 .920 .919 .91940 .942 .942 .942 .943 .938 .939 .939 .941 .910 .912 .913 .91480 .946 .947 .947 .947 .940 .939 .940 .940 .881 .884 .887 .885160 .949 .948 .948 .949 .934 .934 .935 .935 .822 .825 .825 .827
Note. True effect � the mean correlation in the superpopulation
458 FIELD

intervals containing the true correlation. As such the simu-lation process did not seem to interact with the weights ineach method.
Discussion
Estimates of the True Correlation
This article aimed to present extensive simulated dataabout the performance of the two most widely used random-effects methods of meta-analysis. Doing so has expandedearlier work (Field, 2001; Hall & Brannick, 2002; Schulze,2004) to provide detailed information about when thesemethods can be trusted, and present comparative data about
the relative strengths of the H-S and H-V methods. Somefirm conclusions emerge from the initial predictions.
First, contrary to prediction 1 the estimates of the truecorrelation were not noticeably inaccurate when small num-bers of studies were included in the meta-analysis. How-ever, confidence intervals were: When small numbers ofstudies based on small sample sizes were included in theanalysis, confidence intervals were too wide when the stan-dard deviation of correlations was small (�� 0.08); re-gardless of the sample size of studies, when the standarddeviation of correlations was large (�� 0.16) confidenceintervals were too narrow when small numbers of studieswere included in the meta-analysis.
Contrary to prediction 2, estimates of the true correla-tion from the H-S method were unaffected by the vari-
Table 4Proportion of Confidence Intervals Based on the Hunter–Schmidt Method That Actually Contained the True Correlation When theSuperpopulation Is Based on zr Values
No. ofstudies
Average sample size
True effect � 0 True effect � .1 True effect � .3 True effect � .5 True effect � .66
20 40 80 160 20 40 80 160 20 40 80 160 20 40 80 160 20 40 80 160
�� � 0.04
5 .843 .846 .844 .843 .845 .846 .844 .844 .845 .845 .845 .846 .843 .843 .845 .840 .842 .843 .845 .84110 .903 .903 .903 .900 .904 .905 .903 .901 .904 .904 .904 .902 .903 .904 .903 .903 .905 .903 .905 .90120 .929 .928 .927 .927 .928 .929 .927 .928 .928 .928 .928 .929 .928 .928 .927 .927 .929 .928 .927 .92840 .941 .938 .938 .938 .941 .941 .938 .939 .938 .938 .938 .939 .935 .937 .939 .938 .932 .934 .937 .93780 .945 .945 .944 .943 .945 .946 .943 .943 .939 .941 .942 .943 .929 .938 .941 .941 .912 .927 .936 .940160 .947 .946 .947 .945 .947 .945 .946 .945 .932 .939 .942 .944 .908 .928 .938 .942 .861 .906 .928 .939
�� � 0.08
5 .847 .844 .842 .841 .844 .842 .842 .840 .842 .845 .841 .841 .842 .841 .842 .84110 .904 .903 .900 .899 .903 .903 .900 .899 .902 .902 .902 .901 .901 .902 .902 .90020 .929 .928 .928 .925 .928 .928 .926 .925 .927 .926 .925 .924 .926 .928 .926 .92740 .939 .940 .936 .937 .938 .939 .937 .937 .938 .938 .937 .936 .936 .938 .936 .93680 .944 .943 .942 .940 .944 .943 .942 .941 .940 .941 .942 .942 .931 .937 .940 .942160 .949 .946 .944 .944 .945 .946 .944 .944 .933 .940 .943 .943 .911 .930 .938 .942
�� � 0.16
5 .841 .840 .837 .835 .840 .840 .838 .836 .840 .839 .838 .838 .838 .837 .836 .83410 .902 .899 .896 .897 .901 .899 .897 .898 .901 .899 .897 .898 .900 .897 .895 .89520 .926 .925 .923 .922 .925 .925 .923 .921 .925 .926 .923 .923 .927 .924 .922 .92140 .936 .936 .934 .934 .937 .935 .934 .934 .937 .936 .935 .934 .935 .936 .935 .93480 .942 .942 .939 .939 .942 .942 .940 .940 .939 .941 .938 .940 .934 .939 .939 .940160 .946 .944 .942 .943 .944 .943 .941 .942 .937 .941 .941 .942 .921 .937 .940 .942
�� � 0.32
5 .836 .836 .835 .835 .835 .834 .836 .831 .834 .830 .830 .83110 .898 .895 .897 .895 .896 .895 .895 .896 .895 .894 .891 .89120 .924 .922 .921 .922 .923 .923 .922 .924 .922 .921 .920 .91940 .934 .934 .932 .933 .934 .934 .934 .933 .935 .935 .933 .93280 .940 .939 .939 .938 .940 .939 .939 .939 .939 .939 .937 .938160 .943 .942 .939 .941 .941 .941 .940 .941 .941 .942 .940 .940
Note. True effect � the mean correlation in the superpopulation
459META-ANALYSIS OF CORRELATION COEFFICIENTS
ability in correlations. Instead, estimates of the true cor-relation from the H-V method were affected byvariability in correlations. Most noticeably, the overesti-mation of the true correlation by the H-V method wasmarked when the standard deviation of correlations was0.16 or above. Also, the proportion of H-V confidenceintervals containing the true correlation fell as variabilitybetween correlations increased. This was true also for theH-S method, but less so.
Contrary to prediction 3, the weights were not responsiblefor the differences between estimates of the true correlation:Both methods appeared to produce similar estimates of thetrue correlation regardless of whether the correct weightswere used or the weights from the opposite method. In termsof the confidence intervals from the two methods, weightingthe correlation by the sample size in the H-V method did
reduce the width of these intervals (and their accuracy). Thereverse was not true: Conducting the H-S method but usingthe weights from the H-V method had virtually no effect onthe resulting confidence intervals.
In terms of prediction 4, H-S estimates seemed relativelyunaffected by the standard deviation of correlations and thesize of the true correlation in the superpopulation. In allsimulation conditions H-S estimates of the true correlationwere very accurate indeed and precision of the confidenceintervals (although less precise than those from H-V’smethod) improved as correlation variability increased.However, H-V estimates of the true correlation were af-fected by the distribution of correlations: Estimates becameless accurate, and confidence intervals had lower coverageproportions as the standard deviation of correlations and thesize of the true correlation became larger. These differences
Table 5Proportion of Confidence Intervals Based on the Hedges–Vevean Method That Actually Contained the True Correlation When theSuperpopulation Is Based on r Values
No. ofstudies
Average sample size
True effect � 0 True effect � .1 True effect � .3 True effect � .5 True effect � .8
20 40 80 160 20 40 80 160 20 40 80 160 20 40 80 160 20 40 80 160
�� � 0.04
5 .962 .958 .954 .947 .962 .959 .953 .945 .961 .958 .952 .943 .959 .954 .948 .934 .941 .930 .911 .89410 .960 .957 .953 .946 .960 .958 .953 .946 .958 .956 .952 .944 .954 .952 .947 .937 .932 .925 .919 .91720 .959 .955 .952 .947 .957 .956 .952 .946 .956 .954 .949 .944 .950 .949 .944 .941 .913 .917 .917 .92140 .957 .955 .951 .948 .956 .953 .950 .947 .950 .951 .948 .944 .938 .943 .942 .939 .875 .891 .904 .91180 .954 .953 .950 .947 .954 .951 .950 .947 .943 .945 .945 .944 .918 .931 .935 .938 .801 .843 .862 .874160 .954 .952 .949 .947 .950 .949 .948 .947 .929 .939 .941 .942 .882 .909 .923 .930 .649 .732 .770 .790
�� � 0.08
5 .955 .946 .933 .914 .955 .947 .930 .914 .953 .941 .928 .910 .947 .934 .916 .89810 .954 .947 .937 .926 .954 .947 .936 .926 .951 .943 .933 .924 .943 .935 .925 .92120 .953 .948 .939 .937 .953 .945 .941 .935 .947 .942 .937 .936 .934 .930 .929 .93040 .952 .946 .943 .942 .950 .946 .943 .942 .943 .940 .939 .940 .922 .927 .928 .93280 .952 .947 .946 .947 .948 .947 .944 .946 .933 .936 .939 .941 .894 .909 .916 .920160 .950 .947 .948 .947 .947 .946 .947 .947 .916 .926 .931 .935 .840 .871 .885 .894
�� � 0.16
5 .934 .914 .897 .884 .933 .912 .894 .884 .928 .910 .893 .885 .915 .898 .888 .88310 .937 .926 .922 .919 .938 .926 .920 .920 .930 .923 .919 .917 .917 .914 .914 .91620 .941 .936 .936 .935 .940 .934 .935 .936 .930 .929 .931 .931 .910 .914 .919 .92040 .943 .942 .943 .943 .942 .941 .942 .943 .926 .929 .931 .932 .880 .889 .896 .90080 .947 .947 .946 .947 .942 .944 .945 .945 .911 .918 .919 .922 .807 .825 .831 .837160 .948 .948 .948 .949 .941 .943 .943 .944 .876 .888 .888 .895 .660 .686 .694 .700
�� � 0.32
5 .897 .890 .885 .884 .899 .888 .883 .883 .895 .887 .886 .88510 .921 .920 .919 .922 .919 .918 .921 .921 .914 .915 .917 .91720 .935 .936 .936 .936 .933 .934 .935 .934 .916 .918 .920 .92040 .943 .944 .945 .944 .938 .938 .939 .939 .892 .893 .896 .89780 .948 .946 .947 .947 .933 .934 .934 .936 .823 .826 .829 .831160 .948 .949 .948 .948 .922 .920 .922 .922 .680 .685 .688 .689
Note. True effect � the mean correlation of the superpopulation.
460 FIELD

cannot be explained by the differing weights in the twomethods (see above) and so these findings support Schulze’s(2004) general position that the Fisher z transformation isunnecessary (perhaps even unhelpful).
Finally, the way in which the superpopulation was sim-ulated did have an effect on the results obtained: Estimatesof the true correlation using the H-V method were betterwhen the superpopulation was based on z-transformed val-ues than when it was based on rs. However, estimates fromthe H-S method were unaffected, and the profile of resultsremained unchanged by the simulation procedure: H-S es-timates of the true correlation were as good as or better thanthose of the H-V method regardless of the simulation pro-cedure. The data on the accuracy of confidence intervalswas also unaffected in any substantive way by the simula-tion procedure: The H-V confidence intervals were more
accurate when the superpopulation contained z-transformedscores, but were more accurate (generally—see below) thanthose from the H-S method even when the superpopulationwas based on r values.
To sum up the findings about the accuracy of the esti-mates of the true effect, there was little to differentiate theH-V and H-S estimates of the true correlation when thestandard deviation of correlations was small (�� 0.08).However, H-V’s method overestimated the true correlationwhen the true correlation was large (�� .3) and the stan-dard deviation of correlations was also large (�� 0.16),and when the true correlation was small (�� .1) and thestandard deviation of correlations was at its maximum value(�� � 0.32). The H-S method produced very accurateestimates under all conditions (estimates were alwayswithin .011 of the true value).
Table 6Proportion of Confidence Intervals Based on the Hunter–Schmidt Method That Actually Contained the True Correlation When theSuperpopulation Is Based on r Values
No. ofstudies
Average sample size
True effect � 0 True effect � .1 True effect � .3 True effect � .5 True effect � .8
20 40 80 160 20 40 80 160 20 40 80 160 20 40 80 160 20 40 80 160
�� � 0.04
5 .846 .844 .843 .846 .847 .846 .843 .843 .845 .843 .843 .843 .843 .844 .843 .841 .838 .841 .838 .83710 .903 .904 .903 .903 .905 .903 .901 .901 .904 .902 .904 .901 .902 .904 .902 .902 .902 .900 .898 .89920 .929 .927 .928 .927 .928 .929 .928 .927 .928 .929 .928 .926 .929 .929 .928 .928 .926 .926 .924 .92540 .940 .940 .939 .940 .941 .939 .938 .939 .938 .939 .939 .938 .935 .937 .938 .937 .929 .933 .935 .93580 .945 .945 .944 .943 .945 .944 .944 .944 .939 .941 .942 .943 .926 .936 .940 .942 .908 .928 .937 .939160 .948 .948 .946 .945 .946 .945 .946 .945 .930 .940 .943 .944 .902 .926 .936 .943 .848 .907 .929 .938
�� � 0.08
5 .846 .843 .842 .840 .841 .838 .838 .836 .844 .842 .843 .842 .839 .842 .838 .83710 .904 .903 .902 .900 .901 .901 .898 .899 .903 .901 .901 .900 .902 .901 .900 .90020 .929 .929 .925 .926 .926 .924 .923 .924 .928 .926 .926 .927 .926 .925 .924 .92440 .939 .937 .937 .936 .937 .937 .934 .935 .938 .936 .937 .935 .935 .937 .936 .93680 .946 .943 .942 .942 .942 .942 .940 .939 .937 .941 .942 .941 .929 .936 .939 .940160 .947 .945 .945 .942 .944 .943 .941 .942 .932 .939 .941 .943 .906 .930 .937 .942
�� � 0.16
5 .844 .840 .839 .837 .841 .838 .838 .836 .840 .840 .838 .838 .837 .836 .837 .83610 .900 .900 .900 .898 .901 .901 .898 .899 .899 .899 .899 .897 .899 .898 .896 .89620 .927 .924 .924 .921 .926 .924 .923 .924 .925 .924 .923 .921 .925 .922 .923 .92040 .936 .936 .935 .935 .937 .937 .934 .935 .936 .935 .935 .934 .935 .935 .934 .93480 .943 .941 .940 .940 .942 .942 .940 .939 .939 .939 .939 .938 .935 .938 .939 .939160 .945 .944 .942 .943 .944 .943 .941 .942 .937 .941 .940 .941 .924 .936 .939 .941
�� � 0.32
5 .835 .838 .836 .836 .838 .836 .834 .835 .836 .835 .836 .83510 .897 .897 .895 .897 .896 .895 .896 .895 .895 .895 .895 .89520 .922 .922 .921 .920 .923 .921 .921 .920 .922 .921 .922 .92040 .934 .933 .934 .933 .935 .932 .933 .933 .935 .932 .935 .93280 .942 .938 .938 .938 .939 .939 .938 .939 .940 .939 .938 .935160 .941 .941 .940 .941 .944 .941 .941 .941 .939 .942 .942 .939
Note. True effect � the mean correlation of the superpopulation.
461META-ANALYSIS OF CORRELATION COEFFICIENTS

(Figure 5)
462 FIELD

The main deviation between the estimates from the twomethods was when effect-size variability was large (�� �0.32). Hall and Brannick (2002) believe that this level ofvariability is “somewhat unrealistic” and so perhaps these
findings are unimportant. However, Figure 1 shows thatvariability around this size can occur in real data, albeitrelatively infrequently, and so these findings do have rele-vance—although it is worth remembering that this situationreflects the very extreme of what would occur in real-worlddata.
95% Confidence Intervals
In terms of coverage proportions of the 95% confidenceintervals from the two methods, those from the H-V methodwere relatively more accurate than those from the H-Smethod. Coverage proportions for H-S’s method were al-ways too low and so these confidence intervals miss the trueeffect in the superpopulation more often than they should.Coverage proportions from the H-V method were generally
Table 7Proportion of Confidence Intervals Based on the Hedges–Vevea Method, but With Hunter–Schmidt Weights, That Contained the TrueCorrelation When the Superpopulation Is Based on zr Values
No. ofstudies
Average sample size
True effect � 0 True effect � .1 True effect � .3 True effect � .5 True effect � .66
20 40 80 160 20 40 80 160 20 40 80 160 20 40 80 160 20 40 80 160
�� � 0.04
5 .924 .931 .930 .915 .925 .932 .929 .916 .923 .932 .930 .916 .922 .932 .929 .914 .921 .930 .930 .91410 .923 .933 .930 .914 .924 .933 .929 .915 .924 .930 .929 .917 .919 .931 .928 .915 .917 .929 .927 .91420 .925 .932 .929 .915 .925 .932 .928 .915 .920 .930 .930 .916 .917 .928 .926 .914 .908 .924 .924 .91240 .926 .931 .928 .915 .924 .933 .928 .914 .918 .929 .926 .914 .907 .925 .924 .913 .886 .913 .920 .90780 .925 .932 .929 .915 .923 .933 .928 .915 .911 .925 .925 .913 .887 .915 .919 .908 .848 .896 .908 .901160 .925 .931 .930 .914 .921 .929 .928 .913 .894 .918 .921 .910 .849 .897 .910 .900 .771 .857 .885 .884
�� � 0.08
5 .911 .909 .881 .823 .911 .906 .881 .823 .910 .907 .879 .825 .908 .905 .878 .82510 .913 .907 .880 .823 .912 .908 .879 .822 .908 .907 .880 .824 .905 .904 .878 .82120 .913 .908 .882 .823 .911 .908 .880 .822 .906 .903 .877 .820 .901 .900 .874 .81840 .912 .909 .880 .824 .909 .907 .880 .822 .902 .901 .876 .819 .886 .893 .867 .81180 .912 .906 .881 .823 .910 .906 .879 .822 .892 .894 .871 .814 .864 .875 .855 .801160 .913 .906 .878 .823 .907 .904 .877 .821 .874 .883 .861 .803 .815 .845 .828 .773
�� � 0.16
5 .863 .816 .723 .604 .861 .816 .725 .604 .861 .814 .723 .602 .857 .812 .725 .60010 .863 .814 .724 .605 .860 .815 .723 .604 .857 .810 .720 .599 .850 .802 .713 .59220 .862 .815 .724 .603 .859 .815 .721 .603 .850 .806 .714 .594 .837 .791 .701 .58340 .861 .813 .726 .600 .858 .812 .722 .599 .841 .796 .706 .584 .810 .767 .676 .55780 .862 .815 .725 .601 .856 .810 .718 .599 .822 .777 .687 .565 .759 .722 .634 .518160 .861 .815 .724 .602 .851 .805 .713 .592 .781 .741 .653 .533 .663 .637 .552 .445
�� � 0.32
5 .708 .598 .473 .353 .708 .598 .471 .354 .703 .592 .464 .34910 .708 .596 .473 .354 .708 .596 .468 .353 .691 .581 .456 .34020 .708 .599 .468 .355 .707 .597 .464 .350 .678 .568 .447 .33640 .705 .597 .467 .353 .699 .591 .464 .346 .652 .544 .422 .31580 .709 .595 .467 .352 .695 .584 .456 .343 .593 .493 .378 .284160 .710 .595 .466 .353 .681 .570 .446 .333 .500 .403 .305 .226
Note. True effect � the mean correlation in the superpopulation
Figure 5. The deviation from the true value of average correla-tions (circles) and the lower and upper boundaries of the 95%confidence interval (triangles) from Hedges–Vevea (left panels)and Hunter–Schmidt (right panels) methods of meta-analysis whenthe wrong weights are used (the superpopulation is based onz-transformed values). The average sample sizes of studies in themeta-analysis are shown by the size of circles and triangles(smaller circles and triangles represent smaller average samplesizes). Average correlations and confidence intervals were com-pared to the values in Table 1. Values along the x-axis indicate thenumber of studies in the meta-analysis.
463META-ANALYSIS OF CORRELATION COEFFICIENTS
on target, but deteriorated when a small number of studies(k � 5) were included in the meta-analysis and when thetrue effect, effect-size variability, and number of studies inthe meta-analysis increased. This is likely to be a centeringissue because these are exactly the combination of param-eters that cause the average correlation from H-V to deviatefrom the true correlation (see, e.g., Figure 1).
In some situations, confidence intervals based on the H-Smethod had better coverage: In general, as combinations ofthe number of studies included in the meta-analysis, the sizeof the true correlation and the variability of correlationsincreased, the confidence intervals from the H-S methodwere more likely to have the desired coverage than thosefrom H-V. This suggests that the estimates of the standarderror in the H-S method became more precise as the numberof studies included in the meta-analysis, the size of the true
correlation and the variability of correlations, in combina-tion, increased.
The standard error of the mean correlation from the H-Smethod underestimated the true standard error generally andthis was especially true when the number of studies in themeta-analysis was small. This underestimation is becausethe variance of the observed rs (see Equation 13) is calcu-lated using the sum of sample sizes in the denominator
� �i�1
k
ni), which is equivalent to the number of studies mul-
tiplied by the average sample size of all studies (kN). Ingeneral, a less biased estimate of population variance iscalculated using the number of observations minus 1 (, e.g.,when estimating the population variance n–1 is used ratherthan n). In this case, the number of observations is thenumber of effect sizes, k, and so the denominator of Equa-
Table 8Proportion of Confidence Intervals Based on the Hunter–Schmidt Method, but With Hedges–Vevea Weights, That Contained the TrueCorrelation When the Superpopulation Is Based on zr Values
No. ofstudies
Average sample size
True effect � 0 True effect � .1 True effect � .3 True effect � .5 True effect � .66
20 40 80 160 20 40 80 160 20 40 80 160 20 40 80 160 20 40 80 160
�� � 0.04
5 .841 .845 .844 .843 .843 .845 .844 .845 .843 .844 .845 .846 .841 .842 .845 .841 .840 .843 .845 .84110 .901 .902 .903 .900 .902 .904 .904 .902 .902 .904 .904 .903 .902 .904 .904 .904 .903 .902 .905 .90220 .928 .927 .928 .928 .926 .928 .927 .928 .927 .927 .929 .929 .927 .927 .927 .927 .927 .927 .928 .92940 .939 .938 .939 .939 .939 .941 .938 .940 .936 .938 .938 .939 .933 .937 .939 .939 .930 .933 .937 .93880 .943 .945 .945 .944 .943 .946 .943 .945 .938 .941 .943 .943 .927 .938 .941 .942 .911 .926 .937 .941160 .946 .946 .948 .946 .945 .945 .946 .946 .930 .939 .943 .945 .907 .928 .938 .943 .861 .906 .928 .940
�� � 0.08
5 .844 .844 .843 .843 .841 .841 .842 .842 .839 .844 .842 .844 .839 .841 .843 .84410 .902 .902 .901 .902 .901 .903 .901 .901 .901 .902 .903 .903 .899 .902 .903 .90220 .928 .928 .930 .928 .926 .928 .928 .928 .925 .926 .926 .927 .925 .928 .927 .93040 .938 .940 .938 .940 .937 .939 .939 .940 .936 .938 .939 .940 .935 .938 .938 .93980 .943 .943 .944 .943 .943 .943 .944 .944 .938 .941 .944 .945 .929 .937 .942 .945160 .948 .946 .946 .947 .944 .946 .946 .947 .932 .941 .946 .946 .909 .930 .940 .945
�� � 0.16
5 .840 .841 .841 .842 .839 .841 .841 .842 .839 .840 .842 .844 .837 .838 .840 .84010 .901 .902 .901 .903 .901 .901 .901 .903 .901 .900 .902 .904 .899 .899 .899 .90020 .926 .927 .928 .928 .925 .927 .928 .928 .924 .928 .927 .928 .927 .926 .927 .92840 .937 .939 .939 .940 .937 .939 .939 .940 .937 .939 .939 .940 .935 .939 .940 .93980 .943 .946 .944 .945 .943 .944 .945 .945 .940 .944 .943 .946 .935 .942 .944 .945160 .946 .947 .947 .948 .945 .947 .946 .948 .938 .944 .946 .948 .922 .939 .944 .948
�� � 0.32
5 .837 .841 .843 .844 .837 .840 .843 .840 .836 .835 .838 .83910 .901 .902 .904 .903 .899 .901 .902 .905 .898 .899 .899 .90020 .927 .928 .928 .931 .927 .929 .929 .931 .925 .927 .927 .92740 .938 .940 .939 .940 .939 .940 .940 .941 .939 .940 .939 .93980 .944 .945 .945 .945 .945 .945 .945 .945 .943 .945 .944 .945160 .948 .947 .947 .948 .945 .947 .948 .947 .946 .948 .946 .947
Note. True effect � the mean correlation in the superpopulation.
464 FIELD
tion 13 should be (k–1) N rather than kN. The effect of thischange would be to increase the estimated variance ofobserved rs, which in turn would increase the standard errorof the mean correlation, which would widen the confidenceintervals (see Equation 17). This observation explains whythe confidence intervals from H-S were too narrow whenfew studies were included (k is small).
The profile of results was unaffected by how the super-population was simulated, although the differences betweenmethods were exaggerated when the superpopulation wasbased on rs. In addition, the weights used in the two meth-ods did not appear to be responsible for the differences inthe accuracy of estimates of the true correlation (althoughusing sample size as the weight in H-V method certainlygave rise to poorer coverage proportions for the resultingconfidence intervals).
Population Confidence Intervals
The population confidence intervals around the meancorrelation (the boundaries within which 95% of averagecorrelations fell) were smallest when the number of studiesin the meta-analysis was large, and generally got bigger asthe standard deviation of superpopulation correlations in-creased. Based on these population confidence intervals thefollowing advice could be given: If a large average corre-lation is found (� .5) then this will be within .1 of thetrue value only if 20 or more studies were included in themeta-analysis (if �� 0.16), or if 40 or more studies wereincluded (if �� � 0.16). If a small or medium averagecorrelation is found (� � .1 or .3) then this value will bewithin .1 of the true value only when 40 (if �� 0.16)or 80 (if �� � 0.16) or more studies are in the meta-analysisand the H-V method is used, but regardless of the correla-tion variability only 40 studies will be required if the H-Smethod is used. When there was no effect in the populationand the standard deviation of population correlations wasmedium to extreme (�� 0.16), the methods could erro-neously detect a small average correlation unless more thanabout 40–80 studies (H-V) or 40 studies (H-S method) areincluded in the meta-analysis. Although the average samplesize of the studies in the meta-analysis did make a differ-ence (larger sample sizes produced tighter population con-fidence intervals), this difference was smaller than the effectof the number of studies in the meta-analysis and the stan-dard deviation of correlations.
Comparisons With Previous Work
The results of the current study are consistent with thoseof Hall and Brannick (2002) and Field (2001) who foundconsistent overestimations of the average correlation fromthe H-V method. Hall and Brannick (2002) found overesti-mations ranging from 0 to .06 (and in general the overesti-mation increased as a function of the standard deviation of
correlations). Field (2001) found even greater overestima-tion: in the range of 0 to .20. In the current study, estimatesfrom the H-V method produced a maximum overestimationof .031 (when the superpopulation was based on zr values)and .052 (when the superpopulation was based on r). Thelatter value is based on a simulation procedure most similarto Field (2001) and Hall and Brannick (2002) and found asimilar result.
Some cells of the design have approximately the sameparameters examined in Field (2001) and can be directlycompared. For example, when �� � 0.16, the number ofstudies in the meta-analysis was 30, and the superpopulationwas based on r values, Field (2001) reported for superpopu-lation correlations of .1, .3, and .5 estimates from the H-Vmethod of .144, .436, and .706, respectively. These areoverestimations of .044, .136 and .206, respectively. In thepresent study, when �� � 0.16, the number of studies in themeta-analysis was 40, and the superpopulation was simu-lated using r values, the overestimations of population cor-relations of .1, .3, and .5, were (averaged across the differentlevels of sample size) .004, .013, and .025. Under the sameconditions described above, Field (2001) reported for pop-ulation correlations of .1, .3, and .5, estimates from the H-Smethod of .098, .293, and .478. These are deviations fromthe true value of �.002, �.007, and �.022, respectively. Inthe present study, the comparable estimates were �.001,�.003, and �.004. Thus, Field (2001) concluded that esti-mates of the average correlation from H-S were more ac-curate than from H-V — as did Hall and Brannick (2002).The current simulations tend to suggest the same conclu-sion; however, both methods produce more accurate aver-age correlations than Field (2001) and, to a lesser extent,Hall and Brannick (2002) suggest.
The likely explanation for these small differences is thetreatment of inadmissible values. In the current study, pop-ulation correlations outside of the boundaries of �1 to � 1were rejected (i.e., correlations were simply sampled until avalue between �1 and � 1 was obtained). In Field (2001)values outside of the upper and lower limit of 1 werecapped; that is, replaced with a maximum value (0.999).Hall and Brannick (2002) used the same procedure as Field(2001) except values outside of .94 were capped at 0.94(S. Hall, personal communication, August 12, 2004). Theresult of a capping strategy is a build up of correlations atthe very extreme of the distribution, which will be morepronounced as the superpopulation correlation and standarddeviation increases. The effect of this build up of maximumvalues will be to drag the superpopulation mean upwardrelative to when inadmissible correlations are rejected andregenerated. This will increase the H-V and H-S estimatesof the true correlation. The overestimation in the H-Vmethod is thus exaggerated. Also, because Field (2001)used a more extreme capping value than Hall and Brannick,there would be a greater build up of extreme values in hisstudy, which explains the greater similarity between Hall
465META-ANALYSIS OF CORRELATION COEFFICIENTS
and Brannick’s results and those in the current study. Inaddition, the present study made attempts to compare theestimated mean correlations from the H-S and H-V methodsto the actual mean correlation of the superpopulation (andnot the hypothetical value set in the simulation). The buildup of correlations when a capping strategy is used willchange the mean correlation of those distributions, but un-like the current study, neither Field (2001) nor Hall andBrannick (2002) attempted to estimate the true mean of thesuperpopulation.
The current study also supports Schulze’s broad conclu-sions (although not based on H-V’s random-effects modelfor combining correlations) that the weights and z transfor-mation advocated by Hedges do not necessarily producemore accurate average effect sizes than those proposed byHunter and Schmidt. Switching the weights in the twomethods made very little difference to the averagecorrelation.
Hall and Brannick’s (2002) results differed from those ofthe current study in terms of the confidence intervals for theaverage effect size: They looked at credibility intervalsfrom both methods and concluded that in most circum-stances, the H-S method produced more accurate intervals.However, Hedges and Vevea (1998) do not advocate suchintervals and instead provide equations for confidence in-tervals. The present study took the reverse approach andcompared confidence intervals from both methods (which,conversely, Hunter and Schmidt do not advocate). Thepresent study found a more complicated pattern of resultsthan Hall and Brannick: The H-V confidence intervals weremore accurate than those from the H-S method much of thetime, but as combinations of the number of studies includedin the meta-analysis, the size of the true correlation and thevariability of correlations increased, the confidence inter-vals from the H-S method became more likely to be moreaccurate than those from H-V. However, even in thesecircumstances the H-S 95% confidence intervals (althoughan improvement on those from H-V) were still rather nar-row containing only 94% of true correlation values.
Conclusions
Most researchers reading this article might expect ananswer to the question in the title: Is the meta-analysis ofcorrelation coefficients accurate when population correla-tions vary? Well, yes, by and large random-effects methodsof meta-analysis produce accurate estimates of the truecorrelation. Although when the true correlation was large(�� .3) and the standard deviation of correlations was alsolarge (�� 0.16), and when the true correlation was small(�� .1) and the standard deviation of correlations was at itsmaximum value (�� � 0.32) the H-V method overestimatedthe true correlation, these overestimations were small (lessthan .052 above the true value). The H-S estimates weregenerally less biased than H-V estimates (less than .011
below the true value). In terms of 95% confidence intervals,the H-S method only ever produced confidence intervalsthat contained the true correlation on 94% of occasions, andoften much lower (as low as 83% when few studies werecombined). Although 95% confidence intervals from H-V’smethod did, at times, contain 95% of true effect sizes, theseconfidence intervals could in certain circumstances be toowide (contained up to 96.2% of true correlations) or toonarrow (contained 81.4% or 66% of true correlations de-pending on how the superpopulation was simulated). Assuch, researchers would need to make judgments aboutwhich method to use based on the size of the true correla-tion, the standard deviation of correlations (or estimates ofthese values), the number of studies being combined and theaverage sample size of studies in the meta-analysis.
References
Barrick, M. R., & Mount, M. K. (1991). The big five personalitydimensions and job performance: A meta-analysis. PersonnelPsychology, 44, 1–26.
Becker, B. J. (1996). The generalizability of empirical researchresults. In C. P. Benbow and D. Lubinski (Eds.), Intellectualtalent: Psychological and social issues (pp. 363–383). Balti-more, MD: Johns Hopkins University Press.
Cohen, J. (1988). Statistical power analysis for the behaviouralsciences (2nd ed.). New York: Academic Press.
Cohen, J. (1992). A power primer. Psychological Bulletin, 112,155–159.
Field, A. P. (2001). Meta-analysis of correlation coefficients: AMonte Carlo comparison of fixed- and random-effects methods.Psychological Methods, 6, 161–180.
Field, A. P. (2003a). Can meta-analysis be trusted? The Psychol-ogist, 16, 642–645.
Field, A. P. (2003b). The problems in using fixed-effects models ofmeta-analysis on real-world data. Understanding Statistics, 2,77–96.
Field, A. P. (2005). Discovering statistics using SPSS (2nd ed.).London: Sage.
Fisher, R. A. (1921). On the probable error of a coefficient ofcorrelation deduced from a small sample. Metron, 1, 3–32.
Friedman, L. (2000). Estimators of random effects variance com-ponents in meta-analysis. Journal of Educational and Behav-ioural Statistics, 25, 1–12.
GAUSS for Windows 4.0 [Computer software]. (1984). MapleValley, WA: Aptech Systems.
Glass, G. (1976). Primary, secondary, and meta-analysis of re-search. Educational Researcher, 5, 3–8.
Hall, S. M., & Brannick, M. T. (2002). Comparison of two ran-dom-effects methods of meta-analysis. Journal of Applied Psy-chology, 87, 377–389.
Hedges, L. V. (1992). Meta-analysis. Journal of Educational Sta-tistics, 17, 279–296.
Hedges, L. V., & Olkin, I. (1985). Statistical methods for meta-analysis. Orlando, FL: Academic Press.
466 FIELD

Hedges, L. V., & Pigott, T. D. (2001). The power of statistical testsin meta-analysis. Psychological Methods, 6, 203–217.
Hedges, L. V., & Vevea, J. L. (1998). Fixed- and random-effectsmodels in meta-analysis. Psychological Methods, 3, 486–504.
Hunter, J. E., & Schmidt, F. L. (1990a). Dichotomization ofcontinuous variables: The implications for meta-analysis. Jour-nal of Applied Psychology, 75, 334–349.
Hunter, J. E., & Schmidt, F. L. (1990b). Methods of meta-analysis:Correcting error and bias in research findings. Newbury Park,CA: Sage.
Hunter, J. E., & Schmidt, F. L. (2000). Fixed effects vs. randomeffects meta-analysis models: Implications for cumulativeknowledge in psychology. International Journal of Selectionand Assessment, 8, 275–292.
Hunter, J. E., & Schmidt, F. L. (2004). Methods of meta-analysis:Correcting error and bias in research findings (2nd ed.). New-bury Park, CA: Sage.
Hunter, J. E., Schmidt, F. L., & Jackson, G. B. (1982). Meta-analysis: Cumulating research findings across studies. BeverlyHills, CA: Sage.
Johnson, B. T., Mullen, B., & Salas, E. (1995). Comparison ofthree major meta-analytic approaches. Journal of Applied Psy-chology, 80, 94–106.
Mooney, C. Z. (1997). Monte Carlo simulation (Sage UniversityPaper series on Quantitative Applications in the Social Sciences,Series No. 07–116). Thousand Oaks, CA: Sage.
National Research Council. (1992). Combining information: Sta-tistical issues and opportunities for research. Washington, DC:National Academy Press.
Osburn, H. G., & Callender, J. (1992). A note on the samplingvariance of the mean uncorrected correlation in meta-analysisand validity generalization. Journal of Applied Psychology, 77,115–122.
Overton, R. C. (1998). A comparison of fixed-effects and mixed(random-effects) models for meta-analysis tests of moderatorvariable effects. Psychological Methods, 3, 354–379.
Rosenthal, R. (1991). Meta-analytic procedures for social re-search (rev.). Newbury Park, CA: Sage.
Rosenthal, R., & Rubin, D. (1978). Interpersonal expectancy ef-fects: The first 345 studies. Behavior and Brain Sciences, 3,377–415.
Sackett, P. R., Harris, M. M., & Orr, J. M. (1986). On seekingmoderator variables in the meta-analysis of correlational data: AMonte Carlo investigation of statistical power and resistance toType I error. Journal of Applied Psychology, 71, 302–310.
Schmidt, F. L., & Hunter, J. E. (1977). Development of a generalsolution to the problem of validity generalization. Journal ofApplied Psychology, 62, 529–540.
Schmidt, F. L., & Hunter, J. E. (1999). Comparison of threemeta-analysis methods revisited: An analysis of Johnson,Mullen, and Salas (1995). Journal of Applied Psychology, 84(1),144–148.
Schmidt, F. L., Hunter, J. E., & Urry, V. W. (1976). Statisticalpower in criterion-related validation studies. Journal of AppliedPsychology, 61, 473–485.
Schulze, R. (2004). Meta-analysis: A comparison of approaches.Cambridge, MA: Hogrefe & Huber.
Silver, N. C., & Dunlap, W. P. (1987). Averaging correlationcoefficients: Should Fisher’s Z transformation be used? Journalof Applied Psychology, 72, 146–148.
Strube, M. J. (1988). Averaging correlation coefficients: Influenceof heterogeneity and set size. Journal of Applied Psychology,73, 559–568.
Takkouche, B., Cadarso-Suarez, C., & Spiegelman, D. (1999). Eval-uation of old and new tests of heterogeneity in epidemiologicmeta-analysis. American Journal of Epidemiology, 150, 206–215.
Wolf, F. M. (1986). Meta-analysis. Sage university paper series onquantitative applications in the social sciences, 07–061. New-bury Park, CA: Sage.
Received February 19, 2002Revision received June 27, 2005
Accepted August 3, 2005 �
467META-ANALYSIS OF CORRELATION COEFFICIENTS