Embed Size (px)
Citation preview

Thomas R. Bailey, D. Timothy Leinbach, and Davis Jenkins
Community College Research Center Teachers College, Columbia University
CCRC Working Paper No. 1
Originally published October 2005 Updated September 2006
Address correspondence to: Davis Jenkins Community College Research Center Teachers College, Columbia University 525 W. 120th Street, Box 174 New York, NY 10027 Tel.: (312) 953-5286 Email: [email protected] Funding for this study was provided by Lumina Foundation for Education through the Achieving the Dream: Community Colleges Count initiative. For more information see http://www.achievingthedream.org.
IS STUDENT SUCCESS LABELED INSTITUTIONAL FAILURE?
STUDENT GOALS AND GRADUATION RATES IN THE ACCOUNTABILITY DEBATE
AT COMMUNITY COLLEGES

Abstract Community colleges are open-door institutions serving many students with characteristics that
can make college completion a challenge. Their graduation rates are often considered low, but
their students do not always have earning a degree as a goal. While individuals may feel that
their college experience was a success, standard graduation rate measures of performance count a
student’s enrollment as a failure unless it culminates in a credential or transfer to a four-year
institution. This paper explores the impact of students’ reasons for enrollment and educational
expectations on their outcomes and, thus, on the performance of their college, showing that
community college students with degree and transfer goals are more likely to graduate or
transfer. Still, an analysis suggests that even among only students who state that their goal is a
degree, certificate, or transfer, fewer than 50 percent achieve that goal within six years.
Moreover, large gaps in success rates for Black and Hispanic students cannot be explained by
differences in either their reason for enrolling or their educational expectations. We also show
that students’ educational expectations should not be treated as fixed, and that, not surprisingly,
the experience of college has a role in shaping their expectations. We conclude that educators
and policy makers should be cautious in using student goals as benchmarks for success, and that
assumptions about student goals should not be used to discourage efforts to improve overall
performance and reduce disparities between groups. Colleges need to recognize the dynamic
nature of student intentions and expectations, the factors that shape these goals before entering
college, and the institutional role in shaping them while at college.

Table of Contents Introduction..................................................................................................................................... 1 Institutional Accountability and Graduation Rates......................................................................... 3
The Trend Toward Greater Accountability ..........................................................................................................3 Concerns About Graduation Rates as Measures of Community College Performance........................................3 The Effects of Student Goals and Expectations on College Completion .............................................................6
The Relationship Between Student Goals and Outcomes............................................................... 8
Primary Reason for Enrolling ..............................................................................................................................8 Long-Term Educational Expectations................................................................................................................13 Shifting Student Expectations ............................................................................................................................16 Student Background and the Construction of Educational Expectations ...........................................................18
Conclusion .................................................................................................................................... 20
The Effects of Student Goals .............................................................................................................................21 The Effect of College on Student Expectations .................................................................................................22 Goal Formation ..................................................................................................................................................22 Community College Performance and Accountability.......................................................................................23
References..................................................................................................................................... 25

1
Introduction
I continue to be discouraged that these articles do not ever account for the students who come to the community colleges with different goals. While I agree that the students we get whose goal is, or should be, a degree and transfer need more focused attention from us, I am always discouraged that community colleges are made to look like failures when the number of students who come to the community colleges to gain particular job skills or some similar goal are not separated out when the percentages are run. . . . I think this continues to be one of our challenges: to remind university researchers of the multiple missions of the community colleges and to define success by the students who meet their personal goals. Then we would be in a better position to talk about how much more community colleges need to do.
— Community college president in response to an
article criticizing community colleges for low graduation rates
This quotation will have a familiar ring to anyone involved in the discussion of community college outcomes and accountability. It reflects a conviction that community colleges are unfairly criticized for low graduation rates by outsiders (university researchers and others) who fail to understand that these colleges enroll a wide range of students, many of whom are not seeking degrees. If this is indeed true, then many community college “non-completers” are actually achieving their goals. From this perspective, a strong focus on low graduation rates is misplaced and counterproductive. It creates a negative image of community colleges, which are, given the different objectives of their students and the many challenges that they face, actually meeting their students’ goals as well as they can. At first glance, community college graduation rates appear to be very low. According to the Beginning Postsecondary Students Longitudinal Study of 1996-2001 (BPS:96/01, U.S. Department of Education, 2003),1 six years after initial enrollment at a community college only 36 percent of all students had earned a certificate or an associate or bachelor’s degree. Eight percent were still enrolled in a community college but had not yet earned a degree or transferred; another nine percent had transferred to a four-year college and were still enrolled. Yet, 47 percent were no longer enrolled and had not earned any degree or certificate, although four percent of those transferred before ending their enrollment (see Figure 1). There are also significant gaps in achievement among Whites, Blacks, and Hispanics, and between low- and high-income community college students. After six years, while 40 percent of White students earned some degree or certificate, only 27 percent of Blacks and 31 percent of Hispanics did. Moreover, for Blacks, the large majority of those credentials were certificates. The comparison between low- and high-income students is more complicated. After six years, the low-income students were more likely to have earned some credential, but it was much more likely to be a
1 BPS:96/01 is based on a sample collected by the National Center for Education Statistics of 12,085 students who began their postsecondary education in the 1995-96 school year. The sample used in this report includes 9,132 students for whom we have six years of longitudinal data, 1,094 of whom started their postsecondary education in a community college. The first-time students included here can be of any age.

2
certificate. Conversely, high-income students were more likely to have transferred and earned a bachelor’s degree and were also more likely to still be enrolled, presumably working toward a degree.
Figure 1: Highest Outcome in Postsecondary Education Within Six Years for First-Time Community
College Students by Race/Ethnicity and Household Income Quartile (Percents)
10 1017
915
4
16 188
15
19
14
10 12
2 5
5
18
99
59
616
44
53
2
687
89
9
9
43 40
5449
4433
0%
10%
20%
30%
40%
50%
60%
70%
80%
90%
100%
All White Black Hispanic Lowest IncomeQuartile
Highest IncomeQuartile
No Longer Enrl (NoDeg/Xfer)
Still Enrl (NoDeg/Xfer)
Transfer (No Deg)No Longer Enrl
Transfer (No Deg)Still Enrl
Bachelor's
Associate
Certificate
Source: Authors’ calculations using data from BPS:96/01 (n=1,080). Note: This chart displays the highest outcome for each student. A student who earns both an associate and a bachelor’s degree is counted as earning a bachelor’s. A student who earns an associate and transfers without subsequently earning a bachelor’s is counted as earning an associate and is not included in the transfer totals.
What should we make of these numbers? Are the outcomes low? Do they reflect the quality and effectiveness of policies, programs, and practices that community colleges should improve upon? Or do they reflect the characteristics and varied goals and interests of community college students? This report explores these questions based on an analysis of evidence from national data. We first discuss the background of the use of graduation rates in the accountability debate. We next examine the major reasons why community college faculty, administrators, and supporters argue that graduation rates are misleading measures of institutional performance and student success. Among those reasons, we focus primarily on the influence of students’ reasons for enrolling and educational goals and expectations by analyzing what national data say about the relationship between these goals and student outcomes. Our conclusion presents some suggestions for how colleges should approach student goals and aspirations in seeking to improve student success.

3
Institutional Accountability and Graduation Rates The Trend Toward Greater Accountability The focus on the graduation rates of community college students must be understood in the context of broader trends in education. Over the last two decades, state and federal policy makers and accreditors have increasingly come to demand performance accountability and assessment of institutional quality based on student outcomes rather than on more traditional process indicators (Burke, 2005; Dougherty & Hong, in press). This movement toward accountability has recently gained momentum, particularly in elementary and secondary schools, where the No Child Left Behind Act has brought the issue to the center of the public debate about educational policy. At the postsecondary level, accreditation traditionally had been determined by an examination of the characteristics of a program or institution, such as faculty qualifications and characteristics or adequacy of facilities, rather than by measures of student success. Recently, though, many states have introduced various types of accountability measures based on student outcomes, and, in some cases, have tied at least some amount of funding to performance on outcome measures (Burke, 2005). The calls for accountability are only going to increase and, indeed, in 2006 the Secretary of Education’s Commission on the Future of Higher Education placed a great deal of emphasis on accountability and transparency. The Commission made the following recommendation:
We believe that improved accountability is vital to ensuring the success of all the other reforms we propose. Colleges and universities must become more transparent about cost, price, and student success outcomes, and must willingly share this information to improve communications with students and families. Student achievement, which is inextricably connected to institutional success, must be measured by institutions on a “value-added” basis that takes into account students’ academic baseline when assessing their results. This information should be made available to students, and reported publicly in aggregate form to provide consumers and policy makers an accessible, understandable way to measure the relative effectiveness of different colleges and universities. (Secretary of Education’s Commission on the Future of Higher Education, 2006, p. 8)
There are potentially many alternative measures of performance that could be used for accountability, but graduation rates are relatively easy to measure and some form of graduation rates are already available for most colleges. Thus it is important to understand their meaning and to evaluate the extent to which they are appropriate as accountability measures. Concerns About Graduation Rates as Measures of Community College Performance Graduation rate-based outcome measures can be criticized for four broad reasons. First, many of the economic, social, and academic problems that confront community college students and thwart their retention and graduation are beyond the control of the colleges. Second, the specific institutional graduation rate, referred to as the Student Right-to-Know (SRK) rate, which

4
colleges are required to report to the Department of Education, is said to present a biased picture of college performance. Third, the fact that short-term occupational certificates and baccalaureate transfers are important components of community college completion complicate efforts to measure community college “graduation” rates. Finally, many community college students are pursuing goals other than degrees. We will discuss the first three briefly here, as we have addressed them at length in other publications. This paper is primarily concerned with the fourth criticism. Characteristics of community college students. Community colleges are expected to provide open access, and in many states students seeking to enroll include even those who have not graduated from high school. Many, if not most, community college students have a number of characteristics that can make completing a credential a challenge. Indeed, when compared with four-year college students, students in community colleges tend to come from lower income families and arrive with weaker academic skills, and they are more likely to work while enrolled, attend part time, and interrupt their studies (Gooden & Matus-Grossman, 2002; Horn & Griffith, 2006). All these factors have been shown in many studies to be related to lower retention and graduation (Adelman, 2006; Berkner, Cuccaro-Alamin, & McCormick, 1996; Crosta, Calcagno, Bailey, & Jenkins, 2006). Thus community colleges are expected to accommodate a wide variety of students, and many of them face financial, academic, and personal challenges that may be beyond the control of the colleges and that can thwart students’ retention and successful completion of programs (Adelman, 2005b; Grubb, 2002; Pascarella & Terenzini, 2005). As open access institutions, community colleges cannot increase their graduation rates by being more selective in admissions. Clearly, therefore, student characteristics must be taken into account when judging institutional performance. It is reasonable to ask why community colleges should be criticized for enrolling the very students they are expected to serve, regardless of their prospects for graduation. Problems with the Student Right-to-Know graduation rates. There is also a set of criticisms that apply specifically to the Student Right-to-Know graduation rate that colleges must report to the Department of Education. The rate is calculated by dividing the students in a cohort who earn a degree or certificate at the college within 150 percent of the expected completion time for the program in which they enrolled (three years for most associate degree programs) by the total number of students in the cohort. A cohort includes all first-time full-time students at a college enrolled in the fall of an academic year. Critics argue that these rates are most appropriate for four-year colleges and that they distort the performance of community colleges (Burd, 2004; Dellow & Romano, 2002). We have discussed these criticisms in another publication (Bailey, Crosta, & Jenkins, 2006) where our most important conclusion was that the SRK rate provides a valid measure of the relative performance of colleges even though the absolute values of the rate give a biased view of the performance of any one institution. Complex and ambiguous measures of community college student completion. Most students at four-year colleges are pursuing a bachelor’s degree. Therefore, measuring the percentage of a cohort that completes a BA in a fixed period, such as six years, is a reasonable assessment of student goal attainment. In contrast, community college students may be pursing different types of degrees – certificates or associate or bachelor’s degrees – with different expected lengths of time to completion. Furthermore, the successful completion of a bachelor’s degree requires a

5
transfer and an effective education program at a four-year institution, outcomes over which a community college typically has only partial control. The image of community college performance will vary depending on the way that different levels of degrees and transfer are incorporated into measures of completion. Figure 2 is derived from Figure 1 to illustrate different possible pictures of community college completion rates based on different concepts of success. The first rate restricts success to completion of a certificate or degree in six years, a time period over which a student would be expected to complete a certificate or associate degree. (While we would also expect students to complete a bachelor’s degree within six years, for those in community colleges who have the additional transfer step, the process may reasonably take longer.) The second rate adds successful transfer to the completion rate for those who did not earn a credential. Finally, given the challenges faced by many community college students, we also include in our rate those who are still enrolled after six years, as it may be a “success” for some to remain enrolled even if they have not yet completed a program. The Student Right-to-Know measure uses the first completion rate, although it limits the student cohort and time period as noted above. Thus, using the first measure, community college students have a 36 percent six-year success rate, while using the third measure gives them a 57 percent success rate. Figure 2 also shows different completion rates for different racial, ethnic, and social class groups. But even these more disaggregated measures disguise some important differences. Notice that low-income students actually have a higher credential completion rate than high-income students. However, for the latter, half of the degrees are bachelor’s, while for the low-income group only 15 percent are BAs (from Figure 1).

6
Figure 2: Highest Degree Outcome in Postsecondary Education Within Six Years for First-Time
Community College Students by Race/Ethnicity and Household Income Quartile (Percents)
36%
40%
27%29%
39%36%
49%
53%
39%41%
47%
58%57%60%
46%
51%
56%
67%
All White Black Hispanic Lowest IncomeQuartile
Highest IncomeQuartile
Certificate orDegree
Certificate orDegree orTransfer
Certificate orDegree orTransfer orStill Enrolled
Source: Authors’ calculations using data from BPS:96/01 (n=1,080).
The Effects of Student Goals and Expectations on College Completion We now turn to the fourth criticism of using a graduation rate-based measure of community college performance: Community college students have a diverse array of goals and expectations for enrollment, many of which may not include a credential or transfer. Many students arrive at a community college intending to complete a certificate, associate, or bachelor’s degree. However, this intention may not be very concrete – at least not at their initial institution of enrollment. Some students may in effect be “sampling” college (Adelman, 2005b). Since community colleges are often closer to students’ homes and cost less than four-year institutions, they lend themselves to such experimentation. Furthermore, as suggested by the quote at the beginning of this paper, some students have very specific goals that can be met by taking a small number of courses.

7
A 2006 study published by the National Center for Education Statistics used this type of argument to suggest that problems with community college performance have been exaggerated (Horn & Griffith, 2006). The study examined the relationship between goals and outcomes among community college students using data from the 2003-04 National Postsecondary Student Aid Study (NPSAS:04). The researchers classified community college students according to their “commitment” to earning a degree. Students were classified as “more committed” if they attended college at least half-time during the year under study and reported that earning a community college degree or certificate or transferring to a four-year institution was a reason for enrolling.2 Students who did not meet these criteria were separated into two categories: those enrolled in a formal degree program (who were considered “less committed”) and those who were not in a degree program (“not committed”). The study found that 49 percent of community college students met the criteria for the “more committed” classification, 39 percent were “less committed,” and 12 percent were “not committed” in that they were not in a degree program and did not express intentions of earning a credential. NPSAS contains a cross-sectional survey of students at different years in their postsecondary education, yet it includes information about student retention over the course of only one academic year, and this is the information used to derive an outcome measure. (Note that this retention measure is different from the completion-based measures used in Figures 1 and 2.) Using t-tests and one-way Analysis of Variance (ANOVA), the researchers found that students who were classified as more committed were more likely to have earned a credential or persist during the study period. Overall, 83 percent of the more committed students either earned a credential or persisted during the one-year study period, compared with 70 percent of students considered less committed and 58 percent of those not in a degree program. According to the study’s authors, “[t]he results suggest that if community college graduation rates were based on students’ expressing a clear intention of transfer or degree completion rather than simply being enrolled in a formal degree program, they would be considerably higher” (p. x). This type of argument is generally welcomed by beleaguered community college personnel. In response to this publication, the American Association of Community Colleges, in its electronic newsletter, stated,
A NEW REPORT FROM THE NATIONAL CENTER FOR EDUCATION STATISTICS SUPPORTS WHAT MANY COMMUNITY COLLEGE EDUCATORS HAVE LONG ASSERTED: If student intention is taken into account, the success level of community college students, as measured by transfer, persistence and/or degree attainment, goes up significantly. (American Association of Community Colleges, 2006)
Below, we use longitudinal data and an in-depth multivariate analysis to assess the validity of this argument.
2 The use of the word “commitment” appears to draw a psychological conclusion from behavior (attendance more than part time), which in fact may be affected by practical factors other than students’ level of interest in getting a college education. Therefore, using the label itself implies a particular answer to the question that is the subject of the analysis.
8
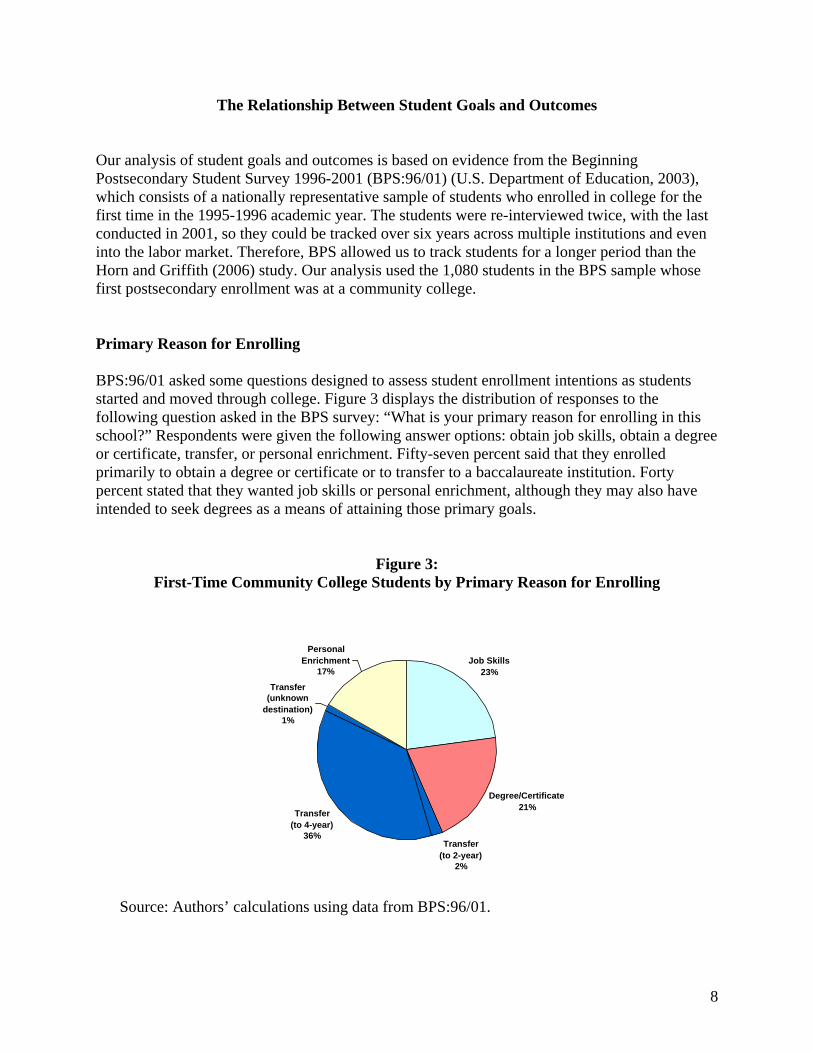
The Relationship Between Student Goals and Outcomes Our analysis of student goals and outcomes is based on evidence from the Beginning Postsecondary Student Survey 1996-2001 (BPS:96/01) (U.S. Department of Education, 2003), which consists of a nationally representative sample of students who enrolled in college for the first time in the 1995-1996 academic year. The students were re-interviewed twice, with the last conducted in 2001, so they could be tracked over six years across multiple institutions and even into the labor market. Therefore, BPS allowed us to track students for a longer period than the Horn and Griffith (2006) study. Our analysis used the 1,080 students in the BPS sample whose first postsecondary enrollment was at a community college. Primary Reason for Enrolling BPS:96/01 asked some questions designed to assess student enrollment intentions as students started and moved through college. Figure 3 displays the distribution of responses to the following question asked in the BPS survey: “What is your primary reason for enrolling in this school?” Respondents were given the following answer options: obtain job skills, obtain a degree or certificate, transfer, or personal enrichment. Fifty-seven percent said that they enrolled primarily to obtain a degree or certificate or to transfer to a baccalaureate institution. Forty percent stated that they wanted job skills or personal enrichment, although they may also have intended to seek degrees as a means of attaining those primary goals.
Figure 3: First-Time Community College Students by Primary Reason for Enrolling
Job Skills23%
Degree/Certificate21%
Personal Enrichment
17%
Transfer(to 2-year)
2%
Transfer(to 4-year)
36%
Transfer(unknown
destination)1%
Source: Authors’ calculations using data from BPS:96/01.

9
Outcomes for the total sample. Figure 4 shows the educational outcomes, six years after initial enrollment, by students according to their primary reasons for enrolling. The bottom three sections of each bar indicate the share of students who completed a certificate, associate degree, or bachelor’s degree. The middle sections show the proportion of students who transferred to a four-year college (without earning any credential in six years). The top section shows the share who were still enrolled and those who were no longer enrolled – neither having completed a degree nor having transferred.
Figure 4: Highest Degree Outcome in Postsecondary Education Within Six Years for First-Time
Community College Students by Primary Reason for Enrolling (Percents)
1712
510
1317
16
19
7 19 74
5
15
9
2
3
6
6
6
7
8
9
59
49
29
40
0%
10%
20%
30%
40%
50%
60%
70%
80%
90%
100%
Job Skills Degree/Certificate Transfer Personal Enrichment
No Longer Enrl (NoDeg/Xfer)
Still Enrl (NoDeg/Xfer)
Transfer (No Deg)No Longer Enrl
Transfer (No Deg)Still Enrl
Bachelor's
Associate
Certificate
Source: Authors’ calculations using data from BPS:96/01. It is clear from these data that a student’s stated primary reason for enrolling did not preclude achievement of other objectives. Many students who stated that their primary reason was “job skills” or “personal enrichment” still earned a certificate or degree or transferred, suggesting that many of them sought to attain the non-degree goals by earning postsecondary credentials, not necessarily just by taking a limited number of courses. Nevertheless, there is a relationship between the primary reason for enrolling and student outcomes. The credential completion rate (the percentage of students who earn a certificate or an associate or bachelor’s degree within six years) for students who sought “job skills” was lower than the average: 30 percent instead of 36 percent. None of the students in this sample with the job skills goal completed a bachelor’s degree. Perhaps consistent with their non-degree goals, three-fifths of them were no longer enrolled and had not completed any degree after six years. In contrast, the students who stated that their primary enrollment reason was transfer were much more likely

10
to complete a degree; 40 percent completed some degree and almost half of them earned a bachelor’s.3 The contrasts are even greater if we include transfer in our completion rate. Not surprisingly, students who wanted to transfer were much more likely to do so than were students who wanted job skills. Interestingly, students who said that their primary goal was “personal enrichment” also had high completion and transfer rates. They were more likely to graduate or transfer than were students whose primary goal was a “degree or certificate.” Their experience closely paralleled that of the typical student: after six years, 36 percent had completed a degree or certification and about half were no longer enrolled, had not transferred, and had earned no credential. Completion differences based on student characteristics. Figures 2 and 4 present simple comparisons among students with different demographic characteristics, educational expectations, and reasons for enrolling. We have already noted correlations between students intending to transfer and their probability of receiving a degree; students with high degree intentions and their probability of receiving a degree; and students’ race/ethnicity and family income and completion. We would also like to determine whether the differences in outcomes reflect differences in intentions or differences in underlying characteristics, such as family income or age, which are correlated with stated objectives. Further, we would like to know whether the racial, ethnic, and socioeconomic differences in outcomes evident in Figure 1 can be explained by differences in reasons for enrolling. To explore these questions, we conducted a multivariate analysis (logistic regression) using the BPS sample to predict the probability that community college students would complete a degree or certificate or transfer within six years. In addition to variables indicating students’ reasons for enrolling, we included gender, race/ethnicity, and disability status. Older students generally are less likely to complete degrees, so we differentiated between traditional-age college students (22 or younger) and older students. We controlled for part-time enrollment since part-time students are less likely to complete a degree within a limited time because they need more time to accumulate credits than a full-time student. BPS does not have good measures of prior academic achievement, but we used students’ receipt of a GED, as opposed to a regular high school degree, and enrollment in a remedial education course as proxies.4 We also included a variable indicating whether the student started in a certificate program since certificate programs tend to have higher gradation rates. To control for socioeconomic status, we included dummy variables for parental education levels and family income quartiles (we used parents’ income for dependent students and student’s income for independent students). Marginal effects (and variable means) are presented in Model 1 of Table 1.
3 Among students with the primary goal of transfer to a four-year institution specifically, the degree completion rate was even higher. 4 This is a weak measure since states and even colleges within states have very different policies with respect to remedial education placement. In many cases, students with weak skills may not be required to enroll in remediation or may not choose to enroll even if recommended to do so.

11
Table 1: Logistic Regressions of Completing a Degree or Certificate or
Transferring to a Baccalaureate Institution in Six Years
Model 1 Model 2 Independent Variable Mean (St. Dev) dy/dx (Std. Err.) dy/dx (Std. Err.)
Female .524 (.500) -.034 (.044) -.040 (.044) Race/Ethnicity (reference: White)
Black .117 (.321) -.200 (.068) ** -.219 (.065) ** Hispanic .116 (.321) -.087 (.070) -.090 (.068) Asian .035 (.185) -.107 (.103) -.077 (.114) Other race/ethnicity .012 (.108) -.042 (.194) -.042 (.191)
Any disability .079 (.270) -.089 (.075) -.096 (.076) 23 or older upon enrollment .271 (.444) -.132 (.056) * -.140 (.054) * Highest level of parents’ education
Some college/certificate/associate .235 (.424) -.030 (.058) -.022 (.057) Bachelor’s degree .274 (.446) .153 (.052) ** .157 (.053) **
Income quartile (reference: first) Second .302 (.459) -.041 (.061) -.060 (.062) Third .268 (.443) .026 (.063) .026 (.064) Fourth (highest) .191 (.393) -.030 (.071) -.018 (.074)
Received financial aid .417 (.493) .109 (.047) * .101 (.047) * Received GED .076 (.266) .014 (.087) -.009 (.087) Initial program is certificate .152 (.359) .068 (.070) .019 (.072) Enrolled in remedial courses .246 (.431) -.157 (.047) ** -.157 (.048) ** Enrolled full-time .375 (.484) .244 (.042) *** .238 (.042) *** Reason for enrolling (reference: job skills)
Obtain degree or certificate .205 (.404) .057 (.071) Transfer .409 (.492) .221 (.061) *** Personal enrichment .162 (.369) .103 (.070)
Highest degree expected (reference: no degree) Certificate .050 (.218) .186 (.121) Associate .095 (.294) -.003 (.092) Bachelor’s .375 (.485) .147 (.067) * Post-bachelor’s .339 (.474) .223 (.066) **
Base Probability .510 .509 Observations /
Pseudo R2 889
.129 .130 Notes: 1. dy/dx (marginal effect) represents the change in probability of degree completion when dummy variables change from 0 to 1. 2. * < .05, ** < .01, *** < .001
Source: Authors’ calculations using data from BPS:96/01. The regression results show that Black students had a 20 percent lower probability of completing compared with the reference group (White). There was no distinguishable difference in

12
completion probabilities among the other race/ethnicity categories. Our results also indicate that students who enrolled in remediation were less likely to complete by 16 percentage points. The influence of social class operates primarily through the parent’s education level, and we indeed found that students whose parents had a bachelor’s degree were 15 percent more likely to complete than those whose parents had no more than a high school degree. According to Table 1, a student who stated that transfer was a primary reason for enrolling was predicted to have a 22 percent greater likelihood of earning a certificate or degree or transferring than a student whose stated enrollment goal was to obtain job skills. This finding supports our earlier assertion based on Figure 4. However, there was no statistically significant difference in the probability of completion among students who stated that they were seeking a credential or personal enrichment. Goal attainment. So far we have looked at the relationship between student intentions and the probability of completing a certificate or degree or transferring. An investigation of student intentions, however, implies an additional measure of successful goal completion: attainment of the objective indicated by the student’s primary reason for enrolling. From this perspective, students seeking “job skills” can have a successful outcome without completing a degree or certificate as long as they learn those skills. Unfortunately, we could not discern from our data whether a student achieved that particular objective, although job skills seekers do have lower completion rates. We could compute an outcome measure based on the stated intentions for certificate, degree, and transfer seekers, however. Figure 5 displays various completion measures for all community college students and for the four student intention categories from the BPS “primary reason for enrolling” question. We used the same three completion rates described earlier, with an additional two measures based on stated intentions. The first additional measure is simply the percentage of students who achieved their intention within six years; the second is that percentage plus the percentage of those still enrolled who could presumably eventually achieve their intended objective. Since we had no way of knowing from these data whether students achieved their “job skills” or “personal enrichment” goals, we could calculate completion measures only for those whose primary reason was to obtain a degree or certificate or transfer. Figure 5 supports the conclusion that we drew from Figure 4 and Table 1: Students with a transfer goal were more likely to transfer or complete a degree. Moreover, when we looked at goal attainment, we found that 49 percent of students who enrolled with the goal of transferring actually did so within six years, and 55 percent either transferred or were still enrolled. (Note that in this estimate of goal attainment we did not count students who completed certificates or associate degrees without transferring.) Still, accounting for students’ goals at entering did not increase community college completion rates substantially: 49 percent of all students completed a certificate or degree or had transferred after six years, while 49 percent of all students with transfer as their primary reason for enrolling had achieved that goal after six years. Only 36 percent of students who entered with the goal of earning a certificate or degree actually attained that goal within six years.

13
Figure 5:
Highest Outcome in Postsecondary Education Within Six Years for First-Time Community College Students by Primary Reason for Enrolling
(Percents)
36%
30%
36%40%
36%
49%
36%
44%
62%
51%
57%
42%
51%
71%
60%
36%
49%48%
55%
n/a n/a n/an/a n/a n/a
All Job Skills Degree/Certificate* Transfer** PersonalEnrichment
Certificate orDegree
Certificate orDegree orTransfer
Certificate orDegree orTransfer orStill Enrolled
AchievedStatedReason
AchievedStatedReason orStill Enrolled
Source: Authors’ calculations using data from BPS:96/01. * Students who transferred without a degree or certificate and were no longer enrolled were not counted as a success in the last measure. If they were added, the result for the degree/certificate seekers would then be 51 percent. ** Since the student’s goal was transfer, those who completed an associate degree or certificate but who did not subsequently transfer did not meet his or her goal.
Long-Term Educational Expectations In addition to the primary reason for enrolling, BPS asked students during their first year of postsecondary enrollment “What is the highest level of education you ever expect to complete?” The answer to this question would combine students’ aspirations and their judgments about what they expected to be able to achieve. Logically, it should understate a student’s aspirations since some students may aspire to a higher degree but believe that they could not achieve that goal. Nonetheless, the results suggest that, over the long run, students were very ambitious. For

14
example, Figure 6 shows that 70 percent of students starting their postsecondary education at a community college expected to earn a bachelor’s degree or more, while 80 percent expected to earn at least an associate degree. Even among students enrolled in a certificate program, 60 percent expected to earn at least an associate degree at some point (results not shown). When comparing the relationship of students’ stated primary reason for enrolling with their long-term expectations, we found a similar relationship of high expectations even if the immediate goals were modest. Nearly 80 percent of students in community colleges whose primary reason for enrolling in their initial postsecondary institution was either to gain job skills or for personal enrichment still expected to earn some credential in the long term. In most cases, the expected credentials were associate or higher degrees.
Figure 6: First-Time Community College Students by Highest Level of Education Expected
Associate9.9%
Certificate5.0%
No Credential4.3%
Don't Know10.1%
Post-Bac33.7%
Bachelor's37.1%
Source: Authors’ calculations using data from BPS:96/01. Students’ long-term educational expectations are also correlated with their educational attainment (see Adelman, 2005a). Figure 7 displays the educational outcomes for students with different long-term expectations. Clearly more ambitious students earn higher degrees, and students with expectations for a bachelor’s degree or higher are more likely to transfer. However, the overall six-year graduation rate hovered near 40 percent for all students except the small number who explicitly expected to earn no credential and the students with unknown degree or certificate expectations. Students who had no degree goals were not likely to complete degrees.

15
Figure 7: Highest Outcome in Postsecondary Education Within Six Years for
First-Time Community College Students by Highest Level of Education Expected (Percents)
159
32
8 8 8
11
11
11
2417 16
6
0
0
310
187
0
0
110
14
1
0
03
5
6
8
7
0 7
9
8
52
74
58 54
41
29
0%
10%
20%
30%
40%
50%
60%
70%
80%
90%
100%
Don't Know No Credential Certificate Associate Bachelor's Post-Bac
No Longer Enrl(No Deg/Xfer)
Still Enrl (NoDeg/Xfer)
Transfer (No Deg)No Longer Enrl
Transfer (No Deg)Still Enrl
Bachelor's
Associate
Certificate
Source: Authors’ calculations using data from BPS:96/01. These observed relationships are confirmed in our multivariate logistic regression presented in Model 2 of Table 1. The coefficients for the demographic variables are all similar to those for the regression where we used the student’s primary reason for enrolling (Model 1). With respect to the expectations variables, the multivariate analysis confirms that students who, upon entering college, expect eventually to earn a bachelor’s or graduate degree are more likely to complete a certificate, degree, or transfer. Compared with students who do not expect to receive any degree, those who expect to receive a bachelor’s degree are predicted to have a 15 percentage point higher probability of completing; those who expect to earn a graduate degree are 22 percentage points more likely to complete. Students with modest goals tended to pursue less education, to persist less, and to earn fewer degrees; when they did complete credentials, they earned lower-level ones. Yet, this does not mean that even students with lower expectations were necessarily meeting their goals. As shown in Figure 4, more than half of students whose primary reason for enrolling was to earn a certificate or degree did not complete any credential within six years of entering a community college. Among students whose long-term expectation was to complete an associate degree, only 27 percent completed an associate or bachelor’s degree within six years and 57 percent were no longer enrolled, having completed no degree or certificate (Figure 7). Among those expecting to receive a bachelor’s, 27 percent earned that degree or an associate degree after six years, while another 19 percent of that group was still enrolled, either in a community college or a baccalaureate institution. Thus, among those students whose long-term expectation was to earn some kind of certificate or degree, with the exception of the students who stated that their goal was to complete a graduate degree, after six years 50 percent or fewer of those students had

16
either achieved their goal or were still enrolled (presumably with a chance to eventually achieve it). Shifting Student Expectations When analysts or community college educators suggest that students’ expectations be taken into account when examining student outcomes and college performance, they are implicitly assuming that expectations are stable and fixed characteristics of the student – that is, exogenous variables. But, rather, student goals and expectations are the product of social processes, which interact with the factors that determine college outcomes. Moreover, if student expectations are not fixed, they could change over the course of the college experience, perhaps as students solidify their understanding of their own interests and capabilities. Alternatively, the colleges themselves might influence students’ expectations through counseling, career planning, or through good teaching that inspires students to gain confidence and causes them to raise their goals. BPS provides some possibilities for exploring whether students’ expectations change as a result of their educational experience by asking students “What is the highest level of education you ever expect to complete?” in the 1995-96 school year and then again in 2001. Figure 8 displays the direction of shifts differentiated by the student’s initial expectation. The figure shows that in 1995-96, 37 percent of all students expected to earn a bachelor’s degree, but, by 2001, 11 percent of that group had raised their expectations, 8 percent had lowered them, and the remaining 18 percent had maintained their initial level of expectation. Notice from the first column (Don’t Know) that most of the more than 10 percent of students who did not have an expected outcome had raised their expectations by 2001.5 In fact, more than half of them ended up expecting to earn at least a bachelor’s degree (data not shown). Thus, students who started with very low expectations tended to raise them and those with the highest expectations were, not surprisingly more likely to lower them. Between a third and a half of those who expected to complete a certificate or an associate or bachelor’s degree maintained their original expectations; roughly an equal number raised and lower their long-term goals.
5 The Raised Expectations category includes a shift from Don’t Know to (expecting to earn) No Credential.

17
Figure 8: First-Time Community College Students
by Highest Level of Education Expected in 1995-96 with Change in Expectations by 2001
(Percents)
0.3 1.7 3.2
8.0
13.3
1.0 1.01.4
3.4
18.2
20.4
9.3
2.61.9
11.0
3.4
0.0
5.0
10.0
15.0
20.0
25.0
30.0
35.0
40.0
Don't Know No Credential Certificate Associate Bachelor's Post-Bac
Raised
No Change
Lowered
Change in Expectations
from1995-96 to
2001
Note: The height of each bar represents the percent of all students with each level of expectation in 1995-96. The bars correspond to the pie segments in Figure 6. Source: Authors’ calculations using data from BPS:96/01.
Figure 9 helps identify the circumstances under which these shifts in expectations occur by separating expectations for students who had no outcome and were no longer enrolled (first column in each cluster, labeled “No”) and for students who had either earned a credential, transferred to a baccalaureate institution, or were still enrolled (second column in each cluster, labeled “Yes”). Students who had no outcome and were no longer enrolled by 2001 were even less ambitious than they had been in 1995-96. Moreover, their expectations were much more likely to drop by 2001 than the expectations of those who had completed a degree or certificate or were still enrolled.

18
Figure 9: First-Time Community College Students
with Change in Expectations by 2001 by Highest Level of Education Expected in 1995-96 and by Outcome Within Six Years
(Percents)
0.64.1
0.1
6.6
0.9
12.1
5.1
15.112.0
1.7 0.52.4
1.3
1.5
3.6
4.5
19.4
17.3
8.6
28.7
11.3
7.9 3.6
1.9
1.7
2.1
3.0
3.7
4.9
15.3
0.0
5.0
10.0
15.0
20.0
25.0
30.0
35.0
40.0
No Yes No Yes No Yes No Yes No Yes No Yes
Don't Know No Credential Certificate Associate Bachelor's Post-Bac
Raised
No Change
Lowered
Change in Expectations
from1995-96 to
2001
Source: Authors’ calculations using data from BPS:96/01. What does this diminution suggest about the causes of changing expectations and the influence of expectations on student outcomes? It could be that students drop out and their expectations decline because they are poorly served by community college education. But the relationship between changing expectations and educational achievement is complicated, and causality could run in both directions. Students’ educational expectations might change for reasons beyond the control of colleges – their personal circumstances might militate against their persistence in college, and their lowered expectations might reflect recognition of that reality. The direction of causality cannot be determined from these data, but the analysis does suggest that it is inadvisable for colleges to take student expectations as given. The findings also indicate that colleges should use caution in considering initial goals as benchmarks against which to judge student achievement, and colleges should also recognize that they can have an influence on raising or lowering student goals. Student Background and the Construction of Educational Expectations Students arrive at college with certain reasons for enrolling and certain long-term expectations, and, as we have seen, these can influence their outcomes. How should we interpret students’ educational goals? From one perspective, they could be considered unrealistic and “socially constructed.” This would be the case when students say that they want a bachelor’s degree because they believe they are expected to say that. But from the point of view of college educators, it is problematic to discount students’ stated goals on the basis of the argument that those educators know, despite what the students say, that students’ real goals are actually more

19
modest. Moreover, if goals are socially constructed, and if low-income and minority students have lower educational expectations than other students, then educators may question whether they should consider students’ outcomes a success even when their goals are met. Alfonso (2004) showed that after controlling for academic achievement and other demographic factors, low-income high school students had lower educational aspirations than high-income students. Indeed, she argued that one of the most important mechanisms through which social class influences college outcomes is the pre-college goal formation process. In any case, research has shown that there are clear economic benefits to credentials and, in particular, to a bachelor’s degree, so high educational expectations should be seen as a rational economic goal for students (Grubb, 2002; Kane & Rouse, 1995; Marcotte, Bailey, Borkoski, & Kienzl, 2005). Figure 10 displays data on the educational expectations of community college students by race/ethnicity and from the lowest and the highest family income quartiles. Although White and Black students had little difference in degree expectations, Hispanics exhibited much higher expectations for earning bachelor’s and graduate degrees. However, only 60 percent of low-income students expected to earn a bachelor’s or higher degree, while over 80 percent of high-income students had such expectations. The low-income students were also considerably more likely to have unknown expectations or to have a certificate as their highest expected credential. There is a similar pattern in students’ responses to the question asking about their “primary reason for enrolling”: low-income students were more than twice as likely to state that they wanted job skills, while high-income students were far more likely to be pursuing transfer (results not shown). It should be noted here that over 75 percent of high school graduates from the highest income quartile initially go to four-year colleges, while the majority (55 percent) of graduates from the lowest quartile start at community colleges.6
6 Authors’ calculations using data from NELS:88.

20
Figure 10: Highest Degree Ever Expected by First-Time Community College Students
by Race/Ethnicity and Household Income Quartile (Percents)
34 33 3540
33 36
37 37 33
39
27
45
10 10 10
6
15
65 4 115
9
14 54 1
36
10 11 7 913
6
0%
20%
40%
60%
80%
100%
All White Black Hispanic Lowest IncomeQuartile
Highest IncomeQuartile
Dont Know
No Credential
Certificate
Associate
Bachelor's
Post-Bac
Source: Authors’ calculations using data from BPS:96/01. Even after controlling for high school test scores (which cannot be done with the BPS data used in this paper), other personal characteristics, and stated degree goals, socioeconomic status continues to be strongly related to the probability of completion for students who enter postsecondary education through community colleges (Alfonso, Bailey, & Scott, 2005). If this finding represents systematic difficulties faced by lower income and minority students, then colleges should try to do something about those difficulties. Alternatively, if it represents systematic differences in expectations, even after controlling for high school academic record, then we should ask why such students have lower expectations. For these reasons, it might be argued that even when students state that they do not seek degrees, community colleges should strive to raise their aspirations, including helping them recognize the economic benefits of additional education and their potential for success in postsecondary education.
Conclusion Graduation rates should be used cautiously as a measure of community college performance, since there is no question that many factors beyond the control of the colleges hinder their ability to increase the rates at which students complete. Community colleges are expected to open their doors to all students, regardless of academic or socioeconomic challenges and, compared with public four-year institutions, they are given fewer financial resources per student to provide their services.

21
Still, there are many steps that policy makers and the public outside of community colleges could take to increase graduation rates at these colleges. They include implementing policies to increase financial aid and affordable day care, providing flexible work schedules and job search assistance, and instituting more flexible regulations regarding work and schooling for welfare recipients. Certainly, improving K-12 education would increase the number of students who arrive at community colleges prepared for college-level work. While it is important to work for broad policy changes and to recognize that there are limits to what community colleges can do, we nevertheless observe that some colleges have higher graduation rates than others and perform better on a variety of student outcome measures, even after controlling for the characteristics of the students they serve and other factors that might bear on performance (Bailey, Calcagno, Jenkins, Leinbach, & Kienzl, 2006). This paper has focused primarily on the relationship between student goals and expectations, on the one hand, and student outcomes, on the other hand. As its title implies, we are concerned with whether taking account of varied student goals would substantially increase community college institutional graduation rates. Put another way: Do low graduation rates mask the extent to which students are achieving their non-degree goals? The Effects of Student Goals Both our descriptive and multivariate analyses show that, controlling for personal characteristics, students who had more ambitious goals were more likely to graduate, transfer, and persist. Students whose primary reason for enrolling was to learn “job skills” and whose long-term expectations did not include any degree or certificate were less likely to complete a credential or transfer than were students whose reason for enrolling was to transfer or who expected to complete a bachelor’s or graduate degree eventually. Although students with more ambitious expectations had higher rates of completion (using various measures), measuring student outcomes against student reasons for enrolling gives mixed results. The modest goals for students enrolling for the primary purpose of acquiring job skills might explain their lower graduation and transfer rates, although a substantial percentage of these students actually ended up earning a credential or transferring. However, those who did enter seeking a certificate or degree were no more successful, by any of the completion measures, than the average community college student. Those enrolling with the intention to transfer had higher completion rates, but after six years, still only about half of them achieved their transfer goal. Strictly speaking, the rate of attainment of a stated reason for enrolling cannot be compared with an actual credential completion or transfer rate. Nevertheless, we feel that the statement that 49 percent of transfer seekers did transfer after six years does not give a fundamentally different impression of community college performance than the statement that 49 percent of all community college students completed a certificate, degree, or transferred within six years. Our findings concerning the effects of race/ethnicity and socioeconomic status indicators also suggest that there are gaps in student attainment even after accounting for differences in student intentions and expectations. We have shown that even after controlling for both primary reason

22
for enrolling and long-term expectations and other student characteristics, Black and Hispanic students and those from lower SES backgrounds were less likely to complete degrees. Students from these groups who completed degrees were more likely than White or higher income students to complete a certificate rather than an associate or bachelor’s degree. Horn and Griffith (2006) also found that Black students are no less “committed” to degrees than White students (although they did not analyze the effect of income or SES). So, both our findings and theirs show that much lower completion rates for Black students cannot be explained by differences in goals or degree commitment. Moreover, we have seen that expectations of students change as they experience college. The pattern of these changes suggests that many students who left without any degree were not those who arrived with modest goals and left satisfied. A substantial number who did not earn credentials had lower educational aspirations than when they began, although we cannot say for certain what caused them to lower their sights. The Effect of College on Student Expectations The fluidity of student goals implies that the colleges themselves can have an influence on student expectations. Colleges and researchers should take this into account when examining the relationship between student goals and outcomes. Failure to account for changing student goals is a potential problem with the Horn and Griffith (2006) analysis. Since college policy could influence goals and attendance patterns, by taking those factors as fixed for students beyond their initial enrollment, the researchers are in effect taking as independent influences what are in fact influences that are partly under the control of the college. For example, a college may, through poor-quality programs or services, discourage students and lead them to enroll in less ambitious programs or reduce their course load. Therefore, taking student expectations as fixed may in effect disguise problems with college effectiveness. Goal Formation Students arrive at college with a set of intentions and expectations, and colleges need to decide the extent to which they should take them as appropriate benchmarks for judging student outcomes and college performance. All students are not equally well informed about the costs and benefits of college or about the education necessary to prepare for different occupations. Our analysis shows that low-income students and students whose parents had less education also had lower educational expectations. Moreover, Alfonso (2004) argued that the formation of pre-college goals is one of the most significant processes through which SES influences college enrollment and outcomes. Do colleges have a responsibility to encourage their students to be more ambitious? This may depend on the type of students and the concreteness of their goals. It is one thing to say that adult full-time workers returning to college to learn some specific skills for job advancement do not intend to seek a credential. Yet we should be less willing to accept such unambitious goals from students of any age who have had little success in school or work, who have limited access to

23
information about college and related employment opportunities, or who lack confidence about their abilities or knowledge about what they need to do to advance. Many community college students tend to state ambitious long-term goals, yet fail to progress very far toward reaching them. Others may have more modest goals based on negative school and community experiences. We have seen that students who arrived with clear intentions to transfer or attend graduate school were more likely to transfer and earn degrees. Yet, we have also seen that such high educational aspirations tend to be correlated with students’ race/ethnicity and socioeconomic status. Thus, colleges have a responsibility to work with students to help them understand the implications of their long-term goals, to make the goals more concrete, and to help their students achieve them more effectively. Community College Performance and Accountability Simple graduation rates, published without comment or an explanation of the context, provide an unfairly negative impression of community college performance. The public and policy makers need to understand that the mission of community colleges is to enroll almost all students who present themselves regardless of their projected ability to earn a degree. It is also a fact that community colleges serve some students who are not seeking a degree; therefore, college completion rates for community college students with concrete degree intentions would be somewhat higher than the overall rates. The public, policy makers, and anyone else judging the performance of community colleges should be made aware of these considerations. Nevertheless, it does not follow that community colleges should be content with their performance. Even among community college students with degree or transfer goals, a majority do not end up earning a credential or transferring, and differences in reasons for enrolling and long-term expectations cannot explain the continued gaps in achievement among racial, ethnic, and income groups. Some colleges are able to achieve higher student completion rates, even after taking account of the characteristics of the students they serve. Moreover, our analysis of changes in student expectations over the course of their college experience suggests that many students who leave without completing a credential or transferring had lower expectations of educational attainment than when they first enrolled. Hence, assumptions about community college student goals should not be used to discourage efforts to improve student outcomes overall and reduce disparities between groups. Our argument also suggests that colleges should be wary of using student intentions and expectations as benchmarks for measuring their performance. Many students arrive at college without having grounded their goals in an understanding of the possibilities and the requirements of achieving them. Further, as we have shown, goals can change and they are to some extent under the control of the colleges. The extent to which initial college intentions and expectations are closely related to race/ethnicity and social class suggests that they should be viewed with skepticism. In the end, a better understanding of student goals and expectations can best be used by colleges as a starting point for a process to help students maximize the benefits of their college education. This is particularly important for community colleges, whose students are less likely to be well informed.

24
If student goals are difficult to use as benchmarks for judging college performance, what alternatives are there? It makes most sense for colleges, policy makers, and researchers to use a variety of measures, including those that take goals into account. Methods of measuring college performance that adjust for the characteristics of the student body, such as family income, race/ethnicity, and age, may be particularly revealing. We have, in fact, demonstrated the usefulness of such methods elsewhere (Bailey, Calcagno, et al. 2006; Bailey, Crosta, & Jenkins, 2006). After six years, approximately half of community college students in our sample experienced “student success” or were still enrolled. Nevertheless, if community colleges rely too much on student goals to judge that success – and if they are not aware of the dynamic nature of student intentions and expectations, the factors that shape these goals before students enter college, and the institutional role in shaping them during students’ attendance – then the colleges may indeed be seen as experiencing “institutional failure.”

25
References Adelman, C. (2005a). Educational “anticipations” of traditional age community college students:
A prolegomena to any future accountability indicators. The Journal of Applied Research in the Community College, 12(2), 93-107.
Adelman, C. (2005b). Moving into town – and moving on: The community college in the lives of
traditional-age students. Washington, DC: U.S. Department of Education. Adelman, C. (2006). The toolbox revisited: Paths to degree completion from high school through
college. Washington, DC: U.S. Department of Education. Alfonso, M. (2004). The role of educational expectations and college choice in transfer and
baccalaureate attainment of community college students. New York: Unpublished dissertation, Columbia University, Teachers College, Economics and Education Department.
Alfonso, M., Bailey, T., & Scott, M. (2005). The educational outcomes of occupational sub-
baccalaureate students: Evidence from the 1990s. Economics of Education Review, 24(2), 197-212.
American Association of Community Colleges (2006, June 23). AACC Letter, 652. Electronic
edition. Bailey, T., Calcagno, J.C., Jenkins, D., Leinbach, T., & Kienzl, G. (2006, August). Is Student
Right-to-Know all you should know? An analysis of community college graduation rates. Research in Higher Education, 47(5), 491-519.
Bailey, T., Crosta, P., & Jenkins, D. (2006, August). What can Student Right-to-Know
graduation rates tell us about community college performance? New York: Columbia University, Teachers College, Community College Research Center.
Berkner, L., Cuccaro-Alamin, S., & McCormick, A. (1996). Descriptive summary of 1989-90
beginning postsecondary students: Five years later. Washington, DC: U.S. Department of Education, National Center for Education Statistics.
Burd, S. (2004, April 2). Graduation rates called a poor measure of colleges. The Chronicle of
Higher Education, p. A1. Burke, J. C. (Ed.). (2005). Achieving accountability in higher education: balancing public,
academic, and market demand. San Francisco: Jossey-Bass. Crosta, P., Calcagno, J. C., Bailey, T., & Jenkins, D. (2006, July). Does age of entrance affect
community college completion probabilities? Evidence from a discrete-time hazard model. New York: Columbia University, Teachers College, Community College Research Center.

26
Dellow, D., & Romano, R. (2002). Editors choice: Measuring outcomes: Is the first-time, full-time cohort appropriate for the community college. Community College Review, 30(2), 42-54.
Dougherty, K. J., & Hong, E. (in press). Performance accountability as imperfect panacea: The community college experience. In T. Bailey & V. Smith Morest (Eds.) Defending the Community College Equity Agenda. Baltimore: Johns Hopkins Press.
Gooden, S., & Matus-Grossman, L. (2002). Opening doors: Students’ perspectives on juggling
work, family, and college. New York: MDRC. Grubb, W. N. (2002). Learning and earning in the middle, part I: National studies of pre-
baccalaureate education. Economics of Education Review, 21(4), 299-321. Horn, L., & Nevill, S. (2006). Profile of undergraduates in U.S. postsecondary education
institutions: 2003-04: With a special analysis of community college students. (NCES 2006-184). Washington, DC: U.S. Department of Education, National Center for Education Statistics.
Kane, T. J., & Rouse, C. E. (1995). Labor market returns to two- and four-year colleges: Is a
credit a credit and do degrees matter? American Economic Review, 85(3), 600-614. Marcotte, D. E., Bailey, T. R., Borkoski, C., & Kienzl, G. S. (2005). The returns of a community
college education: Evidence from the National Education Longitudinal Survey. Educational Evaluation and Policy Analysis, 27(2), 157-175.
Pascarella, E., & Terenzini, P. (2005). How college affects students: A third decade of research
(Vol. 2). San Francisco: Jossey-Bass. Secretary of Education’s Commission on the Future of Higher Education (2006, August 9). Draft
report of the Commission. Retrieved August 17, 2006 from http://www.ed.gov/about/bdscomm/list/hiedfuture/reports/0809-draft.pdf
U.S. Department of Education. (2003). 1995-96 Beginning Postsecondary Students Longitudinal
Study, second follow-up (BPS: 96/01). NCES 2003-160 [Data CD-ROM]. Washington, DC: U.S. Department of Education, National Center for Education Statistics.