Embed Size (px)
Citation preview

Dec PrinSou
Is Sri Lanka Ready for the Removal of Textile and Clothing Export Quotas?
ember 6, 2004
cess Ventura th Asia Poverty Reduction and Economic Management Unit

Table of Contents
Overview 1
Chapter 1: Garment Industry in Sri Lanka 2 1.1: Evolution of the Industry 2 1.2: Utilization of Clothing Quotas in Sri Lanka 5 Chapter 2: Strengths and Weaknesses of the Sri Lankan Garment Industry 6 Chapter 3: Preparing for the MFA Phase Out 9 Chapter 4: Implications of the End of Clothing Quotas 11 4.1: Global Picture 11 4.2: Local Impact 12 Chapter 5: How Can the Sri Lankan Garment Industry Be More Competitive? 16 References 18 Annexes i

List of Tables Table 1.1: Garment Manufacturers by Export Value, 2001 2
Table 1.2: Geographical Distribution of Garment Factories in Sri Lanka, 1999 3
Table 1.3: Market Share of the Largest Apparel Exporters to the US, (%) 2000 4
Table 1.4: Selected Quota Utilization Rates to the US, (%) 1996-2003 5
Table 2.1: Hourly Wages in Clothing, (US$) 2002 7
Table 2.2. Regulations for Labor Redundancy for Selected Asian Countries 8
Table 3.1: List of BOI Approved Projects in Textiles, Fabrics, and Garment 10 Accessories, ($ Mn.) 2002-2003
Table 4.1: Estimated ETEs of Quotas in Selected Asian Regions, (%) 2002-2003 13
Table 4.2: Garment Manufacturers by Employment, 2001 15
List of Figures Figure 1.1: Share of Garment and Textile Exports, (US$ Million)1985-2003 2
Figure 1.2: Growth in Unit Price of Garment Exports of Selected Asian Countries, (%) 1985-2001 4
Figure 2:1: Labor Productivity and Capital Use in Garments in Sri Lanka and China (US$) 7
Figure 4.1: Average (Weighted) Tariffs of Selected Countries to the US, (%) 1996-2003 14
Figure 4.2: Product Overlap to the US Market Between Sri Lanka and Other Countries, (%) 1996-200314
Figure 4.3: Volume of US Import of Textiles and Clothing, ($ Billions) 2003 15
List of Boxes Box 1.1: Administration and Price of Quotas in Sri Lanka 5
Box 2.1: Key Features of the Sri Lankan Garment Industry 6
Box 2.2: Labor Standards in Sri Lanka 8
Box 3.1: A Perspective from Sri Lankan Garment Manufacturers 9
Box 3.2: JAAF Strategy 11
Box 4.1: Predicted Effects of the End of the MFA on Selected Regions 12
Box 5.1: Summary of Key Actions to Enhance Sri Lanka’s Competitiveness 17
List of Annexes Table A1: Structure of Exports from Sri Lanka, (US$ Million) 1978-2003 i
Table A2: Textile and Garment Exports of Sri Lanka, (As a Percentage of Total Exports) 1998-2003 ii
Box A2: Non-Tariff Barriers in Sri Lanka iii
Table A3: Sri Lanka’s Quota Utilization Rates by Product Category, 1996-2003 iv
Table A4: Value, Volume, and Unit Value of Garment Exports, (US$) 1985-2001 v
Figure A1: Average Cost of Firing Workers (Weekly Wages) vi
Box A1: China’s Unfair Trading Practices vii

ACKNOWLEDGEMENTS
This report was primarily written by Princess Ventura (SASPR). Caglar Ozden (DECDG) carried out the cross-country quantitative analysis of quota utilization, extent of product overlap, and average tariff rates countries face in the US contained in Chapter 4. Very useful comments and suggestions were provided by Kapil Kapoor, Rocio Castro, Tercan Baysan, Cresenta Fernando, Ambar Narayan (SASPR), Peter Harrold, Debbie Bateman, and Malathi Ratnayaka (SACSL). Malathi Ratnayaka provided administrative and research assistance, and Melanie Kanaka (SARRM) facilitated the garment factory visits.

Overview
As a small island nation, Sri Lanka’s economic prospects are highly contingent on sustaining strong export growth. Given its high export concentration on garments and textiles, how Sri Lanka handles the end of the Multi-Fiber Agreement (MFA) will be crucial to its economic future. This report is intended to inform the Sri Lanka Country Team on how the country is confronting the end of the MFA. The analysis is principally a stock-taking exercise about the structure and relative importance of the garment sector in Sri Lanka, and about the state of readiness of the sector for the post-export quota period. The report relies largely on consolidating secondary data sources; available studies on the sector; and interviews with firms, trade unions, and relevant Government officials. The report also draws from the preliminary cross-country quantitative findings of DECDG on quota utilization, extent of market overlap, and average tariffs of clothing exports to the US.
Robust growth in garment and textile exports during the last two and a half decades led to the profound transformation of the Sri Lankan economy. Garments and textiles today make up half of Sri Lanka’s exports and 44 percent of industrial output, provide employment to roughly 6 percent of the total labor force, and is the largest foreign exchange earner of the country. The estimated 850 to 900 garment manufacturing enterprises currently operating in Sri Lanka employ around 350,000 workers directly and one million total with indirect employment. In addition, around 150,000 Sri Lankan workers are employed in garment factories in the Middle East and the Maldives. Particulars on the evolution of the garment industry in Sri Lanka will be presented in the following section. Subsequently, Chapter 2 will draw attention to the key features of the industry.
At present, about 60 percent of Sri Lankan garment exports go to fill quotas provided for under the Multi-Fiber Agreement (MFA). The remaining 40 percent of garments produced by Sri Lanka are no longer protected or restricted by quotas. The MFA covers almost 80 percent of global textile and garment trade, allotting to each signatory an import or export quota. Under the agreement on textiles and clothing (ATC), the MFA is to be phased out in four stages over a period of 10 years (1995-2005) with the total elimination of quotas planned on December 31, 2004.
The abolition of the quota system in 2005 will enable buyers in future, by and large, to procure goods from the most efficient producers. Although, the proliferation of preferential trading arrangements around the world still tip the scale in favor of certain countries and regions. The MFA benefited some developing countries by providing them protection despite steep competition from more efficient producers. At the same time, quota utilization poses additional costs and restricts garment exports, which will be eliminated after 2004. After 2004, world markets will become even more responsive --- increasing opportunities to expand where there are productivity improvements. In contrast, countries that are less competitive can expect to suffer large losses in the global market. The end of the quota period presents both challenges and opportunities. Thus, making it vital for responses to consider both aspects.
The garment industry in Sri Lanka has been gradually preparing for the imminent end of clothing quotas. Manufacturers have been taking proactive measures to improve productivity, rationalize production costs, and probe for new niche markets. A five year comprehensive strategy has also been developed by the Joint Apparel Association Forum (JAAF) to ensure the success of the Sri Lankan apparel industry beyond 2004. On the other hand, the Government and trade unions are only now beginning to consider how to safeguard the interests of workers who may lose their jobs as less competitive firms are driven out of business after 2004. This Study will try to ascertain the relevance and adequacy of strategies being adopted by the Government and the industry in planning for the post-quota scenario in Chapter 3.
The impending end of the MFA has created doubts in Sri Lanka as to whether the change would mean a sudden collapse for the industry or whether effects will be slower and somewhat predictable. On one end of the spectrum some postulate that the larger companies will continue to thrive and grow at an annual rate of 12 percent in the next 4 years, and the end of the MFA will result in minimal job losses. On the other end, some expect China to drive Sri Lanka out of the market for most product categories. The garment sector in Sri Lanka has strengths and weaknesses, which make it difficult to readily quantify the potential effects of the end of the MFA. In addition, unlike tariffs or taxes, export quotas do not have transparent effects on trade. Addressing weaknesses in Sri Lanka’s investment climate will have enormous payoffs, not only for strengthening the sector, but in facilitating diversification into areas where competition may reduce as some countries transfer resources into textiles and clothing following the abolition of quotas. On balance the potential effects of the end of the MFA have been overstated and will likely be more muted than expected. This report will give a flavor of the nature of the effects we can expect from the end of the MFA in Chapter 4. Thereafter, key knowledge gaps and crucial areas in need of attention will be highlighted in Chapter 5.

I. Garment Industry in Sri Lanka 1.1. Evolution of the Industry
1. Robust growth in the clothing industry led to the profound transformation of the Sri Lankan economy
during the last two and a half decades. Garment and textile exports1 in Sri Lanka have dramatically expanded in the last 25 years, making up only 4 percent of exports in 1978 and now accounting for half of all exports (Figure 1.1). They contribute 44 percent to industrial output, employ roughly 6 percent of the labor force, provide one million jobs with indirect employment, and is the largest foreign exchange earner in the country ($ 2.5 billion). Garment and textile exports have been growing on average at a healthy 12.5 percent annually since 1990 and peaked in 2000 at $2,982 million. The sector then contracted in 2001 and 2002 due to the drop in global demand for apparels and stocks build up. However, the industry started to recover during the second half of 2002 and continued in 2003, expanding by 6 percent in 2003 to reach $2,575 million.
Figure 1.1: Share of Garment and Textile Exports (US$ Million) 1978-2003
0
1000
2000
3000
4000
5000
1978 1980 1985 1990 1995 2000 2003Total Exports Textiles and Garment Exports
Source: Central Bank of Sri Lanka Annual Report, multiple years.
2. According to the most recent available data, there were 859 garment factories in Sri Lanka in 2001, while
only 5 factories existed in 1977. Of these factories, over 80 percent are categorized as small and medium scale but account for only 28 percent of the total value of garment exports. While the large manufacturers, contribute about 72 percent of the revenue in the industry (Table 1.1) and are large employers (accounting for 62 percent of employment in the industry) (Table 4.2 ). Females dominate the garment industry, making up 87 percent of the total labor force in the industry. About 72 percent of the garment manufacturers in Sri Lanka are located in the Western Province and contribute to 65 percent of total employment in the industry. This explains part of the story behind the strong economic performance of the province and low incidence of poverty2. (Table 1.2).
Category No. of Factories Share of ExportersExport Value ($ Mn.)
Share of Garment Exports
Small (Less than $1 mn.)
Medium ($ 1.1-2.5 mn.)
Large (Over $2.51 mn.)
Total 859 100% 2,332 100%
Table 1.1: Garment Manufacturers by Export Value, 2001
Source: Central Bank of Sri Lanka 2002 Annual Report.
106 12% 1,671 72%
204 23% 548 23%
549 64% 116 5%
1 Textiles only make up about 10 percent of the total value of garment and textile exports. 2 Based on the Household Income and Expenditure Survey 2002 conducted by the Department of Census and Statistics, poverty incidence in the Western Province was measured as 11 percent compared to the national average of 23 percent in 2002.
2

Table 1.2: Geographical Distribution of Garment Factories in Sri Lanka, 1999
Province Factories Percentage Employment PercentageWestern 638 71.6 181,329 65.5Southern 51 5.7 19,488 7.0Central 54 6.1 17,056 6.2Eastern 8 0.9 3,512 1.3North Western 60 6.7 22,398 8.1North Central 21 2.4 10,426 3.8Uva 20 2.2 6,559 2.4Sabaragamuwa 63 7.1 15,419 5.6Northern 3 0.3 634 0.2Total 891 100.0 276,821 100 Source: Institute of Policy Studies (2004), ‘Ready-Made Garment Industry in Sri Lanka.’
3. The garment industry in Sri Lanka can trace back its origins to the mid-1960s. Initially, almost all
garments produced in Sri Lanka catered only to the domestic market in the hands of a few companies. However, it was only after the first wave of economic liberalization in 1977 did the garment industry in Sri Lanka start to flourish and have a stake in the international market. The growth of the sector was fueled by the Government’s greater emphasis on export-led industries and establishment of free trade zones. In addition, the country’s early commitment to human development has resulted in a skilled labor force that distinguished it from other low-income countries. The other important factor that contributed to the growth of the industry is the Multi-Fiber Agreement (MFA) that commenced in 1974. Under-utilized quotas attracted a large number of foreign direct investments (FDI) forming joint ventures with local investors. Around 80-85 percent of garment factories in Sri Lanka today are partly or fully locally owned. Until 1990 FDI in Sri Lanka was heavily concentrated only in the garment industry.
4. Despite having very few local suppliers of fabric and accessories in Sri Lanka, the garment industry has managed to grow at a remarkable rate. Over 65 percent of material inputs needed in the industry are imported. Some Asian countries have similar experience when it comes to developing a strong garment industry and relatively weak backward linkages with countries such as Bangladesh, the Philippines, and Vietnam also highly dependent on imported fabrics. The Government has tried to facilitate the development of backward linkages to the garment industry in Sri Lanka through the decades by means of various tax incentives, but with disappointing results. While backward linkages are important, there are a number of impediments to their formation in Sri Lanka. To ensure standards buyers often specify common suppliers of inputs for all production sites. Capital costs3 are higher for fabric manufacturing. Sri Lanka does not produce the raw materials used in the production of fabrics and most accessories. And efficiency of investment is lower in Sri Lanka compared to its competitors.4
5. Sri Lanka’s garment exports cater mostly to the US and European markets. About 61 percent of the
garments Sri Lanka exports are destined for the US and 32 percent to the EU (CBSL 2004). There have been attempts to diversify into other markets since 1992 with limited success. Although Sri Lanka does not feature in the top garment exporters in the world, it ranks as the 16th largest exporter to the US (Table 1.3). About 10 percent of the apparels Sri Lanka produces go to brand stores, 50 percent to department stores, and 40 percent to discount stores, but the industry is concentrating on tipping the scale towards brand and department store items in future (JAAF 2002).
3 A garment factory employing 400 workers and 200 machines can be set up for less than $ 1 million in Sri Lanka and the capital is quite mobile. However, setting up a weaving factory capable of producing 20 million meters of fabric, would require $ 20 million in capital (IPS 2004, p. 131). 4 Rate of return on capital use in general is estimated to be 17 percent in Sri Lanka compared to 32 percent in South Korea, 28 percent in Thailand, 23 percent in Indonesia, and 20 percent in Malaysia during 1980-1990 (Ahamed and Rajan 1995).
3

Table 1.3: Market Share of the Largest Apparel Exporters to the US, (%) 2000 1 Mexico 14.682 China 7.853 Hong Kong 7.824 Dominican Republic 4.245 Honduras 4.126 South Korea 3.957 Bangladesh 3.698 Taiwan 3.69 Indonesia 3.5810Philippines 3.311Thailand 3.1812India 3.1213Canada 3.0414El Salvador 2.7915Guatemala 2.616Sri Lanka 2.56
Source: Institute of Policy Studies (2004), ‘Ready-Made Garment Industry in Sri Lanka.’
6. Sri Lanka has been gradually shifting production towards higher value added garments and away from
low priced quota items. This is suggested by increases in the average unit value of Sri Lankan garment exports. The value of Sri Lankan garment and textile exports expanded by 6 percent in 2003, reaching $ 2,575 million. Interestingly, although the quantity of garments produced by Sri Lanka during the last two years have remained relatively the same (446 mn. kgs.), the average unit price increased significantly by 18.6 percent from $ 5.40 per kg. in 2001 to $ 6.50 per kg. in 2003. In addition, the average unit price of garment exports from Sri Lanka grew much faster in the last 15 years (4 percent) compared with other Asian countries (China and Thailand fell by around 1.5 percent, and Bangladesh and Indonesia remained relatively the same – increasing by 0.2 percent) (Figure 1.2).5 The increase in unit price of Sri Lankan garment exports is due mainly to manufacturers being able to effectively capture increasing orders for higher value added items, especially in the last decade. While the drop in the unit price of Chinese and Thai garment exports have been due to their focus on increasing production of low priced items and improved cost effectiveness.
Figure 1.2: Growth in Unit Price of Garment Exports in Selected Asian Countries, (%) 1985-2001
Bangladesh
China
Indonesia
Sri Lanka
Thailand -2 -1 0 1
2 3 4
Source: Compiled from data extracted from UN.COMTRADE database.
4
5 The data reported covers exports of garments belonging to three 3-digit categories under the standard international trade classification (SITC). Growth rates estimated by fitting a logarithmic trend line.

1.2 Utilization of Clothing Quotas in Sri Lanka
7. At present about 60 percent of Sri Lankan garment exports fill quotas provided by the MFA. While, the remaining 40 percent of garments exported by Sri Lanka are no longer protected by quotas. The MFA commenced in 1974 and covers about 80 percent of global trade in apparels and textiles. It includes about 100 bilateral agreements, allotting to each signatory an import or export quota. The MFA provided effective protection to several developing countries around the world in the last 3 decades by limiting the total clothing exports of all MFA signatory countries. Thereafter, an important outcome of the Uruguay Round in 1995 was the Agreement on Textiles and Clothing (ATC), by which the quota imposing industrial countries agreed to phase out the MFA oven a ten year period. Textiles and clothing are to be integrated into the normal General Agreements on Tariffs and Trade (GATT) rules. Under the ATC, nations agreed to liberalize 16 percent of clothing imports on January 1, 1995, 17 percent in 1998, 18 percent in 2002, and the remaining 49 percent on January 1, 2005.
8. Clothing quotas in Sri Lanka, unlike in many other countries, are not auctioned. They are distributed by
the Textile Quota Board in a predictable manner by being primarily based on past performance (Box 1.1). Although, the Board does not charge for quotas rights, manufacturers can (and often do) sell unutilized quotas to other enterprises after the Board allocates quotas.
Box 1.1: Administration and Price of Quotas in Sri Lanka
In Sri Lanka textile and clothing quotas are distributed by the Textile Quota Board. The Board has five members representing the Government and five members representing the industry. Only quotas from the US and Canada now apply to Sri Lanka. Quotas from the EU were lifted for all of Sri Lanka’s categories in 2002. Garment production in Sri Lanka is concentrated in specific product categories utilizing over 60 percent of quotas only in respect of half of categories to the US and one sixth to Canada in 2003 (Table A3). Half of quotas are allocated by the Board based on manufacturers previous year performance, 25 percent are allocated to exporters that have increased the value of their non-quota exports the previous year, 3 percent are reserved for small and medium enterprises, and the remainder are set aside for the revival of closed factories. Thereafter, although the Textile Quota Board does not charge for quotas, manufacturers can sell unutilized quotas to other manufacturers. The Textile Quota Board then transfers the quota rights to produce those items to the buyer manufacturer. In the past the Board also provided higher quota allocations to companies located over 200 kilometers away from Colombo under the 200 Garment Factory Program in an effort to extend economic development beyond Colombo. One of the most in demand quota product category is cotton pants. The current informal market price for this quota is about $ 80 cents per piece. It has gone up to as much as $ 3.50 per piece in 2002. Purchasing additional quotas add to production costs, which will no longer be the case after 2004.
. 9. Sri Lanka only utilizes about 60 percent of total available quotas. This low quota utilization rate is the
result of lack of adequate orders for certain product categories, limitations enterprises have in supplying certain products, or manufacturers preferring to produce non-quota items. Sri Lanka’s available quotas from the US expanded by 9 percent to 394 million pieces and Canada by 12 percent to 15 million pieces in 2003. Sri Lanka exported 30 different apparel and textile items to the US and 11 items to Canada that year. However, with the sudden increase in quotas in 2002 and 2003, Sri Lanka was able to utilize only 65 percent of quotas to the US and 31 percent to Canada. The corresponding quota utilization rates in respect of exports to the US of dresses, knit shirts/ blouses, skirts, trousers, nightwear, underwear, and shorts were binding at over 90 percent (Table 1.4). Whereas, they were below 25 percent in the playsuits, fabric poplins and spun cell, gloves, suite-type coats, coats no suits, overalls, coveralls, and coats categories (Table A3).
5

Table 1.4: Sri Lanka’s Binding Quota Categories to the US, (%) 1996-2003 Category Description 1996 1997 1998 1999 2000 2001 2002 2003 336/636/836 dresses 100 96 94 97 98 80 100 100 338/339 knit shirts/blouses 100 100 100 96 100 100 100 100 342/642/842 skirts 100 76 90 100 96 72 97 92 345/845 sweaters 59 41 58 48 97 100 89 89 347/348/847 trousers 100 98 100 100 100 100 100 100 350/650 dressing gowns 89 100 100 93 91 100 - - 351/651 nightwear 100 100 97 79 87 98 100 100 352/652 underwear 100 100 71 76 84 100 100 100 647/648 trousers and shorts 82 100 100 96 100 100 100 100 Source: Textile Quota Board
II. Strengths and Weaknesses of the Sri Lankan Garment Industry
10. The apparel industry in Sri Lanka has a number of strengths and weaknesses, which make it difficult to
readily quantify the potential effects of the end of the MFA era (Box 2.1). This section will highlight the key factors to the Sri Lankan garment industry’s competitiveness. While, later on Chapter 5 will offer ways to address critical weaknesses in the industry precluding it from reaching its full potential.
Box 2.1: Key Features of the Sri Lankan Garment Industry Strengths Weaknesses - good reputation for quality - poor road and transport infrastructure - reliability in delivery - high lead times - relatively low wages - low labor productivity - high compliance with international labor standards - highly restrictive labor laws - duty free provision for yarn and fabrics imports - limited local availability of raw materials - prestigious customer base - lack of market diversification - close proximity to India for fabrics - unreliable and high cost of power - competitive local exchange rate - high cost financing especially for SMEs - low clearance charges - lengthy port and customs clearance times
11. The sector’s success in large part can be attributed to the relatively low wages (Table 2.1) and educated
workforce in Sri Lanka. Workers in Sri Lanka are easier to train than less educated workers elsewhere.6 However, benefits of low hourly wages are quickly negated by high absenteeism (5 percent monthly), high labor turnover (about 5 percent monthly), persistent vacancies (10 percent of total workforce), costly and lengthy labor disputes, and low adaptation of modern technology all contributing to low labor productivity. Labor productivity in more competitive countries are around 65-75 percent, while Sri Lanka’s are only around 35-45 percent.7 The value added per worker in Sri Lanka is about 28 percent lower than in China, which operates with much higher levels of capital (Figure 2.1). Labor productivity in other South Asian countries such as India, Pakistan, and Bangladesh are also comparably low.8 Labor costs amount to only 15-20 percent of total costs. Thus, there are other significant non-labor aspects that also contribute to low productivity and high production costs. Power charges, for example, for industrial purposes in Sri Lanka at $ 11.44 per kwh are the highest in Asia, with the exception of Hong Kong. The power supply is also highly unreliable and nearly 75 percent of urban manufacturing firms in Sri Lanka own a generator compared to much lower levels in competitor countries (27 percent in China).9 Some
6 In Sri Lanka, it only takes about 2-3 weeks to train new employees to become sewing machine operators. 7 Labor productivity here is measured by the increase in output resulting from an increase in labor. 8 USITC (January 2004), ‘Textile and Apparel: Assessment of the Competitiveness of Certain Foreign Suppliers to the U.S.’ 9 World Bank (October 2004), ‘Draft Sri Lanka: Improving the Rural and Urban Investment Climate (ICA).’
6

manufacturers even opt to keep certain production processes manual, that can otherwise be mechanized, due to the high cost of power on one hand and relatively low wages on the other.
Source: World Bank ( 2004), ‘Implications for Pakistan of Abolishing Textile and Clothing Export Quotas.’
Table 2.2: Hourly Wages in Clothing (US$), 2002 Germany 21.18Italy 15.60USA 15.13Taiwan 7.15Hong Kong 6.15South Korea 5.73Mexico 2.30South Africa 2.17Turkey 2.13Mauritius 1.33Thailand 1.24China (Coastal) 0.69Kenya 0.62India 0.57Indonesia 0.50China (Interior) 0.41Sri Lanka 0.40Pakistan 0.34Bangladesh 0.25
12. The heavy reliance of the garment industry on imported raw materials, significant distance of Sri Lanka
from its major markets -- US and EU, prolonged customs clearances, and poor infrastructure network contribute to lengthy lead times. Sri Lanka sources most inputs from East Asian countries such as Taiwan and Korea. The road infrastructure in Sri Lanka is poor, and there are a limited number of ships and airlines operating in Colombo. As much as 90 percent of the paved road network in the country is in poor condition.10 Consequently, the lead time (duration of time between when an order is placed and when it is delivered) for the Sri Lankan garment industry is around 100 days, which is much longer than more competitive countries such as Hong Kong of around 60 days.
Figure 2:1: Labor Productivity and Capital Use in Garments in Sri Lanka and China (US$)
0
500
1000
1500
2000
2500
Value added/worker Fixed capital/worker
Sri Lanka
Source: World Bank (2004), ‘Draft Sri Lanka: Investment Climate Assessment.’
China
7
10 World Bank, October 2004.

13. Sri Lanka produces a large amount of goods for the mass market, but it has also managed to move up to higher value segments as reflected by increases in both the volume and unit price of garments exported (Table A4) in the last 15 years. Sri Lanka today can boast of a prestigious international customer base including famous clients such as Victoria’s Secret, Liz Claiborne, Pierre Cardin, Abercrombie and Fitch, Nike, GAP, Ralph Lauren, Marks and Spencer, NEXT, Triumph, and Tommy Hilfiger. Sri Lankan firms strong links to prestigious designer labels will help market itself further as a quality producer in future.
Box 2.2: Labor Standards in Sri Lanka
non discrimination among workers on the basis of sex, race, or religion prohibition of child labor prohibition of forced labor maintenance of health and safety standards strong adherence to minimum wage standards standard hours of work
14. The Sri Lankan garment industry has a good reputation for compliance with international labor standards
(Box 2.2). As most end-users in western countries attain higher incomes and purchasing power, they are also increasingly becoming more conscientious about social issues. In recognition of this track record in labor compliance, the EU granted additional GSP11 (Generalized System of Preferences) duty concession (20 percent duty reduction in addition to standard 20 percent GSP) to Sri Lanka in 2003. Only Sri Lanka and Moldova have succeeded in obtaining EU duty concession based on labor compliance to date.
Table 2.2. Regulations for Labor Redundancy for Selected Asian Countries
Country Administrative Authorization
Required Statutory Redundancy
Payment Per Year of Service Sri Lanka Yes, if over 15 employees Not fixed, case by case India Yes, if over 100 employees, not
applicable to managerial and administrative employees
15 days
Pakistan Yes, if closing down or retrenching more than half of workers
20 days
Malaysia No 10-20 days Thailand No Approximately 30 days, capped
at 180 days total Source: World Bank (2004), ‘Draft Sri Lanka Investment Climate Assessment.’
15. On the other hand, the labor regulations in the country are outdated, too restrictive, and negatively affect
Sri Lanka’s competitiveness.12 While some labor regulations have changed with minor revisions,13 others have remained untouched by time. The stringent labor regulations in Sri Lanka hampers productivity and job creation, not only in the garment industry, but of the economy at large. The most stifling regulations include the Termination of Employment of Workmen Act (TEWA). TEWA protects workers employed for at least one year in establishments with 15 or more staff. Under this law, termination of employment
11 The GSP preferences granted by the EU are country and product specific. All South Asian countries qualify for EU GSP based on the income criteria. Preferences are calculated as a percentage of Most Favored Nation (MFN) rates. Under the Special Incentive Arrangement (SIA), countries can get additional benefits for complying with certain environmental and labor standards. 12 Regulations are based on legislation such as the Trade Unions Ordinance of 1935, Wages Board Ordinance of 1941, Factories Ordinance of 1942, Industrial Disputes Act of 1950, and the Termination of Employment of Workmen Act (TEWA) of 1971. 13 In 2002, TEWA and the Industrial Disputes Act were amended to introduce the use of a uniform compensation formula and limit the time taken to resolve termination cases. However, the formula, which was originally scheduled to take effect in 2004, has been suspended.
8

is possible only with the prior written consent of the employee or the Commissioner of Labor. The mandatory severance payment is solely at the discretion of the Labor Commissioner and is on average much higher than international standards (Table 2.2 and Figure A1). The process leading to the consent takes several months if not years to resolve. Some exporters are somewhat shielded from these labor policies since although officially in effect for Board of Investment (BOI)14 firms, enforcement is known to be lax.15 Other firms can also try to avoid these regulations by hiring temporary workers. However, productivity tends to be lower in firms that have a larger share of temporary workers.16
III. Preparing for the MFA Phase Out
Box 3.1: A Perspective from Sri Lankan Garment Manufacturers
A cross-section of garment factories both around Colombo and outside were visited to inform this study ranging from very small low-tech subcontracting enterprises with 10 workers to very large umbrella companies with about 18,000 staff and 11 factories (including some with factories abroad). Very large companies run a number of production lines simultaneously with each worker only responsible for one step in the sewing process. While, very small factories run only one production line at a time with each worker responsible for 3 to 4 steps.
Manufacturers have not seen any indications from buyers so far of impending future loss of business. Sri Lankan companies have been proactive. Most manufacturers have been investing in expanding factories and upgrading technology to increase capacity and efficiency, and to comply with working standards specified by international buyers. Large umbrella companies and small stand alone factories alike are continuing to explore potentials for mergers. The lack of a solid fabric and accessory base in Sri Lanka is starting to be addressed with large umbrella companies such as Brandix Lanka and Mass Holding investing in fabric mills and accessory plants in the last five years taking advantage of available BOI incentives. Large companies are also strengthening direct relationships with buyers aboard, bypassing the need for Colombo-based intermediaries in future. While a handful already work purely with buyers abroad.
Although Colombo manufacturers believe that factories outside Colombo would close down or move to Colombo after the MFA, outstation factories disagree. Although, transport costs may be higher for factories located outside of Colombo, they are not exorbitant. In addition, outstation manufacturers report lower labor turnover, less labor shortages, and lower incentive payments. A number of the workers in Colombo also have to be boarded in dormitories at the manufacturers’ cost, while outstation workers are mostly local to the area.
Low labor productivity is of particular concern to manufacturers, and this is being attributed more due to labor issues than to inadequate investments in technology. Manufacturers ascribe their competitiveness to the educated easy to train workers, quality of products, reliability in delivery, strong compliance with international labor standards, and good long-term relationships with buyers. While the critical issues manufacturers emphasize that necessitate the Government’s urgent attention include the lack of affordable financing, stringent hiring and firing policies, restrictions on overtime and numerous holidays, and high power costs.
16. Restructuring activities in the apparel industry in Sri Lanka intensified in 2003 and 2004 in preparation
for a global quota free market in clothing. Most manufacturers are taking proactive measures to improve productivity by updating machinery and reconfiguring production lines, rationalize production costs through consolidations and mergers, and explore new niche markets through improved marketing. Merged companies are strengthening product specialization, with larger firms handling sales and marketing, while increasingly outsourcing certain production activities to smaller factories. Manufacturing processes are being streamlined, design capacity strengthened, and own brands are being developed (Box 3.1).17 The BOI offers a special package of incentives for mergers in the garment sector 14 The BOI provide direct tax incentives, exemptions from foreign exchange controls, and separate legal and administrative systems for taxation and customs to investors who meet minimum investment and export requirements in specific sectors. 15 World Bank (June 2004), ‘Draft Sri Lanka: Development Policy Review.’ 16 World Bank, October 2004. 17 For example, two of the leading garment companies in Sri Lanka, Phoenix Ventures and Jewelknit Group, merged to form Brandix Lanka in 2003 to develop Brandix as a branded product.
9

to aid this process. The apparel industry took several steps to improve delivery time in collaboration with the Ports Authority and Customs Department. The Budget 2005 announced in November 2004 also revealed additional incentives to the garment and textile industry in Sri Lanka including the proposed SME Bank to allocate $ 6 million to provide guarantees to SMEs in the sector, complete exemption from value added tax (VAT) of garment manufacturers registered with the Textile Quota Board, $ 1 million Grant to be provided to the Garment Sector Productivity Improvement Program, provision of $ 1 million to the University of Moratuwa to improve recently started design and marketing programs, and setting up of an industrial park in Biyagama with waste and effluent treatment plants to facilitate fabric manufacturing in the country.
17. Major manufacturers have been actively participating in international trade fairs facilitated by the Export
Development Board (EDB), Ministry of Industries, and private sector associations in an effort to strengthen existing relationships and search for new clients.18 The Ministry of Industries and JAAF also hired an American firm to assist the industry lobby for duty concessions to the US through its Trade and Investment Framework Agenda (TIFA) 19 similar to the African Growth and Opportunities Act (AGOA) granted to Sub-Saharan African countries with a facility to use foreign fabrics for 4 years. However, with US Presidential elections taking place this year and the Sri Lanka Presidential elections scheduled within the next 2 years, agreement on a free trade agreement with the US may not be completed soon.
18. To support the garment industry face the post-2004 era, the 2004 Budget introduced the Garment Sector Productivity Improvement Program implemented by JAAF. The program include a Grant to promote the industry abroad and interest free loans for manufacturers to pay for training and production process enhancements to improve productivity. Already, 10 pilot factories have been covered under this scheme and a total of 100 factories are to be included in the next 2 years. An additional $ 1 million Grant has also been provided in the 2005 Budget to expand the implementation of this program. The objectives of the program are to enhance productivity by 30 percent and lower the cost of production from 14 cents per minute to 5 cents per minute. However, it is still too premature to make a judgment about the effectively of this program at this point. A number of courses have also been launched by the Ministry of Industries
Table 3.1: List of BOI Approved Projects in Textiles, Fabrics, and Garment Accessories ($ Mn.), 2002-2003
Enterprise Activity Estimated InvestmentGreat Wall Thread Manufacturing Company (Pvt.) Ltd. sewing thread -Han Sung Koala Thread (Pvt.) Ltd. sewing thread -Noyon Lanka (Pvt.) Ltd. lace and yarn 24Biyagama Towel Mills (Pvt.) Ltd. terry towels 1Denim Yarn (Pvt.) Ltd. denim yarn and fabrics 1Lanka Knitters (Pvt.) Ltd. surgical cuffs 1D.P.A. Barcode and Label Printers (Pvt.) Ltd. barcode and printed labels 2Intima (Pvt.) Ltd. garment accessories 5Lankathermo (Pvt.) Ltd. wadding 1Nova Concepts (Pvt.) Ltd. ancilliary items 1Silueta (Pvt.) Ltd. molded bra cups and lace 5Total 41Source: Board of Investments.
18 For example, a Business Promotion Mission was sent by JAAF to North Carolina late this year in an effort to forge business links with US yarn and fabric manufacturers. This will be followed up by Sri Lanka hosting a business delegation from the North Carolina textile industry in December. 19 The TIFA provides a forum to examine ways to expand bilateral trade and investment relations. The signing of the TIFA with the US is considered by Sri Lanka as a prelude to the creation of a Free Trade Agreement (FTA). Countries such as Taiwan, Ghana, Egypt, Jordan, South Africa, Turkey, Nigeria, Bahrain, Brunei, Thailand, and Tunisia also have TIFAs with the US.
10

in collaboration with the London School of Fashion and London School of Marketing at the University of Moratuwa focused on building design and marketing capacity. Some tax incentives are also offered by the BOI for investments in fabrics and accessories to promote backward linkages in the industry, which have met with some success (Table 3.1).
19. A comprehensive five year strategy was developed by JAAF in June 2002 to strengthen the position of
the Sri Lankan apparel industry to face the total elimination of quotas in 2005 (Box 3.2). Eight task forces were appointed in logistics, backward integration, technology upgrading, labor, trade agreements, development of SMEs, image building, and financial reforms. The strategy has made considerable progress in enabling large companies develop marketing and design capacity, implement productivity enhancing training, and facilitate upgrading of technology. However, the strategy has been less effective in dealing with the issues that confront SMEs, e.g. lack of low cost financing. The industry has also not been able to tap the Budget 2004 allocation of $ 10 million on Technology Improvement for Small and Medium Industries due to administrative delays associated with the change in Government earlier this year. The JAAF plan has not considered an exit strategy for companies who may have to close down. And there are an unrealistic number of (about 93 items) recommended actions in the plan under various topics (Box 3.2), which cannot be completely address within a short time period.
Box 3.2: JAAF Strategy 2002
Objectives double turnover to $ 4.5 billion by 2007 transform industry from a “manufacturer” to a provider of a “fully integrated service” increase penetration into premium market segments become recognized as a superior manufacturer of specific product categories consolidate and strengthen the industry to meet the challenges of a quota free era
Topics Covered - labor laws - communication and language skills - utilities - technology - marketing - tariffs - air and shipping services - the Port - training - financing - alternative industries to garments - lobbying abroad for preferential agreements
20. Steeper global competition in garments and textiles will lead to some consolidation and closure of less
competitive manufacturers. However, neither the Government nor the industry has concrete strategies to deal with potential job losses and factory closures. How do we facilitate re-employment of garment factory workers who will loss their jobs due to the closures of less competitive firms? How do we ensure that the contributions of the employees and the employers to the employees trust fund (ETF) and employees provident fund (EPF) are credited to accounts on a timely basis? What can be done for mid-sized companies who can successfully compete without quotas with some technical assistance? Given that the end of the MFA is only weeks away, there is an urgent need to start focusing on developing a strategy to deal with possible job losses and company closures after 2004.
IV. Implications of the End of Clothing Quotas
4.1. Global Picture
21. A number of studies have tried to capture the likely global impact of the end of the MFA. Estimates of the expected annual global welfare benefit vary widely from $ 6.5 billion to $ 324 billion, with huge discrepancies with respect to the distribution of these gains (OECD 2003) (Box 4.1). The discrepancy in welfare gains is partly due to the proliferation of preferential trading agreements around the world, which
11

result in an uneven playing field. For example, the North American Free Trade Agreement (NAFTA), the African Growth and Opportunities Act (AGOA), and the Caribbean Basin Initiative (CBI) provide duty free access to the US market to goods originating from signatory countries.
22. There are also substantial fears internationally that China would dominate after 2004 now that it has
joined the World Trade Organization (WTO) with its low cost of production, allegedly supported in part by “unfair” trading practices (Box A1). One study conducted recently by the American Textile Manufacturers Institute (ATMI) report that China could increase its share in the US textile and garment sector from 13 percent in 2002 to 71 percent by 2006. US apparel companies are also planning to increase sourcing of garments and textiles from East Asia in future given the region’s excellent sewing skills, substantial manufacturing base for raw materials, and its excellent lead times. India is going to be another force to recon with after 2004 given its design expertise, huge manufacturing base for yarns and fabrics, massive skilled labor force, and ability to produce a wide range of apparels. India is considered as a major competitive alternative to China and is predicted to increase its market share in the US from the present 3 percent to 15 percent in the medium-term; and continue to be a strong global supplier of yarn and fabric.20
Box 4.1: Predicted Effects on Selected Regions of the End of the MFA
Region Predicted Effect Reason
South Asia - mixed - India is likely to benefit substantially with its strong backward linkages
- Competitiveness of other countries vary widely
East Asia - likely to benefit - readily available raw materials
- excellent lead times
China - will gain the most - low production costs - strong backward linkages
ASEAN - likely to lose - relatively high labor costs countries - lengthy shipping times
Central America - likely to consolidate to niche - preferential access to US through NAFTA and Mexico markets - proximity to the US market - relatively high cost of production
Mediterranean and - already gained a substantial share - proximity to European market Eastern Europe of the European market and this - reputation for quality
trend is expected to continue
African region - uncertain - preferential access through AGOA with the US and under “everything but arms” with EU - limited ca
pacity to produce beyond basic items
US and EU - substantial welfare gains - lower international textile and clothing prices
4.2. Local Impact 23. While a number of reports have been written on the garment industry in Sri Lanka, there is a dearth of
conclusive studies available quantifying the potential effects of the end of the clothing export regime on the country. Looking at recent investment patterns from the BOI, one cannot deduce from the data for certain whether investors expect the end of the MFA to result in a net gain or net lost for Sri Lanka. On one hand, some 50 BOI garment factories have closed down in Sri Lanka in the last 2 years mostly East
12
20 USITC, January 2004.

Asian investors who plan to move their plants back to their home countries. On the other hand, an equal number of new investors, mostly from Europe, must have recognized opportunities for growth in Sri Lanka have set up new factories during the same period. A number of existing investors are also expanding operations.
24. While the removal of MFA quotas on Sri Lanka is likely to benefit it, the simultaneous removal of other
countries’ quotas can potentially have negative effects. In 2002 when quotas were removed on five categories under Sri Lanka’s quotas to the US and all four categories to the EU the net impact on Sri Lanka was not clear. While, Sri Lanka significantly reduced its market share in three categories to the US, namely: playsuits, gloves and mittens, and luggage. It also maintained market share in two categories, namely: bras and dressing gowns. In addition, when quotas we removed for all four quota categories that Sri Lanka exported to the EU, garment exports to the EU remained stable around $ 777 million in 2003 demonstrating Sri Lanka’s competitiveness to some extent.
25. Estimates of the export tax equivalents (ETEs) for a subset of regions calculated by a recent World Bank
study21 also cannot offer a definitive answer. ETEs were estimated using quota prices when available or quota utilization rates (where no adequate estimates of quota prices were available) to determine the cost-raising effects of quotas. If a country’s ETE is higher than its competitors, it can be expected to gain from quota abolition. Conversely, if a country faces lower ETEs than other competitors, that would indicate that exporters are being sheltered by quotas and thus stand to lose out from their abolition. In Sri Lanka’s case, estimated ETEs are very low, but comparable to other competitive East Asian countries and newly industrialized countries, except for clothing exports to the US. The 7 percent ETE for Sri Lanka’s clothing exports to the US is significant and noteworthy since 61 percent of Sri Lanka’s garment exports go the US market (Table 4.1). In the end, no definitive conclusion can be drawn based on the estimated ETEs for Sri Lanka since its ETEs are moderate and comparable to half of the ETEs of the regions in the sample, Sri Lanka’s low ETEs are due in part to the recent high growth of its quotas in 2002 and 2003, and the practical application of ETEs is limited since they are based on the overall quota utilization rates of countries and do not take a product by product approach.22
Table 4.1: Estimated ETEs of Quotas in Selected Asian Regions, (%) 2002-2003 Textiles Clothing EU USA EU USA Bangladesh* - 0.0 - 20.4India 1.0 3.0 20.0 20.0Pakistan* 9.4 9.8 9.2 10.3China* 1.0 20.0 54.0 36.0Hong Kong* 2.1 0.0 12.3 2.3Sri Lanka 1.0 0.0 0.0 7.0Other East Asia/1 1.0 0.0 3.0 7.0Newly Industrialized Economies/2 1.0 0.0 0.3 2.5Notes: * Denotes an estimate based on quota price information. Other estimates interpolated from quota utilization data. /1 Based on Indonesia, Philippines, Thailand; /2 Korea, Taiwan.
Source: World Bank ( 2004), ‘Implications for Pakistan of Abolishing Textile and Clothing Export Quotas.’
21 World Bank (April 2004), ‘Implications for Pakistan of Abolishing Textile and Clothing Export Quotas,’ Washington, D.C. 22 The Bank’s Development Economic Group (DECDG) plans to carry out more detailed econometric analysis next year using US International Trade Commission data on imports by product category at the 10 digit level of desegregations to get a more realistic picture of the likely impact of the end of the MFA on different countries and regions.
13

Figure 4.1: Average (Weighted) Tariffs of Selected Countries to the US, (%) 1996-2003
101112131415161718
1996 1997 1998 1999 2000 2001 2002 2003
SriLankaChinaIndiaBangladesh
Source: Based on C. Ozden’s calculations using US International Trade Commission data.
26. After the end of quotas, tariffs will remain effective barriers to free trade in garments and textiles. Countries with preferential access to large markets such as the US will have an edge over the competition by facing lower tariff barriers when accessing markets. In Sri Lanka’s case, the country only has preferential access to the EU. However, it does not have preferential access to its main market – US. Analyzing tariffs countries face in exporting to the US using the US Trade Commission data reveal that Sri Lanka faces an average weighted tariff rate of 16.5 percent when exporting clothes to the US (Figure 4.1). This tariff rate is comparable to other countries in South Asia such as India and Bangladesh, and the average most favored nation (MFN) rate (16.7 percent in 2003). However, the tariffs Sri Lanka face in the US market are significantly higher than those faced by China (around 11 percent). This places China at an advantage, and suggests that Chinese exports to the US are highly concentrated in low tariff categories given that it too does not have preferential access to the US market.
Figure 4.2: Product Overlap in the US Market Between Sri Lanka and Other Countries, (%) 1996-2003
01020304050607080
1996 1997 1998 1999 2000 2001 2002 2003
Chinese share in Sri Lanka's export categoriesQuota Countries' share in Sri Lanka's export categories
Source: Based on C. Ozden’s calculations using US International Trade Commission data.
27. Now if we turn to US garment and textile imports, it is evident that the degree of product overlap between
China and Sri Lanka is limited (less than 13 percent), but significant from other quota facing countries (66 percent) (Figure 4.2). Therefore, Sri Lanka can expect to face significant competition from other quota countries after the end of the MFA, although not necessarily from China. It is also important to note that only one-sixth of total US and one-third of US clothing imports from China still remain under binding23 quotas (Figure 4.3). In addition, the WTO also provides for safeguard measures after 2004 in the event that imports from certain countries are found to cause market disruption. Already, the US imposed a quota on the import of Chinese socks with effect until October 28, 2008 and similar quotas are expected to be imposed on other products from China. Finally, poor labor standards is likely to hurt China. Last 23 Defined as over 80 percent utilization of quota category.
14

year, for example, the US retail giant Wal-Mart was criticized by the US National Labor Committee and China Labor Watch for sourcing from Chinese firms who pay their workers below the minimum wage. Thus, the ‘China effect’ after quotas are removed will likely be more subdued than many expect.
28. The Sri Lankan garment industry in its entirety is not ready to face the removal of quotas. The stronger
and larger companies are equipped to take advantage of the opportunities of a non-quota environment. Whereas, a substantial number of SMEs have not changed their operations adequately to improve cost-effectiveness and quality, and some will have to close down after quotas are abolished. Some studies speculate that the worse case scenario would result in the closure of all small enterprises and half of medium sized enterprises in Sri Lanka. This can result in the lose of 70,000 jobs (Table 4.2). What is worrying is that workers who are likely to loss their jobs will tend to come from small enterprises, low skill levels (equating to low wages), and be predominantly women. This is particularly disquieting given that unemployment among women (14 percent) is double that of men (7 percent) in Sri Lanka.24
Figure 4.3: Volume of US Import of Textiles andClothing, ($ Billions) 2003
010203040506070
Total Clothing Exports Exports Under Quotas
China Total US import of T&C
Exports Under Binding Quotas
Source: Based on C. Ozden’s calculations using US International Trade Commission data.
29. Bottom Line: In the end, the actual loss of exports and employment in Sri Lanka emanating from the removal of clothing export quotas will likely be less extensive than many fear. First, over 80 percent of total US clothing imports and over 65 percent of US clothing imports from China no longer come under binding quotas. Second, the extent of overlap in the products that China and Sri Lanka produce is limited (13 percent) (Figure 4.1). Third, when all clothing categories Sri Lanka exported to the EU were liberalized Sri Lanka managed to maintain its market share demonstrating signs of competitiveness. Therefore, the effects of the MFA quota abolition will likely be more muted than expected. Consequently, the more plausible resultant loss in employment following the abolition of quotas will amount to less than 50,000 jobs (less than 15 percent of total jobs in the sector) and cost the industry roughly $ 115 million in total severance payments.25
Table 4.2: Garment Manufacturers by Employment, 2001 Employment
Category Number PercentageSmall (1-100 employees) 10,501 3 Medium (101-250 employees) 118,679 35 Large (Over 251 employees) 209,524 62 Total 338,704 100
Source: Central Bank of Sri Lanka 2002 Annual Report.
24 Department of Census and Statistics Second Quarter 2004 Labor Force Survey. 25 This is based on a rough calculation taking the average hourly wage in clothing in Sri Lanka of $ 0.40 (Table 2.1), assuming employees work an average of 20 years, using the average 1.8 months of wages per year of service in the proposed TEWA compensation formula, and taking 50,000 job losses into account.
15

V. How Can the Sri Lankan Garment Industry Be More Competitive?
30. The Sri Lankan garment industry and the Government have taken a number of very valuable steps to deal with some of the weaknesses of the sector, described in Chapter 2, in preparation for the MFA phase out. These key steps were then discussed in Chapter 3, including rationalization of production costs through consolidations and mergers; and improving productivity through training, updating of machinery, and reconfiguring production lines. However, there are still some important issues and information gaps that are lacking and crucial to unlocking the garment sector’s growth potential, but have not been completely addressed. Initially buyers would test new producers and are unlikely to shift the entirety of their orders overnight. This gives Sri Lanka only a few years to adjust and strengthen its position. This section will be intentionally selective and highlight only the decisive challenges and information gaps holding the industry back from fully realizing the benefits of a post-export quota era. A summary of these key actions is provided at the end of this section in Box 5.1.
31. Labor productivity in Sri Lanka is notably low. The reasons behind low labor productivity include high labor turnover, high absenteeism, rigid labor laws, workers’ incentives not tied to performance, insufficient investments in technology, inefficient production processes, and poor management. The implementation of the Garment Sector Productivity Improvement Program is a good beginning. However, the completion of labor reforms has been stalled. The implementation of pending labor reforms to liberalize hiring and firing policies are essential in improving labor productivity, facilitating the restructuring of garment industries for improved competitiveness, and encouraging job creation in the rest of the economy. Rigid labor regulations was identified by the recently competed Investment Climate Assessment (ICA) on Sri Lanka as a top constraint by investors. However, no rigorous analysis has been carried out to analyze how labor productivity in Sri Lanka compare to other countries. There is no data available quantifying the relative contribution to low labor productivity of the above mentioned factors. And reports on the reasons behind high labor turnover are not conclusive. There is a need to study productivity issues more systematically and address rigidities in the labor market promptly since tackling these questions will be vital to ensuring the survival of the Sri Lankan garment industry post-2004.
32. The new trend in the global garment industry is “just in time” production where buyers minimize their risks by placing orders closer to fashion seasons and in smaller quantities. This demands quick responses and more efficient linkages among fabric suppliers, manufacturers, and retailers. Thus, making the need to resolve behind the border constraints an urgent priority. Behind the border problems in Sri Lanka include weak road, transport, air, and power infrastructure; inefficiencies in customs; and constraining land, capital, and labor markets. These issues have important ramifications not only in improving lead time and lowering the cost of production in the garment sector, but in improving the efficiency of the rest of the economy. The operations of the ports, airport, and customs need to improve to cut down consignment clearance times. Investments are urgently needed in roads. And reforms in the power sector are desperately required to lower costs and improve quality. The ICA also point to poor power and road infrastructure as major constraints in Sri Lanka’s investment climate.
33. International marketing and promotion need to be enhanced, including not only efforts to keep existing
buyers, but also aimed at gaining new markets. In future garment manufacturers need to be more proactive in pursuing clothing designers and buyers of specialty/branded and department store items in the US, EU, and other potential markets such as Japan and Australia. Competition from cost effective countries such as China will intensify in the low value segments after 2004. Therefore, Sri Lankan manufacturers have to concentrate further on capturing orders for higher value added goods such as branded knitted shirts and blouses, sportswear, children’s wear, and intimate wear -- areas where Sri Lanka has a comparative advantage and a reputation for quality. The industry also needs to effectively utilize its reputation for quality, dependability, and labor friendly policies in future marketing campaigns.
16

34. Although, not an alternative to improving Sri Lanka’s overall competitiveness, preferential access to markets, such as the US and the EU, can ease the transition of the industry from quotas to global free trade. Over half of clothing exports to the US already occur under various preferential arrangements with other countries. Sri Lanka needs to continue lobbying for duty free concessions to the US market as part of its TIFA, pushing for a facility to use foreign fabrics. There is also a need to pursue extending the current rules of origin requirements (South Asia) for GSP concessions to the EU to East Asia where Sri Lanka sources most of its fabrics. New trading arrangements with other potential markets need to be explored. However, Sri Lanka must ensure that the preferential agreements it enters cover the bulk of all trade and address non-tariff barriers. Rules of origin requirements should not be restrictive and should be simple to administer to maximize benefits.
35. SMEs are an important source of employment and growth, which make their survival key to the country’s
overall long-term growth and poverty reduction strategy. However, smaller garment manufacturers note that the high cost financing and the lack of collateral deter them from being able to invest in much needed productivity enhancing technology and place them at a significant disadvantage compared to larger firms. Similarly, smaller urban firms interviewed in the ICA also cite the high cost of finance as a major investment constraint with smaller firms paying significantly higher interest rates (18 percent) than larger firms (12 percent). In addition, the ICA note that banks in Sri Lanka rely primarily on the value of collateral when approving loan applications. The guarantees to be provided by the proposed SME Bank in the 2005 Budget to SMEs in the sector is a good start. Nonetheless, further work is needed to identify SMEs who can thrive post 2004 with some financing and technical assistance. In addition, credit to smaller manufacturers need to be restructured and the incentives available to large firms and SMEs need to be harmonized to bring SMEs on par with large manufacturers.
36. The removal of clothing quotas will bring about steeper competition in the global garment export market.
This is bound to lead to some consolidation and the closure of less competitive firms. The Government can play a useful role in addressing the resultant job losses from consolidations and company closures by strengthening the coordination of job search services; and by expediting the implementation of labor reforms, including the uniform compensation formula that apply to workers covered under TEWA. In addition, the contributions of employees and employers to ETF/EPF have to be closely monitored to ensure accounts are credited on a timely basis. These programs must aim at minimizing the economic and social impact of plant closures on communities in a cost effective and least trade-distorting manner. A strategy to deal with company closures and redundancies is still not in place at the present time. Box 5.1: Summary of Key Actions to Enhance Sri Lanka’s Competitiveness
Adjustment Strategies: Continue consolidation of factories and firms for increased competitiveness and cost effectiveness. Implement labor reforms to make retrenchment costs more predictable and less costly. Study labor productivity issues in Sri Lanka more systematically. Strengthen lobbying for a FTA with the US and extending EU GSP rules of origin to East Asia. Form more efficient sourcing arrangements between fabric suppliers abroad and local garment manufacturers. Continue improving marketing and design capacity of manufacturers to capture high value added markets. Harmonize incentives available to SMEs with those available to large firms. Monitor ETF/EPF contributions in garment enterprises to ensure employees accounts are credited timely. Strengthen the Job Match Program of the Ministry of Labor and Employment.
Longer-term Competitiveness Strategies: Undertake power sector reforms to lower costs and improve quality. Increase investments in road development and maintenance. Modernize the operations of the Customs Department and Colombo Port to increase efficiency.
17

References Ahamed S. and Rajan P. (1995), ‘Promoting Growth in Sri Lanka: Lessons from East Asia,’ The World Bank, Washington D.C. Amunugama S. (November 2004), ‘Budget Speech 2005,’ Ministry of Finance and Planning, Colombo. Central Bank of Sri Lanka (CBSL), ‘ Annual Report, multiple years,’ Colombo. Department of Census and Statistics (2004), ‘Second Quarter 2004 Labor Force Survey,’ Colombo. Economic and Social Commission for Asia and the Pacific (ESCAP) (July 2003), ‘Tariff and Trade Policy Framework for Sri Lanka in 20003,’ Bangkok. Financial Times, Daily Mirror (September 24, 2004), ‘Apparel Industry for Partnerships with US Yarn, Fabric Makers,’ Colombo. Fernando H.S.P.N., Goonewardene S.M.G., and Peiris N.S. (2002), ‘Enhancing the Competitiveness of the Sri Lankan Weaving Apparel Industry,’ Colombo. Fernando N. (September 2004), ‘Impact of the MFA Phase Out on Sri Lankan Apparel Industry,’ Marawilla, Sri Lanka. Organization for Economic Cooperation and Development (OECD) (2003), ‘Liberalizing Trade in Textiles and Clothing: A Survey of Quantitative Studies,’ www.oecd.org/trade. OECD (August 2004), ‘Structural Adjustment in Textiles and Clothing in the Post-ATC Trading Environment,’ www.oecd.org/trade. Ozden C. and Sharman G. (February 2004), ‘Price Effects of Preferential Market Access: The Caribbean Basin Initiative and the Apparel Sector,’ World Bank, Washington D.C. Institute of Policy Studies (IPS) (June 2004), ‘Ready-Made Garment Industry in Sri Lanka: Facing the Global Challenge,’ Colombo. International Labor Organization (April 2002), ‘Garment Industry in South Asia. Rags or Riches?,’ Geneva.
Joint Apparel Association Forum (June 2002), ‘5 Year Strategy for the Sri Lankan Apparel Industry,’ Colombo. Ratnayake J. (2002), ‘Challenges by the Apparel Industry,’ Garment Times, Colombo. Ladduwanhetty R. (November 3, 2004), ‘US Taxing Chinese Imports to Benefit Lanka’s Apparel Industry,’ Financial Times, Colombo. Lanka Business Online (LBO) (August 4, 2004), ‘Tough Luck,’ Colombo.
18

LBO (August 3, 2004), ‘Hard Bargain,’ Colombo. LBO (August 20, 2004), ‘Closer Fit,’ Colombo.
Perera Y. (September 24, 2004), ‘JAAF in Productivity Push with Treasury Funding,’ Financial Times, Daily Mirror, Colombo.
Kelegama S. and Epaarachchi R. (November 2001), ‘Productivity, Competitiveness and Job Quality in Garment Industry in Sri Lanka,’ IPS, Colombo.
Sunday Leader (August 2004), ‘Apparel and Textile News,’ Colombo. Textile Quota Board (October 2002), ‘Scheme Approved by the Ministry of Enterprise
Development, Industrial Policy, and Investment Promotion Under Section 4 of the Textile Quota Board Act No. 33 of 1996 for the Management, Distribution, Utilization, and Allocation of Export Quotas of Textiles and Textile Products,’ Colombo. US-China Economic and Security Review Commission to the United States Congress (2004), ‘2004 Report to Congress on the US-China Economic and Security Review Commission,’ http://wwww.uscc.gov. UN COMTRADE Database.
United States International Trade Commission (USITC) (January 2004), ‘Textiles and Apparel: Assessment of the Competitiveness of Certain Foreign Suppliers to the U.S. Market,’ Washington, D.C.
Vodopivec M. (October 2004), ‘A Note on the New Proposal on TEWA Formula and Unemployment Benefit System,’ Colombo. World Bank (1999), ‘A Fresh Look at Unemployment in Sri Lanka,’ Washington D.C.
World Bank (May 2003), ‘Trade Policies in South Asia,’ Washington D.C.
World Bank (April 2004), ‘Implications for Pakistan of Abolishing Textile and Clothing Export Quotas,’ Washington, D.C.
World Bank ( June 2004), ‘Draft Sri Lanka: Development Policy Review,’ Washington, D.C. World Bank (September 2004), ‘Draft Concept Note: Challenges and Opportunities in a Post
MFA World Strategies and Options for Bangladesh Readymade Garment Sector,’ Washington D.C.
World Bank (October 2004), ‘Draft Sri Lanka: Improving the Rural and Urban Investment Climate (ICA),’ Washington D.C.
World Bank (2004), ‘Doing Business in 2005,’ Washington, D.C.
19

Annexes
Table A1: Structure of Exports from Sri Lanka, 1978-2003
US Dollars Million
Industrial Exports Agricultural Exports
Of Which Year Total
Industrial
Textiles and
Garments
Petroleum
Products
Rubber Product
s
Diamonds
Tea
Rubber
Coconut Product
s
Minor Agricultural Products
AgriculturalExports
GemsOther Total Exports
1978 124 30 666 34 20 8451980 360 111 658 40 6 1065
1985 526 293 143 … … 442 94 114 50 701 21 74 1,315 1990 1,036 628 99 30 92 495 77 69 80 721 73 140 1,9841991 1,226 804 79 30 68 432 64 63 82 641 57 110 2,0391992 1,763 1,214 63 60 107 340 68 84 113 605 57 30 2,4611993 2,102 1,412 79 71 142 413 64 58 121 656 71 30 2,8641994 2,399 1,552 80 102 146 424 72 76 129 701 79 21 3,2091995 2,889 1,853 85 153 163 481 111 103 134 829 78 21 3,8071996 3,006 1,902 104 169 157 616 104 110 132 962 86 41 4,1031997 3,436 2,274 97 178 125 719 79 118 145 1061 83 59 4,6481998 3,607 2,460 73 178 121 780 44 94 170 1088 56 47 4,7351999 3,551 2,425 74 161 161 621 33 129 165 948 61 51 4,6102000 4,283 2,982 98 196 179 700 29 121 155 1005 93 141 5,5222001 3,710 2,543 68 172 166 690 24 82 136 932 82 93 4,8172002 3,631 2,424 73 182 192 660 27 84 168 938 86 41 4,6992003 3,977 2,575 65 231 216 683 39 93 150 965 79 108 5,133
Source: Central Bank of Sri Lanka Annual Report (multiple issues)
i

Table A2: Textile and Garment Exports of Sri Lanka, (As a Percentage of Total Exports) 1998-2003
HS code Description 1998 1999 2000 2001 2002 200350 Silk 0.00 0.00 0.00 0.00 0.00 0.00
0.00 0.00 0.00 0.01 0.00 0.0051 Wool fine or coarse animal hair, horsehair, yarn & woven fabrics
52 Cotton 1.23 1.00 0.79 0.73 0.62 0.360.66 0.80 0.61 0.66 0.69 0.6653
Other vegetable textile fibers, paper yarn & woven fabric of paper yarn
54 Man-made filaments 0.26 0.27 0.31 0.22 0.20 0.1555 Man-made staple fibers 0.65 0.65 0.55 0.45 0.44 0.38
0.10 0.09 0.12 0.14 0.16 0.20
56 Wadding,felt & nonwovens, special yarns, twine, corage, ropes & cables & articles thereof
57 Carpets & other floor covering 0.15 0.14 0.16 0.17 0.16 0.17
0.16 0.20 0.27 0.26 0.42 0.5458 Special woven fabrics, tufted textile fabrics, lace, tapestries, trimmings, embroidery
0.07 0.06 0.05 0.03 0.02 0.0459
Impregnated, coated, covered or laminated textile fabrics; textile articles of a kind suitable for industrial use
60 Knitted or crocheted fabrics 0.37 0.35 0.59 0.30 0.40 0.46
14.51 16.45 18.30 17.49 16.58 16.0261 Articles of Apparel and clothing accessories, knitted or crocheted
32.44 32.73 32.99 32.83 31.35 30.7562 Articles of Apparel and clothing accessories, not knitted or crocheted
2.17 1.80 1.81 1.69 0.98 0.8363
Other made up textile articles, sets, warm clothing & worn textile articles, rags
Source: Department of Customs, 2004.
ii

Box A2: Non-Tariff Barriers in Sri Lanka Compared to the web of controls and licensing that existed 25 years ago, there are few non-tariff barriers to trade in Sri Lanka today. In January 2002 licensing requirements for the import of rice were removed, other than for the import of paddy. Procedures for importing low value items were simplified. Around 12 items are under import license on the grounds of national security, public health, and environmental protection. Four items require an export license and the export of non ferrous scrap metal is banned. The main non-trade barriers of concern now arise in the context of:
• Goods involving safety and security. • Preferential treatment of BOI firms no longer applies but existing contracts are being honored. • Business licensing requirements affecting both production for domestic and external trade. • Restrictions on entry into trade of services. • Temporary bands on some exports such as scrap metal. • Ban on the import of cars, agricultural, and construction machinery over 10 years old on environmental grounds. • Restriction on the import of tea, including tea for blending and re-export. • Restrictions on the import of rubber for further processing.
Source: ESCAP July 2003.
iii

US Category Description 1996 1997 1998 1999 2000 2001 2002 2003237 PLAYSUITS, ETC 62 76 58 40 29 24 9 9314 FABRIC: POPLIN/BROADCLOTH 84 90 77 73 23 14 5 5331/631 GLOVES 100 76 62 77 93 81 41 41333/633 SUIT-TYPE COATS,M&B 4 6 0 2 1 0 5 5334/634 COATS,NON-SUIT, M&B 94 100 100 71 76 77 89 89335/835 COATS, W&G 52 84 93 38 34 57 61 61336/636/836 DRESSES 100 96 94 97 98 80 100 100338/339 KNIT SHIRTS & BLOUSES 100 100 100 96 100 100 100 102340/640 SHIRTS, NOT KNIT,M&B 84 82 100 96 86 82 69 69341/641 SHIRTS, BLS., N.K., W&G 50 45 56 81 81 58 58 58341 SHIRTS, BLS., N.K., W&G 50 38 44 87 85 57 61 61641 SHIRTS, BLS., N.K., W&G 25 29 36 25 73 51 51 51342/642/842 SKIRTS 100 76 90 100 96 72 97 92345/845 SWEATERS 59 41 58 48 97 100 89 89347/348/847 TROUSERS,ETC 100 98 100 100 100 100 100 106350/650 DRESSING GOWNS, ETC., 89 100 100 93 91 100 * *351/651 NIGHTWEAR 100 100 97 79 87 98 100 100352/652 UNDERWEAR 100 100 71 76 84 100 100 100359/659-C COVERALLS & OVERALLS 100 100 55 37 40 38 25 25360 PILLOWCASES 27 0 14 43 59 24 54 54363 TERRY & OTHER PILE TOWELS 100 87 99 90 93 56 46 46369-D DISH TOWELS 26 4 32 6 15 9 * *369-S SHOP TOWELS 90 84 99 100 66 40 87 87434 COATS, NONSUIT, M&B 13 5 15 38 20 18 14 14435 COATS, W&G 61 76 19 17 90 84 59 59440 SHIRTS & BLS., NOT KNIT 36 10 4 16 35 39 22 22611 FABRIC:SPUN CELL., WOVEN 36 50 37 37 34 13 5 5635 COATS W&G 80 100 100 86 77 92 76 76638/639/838 KNIT SHIRTS 47 64 65 86 94 57 62 62644 SUITS, W&G 10 25 98 73 100 78 69 69645/646 SWEATERS 8 33 32 19 33 27 26 26647/648 TROUSERS & SHORTS 82 100 100 96 100 100 100 100840 SHIRTS & BLOUSES, N.K. 79 36 71 69 78 66 * *
EU Category Description 1996 1997 1998 1999 2000 2001* 2002* 2003*6 TROUSERS,SHORTS, BREECHES (M/W) 81 80 83 96 100 7 WOVEN & KNITTED BLOUSES (W/G) 100 98 86 68 66 8 WOVEN SHIRTS (MEN'S & BOY'S) 70 54 37 52 39 21 PARKAS,ANORAKS, WINDCHEATERS,WV 28 25 23 17 14 CANADA Category Description 1996 1997 1998 1999 2000 2001 2002 20031 COATS, JACKETS & RAINWEAR 33 37 42 35 70 41 36 3601A OVERCOATS 3 9 24 17 6 8 6 62 WINTER OUTERWEAR M&B, W&G 69 95 81 71 89 93 64 6403/04 MALE/FEMALE CASUAL & FINEWEAR 32 38 28 20 29 20 16 1603/04A FINE SUITS (SUB-LIMIT) 0 6 0 0 0 6 35 355 TROUSER,OVERALLS & SHORTS 56 70 100 83 100 100 100 10607/08 WOVEN SHIRTS, BLOUSES, ATLETIC 27 29 61 40 9 11 10 1007/08A K/C SHIRTS, BLOUSES & SIMILARART 51 103 98 68 75 98 * *9 UNDERPANTS,BRIEFS, PANTIES 36 23 5 11 13 34 59 5910 SLEEPWEAR & BATHROBES,MB, WG,C 13 15 21 15 17 18 11 1111 SWEATERS, JERSEYS, MB,WG,C 35 5 5 14 31 31 24 2412 SWIMWEAR, MBWGC, K/C & WOVEN 32 23 18 22 24 16 * *14 BABIES GARMENTS 31 60 49 44 91 97 * *41A BED SHEETS & PILLOWCASES 19 33 21 66 49 29 0 0
*Quotas liberalized.
Table A3: Sri Lanka's Quota Utilization Rates by Product Category, 1996-2003
Source : Sri Lanka Textile Quota Board.
iv

Table A4: Value, Volume and Unit Value of Garments Exports (US$), 1985-2001
Sri Lanka and Thailand, 1985 - 2001 1
Bangladesh China Indonesia Sri Lanka Thailand
Value Volume Unit value
Value Volume Unit value
Value Volume Unit value
Value Volume Unit value
Value Volume Unit value
1985 16 --- --- --- --- --- 17 30 58 47 71 66 34 64 541986 19 42 46 --- --- --- 27 42 64 55 93 59 44 73 601987 46 69 66 57 126 45 34 44 78 72 103 70 67 89 761988 66 65 102 68 149 46 44 51 87 73 95 77 78 93 841989 67 7 7 86 83 97 86 70 88 79 84 97 86 89 96 921990 100 100 100 100 100 100 100 100 100 100 100 100 100 100 1001991 119 109 109 129 87 148 138 123 112 121 110 110 124 106 1161992 146 135 108 174 276 63 190 157 121 177 147 120 117 113 1031993 194 194 100 1 90 316 60 207 187 111 201 180 112 121 111 1101994 205 218 94 248 387 64 185 168 110 219 204 107 119 124 961995 269 275 98 239 386 62 182 174 105 214 195 110 108 140 771996 294 318 92 248 398 62 200 188 106 221 188 118 83 140 591997 408 584 70 304 4 49 68 164 182 90 250 201 125 82 142 581998 603 569 96 294 490 60 142 155 92 291 227 128 88 124 711999 --- --- 0 308 524 59 205 264 78 325 249 130 89 120 752000 --- --- 0 370 652 57 263 289 91 359 271 133 96 118 822001 682 717 95 378 754 50 246 300 82 337 271 124 103 106 96
Growth 4 (%)
24.0 2 21.2 2 0.2 2 13.5 3 15.13 -1.53 11.3 11.6 0.2 12.2 8.3 3.8 0.6 2.2 -1.6
(t ratio) (2.9) * (20.9)** (0.1) (13.6)** (8.1)** (0.8) (5.2)** (8.1)** (0.3) (14.2)** (12.0)** (6.6)** (0.5) (3.2)* (-1.3)
Notes (1) The data reported in the Table cover exports of garments belonging to three SITC 3-digit categories (Men's and
Boy's outwear, textile fabrics not knitted or crocheted (SITC 842), Women, girls, infants outwear, not knitted or crocheted (843), and Outwear knitted or crocheted (845)).
(2) For the period 1986-99. (3) For the period 1987-2001. (4) Growth rate estimated by fitting a logarithmic trend line. T-ratios are given in bracket, with the statistical
significance denoted as: * 5-percent, ** one-percent. --- Data not available.
Source: Compiled for data extracted from UN COMTRADE database
v
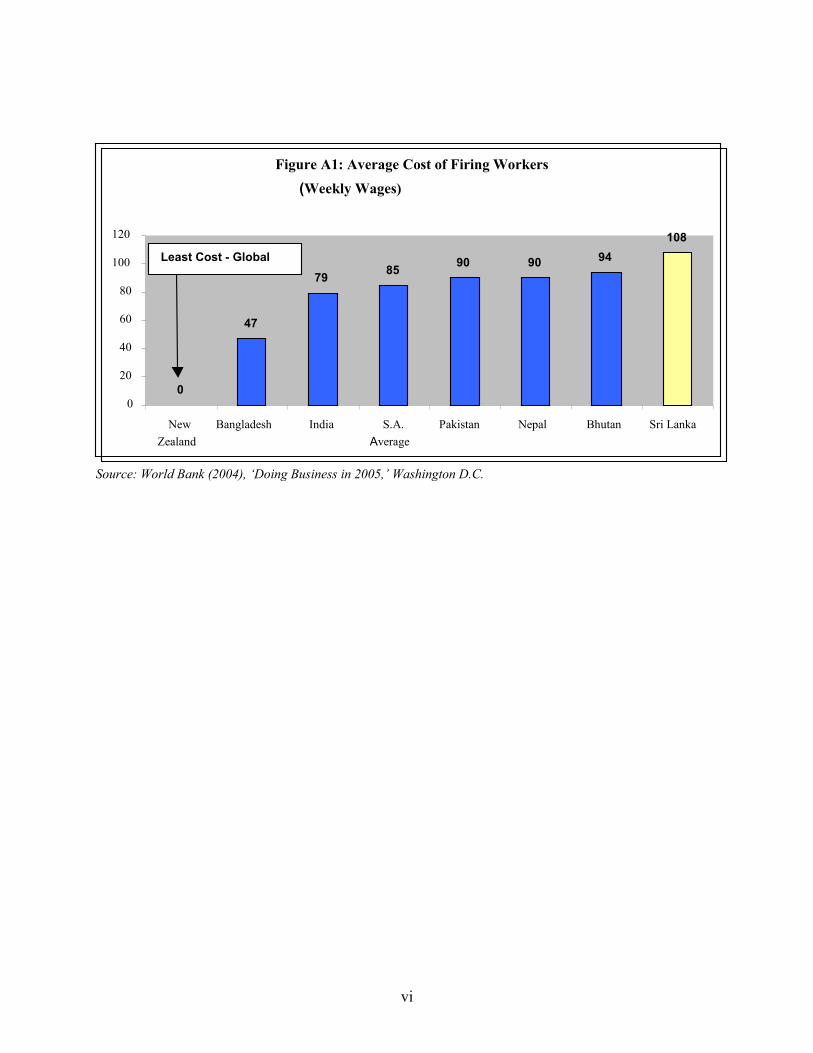
ource: World Bank (2004), ‘Doing Business in 2005,’ Washington D.C.
Figure A1: Average Cost of Firing Workers
(Weekly Wages)
0
47
79 85 90 90 94 108
0
20
40
60
80
100
120
New Zealand
Bangladesh India S.A. Average
Pakistan Nepal Bhutan Sri Lanka
Least Cost - Global
S
vi

Box A1: China’s Unfair Trading Practices
The US-China Economic and Security Review Commission to the United States Congress testify in their 2004 Annual Report that China continues to observe a wide array of unfair and WTO illegal trade practices. China’s adherence to the market access commitments it made as part of its WTO agreement has been described by the Commission as, “at best, mixed.” China continues to heavily subsidize manufacturers through tax incentives, subsidized utilities, and preferential access to credit and capital from State-owned financial institutions. The unfair trading practices cited by the Commission included the following:
• Artificially suppressing the value of its currency by as much as 40 percent • Discriminatory lending practices by Chinese State-owned banks • Subsidized credit • Discriminatory tax relief • Privileged access to land • Privileged access to listings on national and international stock markets • Limitations on access to domestic marketing channels • Direct support for research and development from the Government Budget • Government selection of partners for major international joint ventures
vii

viii
Princess Ventura Q:\My Documents\Princess\Post-MFA\SL MFA Note 12_6_04 Draft.doc December 6, 2004 9:47 PM