Embed Size (px)
Citation preview

Is Social Exclusion still important
for Older People? Dylan Kneale
September 2012
www.ilcuk.org.uk

The International Longevity Centre - UK (ILC-UK) is an independent, non-partisan think-tank
dedicated to addressing issues of longevity, ageing and population change. It develops ideas,
undertakes research and creates a forum for debate. The ILC-UK is a registered charity (no.
1080496) incorporated with limited liability in England and Wales (company no. 3798902).
ILC–UK
11 Tufton Street
London
SW1P 3QB
Tel : +44 (0) 20 7340 0440
www.ilcuk.org.uk
This report was first published in September 2012 © ILC-UK 2012
Acknowledgements
Production of this report would not have been possible without funding from Age UK as part of a
three year programme of work. Thanks are also due to Gill Wyness for her ever valuable input and
support. Thanks also to David Sinclair and Craig Berry for input in terms of policy, and to Trinley
Walker for assistance in editing. Any errors or inaccuracies are the authors own. Feedback is
welcome and any comments will be gratefully received ([email protected]).

Table of Contents
Chapter 1: What does social exclusion mean for older people? .......... 4
1. What does social exclusion mean for older people? ........................ 5
Chapter 2: Data and Methodology: How can social exclusion be
measured among older people? ........................................................... 15
2. Data and Methodology: How can social exclusion be measured
among older people? ............................................................................ 17
Chapter 3: Who was at risk of being socially excluded in 2008? ....... 44
3. Who was at risk of being socially excluded in 2008? ...................... 45
Chapter 4: How does exclusion status change over time among
individuals? ........................................................................................... 62
4. How does exclusion status change over time among
individuals? ........................................................................................... 63
Chapter 5: What impact can social exclusion have on people's
lives? ...................................................................................................... 89
5. What impact can social exclusion have on people's lives? ........... 90
Chapter 6: Conclusions and policy implications - does social
exclusion still matter for older people? ............................................. 101
Appendix 1 - Glossary ......................................................................... 118
Reference ............................................................................................. 119
Chapter 1: What does social exclusion mean for older people?
4
Chapter 1: What does social exclusion mean for older people?
KEY MESSAGES
What is social exclusion?
The idea of social exclusion builds on a long-standing recognition that material
exclusion is both caused by, and is a cause of, exclusion from other domains
related to an individual‟s wellbeing.
Social exclusion is generally accepted to be a multifaceted concept involving
more than simply material disadvantage.
What do we know about social exclusion among older people?
Older people are faced by the threat of losing independence – either financial
or otherwise – which is a key challenge and underpins the identification of
different domains of social exclusion for older people.
Most studies of social exclusion have focussed on children, young people,
and families. Where studies have focussed on older people, risk factors such
as ethnicity and gender, known to be predictive of social exclusion among
other age groups, have not been identified in some quantitative studies as
particularly important components in explaining patterns of deprivation.
Decent housing and access to public transport have been found to be key
issues for older people. Given that social exclusion is also related to societal
participation, social exclusion is possibly more relevant for older people than
other measures of deprivation given that age related factors operate to
prevent societal participation.
What is the current political standpoint on social exclusion?
Social exclusion is not generally a term explicitly used by the current coalition
government. However, the notion that material exclusion is both caused by,
and is a cause of, exclusion from other domains remains a focus of some
policies, albeit under alternative terms of „social isolation‟ or „social justice‟.

Chapter 1: What does social exclusion mean for older people?
5
1. What does social exclusion mean for older people?
1.1 What is meant by ‘social exclusion’?
„Social exclusion‟ has evolved over several decades. Early work began with Townsend (1979)
whose work centred on the detrimental effects of poverty. Townsend argued that exclusion arose
when “resources are so seriously below those commanded by the average individual that they are,
in effect, excluded from ordinary living patterns, customs and activities” (Townsend, 1979; p32).
Townsend argued that poverty did not merely represent lack of financial wealth, but could also
encompass non-financial resources, and that there existed a loosely defined set of customs,
material goods and social „pleasures‟ that the majority of people were entitled to, giving a threshold
below which people were excluded.
Walker & Walker (1997, p8) also focussed on income and poverty in their definition of social
exclusion as “a lack of material resources, especially income, necessary to participate in British
society” but also noted that exclusion has a broader meaning: it refers to “the dynamic process of
being shut out, fully or partially, from any of the social, economic, political and cultural systems
which determine the social integration of a person in society”. Indeed, definitions of social
exclusion that focused mainly or exclusively on poverty prompted researchers to argue that social
exclusion must be defined with both monetary and non-monetary indicators (Nolan and Whelan,
1996), and that there is a need to separate “social exclusion” from “poverty” (Room, 1998).
As a result of earlier work, it is now the norm for definitions of social exclusion to focus on other
outcomes besides financial indicators, (Barnes et al 2006; Levitas, 1998) and in particular to focus
in on the relationship between the individual and society. Individuals are defined as socially
excluded when they suffer from a range of problems, which may or may not include poverty, but
which endanger their relationship with society; for example, the “inability to participate effectively in
economic, social, political and cultural life, alienation and distance from the mainstream society”
(Duffy 1995, p241). Nolan and Whelan (1996) were among the first to emphasise the importance
of identifying different dimensions of disadvantage, and the relationship between them, in order to
more thoroughly understand social exclusion. Building on this, Burchardt, Le Grand and Piachaud
(1999) identified four dimensions of exclusion: the inability to purchase goods and services, the
inability to participate in economically or socially valuable activities, lack of involvement in local or
national decision making, and lack of integration with friends, family and community.
The Social Exclusion Unit, was set up in 1997 to enhance understanding of the key characteristics
of social exclusion and to cover the impact of government policy, and was one of the first official
bodies to attempt to define social exclusion. It included a number of domains in their definition of
exclusion as being “...what can happen when people or areas suffer from a combination of linked
problems such as unemployment, poor skills, low incomes, poor housing, high crime
environments, bad health and family breakdown” (SEU 2001, p10). However, this latter definition
suggests passivity on the part of those who are socially excluded, and does not fully acknowledge
that social exclusion is, at least partly, a reflection of the exclusionary practices of the socially
included. A more satisfactory definition may therefore lie in the definition proposed by Burchardt
and colleagues (2002a), who describe social exclusion as a process or state by which socially

Chapter 1: What does social exclusion mean for older people?
6
excluded people become detached from their communities and wider society through the practices
of the socially included, as the socially included attempt to gain a more privileged position - this
detachment includes a break between the common values of the socially included and excluded.
As well as being a more multi-faceted concept than poverty, social exclusion has evolved to be
understood as a dynamic process, with exclusion happening over time as well as on different
dimensions. This is particularly important when considering the most applicable study design, with
longitudinal studies having the advantage of being able to track movements in and out of social
exclusion.
1.2 How is social exclusion measured?
Just as the definition of social exclusion has developed over several decades, so has the accepted
means of measuring social exclusion. Given the multi-dimensional nature of social exclusion, its
measurement necessarily involves analysis of a wide range of resources potentially available to
individuals, although there is no widely accepted agreement on which of the many potential
elements should be measured. Studies tend to select different measures of social exclusion, and
empirical work can investigate social exclusion in a static context at a single point in time, or in a
more dynamic longitudinal context, with analysis of changes in exclusion over a number of years
(see for example Barnes, 2005).
Burchardt and colleagues (1999) used data from the British Household Panel Survey (BHPS),
choosing five domains of social exclusion that they believed to represent an individuals‟ exclusion
from society (a low standard of living; lack of security; lack of engagement in an activity valued by
others; lack of decision-making power; lack of support from or contact with family or friends and
the wider community). The study explored the prevalence of these factors over a five year period,
made possible by the longitudinal nature of the BHPS. The study emphasised that few people
were excluded on all five domains simultaneously, and that even fewer were excluded over the
whole five year period, emphasising that social exclusion among the general population is a
relatively fluid state. Gordon et al (2000) meanwhile, focused primarily on social relations in their
study of social exclusion, and adopted a cross-sectional approach, without any analysis of how
their measurements changed over time. Barnes (2005), meanwhile, undertook a multi-country
study which enabled them to study how exclusion varied between countries. They constructed a
number of domains, such as income, non-monetary deprivation, health and social participation.
As well as selecting the dimensions of social exclusion to study, and the time period over which to
observe exclusion, empirical studies also require some means of assessing whether an individual
is excluded on the dimension in question. Barnes and colleagues‟ (2006) study of social exclusion
among older people defines social exclusion over seven dimensions and considers individuals to
be suffering from multiple exclusion if they are “excluded on three or more of these dimensions”.
The authors construct a minimum threshold for each dimension (for example, an individual is
considered to be excluded from social relationships if they have less than three good quality
relationships with family and friends, with quality assessed through a range of measure).
Constructing minimum thresholds is a popular method of measuring social exclusion throughout
the literature, and is also used by Burchardt et al (1999) among others.

Chapter 1: What does social exclusion mean for older people?
7
1.3 How does the definition and measurement of social exclusion change when
applied exclusively to older people?
In 1998, the Labour Government committed to measuring social exclusion in its paper Opportunity
for All (DSS, 1998), through a set of quantitative social indicators. This was the first official
measure of social exclusion, and different sets of dimensions were identified for three main
population groups – children and young people, people of working age, and older people. For
children and young people, dimensions of social exclusion focused on education (largely academic
test scores, but also school exclusions), health outcomes (such as low-birth weights), family
poverty and youth unemployment. For people of working age, dimensions of social exclusion were
focussed primarily on unemployment, but also included low income jobs, as well as drug use and
homelessness. The dimensions for older people centred on poverty (largely from reliance on state
pension, but also from fuel poverty), health and life expectancy, fear of crime, poor housing, lack of
independence. These dimensions also mirror more recent analyses of social exclusion among
older people (see Aldridge et al 2011).
The indicators used for studies examining social exclusion among older people seem to
acknowledge that social exclusion among older people often occurs as a result of loss of
independence – including pension wealth, public transport and housing, prompting the need for
state intervention. However, one of the main difficulties around applying the social exclusion
concept to older people in any straightforward sense concerns the centrality of labour market
participation (current and previous) as an indicator of exclusion. Retirement from work is a normal
event or process for people in later life, and not an indication of social exclusion – although
retirement may have an exclusionary impact among some older people. Furthermore, the
experience of retirement may be largely shaped by earlier experiences of labour market
participation, making the process of understanding the dynamics of social exclusion among older
people additionally complex.
Several studies have acknowledged that, whilst age is not a dimension in itself of social exclusion,
there is an important relationship between social exclusion and age. Agulnik, Burchardt and Evans
(2002) note that the risk of lower incomes in particular increases with age – due to loss of earned
income accompanying retirement. They also point out the elevated risk of social exclusion
associated with retirement, which may require the state to become involved in the individual‟s life.
The authors note that pensioners are much better off than in the past in absolute terms, but the
risk of relative poverty in retirement has worsened since 1979, largely driven by government policy
to increase pensions in line with prices rather than earnings. For Phillipson and Scharf (2004), the
main causes of social exclusion for older people are: firstly, age-related characteristics, that is,
things that are more likely to occur on later life, such as disability, low income and widowhood.
Secondly, cumulative disadvantage, that is, where cohorts become more unequal over time due to,
for instance, the impact of labour market experiences on pension outcomes. Thirdly, community
characteristics; older people are more vulnerable to things like population turnover, economic
decline and crime, in their local areas. The final component in explaining social exclusion among
older people related to the experience of age-based discrimination.
Work by Barnes et al (2006) also found an important relationship between social exclusion and
age. Increasing age was found to have a particularly strong relationship with exclusion from social

Chapter 1: What does social exclusion mean for older people?
8
relationships, service provision and material consumption, particularly with individuals aged over
80. Almost one in three persons aged over 80 were found to be excluded on basic services, and
almost one in four were found to be excluded from social relationships – in both cases these
proportions were far higher than among those aged 50-59. Barnes et al (2006) point out that age is
correlated with greater risk of social exclusion for a number of reasons. For example, as a result of
their age, older people are less likely to live with a partner, more likely to be widowed, and likely to
live alone or with fewer people than average, making them particularly vulnerable to exclusion from
social relationships, but also more vulnerable to exclusion from civic and cultural activities. For
example, Barnes et al (2006) find that people who live alone, or have children but no partner, are
the most likely to experience exclusion in two, three or more dimensions. This is particularly
important given that approximately a quarter of older people live alone, with the proportion living
alone rising with age. Older people are also more exposed to poor health which can limit their
independence as well as their ability to become less excluded. Finally, it is important to bear in
mind that older people have very different living situations to younger people – for example they
spend disproportionately more time at home (SEU, 2006) and are more reliant on their immediate
environment (Burns, Lavoie and Rose, 2011) - factors which researchers must bear in mind when
measuring social exclusion among this group.
1.4 What are the known predictors of social exclusion and predictors of social
exclusion of older people?
Predicting social exclusion can be difficult due to the bi-directional relationships between outcome
variables and predictors, as well as the inter-related nature of outcome variables themselves. For
example, poorer life satisfaction is generally regarded as an outcome of social exclusion, but can
in itself predict further social exclusion. Many empirical studies of social exclusion constitute
investigations of the relationship between outcome variables, illustrating correlations between
different dimensions of exclusion, or investigations of the proportion of individuals with different
characteristics that are excluded.
Hobcraft and Kiernan (2001) examine the interplay between a number of outcomes of social
exclusion, including a high malaise score, living in social housing, receipt of benefits, lack of
qualifications and low income, and also measure the impact of early motherhood on exclusion
status. They acknowledge that many are inter-related, and also that there is reverse causality
between many of the factors. Hobcraft (1998) also examines the inter-generational and life course
transmission of social exclusion, using the National Child Development Study (NCDS), and finds
four childhood precursors that have particularly prevalent associations with social exclusion at age
33: low educational test scores, childhood poverty, contact with the police, family disruption during
childhood and parental interest in education.
Barnes (2005) investigates the nature of social exclusion in Britain in the 1990s, and his is one of
the few studies to examine persistent, long-term exclusion (on a variety of dimensions). He uses
the BHPS to investigate the prevalence of social exclusion, and the key characteristics of adults
most at risk. Barnes discovers that it was relatively rare to have suffered from persistent, long term
exclusion on multiple factors, but that the individuals most at risk were lone parents (whose

Chapter 1: What does social exclusion mean for older people?
9
children were living at home) and, similar to the findings of Hobcraft (1998) described above,
particularly those with no educational qualifications. He concludes that these types of individuals
are unable to accumulate resources due to there being only one worker in the household. In an
earlier study (Barnes et al, 2002) found that these types of individuals are also less likely to receive
help through family networks, putting them more at risk.
Most research into social exclusion has focussed on exclusion by people of working age, or by
families with children. However, a small number of studies have focused purely on social exclusion
among older people. This line of enquiry is somewhat in its infancy and consequently there is little
research which looks at the link between childhood factors and social exclusion in later life – this is
also the case with a number of studies which look at social exclusion among adults. Barnes et al
(2006) focus on social exclusion among older people using the English Longitudinal Study of
Ageing (ELSA). Whilst the authors begin by examining correlations between characteristics of
older people and social exclusion (on seven dimensions), finding that many are inter-related, they
advance this study using logistic regression to investigate the relationship between (current)
characteristics of older people and their likeliness to be excluded. They find a variety of
characteristics associated with exclusion among older people including advanced old age, single
person households, poor mental and/or physical health (including depression), lack of access to
private transport, living in rented accommodation, living on a low income, reliance on benefits
(including state pensions) as the main source of income and, in a few cases, lacking access to a
telephone. Whilst their analysis does not seek to prove a causal relationship between these
characteristics and social exclusion, their analysis is useful in that it illustrates the importance of
controlling for multiple characteristics in regression analysis of social exclusion.
Barnes et al (2006) also show that well-known risk factors for social exclusion among the general
population, especially gender, ethnicity and location are not found to be risk-factors – for example,
whilst elderly women are certainly more at risk of social exclusion than elderly men, this is largely
because they are much more likely to be aged 80 or older and to live alone without private
transport, and not a gender effect per se. Similarly, elderly people from ethnic minorities are often
socially excluded but this is largely driven by their increased propensity to live in rented
accommodation.
Both a lack of access to transport, and poor accommodation are found to be key drivers of social
exclusion among elderly people. Work by the Social Exclusion Unit (SEU, 2006) showed that older
people spend between 70-90% of their time in their home, meaning that poor accommodation can
have a disproportionately large impact on them. Elderly people were found to be the most likely to
live in accommodation that was non-decent (English Housing Conditions study, 2001), whilst for
many, the accommodation was unsuitable for their needs – such as houses on two levels
inhabited by people who were unable to use the stairs because of mobility problems. In addition,
elderly people were found to suffer from a lack of information about housing services particularly
information on how to get help with maintaining their homes, and information about types of
accommodation available to them if they wish to move. Many were also found to be ill-informed
about home safety, particularly the maintenance of safety devices such as fire alarms – indeed fire
statistics in the UK show that people aged over 60 are at greater risk of death from a fire in the
home than any other age group (SEU, 2006).

Chapter 1: What does social exclusion mean for older people?
10
The Social Exclusion Unit study also revealed that older people suffer disproportionately from
transport issues, again increasing their risk of social exclusion (SEU, 2006). The study found that
car ownership decreases with age, and that older women in particular are less likely to have
access to a car. Forty-two per cent of women aged 75 to 84 and 25 per cent aged 85 and over had
access to a car in the household, compared to 66 per cent and 45 per cent of men in these two
age groups. Older people, and older women in particular, are more reliant on public transport than
those from different age groups. There is a strong link between transport and social exclusion,
raising the risk of exclusion from basic services and social relationships. Affordability and access
to public transport were found to be key issues for older people, whilst a lack of mobility prevented
many from accessing transport. This is particularly true for older people in rural areas. Similarly,
Barnes et al (2006) found that older people with no access to a car or van are more likely to be
excluded than old people as a whole, particularly as location becomes more rural.
Transport and housing issues are often intertwined, as research by Hoff, 2008, illustrated. This
multi-country study found inadequate housing and lack of access to public transport to be key
predictors of social exclusion. But the study also notes that there is something of an urban-rural
divide. Whilst access to transport is invariably better in urban areas, elderly inhabitants of major
cities find it difficult to afford decent housing. Those living in rural areas were less likely to suffer
from inadequate housing and more likely to own their own homes – but experienced difficulties
accessing care services due to inaccessibility and a lack of public transport. Burns, Lavoie and
Rose (2011) also looked at neighbourhood issues, and found that find that gentrification of
neighbourhoods can play a role in social exclusion among old people, due to loss of spaces
dedicated to older people – though there were other positive changes as a result of gentrification.
Barnes et al (2006) found among old people, renters and part renters had the highest proportion of
individuals excluded on all dimensions.
1.5 How did the previous government respond to social exclusion?
The concept of social exclusion was a key aspect of the Labour government‟s agenda. They
established the Social Exclusion Unit (SEU) upon taking office in 1997 which was rebranded in
2006 as the Social Exclusion Task Force (SETF), under the UK‟s first ever Cabinet minister for
social exclusion, former Chief Whip Hilary Armstrong1. New Labour‟s interest in social exclusion
represented a departure, to some extent, from a more traditional centre-left agenda through
valorising participation or inclusion in mainstream society. This does not mean that the role of
material deprivation in creating non-participation or exclusion was not recognised, but so too were
non-material causes such as discrimination, culture and illness. Some critics have suggested that
the social exclusion agenda was part of New Labour‟s attempt to identify individual behaviour,
rather than structural factors, as the root cause of poverty; for these critics, it is not non-
participation in mainstream society that causes poverty, but rather the terms upon which
disadvantaged individuals and families are compelled to participate (see Annesley, 2000; Levitas,
2005).
1 However, Armstrong‟s post was abolished when Gordon Brown became Prime Minister in June 2007 – although the SETF continued to operate.

Chapter 1: What does social exclusion mean for older people?
11
Such criticisms notwithstanding, it is possible that the social exclusion agenda has greater
relevance for older people, for whom non-participation is clearly a significant problem, due to age-
based factors rather than, or in addition to, material factors. Yet it is fair to say that social exclusion
policy was not initially concerned with older people. Interest grew in the early-2000s, culminating in
Chris Phillipson and Thomas Scharf‟s 2004 review of the impact of government policy on social
exclusion among older people for the Social Exclusion Unit.
Phillipson and Scharf (2004) reviewed a wide range of policy initiatives that could be said to be
tackling social exclusion among older people, including social security payments, fuel poverty and
energy efficiency measures, the universal banking agenda, community care policies and health
action zones, the New Deal for Communities and Home Improvement Agencies, and policies
designed to reduce crime such as the Locks for Pensioners initiative. They conclude that
government policy had been successful in addressing age-related characteristics (by, for instance,
reducing pensioner poverty and tackling chronic health problems and community care needs), but
unsuccessful in addressing cumulative disadvantage (through failing to appreciate the multiple
causes of hardship among older single women and ethnic minority groups, and the barriers to
take-up of means-tested benefits). There was also only limited success in addressing community
characteristics, because older people‟s needs were not systematically taken into account in urban
regeneration projects. According to Phillipson and Scharf, further development of policy was
required in three areas: firstly, a consideration of new forms and causes of social exclusion - for
instance, the experience of „late old age‟ among the early retirees of the 1970s and 1980s, and the
particular difficulties experienced by divorced, widowed or single women. Secondly, they identified
a need to broaden community care from „survival needs‟ to integration into mainstream activities.
And thirdly, there was a need to further understand the differences within groups identified as most
socially excluded, such as older disabled people and ethnic minority groups; people with different
forms of disability, for instance, will have different experiences of participation and non-
participation in mainstream society.
The Labour government‟s 2005 ageing strategy, Opportunity for All, contained some initiatives
relevant to social exclusion, as part of the UK‟s response to population ageing. However, the main
focus of the strategy was employment issues among people in their 50s and early-60s, with the
intent of preventing early retirement – this has now pushed to the policy forefront of both the
previous and current governments. A fuller social exclusion agenda was outlined in the 2006 SEU
report A Sure Start for Later Life. The report was in fact based on a major study of the social
exclusion of older people using the English Longitudinal Study of Ageing (ELSA) conducted by the
National Centre for Social Research and the University of Sheffield, that recommended a stronger
multi-agency focus on the 7 per cent of people aged 50 or over experiencing the most substantial
and complex forms of social exclusion (see Barnes et al, 2006). The approach outlined by the SEU
built upon the apparent success of SureStart (in relation to early years) in providing a single,
accessible gateway to a wide array of services. As such, the report announced the piloting of Link-
Age Plus, which aimed to bring together local authorities with health services, and organisations in
the voluntary and community sector, to find innovative ways to break down traditional
organisational and financial barriers to integrated service delivery. There were multiple access
points for information for service recipients, based on the principle of „no wrong door‟, and joined-
up outreach services.

Chapter 1: What does social exclusion mean for older people?
12
A range of other measures were outlined in the 2006 report, such as initiatives to improve take-up
of pensioner benefits and other services, and improve processes of joint commissioning and
delivery between different service providers (such as health and social care, and national and local
authorities). There was also a particular focus on housing standards, reflected also in the national
strategy for housing in an ageing society, published by CLG (2008) in the report Lifetime Homes,
Lifetime Neighbourhoods, which stated that „good design works well for people of all ages, but for
those with mobility problems or with sensory or cognitive impairments it can make the difference
between independent living and social exclusion‟. The 2009 ageing strategy „refresh‟, Building a
Society for Old Ages (HM Government 2009), contained few references to social exclusion,
although it is worth noting that it brought digital inclusion for older people firmly into the ageing
strategy agenda.
1.6 How has the current government responded to social exclusion?
It remains unclear whether the coalition government intends to continue its predecessor‟s efforts to
address social exclusion, for older people or more generally. The Social Exclusion Task Force was
abolished after the coalition took office, or more precisely, its staff was absorbed into a new Office
for Civil Society (OCS). The OCS‟ main aim is the promotion of the Conservative Party‟s „big
society‟ agenda (Cabinet Office, 2010b). What the big society means for older people has yet to be
established (Kneale, 2011a) – therefore what it means for the social exclusion of older people is
far from certain. In some ways, the association of social exclusion with the big society is a good fit,
given the big society agenda‟s focus on empowering individuals and communities to do more for
themselves (Cabinet Office, 2010a). However, the premise of the social exclusion concept is that
some people are excluded from participation in mainstream society, in contrast to the big society
concept which emphasises the relationship between society and the state, without necessarily
acknowledging that some people may not be fully included in society. Recent policies have largely
been silent on the matter of the „big society‟. Furthermore, while the Labour government‟s
approach was criticised for focusing on non-material sources of exclusion at the expense of
material deprivation, there seems to be little attempt in the big society agenda to tackle material
deprivation. When the OCS remit was announced, the Cabinet Office (2010b) noted that „[l]ead
responsibility for issues of multiple disadvantage now sits within the Department for Work and
Pensions‟ (DWP). This may suggest a return to focusing on material deprivation rather than the
broader social exclusion agenda, given DWP‟s responsibility for social security, including
pensioner benefits. The decision to increase the basic state pension to the level of the minimum
income guarantee for pensioners is suggestive of this approach.
There is as yet little sign of a renewed strategy for tackling „multiple disadvantage‟ among older
people. However, findings from the Older Age review conducted by the Centre for Social Justice
(CSJ) – set up by current DWP Secretary of State Iain Duncan Smith while in opposition – may
provide a useful insight into the government‟s thinking. The review‟s first report The Forgotten Age:
Understanding Poverty and Social Exclusion in Later Life was published in 2010. The report
certainly focuses on both material and non-material sources of the problems faced by many older
people, and could therefore be said to encompass a focus on „multiple disadvantage‟. It
emphasises issues around money, health, housing, care and communities, and calls for a

Chapter 1: What does social exclusion mean for older people?
13
celebration of later life within society, more personalisation and information, and greater co-
ordination between public services. However, whereas New Labour‟s approach included poverty
within its definition of social exclusion, CSJ actually seems to contrast poverty with social
exclusion, defining the latter more narrowly in relation to isolation and loneliness among older
people.
The review‟s second and final report Age of Opportunity: Transforming the Lives of Older People in
Poverty (CSJ, 2011) abandons the terminology of social exclusion altogether. It identifies the need
to build „dynamic communities‟ in order to tackle social isolation among older people in poverty,
alongside other priorities such as benefit reform and money planning advice, suitable housing,
reorienting the care system towards prevention. As such, while CSJ certainly recognises material
deprivation, the Older Age review suggests that tackling social exclusion is germane as a public
policy objective for the coalition government and that it is most relevant in relation to community
development, along the lines of the big society agenda. Poverty matters in its own right, not simply
as a marker of social isolation; however, overcoming social isolation can be part of the solution for
preventing or alleviating poverty.
However, two new publications published in 2012 alter the state of play. The first was a report by
DWP that introduced the concept of „social justice‟ where social justice is defined as being “about
making society function better – providing the support and tools to help turn lives around” (DWP
2012a, p4). Specifically, it revolves around the principles of: (i) early prevention; (ii) on
interventions that promote recovery or independence where problems do arise; (iii) on promoting
work but offering unconditional support to those unable to work; (iv) local design and delivery of
solutions; and (iv) providing a fair deal for tax payers. However, the report makes no mention of
older people, and in both content and tone, expands on some of the themes of a withdrawal of the
state and increasing personal responsibility, observed in other tranches of policy. The second
publication is the DWP‟s „National Social Report‟ (2012b), which does explicitly reintroduce the
terminology of social exclusion, and discusses policy measures aimed at reducing poverty and
improving healthcare and long-term care. However, the report was launched part of the EU‟s
„Open Method of Coordination‟ initiative, which supports a move towards the sharing of good
practice and learning across EU member states; the usage of „social exclusion‟ appears to
acknowledge the concept at the EU level, although all other publications and policies aimed at
audiences working at the national (UK) level appear to favour alternative terminology and
concepts.
Therefore the indications are that social exclusion, as a term and possibly as a concept, is not
favoured by the current coalition government, who favour „social isolation‟ or „social justice‟ as a
means of recognising that deprivation encompasses more than poverty alone. The theoretical
underpinnings for „social isolation‟ and „social justice‟, and the extent to which they differ from the
theoretical underpinnings of „social exclusion‟ reviewed earlier, are unclear. Therefore it is
uncertain to what extent „social isolation‟ and „social justice‟ are passive or voluntary processes, or
to what extent they are contingent on the actions of those in a more advantaged social position.
Despite this shift in perspective between governments, it is worth noting that social exclusion
remains pervasive at the European level since the change in government, with 2010 signalling the
„European Year for Combating Poverty and Social Exclusion‟. In addition, „social exclusion‟

Chapter 1: What does social exclusion mean for older people?
14
remains common parlance in United Nations publications and commissions examining deprivation
among groups including older people, indicating that it will remain pervasive in social policy, albeit
on the world stage.
1.7 Summary and research questions
This review highlights that the concept of social exclusion, the recognition that material exclusion is
both caused by and causes exclusion from other domains essential for wellbeing, builds on a
longstanding tradition within public policy and social science research. However, the terminology
„social exclusion‟ is perhaps most synonymous with the former Labour government, with the new
coalition government having disbanded the Social Exclusion Unit Taskforce. In its place there
exists a gulf in terminology to replace the usage of „social exclusion‟ in policy-terms, although the
concept itself continues to play some part in policy making, while the term itself is still widely used
within academic research. However, while research into social exclusion may have continued,
there remain gaps in the evidence. Specifically, in comparison to children, young people, and
families, social exclusion among older people has received little attention. This is despite the fact
that it is perhaps among this group that the notion of social exclusion is most pertinent, with older
people at high risk of social isolation and loneliness, as well as exhibiting substantial inequalities in
income and housing. In addition, within the extant evidence base, there has been comparatively
little longitudinal research into social exclusion patterns among older people. There are also other
societal changes and evidence gaps that necessitate further exploration of social exclusion among
older people, including the growing reliance on digital technology, changing marital and family
building patterns, and the recession. These are themes that we explore in this report through
addressing the following broad research questions:
- How can social exclusion be measured among older people?
- How have levels of exclusion changed between 2002 and 2008?
- Which factors are associated with an increased risk of being socially excluded and which are
associated with a decreased risk of being socially excluded?
- How did individuals‟ experience of social exclusion change between 2002 and 2008?
- Are older people „recession proof‟ in terms of social exclusion?
- What is the impact of being socially excluded on other factors, including health?
These questions generally form the basis of individual chapters and we begin through exploring
the measurement of social exclusion using data from the English Longitudinal Study of Ageing
(ELSA) as well as the methods used and the challenges that we face.

Chapter 2: Data and Methodology: How can social exclusion be measured among older people?
15
Chapter 2: Data and Methodology: How can social exclusion be
measured among older people?
KEY MESSAGES
How is social exclusion measured in this report?
Following on from the theoretical basis that social exclusion reflects more than
simply material disadvantage alone, this report develops a framework
conceived by Barnes et al (2006) that measures social exclusion across
seven domains.
The domains of social exclusion included in this report reflect: (i) exclusion
from social relationships, (ii) exclusion from cultural activities, (iii) exclusion
from civic activities and access to information, (iv) exclusion from local
amenities, (v) exclusion from decent housing and public transport, (vi)
exclusion from financial products, and (vii) exclusion from common consumer
goods.
How did the level of social exclusion change between 2002 and 2008?
There was little change between 2002 and 2008 in the level of exclusion
across some domains of social exclusion, with only small increases observed
in the prevalence of exclusion from cultural activities and only small decreases
observed in the prevalence of exclusion from civic activities and access to
information, exclusion from social relationships, and exclusion from financial
products. The level of exclusion across these domains remained at around ten
per cent being excluded at both 2002 and 2008.
There were large increases in the proportion excluded from local amenities
and decent housing and public transport, with increases of over 5 per cent
observed in the proportion of over 50s excluded in 2008 compared with 2002.
A large decrease of 6.5 per cent was observed in the proportion excluded
from common consumer goods among the over 50s in 2008 compared to
2002.
While there was little change in the level of exclusion from civic activities and
access to information among the 50+ population as a whole between 2002
and 2008, this masked age differences, with older people at greater risk of
exclusion in 2008, and younger age groups (50-59) at reduced risk. Similarly,

Chapter 2: Data and Methodology: How can social exclusion be measured among older people?
16
while there was only a small decrease in the risk of exclusion from financial
products among the 50+ population, this masked that the levels of exclusion
had fallen over time for the oldest age groups in particular.
Increases in exclusion from local amenities and decent housing and public
transport were mainly attributable to increases among younger age groups
(50-59 years). Decreases in exclusion from common consumer goods were
observed across all age groups, although were particularly prominent for older
age groups.

Chapter 2: Data and Methodology: How can social exclusion be measured among older people?
17
2. Data and Methodology: How can social exclusion be measured
among older people?
2.1 How can social exclusion be measured among older people? Introduction
In the previous chapter, we established that social exclusion was a concept encompassing more
than simply poverty, and reflecting people‟s participation in the social, civic, political and
recreational life of their communities and society; for socially excluded people, low levels of
participation could reflect the exclusionary practices or barriers put in place by the socially
included. For older people, social exclusion was much more focussed on the loss of independence
than it was for working age people or children.
Across all age groups, social exclusion was generally measured across different domains and
levels, and people who were socially excluded were generally those who fell beneath a certain
threshold of exclusion. However, while there was some consensus in the method of measuring
exclusion through domains using thresholds, there was less agreement across studies in terms of
which actual domains or thresholds to include when measuring social exclusion. In this report, our
theoretical model for measuring social exclusion is heavily influenced by earlier work from Barnes
and colleagues (2006), who developed a framework for analysing social exclusion among older
people in ELSA, the English Longitudinal Study of Ageing. In this report, we also use data from
ELSA to examine changes in levels of social exclusion among older people. While a direct
replication of Barnes and colleagues‟ model of exclusion would have been desirable, changes in
the study over time have necessitated some changes, which we describe in this chapter, as well
as presenting some descriptive information of our indicators.
2.2 Measuring social among older people using data from ELSA
The English Longitudinal Study of Ageing (ELSA) is a longitudinal study focussed on older people
aged 50 and above. The study originally recruited around 12,000 respondents who were originally
members of the Health Survey for England (HSE), with the first full wave of data collection under
the auspices of ELSA occurring in 2002. Since the original recruitment of study members in 2002,
two additional waves of study members have been recruited to replenish study numbers (see
Hussey et al 2010 for further information). ELSA collects a range of health information, but also
includes a number of other topics including household and individual demographics, income and
wealth, social participation, work and economic activity, housing, cognitive functioning,
expectations, relationships, and access to services and amenities – many of these are used in this
current study to measure social exclusion. Since the original 2002 sweep of data collection, further
sweeps were collected in 2004, 2006, 2008 and 2010 facilitating longitudinal research, with data
up to 2008 available for use at the time of writing. The study continues to evolve and expand in
terms of topic areas, with the 2008 sweep collecting information on sleep quality for the first time.
However, the study does hold some drawbacks. As is the case for most longitudinal studies,
attrition (respondents dropping out of the survey for various reasons) is a challenge in using the
data; item non-response is also an analytical challenge, although one that is easier to overcome

Chapter 2: Data and Methodology: How can social exclusion be measured among older people?
18
under certain conditions. The study also only has a focus on older people in England, and there
are currently no Scottish, Welsh or Northern Irish equivalent data. However, these limitations do
not detract from the usefulness of ELSA in studying social exclusion among older people, and
make ELSA data an obvious candidate for these analyses.
2.3 Defining the domains of social exclusion among older people
In Chapter 1, we presented the notion of social exclusion being the process by which people
become detached from common values and practices through the exclusionary practices of the
socially included. This emphasis on values and practices means that social exclusion
encompasses a broader scope than simply material disadvantage, although material disadvantage
is an important component of social exclusion. In this research, we build on earlier work by Barnes
et al (2006), which conceptualised social exclusion across seven domains2, reflecting both material
and non-material domains, and used cross-sectional data from the ELSA study from 2002. The
current research builds on this earlier work through utilising data from two different sweeps (2002
and 2008), which allows us to understand change over time between two similar samples, as well
as to understand patterns of change as experienced by individuals. However, as we use two
different sweeps of information, it was necessary to change the items used in developing some of
the domains of social exclusion.
We conceptualise older people who are socially excluded as being excluded from: (i) financial
products; (ii) common consumer goods; (iii) local amenities; (iv) social relationships; (v) cultural
activities; (vi) decent housing and public transport; and (vii) civic activities and access to
information. Each domain of social exclusion is composed of a number of different indicators
(described below), and a score for each component is summated. An arbitrary threshold is then
imposed on the score that roughly approximates to ten per cent of respondents being classed as
socially excluded in 2002. We then use the same absolute values based on the 2002 distributions
to define social exclusion both in 2002 and 2008, which allows us to infer whether or not levels of
social exclusion increased or decreased across the study period.
2 We use the word domain to indicate an individual component or type of social exclusion, such as exclusion from financial products.

Chapter 2: Data and Methodology: How can social exclusion be measured among older people?
19
Figure 1:The seven domains of social exclusion for older people
The seven domains included allow us to examine the relationships between older people in ELSA
and their participation in the social, economic, cultural, community and civic aspects of society.
The choice of domains also allow us to infer to what extent the respondents remain independent, a
crucial element in the measurement of social exclusion among older people as discussed in the
previous chapter; for example, the domain of exclusion from financial products allows us to infer
the extent to which older people can manage their own money which can be particularly important
for weathering financial shocks; further details for individual domains are given below. If we also
return to the causes of social exclusion among older people proposed by Phillipson and Scharf
(2004), we find that the domains themselves, and measurements that compose each domain,
include age-related experiences such as widowhood or the consequences of a low income; they
also reflect where cohorts may become more unequal over time, for example in the way that some
cohorts were more prepared for retirement with private pension compared to others; finally, the
domains also allow us to assess the relationship between older people and their communities
through examining their civic behaviours, their access to local amenities, as well as their access to
decent housing and public transport.
As a note of caution, it is important to remember what an empirical analysis of social exclusion, as
is presented in this report, actually represents. Due to the breadth of measurements used to create
each domain of exclusion, and the arbitrary thresholds used to define who is and who isn‟t
excluded, the empirical analyses included in this report should not be taken as an in-depth study
depicting the nuances of exclusion for any one domain, or its component measurements. What
Exclusion from
Civic Activities
and Access to
Information
Exclusion from
decent housing
and public
transport
Social
Exclusion Exclusion from
Social
Relationships
Exclusion from
Local
Amenities
Exclusion from
Common
Consumer
Goods
Exclusion from
Cultural
Activities
Exclusion from
Financial
Products
Chapter 2: Data and Methodology: How can social exclusion be measured among older people?
20
such a broad-based approach represents instead is a set of shorthand indicators of social
exclusion; this report uses these shorthand measurements to demonstrate who is at risk of
exclusion, how exclusion changes over time and among individuals, and the outcomes of social
exclusion.
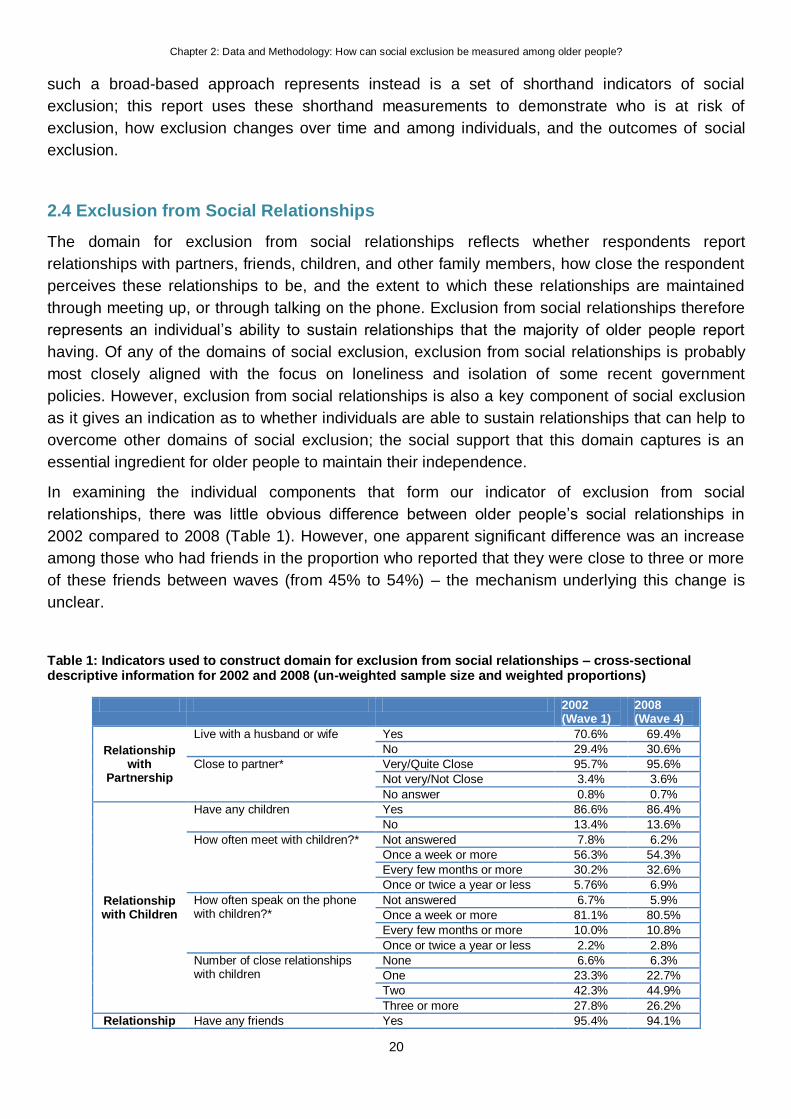
2.4 Exclusion from Social Relationships
The domain for exclusion from social relationships reflects whether respondents report
relationships with partners, friends, children, and other family members, how close the respondent
perceives these relationships to be, and the extent to which these relationships are maintained
through meeting up, or through talking on the phone. Exclusion from social relationships therefore
represents an individual‟s ability to sustain relationships that the majority of older people report
having. Of any of the domains of social exclusion, exclusion from social relationships is probably
most closely aligned with the focus on loneliness and isolation of some recent government
policies. However, exclusion from social relationships is also a key component of social exclusion
as it gives an indication as to whether individuals are able to sustain relationships that can help to
overcome other domains of social exclusion; the social support that this domain captures is an
essential ingredient for older people to maintain their independence.
In examining the individual components that form our indicator of exclusion from social
relationships, there was little obvious difference between older people‟s social relationships in
2002 compared to 2008 (Table 1). However, one apparent significant difference was an increase
among those who had friends in the proportion who reported that they were close to three or more
of these friends between waves (from 45% to 54%) – the mechanism underlying this change is
unclear.
Table 1: Indicators used to construct domain for exclusion from social relationships – cross-sectional descriptive information for 2002 and 2008 (un-weighted sample size and weighted proportions)
2002 (Wave 1)
2008 (Wave 4)
Relationship with
Partnership
Live with a husband or wife Yes 70.6% 69.4%
No 29.4% 30.6%
Close to partner* Very/Quite Close 95.7% 95.6%
Not very/Not Close 3.4% 3.6%
No answer 0.8% 0.7%
Relationship with Children
Have any children Yes 86.6% 86.4%
No 13.4% 13.6%
How often meet with children?* Not answered 7.8% 6.2%
Once a week or more 56.3% 54.3%
Every few months or more 30.2% 32.6%
Once or twice a year or less 5.76% 6.9%
How often speak on the phone with children?*
Not answered 6.7% 5.9%
Once a week or more 81.1% 80.5%
Every few months or more 10.0% 10.8%
Once or twice a year or less 2.2% 2.8%
Number of close relationships with children
None 6.6% 6.3%
One 23.3% 22.7%
Two 42.3% 44.9%
Three or more 27.8% 26.2%
Relationship Have any friends Yes 95.4% 94.1%

Chapter 2: Data and Methodology: How can social exclusion be measured among older people?
21
with Friends No 4.6% 5.9%
How often meet with friends?* Not answered 2.0% 1.0%
Once a week or more 58.4% 55.6%
Every few months or more 34.2% 37.9%
Once or twice a year or less 5.4% 5.6%
How often speak on the phone with friends?*
Not answered 2.8% 1.1%
Once a week or more 57.1% 57.4%
Every few months or more 33.9% 35.8%
Once or twice a year or less 6.2% 5.7%
Number of close relationships with friends
None 22.2% 10.3%
One 11.3% 11.9%
Two 21.2% 23.3%
Three or more 45.3% 54.4%
Relationship with Other Immediate
Family
Have any other immediate family
Yes 91.7% 92.5%
No 8.3% 7.5%
How often meet with other immediate family?*
Not answered 2.9% 1.9%
Once a week or more 34.9% 33.0%
Every few months or more 38.5% 40.0%
Once or twice a year or less 23.7% 25.0%
How often speak on the phone with other immediate family?*
Not answered 2.3% 1.5%
Once a week or more 51.9% 52.4%
Every few months or more 35.3% 34.6%
Once or twice a year or less 10.6% 11.5%
Number of close relationships with other immediate family
None 21.5% 18.7%
One 23.4% 23.4%
Two 21.2% 22.1%
Three or more 33.9% 35.8%
Sample Size 8,998 7,550
Notes: Cross-sectional data, weighted by self-completion weights; *sample size varies from below dependent on number who report presence of relationships
The definition of exclusion from social relationships is based on the methodology developed by
Barnes and colleagues (2006). For relationships with friends, immediate family members, and
children, respondents are given points to develop a score based on the frequency of meeting,
speaking on the phone, and the number of close relationships (see table 1 for a breakdown of
scoring, and table 2 for an annotated outline). In addition, respondents who have quite a close
relationship or a very close relationship with partners are allocated an additional 1.5 points. Those
respondents who report the presence of a relationship, but not the nature of the relationships are
awarded no points3.
Table 2:Scoring system for creating domain for exclusion from social relationships
Occurrence Meeting up
(points)
Speaking on the
phone (points)
Number of close
relationships
Number of close
relationships
(points)
3 times a week or more 1.0 0.5 Three or more 1.5
1-2 times a week 0.8 0.4 Two 1.0
1-2 times a month 0.6 0.3 One 0.5
Every few months 0.4 0.2 None 0
1-2 times a year 0.2 0.1
Less than once a year 0 0
3 To preserve the sample size, we do not treat these respondents as missing. However, if respondents fail to give information on the quality of all
their reported relationships, then they are treated as missing.

Chapter 2: Data and Methodology: How can social exclusion be measured among older people?
22
When we plot the scores for social exclusion by year (see histogram in Figure 2), we can already
observe that the scores for 2008 are skewed slightly to the right of those for 2002, indicating higher
scores for the quality of social relationships at this later point. The red line denotes where the
definition of „socially excluded‟ is drawn, at 3.5, equating to 10.6 per cent of the respondents being
excluded in 2002, compared to 8.9 per cent in 2008.
Figure 2: Exclusion from Social Relationships score and cut off point (2002 and 2008 samples).
In figure 3, we plot the proportion excluded by age group for the 2002 and 2008 sweeps. Here we
show that although there was a slight decline in the proportion excluded from social relationships
in 2008, this decline occurred unequally across age groups, being most noticeable among those
aged 70-84 years, where between 3-6 per cent fewer older people were excluded. Nevertheless,
for both periods, older age increased the risk of social exclusion; in 2002 the point at which this
risk increased occurred among the 70-74 year age group although by 2008 this point had occurred
later among the 75-79 year age group. Among the 2008 sample therefore, the levels of exclusion
from social relationships were lower and appeared to occur later in life than in 2002.
0%
2%
4%
6%
8%
10%
12%
0
0.1
-0.5
0.6
-1.0
1.1
-1.5
1.6
-2.0
2.1
-2.5
2.6
-3.0
3.1
-3.5
3.6
-4.0
4.1
-4.5
4.6
-5.0
5.1
-5.5
5.6
-6.0
6.1
-6.5
6.6
-7.0
7.1
-7.5
7.6
-8.0
8.1
-8.5
8.6
-9.0
9.1
-9.5
9.6
-10.0
10.1
-10.5
Pro
po
rtio
n o
f C
oh
ort
Score for Exclusion from Social Relationships (higher value = least excluded)
Wave 1 (2002)
Wave 4 (2008)

Chapter 2: Data and Methodology: How can social exclusion be measured among older people?
23
Figure 3: Proportion excluded from Social Relationships by age in 2002 and 2008.
2.5 Exclusion from Cultural Activities
Older people were defined as being excluded from cultural activities if they did not access these
activities on a relatively frequent basis, and were unsatisfied with this low level of access.
Exclusion from cultural activities represents an important dimension of social exclusion as it
represents an inability to fully access the cultural fabric of society. Exclusion from cultural activities
can occur for a multitude of reasons, for example because of an inability to afford or physically
access these activities. However, given that many activities, for example access to museums, may
be free, and others including the cinema, may be heavily discounted for older people, other
reasons such as because of poor provision in the local area, or because of exclusion from other
domains including social relationships and public transport, may be more pertinent. Similarly,
personal factors reflecting a lack of confidence or low self-esteem may be underlying reasons for
an inability to access cultural activities. Older people who are excluded from cultural activities may
be more prone to instances of poor mental health and depression, may find it more difficult to form
and maintain social relationships, and may also be more prone to isolation and loneliness.
Returning to the theoretical basis of social exclusion and older people, older people excluded from
cultural activities may be emblematic of those who are excluded due to age related factors (such
as poor health), who are excluded through cumulative disadvantage (such as being on a low
income and being unable to afford cultural activities) and who are excluded because of community
characteristics (due to a lack of appropriate and accessible cultural activities locally). Cultural
activities may represent a critical domain in helping to keep older people independent, with some
studies reporting health benefits of engagement with leisure time activities (for example
Lennartsson and Silverstein 2001, Crowe et al 2003).
0
5
10
15
20
25
30
50-54 55-59 60-64 65-69 70-74 75-79 80-84 85+ Total
Pro
po
rtio
n e
xclu
ded
fro
m s
ocia
l re
lati
on
sh
ips
Age Group
Wave 1 (2002)
Wave 4 (2008)

Chapter 2: Data and Methodology: How can social exclusion be measured among older people?
24
Table 3: Indicators used to construct domain for exclusion from cultural activities – cross-sectional descriptive information for 2002 and 2008 (un-weighted sample size and weighted proportions)
2002 (Wave 1)
2008 (Wave 4)
Going to the Cinema
Twice a month or more 1.7% 1.9%
Once a month or more 3.8% 4.9%
Every few months or more 11% 14.4%
Less than once a year, want to go more frequently 17.5% 21.7%
Less than once a year, don‟t want to go more 66% 53.1%
Less than once a year, no answer 0% 4.0%
Going to the Theatre/Opera
Twice a month or more 1.9% 1.1%
Once a month or more 3.4% 3.1%
Every few months or more 11.2% 12.2%
Less than once a year, want to go more frequently 27.5% 20.6%
Less than once a year, don‟t want to go more 56% 57.3%
Less than once a year, no answer 0.1% 5.7%
Going to a Museum/ Gallery
Twice a month or more 1.7% 1.2%
Once a month or more 4.5% 4.4%
Every few months or more 17.1% 16.4%
Less than once a year, want to go more frequently 31.7% 31.9%
Less than once a year, don‟t want to go more 45% 43.4%
Less than once a year, no answer 0% 2.8%
Going to eat out
Twice a month or more 39.1% 29.7%
Once a month or more 20.6% 23.8%
Every few months or more 18.5% 22.6%
Less than once a year, want to go more frequently 7% 11.5%
Less than once a year, don‟t want to go more 14.8% 11.2%
Less than once a year, no answer 0% 1.2%
Taken a holiday or
daytrip
Taken in the past year 14.7% 13.8%
Not taken in the past year 85.3% 86.1%
Not answered 0.1% 0.0%
Sample size 8,998 7,550
The indicators used to construct our exclusion from cultural activities domain reflect whether
respondents go to the cinema, to the theatre or opera, to museums or galleries, eat out in a
restaurant, café or elsewhere, and whether they have taken a holiday or daytrip in the UK or
abroad. As is noted by original Barnes et al (2006), some of the activities, such as visiting the
opera, are those most associated with people from higher socioeconomic groups, although others
have wider applicability. In this sense, this domain simultaneously reflects involuntary exclusion
through not having financial means to access cultural activities, involuntary exclusion through the
exclusionary practices of the socially included, as well as involuntary and voluntary exclusion for a
number of other reasons. There were few differences in the frequency that older people engaged
in these behaviours over time, with slight increases in the proportion of older people who report
infrequently going to the cinema and eating out and wanting to undertake these activities more
frequently (4% and 4.5% respectively); conversely, the proportion who went to the theatre or opera
infrequently but wanted to go more often declined by over seven per cent. Patterns of eating out
also exhibited other changes between sweeps, with the proportion that ate out twice a month or
more exhibiting a decline of over nine per cent.
In constructing a score, respondents were allocated one point to reflect whether they went to the
cinema, to a museum or gallery, to the theatre or opera, or ate out infrequently, but would like to
undertake on a more frequent basis; an additional point was added to reflect if the respondent had
not gone on a holiday or daytrip in the past year. Older people who had a score of three or more

Chapter 2: Data and Methodology: How can social exclusion be measured among older people?
25
were classified as being excluded from cultural activities, with 11.4 per cent being excluded from
cultural activities in 2002 and 12.5 per cent excluded in 20084.
Table 4: Distribution of scores for exclusion from cultural activities in 2002 and 2008 (un-weighted sample size and weighted proportions)
Wave 1 (2002)
Wave 4 (2008)
Not Excluded
0 44.5% 45.9%
1 27.4% 25.3%
2 16.7% 16.3%
Excluded
3 8.4% 8.4%
4 2.5% 3.0%
5 0.5% 1.2%
Sample Size
8,998 7,550
When we examine exclusion from cultural activities by age, a definite u-shaped pattern emerged in
2002, with those in the youngest and oldest age groups most likely to be excluded from cultural
activities. This pattern was not directly replicated in 2008 where the pattern had changed subtly so
that it was only those in the younger age groups who were at greatest risk of exclusion on this
domain.
Figure 4: Proportion excluded from Cultural Activities by age in 2002 and 2008.
4 For the small number of people who responded only to the question on the frequency of engaging with a cultural activity, but not if they wanted to
engage more, we code those with no response as not wanting to engage with the activity more frequently (less than 6% for each indicator individually in wave 4 , less than 1% in wave 1). For those with values missing for the frequency of engagement, although not for whether they
would like to engage more often (less than 3% for each indicator individually in wave 4, none in wave 1), we code these as belonging to a group who do not frequently engage in the activity. In calculating the cultural exclusion score and defining respondents who are cu lturally excluded, we include respondents who had information for three or more indicators (out of the total of five).
0
2
4
6
8
10
12
14
16
18
20
50-54 55-59 60-64 65-69 70-74 75-79 80-84 85+ Total
Pro
po
rtio
n e
xclu
ded
Age Group
Wave 1 (2002)
Wave 4 (2008)

Chapter 2: Data and Methodology: How can social exclusion be measured among older people?
26
2.6 Exclusion from Civic Activities and Access to Information
Exclusion from civic activities may be most emblematic of social exclusion in some senses, in that
exclusion on this domain signifies an inability to participate in the structures that can allow
individuals to influence choices that could improve their lives. Exclusion from civic activities has
become particularly important in the context of recent government policy that has honed in on the
principles of „the big society‟ and „localism‟. At heart, both of these philosophies symbolise a desire
to towards decentralisation and a withdrawal of the state from areas of public life in favour of
community action and personal responsibility. Elsewhere, it has been argued that among the
factors critical to the success of some of these policies is the existence of substantial levels of
community engagement as well as the accessibility of timely and relevant information to enable
people to participate in civic activities and in local decision making (Kneale 2011a). In this respect,
the outcomes of being excluded from civic activities and access to information may not only
involve decreased participation in civic structures, but this may also have a direct impact on older
people‟s ability to lobby and receive the services that they need in their local community,
particularly if these services are aimed at minority or underrepresented groups. Engagement with
civic activities, particularly volunteering, has been shown to have a positive effect of wellbeing and
mental health, which in turn are key to maintaining independence among older people (for
example Nazroo and Matthews 2012).
In our measure of exclusion from civic activities and access to information, we include the following
indicators: being a member of a political party, trade union or environmental group; a tenants
group, resident group or neighbourhood watch scheme; the church or other religious organisation;
and charitable associations; doing regular voluntary work is also included. In the Barnes et al
(2006) report, voting in the last general election was included. As there was no general election in
the year before the 2008 sweep, we do not include this indicator. However, we include an indicator
of whether the respondent contributes to committee work for any club or society, in recognition that
this work may be valuable to the local community. To discern whether older people access
information, we incorporate additional measures of internet usage. While internet usage is likely to
have grown between waves due to the expansion of new opportunities to engage with digital
media, newspaper readership in contrast may have correspondingly declined as people access
information digitally. Therefore, we hope that the inclusion of both indicators should cancel out any
systematic bias towards lower levels of exclusion from access to information over time.
Table 5: Indicators used to construct domain for exclusion from civic activities and access to information – cross-sectional descriptive information for 2002 and 2008 (un-weighted sample size and weighted proportions)
2002 (Wave 1)
2008 (Wave 4)
Member of Political Party/ Trade Union
Not reported 82.9% 83.5%
Reported 14.2% 13.4%
No answer 3.0% 3.2%
Member of Tenant’s/ Neighbourhood Watch Group
Not reported 79.9% 82.8%
Reported 17.2% 14.1%
No answer 3.0% 3.2%
Member of Church or Religious Organisation
Not reported 77.5% 78.7%
Reported 19.6% 18.1%
No answer 3.0% 3.2%
Chapter 2: Data and Methodology: How can social exclusion be measured among older people?
27
Member of Charitable Organisation
Not reported 79.8% 80.3%
Reported 17.3% 16.5%
No answer 3.0% 3.2%
Carry out committee work for any organisation
Not reported 56.8% 65.9%
Reported 32.8% 29.2%
No answer 10.5% 4.9%
Carry out voluntary work
At least once a year 25.4% 26.9%
Less than once a year 2.3% 2.0%
Never 72.3% 71.2%
No answer 0.0% 0.0%
Use the internet
Not reported 67.9% 45.2%
Reported 32.1% 54.8%
No answer 0.1% 0.0%
Read a newspaper
Not reported 27.6% 37.4%
Reported 72.4% 62.6%
No answer 0.1% 0.0%
Sample size 8,998 7,550
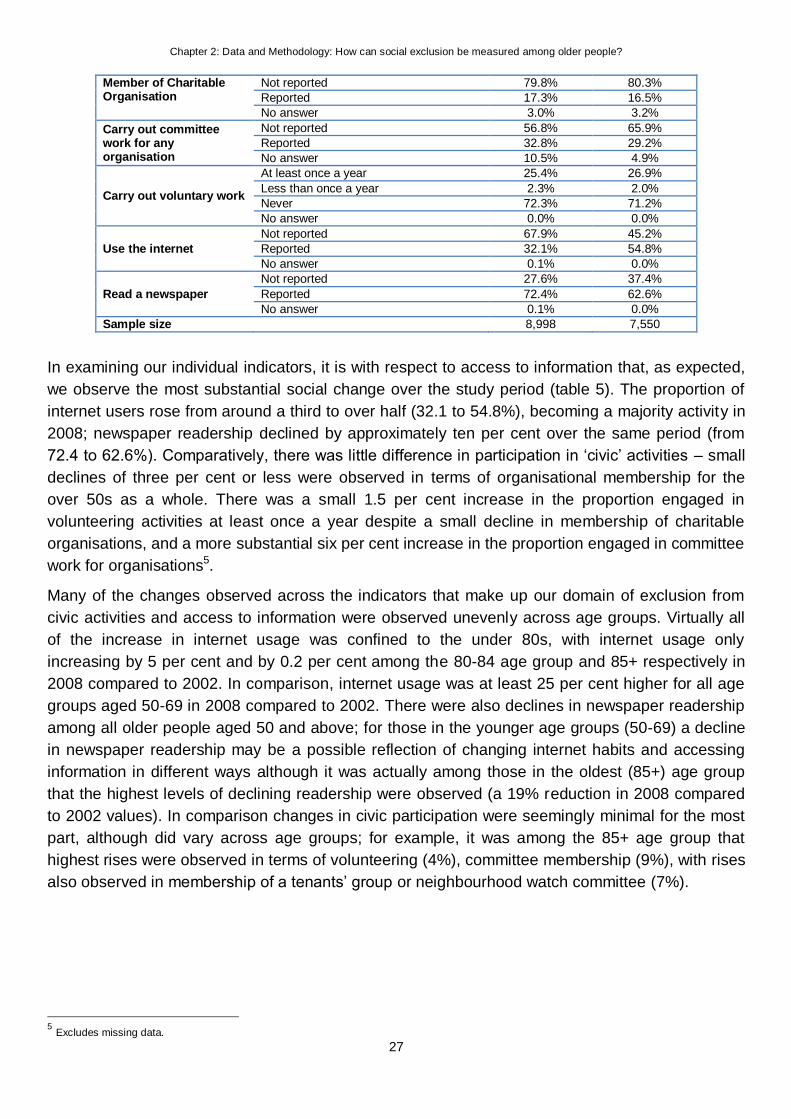
In examining our individual indicators, it is with respect to access to information that, as expected,
we observe the most substantial social change over the study period (table 5). The proportion of
internet users rose from around a third to over half (32.1 to 54.8%), becoming a majority activity in
2008; newspaper readership declined by approximately ten per cent over the same period (from
72.4 to 62.6%). Comparatively, there was little difference in participation in „civic‟ activities – small
declines of three per cent or less were observed in terms of organisational membership for the
over 50s as a whole. There was a small 1.5 per cent increase in the proportion engaged in
volunteering activities at least once a year despite a small decline in membership of charitable
organisations, and a more substantial six per cent increase in the proportion engaged in committee
work for organisations5.
Many of the changes observed across the indicators that make up our domain of exclusion from
civic activities and access to information were observed unevenly across age groups. Virtually all
of the increase in internet usage was confined to the under 80s, with internet usage only
increasing by 5 per cent and by 0.2 per cent among the 80-84 age group and 85+ respectively in
2008 compared to 2002. In comparison, internet usage was at least 25 per cent higher for all age
groups aged 50-69 in 2008 compared to 2002. There were also declines in newspaper readership
among all older people aged 50 and above; for those in the younger age groups (50-69) a decline
in newspaper readership may be a possible reflection of changing internet habits and accessing
information in different ways although it was actually among those in the oldest (85+) age group
that the highest levels of declining readership were observed (a 19% reduction in 2008 compared
to 2002 values). In comparison changes in civic participation were seemingly minimal for the most
part, although did vary across age groups; for example, it was among the 85+ age group that
highest rises were observed in terms of volunteering (4%), committee membership (9%), with rises
also observed in membership of a tenants‟ group or neighbourhood watch committee (7%).
5 Excludes missing data.

Chapter 2: Data and Methodology: How can social exclusion be measured among older people?
28
Figure 5: Exclusion from Civic Activities and Access to Information score and cut off point (2002 and 2008 samples).
In developing a score for exclusion from civic activities and access to information, older people
were give a point for each of the organisations that they reported membership of, and a point each
if they undertook committee work and voluntary work or if they used the internet or read a
newspaper regularly. Older people were excluded if they undertook none of these activities. In
2002, 9.8 per cent of older people aged over 50 were excluded from civic activities and access to
information, declining slightly to 9.2 per cent in 2008 (figure 5). A small number of older people
(approximately 30 at each sweep of the study) reported undertaking all activities. Between 2002
and 2008, age differences in exclusion on this domain became more prominent (figure 6), with
almost a fifth of those aged 85 and above excluded in 2008 (12% in 2002) compared to seven per
cent of those aged 50-54 were excluded in 2008 (9% in 2002).
Figure 6: Proportion excluded from Civic Activities and Access to Information by age in 2002 and 2008.
0%
5%
10%
15%
20%
25%
30%
35%
0 1 2 3 4 5 6 7 8
Pro
po
rtio
n e
xclu
ded
Score for Exclusion for Civic Activities (Higher score = less excluded)
Wave 2 (2002)
Wave 4 (2008)
0
5
10
15
20
25
50-54 55-59 60-64 65-69 70-74 75-79 80-84 85+ Total
Pro
po
rtio
n e
xclu
ded
Age Group
Wave 1 (2002)
Wave 4 (2008)

Chapter 2: Data and Methodology: How can social exclusion be measured among older people?
29
2.7 Exclusion from Local Amenities
Exclusion from basic amenities reflects older people‟s ability to access essential services. Older
people might be expected to be at higher risk of exclusion from local amenities than younger age
groups due to their vulnerability to age related conditions such as ill-health and disability that will
directly impact on their physical ability to access basic amenities; because of cumulative
disadvantage resulting in the lower socioeconomic means or educational capital with which to
purchase or negotiate access to basic amenities; as well as because of a higher risk of exclusion
due to older people‟s increased vulnerability to community level changes including economic
decline and changing land use patterns, that will directly impact on the amenities available to older
people. Older people who are unable to access local amenities are thought to experience a lower
quality of life as a consequence (Barnes et al 2006; Demakakos et al 2010). The inability to access
essential service may also signify an inability to participate in other social structures, and may be
related to other domains of social exclusion. Our measure of exclusion from local amenities, based
on an index of exclusion from basic services developed by Barnes et al (2006), reflects whether
older people report difficulties in accessing financial services, shopping services, and a number of
health related services using their usual mode of transport6. However, we change the terminology
from exclusion from basic services to exclusion from local amenities, believing this to be a better
reflection of the nature of the domain. An inability to access local amenities will have a transparent
impact on older people‟s independence.
Between the 2002 and 2008, there were small increases in the proportions of older people
reporting difficulties in accessing the post office (4.6% in 2002 to 8.1% in 2008), local shops (5.4%
to 7.9%), shopping centre (8.0% to 12.2%), dentist (7.7% to 12.0%), GP (5.2% to 6.8%) and
hospital (12.0% to 15.4%), using their usual form of transport7. While this domain is intended, to
large extent, to capture the quality of provision of local amenities, for some older people it may
reflect problems with public transport if this is their usual mode of transport, or health problems if
walking is their main form.
Table 6: Indicators used to construct domain for exclusion from basic amenities – cross-sectional descriptive information for 2002 and 2008 (un-weighted sample size and weighted proportions)
2002 (Wave 1)
2008 (Wave 4)
Financial Amenities
Difficulties Accessing Bank/Cash Point
No difficulty 90.6% 90.8%
Difficulties in access 6.8% 6.7%
Don‟t wish to go or not answered 2.6% 2.6%
Difficulties Accessing Post Office
No difficulty 94.7% 89.9%
Difficulties in access 4.6% 7.9%
Don‟t wish to go or not answered 0.7% 2.2%
Shopping Amenities
Difficulties Accessing Local Shop(s)
No difficulty 93.4% 85.3%
Difficulties in access 5.4% 7.3%
Don‟t wish to go or not answered 1.2% 7.4%
Difficulties Accessing Shopping Centre
No difficulty 90.5% 82.4%
Difficulties in access 7.9% 11.5%
Don‟t wish to go or not answered 1.6% 6.1%
Difficulties No difficulty 92.5% 90.9%
6 It is possible that some respondents answered on the basis of perceived difficulties and some on the basis of actual experiences of difficulties,
although it is not possible to differentiate between these. 7 Percentages are based on valid data (data excluding values that are missing or where older people have stated that they do not wish to access the
amenity).

Chapter 2: Data and Methodology: How can social exclusion be measured among older people?
30
Accessing Supermarket
Difficulties in access 6.8% 7.4%
Don‟t wish to go or not answered 0.7% 1.8%
Local Healthcare Services
Difficulties Accessing Chiropodist
No difficulty 75.9% 50.9%
Difficulties in access 8.0% 8.5%
Don‟t wish to go or not answered 16.1% 40.5%
Difficulties Accessing Dentist
No difficulty 87.5% 80.1%
Difficulties in access 7.3% 11.0%
Don‟t wish to go or not answered 5.2% 8.9%
Difficulties Accessing GP
No difficulty 93.6% 92.6%
Difficulties in access 5.1% 6.8%
Don‟t wish to go or not answered 1.3% 0.7%
Difficulties Accessing Hospital
No difficulty 86.6% 82.7%
Difficulties in access 11.8% 15.0%
Don‟t wish to go or not answered 1.6% 2.3%
Difficulties Accessing Opticians
No difficulty 91.2% 88.9%
Difficulties in access 6.4% 7.5%
Don‟t wish to go or not answered 2.4% 3.6%
Sample size 8,998 7,550
In developing a score for exclusion from local amenities, older people are allocated one point for
each local amenity they report difficulties in accessing, with any difficulties in accessing financial or
shopping amenities combined and treated as one point each. Respondents could therefore score
up to seven points indicating exclusion across all indicators (3% and 2% in 2002 and 2008
respectively)8. If respondents reported difficulties in accessing more than one local amenity, they
were categorised as excluded from local amenities, with 16.2 per cent falling above this threshold
in 2008, a substantial rise from the 10.9 per cent in 2002. Figure 8 demonstrates that most of this
rise is attributable to a rise in reports of exclusion from local amenities among those in younger
age groups; for example there was over a two-fold rise in the proportion of those aged 50-54
excluded from local amenities between 2002 and 2008. Despite this rise, those in the oldest age
groups remained at higher risk than those in younger age groups of being excluded at both points.
Figure 7: Exclusion from Local Amenities score and cut off point (2002 and 2008 samples).
8 Respondents were classified as missing data for this indicator if they were missing 5 or more values included in Table 6.
0%
10%
20%
30%
40%
50%
60%
70%
80%
90%
0 1 2 3 4 5 6 7
Pro
po
rtio
n e
xclu
ded
Score for Exclusion for Local Amenities (Higher score = more excluded)
Wave 2 (2002)
Wave 4 (2008)
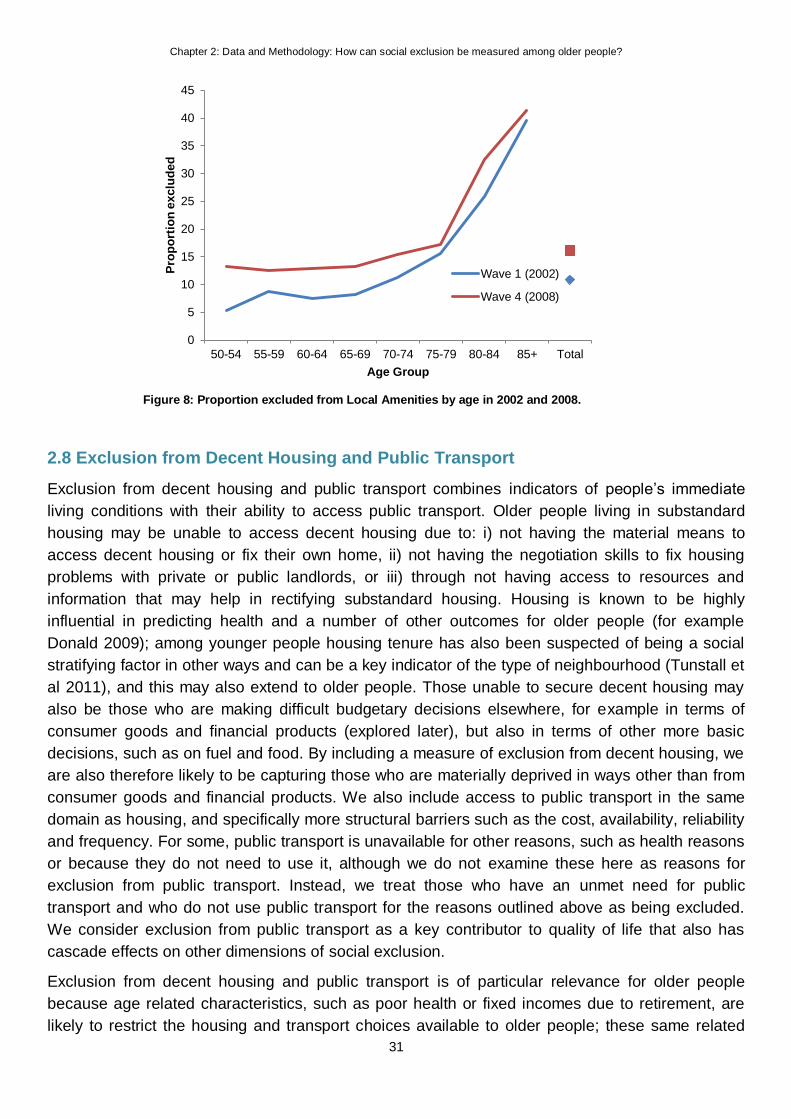
Chapter 2: Data and Methodology: How can social exclusion be measured among older people?
31
Figure 8: Proportion excluded from Local Amenities by age in 2002 and 2008.
2.8 Exclusion from Decent Housing and Public Transport
Exclusion from decent housing and public transport combines indicators of people‟s immediate
living conditions with their ability to access public transport. Older people living in substandard
housing may be unable to access decent housing due to: i) not having the material means to
access decent housing or fix their own home, ii) not having the negotiation skills to fix housing
problems with private or public landlords, or iii) through not having access to resources and
information that may help in rectifying substandard housing. Housing is known to be highly
influential in predicting health and a number of other outcomes for older people (for example
Donald 2009); among younger people housing tenure has also been suspected of being a social
stratifying factor in other ways and can be a key indicator of the type of neighbourhood (Tunstall et
al 2011), and this may also extend to older people. Those unable to secure decent housing may
also be those who are making difficult budgetary decisions elsewhere, for example in terms of
consumer goods and financial products (explored later), but also in terms of other more basic
decisions, such as on fuel and food. By including a measure of exclusion from decent housing, we
are also therefore likely to be capturing those who are materially deprived in ways other than from
consumer goods and financial products. We also include access to public transport in the same
domain as housing, and specifically more structural barriers such as the cost, availability, reliability
and frequency. For some, public transport is unavailable for other reasons, such as health reasons
or because they do not need to use it, although we do not examine these here as reasons for
exclusion from public transport. Instead, we treat those who have an unmet need for public
transport and who do not use public transport for the reasons outlined above as being excluded.
We consider exclusion from public transport as a key contributor to quality of life that also has
cascade effects on other dimensions of social exclusion.
Exclusion from decent housing and public transport is of particular relevance for older people
because age related characteristics, such as poor health or fixed incomes due to retirement, are
likely to restrict the housing and transport choices available to older people; these same related
0
5
10
15
20
25
30
35
40
45
50-54 55-59 60-64 65-69 70-74 75-79 80-84 85+ Total
Pro
po
rtio
n e
xclu
ded
Age Group
Wave 1 (2002)
Wave 4 (2008)

Chapter 2: Data and Methodology: How can social exclusion be measured among older people?
32
age characteristics are also likely to amplify the negative outcomes of exclusion on this domain
among older people. Transport is also of particular interest in examining social exclusion among
older people because pensioners are eligible for free or concessionary travel. Housing is also of
particular interest because many older people are characterised as being „asset rich‟ but „income
poor‟, with some owner occupying older householders unable to maintain their most valuable asset
to a decent standard. Housing and public transport are combined, as both reflect proximal and
distal elements of the local living environment and the ability of an older person to traverse this. In
addition, both may require a similar combination of socioeconomic means or personal negotiation
and organisational skills to prevent falling into exclusion – for example older people may require
the same type of organisational skills in researching and planning what bus routes are available to
reach a particular destination as they do in terms of researching and planning how to obtain
assistance with a particular housing problem. Returning to social exclusion among older people
being related to independence, and a reflection of whether the opportunities to maintain
independence are open to all, the ability to traverse the local environment (through public
transport) is a transparent factor in maintaining independence. Accessing decent, and safe
housing, is also likely to be a key facilitator in maintaining independence, not least in terms of
health (Donald 2009).
Looking at the individual indicators that form our domain of exclusion from decent housing and
public transport, we observe little change between 2002 and 2008 in terms of housing, with the
exception of a perceptible rise in experiences of water leaks. We find greater changes in terms of
exclusion from public transport with the proportion who reported that public transport was too
expensive, unreliable or infrequent increasing by 2-3% each. However, these rises were observed
unevenly between age groups, and the overall rises were mainly attributable to those aged 50-59
reporting problems in terms of water leaks (5% rise among those aged 50-54), exclusion from
public transport because it‟s deemed too expensive (9% rise among those aged 50-54, from 4% in
2002), and exclusion from public transport because it‟s deemed too infrequent (4% rise among
those aged 50-54, from 6% in 2002).
Table 7: Indicators used to construct domain for exclusion from decent housing and public transport – cross-
sectional descriptive information for 2002 and 2008 (un-weighted sample size and weighted proportions)
2002 (Wave 1)
2008 (Wave 4)
Problems With Public Transport
Too Expensive No problem 97.0% 93.9%
Problem reported 3.0% 6.1%
None Available No problem 93.7% 93.7%
Problem reported 6.3% 6.3%
Unreliable No problem 95.4% 93.1%
Problem reported 4.6% 6.9%
Too Infrequent No problem 95.1% 92.1%
Problem reported 4.9% 8.0%
Problems with Accessing Decent Housing
Noisy Neighbours No problem 93.0% 93.5%
Problem reported 7.0% 6.5%
Rising Damp No problem 96.6% 96.8%
Problem reported 3.4% 3.2%
Water Leaks No problem 96.2% 93.5%
Problem reported 3.8% 6.5%
Electrical Problems No problem 98.6% 98.4%
Problem reported 1.4% 1.6%

Chapter 2: Data and Methodology: How can social exclusion be measured among older people?
33
Rot and Decay No problem 98.7% 98.9%
Problem reported 1.3% 1.1%
Insects and other pests No problem 96.4% 96.3%
Problem reported 3.6% 3.7%
Cold No problem 96.1% 95.3%
Problem reported 3.9% 4.7%
Sample size 8,998 7,550
Figure 9: Exclusion from Decent Housing and Public Transport score and cut off point (2002 and 2008 samples).
In creating a score for exclusion from decent housing and public transport, respondents were
awarded a point each for any of the problems included in table 7, with those who reported two or
more problems classified as excluded9. The proportion of older people aged 50 and above
classified as excluded rose from ten per cent in 2002 to 15.6 per cent in 2008. This rise, as shown
in figure 10, can be mainly attributed to very high rises in the proportion aged 50-54 and 55-59
years characterised as being excluded on this dimension; in 2002 around 13% of those aged 50-
59 were excluded on this dimension but by 2008 23% of those aged 50-59 were excluded on this
dimension. This component of social exclusion is the only one of the seven examined in this report
that declines with age, so that those in the oldest age groups are least likely to be excluded on this
dimension.
9 Missing data was not a problem in constructing this indicator – see later note.
0%
10%
20%
30%
40%
50%
60%
70%
80%
0 1 2 3 4 5 6 7 8 9 10
Pro
po
rtio
n e
xclu
ded
Score for Exclusion for Decent Housing and Public Transport (Higher score = more excluded)
Wave 2 (2002)
Wave 4 (2008)

Chapter 2: Data and Methodology: How can social exclusion be measured among older people?
34
Figure 10: Proportion excluded from Decent Housing and Public Transport by age in 2002 and 2008.
2.9 Exclusion from Common Consumer Goods
The concept of exclusion from common consumer goods measures the ownership of goods that
are owned by the majority of the population. Exclusion from common consumer goods is mainly
included as a direct indicator of material poverty, although could also indicate other issues in terms
of accessing local amenities, accessing the internet, or accessing advice or assistance from social
relationships to help purchase these goods. Returning to early definitions of social exclusion
reviewed in Chapter 1, this domain of social exclusion reflects a set of customs, material goods
and social „pleasures‟ that the majority of people are entitled to (Townsend 1979), and we may
assume that some older people may be at high risk of exclusion because of material factors, but
also because of the high risk of being excluded across other domains that are often also
necessary to obtain these common consumer goods. Returning to the link between social
exclusion and independence for older people, while remaining independent is not contingent on
ownership of any one of the individual goods included here, exclusion on this domain may indicate
that older people may not have the necessary socioeconomic resources to remain independent
and enjoy sufficient quality of life, or may indicate that older people are disconnected from
networks that could help maintain sufficient socioeconomic resources.
Common consumer goods here were defined as a fridge-freezer, TV, washing machine,
microwave, CD player, mobile phone, and central heating. Defining indicators to reflect exclusion
from common consumer goods is conceptually difficult due to the need to include relatively neutral
items in terms of technological advancement with the need to reflect what is and is a common
consumer good at any one point in time. We considered including computer ownership, but did not
as computer ownership shifted to majority behaviour only between surveys (not 2002). Across
time, we observed small increases in the ownership of all common consumer goods, although the
largest rise was in mobile phone ownership, from 58.3 per cent to 80.2 per cent between 2002 and
2008. A substantial rise was also observed in the proportion reporting that they owned all of a
0
5
10
15
20
25
30
50-54 55-59 60-64 65-69 70-74 75-79 80-84 85+ Total
Pro
po
rtio
n e
xclu
ded
Age Group
Wave 1 (2002)
Wave 4 (2008)

Chapter 2: Data and Methodology: How can social exclusion be measured among older people?
35
selected number of goods from six per cent in 2002 to sixteen per cent in 200810 (Table 8).
Table 8: Indicators used to construct domain for exclusion from common consumer goods – cross-sectional
descriptive information for 2002 and 2008 (un-weighted sample size and weighted proportions)
2002 (Wave 1)
2008 (Wave 4)
Television Own 99.1% 99.2%
Don‟t Own 0.9% 0.8%
CD Player Own 76.0% 74.6%
Don‟t Own 24.0% 25.4%
Freezer Own 95.4% 96.7%
Don‟t Own 4.6% 3.3%
Washing Machine Own 91.3% 93.6%
Don‟t Own 8.7% 6.4%
Microwave Oven Own 86.5% 92.6%
Don‟t Own 13.5% 7.4%
All* Own 6.0% 16.3%
Don‟t Own 94.0% 83.7%
Central Heating Own 93.5% 96.6%
Don‟t Own 6.5% 3.4%
Mobile Phone Own 58.3% 80.2%
Don‟t Own 41.7% 19.7%
Sample size 8,998 7,550
* Including a television, CD player, freezer, washing machine, microwave oven, tumble dryer, dishwasher, computer, satellite television and a landline phone.
In developing a score for exclusion from common consumer goods, respondents were allocated a
point for each of the goods that they reported having, with those with a score of four or less being
defined as excluded on this domain. We observed a large increase in the proportion of older
people reporting ownership of all seven goods, from two-fifths in 2002 to two-thirds in 2008 (figure
11). Consequently, we observed a substantial decline in the proportion excluded on this domain of
social exclusion, from 9.9 per cent in 2002 to 3.4 per cent in 2008. Such a decline can lead us to
expect that those remaining excluded from common consumer goods will potentially be those
facing the most severe forms of poverty and socioeconomic disadvantage, as well as other forms
of exclusion. A decline in exclusion from common consumer goods was observed across all age
groups (figure 12), although was particularly marked among the oldest age groups, with, for
example, the proportion of those aged 85 and above who were excluded on this domain falling
from almost half (47.5%) to less than a quarter (21.9%).
10
Including a television, CD player, freezer, washing machine, microwave oven, tumble dryer, dishwasher, computer, satellite television and a
landline phone.

Chapter 2: Data and Methodology: How can social exclusion be measured among older people?
36
Figure 11: Exclusion from common consumer goods score and cut off point (2002 and 2008 samples).
Figure 12: Proportion excluded from common consumer goods by age in 2002 and 2008.
2.10 Exclusion from Financial Products
People who are excluded from financial products are generally unable to access resources to help
them manage their finances, either on a day-to-day basis or longer term. These resources can
include relatively simple products such as current accounts, through to more complex long-term
investments including annuities and life insurance. An inability to access and manage financial
products could lead older people to fall into debt, to be unable to purchase common consumer
goods, or to become excluded from common values and practices in another way. Additionally,
exclusion from financial products can act as a marker of other domains of social exclusion, such as
exclusion from local amenities. We could expect older people to be excluded from financial
0%
10%
20%
30%
40%
50%
60%
70%
0 1 2 3 4 5 6 7
Pro
po
rtio
n e
xclu
ded
Score for Exclusion for Common Consumer Goods (Higher score = less excluded)
Wave 2 (2002)
Wave 4 (2008)
0
5
10
15
20
25
30
35
40
45
50
50-54 55-59 60-64 65-69 70-74 75-79 80-84 85+ Total
Pro
po
rtio
n e
xclu
ded
Age Group
Wave 1 (2002)
Wave 4 (2008)

Chapter 2: Data and Methodology: How can social exclusion be measured among older people?
37
products as they may be less able to access some financial products because of age or health
related eligibility criteria, due to their low or fixed incomes being lower than certain thresholds
needed to access these products, or because these products or services are unavailable in their
local area. As was the case earlier for exclusion from common consumer goods, while failure to
access any individual financial product alone is unlikely to impede the independence of older
people, the concept of exclusion from financial products may signify an inability to weather
financial shocks, which in turn could impede on independence.
Table 9: Indicators used to construct domain for exclusion from financial products – cross-sectional descriptive information for 2002 and 2008 (un-weighted sample size and weighted proportions)
2002 (Wave 1)
2008 (Wave 4)
Short-term Financial Product Current Account
Reported 88.1% 91.5%
Not Reported 11.9% 8.5%
Medium-term Financial Products
Savings Account Reported 70.2% 69.2%
Not Reported 29.8% 30.8%
TESSA Reported 16.4% 8.4%
Not Reported 83.6% 91.6%
ISA Reported 45.9% 58.9%
Not Reported 54.1% 41.1%
Premium Bonds Reported 35.8% 37.6%
Not Reported 64.2% 62.4%
National Savings Reported 7.8% 5.6%
Not Reported 92.2% 94.4%
PEP Reported 18.0% 9.5%
Not Reported 82.0% 90.5%
Stocks and Shares Reported 32.0% 28.2%
Not Reported 68.0% 71.8%
Share Options Reported 3.9% 4.0%
Not Reported 96.1% 96.0%
Share Club Reported 0.8% 0.4%
Not Reported 99.2% 99.6%
Unit and Investment Trust
Reported 10.2% 9.0%
Not Reported 89.8% 91.0%
Bonds and Guilds Reported 10.6% 9.4%
Not Reported 89.4% 90.6%
Other Financial Products
Reported 6.5% 5.9%
Not Reported 93.5% 94.1%
Long-term Savings Products
Private Pension Reported 77.7% 82.3%
Not Reported 22.3% 17.7%
Life Insurance
Reported 51.7% 42.7%
Not Reported 48.0% 57.0%
Not answered 0.3% 0.3%
Sample size 8,998 7,550
Following the method developed by Barnes et al (2006), we measure financial exclusion from
short, medium and long-term products; exclusion from short-term financial products is assessed
using information on current accounts at a bank or building society; long-term financial exclusion is
assessed through the inability to access (or be granted access) to current and future private
pension income and life insurance; exclusion from medium-term financial products is assessed
through considering whether respondents have access to products such as savings accounts,
stocks and shares and other investments (table 9). A number of these indicators of financial
exclusion did change between 2002 and 2008, with the most substantial declines observed in the

Chapter 2: Data and Methodology: How can social exclusion be measured among older people?
38
number of older people reporting that they have a TESSA (tax exempt special savings account)
(8% decline to 8.4% in 2008), life insurance (9% decline to 42.7% in 2008), and stocks and shares
(4% decline to 28.2% in 2008). Meanwhile, substantial increases were observed in the proportion
of older people reporting ISAs (individual savings account) (13% increase to 58.9% in 2008) and
private pensions (4.5% increase to 82.3%).
In developing a score for exclusion from financial products, respondents were awarded two points
if they reported a long-term or short-term financial product respectively and a further point if they
reported a medium-term financial product, giving a maximum potential score of 5 (table 10); over
70% of respondents scored 5 points at both 2002 and 2008. Older people were classified as being
financially excluded if they scored two points or less, with a small decline observed in the number
falling beneath this threshold from 7.6 per cent in 2002 to 6.8 per cent in 2008. Figure 13 highlights
that the small overall decline in exclusion from financial products is attributable to declines in
exclusion among older people aged 65 and above, with little change observed in exclusion status
among those aged 50-64 years. Given that this cohort should be preparing for retirement using a
variety of long, medium and short-term financial products, the lack of change in exclusion status on
this domain among this age group may be considered particularly concerning to some.
Table 10: Distribution of scores for exclusion from financial products in 2002 and 2008 (un-weighted sample size and weighted proportions)
Wave 1 (2002)
Wave 4 (2008)
Excluded
0 2.4% 1.0%
1 1.5% 0.9%
2 3.7% 4.9%
Not Excluded
3 13.2% 11.0%
4 9.1% 8.7%
5 70.1% 73.4%
Sample Size
8,998 7,550

Chapter 2: Data and Methodology: How can social exclusion be measured among older people?
39
Figure 13: Proportion excluded from Financial Products by age in 2002 and 2008.
2.11 Further methodological notes: who’s included in our sample?
In these analyses our sample contains those who completed a self-completion questionnaire, who
were core study members, and for whom we were able to establish exclusion status across all
seven domains. Many of the indicators used in constructing the domains of social exclusion are
only collected in the self-completed section of the survey and we therefore we filter out those who
did not submit a questionnaire. While all respondents were invited to submit a self-completed
questionnaire, around 90% of Wave 1 respondent and 85% of those in Wave 4 did so. The ELSA
study contains weights that are used in the cross-sectional analyses to account for the differential
response patterns for those who did and did not submit a self-completed questionnaire. We do not
include partners in this report, as is the convention in many analyses of ELSA (see Hussey et al
2010 for further methodological information on the survey). For our 2002 cross-sectional sample
this resulted in a sample size of 8,988 and for 2008 a cross-sectional sample size of 7,550. For
2002 our sample represents 87 per cent of core study members who submitted a self-completed
questionnaire and for 2008 the sample represents 91 per cent. In later longitudinal analyses, we
also link information of individuals in 2002 with their information in 2008. This produces a working
sample of 4,095 respondents representing 83% of cases who were present at both wave 1 (2002)
and wave 4 (2008) and who completed the self-completed section at both sweeps).
2.12 Further methodological notes: what caveats should be placed on the analyses?
2.12.1 Attrition
In many longitudinal studies, attrition is a potential weakness and can compromise the
representativeness of the data. Attrition occurs when individuals drop out of the study. Many
studies of attrition find that those with disadvantaged characteristics are most likely to attrit
(Hawkes & Plewis 2006, Banks et al 2010). To account for the differential patterns of attrition in the
0
2
4
6
8
10
12
14
16
18
50-54 55-59 60-64 65-69 70-74 75-79 80-84 85+ Total
Pro
po
rtio
n e
xclu
ded
Age Group
Wave 1 (2002)
Wave 4 (2008)

Chapter 2: Data and Methodology: How can social exclusion be measured among older people?
40
survey by socioeconomic characteristics, the study depositors of ELSA constructed longitudinal
attrition weights for individuals who were present throughout the study. The usage of weights in the
analysis of ELSA data is designed to minimise the impact of attrition. For longitudinal analysis, we
use the pre-derived wave 4 longitudinal weights that account for differences between sample
members who participated in the 2002, 2004, 2006 and 2008 sweeps of data compared to the
original core sample members who attrited or were subject to wave non-response (see Hussey et
al 2010).
In this report, attrition poses a particular problem in that many of the factors that are used to define
or predict social exclusion also predict attrition. For example, having a private pension is a proxy
indicator of socioeconomic status, and we would expect those that don‟t have private pensions to
be the most likely to attrit. However, having a private pension is also a component in measuring
exclusion from financial products. We can expect those who are socially excluded to also be those
who attrit from the study, particularly given the correlations between social exclusion with death
and movement into institutional accommodation. When we examine the attrition patterns of those
who were socially excluded, we find that those who were excluded from civic activities, financial
products, local amenities and consumer goods were significantly more likely to attrit than those
who were not excluded on these domains. While this does not present a limit to the cross-sectional
analysis, it does represent a limitation to some of the work looking at patterns longitudinally. The
usage of attrition weights will attenuate this effect to a certain extent. However, attrition does
represent a caveat to these results, and as a result, we are likely to underestimate rates of social
exclusion particularly related to material deprivation or low social capital.
2.12.2 Non-response and missing data
Missing data within waves is a further methodological concern in constructing our domains of
social exclusion. Given that our indicators of social exclusion constituted our dependent (outcome)
variables (for most of the report), we did not employ any specific techniques to control for missing
data on these, beyond those outlined earlier in this chapter (see earlier notes on derivation of
individual domains) due to issues pertaining to methodological appropriateness of doing so (see
von Hippel 2007 for a discussion). However, we do also consider the predictors of social exclusion
in later chapters, and employed multiple imputation models to generate missing values and
preserve the sample size of our cross-sectional and longitudinal samples. We constructed 15
replicate sets each for the 2008 cross-sectional dataset, as well as another for the longitudinal
dataset (see Royston 2004 for an overview of multiple imputation).
2.13 Further methodological notes: which methods were employed in these
analyses?
In this report we use a combination of descriptive and regression techniques on weighted and
multiply imputed data. Our selection of regression model here reflects the nature of our dependent
variable – for continuous outcomes we employ ordinary least squared (OLS) regression models,
for binary outcomes we employ binary logistic regression; and for categorical outcomes we employ
multinomial logistic regression and ordinal logistic regression for ordinal variable.

Chapter 2: Data and Methodology: How can social exclusion be measured among older people?
41
The results presented from binary logistic regression models often represent odds ratios (referred
to as OR in the text at times). These represent the relative probability of experiencing versus not
experiencing a given condition in one group versus another. An odds ratio above one suggests
that a group is more likely to experience a condition than is the case in a comparison group (the
baseline), while an odds ratio below one suggests a lower relative probability of experiencing an
event. It should be noted that odds ratios reflect the relative probability in one group versus
another, but do not reflect the risk in the population of experiencing a given condition. We also
present the results from ordinal logistic regression when looking at overall exclusion, with an odds
ratio over one equating to a higher probability of being more severely excluded in one group
relative to another. We also present the results from ordinary least squares (OLS) regression in
our analyses of wellbeing score.
Finally, we also present results from fixed effects models, using binary logit or OLS regression. In
the longitudinal analyses, even after controlling for individuals‟ prior experiences that may
influence their exclusion experiences, there may be observable or unobservable variables omitted
from the models, which may be correlated with one or more of the explanatory variables, as well
as the outcome variable. These omitted variables can have a pernicious effect leading to spurious
results in our model estimates. We attempt to overcome this potential source of bias through
imposing a fixed effects framework, and make the assumption that these unobserved effects are
time invariant. In this case it is changes over time among individuals that our models aim to identify
through examining how a change in status (for example health) between the 2002 and 2008
sweeps impacts a change in social exclusion or other outcome over the same timeframe, with
unobserved heterogeneity that is fixed over time being controlled for through fixed effects11. While
none of our analyses in this report attempt to establish causality in terms of the associations we
identify, imposing a fixed effects framework can be analogous to taking a „step closer‟ to causality.
2.14 Further methodological notes: the characteristics of socially excluded people
In this report, not only are we interested in the prevalence of social exclusion, and how this may
have changed between sweeps of the ELSA survey, but we are also interested in the
characteristics of those who are most at risk of being socially excluded. This current chapter has
already begun to explore the impact of age on the risk of social exclusion across different domains
and in the proceeding chapters we extend this analysis to explore the impact of other
characteristics. We explore the impact of age on the risk of exclusion initially in bivariate analysis
where we explore a single characteristic at a time. However, we also know that many of the
individual relationships we identify in bivariate analyses will be confounded by other
characteristics, for example age effects may be partly attributable to health or other factors.
Therefore, we explore these relationships simultaneously in multivariate analyses, so that we are
able to describe and identify the association between a single characteristic and the risk of social
exclusion, holding constant other potential confounding characteristics. Our choice of
characteristics that we include in these analyses reflects those factors known to be associated with
higher risks of disadvantage, particularly among older people (for example Barnes et al 2006,
11
At this point we only analyse change between the 2002 and 2008 sweeps and not change across all four available ELSA sweeps.

Chapter 2: Data and Methodology: How can social exclusion be measured among older people?
42
Philipson and Scharf 2004), and can be grouped in terms of variables reflecting demographic
factors, socioeconomic factors and health related factors. The characteristics of older people
included in our 2002 and 2008 cross-sectional samples are included in table 11, and in the next
chapter we outline how these characteristics were associated with the risk of being socially
excluded in 2008.
Table 11: Control factors – cross-sectional descriptive information for 2002 and 2008 (un-weighted sample size and weighted proportions)
2002 (Wave 1)
2008 (Wave 4)
Age Group
50-54 20.7% 13.8%
55-59 18.8% 23.5%
60-64 15.4% 18.3%
65-69 13.8% 13.2%
70-74 12.2% 11.2%
75-79 9.5% 9.0%
80-84 6.8% 6.1%
85+ 3.8% 4.9%
Gender Male 47.1% 47.0%
Female 52.9% 53.0%
Ethnicity
White 97.3% 96.6%
Non-white 2.5% 3.4%
Missing 0.2% 0.0%
Living Arrangements
Live Alone 24.0% 24.3%
Couple No Children 52.0% 46.6%
Children and No Partner, Other Household 6.2% 6.7%
Couple with Children 17.8% 22.4%
Total Children
None 12.7% 11.6%
One 14.2% 14.4%
Two 37.9% 36.4%
Three or More 35.3% 33.7%
Missing 0.0% 3.8%
Total Siblings
None 21.7% 20.0%
One 30.4% 30.8%
Two 20.3% 20.3%
Three or More 25.3% 27.8%
Missing 0.3% 1.1%
Highest Educational Qualification
Degree or Higher 11.7% 17.1%
NVQ Level 4 or equivalent 11.4% 7.7%
NVQ Level 3 or equivalent 6.3% 6.6%
NVQ Level 2 or equivalent 16.2% 12.0%
NVQ Level 1 or equivalent 13.4% 11.7%
No qualifications 40.9% 23.5%
Missing 0.1% 21.5%
Economic Activity
Retired 47.7% 48.7%
Employed 28.4% 30.8%
Self-employed 5.9% 7.0%
Unemployed 2.4% 2.0%
Sick 6.3% 5.0%
Looking after Family 9.3% 6.3%
Missing 0.0% 0.0%
Self-rated Health
Very Good 30.0% 12.6%
Good 40.2% 29.3%
Fair 23.0% 31.6%
Bad 6.9% 26.5%
Missing 0.0% 0/0%
Fallen in past year
Not Fallen 40.7% 45.9%
Fallen 18.3% 16.8%
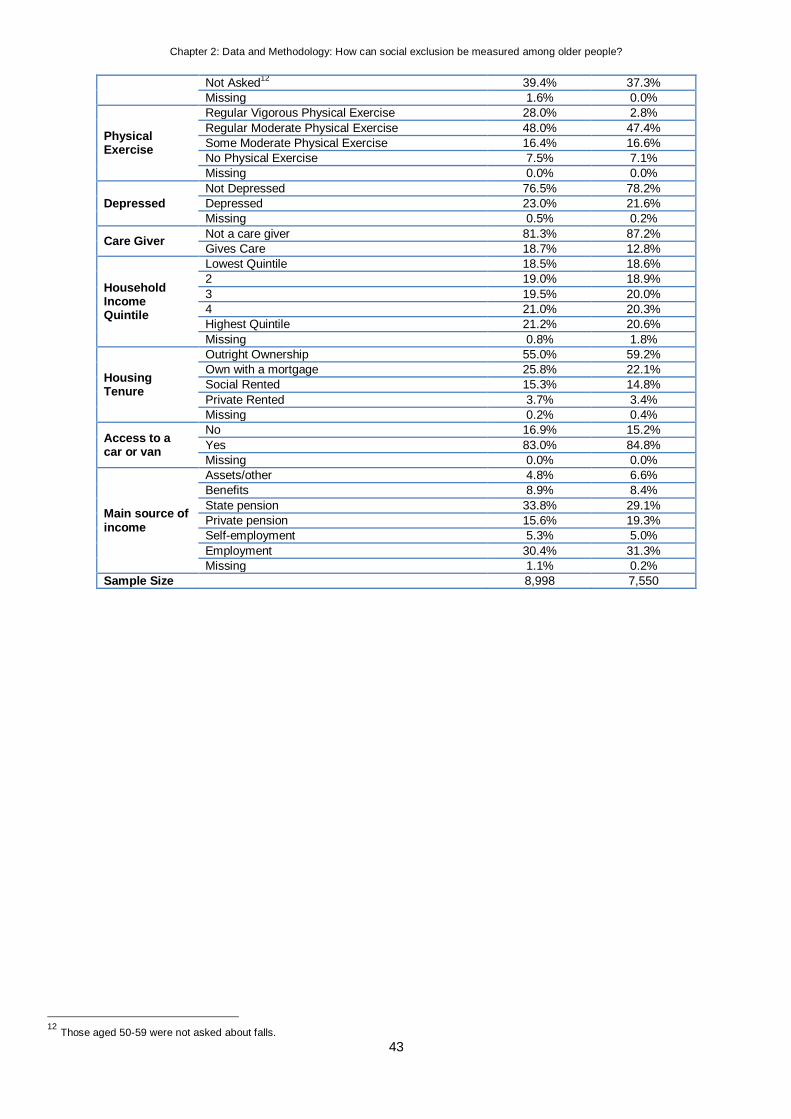
Chapter 2: Data and Methodology: How can social exclusion be measured among older people?
43
Not Asked12
39.4% 37.3%
Missing 1.6% 0.0%
Physical Exercise
Regular Vigorous Physical Exercise 28.0% 2.8%
Regular Moderate Physical Exercise 48.0% 47.4%
Some Moderate Physical Exercise 16.4% 16.6%
No Physical Exercise 7.5% 7.1%
Missing 0.0% 0.0%
Depressed
Not Depressed 76.5% 78.2%
Depressed 23.0% 21.6%
Missing 0.5% 0.2%
Care Giver Not a care giver 81.3% 87.2%
Gives Care 18.7% 12.8%
Household Income Quintile
Lowest Quintile 18.5% 18.6%
2 19.0% 18.9%
3 19.5% 20.0%
4 21.0% 20.3%
Highest Quintile 21.2% 20.6%
Missing 0.8% 1.8%
Housing Tenure
Outright Ownership 55.0% 59.2%
Own with a mortgage 25.8% 22.1%
Social Rented 15.3% 14.8%
Private Rented 3.7% 3.4%
Missing 0.2% 0.4%
Access to a car or van
No 16.9% 15.2%
Yes 83.0% 84.8%
Missing 0.0% 0.0%
Main source of income
Assets/other 4.8% 6.6%
Benefits 8.9% 8.4%
State pension 33.8% 29.1%
Private pension 15.6% 19.3%
Self-employment 5.3% 5.0%
Employment 30.4% 31.3%
Missing 1.1% 0.2%
Sample Size 8,998 7,550
12
Those aged 50-59 were not asked about falls.

Chapter 3: Who was at risk of being socially excluded in 2008?
44
Chapter 3: Who was at risk of being socially excluded in 2008?
KEY MESSAGES
Who is at risk of social exclusion?
In this chapter, we explore how factors measured in 2008 are associated with
exclusion status measured in 2008. We find that different domains of social
exclusion have a different set of risk factors that predict exclusion. For
example, a history of falls is generally not a risk factor for many single
domains of exclusion except for exclusion from local amenities, where those
who had experienced a fall were 33 per cent more likely to be excluded than
those who had not.
If we were to ignore differences across individual domains, and focus on
overall measures of exclusion, we find that people with the following
characteristics are more likely to be excluded using a shorthand measurement
of social exclusion:
Older
Non-white
Lived Alone/Lived with Children and No Partner/Lived without Partner
Childless
Off work sick
Poor self-rated health
No regular uptake of physical exercise
Depressed
Experienced a fall
Poor: in the lowest quintile of equivilised household income
Living in rented housing
No car
Living on benefits as the main source of income

Chapter 3: Who was at risk of being socially excluded in 2008?
45
3. Who was at risk of being socially excluded in 2008?
3.1 Who was a risk of being socially excluded in 2008?
Introduction and overall exclusion trends
Figure 14: Proportion excluded from different domains of exclusion by age in 2002 and 2008.
In the previous chapter, we described the way in which social exclusion is measured in this report,
using seven domains originally based on a framework developed by Barnes et al (2006). We
showed that between 2002 and 2008, there was little change in the risk of exclusion for those aged
50 and above in terms of civic activities and access to information, social relationships, financial
products and social relationships. Over the same period, there were substantial increases in the
risk of exclusion from local amenities and exclusion from decent housing and public transport, as
well as a substantial decrease in the risk of exclusion from common consumer goods (Figure 14).
Overall, Figures 15a and 15b highlight that between 2002 and 2008, there was a modest two per
cent increase in the proportion who were excluded in some form, with most of this increase
confined to those who were excluded from one domain alone; there was actually a small decrease
(1.4%) in the proportion who were excluded on two or more domains of social exclusion.
Furthermore, it should be noted that Figures 15a and 15b both include the over 50 population;
should we confine our interest to the population aged 65 and over, we would observe a modest
-1.7%
+1.1%
-0.6%
+5.3% +5.6%
-0.8%
-6.5%
0.0%
2.0%
4.0%
6.0%
8.0%
10.0%
12.0%
14.0%
16.0%
18.0%
2002 2008
Exclusion from SocialRelationships
Exclusion from CulturalActivities
Exclusion from CivicActivities and Information
Exclusion from LocalAmenities
Exclusion from DecentHousing and PublicTransport
Exclusion from FinancialProducts
Exclusion from CommonConsumer Goods

Chapter 3: Who was at risk of being socially excluded in 2008?
46
three per cent (2.8%) decline in the proportion of people who were excluded on at least one
dimension of social exclusion.
Figures 15a and 15b: Overall level of exclusion in 2002 and 2008. Un-weighted sample size: 2002=8,998,
2008=7,550.
We further examined the impact of age on different forms of exclusion, and observed that those in
the oldest age groups (80-84, 85+) were at elevated risk of being excluded across most domains
compared to those in younger age groups, with age exhibiting an approximate linear relationship
with the risk of exclusion. Two exceptions existed in terms of the risk of exclusion from cultural
activities, where age did not exhibit a linear association, and it was those in the youngest and
oldest age groups who were most at risk of exclusion from this domain. Exclusion from decent
housing and public transport exhibited a negative association with age, and increasing age was
actually associated with a decreased risk of exclusion from this domain. However, there were
differences in the way different age groups experienced levels of social exclusion in 2002
compared to 2008.
In this chapter, we extend this bivariate analysis further to examine other characteristics of older
people – their demographic, socioeconomic and health characteristics – as well as to statistically
test the strength of the observed associations. In addition, we also examine the overall risk of
exclusion in 2008 across any domain. In the latter half of this chapter we construct regression
models to examine the associations between these characteristics simultaneously, in order to
mitigate any confounding effects. Given that social exclusion is a much broader term indicating a
difference in values, as well as access to material resources, that are due, in part, to the
exclusionary practices of the socially excluded (see, for example, Burchardt et al 2002b); we can
also expect the predictors of social exclusion to be much wider than those predicting poverty
among older people alone. The literature supports this notion, with measures of socioeconomic
status (housing tenure, low income, and reliance on state benefits) predicting social exclusion
alongside predictors that are not solely linked to socioeconomic status (older age, single person
households, childlessness, and poor physical and mental health) among older people (Barnes et al
2006). Interestingly, the same study also found that factors that may be expected to be strongly
associated with social exclusion, and in particular gender and ethnicity which can indicate both
socioeconomic resource and historic societal position, particularly among older people, were not
identified as strong explanatory factors. In this chapter, we choose to focus on both gender and
54.4%
28.3%
11.4%
4.3%
1.3%
0.3%
0.0%
2002 Not excluded
Excluded on 1domain
Excluded on 2domains
Excluded on 3domains
Excluded on 4domains
Excluded on 5domains
Excluded on 6domains
52.3%
30.8%
11.2%
3.7%
1.7%
0.2%
0.1%
2008

Chapter 3: Who was at risk of being socially excluded in 2008?
47
ethnicity, among other factors, as we believe that while these may not form strong predictors of
overall levels of social exclusion according to the literature, they may nevertheless be important
predictors of individual domains. Decent housing and access to public transport have also been
found to be significant predictors of social exclusion among older people, and among the wider
population (for example SEU 2006, Barnes et al 2006, Hoff 2008). As such, given that we identify
this as a domain of social exclusion, we could expect this domain to be predictive of other domains
of social exclusion.
Returning to the impact of age on exclusion, we observe in table 12 that age is statistically
significantly associated with all the individual domains of social exclusion, and with the overall risk
of being socially excluded. The higher risk of being excluded in most individual domains of
exclusion also raises their risk of any form of social exclusion. Almost two-fifths (38%) of those
aged 85 and older were excluded from two or more domains of exclusion in 2008 – this compared
with one-in-eight (12.4%) of those aged 60-64 years and one-in-six of the total sample (16.9%).
0
10
20
30
40
50
60
70
50-54 55-59 60-64 65-69 70-74 75-79 80-84 85+
Not excluded any domain2002
Not excluded any domain2008

Chapter 3: Who was at risk of being socially excluded in 2008?
48
Figure 16a and 16b: Overall level of exclusion in 2002 and 2008 by age group. Un-weighted sample size: 2002=8,998, 2008=7,550.
We can also observe that those aged 60-79 had among the lowest risks of being excluded in any
form in 2008 – this represents a departure from 2002 where those aged 50-59 also experienced
the lowest risks of being excluded in any form (Figure 16a and 16b). People aged 50-54 years in
2008 were more likely to be socially excluded in any form than people in older age groups up to 80
years, with the rise in the risk of exclusion spread equally between a rise in people aged over 50
excluded on one domain of social exclusion alone (from 28% to 34% between 2002 and 2008 (not
shown)) and who were excluded on two or more domains (from 13% to 19.5%). Conversely, there
was a decline between 2002 and 2008 in the proportion aged 85+ who were excluded on any
domain, from 83.0 per cent to 71.9 per cent. While public policy has focussed to a greater extent
on tackling social exclusion among children and families, and older people and neighbourhoods to
a lesser extent, this analysis highlights a need for a lifecourse approach that also includes working
age people (Dewilde 2003). We find evidence here that the future cohort approaching retirement
may be more socially excluded than previous cohorts. We describe the risk of exclusion by other
characteristics of older people in the following sections.
3.2 Demographic characteristics and the risk of social exclusion in 2008
We find that older women are at a significantly greater risk of exclusion from cultural activities, civic
activities and access to information, and financial products (table 12 below, where blue shaded
cells represent bivariate statistically significant associations). Older men conversely, are at a
greater risk of exclusion from social relationships and decent housing and public transport. In
terms of the overall risk of social exclusion, women were at a small, although statistically
significantly higher risk of experiencing some form of social exclusion (48.9% compared to 46.3%
among women). Being non-white was also associated with a higher risk of experiencing some form
0
10
20
30
40
50
60
50-54 55-59 60-64 65-69 70-74 75-79 80-84 85+
Excluded 2+ domains2002
Excluded 2+ domains2008

Chapter 3: Who was at risk of being socially excluded in 2008?
49
of exclusion compared to being white (59.8% compared to 47.3%), with most of this difference
attributable to non-white people‟s elevated risks of experiencing exclusion from cultural activities
(20.4% compared to 12.2%), exclusion from civic activities and access to information (14.8%
versus 9.0%), and especially exclusion from financial products (21.0% versus 6.3%).
Statistically significant differences in the risk of exclusion were patterned by the number of siblings
an older person had, although these differences were eclipsed by the differences in exclusion
patterns by the number of children older people had. Unsurprisingly, respondents with no siblings,
but particularly no children, were at greater risk of exclusion from social relationships – almost a
third of older people with no children were excluded from social relationships compared to less
than one-in-twenty older people with three or more children (32.4% versus 4.9%). Older people
with no children were also those at elevated risk of exclusion from common consumer goods –
over one in ten people with no children were excluded on this domain compared to less than two
per cent of those with three or more children (10.4% compared to 1.8%). Consequently, older
people with no children were at greater risk of experiencing some form of exclusion, with over
three-fifths experiencing some form of exclusion (60.1%), compared to less than half of those with
any number of children.
While gender, ethnicity, children and siblings did statistically significantly pattern exclusion across
a number of domains, living arrangements statistically significantly patterned the risk of exclusion
across all seven individual domains. Those who lived alone, or who lived in households with
children and no partner and other households combined, were at substantially elevated risk of
experiencing social exclusion across all domains; the one exception was exclusion from decent
housing and public transport, where those in couple households with children were also at risk of
exclusion on this domain. This heightened risk across individual domains led to almost two-thirds
of those living alone, and those who lived in households with children and no partner and other
households combined, being excluded in some form (63.3% and 64.7% respectively), compared to
less than half of those in couple households and couple households with children (38.5% and
44.7% respectively). Furthermore, the risk of experiencing exclusion on three or more domains
was over four times higher for older people living in the two at-risk households (13.1% and 15.2%
respectively) compared to older people living in the two low risk households (1.9% and 2.7%
respectively).

Chapter 3: Who was at risk of being socially excluded in 2008?
50
Table 12: Proportion excluded by demographic characteristic in 2008 (weighted proportions). Total sample size (7,550), see table 11 for overall prevalence of characteristic in sample.
Exclu
sio
n f
rom
so
cia
l re
lati
on
sh
ips
Exclu
sio
n f
rom
cu
ltu
ral
acti
vit
ies
Exclu
sio
n f
rom
civ
ic a
cti
vit
ies
an
d a
ccess t
o i
nfo
rmati
on
Exclu
sio
n l
ocal am
en
itie
s
Exclu
sio
n f
rom
decen
t h
ou
sin
g a
nd
pu
bli
c t
ran
sp
ort
Exclu
sio
n f
rom
fin
an
cia
l p
rod
ucts
Exclu
sio
n f
rom
co
mm
on
co
nsu
mer
go
od
s
No
t exclu
ded
Exclu
ded
fro
m o
ne d
om
ain
Exclu
ded
fro
m t
wo
do
main
s
Exclu
ded
fro
m t
hre
e o
r m
ore
d
om
ain
s
Gender
Male 10.6% 10.4% 7.1% 15.6% 17.0% 5.8% 3.7% 53.7% 30.7% 10.0% 5.6%
Female 7.4% 14.5% 11.1% 16.8% 14.3% 7.5% 3.2% 51.1% 30.8% 12.2% 5.9%
Age Group
50-54 8.3% 17.5% 7.4% 13.3% 23.6% 8.4% 1.7% 48.8% 33.3% 11.9% 6.0%
55-59 7.8% 12.8% 6.6% 12.6% 24.2% 6.5% 1.2% 50.9% 32.9% 11.3% 4.9%
60-64 6.7% 11.8% 7.6% 13.0% 13.9% 6.1% 2.4% 58.9% 26.9% 9.8% 4.4%
65-69 7.9% 10.4% 9.2% 13.2% 12.2% 5.7% 1.7% 57.8% 29.8% 8.3% 4.1%
70-74 6.9% 10.1% 10.5% 15.5% 10.5% 5.7% 3.0% 57.3% 28.9% 9.4% 4.4%
75-79 8.4% 12.8% 11.6% 17.3% 8.1% 5.9% 3.5% 55.6% 27.6% 11.8% 5.0%
80-84 15.1% 10.6% 14.5% 32.5% 6.3% 8.6% 9.4% 39.4% 36.3% 16.0% 8.3%
85+ 25.0% 12.6% 19.1% 41.4% 4.1% 12.1% 21.9% 28.1% 33.9% 19.1% 18.9%
Ethnic Group
White 8.8% 12.2% 9.0% 16.2% 15.8% 6.3% 3.6% 52.7% 30.7% 11.1% 5.5%
Non-white 12.5% 20.4% 14.8% 16.7% 18.5% 21.0% 1.7% 40.2% 32.5% 15.2% 12.1%
Total Children
None 32.4% 10.7% 9.1% 19.4% 16.6% 7.3% 10.4% 39.2% 32.4% 17.5% 10.9%
One 7.9% 10.8% 8.7% 14.4% 15.6% 5.7% 4.6% 53.9% 31.1% 10.8% 4.2%
Two 5.3% 12.4% 7.4% 13.9% 14.7% 4.3% 2.1% 57.7% 29.5% 9.3% 3.5%
Three + 4.3% 13.9% 10.4% 17.4% 16.9% 9.3% 1.8% 51.5% 31.2% 11.1% 6.2%
Missing 16.4% 13.1% 17.8% 24.8% 9.6% 12.6% 5.9% 41.8% 33.0% 12.7% 12.5%
Total Siblings
None 15.0% 11.8% 10.0% 18.3% 11.9% 5.5% 6.1% 50.7% 29.7% 12.7% 6.9%
One 8.0% 11.0% 7.1% 14.7% 15.5% 5.6% 3.7% 55.4% 30.5% 9.4% 4.7%
Two 6.9% 13.8% 8.2% 14.5% 15.3% 6.7% 2.4% 54.1% 31.4% 9.6% 4.9%
Three + 6.9% 13.9% 11.2% 17.4% 18.4% 9.0% 2.1% 49.3% 31.2% 13.3% 6.2%
Missing 11.9% 11.1% 24.8% 24.2% 22.1% 14.6% 2.8% 36.8% 36.8% 11.4% 15.0%
Living Arrangements
Live Alone 20.3% 14.6% 16.9% 26.1% 13.4% 12.5% 9.7% 36.7% 32.3% 17.9% 13.1%
Couple No
Children 3.6% 10.2% 6.6% 12.4% 13.3% 3.2% 1.1% 61.5% 29.2% 7.4% 1.9%
Children and No
Partner, Other Household
21.6% 21.9% 12.0% 22.9% 20.8% 17.2% 4.6% 35.3% 31.4% 18.1% 15.2%
Couple with
Children 3.9% 12.2% 5.6% 11.5% 21.2% 5.1% 1.1% 55.3% 32.1% 9.9% 2.7%
Notes: Blue shaded cells indicate significant associations at the 5% level
3.3 Socioeconomic characteristics and the risk of social exclusion in 2008
Across many of the socioeconomic factors included in table 13, a consistent story emerges that
those who possess characteristics that would be considered disadvantageous are also at higher
risk of experiencing social exclusion across a number of domains. If social exclusion among older
people is indicative of a process of losing independence, these results suggest that socioeconomic
resources are an important factor in maintaining this independence.

Chapter 3: Who was at risk of being socially excluded in 2008?
51
In the case of highest qualification, we observe a generally linear pattern in the risk of exclusion
across most domains, with those with degree level qualifications possessing the lowest risk of
exclusion and those with no qualifications the highest risk – the exception being exclusion from
decent housing and public transport, where those with NVQ Level 3 or equivalent qualifications
have the highest risk of exclusion. In examining economic activity, those who were categorised as
sick were much more likely than other groups to be classified as excluded across all domains – for
example, almost half of those who were sick were excluded from local amenities (45.1%). In total,
over 80 per cent of people who were sick were excluded on at least one domain (82.3%), and
almost a quarter were excluded on three or more (24.2%). Income exhibited a similar linear
association with exclusion as highest qualification, with those in the lowest quintile of equivilised
household income at greatest risk of exclusion. This increased risk even extends to exclusion from
social relationships, which could be considered a domain that is „income neutral‟, where there is
ostensibly little need for income to support these relationships; this increased risk appears to
support the theoretical basis for relationships between material and non-material disadvantage.
Almost two-thirds of older people in the highest quintile of income were not excluded in any form
compared to less than two-fifths of people in the lowest quintile (64.3% versus 38.7%). We also
observed similar relationships in terms of car ownership, housing tenure, and the main source of
income. In terms of the latter two factors, being in social housing or having benefits as the main
source of income were particularly associated with a high risk of social exclusion with close to
three quarters of people in these categories being excluded from at least one domain of social
exclusion (73.5% and 77.2% respectively).

Chapter 3: Who was at risk of being socially excluded in 2008?
52
Table 13: Proportion excluded by socioeconomic characteristic in 2008 (weighted proportions). Total sample
size (7,550), see table 11 for overall prevalence of characteristic in sample.
Exclu
sio
n f
rom
so
cia
l re
lati
on
sh
ips
Exclu
sio
n f
rom
cu
ltu
ral
acti
vit
ies
Exclu
sio
n f
rom
civ
ic a
cti
vit
ies
an
d a
ccess t
o i
nfo
rmati
on
Exclu
sio
n l
ocal am
en
itie
s
Exclu
sio
n f
rom
decen
t h
ou
sin
g a
nd
pu
bli
c t
ran
sp
ort
Exclu
sio
n f
rom
fin
an
cia
l p
rod
ucts
Exclu
sio
n f
rom
co
mm
on
co
nsu
mer
go
od
s
No
t exclu
ded
Exclu
ded
fro
m o
ne d
om
ain
Exclu
ded
fro
m t
wo
do
main
s
Exclu
ded
fro
m t
hre
e o
r m
ore
d
om
ain
s
Highest
Qualification
Degree or Higher 6.9% 11.0% 2.8% 14.4% 17.8% 3.5% 1.9% 58.1% 29.6% 9.3% 3.0%
NVQ Level 4 or equivalent
6.9% 13.2% 4.2% 13.6% 13.7% 2.9% 1.5% 59.2% 28.3% 9.8% 2.7%
NVQ Level 3 or
equivalent 9.0% 13.2% 6.7% 13.4% 19.7% 3.8% 1.7% 53.7% 31.6% 10.3% 4.4%
NVQ Level 2 or
equivalent 6.0% 12.9% 6.9% 11.2% 13.9% 4.3% 2.4% 57.6% 31.0% 8.4% 3.0%
NVQ Level 1 or equivalent
8.9% 13.8% 9.3% 17.6% 11.7% 6.4% 4.4% 52.0% 31.2% 12.2% 4.6%
No qualifications 13.0% 12.4% 17.9% 22.5% 11.9% 12.8% 7.1% 43.4% 31.3% 14.7% 10.6%
Missing 8.3% 12.5% 8.6% 14.6% 20.4% 7.0% 2.0% 51.8% 31.5% 10.6% 6.1%
Economic Activity
Retired 9.8% 10.5% 11.1% 18.5% 10.3% 6.8% 5.2% 53.6% 29.3% 10.9% 6.2%
Employed 6.2% 11.8% 5.3% 10.0% 19.4% 3.6% 1.3% 56.8% 31.6% 9.1% 2.5%
Self-employed 4.5% 9.8% 4.2% 9.7% 23.6% 3.0% 1.6% 56.9% 32.1% 9.0% 2.0%
Unemployed 17.8% 15.2% 8.9% 14.0% 22.7% 12.5% 4.1% 42.5% 35.3% 14.3% 7.9%
Sick 21.4% 31.2% 20.7% 45.1% 27.4% 25.3% 3.1% 17.7% 30.4% 27.7% 24.2%
Looking after Family
7.2% 18.5% 10.9% 14.7% 16.5% 10.2% 2.7% 46.5% 35.0% 12.1% 6.4%
Household Income Quintile
Lowest Quintile 15.1% 17.5% 17.0% 21.6% 17.2% 17.2% 6.8% 38.7% 30.3% 18.3% 12.7%
2 9.0% 13.7% 11.9% 19.6% 13.0% 8.4% 4.4% 48.7% 32.1% 12.4% 6.8%
3 8.5% 14.1% 9.6% 17.9% 14.1% 4.5% 2.5% 51.9% 31.3% 11.6% 5.2%
4 7.0% 11.2% 5.4% 12.8% 18.1% 3.3% 2.1% 56.0% 32.6% 8.1% 3.3%
Highest Quintile 5.0% 7.0% 3.5% 10.0% 15.8% 1.9% 1.8% 64.3% 27.9% 6.5% 1.3%
Missing 15.7% 8.7% 4.3% 16.4% 11.5% 6.9% 3.2% 56.3% 29.0% 8.9% 5.8%
Housing Tenure
Outright
Ownership 7.2% 10.1% 7.6% 14.4% 11.8% 2.4% 2.5% 59.2% 29.6% 8.2% 3.0%
Own with a mortgage
5.5% 13.9% 5.7% 11.3% 20.5% 4.4% 0.9% 54.0% 33.5% 9.5% 3.0%
Social Rented 18.3% 18.4% 20.0% 29.0% 22.9% 25.1% 10.0% 26.5% 31.4% 24.4% 17.7%
Private Rented 17.5% 16.5% 12.5% 24.1% 17.3% 17.1% 7.2% 37.9% 31.6% 15.6% 14.9%
Use of Car
No 22.4% 11.0% 20.3% 35.9% 14.3% 18.4% 12.5% 28.7% 31.1% 21.0% 19.2%
Yes 6.5% 11.7% 7.2% 12.7% 15.8% 4.8% 1.8% 56.6% 30.7% 9.1% 3.6%
Main Source of
Income
Assets/other 10.3% 7.9% 3.5% 12.9% 15.6% 3.7% 2.9% 58.5% 29.9% 8.7% 2.9%
Benefits 19.7% 28.8% 19.8% 33.7% 25.4% 27.2% 6.4% 22.8% 30.2% 24.5% 22.5%
State pension 11.5% 12.4% 15.3% 21.6% 10.0% 9.3% 6.1% 47.3% 30.8% 13.6% 8.3%
Private pension 6.6% 8.7% 3.8% 13.3% 12.8% 1.0% 2.1% 62.0% 29.9% 6.2% 1.9%
Self-employment 2.8% 8.3% 7.6% 6.5% 17.3% 4.1% 1.6% 61.6% 30.9% 5.6% 1.9%
Employment 5.8% 12.2% 5.6% 10.7% 19.7% 3.8% 1.5% 56.1% 31.5% 9.9% 2.5%

Chapter 3: Who was at risk of being socially excluded in 2008?
53
3.4 Health characteristics and the risk of social exclusion in 2008
As may be expected, those with poorer health were more likely to be socially excluded than those
with better health (table 14). Conceptually, this may be expected, particularly if we return to the
model of social exclusion being related to a loss of independence. The relationship between health
factors and exclusion appears particularly strong for exclusion from local amenities, a domain
representative of the ability of older people to independently traverse their local neighbourhood; for
example, those who were in „bad‟ health were five times more likely to be excluded on this domain
than those who were in very good health (31.1% versus 6.1%), while those who undertook no
regular exercise were four times more likely to be excluded from local amenities than those who
undertook regular physical exercise (43.2% versus 9.9%). Mental health was also predictive over
most domains of social exclusion, with only close to a third of those who were depressed not
excluded in any form (34.3%) compared to over half of those who were not depressed (57.3%).
Unusually, care giving did statistically significant predict many domains, and those that did
revealed a relationship exhibited an unexpected trend with those who undertook caring duties
being at a lower risk of exclusion across many of the indicators. However, had the variable used
reflected differences in the number of hours, the type of care, and the relationship between carer
and dependent, different results may have been obtained. Later results from fixed-effects models
also alter this picture.

Chapter 3: Who was at risk of being socially excluded in 2008?
54
Table 14: Proportion excluded by health characteristic in 2008 (weighted proportions). Total sample size
(7,550), see table 11 for overall prevalence of characteristic in sample.
Exclu
sio
n f
rom
so
cia
l re
lati
on
sh
ips
Exclu
sio
n f
rom
cu
ltu
ral
acti
vit
ies
Exclu
sio
n f
rom
civ
ic a
cti
vit
ies
an
d a
ccess t
o i
nfo
rmati
on
Exclu
sio
n l
ocal am
en
itie
s
Exclu
sio
n f
rom
decen
t h
ou
sin
g a
nd
pu
bli
c t
ran
sp
ort
Exclu
sio
n f
rom
fin
an
cia
l p
rod
ucts
Exclu
sio
n f
rom
co
mm
on
co
nsu
mer
go
od
s
No
t exclu
ded
Exclu
ded
fro
m o
ne d
om
ain
Exclu
ded
fro
m t
wo
do
main
s
Exclu
ded
fro
m t
hre
e o
r m
ore
d
om
ain
s
Self-rated Health
Very Good 6.0% 7.5% 3.0% 6.1% 16.6% 2.0% 1.4% 66.2% 26.8% 5.6% 1.4%
Good 6.8% 9.6% 6.7% 10.2% 14.1% 3.5% 2.6% 59.6% 29.8% 8.5% 2.1%
Fair 7.6% 11.1% 8.0% 13.3% 13.3% 6.0% 3.0% 55.8% 30.8% 9.6% 3.8%
Bad 14.2% 19.7% 16.4% 31.1% 19.5% 13.9% 6.0% 33.5% 33.6% 18.8% 14.1%
Fallen in past
year
Not Fallen 8.7% 10.2% 9.3% 15.1% 10.2% 5.6% 3.8% 56.4% 29.7% 9.8% 4.1%
Fallen 11.5% 14.4% 14.1% 26.6% 11.6% 9.4% 7.1% 46.1% 28.7% 14.2% 11.0%
Not Asked 8.0% 14.6% 6.9% 12.9% 24.0% 7.2% 1.4% 50.1% 33.1% 11.5% 5.3%
Physical Exercise
Regular Vigorous
Physical Exercise 6.2% 9.5% 5.8% 9.9% 17.5% 3.1% 1.7% 59.9% 29.7% 8.0% 2.4%
Regular Moderate
Physical Exercise 8.4% 12.5% 7.9% 12.6% 15.1% 5.6% 2.7% 55.1% 30.6% 10.3% 4.0%
Some Moderate Physical Exercise
11.9% 15.6% 14.2% 26.1% 15.4% 11.8% 5.3% 40.4% 33.4% 15.9% 10.3%
No Physical Exercise
16.1% 18.2% 20.3% 43.2% 11.1% 19.0% 11.2% 30.7% 30.4% 19.1% 19.8%
Depressed
Not Depressed 7.2% 9.9% 7.0% 12.4% 14.8% 5.1% 2.8% 57.3% 30.4% 9.1% 3.2%
Depressed 15.0% 22.0% 17.0% 30.2% 18.3% 13.2% 6.0% 34.3% 32.1% 18.8% 14.8%
Care Giver
Not a care giver 9.3% 12.3% 9.6% 16.7% 15.0% 7.0% 3.7% 52.0% 30.9% 11.2% 5.9%
Gives Care 6.1% 13.9% 6.5% 13.3% 19.6% 5.9% 1.5% 54.2% 30.1% 10.9% 4.8%
3.4 Who was at risk of social exclusion in 2008?: Results from Multivariate Models
Earlier sections of this chapter have revealed a number of groups that could be at higher risk of
social exclusion, including older people, materially disadvantaged people, people living alone, and
people in poorer health. A number of these characteristics are known to confound one another –
for example older people are also often those with poor health due to their increased risk of
developing non-communicable diseases. Examining the effects of health or age, for example,
while controlling for other characteristics, necessitates the construction of multivariate regression
model, and in the remainder of this chapter we describe the results from a regression model that
examines the association between exclusion status in 2008 and contemporaneous characteristics
in 2008. In table 15, we present the results from binary logistic models (for single domains of social
exclusion) and ordinal logistic regression models (for analysis of overall exclusion) as odds ratios.

Chapter 3: Who was at risk of being socially excluded in 2008?
55
3.4.1 Results from Multivariate models: Demographic Factors
Age, ethnicity, living arrangements, and the total number of children a respondent reported were
all significant predictors of overall exclusion, while the number of siblings and gender were not
significant predictors of overall exclusion although were of individual domains. Relative to the 50-
59 year age group, those aged 60-79 years were significantly less likely to be classified as being
excluded on an additional domain (with the highest category coded as three or more domains of
exclusion). For example, those who were aged 70-74 years were approximately 40% less likely
than those aged 50-54 years to report any form of exclusion compared to not being excluded, and
were similarly 40% less likely to report being excluded on two or three domains than being
excluded on one or no domains of exclusion (and so on). Older age was predictive of a lower risk
exclusion from decent housing and public transport and marginally predictive of a lower risk of
exclusion from financial products once other factors had been accounted for. However, being aged
85+ was associated with a 92 per cent increase in the odds of being excluded from social
relationships (OR: 1.921), and over two-fold rise in the odds of being excluded from local amenities
(OR: 2.686). Older women were around half as likely to be excluded from social relationships and
common consumer goods (OR: 0.434 and OR: 0.503 respectively), although were more likely to
be excluded from cultural activities (OR: 1.437).
Non-white older people were over three times as likely to be excluded from financial products as
white older people, and the relationship changed little between sweeps (OR: 3.16 in 2008). Non-
white people were also around twice as likely to be excluded from social relationships (OR: 2.150)
and civic activities and access to information (OR: 1.958). Consequently, non-white older people
were also around 50% more likely to report a more severe category of exclusion when examining
overall exclusion (OR: 1.508). That ethnicity was statistically significantly associated with exclusion
is surprising given that few non-white older people are included in the ELSA study and that our
measure of ethnicity is a crude one that ignores differences between ethnic groups. These results
also appear to show ethnicity as a relatively important predictor of exclusion in cross-sectional
analyses, which was not the case in earlier work by Barnes et al (2006). Nevertheless, the
observed findings of non-white people being at greater risk of financial exclusion chimes with the
literature on financial exclusion more widely (see, for example, Devlin 2005; Devlin 2009).
The number of siblings and number of children reported were both significant predictors of
exclusion from social relationships – those who reported having either children or siblings were
significantly less likely to report exclusion on this domain. Having children also lowered the odds of
exclusion from common consumer goods, with a linear relationship observed between a higher
number of children and lower risk of exclusion on this domain (table 15). However, the results also
suggested that those with more children, relative to childless people, were more likely to be
excluded from cultural activities and financial products; the mechanism underlying these latter
trends is worthy of further investigation beyond the scope of this report.
As was described in table 12, living alone was a risk factor for social exclusion, and many of the
associations described earlier remained, even after controlling for other factors. Living alone
appeared to be a significant barrier to participation in social relationships, civic activities and
access to information, local amenities, and financial products – those living with a partner and no
children enjoyed lower levels of exclusion on these domains, as much as 70% lower in the case of

Chapter 3: Who was at risk of being socially excluded in 2008?
56
social relationships (OR: 0.308). For the most part, there was little difference in the magnitude of
the coefficients for those living alone compared to those living in households with children with no
partner or those living with no partner in another form of household; the exception to this was
exclusion from social relationships, where those in the latter form of household were around twice
as likely as those living alone to be excluded (OR: 2.057).

Chapter 3: Who was at risk of being socially excluded in 2008?
57
Exclusion from Social
Relationships
Exclusion from Civic Activities and Access to
Information
Exclusion from Cultural
Activities
Exclusion from Local Amenities
Exclusion from Decent Housing
and Public Transport
Exclusion from Financial Products
Exclusion from Common
Consumer Goods
Overall Exclusion
Exclusion from Social Relationships
1.736***
1.455* 0.846 1.075 1.102 2.749
***
Exclusion from Civic Activities 1.825***
0.862 1.630***
1.165 1.173 1.113
Exclusion from Cultural Activities
1.542** 0.907 1.397
** 1.297
* 1.419
* 0.590
Exclusion from Local Amenities
0.853 1.620***
1.390** 1.346
** 1.353
* 1.057
Exclusion from Decent Housing and Public Transport
1.073 1.195 1.288* 1.340
** 1.301 1.014
Exclusion from Financial Products
1.182 1.155 1.389* 1.304 1.281 2.339
**
Exclusion from Common Consumer Goods
2.576***
1.062 0.631 1.102 0.845 2.372***
Age Group (Base 50-54)
55-59 1.135 0.860 0.718* 0.928 1.070 0.762 0.878 0.915
60-64 1.079 0.885 0.758 0.999 0.530***
0.637 1.775 0.680***
65-69 1.488 0.946 0.708 0.989 0.469***
0.606 1.378 0.669***
70-74 1.012 0.924 0.691 1.155 0.405***
0.552 2.219 0.631***
75-79 1.367 0.769 0.816 1.063 0.291***
0.375** 2.645 0.570
***
80-84 1.528 0.751 0.590 2.240***
0.212***
0.440 4.568** 0.852
85+ 1.921* 0.881 0.685 2.686
*** 0.137
*** 0.455 8.678
*** 1.251
Gender (Base: Male)
Female 0.434***
1.301* 1.437
*** 0.903 0.835
* 1.126 0.503
*** 0.912
Ethnicity (Base: White)
Non-white 2.150* 1.958
* 1.338 0.776 0.784 3.162
*** 0.415 1.476
*
Living Arrangements (Base: Live Alone)
Couple, no children 0.308***
0.652** 0.908 0.789
* 0.998 0.612
** 0.382
*** 0.597
***
Children, no partner/ other 2.057***
0.674* 1.232 1.121 1.128 1.290 0.652 1.218
Couple with children 0.556** 0.592
** 0.842 0.871 1.111 0.709 0.697 0.727
***
Number of Children (Base: None)
One 0.207***
1.265 1.182 0.791 1.071 1.210 0.760 0.596***
Two 0.168***
1.232 1.460* 0.886 0.975 1.026 0.423
*** 0.578
***
Three or more 0.124***
1.447 1.460* 0.981 1.131 1.778
* 0.307
*** 0.653
***
Number of Siblings (Base: None)
One 0.528***
0.827 0.905 1.024 1.089 1.170 1.157 0.883
Two 0.395***
0.883 1.119 0.955 0.918 1.107 0.847 0.828*
Three 0.424***
1.042 1.009 1.241 1.100 0.976 0.808 0.947
Four or more 0.307***
1.122 0.907 1.075 1.019 1.273 0.699 0.865
Highest Qualification (Base: Degree/ Higher)
NVQ Level 4 1.157 1.613 1.268 0.934 0.681* 0.880 0.832 0.951
NVQ Level 3 1.519* 2.435
*** 1.077 0.865 1.044 1.122 0.746 1.174
NVQ Level 2 0.852 2.171***
0.941 0.592***
0.733* 0.963 0.994 0.803
*
NVQ Level 1 1.132 2.673***
0.998 0.826 0.683** 1.146 1.306 0.968

Chapter 3: Who was at risk of being socially excluded in 2008?
58
No Qualifications 1.240 4.220***
0.716* 0.730
* 0.666
** 1.588 1.226 1.054
Economic Activity (Base: Retired)
Employed 1.444 0.813 1.225 1.089 1.112 0.636 0.559 1.074
Self-employed 0.798 0.635 1.239 1.354 1.705** 0.558 0.828 1.300
*
Unemployed 1.811 1.008 1.253 1.071 1.103 1.135 0.793 1.253
Sick 1.759* 1.045 1.626
* 2.329
*** 0.995 1.100 0.271
* 1.993
***
Looking After Family 1.390 0.944 1.516* 1.037 1.136 1.182 0.953 1.355
**
Self-rated Health (Base: Very Good)
Good 1.009 1.902** 1.237 1.464
* 0.950 1.585 1.209 1.267
**
Fair 0.976 1.757* 1.312 1.675
** 1.003 2.071
* 1.236 1.355
***
Poor 1.248 2.167***
1.750***
2.810***
1.536** 2.171
* 1.366 2.295
***
Fallen in past year (Base: Not Fallen)
Fallen 0.976 1.125 1.183 1.331** 1.128 1.186 1.223 1.278
***
Not Asked$
1
Physical Exercise (Base: Regular Vigorous Exercise)
Regular Moderate Exercise 1.107 0.900 1.136 0.940 0.867 1.208 1.008 0.972
Some Moderate Exercise 0.964 0.978 1.032 1.389** 0.855 1.448 1.222 1.110
No Exercise 0.909 1.155 1.126 2.246***
0.551** 1.875
* 1.437 1.412
**
Depression (Base: Not Depressed)
Depressed 1.430** 1.390
** 1.591
*** 1.467
*** 1.011 0.930 1.383 1.516
***
Care Giver (Base: Not a Care Giver)
Care Giver 0.901 0.868 1.082 1.029 1.228* 1.021 0.942 1.085
Household Income Quintile (Base: Lowest )
2 0.843 0.789 0.875 1.102 0.873 0.642** 0.925 0.765
**
3 1.127 0.819 0.928 1.322* 0.916 0.464
*** 0.561
* 0.860
4 1.093 0.662* 0.734
* 1.189 1.160 0.486
** 0.710 0.846
Highest Income 1.041 0.577* 0.472
*** 1.166 0.892 0.379
*** 0.824 0.675
***
Housing Tenure (Base: Outright Ownership)
Own with a Mortgage 1.062 0.862 1.286* 0.938 1.188 1.659
* 0.708 1.181
*
Social Rented 1.080 1.063 1.031 0.916 2.112***
4.140***
1.673* 1.967
***
Private Rented 1.713 1.040 1.157 1.323 1.323 4.683***
2.054* 1.986
***
Use of Car (Base: No)
Yes 0.625***
0.918 0.971 0.507***
1.076 0.793 0.501***
0.565***
Main Source of Income (Base: Assets/ Other)
Benefits 1.017 2.004* 2.044
** 0.954 1.090 1.596 0.874 1.551
**
State Pension 0.891 2.030* 1.401 0.953 1.239 1.095 0.473 1.218
Private Pension 0.691 1.085 1.361 0.918 1.191 0.377* 0.570 1.013
Self-employment 0.407* 3.907
*** 1.238 0.543
* 0.739 2.368 1.747 0.927
Employment 0.584 2.293* 1.500 0.914 0.968 1.280 1.836 1.091
N 7550 7550 7550 7550 7550 7550 7550 7550
Exponentiated coefficients; 95% confidence intervals in brackets * p < 0.05,
** p < 0.01,
*** p < 0.001
$Not entered in model as collinear with (young) age
Table 15: Exponentiated coefficients (Odds Ratios) from binary logistic and ordinal logistic (overall exclusion) models based on weighted estimates.

Chapter 3: Who was at risk of being socially excluded in 2008?
59
3.4.2 Results from Multivariate models: Socioeconomic Factors
Education appeared to be a key facilitator of participation in civic activities and accessing
information, with those with no qualifications over four times as likely to be excluded on this
domain (OR: 4.220). However, having higher qualifications was not protective against exclusion
across all domains. In fact higher education exhibited the opposite trend in terms of exclusion from
cultural activities, exclusion from local amenities, and exclusion from decent housing and public
transport, with those with no qualifications at a significantly lower risk of exclusion from these
domains than those with degree level qualifications (OR: 0.716; OR: 0.730; OR: 0.666
respectively).
Income exhibited a more consistent trend, and being in the highest income quintile was associated
with significantly lower odds of experiencing exclusion from civic activities and access to
information, cultural activities, and common consumer goods. Overall, relative to those in the
lowest equivilised household income quintile, those in the highest income quintile were almost 33
per cent less likely to report a more severe category of exclusion (OR: 0.675). As was described
earlier in table 13, those whose economic activity was hindered by sickness were at particular risk
of exclusion across a number of domains. Relative to retired people, those who were unable to
work because of ill health were significantly more likely to be excluded from social relationships,
cultural activities, local amenities and were overall twice as likely to report a more severe category
of exclusion (OR: 1.993). However, those who did not work because of sickness did enjoy an
advantage through a lower risk of exclusion from common consumer goods than retired people
(OR: 0.271).
Housing tenure, car ownership and the main source of income were also statistically significant
predictors of exclusion (see table 15). For example, relative to those who reported outright
ownerships, those in social housing were almost seventy per cent more likely to be excluded form
common consumer goods (OR: 1.673), were twice as likely to be excluded from decent housing
and public transport (OR: 2.112), and over four times as likely to be excluded from financial
products (OR: 4.140); similar results were also obtained for private rented housing.
3.4.3 Results from Multivariate models: Health Factors
Relative to those who rated their health as „very good‟, those who rated their health as „poor‟ were
statistically significantly more likely to be classified as excluded across five of the seven domains,
and consequently those in „bad‟ health were over twice as likely to be classed in a more severe
category of overall social exclusion (OR: 2.295). As was observed in table 14, being a care giver
was, for the most part, insignificant in terms of predicting social exclusion, while having
experienced a fall in the previous year was associated only with a rise in the odds of being
excluded from local amenities (OR: 1.331). Poor mental health, and specifically depression, was
associated with a statistically significantly increased risk of exclusion across four of the seven
domains of social exclusion under examination (social relationships, civic activities and access to
information, cultural activities and local amenities), and a 52 per cent rise in the overall risk of
being classified in a more severe category of exclusion (OR: 1.516). Other results for the effect of
physical exercise on the risk of exclusion can be observed in table 15.

Chapter 3: Who was at risk of being socially excluded in 2008?
60
3.4.3 Results from Multivariate models: Interrelationships between domains of social
exclusion
All statistically significant associations between the different domains of social exclusion exhibited
positive relationships, with exclusion in one domain predicting exclusion in another. These
significant relationships are summarised in table 16 by the magnitude of the odds ratio of the
relationships. From tables 15 and 16, we can observe that the strongest association is between
exclusion from social relationships and exclusion from common consumer goods – relative to not
being excluded, being excluded from either domain raised the odds of exclusion in the other by
over 2.5 times. Similar associations were observed between a number of domains, even after
controlling for a number of other factors, reinforcing the theory that social exclusion is a
multifaceted concept, and the theory of the interdependence between material and non-material
deprivation. Of interest is the finding that it was exclusion from cultural activities which was
statistically significantly associated with the highest number of other domains of social exclusion
(4). From a policy-making perspective, these results suggest that interventions to reduce the level
of exclusion in any one single domain may not be entirely successful without addressing the
interrelationships between different domains of social exclusion.
Table 16: Summary of significant associations between domains of social exclusion (see table 15 for odds
ratios).
Common Consumer Goods Social Relationships
Common Consumer Goods Financial Products
Civic Activities and Access to Information Social Relationships
Civic Activities and Access to Information Local Amenities
Social Relationships Cultural Activities
Cultural Activities Financial Products
Cultural Activities Local Amenities
Cultural Activities Decent Housing and Public Transport
Decent Housing and Public Transport Local Amenities

Chapter 3: Who was at risk of being socially excluded in 2008?
61
3.5 Who is at risk of being socially excluded in 2008?
The results in this chapter give a snapshot of the characteristics of those who were socially
excluded in 2008. Based on these results, if we were to select a representative population aged 50
and above, using a single summary measure of social exclusion we would expect people with the
following characteristics to be more excluded than others:
- Older
- Non-white
- Lived Alone/Lived with Children and No Partner/Lived without Partner
- Childless
- Off work sick
- Poor self-rated health
- No regular uptake of physical exercise
- Depressed
- Experienced a fall
- Poor: in the lowest quintile of equivilised household income
- Living in rented housing
- No car
- Living on benefits as the main source of income
It is also perhaps no coincidence that the these characteristics listed above are also those
associated as risk factors for a loss of independence among older people, being representative of
people with poorer health, lower peer support, people who face discrimination, people who are
dependent on the state for income or who are on low incomes. Nevertheless, different domains of
social exclusion each had a different set of predictors, which are outlined more fully in this chapter.
However, these results give a snapshot at one point in time and do not allow us to speculate on
how social exclusion status changes within individuals and the way that these characteristics
influence social exclusion status across time. To investigate this, we undertake longitudinal
analysis, which we present in the next chapter.

Chapter 4: How does exclusion status change over time among individuals?
62
Chapter 4: How does exclusion status change over time among
individuals?
KEY MESSAGES
How does exclusion status change over time among individuals?
People were more likely to become more socially excluded that less socially
excluded over time between 2002 and 2008. This differed substantially by age
group and individual domain of social exclusion.
Overall, people who were older in 2002 were much more likely than those
who were younger to become more excluded than less excluded across most
domains of social exclusion.
Greater numbers of people became more excluded than less excluded in
terms of local amenities and exclusion from decent housing and public
transport.
Approximately half of people excluded from social relationships, local
amenities, and civic activities and access to information in 2002 remained
excluded in 2008.
When we examined characteristics measured in 2002 and their associations
with social exclusion status in 2008, we found that people who had the
following characteristics were had a higher risk of reporting a more severe
category of overall disadvantage than their counterfactual:
Experienced disadvantage in 2002
Older
Lived Alone
Poor self-rated health
Depressed
Poor: in the lowest quintile of equivilised household income
Living in rented housing
No car
However, when we examined changes in characteristics between 2002 and
2008, we found that people who assumed caring responsibilities, who started
to live alone, who became too sick to work, who developed poorer self-rated
health, people who became depressed, and people who took up less exercise
were more likely to become multiply disadvantaged. We therefore emphasise
the importance of the relationship between physical and mental health on the
one hand, and the subsequent effects on social exclusion.

Chapter 4: How does exclusion status change over time among individuals?
63
4. How does exclusion status change over time among individuals?
4.1 How does exclusion status change over time among individuals? Introduction
In this chapter, we present analyses of how individuals‟ experience of social exclusion changed
between 2002 and 2008. As discussed earlier, the social exclusion agenda has recently fallen to
the policy wayside somewhat, a reflection of recent focus on more material deprivation as opposed
to a more holistic assessment of the factors that shape an individual‟s experiences and wellbeing.
In this chapter we explore how individuals‟ experience of social exclusion changed between 2002
and 2008.
In conducting the analysis in this chapter, we encounter age, cohort, and period effects (see for
example Bynner & Joshi 2007). We do not attempt to disentangle these effects in a statistical way
in this chapter, and acknowledge that many of the changes occurring may be driven by a
combination of all three effects, particularly given the relatively short period between sweeps of
information gathering. Longitudinal differences may be representative of all three effects, and while
in the narrative of this chapter we refer to these differences as age effects, we acknowledge that
these differences may occur because of growing older, belonging to a different cohort of people, or
because of social change between sweeps. This chapter is guided by the following questions:
1. How did individuals‟ social exclusion status change between 2002 and 2008?
2. How did individuals‟ characteristics in 2002 shape their experience of social exclusion in 2008?
3. How did changes in individuals‟ characteristics between 2002 and 2008 shape their experience
of social exclusion in 2008?
To address these questions we use three different approaches; to address the first question we
use descriptive methods; to address the second question we use regression techniques similar to
those presented at the end of chapter 3; to address the final question, we employed a fixed effects
framework, described in section 2.13.
4.2 How did exclusion status change between 2002 and 2008 among individuals?
(summary)
Overall, among the 4,095 included in our sample13, we find that 24.0 per cent experienced an
increase in the number of domains from which they were excluded compared to 19.0 per cent who
experienced a decrease in the number of domains from which they were excluded. On aggregate
therefore, a greater number of people became more excluded than less excluded as they aged in
the six years between 2002 and 2008; 38 per cent of the sample were excluded on at least one
domain in 2002 compared to 43 per cent in 2008. Patterns of overall exclusion status differed
significantly by the age of the respondent in 2002. Among those who were aged 50-59 years in
2002, there were approximately equal numbers of people becoming less excluded as there were
people becoming more excluded (20.5% and 22.1% respectively). With each older age group, the
13
Our sample includes older people present at both the 2002 and 2008 sweeps.

Chapter 4: How does exclusion status change over time among individuals?
64
differential between the number becoming more and less excluded increased, so that among those
aged 80 and above in 2002, over a third became more excluded overall between 2002 and 2008
(34.8%) compared to a fifth who became less excluded (19.3%).
The ways individuals experienced social exclusion over time also differed by individual social
exclusion domain. There were two domains of social exclusion that appeared particularly
susceptible to change among individuals between 2002 and 2008 - exclusion from local amenities
and exclusion from common consumer goods. A substantially greater proportion of people moved
from being not excluded to being excluded from local amenities between 2002 and 2008, than
moved from being excluded to being not excluded (11.8% compared to 3.4%); in terms of
exclusion from common consumer goods the opposite trend was observed with greater numbers
moving from being excluded to not (4.0%) than moving from not excluded to being excluded
(1.2%). In addition, although there were more moderate differences in the numbers becoming
excluded versus not excluded over time for many of the individual domains of social exclusion,
differences did occur when disaggregating by age group. Furthermore, examining such changes
does not necessarily illuminate the degree to which exclusion is persistent among individuals
between 2002 and 2008; we provide some indication of this in figure 17 which shows the
proportion excluded from a given domain in 2008 by exclusion status from the same domain in
2002. For example, figure 17 shows that over half (51.6%) of those excluded from social
relationships in 2002 remained excluded in 2008 suggesting that exclusion from this domain is
relatively persistent over time.

Chapter 4: How does exclusion status change over time among individuals?
65
Figure 17: Proportion excluded in 2008 by exclusion status on same domain in 2002. Unweighted sample
size: 4,095.
4.2.1 Exclusion from social relationships
As described earlier in chapter 2, exclusion from social relationships includes examining
relationships with friends, partners, children, and other family members. Of any age group,
respondents aged 80 years and above in 2002 were most likely to experience transitions into the
excluded category and were also the most likely to remain excluded from social relationships at
2002 and 2008. Those in the youngest age groups (pre-retirement and newly retired ages) are
slightly more likely to experience improvement in their social relationships than to experience a
decline. This could suggest that for many, retirement brings new opportunities to expand one‟s
social networks.
4.0%
51.6%
8.5%
32.1%
4.5%
45.4%
12.7%
54.6%
10.2%
27.3%
3.2%
31.3%
1.2%
36.1%
0.0% 10.0% 20.0% 30.0% 40.0% 50.0% 60.0%
Not excluded in 2002
Excluded in 2002
Not excluded in 2002
Excluded in 2002
Not excluded in 2002
Excluded in 2002
Not excluded in 2002
Excluded in 2002
Not excluded in 2002
Excluded in 2002
Not excluded in 2002
Excluded in 2002
Not excluded in 2002
Excluded in 2002
Exclu
ded fro
mS
ocia
lR
ela
tionship
s
Exclu
ded fro
mC
ultura
lA
ctivitie
sE
xclu
ded fro
mC
ivic
Activitie
s
Exclu
ded fro
mLocal
Am
enitie
s
Exclu
ded fro
mD
ecent
Housin
g a
nd
Public
Tra
nsport
Exclu
ded fro
mF
inancia
lP
roducts
Exclu
ded fro
mC
om
mon
Consum
er
Goods
Proportion excluded in 2008

Chapter 4: How does exclusion status change over time among individuals?
66
Figure 18: Exclusion from Social Relationships – Longitudinal changes by age group. Total sample size 4,095. Weighted by longitudinal study weights.
Partnership status was a key driver in explaining exclusion from social relationships. Those without
a partner in both sweeps were most likely to be excluded from social relationships at both points
(12.9%, compared to 4% of the overall sample who were excluded from social relationships at both
points), while those who lost a partner were highly likely to transition to be excluded from social
relationships (9.2%, compared to 4% of the overall sample who became excluded from social
relationships between 2002 and 2008). Furthermore, commencing new partnerships, was a
relatively rare event, with approximately one per cent of all respondents (five per cent of
respondents who were unpartnered at wave 1) beginning new relationships; this compared to six
per cent of respondents whose partnership ended (through death or separation) over the same
period. Older age groups (those aged 75+ in 2002) were much less likely to report a partner at
both sweeps than younger respondents.
The presence of children was also an important explanatory component in dictating whether or not
respondents were classed as being socially excluded on the basis of social relationships. Those
with children were less likely than those without children to be classed as excluded from social
relationships both at 2002 and 2008. However, unlike the presence of a partner, reports of the
existence of children did not vary significantly by respondents‟ age.
Given that partnership status and the presence of children are both relatively static factors
between sweeps, it could be assumed that changes in the relationship with friends and immediate
family (excluding children) are key drivers in dictating transitions into and out of exclusion from
social relationships with age. When we examine the impact of respondents reporting the loss of
relationships with immediate family (not children) or friends between 2002 and 2008, we find that
14% and 24% of respondents who reported these losses respectively became excluded on the
basis of social relationships. Similarly, when we examine changes in the number of children,
immediate family (not children), and friends, that respondents report that they are close to, among
those who transitioned into being excluded on social relationships, 53%, 58% and 67%
90.5% 89.0% 86.1%
73.1%
88.5%
3.4% 3.2%
5.3%
11.2%
4.0%
3.5% 4.4% 3.2%
5.3%
3.8%
2.7% 3.4% 5.4% 10.5%
3.7%
50%
55%
60%
65%
70%
75%
80%
85%
90%
95%
100%
50-59years
60-69years
70-79years
80+ years Total
Moved intoexcluded category
Moved out ofexcluded category
Excluded in 2002and 2008
Not excluded in2002 and 2008

Chapter 4: How does exclusion status change over time among individuals?
67
respectively reported a lower number of close relationships14. This could ostensibly suggest that
the impact of losing friends is a key driver of exclusion from social relationships, and may highlight
the importance of keeping resources and spaces that promote friendships and social relationships
between older people in avoiding social exclusion.
The alternative way of examining patterns of exclusion of social relationships is to explicitly assess
the degree to which individuals who were excluded in 2002 remain excluded in 2008. We
previously observed in Figure 17 that over half of people aged 50 and over excluded in 2002
remained excluded in 2008 (51.6%); of those aged 65 and over this climbed to 55.5%. Previously,
we observed some of the risk factors for exclusion from social relationships in 2008 included being
depressed and living alone – these were also markers for being persistently excluded from social
relationships, with over three fifths of those who were depressed and excluded in 2002 remaining
excluded in 2008 (60.1%), and a similar level of those who lived alone (64.1%). However, we also
observed that older men were at greater risk of exclusion from social relationships in 2008 than
older women, although when we examine the persistence of being excluded from social
relationships, a higher proportion of older women who were excluded from social relationships in
2002 remained excluded in 2008 (61.9%) than older men (45.4%). Nevertheless, a greater
proportion of older men than older women were excluded from social relationships at both 2002
and 2008 (5% versus 3%), and older men were more likely to experience this form of exclusion at
some point in their lives. Overall, the level of persistence of exclusion from social relationships was
higher than was the case for the majority of other domains of social exclusion.
While this index of exclusion from social relationships includes a number of indicators of a variety
of social relationships, it should also be recognised that not all of these have been open to all older
people. LGBT people, for example, will be disproportionately represented as socially excluded due
to life course experiences that traditionally did not involve family building or cohabiting partnerships
(see Potter et al 2011); other single or childless people will also be disproportionately classified as
socially excluded, although may have healthy social relationships. Furthermore, older people with
one close and stable social relationship could be defined as excluded, although may not feel
excluded from social relationships in themselves. While it is tempting to construct an index of
exclusion from social relationships that does not include partnerships or children as an alternative,
this is also an unsatisfactory resolution as it negates the importance of these relationships.
Nevertheless, what this analysis does indicate is that for many of those who do experience any
form of transition in exclusion status from social relationships, changes in friendships are a key
driver of these changes. As people age, for the younger age groups (50-69), these changes are
more likely to represent gaining friends than losing friends, although for the oldest age group these
changes are more likely to be negative.
4.2.2 Exclusion from cultural activities
When we adopt a longitudinal approach to the analyses, we find that 81.8% of respondents were
not excluded at either 2002 or 2008, while 3.4% were excluded at both points; the remainder
transitioned in and out of the excluded category in roughly equal numbers (7.2% of respondents
14
Among those who reported these relationships in 2002.

Chapter 4: How does exclusion status change over time among individuals?
68
moved out of the excluded category while 7.6% moved into the excluded category). Transitions in
and out of exclusion on the basis of cultural activities were not statistically significantly patterned
by age group.
We also explore the persistence of being excluded from cultural activities, showing earlier in Figure
17 that just under a third of people excluded from cultural activities in 2002 remained excluded in
2008 (32.1%). This proportion was higher among those who appeared at elevated risk of exclusion
in earlier cross-sectional analyses (Chapter 3) - at 43.6% among those who classified their health
as poor in 2002; it was also marginally higher among women (35.3%), although the difference was
negligible for those in the lowest income group (32.5%).
4.2.3 Exclusion from civic activities and access to information
When we examine longitudinal movements, we see that exclusion status did not change for over
nine out of ten of the cohort, with almost 89 per cent not excluded at both points and 3 per cent
being excluded at both points. A slightly higher proportion transitioned into the excluded category
than transitioned out by 2008. The oldest group were particularly at risk of moving into the
excluded category, confirming earlier trends, with 9 per cent of those aged 80 and older in 2002
becoming excluded on this dimension by 2008, compared with only 3 per cent who moved out of
the excluded category. This suggests that not only are people in the oldest age group slightly more
likely to be excluded initially, but they are also more likely than younger age groups to become
excluded from civic activities and access to information with age. Conversely, for those in the
youngest age group (50-59 years), greater numbers moved out of the excluded category than
moved in (4.6% compared to 2.7%).
The results show that although exclusion from civic activities and access to information is relatively
fixed, yet this is not the case for the oldest age groups, who are at particular risk of transitioning
into an excluded category. Overall, compared to other domains of social exclusion, those who
were excluded from civic activities and access to information in 2002 were highly likely to remain
excluded in 2008 (45.4% of those excluded in 2002 remained so in 2008); among those aged 65
and over this rose to 55.9%. These descriptive analyses support concerns that people in the oldest
age groups are those who are least likely (or able) to actively participate in initiatives associated
with civic participation, such as the „big society‟, as they age. In addition, the also suggest that
once people become excluded from civic activities and access to information, they are highly likely
to remain excluded.
4.2.4 Exclusion from local amenities
When we examine longitudinal patterns, we find that a substantially higher proportion (around
three times higher) of the cohort transitioned into the excluded category than moved away from i t
in terms of exclusion from local amenities. The excluded category in this case represented those
who reported difficulties in accessing two or more services. Higher levels of movement into the
excluded category was observed across all age groups, although those in the oldest age group
were most likely to report increased difficulties in accessing amenities leading them to become
excluded from local amenities (35.5%) compared to those who became less excluded (18.8%).

Chapter 4: How does exclusion status change over time among individuals?
69
Among the sample as a whole, there was a higher incidence of reporting difficulties in accessing
shopping services (local shops, supermarket and shopping centre combined) and access to a
hospital between 2002 and 2008. We also observed that those who were excluded in 2002 were
also highly likely to remain excluded in 2008 – over half of those excluded from local amenities in
2002 remained excluded in 2008 (54.6%), rising to over three-fifths of those aged 65 and over in
2002 (61.5%). Therefore, not only were older people at a relatively high risk of becoming excluded
from local amenities; once excluded they were highly likely to remain so. While this form of
exclusion may reflect a loss of independence and worsening health to some extent, it may also be
representative of other factors including neighbourhood change.
4.2.5 Exclusion from decent housing and public transport
Similar proportions of our longitudinal sample became more excluded as became less excluded
over time overall, although differences occurred once we disaggregated the results by age group.
Those aged 50-69 in 2002 were more likely to have moved into the excluded category than to
have moved out (11.5% versus 9.9%), although for those aged 70 and above, the pattern
switched; for example among those aged 80 and above in 2002, six per cent became less
excluded and 1.5% per cent became more excluded. When we examine this further we find that
this is due to the younger group primarily developing problems with transport and less so in terms
of housing. This domain of social exclusion was most fluid, with just over a quarter of those who
were excluded in 2002 remaining excluded in 2008 (27.5%).
4.2.6 Exclusion from financial products
Longitudinally, while exclusion from financial products was relatively stable between sweeps
compared to other domains of exclusion, there still remained considerable movement between
categories of exclusion. There were almost identical numbers moving into the excluded category
as were moving out of the excluded category; however, those in the oldest age group were most
likely to move into the excluded category (9.3% of those aged 80+), and the youngest age group
the least likely to (2.1% of those aged 50-59). Exclusion from financial products was not especially
persistent compared to other domains of social exclusion, with just over three-in-ten (31.3%) of
those excluded from financial products in 2002 remaining so in 2008. However, the level of
persistence was higher among those who were at risk of exclusion from financial products, with
over two-fifths of those in social housing and excluded from financial products in 2002 remaining
excluded by 2008 (40.3%).
There were surprising fluctuations in older people‟s usage of financial products; for example fifteen
per cent of the sample did not report having a current account at both points, and 6% who reported
a current account in 2002 no longer did so in 2008. While reporting errors may account for part of
this effect, the results nevertheless show a surprising degree of instability in the use of financial
products by older people. One of the most unstable financial products in terms of consistency of
reports between sweeps was life insurance, with almost a third of the cohort either no longer
reporting any life insurance (23%) or reporting that they had taken up life insurance (7%) between
2002 and 2008.

Chapter 4: How does exclusion status change over time among individuals?
70
4.2.6 Exclusion from common consumer goods
We find that people of all age groups were more likely to move from being excluded to being not
excluded in terms of exclusion from common consumer goods between 2002 and 2008. However,
those in younger groups were much more likely to be not excluded at both points, while those in
the oldest age group were the least likely to (figure 19). Over a third of people excluded from
common consumer goods in 2002 remained so in 2008 (36.1%); this level of persistence rose
slightly among men (39.8%) and older people who lived alone (42.3%) both of which were groups
identified at risk of exclusion on this domain in earlier analyses (chapter 3).
Figure 19: Exclusion from Common Consumer Goods – Longitudinal changes by age group. Total sample
size 4,095. Weighted by longitudinal study weights.
4.2.7 Overall risk of exclusion
We find that people of all age groups were likely to become more excluded than less excluded
over time. As with this individual domains of social exclusion, those who were older in 2002 were
more likely to become more excluded between 2002 and 2008 than those who were younger. Less
than one-in-five older people aged 80+ in 2002 were not excluded in any form between 2002 and
2008; this compared to over two-fifths of older people aged 50-59 years. Across all age groups,
over a fifth became more excluded between 2002 and 2008. Overall, these results show that those
in the oldest age groups were at a substantially higher risk of becoming more excluded over time
(with age); however, earlier cross-sectional results also indicate that successive cohorts aged 80+
were also less excluded (in contrast to the 50-59 year cohort), with a 5% increase in the proportion
not excluded in any form among those aged 80-84 years, and a 11% rise among those aged 85+.
Therefore, despite the oldest old becoming less excluded among successive cohorts (essentially
beginning from a more positive base), this age group appears to remain at higher risk than
younger age groups of becoming more excluded over time.
If we alternatively examine the persistence of social exclusion through tracking those who were
excluded in 2002, we find that almost two thirds of those who were excluded on at least one
domain of exclusion in 2002 remained excluded in 2008 (64.3%), rising to almost seven-in-ten of
96.0% 94.9%
86.0%
67.7%
92.6%
3.8%
16.7%
2.2% 7.8%
10.8%
4.0% 2.4% 4.8%
1.2%
50%
55%
60%
65%
70%
75%
80%
85%
90%
95%
100%
50-59years
60-69years
70-79years
80+ years Total
Moved intoexcluded category
Moved out ofexcluded category
Excluded in 2002and 2008
Not excluded in2002 and 2008

Chapter 4: How does exclusion status change over time among individuals?
71
those aged 65 and over (69.2%). Should we examine the equivalent numbers for those who were
excluded on two domains, we find that almost half (47.4%) of those excluded on two or more
domains in 2002 remained excluded on two or more domains of social exclusion in 2008 (57% for
those aged 65 and over). While these results do not signify that the exclusion was on the same
domain across time, they do suggest that exclusion as a state is relatively „sticky‟ – older people
who experience difficulties in one aspect of their lives are vulnerable to experiencing future
difficulties, either in terms of the same aspect or another. Put another way, once people begin to
lose an enabler of independence in one part of their lives, this can signify a similar loss in the
future.
Figure 20: Overall levels of exclusion – Longitudinal changes by age group. Total sample size 4,095.
Weighted by longitudinal study weights.
4.3 How did individuals’ characteristics in 2002 influence their social exclusion
patterns in 2008?
Earlier in this report we presented results from a regression model that included exclusion status in
2008 with contemporaneous characteristics also measured in 2008 (table 15). These results
presented a snapshot of which characteristics were associated with exclusion at a given point in
time; for example we observed that older people with no qualifications were over four times as
likely to be excluded from civic activities and access to information as older people with degree
level qualifications. However, these results do not necessarily show how these characteristics can
shape future experiences of social exclusion within individuals. To do this, we construct a model
that uses older peoples‟ characteristics in 2002 and examine their associations with exclusion
status in 2008, the results of which are presented in table 17.
44.1% 47.4% 37.6%
19.3%
42.9%
13.1% 13.4%
15.9%
26.5%
14.3%
20.5% 17.0%
18.1%
19.4%
18.9%
22.3% 22.2% 28.4%
34.8% 23.9%
0%
10%
20%
30%
40%
50%
60%
70%
80%
90%
100%
50-59years
60-69years
70-79years
80+ years Total
More excluded
Less excluded
Same - Excudedin some form
Same - NotExcluded

Chapter 4: How does exclusion status change over time among individuals?
72
4.3.1 How did individuals’ previous experience of social exclusion in 2002 influence their
social exclusion patterns in 2008?
Table 17 highlights the way in which exclusion from consumer goods in 2002 most strongly
predicted exclusion from the same domain in 2008 (OR: ~19), followed by the same trend for
exclusion from civic activities (OR ~14) and exclusion from social relationships (OR: ~12); this
suggests that individuals who were excluded on these domains in 2002 were most likely to remain
so in 2008. Exclusion from financial products in 2002 was associated with an elevated odds of
exclusion from cultural activities in 2008 (OR: 1.784); in turn exclusion from social relationships in
2002 was associated with an increased likelihood of exclusion from financial products in 2008 (OR:
2.512) as well as exclusion from common consumer goods (2.692). People who were excluded
from local amenities in 2002 were also more likely to be excluded from common consumer goods
in 2008 (OR: 2.348), although exclusion from common consumer goods was actually associated
with a decreased risk of exclusion from decent housing and public transport (OR: 0.536), the only
instance where exclusion on one domain was associated with a significantly reduced likelihood of
exclusion in another. Finally, older people who were excluded from civic activities and access to
information in 2002 were twice as likely to be excluded from social relationships in 2008 (OR:
1.988). While relatively complex and disparate (figure 21), these results clearly demonstrate the
interrelationships between material and non-material domains of exclusion across time, giving
weight to the concept of social exclusion. We can also observe that many of the relationships
between domains have a degree of plausibility. For example, we find that exclusion from financial
products in 2002 significantly predicts exclusion from cultural activities in 2008, with both domains
in some way reflecting accessing, storing or spending disposable income. In turn, we can also
hypothesise how exclusion from social relationships in 2002 can predict later exclusion from
financial products, given that older people often rely on friends and family to assist with their
finances as they age (Arksey et al 2008).
Figure 21: Significant longitudinal relationships between domains of social exclusion from fully adjusted
models (see Table 18); Arrows = ‘exclusion in 2002 predicts exclusion in 2008 from’
4.3.2 How did individuals’ demographic characteristics in 2002 influence their social
exclusion patterns in 2008?
Women who participated in ELSA in 2002 were associated with a 33% lower risk of experiencing
exclusion from social relationships in 2008 (OR: 0.669), although had a 32% higher risk, relative to
Social
Relationships
Consumer
Goods
Financial
Products
Cultural
Activities
Civic
Activities
Local
Amenities
Housing and
Transport

Chapter 4: How does exclusion status change over time among individuals?
73
men, of being excluded from cultural activities in 2008. However, neither men nor women who
were present at both 2002 and 2008 were more likely than one another to be excluded overall from
any domain of social exclusion, or to be multiply disadvantaged. These results mirror earlier cross-
sectional results, which may be expected given that gender is, for most, fixed over time and that
there were large numbers of men and women in the longitudinal sample. The one exception to the
cross-sectional results was that earlier results suggested men were at greater risk of exclusion
from common consumer goods, which was not statistically significant in the longitudinal sample,
and may reflect the relatively small number that were excluded on this domain in the longitudinal
sample.
We also examine whether particular types of men and women were more likely than other to be
socially excluded, through including interaction terms in our models (not shown). We test
interaction terms for gender with age and with living arrangements, believing that the effect of
gender is likely to vary by both of these factors, although find that these additional terms are not
statistically significant. Finally, we examine the change among some of the individual components
that make-up our domain of exclusion from social relationships. We observe no distinct trend in
terms of the indicators of exclusion from common consumer goods. However, when we examine
changes in the indicators of exclusion from social relationships, we find significant trends in terms
of gender. Women were significantly more likely than men to experience the loss of a partner
between 2002 and 2008, although the impact of this loss did not elevate the risk of exclusion from
social relationships. Men, however, were significantly less likely than women to report that they
had friends at both sweeps of ELSA, and were more likely to report the loss of friends between
both time periods. While the measurement of exclusion from social relationships includes the
presence as well as the quality of social relationships, these results indicate that men experience
greater difficulties in maintaining relationships with friends in particular, more so than women.
Greater provision of social activities that involve older men as well as older women may be one
way of reducing the risk of exclusion from social relationships among older men. This has been
identified as a priority among older divorced and single men in particular in other research (for
example Davidson et al, 2003), although the results here, and particularly the lack of significance
of the interaction term between gender and living arrangements, suggests that this is challenge
applicable to all older men. This is especially pertinent given the significance of being excluded
from social relationships on other domains of social exclusion.
Ethnicity was not a significant predictor of exclusion in longitudinal models, although the small
sample size of non-white people in our longitudinal sample is likely to be the cause. Furthermore in
ELSA, the size of the small ethnic minority sample prevents further analyses of the non-white
population to analyse which non-white groups are particularly at risk of social exclusion; it is highly
unlikely that any risk is distributed equally across non-white groups, and different white ethnicities
may also be excluded at differential rates. Further qualitative investigations or a specific study
design that oversamples non-white older people may illuminate whether this finding applies to all
non-white groups among the older population, and the possible underlying mechanisms. Other
studies which do either include a large sample or purposively examine differences between ethnic
groups do find systematic differences in the outcomes of different ethnic groups among the older
population (for example Campbell & McLean 2002; Grewal et al 2004; Scharf, Phillipson & Smith

Chapter 4: How does exclusion status change over time among individuals?
74
2005), suggesting that our analyses are likely to have overlooked a number of differences by
ethnicity in the risk of social exclusion.
In our longitudinal models, to accommodate a smaller sample size we adjust our age categories to
ten year age groups. Our longitudinal framework allows us to cautiously interpret the effect of age
as a predictor of exclusion, and we can observe that those who begin the study at an older age are
more likely to be excluded from social relationships, local amenities, and common consumer
goods, even after controlling for a number of factors that could explain these effects, including
health status and exclusion status in 2002. Age effects were particularly prominent for exclusion
from consumer goods, with those who were aged 80 years or older over ten times more likely to be
excluded than those aged 50-59 years (OR: 10.91) and those aged 70-79 in 2002 more than five
times more likely to be excluded in 2008 (OR: 5.091). However, as with earlier cross-sectional
results, those in the oldest age group were less likely to be excluded from decent housing and
public transport. Overall, however, those who were in the older age groups were more likely than
those in younger age groups to be experience a more severe degree of exclusion. People in the
80+ age group were around three times as likely to experience a more severe degree of exclusion
than those aged 50-59 (OR: 2.969) and those aged 70-79 around 50% more likely to do so (OR:
1.532). While in these models we control for initial health status in 2002 through measures of self-
rated health, history of falls, physical activity reports, and depression, the higher risk of
transitioning into an excluded category may be partially driven by changes in these variables
between sweeps, as well as other events that older people may be at greater risk of experiencing;
we begin to address this through constructing fixed effects models later in this chapter. We also
tested for interactions between age group in 2002 and self-rated health in 2002, and age group
and gender, believing that both of these factors would serve to amplify the effect of age, although
we find no evidence to support this (not shown).
Living alone in 2002 continues to be a marker of an increased likelihood of exclusion in 2008.
Those living in couple households with no children were significantly less likely to experience
exclusion from social relationships and civic activities and access to information (OR: 0.493 and
OR: 0.574 respectively) even after controlling for previous exclusion status and other potential
confounders. These results are particularly convincing given the amount of controlling factors
included in these models. We also investigated whether the effect of living arrangements varied
across different groups through testing for interaction terms in models, although in the main we
found that additional interaction terms did not significantly contribute to explaining social exclusion
status. Other demographic factors, namely the number of children and siblings reported in 2002,
were restricted to being significant predictors of social relationships alone; given that relationships
with siblings and children form a part of this domain, this is unsurprising.

Chapter 4: How does exclusion status change over time among individuals?
75
Exclusion from
Social Relationships
Exclusion from Civic Activities and Access to
Information
Exclusion from Cultural
Activities
Exclusion from Local Amenities
Exclusion from Decent Housing
and Public Transport
Exclusion from Financial Products
Exclusion from Common
Consumer Goods
Overall Exclusion
Characteristic in 2002
Exclusion from Social Relationships
11.74***
1.198 1.356 1.122 1.467 2.512** 2.692
** 3.655
***
Exclusion from Civic Activities 1.988** 13.61
*** 1.254 1.083 1.356 0.769 0.642 3.163
***
Exclusion from Cultural Activities
1.375 1.067 4.390***
1.321 1.178 1.003 0.574 2.086***
Exclusion from Local Amenities
1.121 0.850 1.132 5.366***
0.980 1.185 2.348** 2.482
***
Exclusion from Decent Housing and Public Transport
0.911 1.133 1.249 1.271 2.885***
1.000 1.361 1.861***
Exclusion from Financial Products
0.965 1.287 1.784* 0.690 0.988 5.006
*** 2.126 1.922
***
Exclusion from Common Consumer Goods
1.525 1.096 0.777 1.087 0.536* 0.904 18.62
*** 1.971
***
Age Group (Base 50-59)
60-69 1.350 1.595* 1.267 1.172 0.756 1.052 1.356 1.142
70-79 2.627** 1.724 1.460 1.691
* 0.575
* 0.942 5.091
** 1.532
**
80+ 3.890***
2.026 1.844 3.954***
0.165** 1.961 10.29
*** 2.969
***
Gender (Base: Male)
Female 0.669* 1.046 1.317
* 1.001 0.841 1.433 0.687 0.978
Ethnicity (Base: White)
Non-white 1.985 1.351 1.397 1.880 0.740 2.283 2.420 1.436
Living Arrangements (Base: Live Alone)
Couple, no children 0.493** 0.574
** 1.154 0.834 0.912 1.091 0.705 0.754
**
Children, no partner 1.251 0.766 1.287 0.757 0.810 1.785 0.257* 0.859
Couple with children 0.810 0.512* 0.983 0.666
* 1.156 1.052 0.474 0.837
Other household 1.101 0.371 1.446 0.865 1.346 0.924 1.624 1.110
Number of Children (Base: None)
One 0.410***
1.057 1.252 0.890 1.296 1.153 1.353 0.880
Two 0.285***
1.031 1.654* 0.940 1.025 0.958 0.648 0.784
*
Three 0.205***
0.985 1.601 0.930 1.178 1.408 0.549 0.823
Four or more 0.213***
1.109 1.625 1.127 1.027 1.714 0.789 0.858
Number of Siblings (Base: None)
One 0.894 1.064 0.824 0.892 1.436* 1.468 1.177 1.060
Two 0.638* 0.915 1.006 0.751 1.247 1.600 1.444 1.001
Three 0.550** 1.208 0.938 0.938 1.355 1.553 0.633 1.027
Highest Qualification (Base: Degree/ Higher)
NVQ Level 4 0.854 1.575 1.313 0.756 1.404 1.147 0.446 1.008
NVQ Level 3 0.687 3.089* 1.401 1.006 1.643
* 0.909 0.505 1.289
NVQ Level 2 0.589* 2.507
* 1.249 0.675
* 1.187 0.714 0.606 0.925
NVQ Level 1 0.870 2.335* 1.109 0.780 1.000 0.961 0.538 0.934

Chapter 4: How does exclusion status change over time among individuals?
76
No Qualifications 0.758 3.478***
0.935 0.733 0.974 1.148 0.644 0.960
Economic Activity (Base: Retired)
Employed 1.565 0.839 1.498 1.324 1.051 0.654 2.227 1.242
Self-employed 1.071 0.961 1.260 1.416 0.746 0.545 1.310 1.139
Unemployed 2.974* 0.845 1.456 0.917 1.087 1.058 1.971 1.414
Sick 1.606 0.956 1.338 1.079 0.600 0.759 0.798 0.939
Looking After Family 1.446 1.148 1.218 0.825 0.988 0.720 1.153 1.046
Self-rated Health (Base: Very Good)
Good 1.407 1.207 1.444** 1.360
* 0.841 1.363 1.068 1.228
*
Fair 1.331 1.428 1.891***
2.057***
1.273 1.319 1.067 1.679***
Poor 1.059 2.193* 2.402
** 2.227
** 1.272 1.464 0.573 1.982
***
Fallen in past year (Base: Not Fallen or Not Asked)
Fallen$ 1.063 0.863 1.049 1.179 1.281 0.747 0.730 1.059
Physical Exercise (Base: Regular Vigorous Exercise)
Regular Moderate Exercise 0.818 0.993 0.826 0.936 0.899 1.497 0.641 0.865
Some Moderate Exercise 0.672 1.390 0.961 1.289 0.877 1.760 0.779 1.172
No Exercise 0.396* 0.977 0.776 1.602 0.692 1.635 0.992 0.946
Depression (Base: Not Depressed)
Depressed 1.997***
1.147 1.249 1.230 1.166 1.303 1.002 1.374***
Care Giver (Base: Not a Care Giver)
Care Giver 0.842 0.918 0.814 0.998 0.778 0.921 0.612 0.820*
Household Income Quintile (Base: Lowest )
2 0.891 0.579* 0.944 1.055 0.865 0.504
* 0.786 0.699
**
3 1.269 0.876 1.102 0.897 0.777 0.623 0.456* 0.807
4 1.119 0.621 0.818 0.997 1.014 0.668 0.533 0.764*
Highest Income 0.849 0.493* 0.628 0.932 0.864 0.277
** 0.239
* 0.629
***
Housing Tenure (Base: Outright Ownership)
Own with a Mortgage 0.805 1.053 1.241 0.971 1.233 1.843* 1.137 1.176
Social Rented 1.243 0.881 1.137 0.931 1.869***
2.794***
1.790 1.563***
Private Rented 1.956 0.995 1.933* 1.513 1.365 3.086
* 0.574 1.757
*
Use of Car (Base: No)
Yes 1.066 0.995 0.821 0.642** 1.131 0.602
* 0.838 0.733
**
Main Source of Income (Base: Assets/ Other)
Benefits 1.262 0.828 1.036 1.441 1.545 3.844 1.460 1.341
State Pension 0.887 0.912 1.512 1.396 0.790 3.867 0.575 1.132
Private Pension 0.695 0.799 1.518 1.214 0.878 2.250 0.800 1.054
Self-employment or Employment 0.893 1.103 1.818 0.973 0.962 3.617 1.115 1.150
N 4085 4085 4085 4085 4085 4085 4085 4085
Table 17: Exponentiated coefficients (Odds Ratios) from binary logistic and ordinal logistic (overall exclusion) models based on weighted estimates. Longitudinal models with characteristics in 2002 as predictors of exclusion status in 2008

Chapter 4: How does exclusion status change over time among individuals?
77
4.3.3 How did individuals’ health characteristics in 2002 influence their social exclusion
patterns in 2008?
When we examine these health related variables measured in 2002 as predictors of social
exclusion in 2008, we find that depression in 2002 is associated with a higher risk of exclusion
from social relationships in 2008, with older people who were depressed in 2002 twice as likely to
be excluded from social relationships in 2008 (OR: 1.997). These results suggest that depression
is a good marker of older people who are unable to maintain quality relationships with partners,
family, or friends. Depression did not statistically significantly predict other domains of social
exclusion in these data, although our sample size and representativeness of our working sample
may partially account for this as the results suggested depressed people did have an elevated
(non-significant) risk of experiencing social exclusion across a range of domains. Overall, however,
depression in 2002 was associated with an elevated risk of experiencing a more severe category
of social exclusion (OR: 1.374).
Poor self-rated health in 2002 continued to be significantly associated with higher risks of
exclusion from cultural activities and particularly exclusion from local amenities and exclusion from
civic activities and access to information, regardless of previous exclusion status in 2002. This also
translated into a higher risk of overall exclusion (being excluded or multiply excluded on any
domain). In terms of the latter result, those with poor health were almost twice as likely to fall into a
more severe category of exclusion as those with very good health (OR: 1.980). These data
suggest that health is strongly associated with exclusion, with poorer physical health associated
with an increased risk of inability to access amenities and participate in civic structures – older
people in poor health in 2002 were twice as likely to experience exclusion on these domains as
those who were in very good health.
The amount of physical exercise older people took in 2002 was generally not predictive of social
exclusion status in 2002. However, one unexpected result was observed in that those who did not
exercise in 2002 were less likely than those who engaged in regular vigorous physical exercise to
be excluded from social relationships. Further investigation, beyond the scope of this report,
should identify the underlying mechanism of this trend; later analyses in this chapter present
clearer results of the effects of physical activity. Similarly an unexpected result occurred among
those who gave care in 2002, who appeared to be at a lower risk of falling into a more severe
category of exclusion in 2008 compared to those who did not give care in 2002; as was outlined
earlier, such a result should be interpreted with caution due to the crude nature of our
measurement of care giving, which does not account for the amount of care given, the relationship
between carer and recipient, and the possibility that other unobserved factors may be leading to
spurious results; as in the case of physical exercise we present results that provide a clearer
indication of the effect of care giving later in this chapter. A history of falls in 2002 was not
significantly associated with social exclusion in 2008, although sample size may be a responsible
factor.

Chapter 4: How does exclusion status change over time among individuals?
78
4.3.4 How did individuals’ socioeconomic characteristics in 2002 influence their social
exclusion patterns in 2008?
Older people living in rented housing in 2002 are at an elevated risk of experiencing social
exclusion in 2008 than those in owner occupied housing, particularly those in socially rented
housing (table 17). For those in socially rented housing relative to owner occupiers, this risk is
significant with respect to accessing decent housing and public transport (OR: 1.869), and
accessing financial products (OR: 2.794), and also translates into a higher overall risk of
experiencing more severe exclusion (OR: 1.757). These results are particularly convincing given
the amount of controlling factors included in these models. We also investigated whether the effect
of housing tenure varied across different groups through testing for interaction terms in models,
although found no evidence of significant interactions.
Earlier cross-sectional results in terms of economic activity and main source of income were not
replicated in our longitudinal models. In particular, those who were prevented from working
because of sickness or whose main source of income was from benefits in 2008 were at particular
risk of experiencing exclusion across a number of domains in cross-sectional models, although
these groups in 2002 were at no greater risk of being excluded in 2008 once other factors had
been accounted for. Other variables reflecting socioeconomic status in 2002 were significant
predictors of social exclusion in 2008. Those with no or low qualifications were at increased risk of
experiencing exclusion from civic activities and access to information compared to those with
degree level qualifications – those with no qualifications being over three times as likely to be
excluded on this domain (OR: 3.478). Meanwhile car ownership was associated with a reduced
chance of being excluded from local amenities (OR: 0.642), although not exclusion from decent
housing and public transport.
Compared to people in the lowest household income quintile, people in the highest quintile of
income were at a reduced risk of experiencing exclusion from civic activities and access to
information (OR: 0.493), common consumer goods (0.277) and exclusion from financial products
(0.239). This latter form of exclusion could be considered particularly worrying, as it suggests that
those with the lowest incomes are least able to manage their money in a way that could protect
from further hardship. Overall, people in the highest quintile of income were over 30 per cent less
likely than those in the lowest income quintile to experience a more severe category of social
exclusion (OR: 0.629).
4.4 How did changes in individuals’ characteristics between 2002 and 2008 influence
their risk of social exclusion?
In the previous set of results, we presented how individuals‟ characteristics in 2002 predicted
social exclusion status in 2008. Many of these results confirmed earlier trends in terms of
descriptive analyses and findings from cross-sectional models, as well as being consistent with the
literature. However, some findings continued to defy conventional wisdom. For example, care
giving continued to be a largely insignificant predictor of social exclusion, and furthermore,
appeared to operate in the opposite way as might be expected according to the results in table,

Chapter 4: How does exclusion status change over time among individuals?
79
being associated with a decreased risk of social exclusion. While the previous set of results in
table 17 described how people‟s characteristics in 2002 predicted exclusion status in 2008,
isolating how a change in characteristics over this period influences a change in social exclusion
status may provide more conclusive evidence of the way that individual characteristics shape
experiences of social exclusion. To do this, we construct fixed effects logistic regression models
modelling our individual domains as well as a binary indicator of whether an individual was multiply
excluded or not (excluded on two or more domains). Fixed effects models also provide a useful
basis for overcoming concerns of omitted variables which may influence exclusion experiences
whose omission may lead to spurious results; we make an assumption that any such variables that
are unobserved in our model, although potentially influential in patterning social exclusion such as
personality type, are fixed between 2002 and 2008. With a fixed effects design, we look at
variation within individuals - imposing a fixed effects framework means that our interest is confined
only to those individuals who experienced a change in exclusion status between 2002 and 2008,
and to individual characteristics that could change over this period. Therefore in addition to having
a reduced sample size, our fixed effects regression models do not explicitly model characteristics
such as number of children, number of siblings, gender and ethnicity that did not exhibit changes
(within our sample) between these periods – our understanding of the effects of these
characteristics is confined to earlier results presented in tables 15 and 1715. We present the results
of our regression models as odds ratios in table 18, and describe some of the results below.
4.4.1 How did changes in individuals’ characteristics between 2002 and 2008 influence their
risk of exclusion from social relationships?
Between 2002 and 2008, older people who moved from living alone to living as part of a couple
with no children had over an 80 per cent reduction in the odds of becoming excluded from social
relationships in our fixed effects models. The fixed effects design means that we control for
unobserved variables that may drive these results, such as personality traits, that could be
considered unlikely to change dramatically among older people over the relatively short
observation period. However, those who moved from living alone to living with children but no
partner were over eight times more likely to become excluded from social relationships (OR: 8.878;
not shown in table 18). Moving from living alone to living with children but no partner among those
aged 50+ could indicate the incidence of a crisis either in the lives of the older person or their
(adult) child, placing a pressure on social relationships. Reducing the frequency of physical
exercise was also associated with an increased risk of experiencing exclusion from social
relationships – for example those who undertook regular moderate exercise were twice as likely to
experience exclusion on this domain as those who were exercising vigorously on a regular basis.
This latter result may highlight the way in which exercise is a part of maintaining social
relationships for many older people, reinforcing that exercise may have a wider effect on the
wellbeing than simply on physical health alone. However, overall these analyses suggest that it is
a change in household composition that was one of the most important predictors of a change in
exclusion status with respect to social relationships.
15
Researchers in the future may wish to examine the influence of these factors through examining changes within populations separately (e.g. men and women) and comparing these results.

Chapter 4: How does exclusion status change over time among individuals?
80
4.4.2 How did changes in individuals’ characteristics between 2002 and 2008 influence their
risk of exclusion from cultural activities?
There were few significant changes in people‟s characteristics that patterned changes in exclusion
from cultural activities, although becoming a care giver over this time did significantly raise the
odds of this form of exclusion by approximately 70 per cent (OR:1.700). This result is significant as
it suggests that the transition into a caring role does have negative implications on social exclusion
that were not highlighted in earlier analyses. Possibly mechanisms include difficulties in accessing
leisure activities because of a lack of time, a lack of support for carers, a lack of disposable income
because of care related costs (which may not be fully captured by the household income quintile
alone) or because of a lack of leisure facilities that may be accessible to those with care needs. A
similar result can also be observed when examining the result for economic activity, where
beginning to look after a family was associated with an increased risk of becoming excluded from
cultural activities.
Becoming excluded from local amenities was also associated with a 60 per cent rise in the odds of
becoming excluded from cultural activities (OR: 1.567). Becoming excluded from cultural activities
and becoming excluded from local amenities may be considered markers of where
neighbourhoods are no longer meeting the accessibility needs of older people.
These findings control for unobserved factors such as different tastes or personality traits that are
simultaneously associated with both exclusion from cultural activities and with independent
variables included in the models such as education or age.
4.4.3 How did changes in individuals’ characteristics between 2002 and 2008 influence their
risk of exclusion from civic activities and access to information?
Becoming depressed between 2002 and 2008 doubled the risk of becoming excluded from civic
activities and access to information (OR: 2.189), as did becoming excluded from local amenities
(OR: 2.000) while becoming unable to work because of sickness tripled the odds of becoming
excluded (OR: 3.205). These three findings indicate the way in which good physical and mental
health, as well as the presence of local amenities, helps prevent exclusion from civic activities and
access to information. The fixed effects design means that we control for unobserved and
unmeasured factors that may have influenced the results in earlier models. Declines in physical
and mental health, as well as declines in the accessibility of local amenities, each impede the
accessibility of opportunities to participate in civic activities. However, such declines in health need
not necessarily lead to exclusion from civic activities in practical terms, as new efforts to help older
people with physical limitations access volunteering activities emerge.
4.4.4 How did changes in individuals’ characteristics between 2002 and 2008 influence their
risk of exclusion from local amenities?
Becoming excluded from local amenities between 2002 and 2008 was significantly associated with
changes in exclusion status across other domains. Those who became excluded from civic
activities and access to information, cultural activities and financial products were more likely to

Chapter 4: How does exclusion status change over time among individuals?
81
also become excluded from local amenities (OR: 1.637; OR: 1.987; OR: 1.930 respectively).
However, the small number who became excluded from common consumer goods within this
sample were associated with a lower risk of exclusion (OR: 0.332), as was the case for those with
no qualifications relative to those with degree level qualifications (OR: 0.101); the explanatory
mechanism for the latter two results is unclear. Self-rated health on the other hand did exhibit
expected trends, with those developing fair health or poor health substantially more likely than
those with very good health to become excluded from local amenities (OR: 2.830, OR: 5.227) –
clearly health is an important facilitator of accessing local amenities, and it is particularly significant
that earlier descriptive results uncovered that it was difficulties in accessing hospital (as well as
shopping facilities) that had risen between sweeps. As with all our models included in table 18, our
fixed effects model examining changes in exclusion status from local amenities controls for factors
that could influence both exclusion status and other factors such as health, that are not otherwise
included in the model – this means that we control for the possibility that those with poorer health,
for example, have a higher prior risk of being excluded from local amenities through other factors.
4.4.5 How did changes in individuals’ characteristics between 2002 and 2008 influence their
risk of exclusion from decent housing and public transport?
There were few significant changes in people‟s characteristics that patterned changes in exclusion
from decent housing and public transport, although becoming a care giver over time did
significantly raise the odds of this form of exclusion by approximately 44 per cent (OR:1.435). The
fixed effects design means that we control for unobserved and unmeasured factors that may have
influenced the results in earlier models, which may have rendered the effect of giving care as
insignificant in earlier results.

Chapter 4: How does exclusion status change over time among individuals?
82
Exclusion from Social
Relationships
Exclusion from Cultural
Activities
Exclusion from Civic Activities and Access to
Information
Exclusion from Local Amenities
Exclusion from Decent Housing
and Public Transport
Exclusion from Financial Products
Exclusion from Common
Consumer Goods
Overall Exclusion
Exclusion from Social Relationships
0.743 0.939 0.842 0.932 0.688 1.405
Exclusion from Cultural Activities
0.898 0.679 1.637* 1.040 0.575 1.926
Exclusion from Civic Activities 1.035 0.652 1.987* 0.867 0.803 2.171
Exclusion from Local Amenities
0.654 1.567* 2.002
* 1.059 1.710 0.197
**
Exclusion from Decent Housing and Public Transport
0.897 1.032 0.694 1.244 1.351 1.520
Exclusion from Financial Products
0.555 0.835 0.800 1.930* 1.008 4.059
*
Exclusion from Common Consumer Goods
0.954 0.688 1.338 0.332** 1.445 1.213
Age Group (Base 50-59)
60-69 0.584 0.809 0.808 1.343 0.923 0.866 0.728 0.839
70-79 0.307 0.972 1.116 2.154 0.844 1.226 0.106 0.900
80+ 0.437 0.799 2.398 4.731* 0.621 1.896 0.0382
* 0.945
Gender (Base: Male)
Female 1 1 1 1 1 1 1 1
Ethnicity (Base: White)
Non-white 1 1 1 1 1 1 1 1
Living Arrangements (Base: Live Alone)
Couple, no children 0.191* 0.852 0.506 0.546 1.172 0.180
** 1.292 0.315
**
Children, no partner/ Other 8.878* 2.044 0.952 0.594 0.640 0.694 9.669 0.593
Couple with children 0.228 0.690 1.151 0.368 1.104 0.193 - 0.401
Number of Children (Base: None)
One 1 1 1 1 1 1 1 1
Two 1 1 1 1 1 1 1 1
Three 1 1 1 1 1 1 1 1
Four or more 1 1 1 1 1 1 1 1
Number of Siblings (Base: None)
One 1 1 1 1 1 1 1 1
Two 1 1 1 1 1 1 1 1
Three 1 1 1 1 1 1 1 1
Highest Qualification (Base: Degree/ Higher)
NVQ Level 4 1.264 0.857 0.632 0.386 0.765 0.397 1.889 0.665
NVQ Level 3 1.421 0.567 0.676 0.172* 0.603 0.470 1.426 0.613
NVQ Level 2 1.891 0.538 1.539 0.206* 0.531 0.880 1.554 0.693
NVQ Level 1 1.787 0.372 1.194 0.238 0.419 3.154 17.27 0.592
No Qualifications 1.081 0.389 0.954 0.101** 0.381 1.506 5.016 0.346
Economic Activity (Base: Retired)

Chapter 4: How does exclusion status change over time among individuals?
83
Employed 0.959 0.744 1.252 0.421* 1.122 0.966 1.638 0.781
Self-employed 1.370 1.989 0.489 0.451 1.194 1.794 8.550 1.852
Unemployed 0.986 1.840 2.787 0.537 0.806 1.764 0.903 1.342
Sick 0.610 1.347 3.205* 1.002 1.144 3.366
* 0.0712
* 2.602
**
Looking After Family 0.411 1.818* 0.905 1.398 0.964 2.018 14.29
** 1.232
Self-rated Health (Base: Very Good)
Good 0.843 0.868 1.155 1.636 1.115 1.253 0.468 1.070
Fair 1.289 0.890 1.126 2.830***
0.995 1.405 0.438 1.073
Poor 1.430 1.090 1.350 5.227***
1.173 0.696 0.326 1.761
Fallen in past year (Base: Not Fallen or Not Asked)
Fallen$ 1.281 0.999 1.065 1.105 1.044 1.140 1.896 1.141
Physical Exercise (Base: Regular Vigorous Exercise)
Regular Moderate Exercise 1.903* 1.191 0.821 0.944 1.002 0.637 5.354
** 0.859
Some Moderate Exercise 2.508* 1.085 0.774 1.088 1.315 1.434 7.383
** 1.039
No Exercise 2.269 1.364 1.006 2.269* 1.153 1.646 30.09
*** 1.933
*
Depression (Base: Not Depressed)
Depressed 0.937 1.264 2.189** 1.315 0.842 0.682 1.652 1.455
*
Care Giver (Base: Not a Care Giver)
Care Giver 1.323 1.700** 1.342 0.819 1.435
* 1.349 3.885
* 1.914
**
Household Income Quintile (Base: Lowest )
2 1.233 1.105 1.242 1.317 0.896 1.287 3.164* 0.869
3 0.765 0.775 1.402 0.950 0.757 1.137 2.345 0.706
4 0.675 0.876 1.719 1.496 0.789 1.445 4.358 0.884
Highest Income 0.846 0.849 1.980 1.404 0.608 2.675 5.181 0.867
Housing Tenure (Base: Outright Ownership)
Own with a Mortgage 0.739 1.041 0.872 0.963 0.857 0.384 1.262 0.826
Social Rented 0.942 2.271 0.393 0.155** 2.274 7.012 1.00e-09 0.672
Private Rented 0.0730* 1.524 0.997 0.423 1.700 2.273 3.785 0.606
Use of Car (Base: No)
Yes 0.581 1.525 0.839 0.681 0.580 2.297* 0.642 0.846
Main Source of Income (Base: Assets/ Other)
Benefits 0.994 1.226 1.726 0.712 0.648 1.367 0.575 0.675
State Pension 1.035 0.869 3.164 0.666 0.794 1.368 5.451 0.838
Private Pension 1.208 0.712 2.013 1.037 1.057 0.292 2.079 0.934
Self-employment or Employment 0.889 0.755 2.452 0.711 0.929 0.597 2.274 1.121
N 614 1166 624 1200 1390 446 402 1130
Table 18: Exponentiated coefficients (Odds Ratios) from binary logistic and ordinal logistic (overall exclusion) fixed effects models based on weighted estimates. Longitudinal models with a change in characteristic as predictors of changes in exclusion status between 2002 and 2008

Chapter 4: How does exclusion status change over time among individuals?
84
4.4.6 How did changes in individuals’ characteristics between 2002 and 2008 influence their
risk of exclusion from financial products?
Between 2002 and 2008, older people who moved from living alone to living as part of a couple
with no children had over an 80 per cent reduction in the odds of becoming excluded from financial
products (OR: 0.180). Such a result may suggest that forming new partnership may prompt some
to organise their financial affairs, alternatively could suggest that some financial products are more
open to those in couple relationships, or could indicate an improvement in socioeconomic status
with partnership and hence new eligibility for financial products. Whatever the case, the results do
suggest that older people living alone are at high risk of exclusion on this domain. The fixed effects
design controls for unobserved factors that may simultaneously influence living arrangements and
exclusion from financial products, such as personality traits or money management skills, which
are not, for the most part, expected to vary over time. Similarly, older people who were sick were
more likely to become excluded, although unexpectedly those who gained use of a car were also
more likely to become excluded on this domain (table 18).
4.4.7 How did changes in individuals’ characteristics between 2002 and 2008 influence their
risk of exclusion from common consumer goods?
Between 2002 and 2008, we observed comparatively little change in exclusion status on this
domain, and consequently our sample is composed of 201 individuals. Such a small sample lends
itself towards spurious results, and while we find that exercising less, a lower income, and
becoming a care giver are associated with a greater risk of exclusion on this domain as might be
expected, we also uncover other significant results that we are unable to explain, although are a
likely artefact of the small sample (table 18).
4.4.8 How did changes in individuals’ characteristics between 2002 and 2008 influence their
risk of being multiply excluded?
When we examine the overall risk of being excluded, through comparing the risk of being multiply
excluded (being excluded from two or more domains) compared to being excluded on a single
domain or not at all, changes in four characteristics become apparent as risk factors of exclusion.
Older people who start to live alone, who become unable to work because of sickness, who take
less exercise, and who become depressed, were also those with elevated risks of becoming
multiply excluded. For example, older people who became depressed were 46 per cent more likely
to become multiply excluded (OOR: 1.455). Perhaps most significant was the result that becoming
a care giver increased the risk of multiple exclusion almost two-fold (OR: 1.914); this result is of
interest as it was not a relationship that was identified using alternative methods. Moving to live
alone from living as part of a couple with no children (not shown directly in table 18), was
associated with a threefold rise in the odds of multiple exclusion – for a large portion of the 50+
age group such a transition would be a reflection of widowhood. As with all our fixed effects
models, these results control for the effect of unobserved potentially confounding variables,
including personality traits such as resilience, which may be associated with the independent
variables included in our models and experiences of exclusion.

Chapter 4: How does exclusion status change over time among individuals?
85
4.4.9 Explaining differences between fixed effects and non-fixed effects models
When comparing the results between tables 17 and 18, different factors appear to be significant
according to the different model specifications that were used. For example in table 17, depression
appeared to be a significant predictor of social relationships, although within the fixed effects
specification, it was no longer significant. In the event of such an instance, we can attribute such
an effect to the influence of another underlying factor associated with both depression and
exclusion from social relationships, such as low self-esteem or substance abuse, which may be
driving the apparent link between depression and social exclusion. Similarly, the association
between exclusion from financial products and a higher risk of exclusion from cultural activities
observed in table 17 was no longer present in table 18, suggesting that another unobserved factor
associated with both forms of exclusion, such as consumption patterns or disposable income (as
opposed to equivilised income which is included as a controlling factor) may have been
responsible for the apparent association. Conversely, we have also noted instances where factors
that were not significant in earlier model specifications became significant in fixed effects models,
such as the assumption of caring duties being a risk factor for becoming socially excluded. Here,
we can assume that unobserved factors that we did not control for in previous models, for instance
stress in this case, were fixed and we were able to observe a true association.
4.5 How does exclusion status change over time among individuals? Summary and
discussion
In this chapter we demonstrate that a greater number of people aged 50 and above became more
excluded than less excluded with age – 24 per cent of people became more excluded while 19 per
cent became less excluded. While the results in part depict a negative trend, they also
demonstrate that social exclusion is neither inevitable nor irreversible with older age.
Notwithstanding, compared to those in younger age groups, people who were in older age groups
in 2002 were more likely to become excluded and less likely to become „not excluded‟ across most
domains of social exclusion. This varied across domains in terms of magnitude, with age less
predictive for some domains, and varied in terms of direction and magnitude for exclusion from
decent housing and public transport, with those in older age groups more likely to move from being
excluded than those in younger age groups. For four out of the seven domains of social exclusion,
approximately equal numbers of older people aged 50+ became more excluded as became less
excluded between 2002 and 2008. For exclusion from common consumer goods, greater numbers
of people became less excluded over time, although for exclusion from local amenities and
exclusion from decent housing and public amenities, greater numbers became more excluded
between 2002 and 2008.
However, these analyses illustrated only part of the picture, and we were also interested in the
extent to which individuals who were social excluded in 2002 remained so in 2008. We found that
this persistence of social exclusion differed by characteristic and by domain of social exclusion,
although exclusion from social relationships, local amenities, and civic activities and access to
information was particularly persistent across time among individuals, with approximately half of
people excluded on these domains in 2002 remaining excluded in 2008. Should policy-makers be
interested in addressing persistent social exclusion, the results presented here could suggest that

Chapter 4: How does exclusion status change over time among individuals?
86
a focus on these three domains may be the most effective approach, albeit with further research
needed to substantiate this conclusion.
When we constructed regression models to examine how characteristics in 2002 were associated
with social exclusion status in 2008, we found that being excluded in 2002 was one of the
strongest predictors of exclusion status in 2008 after controlling for other factors – this was
particularly the case for exclusion from common consumer goods, civic activities and access to
information, and social relationships. We uncovered a number of significant predictors across
different domains. We found that older men were more likely to be excluded from social
relationships, even after controlling for previous exclusion status, whereas older women were more
likely to be excluded from cultural activities. Men and women were not significantly different in their
risk of overall exclusion, although it is too simplistic to conclude that older women do not carry the
burden of disadvantage, having lived a lifetime in a marginalised societal position. The models
reveal the net effect of gender, but it should also be noted that older women, and not older men,
who are more likely to be in poverty, to live alone, to suffer from dementia (Bamford 2011a), and to
suffer from other non-communicable diseases (for example ILC-UK 2011).
Being older was associated with an increased chance of being classified in a more severe
category of exclusion than being in a younger age group – those aged 80+ in 2002 were almost
three times more likely to be in a more severe category of exclusion in 2008 than those aged 50-
59 years. Living arrangements were also predictive – those who lived alone in 2002 were at a
higher risk of being disadvantaged in terms of social relationships and civic activities and access to
information in 2008. This is to be expected to some extent given that partnership status is one
component of the index of exclusion from social relationships. However, the deleterious effect of
living in a single person household extends to exclusion from civic activities also; widowhood and
the consequential loss of societal position may be one explanatory factor (see Serra et al 2011 for
a discussion regarding the case of centenarians).
As might be expected for this group, health in 2002 was a significant predictor of exclusion status
in 2008, both in terms of physical and mental health. Depression in 2002 was associated with a
two-fold increase in the odds of being excluded from social relationships while poorer self-rated
health was associated with a decreased ability to participate in community life and civic structures.
Returning once again to the notion of social exclusion as exclusion from shared values and
behaviours (Burchardt et al 2002b), our evidence adds to the case that people who are happy and
healthy are more likely to participate in society (Cattel 2001), and therefore those who are not are
less likely to participate and ultimately more likely to become socially excluded. Our analysis here
shows that for older people, the effect of poor self-rated health is to raise the risk of exclusion from
services and amenities in particular, while the effect of poorer mental health raises the risk of
exclusion from social relationships. The evidence also leads us to question the case for
considering health as another dimension of social exclusion in some respects, particularly if a
lifecourse approach to health is taken, and if an emphasis is placed on considering social
exclusion as a divorce from shared values and wisdom, including those involving healthy lifestyles
and behaviours. Health can also involve accessing the right services and information.
Nevertheless, in these analyses, physical health and mental health are considered as predictors of
exclusion, as opposed to a dimension of exclusion in their own right.

Chapter 4: How does exclusion status change over time among individuals?
87
People with a more socioeconomically disadvantaged profile were generally more likely to be
excluded, although living in social housing and having a low equivilised household income were
particularly associated with a high risk of exclusion; people who shared either of these factors in
2002 were associated with a higher risk of exclusion from financial products in 2008. Exclusion
from financial products for both of these materially disadvantaged groups suggests a perpetuating
cycle where stable savings and/or credit products are either redundant in function, underutilised, or
unavailable to low income groups, who may become more reliant on less secure avenues for
savings products and money management, or discouraged from saving altogether. Living in social
housing in 2002 was also associated with a higher risk of exclusion from decent housing and
public transport, while low income was also associated with a higher risk of exclusion from civic
activities and access to information and common consumer goods. These results suggest that
housing tenure is a good predictor of older people who will experience difficulties in either
accessing information about financial products or difficulties in being granted access to financial
products, as well as those who are likely to experience difficulties in accessing good housing or
public transport.
Finally, our most interesting results derive from our fixed effects models, which focus changes in
characteristics as predictors of changes in exclusion status, thereby controlling for potential
confounding variables that are unobserved, such as resilience or other personality traits. Those
who became depressed, who lived alone, who became too sick to work, who took less exercise, or
who took on caring responsibilities between 2002 and 2008 were more likely to become excluded
on two or more dimensions or more of exclusion. Changes in self-rated health also predicted
changes in specific domains of social exclusion (exclusion from local amenities). These results
point to some of the factors that lead to greater numbers of people to become more than less
excluded between 2002 and 2008. All of these could be considered age related factors, with
people who are older more likely to experience changes into these categories. In fact, while most
of the other characteristics included in models, such as highest qualification or housing tenure, are
subject to change, the levels of change expected could be considered relatively minimal compared
to changes in health characteristics. Here, we find that changes in health are closely associated
with social exclusion status among older people. Later results in chapter 5 also provide evidence
of some of the potential outcomes that existing health inequalities can lead to among older people
- inequalities that exhibit widespread persistence (Marmot 2010).
Our analyses highlight which factors are important in predicting future patterns of social exclusion
among older people; however, it is beyond the scope of this report to discuss all the factors
individually that were included in our models. Furthermore, many other factors that are likely to be
significant explanatory factors are likely to be absent from our models, for example other health
related factors, sexual orientation, a number of neighbourhood level variables, and many others.
The effects of many of these are controlled for in our fixed effects models, although we are unable
to observe their baseline effect in ordinary logistic models. However, what our analyses do
demonstrate successfully is the complexity of both measuring and analysing social exclusion. Very
few factors were statistically significantly associated with all domains of social exclusion, with
different factors associated with different domains using different analytical approaches. This,
therefore, highlights the challenge in understanding how to reduce levels of overall, multiple or
severe exclusion because the risk factors vary in terms of magnitude and direction in predicting

Chapter 4: How does exclusion status change over time among individuals?
88
different domains of social exclusion. Having said this, physical and mental health, as well as living
arrangements, appear as relatively consistent predictors of social exclusion; these can also be
considered proxy measures for independence and social care needs, giving some weight to linking
social exclusion and independence for older people.
While the analysis contained in this report serves as a progression of earlier work by Barnes et al
(2006), and examines certain aspects in a novel way, there is also a danger that the generalised
approach will have overlooked certain interesting and policy-relevant results. It is hoped that the
results presented here will serve as a springboard for more in-depth and complex analysis of
social exclusion, which may mean examining individual domains singly. Further research, using
different analytical approaches, is also necessary given the risk of reverse causality that may serve
to caveat several of the results presented here.
Nevertheless, we can conclude that levels of social exclusion overall appear to be rising (although
largely driven by a new cohort of older people aged 50-54 years), and that for most domains, as
people age they are more likely to become excluded, with physical and mental health status,
gender, assumption of caring responsibilities, housing tenure, highest qualification, and living
arrangements, among others, significantly moderating the risk of becoming excluded with age.
Ordinarily, each of these factors would usually lend themselves to a separate policy intervention or
targeting strategy, as is reflected in the structure of central government (or local authority)
departments. However, it is perhaps this very approach that has led to rises in overall levels of
exclusion, as well as some quite substantial rises in the number excluded in individual domains. If
successive governments view tackling social exclusion as a policy priority, this analysis highlights
that because of the complexity of the relationships identified here, and the absence of factors that
are consistent in the magnitude, direction and significance in their association across individual
domains, a strategy that does not reflect this complexity is unlikely to impact overall levels of social
exclusion. To some extent, the formation of a dedicated unit to tackle Social Exclusion under the
previous government was illustrative of the necessary holistic approach, although the apparent rise
in levels of exclusion among those aged 50 and above over this time suggests that the execution
of this approach may have needed modification. It should, however, be emphasised that among
those aged 65 and over, who would (conventionally) be the focus of policies aimed at reducing
social exclusion, cross-sectional analyses did suggest a decline in levels of exclusion. In particular,
the rise in social exclusion among those aged 50-54 years is of concern, and may signal the need
for a lifecourse approach in lowering rates of social exclusion, where policies do not address the
needs of children, young people or older people in isolation, but view issues facing people of
different ages as being interconnected. In the next chapter, we progress to analyse the impact of
social exclusion across a selection of outcomes.

Chapter 5: What impact can social exclusion have on people‟s lives?
89
Chapter 5: What impact can social exclusion have on people’s lives?
KEY MESSAGES
What impact can social exclusion have on people’s lives?
Being excluded across three domains of social exclusion in 2002, relative to
not being excluded was associated with the following outcomes in 2008:
Lower quality of life score (CASP-19)
Lower self-perceived social status
Greater self-perceived financial uncertainty
Feeling lonely
Cutting meals
Experiencing difficulties in carrying out the activities of daily living or
instrumental activities of daily living and not receiving assistance with these
Becoming excluded from social relationships between 2002 and 2008 was
associated with an increased likelihood of becoming lonely between sweeps,
becoming more uncertain about the future financially, and in developing a
lower quality of life score.
Becoming more excluded from civic activities and access to information,
cultural activities, and local amenities were associated with lower quality of life
scores.
Becoming more excluded from decent housing and public transport was also
associated with an increased likelihood of becoming lonelier between 2002
and 2008.
We found no evidence of an impact from the recession on social exclusion
status, although this is likely to reflect the time of the survey, with 2008 was
too early to observe the likely effects on older people.

Chapter 5: What impact can social exclusion have on people‟s lives?
90
5. What impact can social exclusion have on people’s lives?
5.1 What impact can social exclusion have on people’s lives? Introduction
The previous government recognised that poorer health could lead to social exclusion (ODPM
2005, p40), although were not as explicit in recognising that social exclusion could lead to poorer
health. Being socially excluded, as well as being a negative state in itself, could lead to a number
of negative outcomes, many of which are likely to have financial implications for individuals and
society. For example, exclusion from social relationships could adversely affect a person‟s
wellbeing and sense of loneliness, which could impact both on their physical and mental health,
both of which have substantial cost implications. In a similar way, social exclusion and living in
poverty have been implicated as factors in raising levels of stress among people, which can have
adverse health outcomes (Cattel 2001). In more recent analyses of social exclusion among older
people, social exclusion was operationalized through indicators reflecting low income and income
inequality, non-take-up of benefits, premature death, low disability-free life expectancy, fear of
crime, lack of access to a car, and lack of internet access (Aldrige et al 2011). Social exclusion can
also have more subjective effects, altering a person‟s sense of their place in society and
expectations and aspirations for the future. Social exclusion could also impede a person‟s
negotiation skills, resulting in socially excluded people failing to obtain the services they needs, as
well as being actively excluded from these services by the practices of the social excluded.
Additionally, this report has highlighted an irrefutable link between material poverty and non-
material disadvantage; consequently we would expect social exclusion to raise the risk of poverty
and material disadvantage. Many of these factors can be simultaneously regarded as predictors,
markers, and outcomes of living in social exclusion, and as was raised earlier, the riddle of the
chicken and the egg, common also to other disciplines (for example Demography (Kiernan, 2002),
is a consideration of our analyses of social exclusion. The use of fixed effects techniques here can
be regarded as one step towards overcoming such a debate.
In this chapter we aim to further understand recent influences on, and outcomes of, social
exclusion on older people. Here we are particularly interested in the way that people may react to
the experience social exclusion through changes in their health and wellbeing, their self-perceived
social status, their experience of poverty and unmet need in terms of services, and their
experience of loneliness. In the previous chapter, we highlighted the difficulties in creating
interventions that aim to reduce levels of overall, multiple or severe exclusion because of the way
that different sets of risk factors predicted different individual domains of exclusion. Another
consideration when considering the impact of interventions that aim to reduce levels of multiple or
severe exclusion is that not all domains of social exclusion may have the same deleterious effect
across different outcomes – in much the same way that different sets of risk factors predict
different domains, these domains will have different outcomes. Our analysis in this chapter helps
to unpick this issue further. However, we begin this chapter with analysis that attempts to examine
the exogenous economic circumstance as a predictor of social exclusion.

Chapter 5: What impact can social exclusion have on people‟s lives?
91
5.2 Are older people recession proof with respect to social exclusion?
The financial crisis of recent years, and resulting recession, needs little introduction. Initially
caused by the collapse of the US sub-prime housing market, the subsequent fiscal effects in the
UK from the banking bailouts and economic slowdown, not to mention the long-term pressure of
population ageing, resulted in a substantial shortfall between government spending and revenue.
This shortfall was estimated to have reached £155 billion in 2009/10. This budget deficit
embedded itself in the public consciousness and culminated in a change of government and a raft
of public spending cuts, as part of the government‟s Spending Review, announced in October
2010. Our ELSA data was collected between June 2008 and July 2009, much earlier than the
Spending Review of October 2010. However, a number of events reflecting the financial crisis
preceded the ELSA interview period: there had already been a run on the Northern Rock bank in
2007, the first time in over a century that this had happened and led to the nationalisation of the
bank; UK house prices had begun to fall sharply; income from dividends and investments had
begun to reduce; and by September and October 2008 the US and UK governments, among
others, had begun to step in to rescue failing banks including the Royal Bank of Scotland. While
the full scale of cut backs were yet to be felt among ELSA respondents in the 2008-2009 interview
period, some effects would have been observed including insecurity and falling revenue from
private pensions and investments as well as the beginning of a raft of job losses. These events
could have led to higher levels of social exclusion, and possibly in particular exclusion from
financial products and common consumer goods, as well as higher levels of exclusion from social
relationships due to the stress that the financial crisis brought on for many.
We investigate this issue through examining differences in levels of social exclusion by interview
date for ELSA respondents. We analyse differences with interview date measured continuously (by
month), as well as partition interview date to reflect those interviewed before October 2008, and
those interviewed after – October 2008 is selected as a point where the full effects of the financial
crisis were visible. We initially insert a covariate reflecting interview date into regression models,
and find little evidence of an effect except upon exclusion from decent housing and public
transport, with those who were interviewed after October 2008, the height of the financial crisis,
being 19% more likely to be excluded on this dimension (not shown). Further evidence was
discovered that may signify that levels of social exclusion rose as a result of the financial crisis in
that those who were interviewed after October 2008 were 17% more likely to be multiply or
severely excluded than not excluded compared to those who were interviewed before November
2008. We found no evidence when using a continuous variable reflecting interview date.
We interrogated this result further, as it is known that the date of interview time can be related to
area and personal characteristics. For example some participants needed up to 20 calls to secure
an interview in the original wave 1 sweep (Taylor et al 2003, p23), which will not only influence
when participants were interviewed, but also reflect participant characteristics. Given that
subsequent interviews were timed to be approximately two years after the original interview date
(for example Scholes et al 2009, p43), there may be unobserved selection effects in terms of who
was selected into the October 2008 and post-October 2008 samples. When we perform propensity
score matching, where we include a greater number of variables to predict interview date, we find
that the possible effects of recession described above disappear. Therefore, our results do not

Chapter 5: What impact can social exclusion have on people‟s lives?
92
appear to capture an effect of interview date, used as a proxy for the early effects of the recession,
on levels of social exclusion using these data. Certainly, some of the descriptive data described
earlier, such as the fall in the proportion of older people eating out, or the decrease in the number
of older people investing in long-term, although non-essential, financial products such as life
insurance, did suggest that older people had falling levels of disposable income (between
sweeps). The likely reason that an observed „recession‟ effect was not detected when modelling
the data is that the interview point occurred too early. The next wave 5 (2010/11) sweep of data
collection will have occurred after the 2010 Spending Review, when the scale of cuts were
outlined. However, even this point may be too early to detect the full long-term impact, given that
unemployment level continued to rise during 2011 (ONS, 2011), and other economic indicators
also continued to exhibit worsening patterns.
5.3 What impact can social exclusion have on people’s lives?
5.3.1 Quality of Life and Social Exclusion
Advances in longevity as well as social changes in occupational, gender, and marital status (to
name but a few) have required researchers from across a number of disciplines to revisit and
theorise what quality of life for older people should signify and include (Wiggins et al 2004), and
one measure growing in prominence is the CASP-19 measure (Hyde et al 2003). CASP-19 is a
measure of quality of life among older people that explicitly aims to measure quality of life, as
opposed to influences on quality of life, through measuring satisfaction across domains of Control,
Autonomy, Self-realisation, and Pleasure (CASP) through a total of nineteen indicators (Hyde et al
2003). These indicators consist of questions designed to measure respondents‟ agreement with a
number of statements, for example „I feel life is full of opportunities‟ or „I enjoy being in the
company of others‟, on a scale of zero (never experience) to three (often experience).
Respondents‟ quality of life can range from a minimum score of zero (no quality of life) to fifty-
seven (full quality of life). Studies examining the predictors of CASP-19 have found that quality of
life is patterned by a number of individual and neighbourhood characteristics including the density
and quality of social networks, the experience of recent stressful life events, poor pension
provision and other measures of household wealth, living in rented accommodation, being older,
living in a deprived area, and living in an area lacking basic services (Wiggins et al 2004;
Demakakos et al 2010). In this study, we would therefore expect social exclusion to be strongly
associated with quality of life given that social exclusion is conceptualised across domains that
include both material and non-material deprivation, including social relationships and basic
services.
Annotated output from modelling exclusion status in 2002 as a predictor of CASP-19 score in 2008
(table 19) illustrates that a number of domains of social exclusion are indeed associated with lower
CASP-19 scores. In particular, holding other factors constant, being excluded from social
relationships in 2002 is associated with a score that is two points lower than for those who were
not excluded, exclusion from decent housing and public transport is associated with a score that is
one point lower, exclusion from cultural activities a score that is two points lower, with exclusion
from local amenities having the largest effect being associated with a score that is three points
lower (table 19). When we examine overall exclusion status, the differences appear even more

Chapter 5: What impact can social exclusion have on people‟s lives?
93
pronounced, with those who were excluded from three or more domains of exclusion in 2002
having CASP-19 scores in 2008 that were over seven points lower than for those who were not
excluded on any domain.
When we introduce a fixed effects structure to the data, we observe that becoming excluded from
social relationships, civic activities and access to information, and cultural activities were each
associated with approximately a one point decline in CASP-19 score (table 22); exclusion from
local amenities continued to have a larger effect with those who became excluded on this domain
experiencing a two point decline in wellbeing score. Unsurprisingly, therefore, a change in multiple
exclusion status was also associated with a significant difference in CASP-19 score, with those
becoming excluded from three or more domains experiencing a three point decline in CASP-19
score. However, the results suggest that it is exclusion from relationships, cultural activities,
opportunities to participate in civic structures, and especially exclusion from local amenities that
are most likely to lead to lower quality of life, and not exclusion from domains reflecting material
conditions (although other indicators reflecting socioeconomic status are included in the models).
In addition, the coefficients for the influence of social exclusion on wellbeing were larger than the
coefficients for most other predictors contained in the models. These results control for
unobserved variables that could otherwise influence our results in relation to wellbeing scores,
such as resilience, outlook on life, pessimism, anxiety, and other characteristics and events.
Table 19: Exclusion status in 2002 as a predictor of selected outcomes in 2008 (weighted estimates).
(annotated output – models contain all predictors included in table 18)
Unmet need for assistance with ADL/IADL (base:
difficulty with ADL/IADL and receiving help)
Exclusion status 2002
CASP-19 Score
Self-
Perceived Bottom 50%
social status
Top Decile Self-
perceived
Financial Insecurity
Feel Lonely Often in the
Past Two
Weeks
Cut Meals because of
money
worries
No difficulties in carrying
out ADL/IADL
Difficulty in
carrying out ADL/IADL and not
receiving help
Exclusion from Social Relationships
-2.032***
1.515* 0.960 1.430 0.925 0.876 0.955
Exclusion from Civic Activities
-0.225 1.143 1.030 1.124 2.408 0.897 1.061
Exclusion from Cultural Activities
-1.936***
1.328* 0.828 1.681
** 1.899 0.782 0.915
Exclusion from Local Amenities
-2.958***
0.783 1.196 1.370 0.935 0.533** 1.160
Exclusion from Decent Housing and Public Transport
-1.121** 1.277 1.232 1.151 1.003 0.660
* 0.865
Exclusion from Financial Products
-0.593 1.228 0.938 1.139 5.123***
0.659 0.724
Exclusion from Common Consumer Goods
-0.104 1.166 1.148 1.360 0.984 0.930 1.001
N 4085 4085 4085 4085 4085 4085 4085
With the exception of results for CASP-19: exponentiated coefficients; 95% confidence intervals in brackets;
* p < 0.05,
** p <
0.01, ***
p < 0.001; full output available on request

Chapter 5: What impact can social exclusion have on people‟s lives?
94
Figure 22: Exclusion status in 2002 as a predictor of selected outcomes in 2008 (weighted estimates). (annotated output – models contain all predictors included in table 18)
This bar chart presents the results from four fully adjusted binary logistic regression models as odds ratios (Models 2-5; see main report for further details), and risk ratios from one multinomial logistic regression model (Model 1). Where the bars are above one, this indicates that people who are socially excluded are more likely to experience a given outcome than people who are not excluded. For example, the odds of an older person who was excluded on three or more domains of exclusion in 2002 reporting feeling lonely in 2008 was 4.35 times higher than among those who were not excluded on any domain.
14.9
24.8
0 2 4 6 8 10
Self-Perceived Bottom 50% socialstatus
Top Decile Self-perceived FinancialInsecurity
Feel Lonely Often in the Past TwoWeeks
Cut Meals because of money worries
No difficulties in carrying outADL/IADL
Difficulty in carrying out ADL/IADLand not receiving help
Odds Ratio
Excluded on threedimensionsExcluded on twodimensionsExcluded on one dimension
Not excluded

Chapter 5: What impact can social exclusion have on people‟s lives?
95
Figure 23: Exclusion status in 2002 as a predictor of CASP-19 in 2008 (weighted estimates with all covariates set to the baseline). (annotated output – models contain all predictors included in table 18)
Table 20: Change in exclusion status between 2002 and 2008 as a predictor of change in selected outcomes (weighted estimates). (annotated output from fixed effects models – models contain all predictors included in table 18)
Self-Perceived Bottom
50% social status
Top Decile Self-perceived
Financial Insecurity
Feel Lonely Often in the
Past Two Weeks
Unmet need for help with
ADL/IADL
Exclusion from Social Relationships
1.160 1.810* 3.339
** 1.203
Exclusion from Civic Activities
1.212 1.488 1.573 0.715
Exclusion from Cultural Activities
1.033 0.964 1.282 0.663
Exclusion from Local Amenities
0.991 1.365 1.190 0.847
Exclusion from Decent Housing and Public Transport
0.845 1.087 2.093* 0.872
Exclusion from Financial Products
0.906 1.012 0.648 0.887
Exclusion from Common Consumer Goods
1.919* 0.692 0.786 0.475
N 1512 1276 1058 1190
Exponentiated coefficients; 95% confidence intervals in brackets; * p < 0.05,
** p < 0.01,
*** p < 0.001; full output available on
request
Table 21: Change in exclusion status between 2002 and 2008 as a predictor of change in selected outcomes (weighted estimates). (annotated output from fixed effects models – models contain all predictors included in table 18)
Self-Perceived Bottom 50% social status
Top Decile Self-perceived Financial Insecurity
Feel Lonely Often in the Past Two Weeks
Unmet need for help with ADL/IADL
Baseline: None
Excluded from one domain
0.897 1.170 1.343 0.715*
Excluded from two domains 1.150 1.393 2.083
* 0.714
Excluded from three or more domains 1.360 1.909 2.840
* 0.464
N 1512 1276 1058 1190
Exponentiated coefficients; 95% confidence intervals in brackets; * p < 0.05,
** p < 0.01,
*** p < 0.001; full output available on
request
30 40 50 60
Not excluded
Excluded on one domain
Excluded on two domains
Excluded on three or more domains
CASP-19 Score

Chapter 5: What impact can social exclusion have on people‟s lives?
96
Table 22: Change in exclusion status between 2002 and 2008 as a predictor of change in CASP-19 score (weighted estimates). (annotated output from fixed effects models – models contain all predictors included in table 18)
CASP-19 CASP-19
Exclusion from Social Relationships -0.898*
Exclusion from Civic Activities -1.070***
Exclusion from Cultural Activities -0.928*
Exclusion from Local Amenities -1.736***
Exclusion from Decent Housing and Public Transport -0.314
Exclusion from Financial Products -0.437
Exclusion from Common Consumer Goods -0.215
Baseline: None
Excluded from one domain -0.556**
Excluded from two domains -1.823***
Excluded from three or more domains -3.284***
N 8189 8189
5.3.2 Self-perceived social status and Social Exclusion
Given that in theoretical terms, becoming socially excluded is expected to reflect the exclusionary
practices of the socially included; we could expect those who are socially excluded to
consequently have lower self-esteem than those who are not socially excluded. The majority who
have been socially excluded are likely to have become so involuntarily, at least initially, which may
alter their perception of their social status. We investigate this through examining a variable
collected in ELSA where respondents were asked to indicate where they were placed in society in
terms of being better or worse off on a scale of zero to one hundred. Those who were faring the
worst were those defined as having „the least money, least education, and the worst jobs or no
jobs‟ while those who were faring the best were those described as having „the most money, most
education, and the best jobs‟.
Most people placed themselves in the top half of society, although 18 per cent of our longitudinal
sample placed themselves in the bottom half of society in 2002, and 21 per cent did so in 2008.
We would expect a higher proportion of those who were socially excluded in 2002 to rate
themselves within the bottom half of society in 2008, and explore these relationships using a full
set of controls (outlined earlier in table 18). Annotated results are presented in table 19 and figure
2216, which show that exclusion from social relationships in 2002 and exclusion from cultural
activities were both associated with a greater likelihood of low perceived social status in 2008 (OR:
1.515 and OR: 1.328 respectively). Unusually, despite social status having been defined in
socioeconomic terms, domains reflecting more material aspects of exclusion in 2002 were not
significant predictors of social status in 2008. Nevertheless, in considering overall exclusion,
relative to those who were not excluded on any domain of exclusion, people who were excluded
on three or more domains of social exclusion in 2002 were three times more likely to have a low
perceived social status; those excluded from two domains almost twice as likely (OR: 1.803), and
those excluded from one domain 34 per cent more likely (OR: 1.344).
A number of other factors are likely to explain these patterns that influence both social status and
social exclusion that are not captured within our set of controls, and as was the case in earlier
analyses we construct fixed effects models to overcome this possible source of error. A fixed
effects structure also allows us to infer how changes in social exclusion status are associated with 16
Full output available on request.

Chapter 5: What impact can social exclusion have on people‟s lives?
97
changes in self-perceived social status. In the fixed effects models, we do not observe changes in
overall exclusion status, or changes in exclusion from social relationships and cultural activities
(found to be significant in ordinary logistic regression), to be significantly associated with
developing a low perceived social status. However, those who became excluded from common
consumer goods over the study period were also more likely to have low self-perceived social
status (OR: 1.919).
5.3.3 Self-perceived financial uncertainty and Social Exclusion
Financial uncertainty among ELSA respondents was measured through responses to questions on
the chances that „at some point in the future‟ they would not have enough financial resources to
meet their needs. These responses were then grouped, and those who were in the top decile of
certainty that they would not have enough financial resources (most financially uncertain) were
compared to those who were more certain that they would have enough financial resources. We
could expect those who are socially excluded to be at greater risk of financial uncertainty because
of the links between social exclusion and material disadvantage. However, we could also expect
some impact from the relationship between social exclusion and wellbeing described earlier, and
the potential for poorer wellbeing to translate into a more negative outlook for the future. In
addition, socially excluded older people may have fewer social resources from which they can
draw in times of crisis.
We find little evidence that any single indicator of social exclusion is associated with a more
uncertain (self-perceived) financial future, although do find that experiences of social exclusion
combined in 2002 are associated with a higher odds of financial uncertainty in 2008. Specifically,
being excluded on three or more domains in 2002 was associated with a 2.5-fold rise in the risk of
financial uncertainty in 2008, compared to not being excluded on any domain (OR: 2.538);
significant differences were also observed for those excluded on two or one domains (figure 22).
When we examine change within individuals using our fixed-effects models, we observe that those
who became excluded from social relationships were 80 per cent more likely to be uncertain about
their financial future (OR: 1.810). This could indicate the contribution of social relationships in
helping older people plan and manage their financial security. Becoming excluded from social
relationships could, for example, be a proxy indicator for an incidence of widowhood or divorce,
which may have catastrophic consequences on older people‟s future financial security. These
latter results control for unobserved factors that may influence both social relationships and
uncertainty about the financial future, which in this case could revolve around a number of
personality factors such as anxiety or confidence for example.
5.3.4 Experiences of Loneliness and Social Exclusion
Current government policy has ostensibly shifted away from social exclusion, with some focus now
given to loneliness and isolation. Independent of policy, loneliness is also associated with poorer
mental health, and can be a marker of poor social support necessary to help older people live
independently. Here we examine the way that social exclusion status in 2002 can predict
experiences of loneliness, and find that experiences of cultural exclusion are statistically

Chapter 5: What impact can social exclusion have on people‟s lives?
98
significantly associated with loneliness in 2008, with those excluded 68 per cent more likely to
have reported being lonely in the past two weeks before the ELSA interview than those who were
not excluded on this domain. Overall experiences of exclusion in 2002 were also significantly
associated with exclusion in 2008 (figure 22). When we control for unobserved factors (including
personality traits, a likely set of predictors of loneliness), and examine the way that changes in
exclusion status in fixed effects models are associated with changes in reports of loneliness
between the 2002 and 2008 sweeps, we find that those who became excluded from social
relationships were three times more likely to report becoming lonely in 2008 (OR: 3.339). This is
an expected finding to some degree, highlighting that negative changes in social relationships are
significantly associated with becoming lonely. We also find that those who report becoming
excluded from housing and public transport also report becoming lonely between 2002 and 2008
(OR: 2.093), a possible indication of the importance of accessing public transport on the mental
health of older people and particularly in maintaining personal contacts. Finally, those who became
more excluded in general were also those who became more lonely; for example those who
became excluded from three domains were almost three times more likely to become lonely by
2008 (OR: 2.844, table 21).
5.3.4 Experiences of Material Poverty and Social Exclusion: Cutting Meals
Those who are socially excluded may be expected to experience material hardship in the form of
cutting meals more than those not excluded. Respondents who cut or skip meals because of
financial pressures may not only be lacking socioeconomic resources, but may also be lacking
social support, necessitating drastic measures. Cutting meals in 2008 was associated with prior
exposure to exclusion from financial products in 2002, as well as overall experiences of exclusion
(table 19 and figure 22). However, only a very small number of ELSA respondents in our
longitudinal sample reported changes of behaviour in terms of cutting or skipping meals between
2002 and 2008, and we were therefore unable to interrogate the results further using fixed effects
models.
5.3.4 Experiencing Unmet Social Care Needs and Social Exclusion
The final outcome of social exclusion we examine is an indicator of unmet need for those who
experience difficulties in carrying out the Activities of Daily Living (ADL) or the Instrumental
Activities of Daily Living (IADL). We initially distinguish three groups – those with no difficulties in
carrying out ADL/IADLs, those with difficulties and who receive some form of help, and those who
experience difficulties and receive no help; we are particularly interested in distinctions between
the latter two groups. While we could expect those who are socially excluded to be at greater risk
of experiencing difficulties in carrying out ADLs/IADLs given the links between health and
exclusion identified earlier, we may also expect differences within this group. We would expect
socially excluded people to experience unmet need for assistance in carrying out ADLs/IADLs
following on from lower levels of social support and greater difficulties in negotiating assistance
and, where applicable, in paying for assistance.

Chapter 5: What impact can social exclusion have on people‟s lives?
99
Experiencing some form of exclusion in 2002, relative to not experiencing exclusion, was
significantly associated with a higher likelihood of experiencing unmet need for assistance with
ADLs/IADLs in 2008 compared to receiving assistance with care needs. Those who were excluded
from three or more domains were over 90 per cent more likely to experience unmet need
compared to those not excluded (OR: 1.941) – similar results were also observed for those
excluded from two domains or one domains although these results were not attributable to a one
single domain of social exclusion. For computational reasons, we combine the categories of
having no care needs or receiving assistance with care needs in our fixed effects models and
compare the impact of being socially excluded with those with care needs and not receiving
assistance; having done so we observe few statistically significant results, although the process of
combining categories may be a factor in this non-significant result.
5.4 What impact can social exclusion have on people’s lives? Summary and
Conclusions
In chapter 1 we discussed the way in which the concept of social exclusion has, to a certain extent,
been side-lined in the current policy environment. This has left a gulf, in the terminology to
describe people who are excluded in various aspects of their lives. Often these aspects overlap,
although this is not a prerequisite; for example, it is possible for people to be excluded from social
relationships or civic activities, but not on any other aspect of their lives. The current policy
environment appears to favour the material aspects of exclusion, and less so the other aspects,
particularly those that are most associated with non-material wellbeing that can serve as markers
of social isolation and loneliness. Both loneliness and social isolation are particularly important to
older people, as they can lead to a loss in independence, autonomy, control, self-realisation, and
pleasure – ultimately some of the key ingredients that form quality of life. Poor quality of life should
be a government priority from a moral perspective; however, there may also be an economic case
to be made for maintaining and improving people‟s quality of life, given that low quality of life is
associated with a range of negative health outcomes (for example Bilotta et al 2011).
Our results here demonstrate that the experience of social exclusion is associated with a lower
quality of life. Older people who become excluded from social relationships, cultural activities, civic
activities and access to information, local amenities and decent housing and public transport were
more likely to also experience a decline in their quality of life than older people who did not report
becoming excluded on these domains. We also found that the experience of social exclusion
significantly patterned self-perceived social status, financial uncertainty and unmet social care
needs – across all three of these outcomes being multiply excluded or severely excluded in 2002
(excluded from three domains or more) was associated with lower self-perceived social status,
greater financial uncertainty, and a higher chance of having care needs but not receiving
assistance with these in 2008, compared with not being excluded across any domain. By far the
most persuasive evidence of the damaging outcomes of social exclusion came when examining
the impact of exclusion on loneliness. When we constructed a fixed effects regression model,
which allows us to control for unobserved variables through examining differences within
individuals, we observed that becoming excluded from social relationships increased the likelihood
of reporting loneliness between 2002 and 2008 by a multiple of three, compared to remaining not

Chapter 5: What impact can social exclusion have on people‟s lives?
100
excluded. Overall, becoming excluded from three or more domains of exclusion was also
associated with almost a three-fold increase in the risk of reporting becoming lonely. These results
highlight the possible conflation between new and old policy directions in terms of social exclusion
and the more recent focus on social isolation.
The results in this chapter add to the evidence that social exclusion among older people is
associated with a range of deleterious outcomes, although as discussed in the concluding chapter,
we are careful not to overstate these results, which do not amount to causality per se, although do
highlight some of the likely outcomes of social exclusion. Furthermore, as we also discuss in the
next concluding chapter, we are likely to underestimate the effects of being socially excluded and
while we explore the outcomes of being socially excluded mainly from a health perspective, with
many of the outcomes related to a loss of autonomy and independence, the outcomes of exclusion
are likely to be much more pervasive than is the case presented in this chapter; further research is
needed to unpack many of these relationships.

Chapter 6: Conclusions and policy implications – does social exclusion still matter for older people?
101
Chapter 6: Conclusions and policy implications – does social
exclusion still matter for older people?
6.1 Social exclusion among older people
In this report, we analysed evidence from the English Longitudinal Study of Ageing collected in
2002 and 2008 to examine how patterns of social exclusion changed across time and within
individuals across this period. Using a framework originally developed by Barnes et al (2006), we
conceptualised social exclusion among older people as being exclusion from one of seven
individual domains: i) social relationships; ii) cultural activities; iii) civic activities and access to
information; iv) local amenities; v) decent housing and public transport; vi) common consumer
goods; and vii) financial products. People become socially excluded through the exclusionary
practices of the socially excluded, leading to a detachment in the common values and practices
between the socially included and excluded (Barry 2002). Social exclusion has been
disproportionately explored through the lens of children and young people, and socially excluded
people are those who are unable to reach their full potential across several lifecourse domains. For
older people, social exclusion is viewed from a different theoretical standpoint and pertains more to
maintaining independence and autonomy than to achieving one‟s potential17 – each of the domains
outlined above can be viewed as a necessary component for keeping older people independent
and autonomous. It is also no coincidence that autonomy is also identified as key to maintaining
and preserving quality of life (Hyde et al 2003). Keeping older people independent and
autonomous could be regarded as a societal obligation from a moral and human rights
perspective, several studies also highlight the fiscal benefits that prolonged independence among
older people can lead to (for example Kneale 2011b). While the nature of social exclusion and the
intended outcomes of policies aimed at reducing social exclusion, can be viewed as apolitical in
one sense, as we discussed in Chapter 1, social exclusion as a term has largely fallen by the
policy wayside. This has left a void in terms of policies that explicitly aim to simultaneously improve
material and non-material aspects of older people lives (or claim to do so), and certainly a void in
terms of policies that aim to reduce levels of social exclusion.
17
Although, maintaining independence and autonomy could be viewed as necessary components to fulfilling one‟s potential regardless of lifecourse
stage.

Chapter 6: Conclusions and policy implications – does social exclusion still matter for older people?
102
KEY FINDINGS
1. Levels of Social Exclusion rose slightly between 2002 and 2008 among older
people aged 50 and above. In 2002, 54.4 per cent were not excluded on any
domain, reducing to 52.3 per cent in 2008.
2. Younger „older‟ people (50-59) have higher rates of social exclusion compared to
previous cohorts of the same age. Among those aged 50-54 years, 12.9 per cent
were excluded on two or more domains in 2002 compared to 17.9 per cent in
2008.
3. Rates of exclusion from decent housing and public transport and local amenities
rose sharply between 2002 and 2008 among the population aged 50 and above
as a whole – by over 5 per cent to 15.6 per cent in the case of the former and
16.2 per cent in the case of the latter.
4. As people age, their chances of becoming socially excluded are higher than their
chances of moving out of exclusion or becoming less excluded – 23.9 per cent of
people became more excluded between 2002 and 2008. However, social
exclusion isn‟t inevitable with advancing age, and many older people experience
an improvement in social exclusion status – 18.9 per cent of people became less
excluded, including 19.4 per cent of those aged 80 and over. In addition, many of
the indicators of social exclusion are not fixed, in unexpected ways.
5. Approximately half of people who were excluded from social relationships, local
amenities, and civic activities and access to information in 2002 remained
excluded in 2008.
6. People with earlier experiences of social exclusion (in 2002) are more likely to
report poorer wellbeing, lower self-perceived social status, greater financial
uncertainty, feeling lonely, cutting meals because of financial difficulties, and
receiving no assistance with the activities of daily living among those who
experienced difficulties (in 2008). For example, the odds of an older person who
was excluded on three or more domains of exclusion in 2002 reporting feeling
lonely in 2008 was 4.35 times higher than among those who were not excluded
on any domain.
7. People who became more excluded between 2002 and 2008 were also at greater
risk of reporting a lower quality of life score and of becoming lonely over this time.
Between 2002 and 2008, becoming excluded from social relationships, civic
activities and access to information, cultural activities, and local amenities was

Chapter 6: Conclusions and policy implications – does social exclusion still matter for older people?
103
associated with a lower wellbeing score; becoming excluded from social
relationships and decent housing and public transport was associated with
becoming more lonely between sweeps. For example, becoming excluded from
local amenities over the study period was associated with a 1.7 point decrease in
quality of life score (CASP) over the study period. Becoming excluded from
decent housing and public transport was associated with a two-fold increase in
the odds of becoming lonely.
8. Older men were more likely to be excluded from social relationships; older
women were more likely to be excluded from cultural activities. In 2008, women
had a 57 per cent lower odds of being excluded from social relationships
compared to men although had 44 per cent higher odds of being excluded from
cultural activities.
9. Older people from ethnic minorities are more likely to be excluded from financial
products. In 2008, the odds of an older person from an ethnic minority being
excluded from financial products were three times higher than the odds of a white
older person.
10. Exploring disadvantage from a multifaceted perspective is useful as material and
non-material domains of exclusion predict one another. For example, we
identified links between exclusion from social relationships in 2002 and later
exclusion in 2008 from financial products and common consumer goods – the
odds of people who were excluded from social relationships in 2002 being
excluded from financial products and common consumer goods in 2008 were 2.5
and 2.7 times higher respectively compared to people who were not excluded
from social relationships in 2002.
11. Changes in health between 2002 and 2008 were associated with negative
movement in terms of social exclusion. Deteriorating self-rated health was
associated with becoming excluded from local amenities; taking less exercise
was associated with becoming excluded from social relationships; and becoming
depressed was associated with becoming more excluded overall and becoming
excluded from cultural activities. Differences by changing health status were of a
substantial magnitude – for example, people whose self-rated health changed
from very good to bad/poor were over five times more likely to become excluded
from local amenities compared to people whose health remained very good.
12. Examining changes in care giving status using fixed effects models revealed that
those who assumed care giving duties between 2002 and 2008 were more likely
to become excluded from civic activities and access to information, excluded from
decent housing and public transport, and excluded from common consumer

Chapter 6: Conclusions and policy implications – does social exclusion still matter for older people?
104
goods. Becoming a care giver between 2002 and 2008 was associated with a two
fold increase in the odds of experiencing greater levels of overall social exclusion
between 2002 and 2008.
13. Older people who live in rented accommodation and/or who live alone are more
likely to be socially excluded. Those who transition to live alone are at particularly
elevated risk of becoming socially excluded – for example those who moved from
living alone to living as part of a couple (with no children) exhibited a 68 per cent
reduction in the odds of becoming multiply excluded (excluded on two or more
dimensions) between 2002 and 2008 compared to those who stayed living alone;
conversely, those who moved from being resident in a couple household to living
alone were over three times more likely to become multiply excluded over this
period.
6.2 Describing and understanding a rise in the number of socially excluded older
people
Across just over half a decade between 2002 and 2008, our cross-sectional results demonstrated
that the number of older people aged 50 and above who were socially excluded in any form rose
by two per cent. Most of the two per cent rise in the numbers excluded in some form between 2002
and 2008 was solely attributable to a rise in the numbers excluded on one domain alone – the
numbers excluded on two domains (multiply excluded) or three domains (severely excluded) were
unchanged or slightly lower among the population aged 50 and over as a whole.
As is the case in some of the literature (Burchardt et al 1999), few people were simultaneously
disadvantaged on all domains of exclusion (none in 2008), and furthermore, exclusion was a
relatively fluid concept, with people moving in and out of exclusion between sweeps. It should also
be noted that this is dependent on where the threshold of exclusion is set – while in these analyses
we adopt thresholds set in the literature that classify around ten per cent of people as being
excluded on any given domain, further research may find that this threshold should be set at a
different point.
This rise in the numbers excluded on one domain was mainly attributable to the substantial rises in
the number of people aged 50-54 years and 55-59 years who were socially excluded, as well as
rises in those excluded from basic services and excluded from decent housing and public
transport. Conversely, we observed substantial declines in the number of older people excluded
from common consumer goods, with the proportion excluded declining by over half during a
relatively short period. In terms of exclusion from decent housing and public transport, older people
were most likely to report difficulties in accessing public transport that was convenient and
affordable. The rise in exclusion from basic services was mainly attributable to older people
reporting greater difficulties in accessing local shopping services and local hospitals. Accessible
public transport and the availability of local services are key tenets of lifetime neighbourhoods –

Chapter 6: Conclusions and policy implications – does social exclusion still matter for older people?
105
neighbourhoods that support people of all ages (Harding 2007). This could indicate that instead of
seeing neighbourhoods becoming more accessible to older people, that the reverse was true in
terms of these basic services and public transport.
However, it should also be noted that for other domains of social exclusion, the picture changed
very little, and that levels of exclusion remained around the ten per cent mark. This was true for
exclusion from civic activities and access to information, where there was a half per cent decrease
in the proportion aged 50 and above excluded. When we investigated this further, we found that
rates of civic participation had changed little, although there had been more substantial changes
for patterns of accessing information. For the majority of the sample, newspaper readership had
declined, although there had been a compensatory rise in internet usage, pointing at changes in
the way the older people access information. The exception to this rule was found among the
oldest age groups, where newspaper readership had declined with no compensatory rise in
internet usage – for example there was just a 0.2 per cent rise in the proportion of people aged 85
and above using the internet in 2008 compared to the same age group in 2002. Likewise, levels of
exclusion from cultural activities had changed very little, and there were only comparatively modest
declines in the proportion aged 50 and over who were excluded from social relationships and
financial products. Furthermore, as we discuss below, longitudinal evidence highlighted that as
people age, they are more likely to become excluded than to transition from being excluded.
In summary:
Levels of exclusion rose slightly, mainly due to:
o Rises in older people excluded on one domain,
o Rises in older people excluded from basic services
o Rises in older people excluded from decent housing and public transport
o Rises in exclusion among older people aged 50-54 and some aged 55-59 who were
new to the study
6.3 Ageing and Social Exclusion – Why we are still not getting it right and identifying
future causes for concern
The state of social exclusion exhibited a remarkable degree of fluidity, and relatively high numbers
of people transitioned in and out of being classified as socially excluded. For the majority,
however, this fluidity was associated with an increase in the likelihood of becoming socially
excluded. Over the half decade between 2008 and 2002 among individuals, around 24 per cent of
those aged 50 and above became more socially excluded in some form, and 19 per cent became
less excluded in some form. However, this varied substantially by age group. Those aged 50-59 in
2002, approximately equal numbers became more excluded (22%) as became less excluded
(21%); for those aged 80+, over twice as many became more excluded (35%) as became less
excluded (19%). There was also considerable variation by domain of exclusion. In terms of
exclusion from decent housing and public transport, there were indications that those in the oldest
age groups became less excluded from this domain over time. This was the exception to the rule,
and for the majority of the individual domains of social exclusion, the evidence suggested that for
all people aged 50 and above, that the risk of becoming excluded was either approximately equal

Chapter 6: Conclusions and policy implications – does social exclusion still matter for older people?
106
or higher than the chance of becoming not excluded - for those in the oldest age groups the risk of
becoming more excluded over time in most cases far outweighed the chance of becoming less
excluded. Generally, with the exception of exclusion from decent housing and public transport,
those in the oldest age groups were already more excluded than younger age groups in 2002, and
with the passage of time to 2008, became excluded further.
We were also interested in the way in which people who were socially excluded in 2002 remained
excluded in 2008. We found that those who were excluded from social relationships, local
amenities, and civic activities and access to information were most likely to remain excluded –
around half of those excluded in 2002. In addition, some groups were particularly likely to remain
excluded; for example, almost two-thirds of people who were excluded from social relationships
and lived alone in 2002 were still excluded in 2008. For these domains in particular, social
exclusion is a persistent state (or „sticky‟ state) for a substantial portion of older people with earlier
exposures – here the analyses demonstrate that approximately half of people excluded on these
domains are still excluded in the same way six years later. Six years of experiencing exclusion on
any one of these domains is likely to have a substantial negative impact on older people‟s
outcomes, not least their quality of life. Furthermore, almost two-thirds of people who were
excluded on at least one domain in 2002 (64.3%) were also excluded on at least one domain of
social exclusion in 2008. This evidence builds on the earlier theme that one of the best predictors
of social exclusion at any given point is previous experience of social exclusion. These results
highlight the specific domains of exclusion that are most persistent among individuals across time.
Should policy-makers regard persistent exclusion as a priority, these results suggest that
interventions should focus on these domains; however, as was outlined in the earlier chapters,
levels of persistent exclusion not only differ between domains, they also differ according to older
people‟s characteristics.
It is clear that the risk of social exclusion and the ageing process are intimately twined with one
another. Transitions that characteristically mark the ageing process for many – for example
retirement, widowhood, or loss of health – can culminate in a loss of independence and autonomy
that is suggestive of synonymy with social exclusion. From the perspective of policy-makers, the
trend towards greater levels of social exclusion with time and age suggests that society is still
unable to prevent older people from becoming socially excluded. In terms of the domain that bucks
this trend, exclusion from decent housing and public transport, where the oldest age groups
actually become less excluded over time, we can consider several explanations as to why those in
post-retirement years enjoy lower levels of exclusion. Firstly, in terms of public transport, those in
post-retirement years are eligible for bus passes, which offer free bus travel. They are also eligible
for railcards which offer a third off the cost of standard fares. Given that cost and convenience
were some of the main barriers to using public transport (Chapter 3), the combination of
discounted or free travel, as well as the convenience of not being restricted to rush hour travel for
work, could be one set of explanatory factors for the distinction between the exclusion rates
between the pre and post-retirement age groups. Similarly, while many older people do continue to
live in substandard housing, many agencies exist to help older homeowners and private sector
tenants to carry out essential repairs to their homes. These services are often provided at a
discounted rate, although people below pensionable age are generally not eligible. Perhaps it
could be argued that results reflect the fact that not one of the other domains of social exclusion

Chapter 6: Conclusions and policy implications – does social exclusion still matter for older people?
107
have such transparent policies, discounts, and incentives that help people, especially those in the
oldest age groups, from becoming excluded with age.
Nevertheless, it is important not to pitch the results for exclusion from decent housing and public
transport as necessarily being exemplary of the success of older people‟s policies – they could
simply highlight that those approaching retirement may have been overlooked in policy terms and
the failure of policy to consider ageing as a process. Among those in the younger age groups of
this study (50-54 and 55-59 years), successive cohorts appear to be faring less well, with those in
2008 more excluded than those in 2002 in terms of exclusion from cultural activities, basic
services, financial products, and decent housing and public transport. Rising levels of exclusion for
this group does not bode well for plans for keeping older people active for longer in the workforce,
particularly given the negative impacts of social exclusion on health and wellbeing. Some of the
underlying mechanisms in explaining this trend may derive from changes in lifecourse transitions
exhibited between these age cohorts that may impact on family caring patterns and patterns of
financial support. For example, among those aged 50-54 years in 2002, between 76-81 per cent
would have had at least one child by the age of 30; for those of the same age in 2008, 69-73 per
cent would have had a child by the age of 30 (Office for National Statistics 2009). The higher rates
of postponement of fertility among the more recent cohort could suggest that they are more likely
to be supporting financially dependent children. The more recent cohort may also be more likely to
be supporting dependent parents through changes in longevity – life expectancy rose from 80.5
years to 82.3 for women and 77.6 from 75.8 years for men even over the short six year period
between interviews (Office for National Statistics 2010). Equally, period effects manifested as
changes in the labour markets and housing markets may act independently, or may amplify the
cohort differences described above. When we control for financial status and care giving in our
models, the effect of age attenuates somewhat for some individual domains. However, we
continue to observe an effect where those aged 50-54 years were at high risk of multiple and
severe exclusion in 2008.
The longitudinal results suggest that the risk of exclusion increases with age, although it is
important to note that social exclusion is not inevitable with advanced age, and substantial
numbers of people in the oldest groups actually became less excluded over time. Further research
will shed light on the characteristics and life course events that predict such transitions – our
results help to shed light on the predictors of exclusion, but not so much the characteristics or
events that help people stay resilient and out of social exclusion, or actually develop resilience and
move from being excluded. Although the population aged 80+, for example, were less excluded in
2002 than the population of the same age in 2008, the longitudinal evidence could suggest that
this group is still the most vulnerable to becoming excluded over time, and overall as a society, we
are still unable to prevent increasing age being synonymous with increasing levels of social
exclusion. If the cost of an ageing society is to be met, at least in part, through keeping older
people independent and autonomous for longer, then these results are of concern.
In summary:
The new 50-54 years cohort appeared particularly vulnerable to being socially excluded
The 80+ age group was the most vulnerable to becoming more socially excluded over the
study period, with high numbers becoming more socially excluded

Chapter 6: Conclusions and policy implications – does social exclusion still matter for older people?
108
Successive cohorts of the youngest age group in the study (50-54 years) appeared to become
more socially excluded over the study period
6.4 Who is at greatest risk of social exclusion among those aged 50 and above?
In this study we included many factors in our models and described the results for many of these.
Unsurprisingly, we found that those with a social profile that is usually associated with material
disadvantage or poverty were statistically significantly more likely to experience social exclusion.
For example, we found that non-white older people were over three times as likely to be excluded
from financial products as white older people in 2008. This led us to speculate on issues of access
to financial products through information, affordability, and physical accessibility, as well as issues
related to discriminatory practices. Similarly, those in rented accommodation were four times more
likely to be excluded from financial products in 2008. This suggests that those with characteristics
known to be disadvantageous across other stages of the lifecourse were also disadvantaged in
older age – exclusion from financial products serves not only as a marker of poorer financial
circumstances, but also as a marker that older people will be less able to alter their financial
circumstances and to weather financial shocks. When we analyse movement in terms of exclusion
status longitudinally, we find that those who were in social housing in 2002 were 87 per cent more
likely to become excluded from decent housing and public transport, and three times as likely to
become excluded from financial products, than those in outright owner occupied housing by 2008.
These results suggest that housing tenure is a good predictor of older people who will experience
difficulties in either accessing information about financial products or difficulties in being granted
access to financial products, as well as those who are likely to experience difficulties in accessing
good housing or public transport.
Older people who were depressed in 2002 were twice as likely to be excluded from social
relationships in 2008, compared to older people who were not depressed in 2002. We also find
strong relationships over time between poorer self-rated health and a number of individual
domains of exclusion. Our analyses indicated that for older people, the effect of poor self-rated
health is to raise the risk of exclusion from services and amenities in particular, while the effect of
poorer mental health raises the risk of exclusion from social relationships. These longitudinal
models offered compelling evidence given that they included previous exclusion status. Early
models did not find caring duties to be especially strongly associated with social exclusion;
however, when we explored fixed effects models, we found that becoming a care giver between
2002 and 2008 was statistically significantly associated with becoming excluded from civic
activities and access to information, exclusion from decent housing and public transport, and
exclusion from common consumer goods. The fixed effects models controlled for unobserved
variables that may have led to the spurious non-significant results in earlier logistic regression
models.
Not all of our findings were expected. Longitudinally, we find men and women are not significantly
different in their risk of becoming multiply or severely excluded, but women are around 33 per cent
less likely to be excluded from social relationships and 30 per cent more likely to be excluded from
cultural activities in 2008, regardless of their observed characteristics in 2002. However, it should
be noted that women are more likely to possess other disadvantageous characteristics such as

Chapter 6: Conclusions and policy implications – does social exclusion still matter for older people?
109
low education, low income, high levels of living alone, and are more likely to live in rented
accommodation. Our null effect in terms of gender and overall exclusion occurs despite that many
older women will have spent the majority of their lives in a societally marginalised position,
certainly in terms of labour market opportunities. Men‟s higher likelihood of being excluded from
social relationships is being addressed through initiatives such as „men in sheds‟, based on a
successful Australian model of community activity, informal learning, and social participation
(Golding 2011). Our findings appear to suggest that such initiatives should expand in terms of
geographic scope. Similarly, exclusion from cultural activities suggests that there is greater scope
for offering incentives and discounts to encourage female participation in cultural activities, as well
as a need for further research to better understand the mechanisms of gender differences in
exclusion from cultural activities.
These analyses highlight which factors are important in predicting future patterns of social
exclusion among older people; however, it is beyond the scope of this report to discuss all the
factors individually that were included in our models. Nevertheless, we can conclude that levels of
social exclusion overall appear to be rising, in ways discussed earlier, and that for most domains,
as people age they are more likely to become excluded, with physical and mental health status,
gender, housing tenure, highest qualification, and living arrangements, among others, significantly
moderating the risk of becoming excluded with age.
Many other factors that are likely to be significant explanatory components are absent from our
models, for example widowhood status, sexual orientation, a number of neighbourhood level
variables, and many others. Our fixed effects models assume that these unobserved variables
were fixed between 2002 and 2008; these models find that changes in health between 2002 and
2008 were associated with negative movement in terms of social exclusion, as were transitions to
living alone. Deteriorating self-rated health was associated with becoming excluded from local
amenities; taking less exercise was associated with becoming excluded from social relationships;
and becoming depressed was associated with becoming more excluded overall and becoming
excluded from cultural activities. In addition, becoming a carer (described earlier) and moving to
live alone was associated with increased odds of becoming excluded from social relationships and
becoming excluded from financial products.
In summary, what our analyses do demonstrate successfully is the complexity of both measuring
and analysing social exclusion, a challenge which we have attempted to address in this report,
although we acknowledge there is ample room for improvement.
6.5 Why does social exclusion still matter?
One of the strongest predictors of exclusion in 2008 was previous exclusion status from the same
domain; this was particularly true for exclusion from common consumer goods, civic activities and
access to information, and social relationships. However, we also found a number of instances
where non-material domains of social exclusion were significantly associated with material
domains of social exclusion (and vice versa). This lends weight to an argument for the
consideration of non-material domains of exclusion in assessing disadvantage, perhaps

Chapter 6: Conclusions and policy implications – does social exclusion still matter for older people?
110
particularly in the case of older people where non-material domains are enablers to maintaining
independence.
However, we presented further evidence of the importance of assessing disadvantage in a
multifaceted way, as is the case for social exclusion, through examining the impact of earlier
exposure to different domains of social exclusion on outcomes measured in 2008. Our final set of
results in Chapter 5 demonstrated that the experience of social exclusion is associated with a
lower quality of life. Essentially, when these aspects of older people‟s lives deteriorate, they
directly lead to a decrease in quality of life. While composing an economic argument for the
benefits of maintaining quality of life among older people is challenging, there is a transparent
moral argument for doing so. In addition, through impacting on health outcomes (for example
Bilotta et al 2011), but also in other ways through keeping older people actively contributing
through volunteering or providing care, policy-makers should be prepared to accept that
maintaining and raising quality of life is a necessity not a luxury for older people, and the wider
community and society. In addition, we also demonstrated that people with earlier experiences of
social exclusion (in 2002) are more likely in 2008 to report poorer wellbeing, lower self-perceived
social status, greater financial uncertainty, feeling lonely, cutting meals, and receiving no
assistance with the activities of daily living (among those who were most likely to be in need of
assistance). These results suggest that the impact of being socially excluded pervades outcomes
reflecting both material and non-material circumstances. We also present evidence from fixed
effects models that examine changes in these outcomes, finding that overall exclusion was a
significant predictor of wellbeing and loneliness. Between 2002 and 2008, becoming excluded from
social relationships, civic activities and access to information, cultural activities, and local
amenities was associated with a lower wellbeing score; becoming excluded from social
relationships and decent housing and public transport was associated with becoming lonelier
between sweeps.
In this research, we only examined a limited set of outcomes on older people of being socially
excluded– there are many more. However, our evidence gives a persuasive argument of the need
to consider both material and non-material domains of older people‟s lives to understand the
outcomes of older people. We also noted the close relationships between material and non-
material domains over time, and how earlier exposure to exclusion on non-material domains was
associated with a higher likelihood of exclusion from a material domain at a later point, and vice
versa. These findings highlight the importance of acknowledging the multifaceted nature of
disadvantage, as was the case with the notion of social exclusion. Social exclusion, as a term, has
virtually disappeared from current national policy, being associated with the previous Labour
government, although we would emphasise that the notion of a relationship between material and
non-material domains is non-partisan. It would not be an accurate representation to suggest that a
recognition of the importance of non-material factors has disappeared from public policy altogether
- indeed the present government is set to measure the nation‟s happiness and wellbeing, as well
as planning to ensure „social justice‟ for all. However, the advantage of social exclusion as a policy
focus was the full recognition to the multifaceted nature of disadvantage, as well as the equal
weight placed on material and non-material domains. These advantages may explain why the
concept and terminology remain in use in European and UN policy. Given that our results
emphasise the usefulness of social exclusion in understanding patterns of disadvantage, and for
Chapter 6: Conclusions and policy implications – does social exclusion still matter for older people?
111
older people can represent a shorthand way of expressing the domains of social participation
necessary to maintain independence and autonomy, the current UK policy void in this respect and
the abandonment of the notion of social exclusion, is likely to be at the detriment of older people.
6.6 What are the limitations to the research?
In this research we make the following broad points: that social exclusion increased slightly
between survey points and that social exclusion remains a valid concept because of both the
irrefutable link between material and non-material domains of poverty and because of the
association between social exclusion and a number of outcomes including wellbeing. However,
there are some limitations to the research that serve to caveat our results. One of the main
limitations of the research is that attrition, which as discussed in Chapter 2 is likely related to social
exclusion, serves to both limit our sample size and potentially make the sample unrepresentative.
Attrition weights will partially correct for this; however, in this report, our longitudinal analyses in
particular are likely to have led to an underestimate in the level social exclusion as well as the
numbers who became socially excluded. The limited sample size also means that the effect of
social exclusion among small groups of older people, such as non-white older people or those in
privately rented accommodation, was likely to have been overlooked or underestimated because
of a lack of statistical power. We have also noted throughout that our models are likely to have
omitted a number of variables that may help to further understand patterns of social exclusion, but
whose omission could bias our estimates, although our fixed effects models help to alleviate
potential bias that this may cause.
Three further limitations are worthy of mention. Firstly, while we are careful to avoid the language
of causality when discussing our results, it is inevitable that some intonation of causality may be
derived from our results. As was noted earlier in some of the chapters exploring the results
however, we are not able to fully ascertain whether social exclusion causes deleterious outcomes
or whether deleterious factors cause social exclusion. We referred to this as something of a
chicken and egg parable and it is likely that there is something of a symbiotic relationship between
social exclusion and negative outcomes – in this sense social exclusion is both a marker and
influencer of negative outcomes. Secondly, our conception of social exclusion, while based on an
existing framework in the literature (see Barnes et al 2006), is still arbitrary to some extent. The
original framework defined those with the ten per cent lowest scores on any given domain as being
socially excluded, and while the use of thresholds is common in social exclusion research, older
people themselves may perceive that the location of these threshold points should be located at
very different points. This may be particularly relevant given that we use the same thresholds for
the whole of the over 50 population, despite the fact that this population is very heterogeneous. In
addition, our use of thresholds, particularly in our longitudinal analyses, may overlook movement
within these – for example and older person may have experienced an improvement in terms of
their social exclusion score, although may still be classified as excluded at both interview points
because of the cut-off point used for defining those as socially excluded. Thirdly, our domains of
exclusion, are in part driven by theory, but also partially reflect the availability of the data available
in ELSA. As such, some indicators which would have been useful in constructing our domains of

Chapter 6: Conclusions and policy implications – does social exclusion still matter for older people?
112
social exclusion, such as an indicator of going to a pub or social club in constructing our measure
of exclusion from cultural activities, were absent.
While these potential limitations do represent possible caveats to the results, they do not detract
from the recommendations below. In addition, it is intended that these results will serve as a
springboard for further investigation – for example there is further scope for understanding change
within individuals through including data from 2004 and 2006 in our fixed effects models. As was
stated earlier, we suspect that most of these limitations lead to an underestimate of the level and
consequences of social exclusion for older people.
6.7 How should policy-makers respond to these results?
6.7.1 Shift policy directions away from ‘older people’s policies’ to ‘ageing policies’ in order
to tackle increasing exclusion among middle aged people
Older people approaching retirement (50-54) appear to be worse off in 2008 compared to 2002.
This is a group that is facing the brunt of increases in state pension age. This is also a group that
is likely to be facing the brunt of some demographic changes including caring for parents or older
relatives who are living longer but not necessarily healthier, while simultaneously providing
resources for longer periods to their adult children. Policy-makers have recently identified the
squeezed middle classes as an at risk group (Independent 2011) – this analysis suggests that the
squeezed middle age group may also be another at risk group. Although our models accounted for
care giving and number of children, our analyses did not account for the potentially increasingly
dependent nature of these relationships, which may be instrumental in explaining the elevated
levels of exclusion among this age group. Alternatively, changes in working patterns may be
another explanatory factor in accounting for the rise in exclusion. However, there is little in the way
of clear policies aimed at steering this pre-retirement group towards a better future in older age.
Without further research and action, it is questionable whether the previous gains we have
witnessed in terms of lower levels of exclusion among those of pensionable age will be replicated.
As such we would call for:
- older persons’ policies to start earlier, and take on the mantle of ‘ageing’ as opposed to
‘older people’.
Such a shift could also have benefits in terms acknowledging the diversity of older people and in
recognising that ageing is a dynamic process that occurs among both those who have already
reached what would be conventionally recognised as old age and those who have not.
6.7.2 Allocate the task of measuring and developing strategies to overcome material and
non-material disadvantage simultaneously to a specific unit or team within government
The link between material and non-material domains needs to be maintained and reflected in all
policy, for older people and more widely among people of all ages. Our analysis in this report
highlights the way in which non-material domains of social exclusion can act as risk factors for
later experiences of material domains of social exclusion, and vice versa. However, non-material
domains and services are often viewed as non-essential by policy-makers, both in central and

Chapter 6: Conclusions and policy implications – does social exclusion still matter for older people?
113
local government. For example, it is resources that can potentially help to lower levels of exclusion
from civic activities and access to information and that can help preserve levels of social
relationships, local amenities, and cultural activities, which are the first to face cuts in funding in
times of austerity. The analysis in this report presents evidence which suggests that such an
approach may hold long-term negative consequences in terms of the levels of material exclusion –
becoming excluded from non-material domains of social exclusion is a risk factor for becoming
excluded from material domains. Therefore, here we view social exclusion as an
apolitical/academic construct that is useful for policy-makers as a short-hand way of describing
people who face a combination of material and non-material deprivation.
However, at the beginning of this report we outlined that despite „social exclusion‟ as a term and
construct predating the previous Labour government, the current government has disbanded the
Social Exclusion Unit, has dropped the terminology of „social exclusion‟, and has left a void in its
place. Therefore, what appears to be lacking in current government policy is a specific structural
framework that allocates responsibility for the measurement and reduction of non-material and
material disadvantage in a simultaneous, systematic and cohesive way. Whether the government
sticks with the (arguably apolitical) term of social exclusion, or develops new terminology is
irrelevant to our call for:
- the allocation of the task of measuring and developing strategies to overcome material
and non-material disadvantage simultaneously and cohesively to a specific unit or team
within government
Levels of social exclusion among those aged 65+ in 2002 compared with the same age group in
2008 declined – these were age groups that were the focus of policies aimed at tackling social
exclusion among older people. However, policies were not aimed as younger older people (50-64),
who exhibited an increase in exclusion over the same period, reinforcing our recommendation
above.
6.7.3 Improve planning of neighbourhoods for people of all ages to reduce levels of
exclusion from local amenities and decent housing and public transport
Creating neighbourhoods for people for all ages gathered some policy momentum under the final
years of the previous government, but made relatively little impact on the ground, particularly once
the full effects of the financial crisis and recession became apparent (Kneale 2011c). The new
coalition government has transformed the way that communities will be developed in future.
However, much of the focus has been on housing, and there has been little mention of how
neighbourhoods per se should be developed to support people of all ages. For example, the
National Planning Policy Framework, which sets out principles for developing neighbourhood
development plans, addresses the needs of different age groups, and the challenge of
demographic change, only through the guise of housing. There is no mention of the need to plan
neighbourhoods to better facilitate people of all ages to traverse the local neighbourhood and to be
able to access the full range of amenities needed to prevent deprivation. Building houses to
support people of all ages but not neighbourhoods is a false errand. Our results here showed
increasing levels of exclusion from decent housing and public transport, with most of the increase

Chapter 6: Conclusions and policy implications – does social exclusion still matter for older people?
114
attributable to increases in difficulties in accessing public transport. Similarly, we also presented
evidence of increasing difficulties in accessing local amenities, particularly in accessing local
shopping facilities and hospitals. We would therefore call for the next National Planning Policy
Framework (post-2012) to explicitly address the issue of neighbourhood design, including public
transport and community facilities and amenities to ensure:
- better planning of neighbourhoods for people of all ages to reduce levels of exclusion
from local amenities and decent housing and public transport
Given that accessing local hospitals was one of the amenities that respondents reported
increasing difficulties in accessing, better neighbourhood planning may necessitate the
involvement of a greater range of stakeholders than is usually the case, including the health
sector. The forthcoming changes in health service delivery may provide opportunities for greater
collaboration and integration of health services in neighbourhood design.
6.7.4 Instigate further research into the trigger factors and roles of public policy and
services in helping older people move from being socially excluded
This report identified that social exclusion was not inevitable or irreversible with age. We identified
several instances where older individuals became less excluded between 2002 and 2008.
However, while we identify many of the characteristics associated with becoming more (or less)
excluded over time, there is considerable further work to identify other trigger factors associated
with positive movement in terms of social exclusion. This work could better link policy
developments and initiatives to examine evidence for improvements in levels of exclusion. We
view this report as uncovering many trends worthy of further investigation and requiring:
- further research into the trigger factors and roles of public policy and services in helping
older people move from being socially excluded
6.7.5 Encourage greater development of outreach provision to reach the hardest to reach
before crises occur
Our analyses highlight that those who were socially excluded in 2002 were associated with higher
levels of loneliness, higher levels of cutting meals, and were more likely to receive no assistance
with the activities of daily living, despite ostensibly requiring this assistance. Overall, our analyses
highlight the precarious position of those who are socially excluded occupy in accessing the
necessary services and support that they need. Our concern here is, given that socially excluded
people, in theoretical and pragmatic terms, are those who are likely to be less engaged with civic
structures and have access to information; are those who have difficulties in physically and
economically accessing social, financial, cultural and civic structures and institutions; and are also
likely to have lower levels of negotiation skills and fewer avenues of social support to help in
accessing services and support; that socially excluded people will remain at higher risk of failing to
receive the services and support that they need without a programme of engagement and
outreach. Loneliness, cutting meals, and not receiving care to help with the activities of daily living

Chapter 6: Conclusions and policy implications – does social exclusion still matter for older people?
115
are negative outcomes in themselves, but can also be viewed as precursors of much more
serious, and costly, events.
Providing services is only part of the solution; for socially excluded people, who are detached from
many of the institutions and structures that are considered „standard‟ among socially included
people, these services are redundant without supplementary outreach programmes. Outreach
programmes could also be aligned with other government policies, such as the move towards the
Big Society, and could encourage more targeted volunteering and advocacy to ensure and
encourage those with fewer resources receive the services and support that they may need. We
would therefore welcome the development of:
- greater development of outreach provision to reach the hardest to reach before crises
occur
6.7.6 Support programmes to encourage the development/uptake of financial products
among disadvantaged older people
Disadvantaged groups are at particular risk of exclusion from financial products – two groups
identified in this research included those resident in social housing and those from black and
minority ethnic groups. In terms of the latter result, further research is needed to investigate which
particular ethnic groups were at elevated risk of exclusion from financial products. However, our
findings are particularly concerning as they signal that those with the lowest levels of financial
resources are also less likely to be able to manage their resources in a way that could enable them
to weather financial shocks. This level of financial exclusion highlights the need for the financial
sector to engage with older people on low incomes to overcome problems in accessibility. It is
unclear from these results whether problems in accessibility include direct criteria on
income/wealth eligibility or whether the issues lie with other factors such as the physical
accessibility of financial institutions for those from more disadvantaged groups. Further research is
needed to tease out these unresolved issues, and specifically to ascertain whether new sets of
financial products need to be developed, or whether criteria on existing products need to be
modified, or if financial institutions need to provide better information and services around existing
products. Nevertheless, we would encourage policy-makers to work with the financial services
sector to:
- support programmes to encourage the development/uptake of financial products among
disadvantaged older people
6.7.7 Development of a widowhood strategy
Our results suggest that transitioning to living alone from being part of a couple has devastating
effects in terms of increasing the likelihood of overall exclusion. We found that moving from living
in a couple household (no children) to living alone between 2002 and 2008 raised the odds of
becoming multiply excluded three-fold. For many respondents, this change would signal
occurrences of widowhood, and less so divorce or separation (although divorce rates are thought
to be increasing among older people). Therefore, we would recommend the development of a

Chapter 6: Conclusions and policy implications – does social exclusion still matter for older people?
116
specific set of strategies and policies to help older people adjust to the loss of a partner, who in
some cases will have been a life-long partner. This may help reduce the consequential loss social
status that can follow widowhood, which in these analyses is found to substantially raise the risk of
social exclusion.
- development of a widowhood strategy
6.7.8 Provision of additional support for carers
Unpaid care is the bedrock of the health and social care system. Analyses by Carers UK suggest
that the economic contribution of carers is as high as £119 billion annually (Buckner and Yeandle
2011). Despite the invaluable work of carers, we find that those who became carers between 2002
and 2008 were at a substantially higher risk of becoming socially excluded compared to those who
did not become carers. These results suggest that without the:
- provision of additional support for carers
that carers will continue to be socially excluded. This not only has implications for the quality of life
of the carer, but also will likely impact on the standard of care delivered to the recipient and the
sustainability of individual‟s long-term informal care arrangements.
6.7.9 Greater investment in physical exercise services for older people with specific focus
on how to retain older people in programmes of physical exercise
We find that older people who decreased the level of physical exercise that they took are not only
more likely to develop health problems, but are likely to become more socially excluded. Greater
investment in resources promoting physical exercise for older people not only represents a
relatively cost effective way of improving health; it could also have wider benefits in helping to
reduce levels of social exclusion. In particular, many of the arguments for promoting physical
exercise and a healthy lifestyle made to older people in public health campaigns are made around
the health implications; an alternative message from these analyses is to highlight the way in
which decreasing physical exercise can also negatively impact on people‟s social relationships and
the way in which they access local amenities. We would therefore highlight the positive impact on
people‟s health and levels of social exclusion that the following, relatively cheap, measure could
have:
- greater investment in physical exercise services for older people with specific focus on
how to retain older people in programmes of physical exercise
6.7.10 Reduction of gender inequalities in social exclusion through expansion of existing
intervention programmes
These analyses have highlighted gender differentials in exclusion from social relationships and
cultural activities. Men are much more likely than women to be excluded from social relationships
while women are much more likely to be excluded from cultural activities. In the case of exclusion
from social relationships, greater geographic expansion of programmes that aim to foster social

Chapter 6: Conclusions and policy implications – does social exclusion still matter for older people?
117
relationships for men such as the „men-in-sheds‟ initiative could have measureable benefits in
reducing men‟s elevated risk of becoming excluded from social relationships. Similarly for older
women, further research to understand the underlying mechanisms may be needed before trialling
interventions aimed at reducing women‟s elevated levels of exclusion from cultural activities. Such
interventions could build on the existing offers and incentives available to older people, such as
discounted or free admission. The results here suggest that changes in the activities on offer, the
way that these are run, or the way in which they are marketed to attract greater numbers of older
women, may have an impact in reducing gender differentials in exclusion.
- reduction of gender inequalities in social exclusion through expansion of existing
intervention programmes

Appendices
118
Appendix 1 - Glossary
Domains of exclusion: (also referred to as components at times) refer to individual elements of
social exclusion such as exclusion from financial products or social relationships
Multiple exclusion: Defined here as when an older person is excluded on two domains
Severe exclusion: Defined here as when an older person is excluded on three or more domains
Overall exclusion: A shorthand term used to denote any form of social exclusion and not referring
to a specific domain.
Cross-sectional: Refers to analysis that only explores data from 2002 or 2008, and does not
consider change within individuals
Longitudinal: Refers to analysis that explores change within individuals between 2008 and 2008.
Binary Logistic Regression: A model that aims to understand the relative effect of different
factors simultaneously on the probability of experiencing a certain condition versus not.
Multinomial Logistic Regression: A model that aims to understand the relative effect of different
factors simultaneously on the probability of experiencing a certain circumstance versus not, where
the circumstance is one of a number of possible outcomes.
Ordinal Logistic Regression: Where the dependent variable is measured on a scale this model
aims to understand the relative effect of different factors simultaneously on the probability of
experiencing a higher or lower value on the scale.
Odds Ratio (OR): Deriving from a binary or ordinal logistic regression model, a way of expressing
the relative probability that a group will experience a certain condition versus not – values over one
suggest that the group is more likely to experience an event; values below one suggest the group
is less likely.
Relative Risk Ratio (RRR): Deriving from a multinomial logistic regression model and similar in
interpretation to an odds ratio, a way of expressing the relative probability that a group will
experience a certain condition versus not – values over one suggest that the group is more likely
to experience an event; values below one suggest the group is less likely.

Appendices
119
References
Agulnik, P., Burchardt, T. and Evans, M. (2002). Response and Prevention in the British Welfare
State in Hills, J., Le Grande, J. & Piachaud, D. (Eds.) Understanding SocialExclusion. Oxford,
Oxford University Press.
Aldridge, H., Parekh, A., MacInnes, T. and Kenway, P. (2011) Monitoring Poverty and Social
Exclusion. York: Joseph Rowntree Foundation.
Annesley, C (2000) „Welfare reform and social exclusion‟, paper presented at Political Studies
Association Conference, April 2000, available at www.psa.ac.uk/cps/2000/Annesley%20Claire.pdf.
Arksey, H., Corden, A., Glendinning, C., Hirst, M. (2008) Managing money in later life: help from
relatives and friends. Benefits 16(1):47-59
Bamford, S-M (2011) Women and Dementia – Not Forgotten. London: International Longevity
Centre.
Banks, J., Muriel, A., Smith, J. P. (2010) Attrition and Health in Ageing Studies: Evidence from
ELSA and HRS. Institute for the Study of Labour Discussion Papers. IZA DP No. 5161. Bonn,
Germany: Institute for the Study of Labour
Barnes, M., Heady, C, Millar, J., Middleton, S. Tsakloglou, P. and Room, G. (2002) Poverty and
social exclusion in Europe. Cheltenham: Edward Elgar.
Barnes, M. (2005) Social Exclusion in Great Britain: An Empirical Investigation and Comparison
with the EU. Aldershot, Hants: Ashgate Publishing
Barnes, M.,Blom, A., Cox, K., Lessof, C., Walker, A. (2006) The Social Exclusion of Older People:
Evidence from the first wave of the English Longitudinal Study of Ageing (ELSA). London: Office of
the Deputy Prime Minister, Social Exclusion Unit.
Barry, B. (2002) Social Exclusion, Social Isolation, and the Distribution of Income. in Hills, J., Le
Grande, J. & Piachaud, D. (Eds.) Understanding SocialExclusion. Oxford, Oxford University
Press.
Bilotta, C., Bowling, A., Nicolini, P., Casè, A., Pina, G., Rossi, S. V. and
Vergani, C. (2011) Older People‟s Quality of Life (OPQOL) scores and adverse health outcomes at
a one-year follow-up. A prospective cohort study on older outpatients
living in the community in Italy. Health and Quality of Life Outcomes, 9:72
http://www.hqlo.com/content/9/1/72
Buckner, L., Yeandle, S. (2011) Valuing Carers 2011. Carers UK, London, UK
Burchardt, T, Le Grand, J., Piachaud, D. (1999) Social Exclusion in Britain 1991-1995 Social
Policy and Administration 33(3): 227-244
Burchardt, T., Le Grande, J. & Piachaud, D. (2002a) Degrees of Exclusion: Developing a Dynamic,
Multidimensional Measure. in Hills, J., Le Grande, J. & Piachaud, D. (Eds.) Understanding Social
Exclusion. Oxford, Oxford University Press.

Appendices
120
Burchardt, T., Le Grande, J. & Piachaud, D. (2002b) Introduction. in Hills, J., Le Grande, J. &
Piachaud, D. (Eds.) Understanding Social Exclusion. Oxford, Oxford University Press.
Burns, V. F., Lavoie, J-P. & Rose, D. (2012) Revisiting the Role of Neighbourhood Change in
Social Exclusion and Inclusion of Older People. Journal of Aging
http://www.hindawi.com/journals/jar/2012/148287/
Bynner, J. & Joshi, H. (2007) Building the Evidence Base from Longitudinal Data: The Aims,
Content and Achievements of the British Birth Cohort Studies. Innovation: The European Journal
of Social Science Research, 20, 159-179.
Cabinet Office (2010a) „Big Society – overview‟, available at www.cabinetoffice.gov.uk/content/big-
society-overview.
Cabinet Office (2010b) „Office for Civil Society structure finalised‟, available at
www.cabinetoffice.gov.uk/resource-library/office-civil-society-structure-finalised.
Campbell, C & McLean, C. (2002) Ethnic identities, social capital and health inequalities: factors
shaping African-Caribbean participation in local community networks in the UK. Social Science &
Medicine. 55(4):643-657
Cattel, V. (2001) Poor people, poor places, and poor health: the mediating role of social networks
and social capital. Social Science & Medicine. 52(10):1501-1516
CLG (Department for Communities and Local Government) (2008) Lifetime Homes, Lifetime
Neighbourhoods: A national strategy for Housing in an Ageing Society. London:Department for
Communities and Local Government
CSJ (2010) The forgotten age: understanding poverty and social exclusion in later life, CSJ.
CSJ (2011) Age of opportunity: transforming the lives of older people in poverty, CSJ.
Crowe, M., Andel, R., Pedersen, N. L., Johansson, B., Gatz, M. (2003) Does Participation in
Leisure Activities Lead to Reduced Risk of Alzheimer's Disease? A Prospective Study of Swedish
Twins. The Journals of Gerontology, Series B. 58(5): 249-255
Davidson, K., Daly, T., Arber, S. (2003) Older Men, Social Integration and Organisational
Activities. Social Policy and Society. 2(2):81-89
Demakakos, P., McMunn, A. and Steptoe, A. (2010) Well-being in older age: a multidimensional
perspective in Banks, J., Lessof, C., Nazroo, J., Rogers, N., Stafford, M & Steptoe, A. (eds.)
Financial circumstances, health and well-being of the older population in England: The 2008
English Longitudinal Study of Ageing. The Institute of Fiscal Studies, London.
Department of Social Security (DSS) (1998), New Ambitions for our Country: A New Contract for
Welfare, Cm 3805, London: The Stationery Office
Devlin, J. (2005) A Detailed Study of Financial Exclusion in the UK. Journal of Consumer Policy.
28(1):75-108
Devlin, J. (2009) An analysis of influences on total financial exclusion. The Service Industries
Journal 29(8):1021-1036

Appendices
121
Dewilde, C. (2003) A life-course perspective on social exclusion and poverty. British Journal of
Sociology. 54(1):109-128
Donald, I. (2009) Housing and health care for older people. Age and Ageing. 38(4):364-367
Duffy, K. (1995), Social Exclusion and Human Dignity in Europe, Strasbourg: Council of Europe
DWP (2012a) Social Justice: transforming lives. London: The Stationery Office
DWP (2012b) National Social Report. London: Department of Work and Pensions.
Golding, B. (2011) Why do men‟s sheds work in diverse communities? Presentation given at
Discovering Men’s Sheds Conference Leicester, UK. (29 Sept 2011)
Gordon, D. Levitas, R., Pantazis, C., Patsios, D., Payne, S., Townsend, P., Adelman, L., Ashworth,
K., Middleton, S., Bradshaw, J. & Williams, J. (2000), Poverty and Social Exclusion in Britain, York:
Joseph Rowntree Foundation
Grewal, I., Nazroo, J., Bajekal, M., Blane, D. & Lewis, J. (2004) Influences on quality of life: a
qualitative investigation of ethnic differences among older people in England. Journal of Ethnic and
Migration Studies. 30(4):737-761
Harding, E. (2007) Towards Lifetime Neighbourhoods: Designing sustainable communities for all.
London: International Longevity Centre.
Hawkes, D. & Plewis, I. (2006) Modelling non-response in the National Child Development Study.
Journal of the Royal Statistical Society - Statistics in Society (Series A), 169, 479-491.
HM Government (2005) Opportunity for all, available at
webarchive.nationalarchives.gov.uk/20100406213018/http:/dwp.gov.uk/policy/ageing-
society/strategy-and-publications/opportunity-age-first-report.
HM Government (2009) Building a society for all ages, available at
webarchive.nationalarchives.gov.uk/20100406213018/http://hmg.gov.uk/buildingasocietyforallages
/press_release.aspx.
Hobraft, J. (1998) Intergenerational and Life-Course Transmission of Social Exclusion: Influences
of Childhood Poverty, Family Disruption, and Contact with the Police. CASE Papers/15. Centre for
Analysis of Social Exclusion (CASE), LSE: London
Hobcraft, J. and Kiernan, K. E. (2001) Childhood poverty, early motherhood and adult social
exclusion. British Journal of Sociology 52:495-517
Hoff, A (2008) Tackling Poverty and Social Exclusion of Older People – Lessons from Europe.
Oxford Institute of Ageing Working Papers
Hussey, D., Lessof, C., Ward, K. & Wood, N. (2010) Methodology in Banks, J., Lessof, C., Nazroo,
J., Rogers, N., Stafford, M & Steptoe, A. (eds.) Financial circumstances, health and well-being of
the older population in England: The 2008 English Longitudinal Study of Ageing. The Institute of
Fiscal Studies, London.
Hyde, M., Wiggins, R. D., Higgs, P. F., and Blane, D. B (2003) A measure of quality of life in early
old age: the theory, development and properties of a needs satisfaction model (CASP-19). Aging
and Mental Health. 7(3):186-94.

Appendices
122
ILC-UK (2011) Osteoporosis in the UK: At Breaking Point. London: International Longevity Centre.
Independent (2011) The word of the year? 'Squeezed middle' says Oxford Dictionary. November
23rd 2011. http://www.independent.co.uk/news/uk/this-britain/the-word-of-the-year-squeezed-
middle-says-oxford-dictionary-6266506.html (Accessed 27-06-12)
Kiernan, K. (2002) Disadvantage and Demography - Chicken and Egg? in Hills, J., Le Grand, J. &
Piachaud, D. (Eds.) Understanding Social Exclusion. Oxford, Oxford University Press.
Kneale, D. (2011a) Can Localism work for Older People in Urban Environments? London:
International Longevity Centre.
Kneale, D. (2011b). Establishing the Extra in Extra Care Housing. London: International Longevity
Centre.
Kneale, D. (2011c). Localism and Neighbourhoods for all ages. London: International Longevity
Centre.
Levitas, R (1998) “New Labour and Social Exclusion” Citizenship and Social exclusion panel,
University of Bristol
Levitas, R (2005) The Inclusive Society: New Labour and Social Exclusion, Palgrave.
Lennartsson, C. & Silverstein, M. (2001) Does Engagement With Life Enhance Survival of Elderly
People in Sweden? The Role of Social and Leisure Activities. The Journals of Gerontology, Series
B. 56(6): S335-S342
Phillipson, C & Scharf, T (2004) The impact of government policy on social exclusion among older
people, SEU/ODPM.
Marmot M. (2010) Fair society, healthy lives. London, UK : University College
Nazroo, J. & Matthews, K. (2012) The impact of volunteering on well-being in later life. Cardiff, UK:
WRVS
Nolan, B. and Whelan, C. T. (1996a), „Resources, Deprivation and Poverty‟, Oxford and New York:
Oxford University Press, Clarendon Press
ODPM (2004) The drivers of social exclusion: A review of the literature for the Social Exclusion
Unit. London: ODPM
ODPM (2005) Excluded Older People: Social Exclusion Unit Interim Report. London: ODPM/Social
Exclusion Unit
Office for National Statistics (ONS) (2009) Cohort Fertility. London: ONS
Office for National Statistics (ONS) (2010) 2010-based period and cohort life expectancy tables.
London: ONS
Office for National Statistics (ONS) (2011) Labour market statistics: December 2011. London: ONS
Phillipson, C. and Scharf, T. (2004) The impact of government policy on social exclusion among
older people. London: Social Exclusion Unit, Office of the Deputy Prime Minister.
Potter, C., Bamford, S-M. and Kneale, D. (2011) Bridging the Gap: Exploring the potential for
bringing older and younger LGBT people together. London: International Longevity Centre.

Appendices
123
Royston, P. 2004. Multiple imputation of missing values. The STATA Journal 4(3):227-241.
Scharf, T., Phillipson, C., and Smith, A. (2005) Social exclusion of older people in deprived urban
communities of England. European Journal of Ageing. 2(2):76-87
Scholes, S., Medina, J., Cheshire, H., Cox, K., Hacker, E. and Lessof, C. (2009) Health, wealth
and lifestyles of the older population in England: The 2006 English
Longitudinal Study of Ageing: Technical Report. London: National Centre for Social Research.
Serra, V., Watson, J., Sinclair, D. and Kneale, D. (2011) Living Beyond 100: A report on
centenarians. London: International Longevity Centre
Social Exclusion Unit (SEU) & Office of the Deputy Prime Minister (ODPM) (2006) A Sure Start to
Later Life: Ending Inequalities for Older People, London: Social Exclusion Unit, Office of the
Deputy Prime Minister.
Social Exclusion Unit (SEU) (2001) Preventing Social Exclusion: Report by the Social Exclusion
Unit. London: Social Exclusion Unit, Office of the Deputy Prime Minister.
Social Exclusion Unit (2004) Breaking the Cycle: Taking stock of progress and priorities for the
future. London: Social Exclusion Unit, Office of the Deputy Prime Minister.
Taylor, R., Conway, L., Calderwood, L., Lessof, C., Cheshire, H., Cox, K. and Scholes, S. (2007)
Health, wealth and lifestyles of the older population in England: The 2002 English
Longitudinal Study of Ageing: Technical Report. London: National Centre for Social Research.
Townsend,P (1979) „Poverty in the United Kingdom‟ Harmondsworth: Penguin
Tunstall, R; Lupton, R; Kneale, D and Jenkins, A (2011) Teenage housing and neighbourhoods
and links with adult outcomes: Evidence from the 1970 cohort study CASEReport 64 London:
CASE
Walker, A & Walker, C (1997) ed Britain Divided: the growth of social exclusion in the 1980s and
1990s, London: CPAG
Wiggins, R. D., Higgs, P. F., Hyde, M. and Blane, D. B. (2004). Quality of life in the third age: key
predictors of the CASP-19 measure. Ageing and Society. 24:693-708

ILC–UK
11 Tufton Street
London
SW1P 3QB
Tel : +44 (0) 20 7340 0440
www.ilcuk.org.uk