Embed Size (px)
Citation preview
Is job satisfaction ‘u’ shaped in earnings?
Andrew Brown, Andy Charlwood, Chris Forde and David Spencer
Presentation prepared for the Work, Employment and Society conference, University of Aberdeen, 12th-14th
September 2007

Background
• Job satisfaction and well-being at work increasingly important areas of research:– Move to ‘full’ employment: hence turn to
quality of employment– Knowledge economy: focus on high skill, high
quality jobs
– Issue of work-life balance

Background
• Our project has used large scale social surveys to address the question of job satisfaction (and job quality more broadly)
• We bring to bear a ‘political economy’ approach to job satisfaction and to job quality (see below).

Main Argument
• Much of the literature takes a ‘utility’ approach to job satisfaction– ‘economics of happiness’ (e.g. Layard, Clark)– Rose’s project (‘league tables’ of occupational job
satisfaction)
• We will argue for an alternative, objective approach to job satisfaction data
• We uncover a ‘u-shape’ relation between reported job satisfaction and earnings: we argue that this result can only be properly explained through political economy

Point of reference
• We will particularly consider ‘league tables’ of job satisfaction in occupations constructed by Rose (2003, 2007)
• ‘Surprising results’: some low paid as well as high paid occupations at top– Hairdressers; corporate managers
• We will problematize the interpretation of these tables
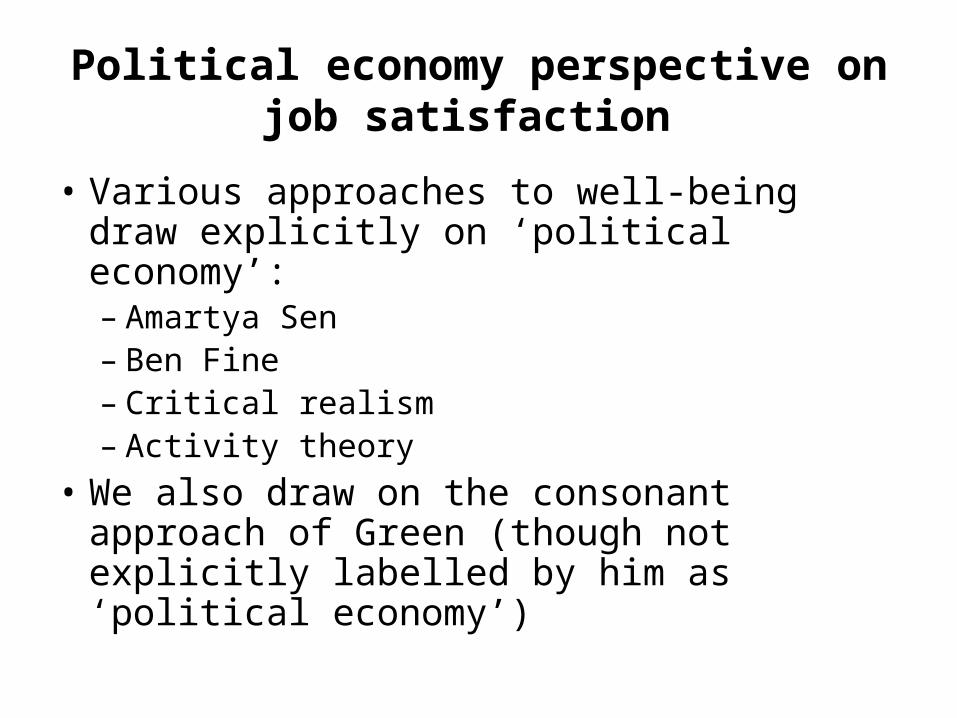
Political economy perspective on job satisfaction
• Various approaches to well-being draw explicitly on ‘political economy’:– Amartya Sen– Ben Fine– Critical realism– Activity theory
• We also draw on the consonant approach of Green (though not explicitly labelled by him as ‘political economy’)

Overview
Common themes in political economy view of well-being at work
• Stress on objective needs as opposed to subjective preferences
• Rejection of utility theory (ordinal and cardinal)
• Focus on qualitative development of individuals (and so their needs) through free creative activity
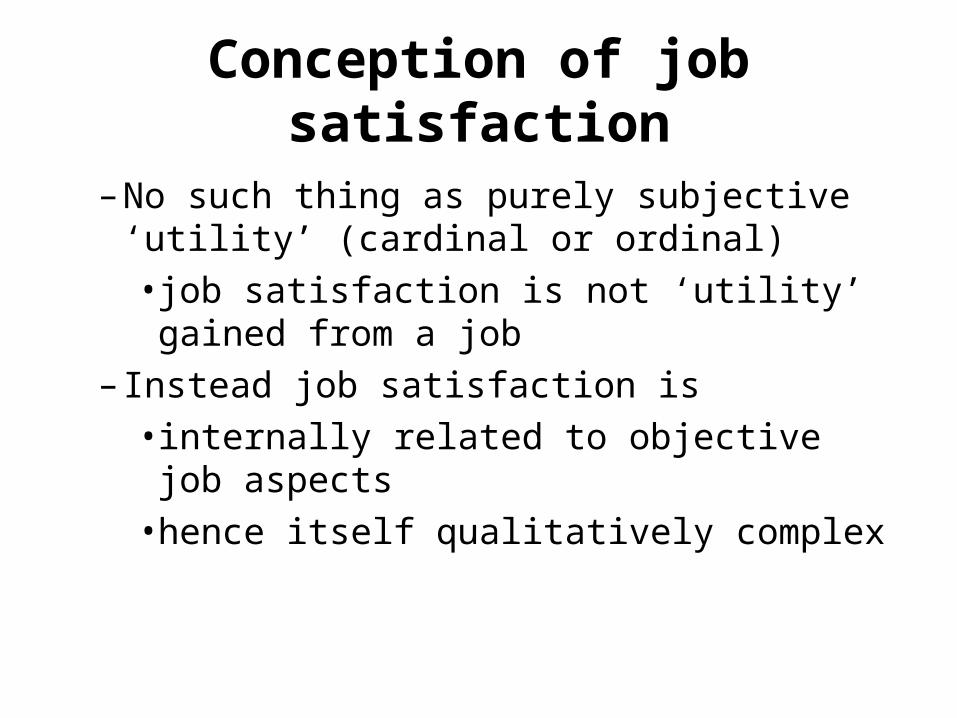
Conception of job satisfaction
– No such thing as purely subjective ‘utility’ (cardinal or ordinal)• job satisfaction is not ‘utility’ gained from
a job– Instead job satisfaction is
• internally related to objective job aspects
• hence itself qualitatively complex

Conception of job satisfaction
• This conception consonant with Green’s approach to job satisfaction surveys
• Reported job satisfaction (on Likert scale) reflects 2 things:– True job satisfaction– Norms and expectations of respondents
regarding jobs
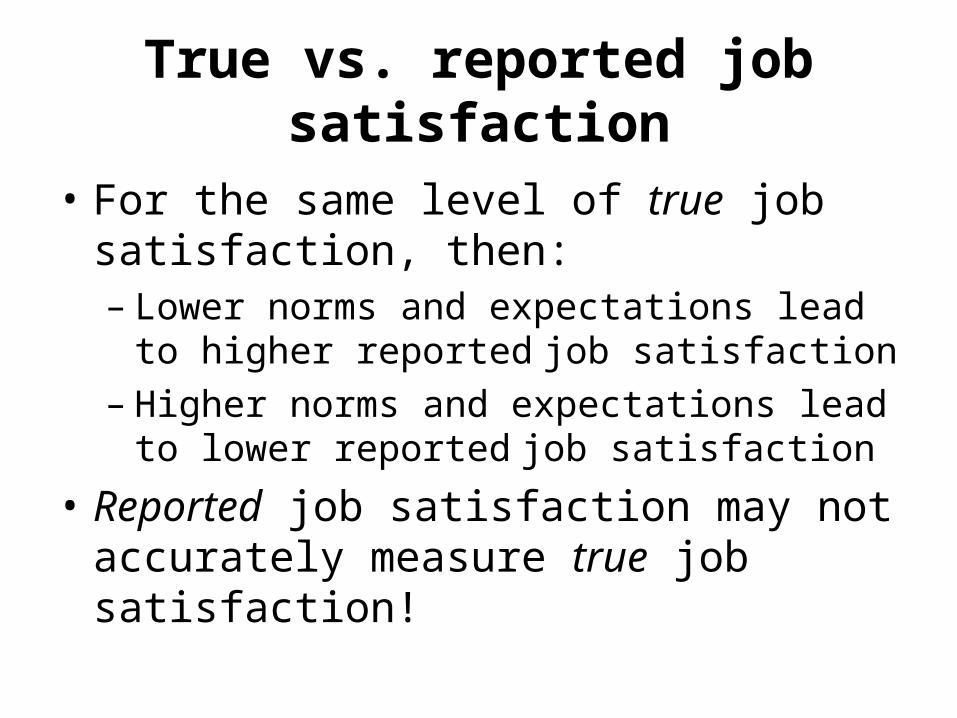
True vs. reported job satisfaction
• For the same level of true job satisfaction, then:– Lower norms and expectations lead to higher
reported job satisfaction– Higher norms and expectations lead to lower
reported job satisfaction
• Reported job satisfaction may not accurately measure true job satisfaction!

True vs. reported job satisfaction
• Do Rose’s ‘league tables’ distinguish between true and reported job satisfaction?
• Reconsider near equivalent placing of hairdressers and corporate mangers at top of league tables of job satisfaction: Ifnorms and expectations of hairdressers are much lower than those of corporate managers
thentrue job satisfaction may be much higher for corporate managers than for hairdressers

Empirical work
• Our empirical work shows significance of our political economy approach to job satisfaction
• We uncover a robust u-shaped pattern of reported job satisfaction in earnings across British employees– Based on data from WERS and BHPS– Hitherto only seldom remarked upon (or
puzzled over) in secondary literature
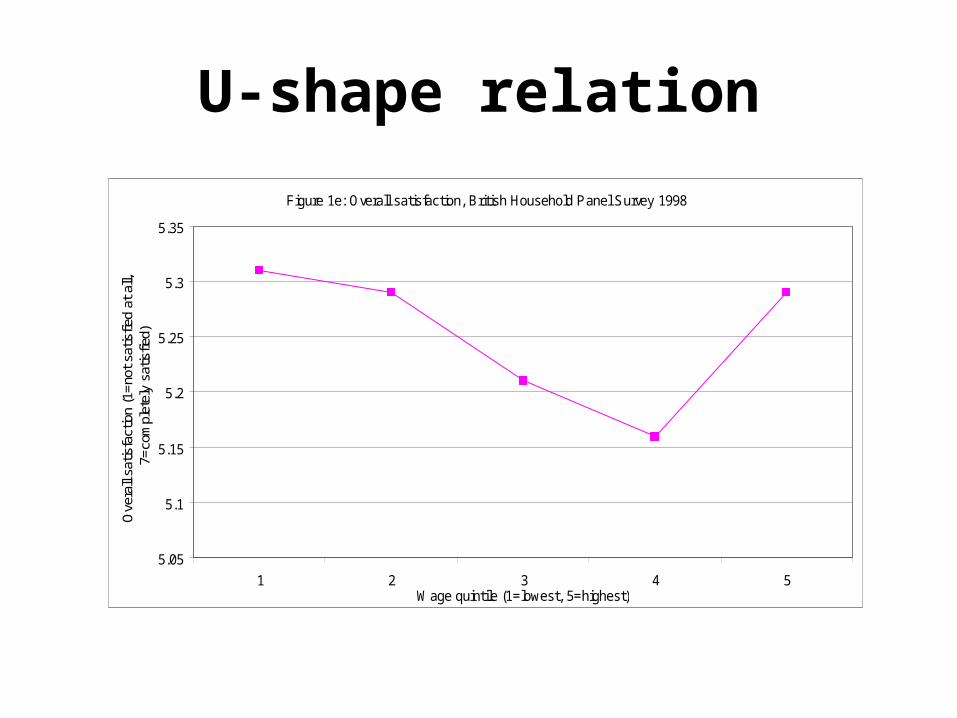
U-shape relation
Figure 1e: Overall satisfaction, British Household Panel Survey 1998
5.05
5.1
5.15
5.2
5.25
5.3
5.35
1 2 3 4 5Wage quintile (1=lowest, 5=highest)
Ove
rall
satis
fact
ion
(1=
not
satis
fied
at a
ll,
7=co
mpl
etel
y sa
tisfie
d)

U-shape relation
Figure 1f: Overall satisfaction, British Household Panel Survey 2004
5.2
5.22
5.24
5.26
5.28
5.3
5.32
5.34
5.36
1 2 3 4 5
Wage quintile (1=lowest, 5=highest)
Ove
rall
satis
fact
ion
(1=
not
at a
ll sa
tisfie
d,
7=co
mpl
etel
y sa
tisfie
d)

U-shape relation
Figure 1g: Satisfaction with work itself, British Household Panel Survey 1998
5.2
5.25
5.3
5.35
5.4
5.45
5.5
5.55
5.6
1 2 3 4 5
Wage quintile (1=lowest, 5=highest)
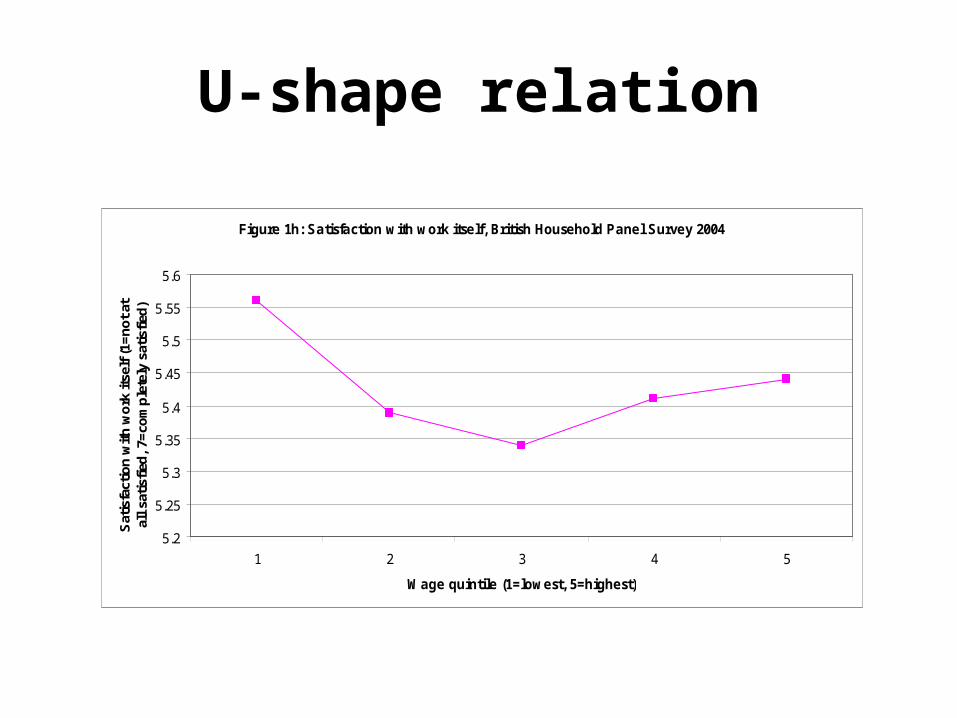
U-shape relation
Figure 1h: Satisfaction with work itself, British Household Panel Survey 2004
5.2
5.25
5.3
5.35
5.4
5.45
5.5
5.55
5.6
1 2 3 4 5
Wage quintile (1=lowest, 5=highest)
Sat
isfa
ctio
n w
ith
wo
rk i
tsel
f (1
=n
ot
at
all
sati
sfie
d,
7=co
mp
lete
ly s
atis
fied
)

U-shape relation
Figure 1a: Satisfaction with sense of achievement, Workplace Employment Relations Survey 1998
3.35
3.4
3.45
3.5
3.55
3.6
3.65
3.7
1 2 3 4 5Wage quintile (1=lowest, 5=highest)
Sat
isfa
ctio
n w
ith
sen
se o
f ac
hie
vem
ent
(1=v
ery
dis
sati
sfie
d, 5
=ver
y sa
tisf
ied
)
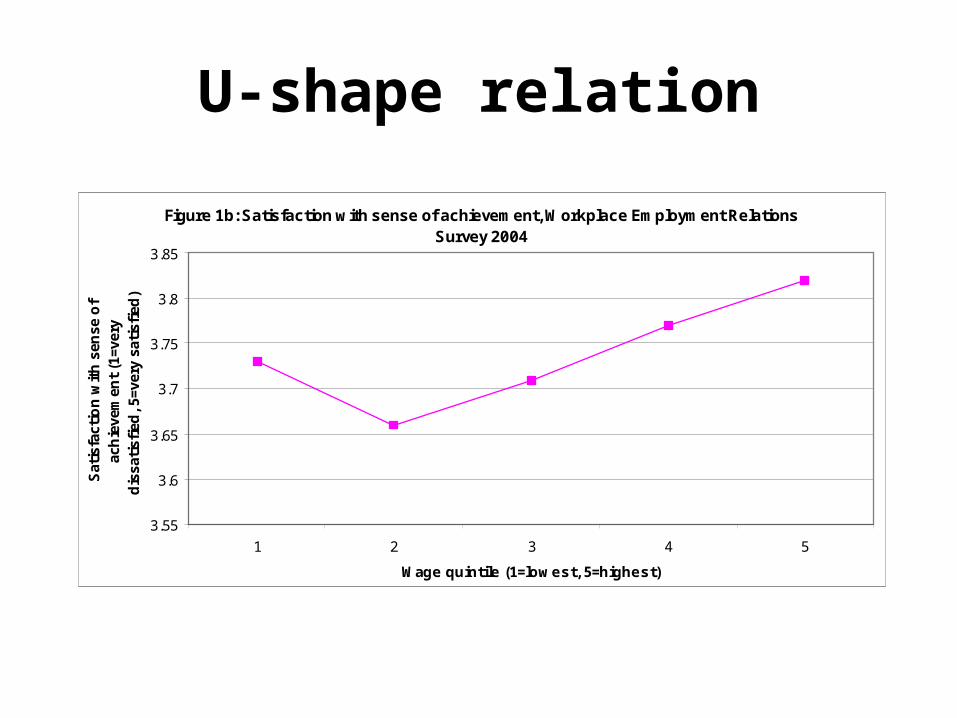
U-shape relation
Figure 1b: Satisfaction with sense of achievement, Workplace Employment Relations Survey 2004
3.55
3.6
3.65
3.7
3.75
3.8
3.85
1 2 3 4 5
Wage quintile (1=lowest, 5=highest)
Sat
isfa
ctio
n w
ith
sen
se o
f ac
hie
vem
ent
(1=v
ery
dis
sati
sfie
d, 5
=ver
y sa
tisf
ied
)

U-shape relation
Satisfaction with influence by wage quintile, WERS2004
3.3
3.35
3.4
3.45
3.5
3.55
3.6
3.65
3.7
1 2 3 4 5
Wage quintile (1=lowest, 5=highest)
Sati
sfa
cti
on
wit
h in
flu
en
ce (
1=
very
dis
sati
sfi
ed
, 5=
very
sati
sfi
ed
)

U-shape relation
Satisfaction with pay by wage quintile, WERS2004
2.4
2.5
2.6
2.7
2.8
2.9
3
3.1
3.2
1 2 3 4 5
Wage quintile (1=lowest, 5=highest)
Sat
isfa
ctio
n w
ith
pay
(1=
very
dis
sati
sfie
d,
5=ve
ry s
atis
fied
)
U-shape relation
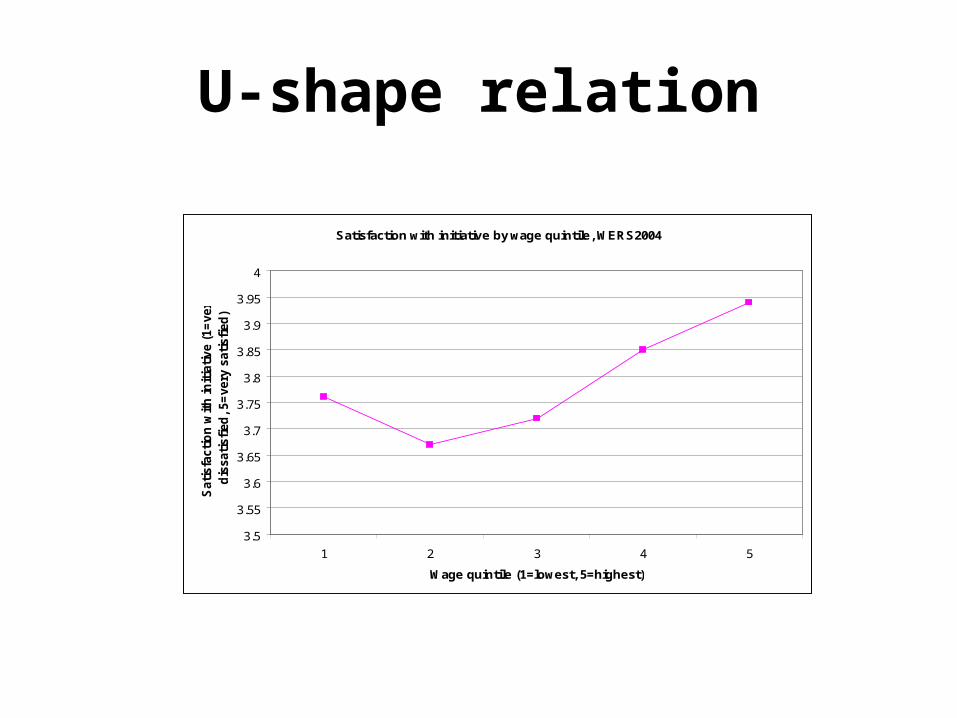
Satisfaction with initiative by wage quintile, WERS2004
3.5
3.55
3.6
3.65
3.7
3.75
3.8
3.85
3.9
3.95
4
1 2 3 4 5
Wage quintile (1=lowest, 5=highest)
Sati
sfa
cti
on
wit
h in
itia
tive (
1=
very
dis
sati
sfi
ed
, 5=
very
sati
sfi
ed
)
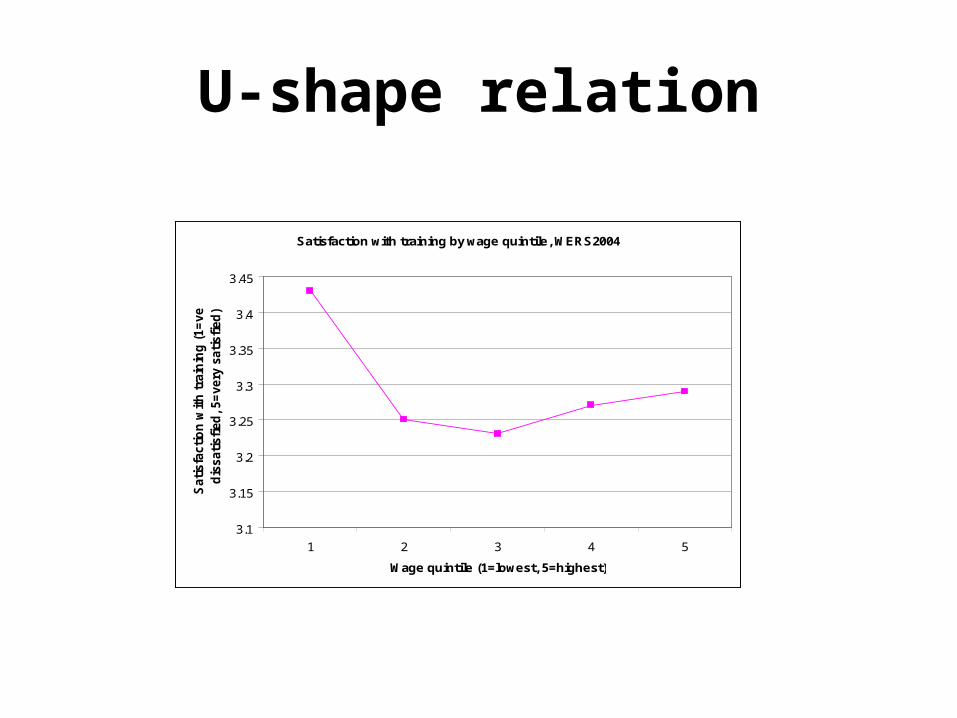
U-shape relation
Satisfaction with training by wage quintile, WERS2004
3.1
3.15
3.2
3.25
3.3
3.35
3.4
3.45
1 2 3 4 5
Wage quintile (1=lowest, 5=highest)
Sati
sfa
cti
on
wit
h t
rain
ing
(1=
very
dis
sati
sfi
ed
, 5=
very
sati
sfi
ed
)
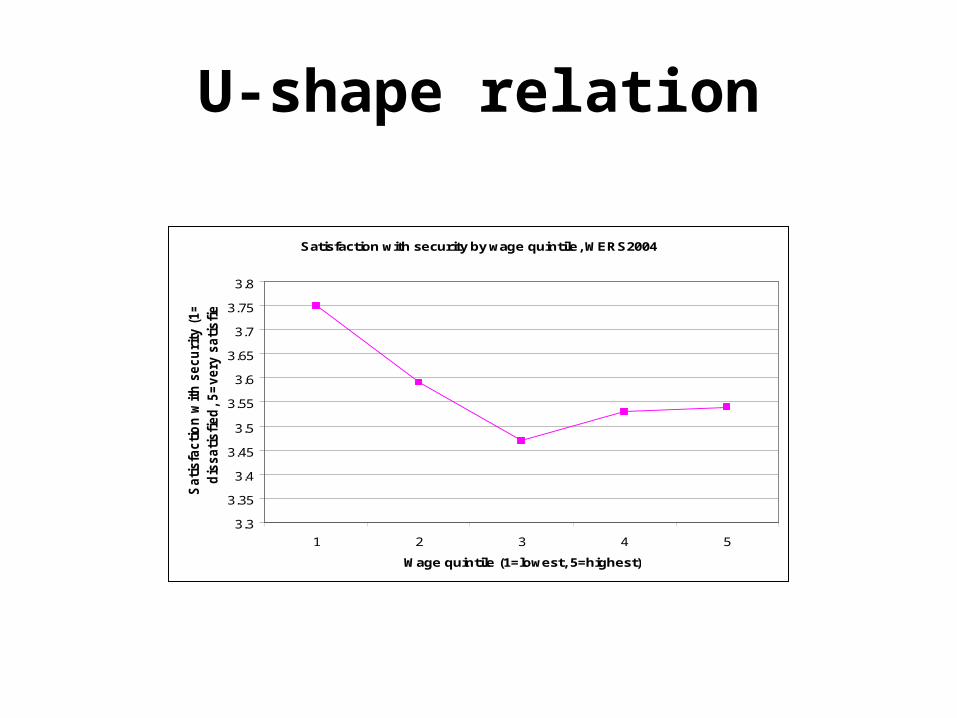
U-shape relation
Satisfaction with security by wage quintile, WERS2004
3.3
3.35
3.4
3.45
3.5
3.55
3.6
3.65
3.7
3.75
3.8
1 2 3 4 5
Wage quintile (1=lowest, 5=highest)
Sati
sfa
cti
on
wit
h s
ecu
rity
(1=
very
dis
sati
sfi
ed
, 5=
very
sati
sfi
ed
)

U-shape relation
Satisfaction with work itself by wage quintile, WERS2004
3.64
3.66
3.68
3.7
3.72
3.74
3.76
3.78
3.8
3.82
1 2 3 4 5
Wage quintile (1=lowest, 5=highest)
Sati
sfa
cti
on
wit
h w
ork
its
elf
(1=
very
dis
sati
sfi
ed
, 5=
very
sati
sfi
ed
)

U-shape relation
Composite satisfaction by wage quintile, WERS1998
3.1
3.15
3.2
3.25
3.3
3.35
3.4
3.45
3.5
1 2 3 4 5
Wage quintile (1=lowest, 5=highest)
Co
mp
osi
te s
atis
fact
ion
(1=
very
dis
sati
sfie
d,
5=ve
ry s
atis
fied
)

U-shape relation
Composite satisfaction by wage quintile, WERS2004
3.35
3.4
3.45
3.5
3.55
3.6
3.65
1 2 3 4 5
Wage quintile (1=lowest, 5=highest)
Co
mp
osi
te s
atis
fact
ion
(1=
very
dis
sati
sfie
d,
5=ve
ry s
atis
fied
)

U shapes in WERS2004Basic regression (P-values in parenthesis)
Full regression with controls (P-values in parenthesis)
Satisfaction facet Coefficient on log wage squared term
Coefficient on log wage
Coefficient on log wage squared term
Coefficient on log wage term
Sense of achievement
0.1172
(0.017)
-0.3616
(0.076)
0.2091
(0.001)
-0.9014
(0.001)
Influence 0.2275
(0)
-0.7460
(0)
0.1244
(0.039)
-0.5661
(0.031)
Pay 0.3896
(0)
-1.3174
(0)
0.1443
(0.02)
-0.0861
(0.752)
Initiative 0.2256
(0)
-0.6806
(0)
0.1167
(0.053)
-0.4796
(0.07)
Training 0.2994
(0)
-1.3294
(0)
0.1403
(0.02)
-0.1121
(0.674)
Security 0.2820
(0)
-1.3391
(0)
0.1111
(0.068)
-0.4117
(0.123)
Work itself 0.1328
(0.006)
-0.4722
(0.02)
0.1532
(0.014)
-0.5853
(0.031)
Composite satisfaction
0.2246
(0)
-0.8473
(0)
0.1315
(0.001)
-0.3797
(0.028)
Interpretation
• A ‘utility’ interpretation of u-shape relation would be that those in high and low paid jobs are truly satisfied in their jobs
• But this has potentially counterintuitive policy implications: it suggests that low paid jobs are truly conducive to high employee job satisfaction and therefore that these jobs should be encouraged!
How should u-shape be explained?
We suggest explanation in terms of norms and expectations
• Low earnings: low norms and expectations matched by actual job
• Medium level earnings: High norms and expectations not matched by job
• High earnings: High norms and expectations matched by job
• Therefore only top third of earners can plausibly be argued to have high job expectations which are actually met by their jobs
Implications of our interpretation
• Job satisfaction may therefore be truly high only in the high earnings category– Disjuncture between reported and true job
satisfaction for low earners– The ‘league tables’ do not seem to allow for
disjuncture of true and reported job satisfaction

Further support for explanation
Existing qualitative research supports our hypothesis:
• Low paid have low norms and expectations (Edwards and Burkitt, 2001)
• Low norms and expectations explain high reported job satisfaction of low paid (Tomlinson 2005; Walters, 2005)
• Low paid ‘satisficing’ as opposed to being truly fulfilled in their jobs (Walters, 2005)
• (More qualitative work required to develop and substantiate our argument)

Conclusion
So, is job satisfaction u-shaped in earnings?• The robust statistical u-shape is not decisive• Answer depends on concept of job satisfaction
and its measurement:• YES, if true and reported job satisfaction are
equivalent (economics of happiness; Rose?) • NO, if there is disjuncture between reported and
true job satisfaction (Political Economy)

Conclusion
• Conception of job satisfaction matters in terms of interpretation and understanding of job satisfaction data
• We would argue for political economy approach that is sensitive to both qualitative differences between jobs and norms and expectations of workers