Embed Size (px)
Citation preview

Is It Whom You Know or What You Know?
An Empirical Assessment of the Lobbying Process
Marianne Bertrand (Chicago Booth, NBER, CEPR, and IZA)
Matilde Bombardini (UBC, NBER, and CIFAR)
Francesco Trebbi (UBC, NBER, and CIFAR)
First Draft: November 2010
This Draft: August 2012
Abstract
Do lobbyists provide issue-specific information to congressmen? Or do they provide special interests access to politicians? We present evidence to assess the role of issue expertise versus connections in the lobbying process and illustrate how both are at work. In support of the connections view, we show that lobbyists follow politicians they were initially connected to, when those politicians switch to new committee assignments. In support of the expertise view, we show that there is a group of specialists that even politicians of opposite political affiliation listen to. However, we find a more consistent monetary premium for connections than expertise.
Keywords: Lobbying, Special Interest Politics, Political Access, Expertise, Advocacy.
JEL Classification Codes: D72, P48, H7.
Acknowledgements: the authors would like to thank Allan Drazen, Keith Krehbiel, Ken Shepsle, and seminar participants at the Korean Development Institute, the University of Chicago Booth School of Business, Columbia Graduate School of Business, University of California Berkeley Haas School of Business, NBER Political Economy Summer Institute, University of Minnesota, the 2010 Wallis Conference on Political Economy, and Stanford Graduate School of Business. David Wood provided outstanding research assistance. Financial support from the Initiative on Global Financial Markets and CIFAR is kindly acknowledged.
1
1 Introduction
At the intersection between the political and the economic spheres lays the lobbying industry. Trillions
of dollars of public policy intervention, government procurement, and budgetary items are constantly
thoroughly scrutinized, advocated, or opposed by representatives of special interests. The sheer
relevance of the 4 billion dollars federal lobbying industry has become evident in any aspect of the
2008-2009 financial crisis, including emergency financial market intervention (the TARP), financial
regulation, countercyclical fiscal policy intervention, and healthcare reform.1 Notwithstanding its
perceived fundamental role in affecting economic policy, very little systematic empirical research about
the lobbying industry is available to economists and political scientists alike. A large part of the
theoretical literature on interest groups has painted the lobbying process as one of information
transmission: informed interest groups send cheap or costly signals to uninformed politicians.2 However,
these stylized models of lobbying do not account for the presence of the lobbying industry as an
intermediary. In this paper, we propose to study the role that the lobbyists themselves play in the
lobbying process, how they use their specific skills and assets, and which of these skills and assets are
particularly valuable to the interest groups that hire them.
What might be the lobbyists’ role in the lobbying process? Under one view, lobbyists are the experts
who provide information to legislators and help guide their decision-making process. Their expertise
might be particularly valuable when one considers that neither legislators nor the interest groups that
hire lobbyists may have the technical background or the time to delve into the detailed implications of
all the pieces of legislation that are being debated. This view is also maintained by the American League 1 See for instance Birnbaum (2008): “A key provision of the housing bill now awaiting action in the Senate -- and widely touted as offering a lifeline to distressed homeowners -- was initially suggested to Congress by lobbyists for major banks facing their own huge losses from the subprime mortgage crisis[…]” [Vital Part of Housing Bill Is Brainchild of Banks, 6/25/2008, The Washington Post] or Pear (2009): “In the official record of the historic House debate on overhauling health care, the speeches of many lawmakers echo with similarities. […] Statements by more than a dozen lawmakers were ghostwritten, in whole or in part, by Washington lobbyists working for Genetech, one of the world’s largest biotechnology companies.” [In House Many Spoke With One Voice: Lobbyists’, 11/15/2009, New York Times].
2 Grossman and Helpman (2001) offer an exhaustive literature review. The basic idea is that interest groups, although known to be biased, are credible to the politician if their preferences are sufficiently aligned with the politicians’ or the information they send is costly (or if it can be verified). Among the most prominent contributions are Crawford and Sobel (1982), Calvert (1985), Potters and Van Winden (1992), Austen-Smith (1994, 1995). A few papers have looked at the interactions between the two tools available to interest groups (information transmission and campaign support), e.g., Austen-Smith (1995), Lohman (1995), and more recently, Bennedsen and Feldmann (2006).

2
of Lobbyists, which on its official website states “Lobbying is a legitimate and necessary part of our
democratic political process. Government decisions affect both people and organizations, and
information must be provided in order to produce informed decisions.”3
In contrast is the view, held by many in the media and on the street, which is that lobbyists’ main asset
is not what they know, but instead whom they know.4 In interviews with insiders, McGrath (2006)
reports “There are three important things to know about lobbying: contacts, contacts, contacts.” Under
this alternative view, lobbyists’ key asset is not their expertise, but instead their access to various
members of Congress through personal, and possibly also financial, connections.5 While this view of
lobbyists’ role does not rule out a flow of information from interest groups to politicians, it excludes that
lobbyists are the source of this information.
In this paper, we combine multiple data sources to help inform our thinking about these two views of
lobbyists. The data set we assembled represents the entire federal lobbying industry in the US. We
employ lobbying records as maintained by the Senate Office of Public Records (SOPR), lobbyists’
campaign contribution donations from the Federal Election Commission, and biographical information
for a subset of lobbyists that we collect from an online registry. We develop measures of lobbyists’
connections to politicians and lobbyists’ expertise. Our measure of issue expertise is based on
considering the entire set of lobbying records that are associated with a given lobbyist and evaluating
how narrow or broad the range of issues a lobbyist’s name is associated with is. While we cannot
3 http://www.alldc.org/publicresources/lobbying.cfm
4 See Salisbury et al. (1989) for an early discussion and test based on surveys of lobbyists and Apollonio, Cain and Drutman (2008, section B), for a recent discussion.
5 It is important to notice, however, that such a view of lobbyists does not necessarily imply (even though it could be associated with) a quid-pro-quo aspect of the lobbying process. According to the “quid-pro-quo” view, politicians either modify their electoral platform or implement policies when in office and receive in exchange valuable campaign contributions that are used more or less directly to sway voters. A large number of models with different objectives share this fundamental “quid-pro-quo” approach. A non-exhaustive list of papers that have employed this approach includes Austen-Smith (1987), Baron (1989), Baron (1994), Snyder (1990), Snyder (1991), Grossman and Helpman (1994), Dixit et al. (1997) and Besley and Coate (2001). Bombardini and Trebbi (2009) explore the interaction between monetary support and direct votes promised by interest groups but essentially maintain the quid-pro-quo approach. This strand of the literature has received a lot of attention from the empirical point of view, in particular in its application to the literature on endogenous trade policy (Goldberg and Maggi, 1999).

3
directly observe lobbyists’ contacts with politicians, we propose to proxy for it with information on the
campaign contributions that lobbyists make to various politicians and Members of Congress.6
We start by demonstrating that lobbyists’ connections to politicians are a significant determinant of what
legislative issues they work on. Specifically, a lobbyist that works on health care-related issues is
systematically more likely to be connected (through campaign contributions) to legislators whose
committee assignments include health care. In support of a causal interpretation of this pattern, we show,
more strikingly, that lobbyists switch issues in a predictable way as the legislators they are connected to
through campaign donations switch committee assignments. So, for example, a lobbyist that is
connected to a legislator whose committee assignment includes health care in one Congress is more
likely to cover defense-related issues in the next Congress if the legislator he or she is connected to is re-
assigned to defense in the next Congress. These first results are consistent with Blanes-i-Vidal, Draca,
and Fons-Rosen (2010), who show, for a subset of lobbyists with past experience as senatorial aides, a
drop in revenues occurring when their Senator leaves office.
We interpret these results as evidence that lobbyists’ personal contacts to politicians are a relevant asset
in defining their job. Yet, this evidence does not per se, as we indicated above, imply that lobbyists’
expertise about certain topics is irrelevant to their job. Connections may simply be a way for lobbyists to
gain access to time-constrained politicians, “a chance to ‘tell their story’” (Sabato, 1985). Once access
has been gained, the lobbyists may still provide useful information to the politicians. We argue that
some systematic patterns we observe in the data about the structure of the personal connections between
lobbyists and politicians provide at least indirect support for the view that lobbyists’ issue expertise is
also a relevant asset in defining their job, a prevalent view in the informational lobbying literature.
Specifically, we find that, among the lobbyists that are connected to a given politician, a larger share of
experts than non-experts have opposite party affiliation to the politician. This, we argue, is consistent
with the prediction of standard informational lobbying models such as Krishna and Morgan (2001) and
Helpman and Grossman (2001), where a receiver is better informed if she receives a signal from senders
with opposite biases. More intuitively, while politicians primarily maintain relationships with lobbyists
6 Wright (1990) is among the first to report a positive correlation between lobbying contacts and campaign contributions, while Ainsworth (1993) underscores that “indeed, there is evidence that campaign contributions appear to be most useful as predictors of access (Grenzke 1989; Herndon 1982; Langbein 1986).”
4
of the same political orientation, they do appear more likely to cross the aisle when talking to experts, as
would be expected if the politicians were trying to improve their information acquisition.
While the lobbyists’ job may rely on both their personal contacts, but also their knowledge of more
technical legislative issues, these two assets may differ in how scarce or easily replicable they are. This
leads us to the final question we address in this paper, which is: what are lobbyists paid for? Do interest
groups that hire lobbyists mainly pay for access to their connections or access to their expertise? Using
information on the dollar value attached to lobbying reports, we show that both carry a positive
premium, i.e. expert lobbyists and connected lobbyists are paid more on average. Nevertheless, when
comparing the evidence on the two premia, we argue that lobbyists’ connections are a scarcer resource
than their expertise as they are more consistently associated with a positive revenue premium. Further
supporting this view, we find evidence of “political cycles” in the returns to lobbyists, with increase in
the returns to lobbyists associated to a given party when that party is in a position of power. In contrast,
we find no evidence that the return of a specialized lobbyist increases when his or her issue becomes
hot; instead, it seems that most of the adjustment during a boom is through additional entry of non-
specialists who start lobbying on that issue.
The battery of tests and pieces of evidence leads us to the conclusion that the lobbying process is a
complex activity where both the personal connections and issue expertise of the lobbyists play a role.
But the evidence on returns points to connections being the scarcer resource,7 and is rather consistent
with a scenario where lobbyists connected to a given politician are valuable because they have a deep
knowledge of that politician’s constituency,8 and/or have built a relationship of trust and credibility vis-
à-vis that politician. Lobbyists are likely communicating information, but their returns are seemingly
more related to the complementary asset they bring to the table and to their role as intermediaries in the
transmission of information. In general the evidence seems to reject a view that unilaterally espouses
7 Incidentally, it is easy to verify that large lobbying firms like Patton Boggs LLP or Cassidy and Associates employ few individuals with background that points to specific technical training, even when the lobbying covers technical issues such as biotechnology or nuclear energy. See Appendix Table A1 where report information extracted from the biographies of lobbyists posted online by the lobbying firms.
8 Hansen (1991) suggests that “Lawmakers operate in highly uncertain environments. They have an idea of the positions they need to take to gain reelection, but they do not know for sure. Interest groups offer to help . . . They provide political intelligence about the preferences of congressional constituents.”

5
either the informational story or the connection story as a single, stand-alone driving force of this
industry.
The rest of the paper proceeds as follows. We first describe the pool of lobbyists and present some
summary statistics on their professional background (Section 2). We then define our measures of
connections and expertise (Section 3). Section 4 presents tests of whether and how connections to
politicians affect what lobbyists work on. Section 5 presents indirect evidence of informational transfer
between lobbyists and politicians. Section 6 presents our analysis of the premia associated with issue
expertise and connections, along with an analysis of returns over “issue cycles” and “political cycles.”
We conclude in Section 7. An online Appendix includes all the descriptive Tables and our robustness
checks.
2 The Lobbyists
We use lobbying registration information from the Senate Office of Public Records (SOPR) to build a
database of lobbyists for the period 1999 to 2008.9 Each of the records filed with SOPR contains not
only the name of the reporting firm and the name of the client firm or organization, but also the names
of the individual lobbyists that were involved in this specific lobbying case. It is therefore possible to
construct, starting with the lobbying records, a database that contains the names of all lobbyists that
were active at the federal level over the last decade.10 We identify about 37,000 individual lobbyists
9 Data on lobbying expenditures from the Senate Office of Public Records has been previously employed in a very small number of papers, some of which utilize only a very limited subset of the available information. Ansolabehere, Snyder and Tripathi (2003) focus on the link between campaign contributions and lobbying and show that the two are correlated, consistently with a view that campaign contributions are a way for interest groups to buy access to politicians. Once access is gained lobbyists have a chance to voice the interests of their clients. The paper also shows that the pattern of campaign contributions varies according to the intensity of lobbying of a given group. Baumgertner and Leech (2001) offer a partial analysis of the distribution of lobbyists across issues, finding high concentration in some issues and very low in others. Bombardini and Trebbi (2008) study trade association lobbying in international trade, while Igan, Mishra and Tressel (2009) and Mian, Sufi and Trebbi (2010) study lobbying by home mortgage firms during the US housing market expansion. Finally, Drutman (2011) and Kerr, Lincoln, and Mishra (2011) study empirically the decisions of firms to lobby and de Figueiredo and Silverman (2006) the lobbying decisions of universities.
10 Any type of information provision and research activity related to contacts to politicians requires registration. From the Office of the Clerk, Lobbying Disclosure Act Guidance: ‘Lobbying activity is defined in Section 3(7) as "lobbying contacts and efforts in support of such contacts, including . . . background work that is intended, at the time it is performed, for use in contacts, and coordination with the lobbying activities of others." If the intent of the work is to support ongoing and future lobbying, then it would fall within the definition of lobbying activities.’ Any individual paid to perform such activities in
6
between 1999 and 2008. The SOPR data also allow us to separate the lobbyists into two sub-groups
based on whether they are in-house lobbyists (these are the cases where the registering firm is the same
as the client firm in the lobbying report) or whether they work for a lobbying firm that is representing
another organization (the cases where the registering firm is different from the client firm). In what
follows, we refer to the former group as the “internal” (or in-house) lobbyists and to the latter group as
the “external” lobbyists.11 We can also use the SOPR data to compute, for each lobbyist*year
observation: number of years of experience (with the caveat of the right-tail truncation), and number of
records the lobbyist name is attached to in a given year. Furthermore, we can compute how many years a
given lobbyist appears as active over the sample period (10 years at most).
We rely on www.lobbyists.info to obtain additional time-invariant background information about the
lobbyists we identify in the lobbying records. This website, which was originally derived from the
directory “Washington Representatives” and is maintained by Columbia Books & Information Services
(CBIS), is the best information source we are aware of for federal lobbyists. Often included on the
website are short biographies that allow us to further profile the lobbyists. In particular, we searched for
specific strings in this online directory to build a set of background experience indicators, such as
whether a lobbyist has “Republican” or “Democrat” associations, whether the lobbyist has “House” or
“Senate” or “White House” experience, or whether the lobbyist is referred to as “Hon.” (the explicit title
for former members of Congress).12 Not all lobbyists identified in the SOPR data appear on
www.lobbyists.info; in practice, we found about 14,000 of the 37,000 lobbyists identified in the SOPR
data in www.lobbyists.info.13
excess of 20% of his work time and who establishes more than one lobbying contact with a politician over a quarter has to register as lobbyist.
11 If a lobbyist ever appears as both internal and external in a given year, we arbitrarily categorize her as external in that year. When we collapse the panel data at the lobbyist level, we also categorize as external a lobbyist that appears both as internal and external in different sample years.
12 To be specific, we first downloaded the whole directory by running a blank search on the database. Second, we run a series of searches conditional on matching certain strings of text in the bio, like "senate" or "house" or "Democrat", etc. Third, we merged together every single list against the whole set of lobbyists, generating a dummy conditional on the matching being successful (i.e. you get Democrat=1 if you are in the output of that search). Prior to converging on this coding method, we run about 200 manual spot searches to check that the method was producing reliable results.
13 Maybe not surprisingly given that we downloaded the directory information in 2009, we are more successful at identifying lobbyists that were active in the later part of the sample period than lobbyists that were active at the first few years. The match rate varies between the upper 30 percents at the beginning of the period to the mid 60 percents towards the end. Those

7
Table 1 summarizes the lobbyist-level data; the unit of observation is a lobbyist and all lobbyists are
equally weighted to compute these summary statistics. About 40 percent of lobbyists work in-house.14
The average lobbyist appears in the data for about four years and has nearly two years of experience;
he/she is associated with about 5 lobbying records in a typical active year. Among those lobbyists that
we can find in www.lobbyist.info, 97 percent have some biographical information associated with their
name. Among those, about 11 percent have some association to the Republican party and about 9.8
percent to the Democratic party. A bit more than 1 percent of the lobbyists for which we could find
biographical information are former members of Congress.15 About 2 percent of the biographies mention
some experience in the White House. There is also a large representation of former “aides” (11 percent)
and individuals with experience in senators’ offices (around 10 percent).16 We refer to Bertrand,
Bombardini and Trebbi (2011) for a description of how lobbyists’ background has evolved over time.
3 Measuring Connections and Expertise
3.1 Connections
A common view is that lobbyists’ main asset is their social network and, in particular, their personal
relations to lawmakers. In the words of Hon. John Boehner “many of the lobbyists who enter our offices
every day to represent their clients are, for all practical purposes, complete mysteries to us. Yet for the
House to function, some degree of trust is necessary. Many lobbyists are of the highest integrity and feel
as much of a duty to the House as a democratic institution as they do to their clients. But there’s every
lobbyists that can be identified in www.lobbyists.info typically have more years of experience and are associated with more lobbying records in each active year. See Table 1.
14 A widely held view of internal lobbyists is of watchdogs monitoring the day-to-day activity of Congress flagging potential issues of interests for their company (and calling in the professional external lobbyists when necessary). Such activity does not appear to require any particular expertise or connections. Hrebenar and Morgan (2009) highlight how many of the in-house lobbyists are also not full-time lobbyists and often volunteer or amateur lobbyists, especially with regard to groups dealing with moral, environmental, or religious issues.
15 A majority of those are ex-House Representatives, and about equal shares come from the right and left wings of the political spectrum (.7 percent and .6 percent, respectively).
16 Of course, these two groups can overlap.

8
incentive for those with more questionable ethics to shortchange us and the House. And absent our
personal, longstanding relationships, there is no way for us to tell the difference between the two.” 17
While investigative journalism has given us detailed accounts of relationships between legislators and
lobbyists, these accounts only provide spotty pictures that cannot be generalized to the entire lobbying
industry or lawmaking group. A clear difficulty in terms of painting a more complete picture is to build
a systematic measure of connections. We propose to exploit information on campaign contributions
lobbyists make to politicians to construct such a measure. Specifically, we search the campaign
contribution records kept by the Federal Election Commission to identify all campaign contributions
made by the lobbyists identified in the SOPR data. For each lobbyist, we can measure whether he or she
has made at least one contribution to a campaign over the sample period18 and we can count a lobbyist’s
average number of contributions in any given Congress; we can also tag those lobbyists that make
“many” campaign contributions in any given Congress (we arbitrarily define “many” as five or more).
One of the advantages of this measure is that it can be constructed for the universe of lobbyists.
Across all lobbyist-year observations, the fraction of lobbyists with at least one donation is 27 percent;
about 8 percent make contributions to many politicians. For external lobbyists the same figures (38%
and 14% respectively) are more than twice as large compared to in-house lobbyists. A detailed trend
analysis reported in Bertrand et al. (2011) shows that the frequency of connections has increased over
time.
How good is our proposed measure of connections at capturing personal relationships between lobbyists
and politicians? We perform several exercises to address this question. First we show that our measure
of connections performs reasonably well in subsets of the data for which we have detailed information
about relationships and when compared to the measure of connections in Blanes-i-Vidal et al (2012).
Second, we show that our measure of connections correlate with lobbyists’ and politicians’
characteristics that should intuitively make them more likely to be connected.
First, we verify that our measure of connections captures relationships that we can document through
other sources. Indeed, a concern about this measure is that it may systematically miss strong connections
17 John Boehner: For a Majority That Matters (January 9, 2006).
18 FEC disclosure requires indicating the individual name, occupation and employer of the donor, allowing a precise match to SOPR data. The FEC data identify 143,033 unique politician-lobbyist-congress links with 796 uniquely identified politicians, 12,514 unique lobbyist names, and a median donation of $500.

9
between lobbyists and politicians, since such connections may not require campaign contributions. To
build some sense of how much of a concern this is, we considered a group of 50 lobbyists with family
members serving in Congress (source: Public Citizen, 2007). Were campaign contributions just a weak
substitute for closer ties, we would expect to see no connections as we measure them (e.g. through
political donations) between these lobbyists and their family members in Congress. In fact, we found
that 30 percent of these 50 lobbyists make campaign contributions to their family members. As an
additional check, we also made use of a list of 21 lobbyists and public affairs consultants with strong ties
to Republican Congressman John A. Boehner published by the New York Times.19 Cross-checking with
FEC individual campaign contribution data we were able to recover 52 percent of the connections.
Hence, our connection measure, while certainly noisy, arguably correlates with strong ties.20
We also compare our measure of connections to the one recently proposed by Blanes-i-Vidal et al
(2012). They define a lobbyist-politician pair as connected if the lobbyist worked as an aid for that
Senator or Congressman before moving to K street. Naturally, the number of connections based on FEC
campaign contributions is larger than the number of connected pairs in Blanes-i-Vidal et al. (144,000 vs
1,354). Our FEC-based measure identifies 40.5% of the pairs in Blanes-i-Vidal et al. (2012).
In our second check, we investigate which lobbyists and politicians’ characteristics make them more
likely to be connected. This analysis is reported in Tables 2 and 3.We start with a lobbyist level analysis
(Table 2). Intuitively, we expect our measure of connections to be larger for lobbyists whose past
experience includes political jobs or working with politicians. The unit of observation in Table 2 is a
lobbyist and all lobbyists are equally weighted. There is unambiguous evidence that past experience on
19 Lipton (2010) [A GOP Leader Tightly Bound to Lobbyists, 09/11/2010, New York Times].
20 Another reason to believe that our measure may not pick up an existing connection is that, while a lobbyist may be connected to a politician, it is really the client hiring the lobbyist that is paying the campaign contributions to the politician, and not the lobbyist directly. This alternative concern may be partially addressed by considering the relationship between the campaign contributions received by politicians from lobbyists and from their clients respectively. While it is very cumbersome to explore any possible client-lobbyist-congressman connection in the data, the Center for Responsive Politics (CRP) presents lobbyist-client clusters of donations to members of Congress between January 2007 and June 2009. Clients must be members of the health care/health insurance industry and have hired at least ten outside lobbyists who display some campaign contribution to the same Congressmen as the clients contributed to. Under the view requiring clients to carry the bulk of the campaign donations relative to their lobbyists, the amount of campaign contributions received by congressmen from clients should vastly exceed the lobbyists’ donations. Quite the contrary, for 52 out of 61 congressmen identified by the CRP as recipients of lobbyist-client bundles, the amount of lobbyists’ contributions exceeds what paid by clients. The lobbyist-client difference is large and statistically significant with lobbyists contributing on average $14,642 more than their clients, an average relative difference of about +50.4 %.
10
the Hill or in the White House is associated with more connections to politicians through campaign
contributions. Consider the last 6 columns, where the dependent variable is a dummy variable that
equals 1 if the lobbyist makes campaign contributions to at least 5 politicians in the average Congress
we observe him in the lobbying records. We find (column 7) that former members of Congress and those
with some prior experience in the White House are respectively another 14 and 10 percentage points
more likely to maintain many connections to politicians. Lobbyists with associations with the
Republican or Democratic parties are respectively 10 to 14 percentage points more likely to fall in the
“many connections” category.Moving the focus to lobbyist-politician pairs, Table 3 provides evidence
on which lobbyists make campaign contributions to which politician. We perform this analysis
separately by Congress and present results for the 107th and 108th Congresses.21 We then create all
possible lobbyist-lawmaker pairs (by cross-matching the list of lobbyists with the list of Congressmen
and women) and create a dummy variable that equals 1 if the lobbyist in a pair has made a campaign
contribution to the lawmaker in that pair, 0 otherwise. We perform the analysis both with and without
lobbyist and lawmaker fixed effects. Standard errors are clustered at the lobbyist level. Maybe not
surprisingly, whether a given lobbyist contributes to a given politician’s campaign is systematically
related to whether the lobbyist and the politician share the same political ideology.
3.2 Expertise
An alternative to the idea that a lobbyist’s value lies in her connections is the view that lobbyists’ role is
to support and provide guidance to overly burdened legislators (and regulators) with much needed
expertise on often complicated topics. In this section, we construct measures of expertise (or
specialization) at the lobbyist level.
We propose to measure the extent to which lobbyists are experts by assessing how narrow or broad the
range of issues they work on is. This can be done with the SOPR data. Associated with each report is a
checklist of all the issues a given report is covering (the full list of issues is reported in Appendix A1,
while a sample report is presented in Appendix A2). More precisely, consider a report r at time t. The
report lists a number of issues Irt (where Irt is bound between 1 and 76 possible issues), the name of all
Lrt lobbyists employed and the dollar amount paid for lobbying services on those issues Irt at time t, Vrt.
21 Within each Congress, we restrict ourselves to the subset of lobbyists for whom we could find background information on www.lobbyist.info and are active during that term and to the subset of politicians that are Members of Congress during that term.

11
Let us assume that the report value is divided symmetrically across all lobbyists, so that the service of
each lobbyist l in the report is valued . If we impute this value symmetrically to all issues, then
the dollar amount for issue i and lobbyist l on report r at time t is . If lobbyist l works on
reports then we can indicate by the value of lobbying on issue i so that ∑ . We
sum across all active years for lobbyist l to obtain . Using these dollar values as weights, we
compute for each lobbyist l an issue-based Herfindahl Index (HHI) that measures how concentrated this
lobbyist’s assignments are across all possible issues I:
HHI
where ∑ .
As a complementary measure, we also generate a dummy variable called “specialist” that equals 1 if a
lobbyist spends (in dollar terms) at least a quarter of his assignments in each active year on the same
issue, as well as a dummy variable called “generalist” that equals 1 if a lobbyist never spends (i.e. in no
active year) more than a quarter of his assignments on the same issue.22
Across all years and all lobbyists our expertise measures lead us to qualify about a quarter of lobbyists
as specialists and about another quarter as generalists; the average issue-based HHI in the lobbyist panel
is .34. The share of specialists is higher for external than for in-house lobbyists. Bertrand et al. (2011)
reports a detailed analysis of the degree of specialization across lobbying firms and an analysis of the
trends in the number of specialists over time.
22 The measures of specialization we propose are subject to both downward and upward sources of bias. First, there are
typically multiple lobbyists assigned to a given lobbying report (the mean across reports is 3; the median is 2), and it is
possible that not all the lobbyists whose names are listed on a report cover all the issues associated with the report. Because
we do not observe when such within-report specialization occurs, we cannot account for it; this will lead us to underestimate
how specialized a given lobbyist is. Second, because lobbyists typically do not work for many years in our data (the average
number of active years is about 4), our proposed specialization measures may mistakenly classify as specialists those
lobbyists that appear on only a very limited number of reports or work for a very limited number of years; this will lead us to
overestimate the degree of specialization.

12
Analogously to Table 2, Table 4 relates specialization to lobbyist’s biographical information.23 The unit
of observation is a lobbyist and all lobbyists are equally weighted in these OLS regressions. We present
regressions both for all lobbyists (odd columns) and for those with at least 4 years of presence in the
SOPR data (even columns). The dependent variable in the first 6 columns is the “specialist” dummy; the
dependent variable in the last 6 columns is the issue-based HHI. The main theme that emerges from this
table is that lobbyists with prior political experience or political affiliations are less likely to be experts
on specific topics. For example (column 2), lobbyists with prior association with the Republican or
Democratic Party are about 5 percentage points less likely to be specialists. These patterns appear to be
more systematic and more precisely estimated among external lobbyists.
4 The Importance of Connections: Evidence from Lobbyists’ and Politicians’ Issue Assignment
In this section, we provide evidence that lobbyists’ connections to specific politicians are a significant
determinant of their work assignment. We first show that whom lobbyists give to (and most likely whom
lobbyists know) is systematically correlated to what issues they work on. In support of a causal
interpretation of this pattern, we further show that lobbyists switch issues in a predictable way as the
legislators they are connected to switch committee assignments.
4.A Are current connections related to current issue assignment?
The nature of the empirical exercise we perform in Table 5 is as follows. We start with the pool of all
Senators and House Representatives in a given Congress. We then use committee assignment
information to determine the specific lobbying issues each of these Members of Congress are
particularly tied to in that Congress.24 For instance, the powerful House Appropriations committee maps
into the lobbying Budget issue (BUD). We then create a dataset that includes all possible lobbyist-
legislator pairs in a given Congress by crossing the pool of active lobbyists with the pool of lawmakers.
For each lobbyist-legislator pair, it is possible to construct some measures of the “issue overlap”
between the legislator and the lobbyist in the pair. The first measure we propose simply counts the
number of issues a given legislator is assigned to (given his or her committee position in that Congress),
23 The sample here is of course smaller, e.g. limited to the subset of lobbyist we could identify in www.lobbyist.info and for whom detailed biographical data was available.
24 A list of committees and corresponding issues is in Appendix A3.

13
that also appear in at least one of the lobbying records associated with the lobbyist during that session of
Congress. We also define a dummy variable that equals 1 for a lobbyist-legislator pair if the lobbyist’s
records during that session of Congress cover all the issues assigned to the legislator in that Congress, 0
otherwise.
In this sample of all possible lobbyist-legislator pairs in a given Congress, we then test whether the issue
overlap between the lobbyist and legislator in the pair is systematically larger when the pair actually
exists in the campaign contribution data, e.g. when the lobbyist made a campaign contribution to that
legislator in any of the two years that Congress was in session. As in Table 3, we perform our analysis
separately by Congress and present for now results for the 107th and 108th Congress. (We obtained
qualitatively similar results for the other sessions of Congress covered in our sample time period).
Note that for each overlap measure and Congress we report the results of two regressions: one with
legislator fixed effects and one with lobbyist fixed effects; such fixed effects are important since, for
example, the overlap measures we have defined may largely vary across legislators simply based on
whether they are assigned to narrowly-focused committees or committees with broader mandates. Also,
standard errors are clustered at the lobbyist level.
There is systematic evidence across all Congresses that the existence of a campaign contribution
connection between a lobbyist and a legislator is associated with a higher likelihood that the lobbyist and
legislator work on the same issues. For example, the likelihood of a perfect issue overlap between a
lobbyist and a legislator (e.g. the lobbying records associated with that lobbyist during that session of
Congress cover all the issues associated with the legislator's committee) in a random pair in the 108th
Congress is 11.5 percent. The likelihood increases by 2.9 percentage points, or about 25 percent if the
lobbyist made a campaign contribution to that legislator (column 3, Table 5), controlling for whether the
lobbyist and legislator share political orientation or house or senate affiliations.25
25 We also replicated the analysis in Table 5 under the alternative measure of connection proposed in Blanes-i-Vidal et al. (2012) and compare it to our FEC-based one. We find no statistically significantly larger issue overlap for the connected pairs defined under the Blanes-i-Vidal measure; conversely we do find statistically significantly larger issue overlap for the connected pairs defined using the FEC-based measure (consistent with the findings in Table 5). One interpretation of this result is that lobbyists have several important connections, some of which with Senators or Congressmen that formerly employed them, but others as well, which appear in the FEC-connected pairs, but not in the Blanes-i-Vidal et al. pairs. Another interpretation is that having been a former aide does not always imply a lobbying relationship, or that the connections might have gotten cold. In fact, when we look at the issue overlap for the 59.5% pairs in Blanes-i-Vidal et al. that the FEC does not match we find that it is significantly lower than for the 40.5% that the FEC does match.

14
4.B Do previous connections predict future issue assignment?
The point of departure of this section is the finding in Table 5 that in any given period, there is a
correlation between whom lobbyists know and what they work on. There are however many different
ways to interpret such a correlation. We are particularly interested in separating two possible
interpretations. The first interpretation is that what determines what a lobbyist works on is whom he or
she knows: because a lobbyist knows a given politician, he or she has influence on that politician and
therefore is particularly effective in affecting outcomes related to the issues this politician’s committee
covers. In a sense, under this first interpretation, whom a lobbyist knows comes first and this determines
in great part what he or she works on. A second interpretation is that what a lobbyist knows determines
which politician he or she is more likely to establish some connections with. Under this second
interpretation, lobbyists are defined by what they know more than whom they know. However, there is
some friction in the communication of this expertise, maybe because of lawmakers’ overburdened
schedule and limited attention span. Campaign contributions are then a way to get politicians’ attention;
they serve as some grease in the transmission of information and expertise between lobbyists and
lawmakers.
In Table 6 we present an empirical test of whether lobbyists “stick to” the people they know when it
comes to what issues they work on. If lobbyists essentially provide companies with access to politicians
in their “circle of influence,” one would expect lobbyists’ job assignments to be determined by the
identity of the politicians in charge, independent of the specific issues being decided upon; hence a
lobbyist should “follow” a congressman that he or she knows as the congressman moves from one
committee assignment to another.
To perform that test, we isolate the subset of Congressmen that switch committee assignments between
Congress t and Congress t+1. We form all the possible pairs between a given Congressman and the
lobbyists in our sample, but because of computational constraints we cannot employ all the lobbyists, so
we adopt the strategy of keeping only those that work on similar issues as the politician before the
reassignment. For this group it is easier to establish whether the lobbyist follows the Congressman given
a common point of “departure”. We therefore keep the 3000 lobbyists (and therefore pairs) that are

15
closest to the Congressman in terms of issue overlap at time t (as previously defined). The data set is
formed by appending 3000 pairs for each “switcher” for each Congress. 26
We then ask in Table 6 whether the overlap of new issues covered by the lobbyist and the Congressman
in t+1 can be predicted by whether the pair was connected in Congress t. The dependent variable
isN , , the number of new issues for politician p in Congress t+1, that are also new to lobbyist l in
that Congress. We regress this new issue overlap on the connection dummy Clpt employed in Table 5,
which is equal to 1 if politician p is connected to lobbyist l in Congress t. We control for both overlap in
Congress t, , and for the overlap between the lobbyist in Congress t and Congressman in Congress
t+1, a ‘forward overlap’ measure we denote by , . The latter control captures the fact that the
lobbyist may be already working on the issues the legislator takes up as new assignment. Our ‘new issue
overlap’ estimating equation is:
, , , 1
where , is a normally distributed iid error term and , , , are, respectively, politician, lobbyist
and Congress-specific constants. This specification is amended in various ways to check for robustness
as indicated in the different columns of Table 6.
We also address the potentially non-random nature of the set of switchers with a selection model similar
to Heckman (1979). Although the large literature on committee assignment does not address the role of
lobbyists in facilitating politicians’ moves across committees, it is worth discussing it in our context.27
Two considerations are in order. First, if lobbyists connected to politicians could systematically
influence their committee assignments then this would point to connections being important. It is
otherwise not clear why a lobbyist would want a specific legislator on a specific committee. Second, it is
not obvious in what direction selection would affect out estimates. Nevertheless we specify a two-step
26 We include more than 3000 observations per politician if there is a higher number of lobbyists with perfect overlap of issues, which happens in a few cases where the politician works on very few issues.
27 See Frisch and Kelly (2004), Krehbiel (1990), Groseclose (1994), Adler and Lapinski (1997), Rhode and Shepsle (1973). The most closely related issue discussed in this literature is whether constituency interests affect a legislator’s committee requests and whether those requests are satisfied by the committee on committees. Frisch and Kelly (2004) show that the evidence weakly supports these hypotheses. In a comprehensive book on the topic Frisch and Kelly (2006) do not mention lobbyists as determinants of committee assignments.
16
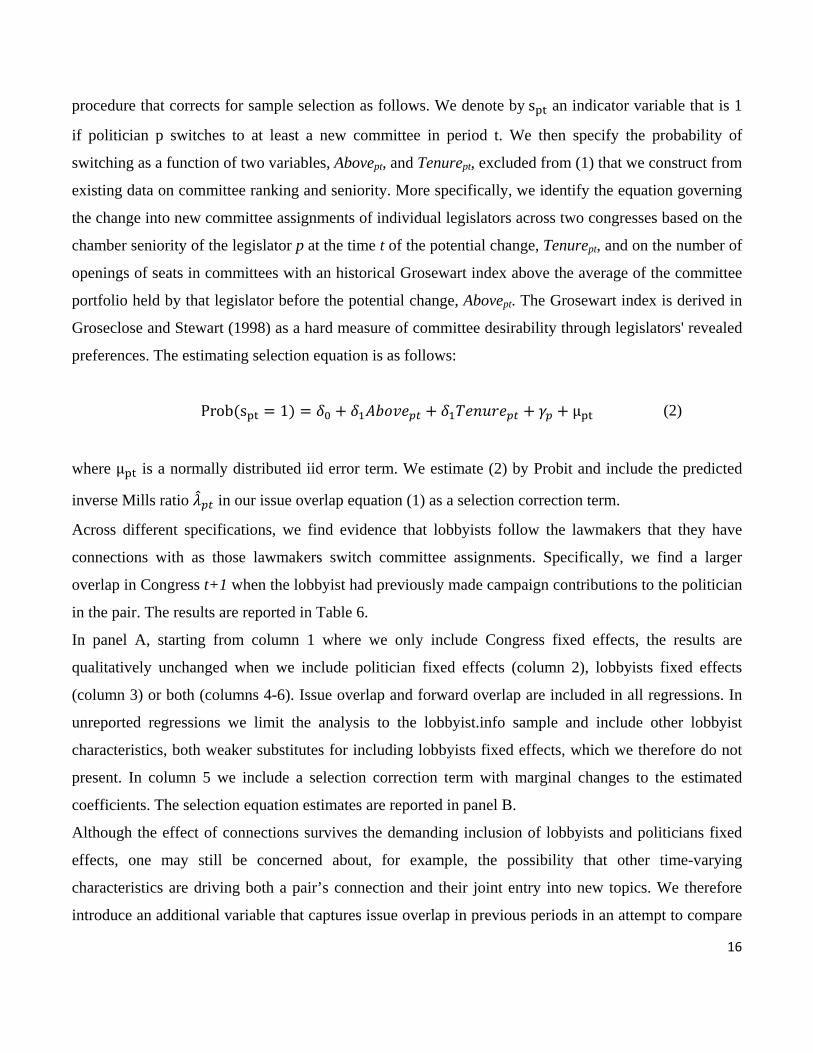
procedure that corrects for sample selection as follows. We denote bys an indicator variable that is 1
if politician p switches to at least a new committee in period t. We then specify the probability of
switching as a function of two variables, Abovept, and Tenurept, excluded from (1) that we construct from
existing data on committee ranking and seniority. More specifically, we identify the equation governing
the change into new committee assignments of individual legislators across two congresses based on the
chamber seniority of the legislator p at the time t of the potential change, Tenurept, and on the number of
openings of seats in committees with an historical Grosewart index above the average of the committee
portfolio held by that legislator before the potential change, Abovept. The Grosewart index is derived in
Groseclose and Stewart (1998) as a hard measure of committee desirability through legislators' revealed
preferences. The estimating selection equation is as follows:
Prob s 1 μ (2)
where μ is a normally distributed iid error term. We estimate (2) by Probit and include the predicted
inverse Mills ratio in our issue overlap equation (1) as a selection correction term.
Across different specifications, we find evidence that lobbyists follow the lawmakers that they have
connections with as those lawmakers switch committee assignments. Specifically, we find a larger
overlap in Congress t+1 when the lobbyist had previously made campaign contributions to the politician
in the pair. The results are reported in Table 6.
In panel A, starting from column 1 where we only include Congress fixed effects, the results are
qualitatively unchanged when we include politician fixed effects (column 2), lobbyists fixed effects
(column 3) or both (columns 4-6). Issue overlap and forward overlap are included in all regressions. In
unreported regressions we limit the analysis to the lobbyist.info sample and include other lobbyist
characteristics, both weaker substitutes for including lobbyists fixed effects, which we therefore do not
present. In column 5 we include a selection correction term with marginal changes to the estimated
coefficients. The selection equation estimates are reported in panel B.
Although the effect of connections survives the demanding inclusion of lobbyists and politicians fixed
effects, one may still be concerned about, for example, the possibility that other time-varying
characteristics are driving both a pair’s connection and their joint entry into new topics. We therefore
introduce an additional variable that captures issue overlap in previous periods in an attempt to compare
17
connected and unconnected pairs that have otherwise similar issue coverage progress over time. This is
done in column 6. The estimates are once again qualitatively unchanged.
The magnitude of the effect of connections is rather large. Considering that the overall mean overlap of
new issues at t+1 is 0.26, the estimated effect ranges between about 12% and 53% higher overlap for
connected lobbyists and politicians, depending on the source of variation we consider (i.e. the set of
fixed effects included).
This indicates that a previous connection increases the chance of a lobbyist following a politician to her
newly assigned topics by a substantial amount. This pattern is, we believe, an indication that connections
are important determinants of what lobbyists work on.
In appendix Table A7 we repeat the analysis in the sample of freshmen, i.e. Congressmen that enter
Congress at t+1. Notice that we still observe contributions during the campaign stage and therefore all
variables of interest, except for issue overlap at t, can be defined for this sample. Since we are including
all lobbyists, Table A7 performs the analysis separately for sets of Congresses, for computational
reasons. Since freshmen start with no committee assignment, of course selection into switching is not a
concern in this case. The results are largely confirmed: as freshmen are elected and are assigned to given
committees, lobbyists who gave them campaign contributions start working on the same issues
(controlling for whether the lobbyist was already working on those issues).
An alternative and simple, although indirect, way of quantifying the degree to which lobbyists enter new
issues as politicians switch to new committee assignments is to relate the amount of churning for these
two groups. More specifically, for each issue and congress we calculate the fraction of new congressmen
assigned to the issue and the share of dollars spent on the issue coming from lobbyists that did not work
on the issue in the prior congress. When weighting by dollar amount attached to the issues, the
correlation between the two “entry” variables is 40%. This implies that, if all congressmen were new to
an issue, then 40% of lobbyists in dollars terms would be new to the issue. This figure is 80% if we limit
the analysis to those issue-congress observations that are above the median in terms of the share of
Congressmen that have at least one connection to lobbyists.
5. The Importance of Expertise: an “Opposite Bias” Test
A role for connections does not imply that lobbyists’ expertise about certain topics is irrelevant to their
job. Once access has been gained, the lobbyists may still provide useful information to the politicians. In

18
this section we present a test aimed at detecting the presence of information transmission between the
lobbyist and the politician, and hence a role for lobbyists’ expertise. Absent direct measures of
informational flows all tests of informational lobbying, by necessity, need to be indirect. At the same
time one would require such tests to be sufficiently discriminating across alternative hypotheses. The
goal is to reject the null hypothesis of no informational lobbying by presenting evidence that can be
parsimoniously explained only by informational lobbying models. These conditions make sharp tests of
this kind rare in the literature.
Our test is based on the theoretical literature in multiple sender communication. For example consider
the cheap talk setup in Krishna and Morgan (2001) and Grossman and Helpman (2001) where two
informed, but biased lobbyists send messages to influence the action of a single uninformed policy
maker. The messages sent by the lobbyists are aimed at informing the politician about the state of
nature, which in turn determines the optimal action to take. Importantly, when the two lobbyists have
opposite biases (relative to the policy maker), the policy maker can learn more precisely what the true
state of nature is (and could also become fully informed under some conditions). This is because the
credibility of a message sent by a lobbyist is enhanced by the presence of another lobbyist that also
sends a message and this mechanism prevents both lobbyists from exaggerating their messages to bias
policy in their favor. Interestingly, Krishna and Morgan (2001) show that not only the policy maker, but
also both lobbyists, benefit, relative to the case of only one lobbyist sending a message. Notice that,
although the mechanism is slightly different, an analogous prediction holds in costly signaling models,
like Battaglini and Benabou (2003). We take this prediction as a starting point to construct our test.
We focus on the set of lobbyists connected to a given politician based on our FEC data. A precise
measure of the direction of bias of the lobbyist is given by the political affiliation of the lobbyist, which
we derive from www.lobbyists.info. We construct a measure of the composition of the pool of lobbyists
a given politician listens to in every period as follows. The variable Spt measures the share of all
lobbyists linked to politician p at Congress t that have an opposite political affiliation (i.e. are
Republican if the politician is a Democrat). We test whether the share of “opposite bias” lobbyists Spt is
larger for the set of specialist lobbyists than for non-specialists. In particular for each politician and
Congress we generate two separate shares, one for specialists, 1, and one for non-specialists, 2,
and estimate the fixed effects specification:

19
1 ,
where . is the indicator function.
Information acquisition on the part of the legislator would require the presence of opposite party
lobbyists especially for the specialists, the subset of lobbyists in which informational lobbying is more
likely to be detected and relevant, or 0. This would lend empirical support to Krishna and
Morgan’s result.
Notice the disciplining effect of the test. Alternative interpretations of lobbying, such as a pure favor
exchange hypothesis, do not supply a clear intuition for 0. A quid-pro-quo argument, for instance,
would justify connections to an overall higher number of lobbyists from the same political party, i.e. an
Spt substantially below 0.5 (it may be cheaper to buy favors from a politician with the same policy
views). But a quid-pro-quo model would provide no intuitive reason for why the share of opponent party
lobbyists should be systematically higher when computed for issue specialists compared to non-
specialists connected to a given politician.
Table 7 reports the results by pooling all politicians and Congresses. It also splits samples across all the
different Congresses and across political party of the legislator. While the pooled results reassure about
the generality of the finding, the sample splits will reassure about specific subsamples not driving our
result.
Column (1) of Table 7 reports the estimated differential for a specification only including Congress
fixed effects, while Column (2) adds legislator fixed effects. In the pooled sample the estimated mean
share of non-specialists from the opposite party is about 17%, which increases by 9 percentage points
when considering the group of specialist lobbyists affiliated to the politician. This is an increase of about
53% percent, so particularly sizeable, and stable across specifications. Splitting our analysis Congress by
Congress in Columns (3)-(7) produces estimates of ranging from 7% in the 110th to 12% in the 107th
Congress. All estimates are statistically significant at 1 percent confidence level. Splitting between
Democrat (Column 8) and Republican legislators (Column 9) produces strong and significant
differentials across samples as well. We estimate at 15% for Democrats and around 5% for
Republicans, both statistically significant at 1 percent confidence level. Separating between House

20
representatives and Senators delivers estimates of 9% and 11% for the House and Senate respectively
(not reported in the table for brevity).
6 Connections and Issue Expertise: Evidence from Lobbying Returns
6.A Report-level analysis
Our analysis so far suggests that both lobbyists’ personal access to lawmakers and their expertise seem
to be at work in the lobbying process. Nevertheless one may still wonder if they are also equally valued
and scarce resources. We therefore propose a complementary approach to assess the relative importance
of access versus issue expertise by asking how much these two assets are paid. Who is paid more? Is it a
lobbyist with lots of connections to politicians, or a lobbyist that masters the intricate details of health
care policy or financial market reforms? Unfortunately, we do not have any information on lobbyists’
income.28 But we do observe the price tag associated with each lobbying report. It is therefore possible
to assess how the characteristics of the lobbyists that are assigned to a report relate to how much was
spent on that report. We perform this analysis in Table 8. Because of computational constraints and
because the previous patterns we have documented are more pronounced for external lobbyists we limit
our analysis to this group. An obvious limitation of this empirical approach is that we cannot isolate the
contribution of an individual lobbyist to a given report (recall that most reports have more than one
lobbyist assigned to it). In Table 9, we will present an alternative approach where we try to get at
individual lobbyists’ value-added to a given report by estimating a vector of lobbyist fixed effects.
Before discussing the report-level analysis in Table 8, we report in Appendix Table A8 the total dollar
decomposition of lobbying aggregate amounts by category of lobbyists. Connected lobbyists and
lobbyists with multiple connections not only command a very large share of the industry in terms of
aggregate revenues, but also stand out in terms of amounts per lobbyists (connected lobbyists cover 42
percent of the revenues but are only 25 percent of the industry population). Specialists command
substantially lower shares, even if they represent 25 percent of the population. For external lobbyists the
patterns are even more pronounced.
28 Concerning payment structures: “There are several fee structures on K Street, from annual retainers and lump sums for specific projects to monthly and even hourly rates. […]. But it is most common to find clients paying a monthly rate. Universities, local and municipal governments, and companies that are most closely focused on the appropriations process pay fees of between $5,000 and $30,000 a month. […] [LobbySearch: The Who, When, and How Much of Hiring a Lobbyist].

21
The size of the premium on connections compared to expertise is evident in the report-level analysis of
Table 8. The unit of analysis is an external lobbying record, as defined in the SOPR data. The dependent
variable is the logarithm of the dollar amount attached to that report, ln(Vrt). All regressions reported in
Table 8 include a vector of year dummies, a vector of dummies for report type (e.g. end-of-year report
or mid-year report), and a vector of dummy variables for the issues that are being covered in the report.
We also control non-parametrically for the number of lobbyists included in the report (with separate
indicator variables for all numbers –from 1 to 62). Finally, all regressions include controls for the
average tenure of the lobbyists assigned to the report, as well as the average number of active years
among these lobbyists over the entire sample period and the average number of reports per lobbyist on
the team per year. For ease of interpretation we construct two dummy variables. The first one equals 1 if
there is at least one specialist in one of the issues covered by the report. The second dummy equals 1 if
there is at least a lobbyist on the report that is connected to a politician that works on an issue in that
report.
We find qualitatively similar results across all specifications. Specifically, everything else equal, we find
a premium of about 3 to 5 percent for a lobbying report that has a relevant specialist, while that premium
is about 8 to 10 percent for a report with a relevant connected lobbyist. Overall, having a specialist on
the team comes at a premium, but having connected lobbyists commands a premium twice as large.
Given an average report amount Vrt of $63,200, this implies a per-report premium of $5,056-$6,320 per
connected lobbyist29.
The last column of Table 8 introduces a number of characteristics of the lobbyists on the report. We find
additional premia for most of the variables that describe the political background of the lobbyists on the
team. Everything else equal, staffing a lobbying case exclusively with former Members of Congress
increases its price by about 12 percent. Teams composed of lobbyists with Democratic and especially
Republican affiliations cost more. The largest premium we observe is for lobbyists with past experience
in the White House.
6.B. Lobbyist-Level Analysis
29 The premium is computed per report and thus needs to be further multiplied by the number of reports on which a lobbyist typically works on (between 23 and 45 per year on average and assuming that a connected lobbyist works on reports where he is connected to a politician that works on an issue in that report) to obtain a yearly connection premium. This places the value of a connection in excess of $116,000 per year.

22
The report-level analysis above suggests interesting patterns that can be further investigated moving to
an individual lobbyist analysis. As indicated above, one of the difficulties with the report-level analysis
is that we cannot zero in on the value added of a specific lobbyist. Hence, we can only estimate premia
at the working team level. For a subset of lobbyists that can be observed working with diverse set of co-
workers, though, it is possible to estimate fixed effects in the dollar amount associated with having their
name attached to a lobbying report.
Specifically, we start with a dataset where the unit of observation is at lobbyist*lobbying report level.
We define as the dependent variable the logarithm of the total dollar amount associated with that
lobbying report ln(Vrt) (the same dependent variable as in Table 8, ln(Vrt) is now replicated for each
lobbyist in the report). We then estimate lobbyist fixed effects in a regression that also includes year
dummies, a vector of indicator variables for all issues or topics, and non-parametric controls for the
number of lobbyists associated with the report Lrt (e.g. dummies for each possible size of the lobbying
team).
Intuitively, it should be clear that such lobbyist fixed effects cannot be estimated for all individuals. To
fix ideas, consider a pair of lobbyists that always work together. It will be impossible to separately
estimate separate fixed effects for each of them. Instead, we will only be able to compute fixed effects
for those lobbyists that we observe as part of changing teams across lobbying reports. Because the
estimation of such individual fixed effects (and the standard errors associated with them) is quite
computationally intensive, we restrict the sample to external lobbyists that are active in at least 6 years
over the entire sample period. Furthermore, this condition guarantees lower measurement error in the
fixed effect estimates.30
Once we have computed the lobbyist’s fixed effects, we can then relate them to each lobbyist's level of
expertise, connections and past professional experience. We do this in Table 9, where the unit of
observation is a lobbyist and the dependent variable is the estimated lobbyist fixed effect derived from
the regression outlined above. We estimate median regressions, which allow us to better address outlier
concerns; we also weigh each observation by the inverse of the standard error associated with the
estimated fixed effect for that lobbyist/observation further accounting for noise in the estimation.
30 For estimating each fixed effect at least six observations are available. For a related discussion Besley and Preston (2007) who discuss the issue of consistency of the individual-specific fixed effects in the case of assessing bias of local authorities with small T.

23
Before moving to the regression results, we discuss Figures A2 and A3, which graphically show how the
distribution of lobbyist fixed effects relate to both their expertise and their level of connections. In
Figure A2, we see that the distribution of fixed effects for specialists and non-specialists are almost
identical. When we separate lobbyists into those with high (>.33) and low issue-based HHI, we find the
distribution of fixed effects for the high HHI group to be more spread out and with more mass towards
low fixed effects compared to the distribution of fixed effects for the low HHI group. Hence we observe
no premium associated with issue expertise. If anything, those lobbyists that concentrate on fewer issues
appear to come at a discount. Figure A3 plots the distributions of lobbyist fixed effects for those with no
political connection and those with at least one connection (top), as well as for those with 5 connections
or more in any given Congress and those with less than 5 connections (bottom). In both cases, it is very
clear that the distribution of fixed effects for those with some or many connections is shifted to the right
compared to the distribution for those with no or few connections.
The regression analysis in Table 9 qualitatively confirms the patterns we observed in Figure A3. Issue
experts do not receive a premium.31
In contrast, there is a positive and significant premium associated with having more political
connections through campaign contributions. The premium appears to be especially large for those
lobbyists that entertain many connections to politicians (6 to 10 percent). Even after controlling for
connections, we still find a large premium associated with some of the political background
characteristics. In particular, everything else equal, past experience in the White House increases a
lobbyist fixed effect by 12 to 15 percent. The premium associated with affiliation to the Republican
party is larger and more precisely estimated than the premium associated with the Democratic party. The
estimated coefficient for former Member of Congress is quantitatively smaller (2 to 8 percent) and less
precisely estimated here than in the report-level analysis in Table 8.32
6.C. Political Cycles and Issue Cycles
31 This evidence can be reconciled with the report-level results: the fixed effect analysis provides a measure of the average return to a specialist, which is revealed to be lower than for non-specialists. This is not in contrast with the fact that when they work on issues on which they are experts, specialists may receive a higher than average compensation.
32 In regressions not reported here, we also tested for the possibility that expertise might only be valuable when combined with connections, a possibility that seemed in keeping with some of the patterns we observed in Table A9. We tested for this hypothesis in both the report-level analysis and the lobbyist fixed effect analysis. We did not find this interaction term to be economically or statistically significant.

24
In this section we perform alternative exercises aimed at measuring whether premia associated to issue
expertise or to connections change with, respectively, the ‘political cycle’ and the ‘issue cycle’. More
specifically in our first exercise we ask whether a lobbyist that has affiliation to a specific party sees his
average return increase as this party moves to a position of power.
Figure 1 presents evidence that connections to politicians matter for lobbyists’ professional activities
and particularly for their average revenue. In computing those measures, we assign to each lobbyist on
the report the average per lobbyist dollar amount on that report Vrlt, aggregate over each year and take
logs. Figure 1 reports the Republican lobbyist revenue premium in percentage terms relative to a
Democratic lobbyist (benchmarked at zero) based on total per-lobbyist per-year amount reported in the
SOPR data. Republican lobbyists tally higher revenues during Republican Congresses and Republican
administrations (up to 30% more during the first year of Bush’s second term).33 The political cycle is not
driven by specific issues being more likely to be associated to certain parties. Revenue premia are
virtually unchanged running the specification issue-by-issue in the vast majority of issues. This
estimated revenue cycle can be attributed to a decrease in the value of connections when political allies
are out of office. In this sense this result is very much in line with the finding of Blanes-i-Vidal, Draca,
and Fons-Rosen (2010) that assess a 20% drop in revenues occurring to lobbyists with past experience
as senatorial aides when their connected Senator leaves office.
In Appendix Table A9, we also report, by year, total lobbying expenses associated with lobbyists with a
Republican affiliation and total expenses associated with lobbyists with a Democratic affiliation. We
also report, by year, number of active lobbyists with Republican or Democratic affiliations. The patterns
in this data match political cycles. In particular, the Republican-Democratic gaps (columns 3 and 6)
appear smallest in the very first years of the sample (Democratic President) and the last few years
(Democratic Congress). Hence, Republican (Democratic) lobbyists seem to be professionally more
active when political power in Washington moves to the right (left).
In our second exercise we ask whether the average return to an issue-specialist increases in periods
where that issue becomes more popular and spending on that issue increases overall (perhaps because a
relevant piece of legislation is being discussed in Congress or at the committee level). We construct our
33 The picture also clearly emphasizes the success of the so-called K-Street Project implemented by the Republican party leadership during the first part of the 2000’s. The project was a “database intended to track party affiliation, hill experience and political giving of every lobbyist in town.” [Confessore (2003), Welcome to the Machine, 03/07/2003, Washington Monthly] with the explicit aim of selectively assigning political access to GOP lobbyists.

25
measure of issue cycle as follows. Consider the value of report r at time t, and divide it by the
number of issues on that report . This generates an average value per issue i on report r, . Then we
sum across all the reports that contain issue i at time t, to obtain , the total amount spent on issue i
at time t:
For each lobbyist l we construct a variable that captures whether the issue in which the lobbyist is an
expert is booming. Define the set of issues for which lobbyist l is a specialist as and then construct a
lobbyist-specific issue cycle measure :
In Table 10A we show that the adjustment during a boom is mainly in terms of non-specialists entering a
given issue. More specifically the first panel shows that the total number of lobbyists working on a given
issue increases when the issue expands, while the second panel shows that the share of issue-specialists
declines during an issue boom, hinting to the fact that entry is primarily by non-experts. This seems to
point to relatively low barriers to entry in a specific issue. In Table 10B the dependent variable is the
average return for lobbyist l at time t, (previously defined). The results show that the average return
to a lobbyist does not seem to respond to an expansion, in dollar terms, of the issues in which a lobbyist
is specialized.
Taking the analysis in Tables 8, 9, and 10 as evidence of what lobbyists' characteristics are most prized,
we do not find support to the view that expertise is the scarce resource. Instead, the lobbyists that appear
to earn a premium are those that have connections to many politicians and to the ruling political party.
At first glance, the barriers to entry in establishing connections to politicians of the type we track here
appear quite low (the median campaign donation is $500). Such low barriers to entry seem inconsistent
with the view that “connected” lobbyists would maintain a sustainable comparative advantage of the
magnitude we measure here. What is likely going on is that the campaign contributions are a symptom
of deeper connections between lobbyists and politicians, which cannot easily be replicated by others. In
contrast, it appears that the barriers to entry into issue expertise are either indeed quite low (maybe the
experts do not need to be the lobbyists themselves, but can be brought in from industry or academia) or
that issue expertise is not necessarily instrumental to “winning” a lobbying case.

26
7. Discussion and conclusions
Our objective in this paper was to provide some guidance on what lobbyists actually do. We were
motivated by two opposite views of lobbyists that have been discussed both in the policy and media
circles and in the academic literature34. The first view considers lobbyists as issue experts who can
contribute valuable information to the law- and rule-making process; the second considers them more as
sources of access to lawmakers, because of their personal ties and knowledge of those lawmakers.
The main takeaway from our analysis is that a pure issue expertise view of lobbying does not fit the data
well. Instead, maintaining connections to politicians appears important to what lobbyists do. Such
connections however need not necessarily raise a flag about unethical or illegal practices. In fact, if we
think deeper about what role connections may play, we can conceive two theoretically sensible roles that
connections may play and that are not welfare reducing. The first and simplest one is a scenario in which
lobbyists, not experts themselves, report to politicians the information produced by expert researchers
working for the lobbying firm. Such view of lobbyists as mere “messengers” is, we believe,
incompatible with the large fees assessed for their services. 35 The price tag attached to lobbyists’
services suggests a second view of what connections represent: connected lobbyists are likely to bring to
the table a complementary resource, perhaps reputation, credibility or political savvy, in the transmission
of information.
The second takeaway is that, although we find relationships to be important, we also find some evidence
that supports the view that at least a subset of lobbyists does have expertise, i.e. concentrates her work in
a specific area. More importantly, we show that politicians listen to a larger share of lobbyists with
opposite political views when those are classified as issue experts. It would be hard to justify this kind of
pattern in a quid-pro-quo setting and it is more suggestive of the existence of some form of information
transmission between expert lobbyists and politicians.
While both lobbyists’ expertise and their connections might be at play in the lobbying process, the value
analysis suggests that connections are the scarcer resource and therefore the one that commands the
34 Heinz et al. (1993); Salisbury et al. (1989).
35 Birnbaum (2005): “Starting salaries have risen to about $300,000 a year for the best-connected aides eager to ‘move downtown’[to K street in 2005] from Capitol Hill or the Bush Administration.” [The Road to Riches Is Called K Street, 6/22/2005, The Washington Post]

27
highest price. We believe the mechanism by which information and reputation complement each other
and combine in creating value in the services of lobbyist is intriguing and deserves attention in future
theoretical research.

28
References
Adler, E. Scott, and John S. Lapinski. 1997. “Demand-Side Theory and Congressional Committee
Composition: A Constituency Characteristics Approach.” American Journal of Political Science
41: 895-918.
Ainsworth, Scott (1993) “Regulating Lobbyists and Interest Group Influence” Journal of Politics, Vol.
55(1), pp. 41-56.
Apollonio, Dorie, Bruce E. Cain and Lee Drutman (2008). “Access and Lobbying: Looking Beyond the
Corruption Paradigm”. Hastings Constitutional Law Quarterly, Volume 36, issue 1.
Ansolabehere, S., J. Snyder, and M. Tripathi (2003). “Are PAC contributions and lobbying linked? New
Evidence from the 1995 Lobby Disclosure Act”. Business and Politics 4(2):131-155.
Austen-Smith, David (1987). "Interest Groups, Campaign Contributions and Probabilistic Voting."
Public Choice 54(2): 123-39
Austen-Smith, David (1994). “Strategic Transmission of Costly Information”, Econometrica 62, pp.
955–963.
Austen-Smith, David (1995). "Campaign Contributions and Access." American Political Science
Review 89:566-81.
Baron David P. (1989) "Service-induced campaign contributions and the electoral equilibrium",
Quarterly Journal of Economics 104(1), pp. 45–73
Baron, David P. (1994). "Electoral competition with informed and uninformed voters", American
Political Science Review 88(1), pp. 33–47.
Battaglini, M. and R. Benabou (2003): "Trust, Coordination, and The Industrial Organization of Political
Activism," Journal of the European Economic Association, 1(4): 851-889.
Baumgartner, F.R. and B. Leech (2001) " Interest Niches and Policy Bandwagons: Patterns of Interest
Group Involvement in National Politics" Journal of Politics 63 (4), pp. 1191-1213.
Bennedsen, M. and S.E. Feldmann, Lobbying legislatures, Journal of Political Economy 110 (2002) (4),
pp. 919–948.
Bertrand, M., M. Bombardini and F. Trebbi (2011) “Is it Whom You Know or What You Know? An
Empirical Assessment of the Lobbying Process” NBER Working Paper No. 16765
Besley, Tim, and Steve Coate (2001) "Lobbying and welfare in a representative democracy", Review of
Economic Studies 68, pp. 67–82.

29
Besley, Tim, and Ian Preston (2007) “Electoral Bias and Policy Choice: Theory and Evidence”
Quarterly Journal of Economics, 122(4), pp. 1473-1510.
Blanes-i-Vidal, Jordi, Mirko Draca, Christian Fons-Rosen (2012) “Revolving Door Lobbyists”,
American Economic Review, forthcoming
Bombardini, M. and F. Trebbi (2011) “Votes or Money? Theory and Evidence from the US Congress”
(with Francesco Trebbi), Journal of Public Economics, 95(7-8), pp. 587-611
Bombardini, M. and F. Trebbi (2008) " Competition and Political Organization: Together or Alone in
Lobbying for Trade Policy?" Journal of International Economics, Vol. 87-1, pp. 18-26
Calvert, R.L. (1985) "The value of biased information: a rational choice model of political advice",
Journal of Politics 47, pp. 530–555.
Crawford,V., and J. Sobel, (1982) "Strategic Information Transmission", Econometrica 50, pp. 1431–
1451.
de Figueiredo, John and Brian S. Silverman. (2006). Academic Earmarks and the Returns to Lobbying.
Journal of Law and Economics, 49(2) (October), 597-626.
Dixit, A., G.M. Grossman and E. Helpman (1996) “Common agency and coordination: general theory
and application to government policy making”, Journal of Political Economy 105 (4), pp. 752–769.
Drutman, Lee (2011) “The Business of America is Lobbying: Explaining the Growth of Corporate
Political Activity in Washington, DC” mimeo.
Frisch, S.A. and S. Q Kelly (2004). ‘Self-Selection Reconsidered: House Committee Assignment
Requests and Constituency Characteristics,’ Political Research Quarterly, 57 (2) 325–36.
Frisch, S.A. and S. Q. Kelly (2004). Committee Assignment Politics in the U.S. House of
Representatives. University of Oklahoma Press
Goldberg, P. K. and G. Maggi (1999). "Protection for Sale: An Empirical Investigation." American
Economic Review 89(5): 1135-55.
Groseclose, Tim. 1994. “Testing Committee Composition Hypotheses for the U.S. Congress.” Journal of
Politics 56: 440-58.
Groseclose, Tim, and Charles Stewart III. 1998. “The Value of Committee Seats in the House, 1947–
91.” American Journal of Political Science 42 (April): 453–74.
Grossman, G. M. and E. Helpman (1994). "Protection for Sale." American Economic Review 84(4):
833-50.

30
Grossman G.M. and E. Helpman, Special Interest Politics, MIT Press, Cambridge (2001).
Grenzke, J. M. (1989). "PAC’s and the Congressional Supermarket: The Currency Is Complex."
American Journal of Political Science 33:1-24.
Hall, Richard L., Frank W. Wayman (1990) “Buying Time: Moneyed Interests and the Mobilization of
Bias in Congressional Committees” The American Political Science Review Vol. 84, No. 3, pp. 797-820
Hansen, J. M. (1991) “Gaining Access: Congress and the Farm Lobby, 1919-1981”. Chicago: University
of Chicago Press.
Heckman, J. J. (1979) “Sample Selection Bias as a Specification Error.” Econometrica, 47, l,
53-161.
Heinz, John P., Edward O. Laumann, Robert L. Nelson, Robert H. Salisbury (1993) “The Hollow Core:
Private Interests in National Policy Making” Harvard University Press
Herndon, J. F. (1982) "Access, Record and Competition as Influences on Interest Group Contributions
to Congressional Campaigns." The Journal of Politics 44:996-1019.
Hrebenar, Ronald and Bryson Morgan (2009) “Lobbying in America” ABC-Clio Inc. Santa Barbara,
California.
Igan D., Mishra P., Tressel T. (2009), "A Fistful of Dollars: Lobbying and the Financial Crisis", NBER
Macro Annual.
Kerr, William, William Lincoln, and Prachi Mishra (2011) “The Dynamics of Firm Lobbying” HBS
mimeo.
Krishna, Vijay, and John Morgan, 2001, A model of expertise, Quarterly Journal of Economics 116,
747–775.
McGrath, Conor, (2006) “The Ideal Lobbyists: Personal characteristics of effective lobbyists” Journal of
Communication Management Vol. 10 No. 1, pp. 67-79
Mian, Atif, Amir Sufi and Francesco Trebbi (2010), “The political economy of the subprime mortgage
credit expansion”, NBER WP 16107.
Langbein, L. I. (1986) "Money and Access: Some Empirical Evidence." The Journal of Politics 48:1052-
62.
Lohmann, S. (1995) “Information, access, and contributions: a signaling model of lobbying”, Public
Choice 85 (1995) (3-4), pp. 267–284.

31
Potters, J. and F. Van Winden (1990) "Modeling Political Pressure as Transmission of Information"
European Journal of Political Economy 6, pp. 61-88
Potters, J. and F. Van Winden (1992). "Lobbying and asymmetric information" Public Choice 74(3), pp.
269-292
Rohde, David W., and Kenneth A. Shepsle 1973. “Democratic Committee Assignments in the House of
Representatives: Strategic Aspects of a Social Choice Process.” American Political Science Review 67:
889-905.
Salisbury, Robert H., Paul Johnson, John P. Heinz, Edward O. Laumann and Robert L. Nelson. 1989.
“Who You Know versus What You Know: The Uses of Government Experience for Washington
Lobbyists” American Journal of Political Science Vol. 33, No. 1, pp. 175-195
Snyder, James M. (1990). "Campaign Contributions as Investments: The House of Representatives,
1980-1986." Journal of Political Economy 98(6): 1195-227.
Snyder, James M. (1991) "On buying legislatures", Economics and Politics 3 (2), pp. 93–109.
Stewart, Charles III and Jonathan Woon. 2009. Congressional Committee Assignments, 103rd to 111th
Congresses, 1993—2009.
Strömberg, D. (2008) "How the electoralcollege influences campaigns and policy: the probability of
being Florida" American Economic Review 98 (3), 769-807.
Wright John R. (1990) “Contributions, Lobbying, and Committee Voting in the U.S. House of
Representatives” The American Political Science Review, Vol. 84, No. 2, pp. 417-43
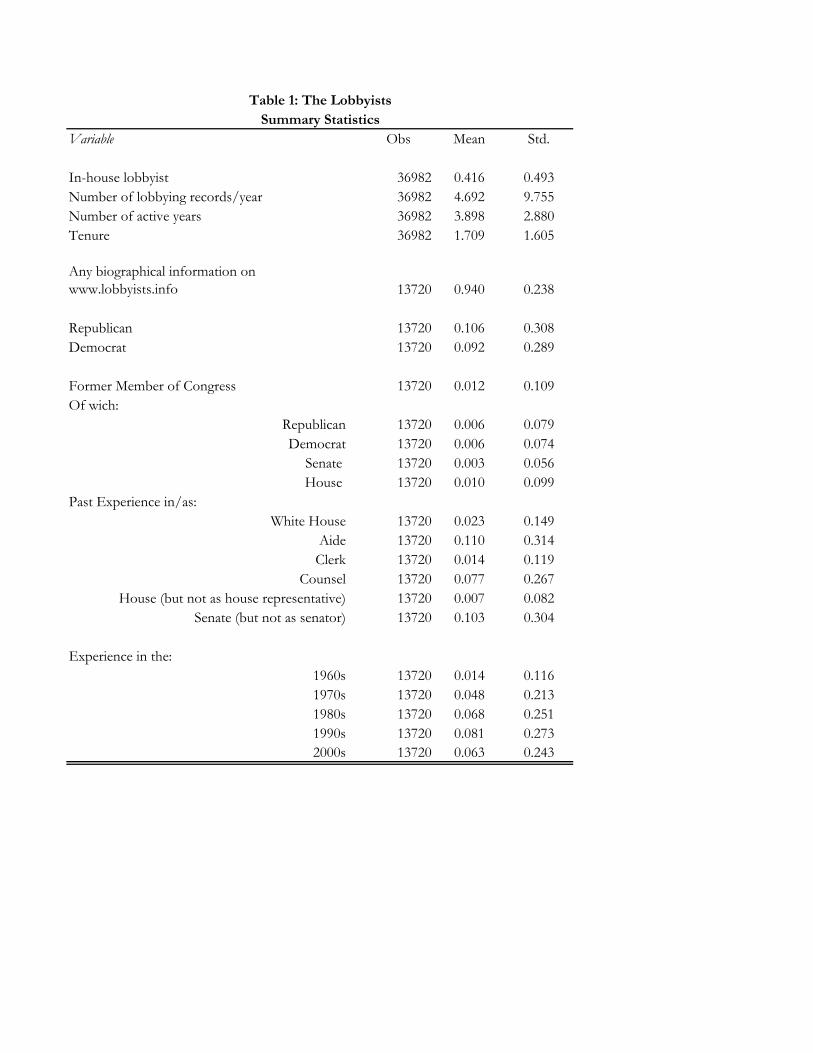
Variable Obs Mean Std.
In-house lobbyist 36982 0.416 0.493Number of lobbying records/year 36982 4.692 9.755Number of active years 36982 3.898 2.880Tenure 36982 1.709 1.605
Any biographical information on www.lobbyists.info 13720 0.940 0.238
Republican 13720 0.106 0.308Democrat 13720 0.092 0.289
Former Member of Congress 13720 0.012 0.109Of wich:
Republican 13720 0.006 0.079Democrat 13720 0.006 0.074
Senate 13720 0.003 0.056House 13720 0.010 0.099
Past Experience in/as:White House 13720 0.023 0.149
Aide 13720 0.110 0.314Clerk 13720 0.014 0.119
Counsel 13720 0.077 0.267House (but not as house representative) 13720 0.007 0.082
Senate (but not as senator) 13720 0.103 0.304
Experience in the: 1960s 13720 0.014 0.1161970s 13720 0.048 0.2131980s 13720 0.068 0.2511990s 13720 0.081 0.2732000s 13720 0.063 0.243
Table 1: The LobbyistsSummary Statistics

Sample:Restrict to at Least 4 Active Years? No Yes No Yes No Yes No Yes No Yes No Yes
(1) (2) (3) (4) (5) (6) (7) (8) (9) (10) (11) (12)Former Memb of Congress 0.12 0.10 0.10 0.09 0.15 0.05 0.14 0.12 0.13 0.12 0.16 0.04
[0.041]** [0.048]* [0.044]* [0.049] [0.124] [0.174] [0.024]** [0.032]** [0.029]** [0.038]** [0.036]** [0.049]Republican 0.15 0.14 0.12 0.11 0.18 0.15 0.10 0.11 0.10 0.12 0.05 0.05
[0.017]** [0.021]** [0.019]** [0.022]** [0.035]** [0.054]** [0.010]** [0.014]** [0.012]** [0.017]** [0.010]** [0.015]**Democrat 0.19 0.19 0.18 0.16 0.10 0.15 0.14 0.17 0.15 0.18 0.02 0.02
[0.018]** [0.022]** [0.020]** [0.023]** [0.041]* [0.063]* [0.010]** [0.014]** [0.013]** [0.017]** [0.012] [0.018]Experience in/as:
House (not rep) 0.10 0.07 0.09 0.05 -0.08 -0.10 0.07 0.08 0.08 0.07 -0.02 -0.04[0.049]* [0.057] [0.053] [0.058] [0.131] [0.219] [0.029]* [0.038]* [0.035]* [0.044] [0.038] [0.062]
Senate (not senator) 0.09 0.08 0.08 0.07 0.07 0.13 0.04 0.05 0.05 0.05 -0.01 0.00[0.016]** [0.020]** [0.018]** [0.021]** [0.036] [0.056]* [0.009]** [0.013]** [0.012]** [0.016]** [0.011] [0.016]
White House 0.18 0.17 0.15 0.13 0.23 0.26 0.10 0.11 0.10 0.10 0.07 0.03[0.028]** [0.032]** [0.030]** [0.032]** [0.076]** [0.112]* [0.016]** [0.021]** [0.020]** [0.025]** [0.022]** [0.032]
Aide 0.04 0.02 0.04 0.03 -0.04 -0.09 -0.01 -0.01 0.00 -0.01 -0.02 -0.02[0.017]* [0.020] [0.018]* [0.021] [0.037] [0.055] [0.010] [0.013] [0.012] [0.016] [0.011] [0.016]
Clerk 0.05 0.03 0.02 0.01 0.05 0.03 0.00 0.01 -0.01 -0.01 -0.01 0.00[0.035] [0.047] [0.036] [0.046] [0.122] [0.219] [0.020] [0.031] [0.024] [0.036] [0.035] [0.062]
Counsel 0.12 0.10 0.09 0.07 0.10 0.08 0.03 0.03 0.02 0.01 0.00 0.00[0.017]** [0.020]** [0.018]** [0.021]** [0.042]* [0.064] [0.010]** [0.013]* [0.012] [0.016] [0.012] [0.018]
Experience in:1960s 0.07 0.06 0.05 0.05 0.12 0.06 0.08 0.10 0.08 0.10 0.06 0.07
[0.038] [0.043] [0.040] [0.044] [0.120] [0.182] [0.022]** [0.029]** [0.026]** [0.034]** [0.035] [0.051]1970s 0.12 0.11 0.10 0.10 0.04 0.09 0.04 0.04 0.04 0.04 -0.02 -0.01
[0.022]** [0.025]** [0.023]** [0.025]** [0.065] [0.092] [0.013]** [0.017]* [0.015]** [0.020] [0.019] [0.026]1980s 0.12 0.09 0.10 0.07 0.05 0.04 0.06 0.05 0.05 0.04 -0.02 0.00
[0.019]** [0.021]** [0.020]** [0.022]** [0.053] [0.073] [0.011]** [0.014]** [0.013]** [0.017]* [0.015] [0.020]1990s 0.11 0.08 0.09 0.07 0.09 0.08 0.04 0.03 0.04 0.03 0.00 -0.01
[0.019]** [0.023]** [0.021]** [0.023]** [0.050] [0.073] [0.011]** [0.015]* [0.014]** [0.018] [0.014] [0.021]2000s -0.05 -0.04 -0.05 -0.03 -0.06 -0.06 -0.02 -0.02 -0.02 -0.01 -0.01 -0.02
[0.020]* [0.026] [0.022]* [0.027] [0.048] [0.075] [0.012] [0.017] [0.015] [0.021] [0.014] [0.021]R-squared 0.09 0.08 0.08 0.08 0.03 0.03 0.08 0.08 0.07 0.07 0.02 0.01Observations 13,720 8,004 9,325 5,788 4,395 2,216 13,720 8,004 9,325 5,788 4,395 2,216The regressions also include an experience dummy and a constant.Standard errors in brackets* significant at 5%; ** significant at 1%
Table 2: Correlates of Lobbyists' Connections to Politicians Dependent Variable: Any Connection? (Y=1) Dependent Variable: Many (>=5) Connections? (Y=1)
All External In-House All External In-House

Congress:(1) (2) (3) (4) (5) (6)
Republican Congressman -0.001 -0.001 -0.0002 -0.0002[0.0001]** [0.0001]** [0.0001]* [0.0001]*
Republican Lobbyist -0.002 -0.002 -0.002 -0.002[0.0003]** [0.0003]** [0.0003]** [0.0003]**
Republican Congressman*Republican Lobbyist 0.008 0.008 0.008 0.007 0.007 0.007[0.0006]** [0.0006]** [0.0006]** [0.0006]** [0.0006]** [0.0006]**
Democratic Lobbyist 0.011 0.011 0.008 0.008[0.0008]** [0.0008]** [0.0008]** [0.0008]**
Republican Congressman*Democratic Lobbyist -0.011 -0.011 -0.011 -0.009 -0.009 -0.009[0.0008]** [0.0008]** [0.0008]** [0.0007]** [0.0007]** [0.0007]**
Senator 0.004 0.004 0.002 0.002[0.0002]** [0.0002]** [0.0001]** [0.0001]**
Lobbyist Has Senate Experience -0.0001 -0.0001 0.0002 0.0002[0.0004] [0.0004] [0.0004] [0.0004]
Lobbyist Has House Experience 0.006 0.006 0.007 0.007[0.0020]** [0.0020]** [0.0022]** [0.0022]**
Senator*Lobbyist Has Senate Experience 0.010 0.010 0.010 0.009 0.009 0.009[0.0009]** [0.0009]** [0.0009]** [0.0009]** [0.0009]** [0.0009]**
House Representative*Lobbyist Has House Experience -0.004 -0.004 -0.004 -0.004 -0.004 -0.004[0.0015]* [0.0015]* [0.0015]* [0.0017]* [0.0017]* [0.0017]*
Congressman Fixed Effects No Yes No No Yes NoLobbyist Fixed Effects No No Yes No No YesR-squared 0.00 0.02 0.02 0.00 0.01 0.02Observations 4,575,967 4,575,967 4,575,967 3,979,756 3,979,756 3,979,756 Standard errors are clustered at the lobbyist level.* significant at 5%; ** significant at 1%
108th 107th
Table 3: Who Makes Campaign Contributions to Whom?The Role of Party and House/Senate Links
Dependent Variable: Lobbyist Makes at Least One Campaign Contribution to that Legislator in that Congress

Sample:Restrict to at Least 4 Active Years? No Yes No Yes No Yes No Yes No Yes No Yes
(1) (2) (3) (4) (5) (6) (7) (8) (9) (10) (11) (12)Former Member of Congress -0.02 -0.03 -0.06 -0.05 0.36 0.19 -0.01 -0.04 -0.03 -0.06 0.15 0.18
[0.040] [0.040] [0.042] [0.042] [0.129]** [0.142] [0.028] [0.030] [0.030] [0.031] [0.093] [0.112]Republican -0.04 -0.04 -0.04 -0.05 -0.04 -0.04 -0.06 -0.08 -0.08 -0.10 -0.04 -0.04
[0.016]* [0.017]** [0.018]* [0.018]* [0.036] [0.044] [0.012]** [0.013]** [0.013]** [0.014]** [0.026] [0.035]Democrat -0.05 -0.06 -0.06 -0.07 -0.01 -0.04 -0.07 -0.08 -0.09 -0.10 -0.03 -0.06
[0.017]** [0.018]** [0.019]** [0.019]** [0.042] [0.051] [0.012]** [0.014]** [0.013]** [0.014]** [0.031] [0.040]Experience in/as:
House (not rep) 0.02 0.09 0.02 0.08 0.02 0.27 0.03 0.05 0.03 0.04 -0.02 0.18[0.048] [0.047] [0.051] [0.049] [0.136] [0.178] [0.034] [0.036] [0.036] [0.036] [0.099] [0.141]
Senate (not senator) -0.01 0.03 0.00 0.04 -0.05 -0.02 -0.02 -0.01 -0.02 -0.01 -0.03 -0.04[0.016] [0.016] [0.017] [0.018]* [0.038] [0.046] [0.011] [0.012] [0.012] [0.013] [0.027] [0.036]
White House -0.09 -0.05 -0.10 -0.06 -0.05 0.07 -0.04 -0.03 -0.05 -0.04 -0.05 0.02[0.027]** [0.026]* [0.029]** [0.027]* [0.079] [0.091] [0.019]* [0.020] [0.020]* [0.020]* [0.058] [0.072]
Aide 0.00 0.03 -0.01 0.04 0.03 0.01 -0.02 0.00 -0.04 0.00 0.03 0.01[0.016] [0.016]* [0.018] [0.018]* [0.039] [0.045] [0.011] [0.012] [0.013]** [0.013] [0.028] [0.036]
Clerk 0.05 -0.03 0.05 -0.03 -0.04 -0.06 0.04 0.03 0.03 0.03 -0.05 -0.12[0.034] [0.038] [0.035] [0.039] [0.127] [0.179] [0.024] [0.029] [0.025] [0.029] [0.092] [0.141]
Counsel -0.02 0.00 -0.04 0.00 0.03 -0.02 0.02 0.03 0.01 0.02 0.00 -0.03[0.016] [0.016] [0.018]* [0.018] [0.044] [0.052] [0.012] [0.012]* [0.012] [0.013] [0.032] [0.041]
Experience in:1960s 0.07 0.07 0.06 0.06 0.05 0.14 0.08 0.08 0.08 0.07 0.13 0.08
[0.036] [0.036]* [0.038] [0.037] [0.124] [0.148] [0.026]** [0.027]** [0.027]** [0.028]* [0.090] [0.117]1970s -0.03 0.02 -0.03 0.02 -0.05 -0.02 0.03 0.04 0.04 0.04 -0.08 -0.06
[0.021] [0.021] [0.022] [0.022] [0.068] [0.075] [0.015]* [0.016]* [0.016]* [0.016]* [0.049] [0.059]1980s -0.03 0.00 -0.03 -0.01 -0.01 0.04 0.01 0.01 0.00 0.00 0.01 0.03
[0.018] [0.018] [0.019] [0.019] [0.055] [0.059] [0.013] [0.013] [0.014] [0.014] [0.040] [0.047]1990s -0.02 0.02 -0.03 0.01 0.01 0.06 -0.02 0.00 -0.02 -0.01 0.01 0.05
[0.019] [0.019] [0.020] [0.020] [0.051] [0.059] [0.013] [0.014] [0.014] [0.015] [0.037] [0.047]2000s 0.05 -0.02 0.06 -0.01 -0.04 -0.14 0.01 -0.02 0.01 -0.01 -0.01 -0.06
[0.020]* [0.021] [0.022]** [0.023] [0.050] [0.061]* [0.014] [0.016] [0.015] [0.017] [0.036] [0.048]R-Squared 0.00 0.00 0.01 0.01 0.00 0.01 0.01 0.02 0.03 0.03 0.00 0.01Observations 13,720 8,004 9,325 5,788 4,395 2,216 13,720 8,004 9,325 5,788 4,395 2,216 The regressions also include an "experience" dummy.Standard errors in brackets* significant at 5%; ** significant at 1%
Table 4: Correlates of Lobbyists' ExpertiseDependent Variable: Issue-Based HHI
All External In-HouseAll External In-House
Dependent Variable: Specialist (Y=1)

Congress
Dependent Variable:(1) (2) (3) (4) (5) (6) (7) (8)
Lobbyist made at least one campaign contribution to that Congressman in Congress (t )? (Y=1) 0.913 0.435 0.029 0.019 1.023 0.400 0.024 0.017
[0.0531]** [0.0261]** [0.0024]** [0.0031]** [0.0670]** [0.0361]** [0.0027]** [0.0039]**Republican Lobbyist 0.576 0.014 0.519 0.011
[0.0538]** [0.0018]** [0.0616]** [0.0018]**Republican Congressman*Republican Lobbyist 0.032 0.036 0.001 0.001 0.019 0.023 0.002 0.002
[0.0032]** [0.0032]** [0.0002]** [0.0002]** [0.0028]** [0.0028]** [0.0003]** [0.0003]**Democratic Lobbyist 0.452 0.014 0.521 0.013
[0.0542]** [0.0019]** [0.0641]** [0.0018]**Republican Congressman*Democratic Lobbyist 0.043 0.038 0.001 0.001 0.037 0.031 0.002 0.002
[0.0036]** [0.0034]** [0.0002]** [0.0002]** [0.0034]** [0.0031]** [0.0003]** [0.0003]**Lobbyist Has Senate Experience 0.045 0.004 0.088 0.003
[0.0513] [0.0023] [0.0589] [0.0022]Senator*Lobbyist has Senate Experience 0.299 0.304 -0.014 -0.014 0.326 0.331 -0.012 -0.012
[0.0334]** [0.0336]** [0.0020]** [0.0020]** [0.0383]** [0.0384]** [0.0020]** [0.0020]**Lobbyist Has House Experience 0.312 -0.009 0.205 -0.008
[0.1726] [0.0010]** [0.1767] [0.0010]**House Representative*Lobbyist has House Experience -0.277 -0.279 0.010 0.010 -0.228 -0.230 0.010 0.010
[0.0781]** [0.0782]** [0.0046]* [0.0046]* [0.0795]** [0.0798]** [0.0042]* [0.0042]*Republican Congressman 0.083 0.019 0.056 0.048
[0.0010]** [0.0001]** [0.0008]** [0.0001]**Senator 0.828 -0.102 0.850 -0.101
[0.0102]** [0.0007]** [0.0115]** [0.0007]**Constant 1.0338 0.9766 0.1116 0.1235 1.049 1.0088 0.1386 0.1342
[0.0138]** [0.0027]** [0.0006]** [0.0002]** [0.0152]** [0.0030]** [0.0006]** [0.0001]**R-squared 0.21 0.42 0.76 0.04 0.23 0.39 0.81 0.03Observations 4,575,967 4,575,967 4,575,967 4,575,967 3,979,756 3,979,756 3,979,756 3,979,756Lobbyist F.E.s No Yes No Yes No Yes No YesCongressman F.E.s Yes No Yes No Yes No Yes NoStandard errors are clustered at the lobbyist level.* significant at 5%; ** significant at 1%
107th
Table 5: Do Connections through Campaign Contributions Correlate with Overlapping Issues between Lobbyists and Congressmen?
Lobbyist Works on All the Issues Covered by the
Legislator in Congress (t) (Y=1)
Lobbyist Works on All the Issues Covered by the
Legislator in Congress (t) (Y=1)
Number of Issues Covered by the Legislator in Congress (t) that the Lobbyists Covers in Congress (t)
Number of Issues Covered by the Legislator in Congress (t) that the Lobbyists Covers in Congress (t)
108th

(1) (2) (3) (4) (5) (6)
Lobbyists made at least one campaign contribution to that Congressman in Congress (t )? (Y=1) 0.137 0.134 0.044 0.031 0.031 0.048
[.01281]** [.01244]** [.01145]** [.0109]** [.0110]** [.0156]**Number of new issues for the legislator in Congress (t+1 ) that the Lobbyist covers in Congress (t ) 0.160 0.121 0.143 0.085 0.083 0.078
[.0027]** [.0027]** [.0024]** [.0024]** [.0024]** [.0032]**
Number of issues covered by the legislator in Congress (t ) that the Lobbyists covers in Congress (t ) -0.006 -0.012 -0.0148 -0.036 -0.037 -0.024
[.0004]** [.0006]** [.0004]** [.0008]** [.0009]** [.0009]**
Number of issues covered by the legislator in Congress (t-1 ) that the Lobbyists covers in Congress (t-1 ) -0.0008
[.0011]Inverse Mills Ratio from Selection Equation -0.079 -0.115
[.0062]** [.0127]**Observations 1,667,047 1,667,047 1,667,047 1,667,047 1,634,744 514,643Congress F.E.s Yes Yes Yes Yes Yes YesLobbyist F.E.s No No Yes Yes Yes YesCongressman F.E.s No Yes No Yes Yes Yes
Number of Openings of Congressional Committee Seats 0.005 0.005Above Current Average Grosewart Rank of Legislator [.0007]** [.0007]**
Chamber Seniority of Legislator -0.130 -0.130[.0134]** [.0134]**
Congress F.E.s Yes YesObservations 1882 1882
Panel B. Selection Equation for Legislators Changing of Committee. Dependent Variable: Committee Change by Legislator
Selection is restricted to Congressmen that switch committee assignments between two consecutive Congresses. Standard errors clustered at the lobbyist level in Panel A and politician level in Panel B. For computational reasons, for each politician considered a sample of the closest lobbyists is created including all the lobbyists that perfectly overlap with the politician in terms of issues covered by the politician plus the 3,000 closest lobbyist in terms of issue overlap with the politician. * significant at 5%; ** significant at 1%.
Table 6: Do Lobbyists Follow Politicians They Are Connected to as Those Politicians Switch Committee Assignments?Panel A. Dependent Variable: Number of new issues for the legislator and for the lobbyist in Congress (t+1)

(1) (2) (3) (4) (5) (6) (7) (8) (9)δ 2 0.093 0.098 0.111 0.117 0.107 0.084 0.069 0.149 0.047
[.0102]** [.0112]** [.0357]** [.0301]** [.0280]** [.0222]** [.0191]** [.0161]** [.0149]**Mean of Dependent Variable for Non-Specialists 0.170 0.170 0.172 0.180 0.189 0.168 0.142 0.121 0.218Observations 4,655 4,655 822 900 947 1,022 964 2,282 2,373Congress F.E.s/Congress Number Yes Yes 106 107 108 109 110 Yes YesCongressman F.E.s No Yes Yes Yes Yes Yes Yes Yes Yes
Table 7: Politicians and Expert LobbyistsDependent Variable: Share of Lobbyists from Opposite Party Connected to the Politician
Note: Standard errors clustered at legislator level. * significant at 5%; ** significant at 1%. Column (8) includes only Democrat congressmen and Column (9) Republicans.
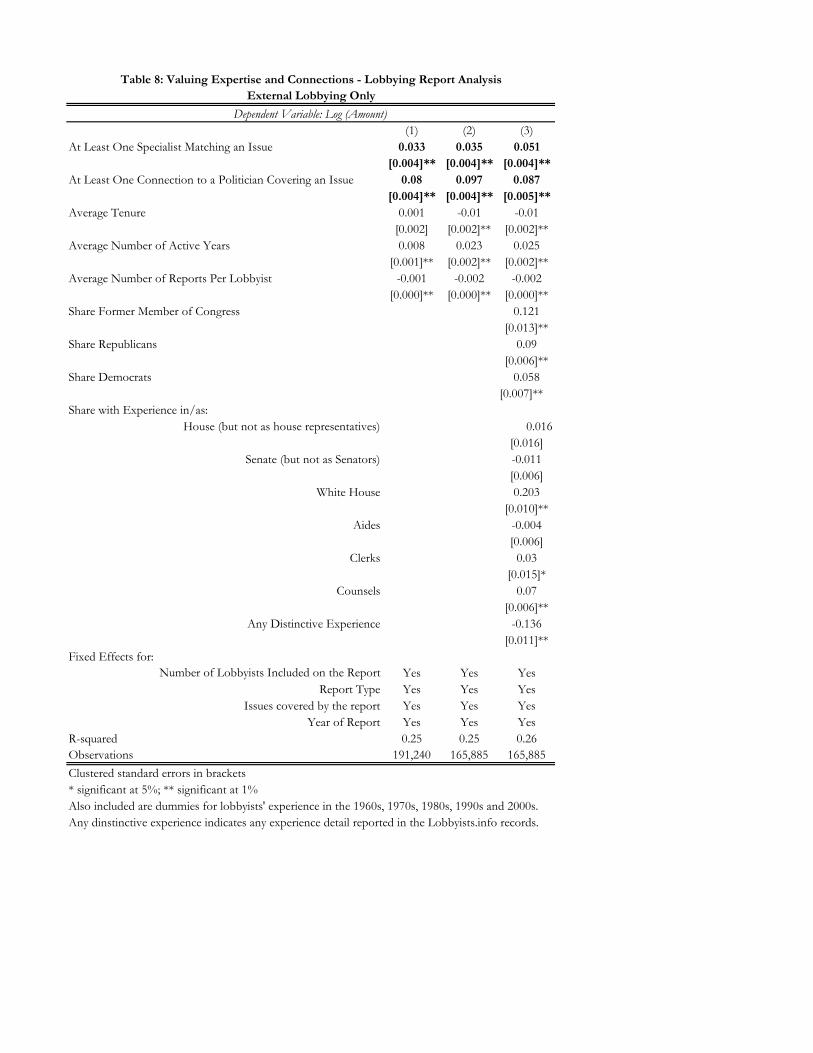
(1) (2) (3)At Least One Specialist Matching an Issue 0.033 0.035 0.051
[0.004]** [0.004]** [0.004]**At Least One Connection to a Politician Covering an Issue 0.08 0.097 0.087
[0.004]** [0.004]** [0.005]**Average Tenure 0.001 -0.01 -0.01
[0.002] [0.002]** [0.002]**Average Number of Active Years 0.008 0.023 0.025
[0.001]** [0.002]** [0.002]**Average Number of Reports Per Lobbyist -0.001 -0.002 -0.002
[0.000]** [0.000]** [0.000]**Share Former Member of Congress 0.121
[0.013]**Share Republicans 0.09
[0.006]**Share Democrats 0.058
[0.007]**Share with Experience in/as:
House (but not as house representatives) 0.016[0.016]
Senate (but not as Senators) -0.011[0.006]
White House 0.203[0.010]**
Aides -0.004[0.006]
Clerks 0.03[0.015]*
Counsels 0.07[0.006]**
Any Distinctive Experience -0.136[0.011]**
Fixed Effects for:Number of Lobbyists Included on the Report Yes Yes Yes
Report Type Yes Yes YesIssues covered by the report Yes Yes Yes
Year of Report Yes Yes YesR-squared 0.25 0.25 0.26Observations 191,240 165,885 165,885Clustered standard errors in brackets* significant at 5%; ** significant at 1%Also included are dummies for lobbyists' experience in the 1960s, 1970s, 1980s, 1990s and 2000s.Any dinstinctive experience indicates any experience detail reported in the Lobbyists.info records.
Table 8: Valuing Expertise and Connections - Lobbying Report AnalysisExternal Lobbying Only
Dependent Variable: Log (Amount)

(1) (2) (3) (4) (5) (6) (7) (8) (9) (10) (11) (12)Issue-Based HHI -0.233 -0.227 -0.218 -0.231 -0.214 -0.218
[0.026]** [0.029]** [0.027]** [0.023]** [0.025]** [0.029]**Specialist -0.012 -0.016 -0.005 -0.02 -0.027 -0.009
[0.017] [0.019] [0.022] [0.017] [0.021] [0.020]At Least One Connection 0.07 0.03 0.009 0.095 0.062 0.043
[0.017]** [0.020] [0.019] [0.016]** [0.019]** [0.022]At Least Five Connections 0.076 0.073 0.055 0.098 0.094 0.073
[0.016]** [0.017]** [0.019]** [0.017]** [0.020]** [0.020]**Number of Active Years -0.014 -0.012 -0.006 -0.018 -0.017 -0.009 -0.01 -0.008 -0.005 -0.014 -0.013 -0.006
[0.008] [0.008] [0.008] [0.007]* [0.007]* [0.008] [0.007] [0.008] [0.009] [0.008] [0.009] [0.008]Tenure 0.031 0.04 0.033 0.045 0.045 0.036 0.03 0.033 0.026 0.042 0.044 0.031
[0.016] [0.017]* [0.015]* [0.014]** [0.014]** [0.016]* [0.015]* [0.017]* [0.019] [0.015]** [0.018]* [0.017]Former Memb. Of Congress 0.017 0.036 0.085 0.052
[0.048] [0.050] [0.058] [0.053]Republican 0.039 0.032 0.061 0.071
[0.024] [0.025] [0.028]* [0.026]**Democrat 0.034 0.03 0.046 0.053
[0.025] [0.026] [0.029] [0.027]*Experience in/as:
House (but not as House Rep.) -0.012 -0.024 -0.001 0.016[0.061] [0.064] [0.074] [0.067]
Senate (but not as Senator) 0.019 0.016 0.02 0.013[0.022] [0.023] [0.027] [0.024]
White House 0.133 0.119 0.127 0.145[0.034]** [0.036]** [0.041]** [0.038]**
Aide -0.048 -0.045 -0.03 -0.03[0.022]* [0.023] [0.027] [0.024]
Clerk 0.108 0.133 0.103 0.11[0.047]* [0.049]** [0.057] [0.052]*
Counsel 0.036 0.033 0.044 0.043[0.022] [0.023] [0.026] [0.024]
Any Distinctive Experience -0.071 -0.04 -0.067 -0.063[0.038] [0.040] [0.046] [0.042]
Constant 15.055 15.027 15.064 15.067 15.052 15.044 14.928 14.924 14.959 14.964 14.953 14.968[0.040]** [0.046]** [0.056]** [0.035]** [0.039]** [0.059]** [0.036]** [0.043]** [0.066]** [0.036]** [0.046]** [0.060]**
Observations 3,926 2,830 2,830 3,926 2,830 2,830 3,926 2,830 2,830 3,926 2,830 2,830Median regressions, Standard errors in brackets* significant at 5%; ** significant at 1%Each observation is weighted by the inverse of the standard error on the estimated fixed effects we use as dependent variable.Also included are dummies for lobbyists' experience in the 1960s, 1970s, 1980s, 1990s and 2000s.Any dinstinctive experience indicates any experience detail reported in the Lobbyists.info records.
Table 9: Valuing Expertise and Connections - Lobbyist-Level AnalysisExternal Lobbyists with at least 6 Years of Active Experience Only
Dependent Variable: Lobbyist's Estimated Fixed Effect

∆ Log total lobbyists in issue Log total lobbyists in issue(1) (2)
∆ Log total amount in issue 0.501[0.062]**
Log total amount in issue 0.491[0.066]**
Issue Specific Trend No YesIssue F.E.s No YesObservations 684 760R-squared 0.49 0.98
∆ share specialists in issue Share specialists in issue
∆ Log total amount in issue -0.021[0.007]**
Log total amount in issue -0.022[0.006]**
Issue Specific Trend No YesIssue F.E.s No YesObservations 684 760R-squared 0.07 0.74
* significant at 5%; ** significant at 1%
Log per Lobbyist Amount
Log per Lobbyist Amount
(1) (2)
Σi [Total amount in issue i *Specialist in issue i] 0.000035[0.000097]
Σi [Log total amount in issue i *Specialist in issue i] -4254.96[9040.62]
Year F.E.s Yes YesLobbyist F.E.s Yes YesObservations 144,137 144,137R-squared 0.48 0.48
* significant at 5%; ** significant at 1%Standard errors are clustered at the issue level.
Table 10b: Issue Booms and Expertise - Lobbyist AnalysisDependent Variable
Table 10a: Issue Booms and Expertise - Issue AnalysisDependent Variable
Dependent Variable
Standard errors are clustered at the issue level.

Appendix not for publication

Figure 1: Republican Lobbyist Revenue Premium-.
10
.1.2
.3.4
1998 2000 2002 2004 2006 2008 2010Year
% GOP Revenue premium 5% Confidence bandDemocratic Benchmark
Republican lobbying revenue premium (per lobbyist)

Firm Employee name Position Issue Bar
Issue-specific
TrainingRegistered
lobbyistCassidy & Assoc. Boylan, John Senior Vice President aerospace 0 1 1
Cassidy & Assoc. Cassidy, Gerald S. J.Founder & Executive Chairman aerospace 1 0 1
Cassidy & Assoc. Edwards, ShawnVice President and Deputy Director of Cassidy Defense aerospace 0 0 1
Cassidy & Assoc. Hegarty,Mark Senior Vice President aerospace 0 1 1
Cassidy & Assoc. McNamara, Dan Executive Vice President aerospace 0 0 1Cassidy & Assoc. Meyers, George Vice President aerospace 0 1 1
Cassidy & Assoc. Paul, Terry
Executive Vice President and Director of Defense Group aerospace 0 1 1
Cassidy & Assoc. Russo, MartySenior Vice Chairman & Chief Executive Officer aerospace 1 0 1
Cassidy & Assoc. Simmons, Vernon Vice President aerospace 0 1 1Cassidy & Assoc. Videnieks, Markus Vice President aerospace 0 0 1
Cassidy & Assoc. Anderson, Kai Executive Vice Presidentenergy efficiency, power storage, green buildings 0 1 1
Cassidy & Assoc. Burlij, Emily Associateenergy efficiency, power storage, green buildings 1 0 1
Cassidy & Assoc. Crespo, Jacqueline Senior Associateenergy efficiency, power storage, green buildings 0 1 0
Cassidy & Assoc. Dennis, Tom Executive Vice Presidentenergy efficiency, power storage, green buildings 0 0 1
Cassidy & Assoc. Anderson, Kai Executive Vice President nuclear power 0 1 1Cassidy & Assoc. Burlij, Emily Associate nuclear power 1 0 1Cassidy & Assoc. Crespo, Jacqueline Senior Associate nuclear power 0 1 0
Cassidy & Assoc. Dennis, Tom Executive Vice President nuclear power 0 0 1
Cassidy & Assoc. Anderson, Kai Executive Vice President technology 0 1 1Cassidy & Assoc. Boylan, John Senior Vice President technology 0 1 1Cassidy & Assoc. Chapman, Justin Account Coordinator technology 0 0 0Cassidy & Assoc. Crespo, Jacqueline Senior Associate technology 0 1 0
Cassidy & Assoc. Dennis, Tom Executive Vice President technology 0 0 1
Cassidy & Assoc. Edwards, ShawnVice President and Deputy Director of Cassidy Defense technology 0 0 1
Cassidy & Assoc. Hartley, Gregg L.Vice Chairman & Chief Operating Officer technology 0 0 1
Cassidy & Assoc. Hegarty,Mark Senior Vice President technology 0 1 1
Cassidy & Assoc. Hochstein, AmosExecutive Vice President for International Operations technology 0 0 1
Cassidy & Assoc. Ide, Betsy Vice President technology 0 0 1Cassidy & Assoc. Levy, Dawn Senior Vice President technology 0 0 1
Cassidy & Assoc. McNamara, Dan Executive Vice President technology 0 0 1
Appendix Table A1: Technical Expertise in Two Large Lobbying Firms

Cassidy & Assoc. Meyers, George Vice President technology 0 1 1Cassidy & Assoc. Neal, Laura Senior Vice President technology 0 0 1
Cassidy & Assoc. Paul, Terry
Executive Vice President and Director of Defense Group technology 0 1 1
Cassidy & Assoc. Russo, MartySenior Vice Chairman & Chief Executive Officer technology 1 0 1
Cassidy & Assoc. Simmons, Vernon Vice President technology 0 1 1
Cassidy & Assoc. Sutton, Barbara Executive Vice President technology 0 0 1Cassidy & Assoc. Temple, Roy Senior Vice President technology 1 0 1Patton Boggs LLP Chambers, Scott Partner biotechnology 1 1 0Patton Boggs LLP Chism, B. Dell Patent Agent biotechnology 0 1 0Patton Boggs LLP McKeague, W. John Associate biotechnology 1 1 0

Firm Employee name Position Issue Bar
Issue-specific
TrainingRegistered
lobbyistPatton Boggs LLP Bell, Chris Of Counsel clean technology 1 0 1Patton Boggs LLP Chajet, Henry Partner clean technology 1 0 1Patton Boggs LLP Driver, Michael Partner clean technology 1 0 1Patton Boggs LLP Farber, David Partner clean technology 1 0 1Patton Boggs LLP Forest, Carl Partner clean technology 1 1 0Patton Boggs LLP Frank, Michele Partner clean technology 1 0 0Patton Boggs LLP Graziano, James Partner clean technology 1 1 0Patton Boggs LLP Greene, Joshua Partner clean technology 1 0 1Patton Boggs LLP Harris, Laurence Senior Counsel clean technology 1 0 1Patton Boggs LLP Horn, Robert Partner clean technology 1 0 1Patton Boggs LLP Johnson, Gregory Partner clean technology 1 0 0Patton Boggs LLP Kelly, Suedeen Partner clean technology 1 0 0Patton Boggs LLP Mayer, David Partner clean technology 1 0 0Patton Boggs LLP McIntosh, Carolyn Partner clean technology 1 0 1Patton Boggs LLP Passaic, Joseph Partner clean technology 1 0 0Patton Boggs LLP Ryan, Deborah Partner clean technology 1 0 0Patton Boggs LLP Savit, Mark Partner clean technology 1 0 1Patton Boggs LLP Stewart, Scott Partner clean technology 1 0 0Patton Boggs LLP Witt, Kenneth Partner clean technology 1 0 0Patton Boggs LLP Chambers, Scott Partner drugs/biologics 1 1 0Patton Boggs LLP Herbert, Toni-Junell Partner drugs/biologics 1 1 0Patton Boggs LLP Nuttall, Carey Associate drugs/biologics 1 0 0Patton Boggs LLP Pape, Stuart Partner drugs/biologics 1 0 1Patton Boggs LLP Rubin, Paul Partner drugs/biologics 1 0 1Patton Boggs LLP Shanks, Mark Partner drugs/biologics 1 1 1
Patton Boggs LLP Nuttall, Carey Associate medical devices and diagnostics 1 0 0
Patton Boggs LLP Pape, Stuart Partner medical devices and diagnostics 1 0 1
Patton Boggs LLP Rubin, Paul Partner medical devices and diagnostics 1 0 1
Patton Boggs LLP Kelly, Suedeen Partner nuclear 1 0 0Patton Boggs LLP Lessy, Roy Partner nuclear 1 0 1Patton Boggs LLP Allard, Nicholas Partner smart grid 1 0 1Patton Boggs LLP Arbuckle, J. Gordon Partner smart grid 1 0 0Patton Boggs LLP Barton, Betty Public Policy Advisor smart grid 0 0 1Patton Boggs LLP Besozzi, Paul Partner smart grid 1 0 1Patton Boggs LLP Cetta, Jennifer Associate smart grid 1 0 1Patton Boggs LLP Didden, Carly Associate smart grid 1 0 1Patton Boggs LLP Driver, Michael Partner smart grid 1 0 1Patton Boggs LLP Ellison, Mark Partner smart grid 1 0 1Patton Boggs LLP Farber, David Partner smart grid 1 0 1Patton Boggs LLP Greene, Joshua Partner smart grid 1 0 1Patton Boggs LLP Johnson, Gregory Partner smart grid 1 0 0Patton Boggs LLP Jolivert, Meredith Associate smart grid 1 0 0Patton Boggs LLP Kelly, Suedeen Partner smart grid 1 0 0Patton Boggs LLP Krayem, Norma Senior Policy Advisor smart grid 0 0 1Patton Boggs LLP Lodge, Deborah Partner smart grid 1 0 1Patton Boggs LLP Martin, Kevin Partner smart grid 1 0 0Patton Boggs LLP McIntosh, Carolyn Partner smart grid 1 0 1Patton Boggs LLP Moran, Janet Partner smart grid 1 0 1Patton Boggs LLP Richter, Jennifer Partner smart grid 1 0 1Patton Boggs LLP Talesnick, Alan Partner smart grid 1 0 0Patton Boggs LLP Turner, Jeffrey Partner smart grid 1 0 1Patton Boggs LLP Voorhees, John Partner smart grid 1 0 1Patton Boggs LLP White, Eric Partner smart grid 1 0 0
Patton Boggs LLP Allard, Nicholas Partner technology and communications 1 0 1
Appendix Table A1: Technical Expertise in Two Large Lobbying Firms (cont.)

Patton Boggs LLP Berry, Matthew Partner technology and communications 1 0 0
Patton Boggs LLP Besozzi, Paul Partner technology and communications 1 0 1
Firm Employee name Position Issue Bar
Issue-specific
TrainingRegistered
lobbyist
Patton Boggs LLP Bright, William Public Policy Advisor technology and communications 1 0 1
Patton Boggs LLP Cetta, Jennifer Associate technology and communications 1 0 1
Patton Boggs LLP Desai, Monica Partner technology and communications 1 0 0
Patton Boggs LLP Didden, Carly Associate technology and communications 1 0 1
Patton Boggs LLP Ellison, Mark Partner technology and communications 1 0 1
Patton Boggs LLP Forest, Carl Partner technology and communications 1 1 0
Patton Boggs LLP Gavin, Stephen Diaz Partner technology and communications 1 0 1
Patton Boggs LLP Graziano, James Partner technology and communications 1 1 0
Patton Boggs LLP Hager, Robert Partner technology and communications 1 0 1
Patton Boggs LLP Harris, Laurence Senior Counsel technology and communications 1 0 1
Patton Boggs LLP Ireland, Kathleen Public Policy Counselor technology and communications 0 0 1
Patton Boggs LLP Kim, Hwan Partner technology and communications 1 0 0
Patton Boggs LLP King, Ryan Associate technology and communications 1 0 0
Patton Boggs LLP Lane, Margaret Senior Paralegal technology and communications 0 0 0
Patton Boggs LLP Lodge, Deborah Partner technology and communications 1 0 1
Patton Boggs LLP Martin, Kevin Partner technology and communications 1 0 0
Patton Boggs LLP Moran, Janet Partner technology and communications 1 0 1
Patton Boggs LLP Reeder, James Senior Counsel technology and communications 1 0 1
Patton Boggs LLP Reisenfeld, Kenneth Partner technology and communications 1 0 0
Patton Boggs LLP Richter, Jennifer Partner technology and communications 1 0 1
Patton Boggs LLP Sachs, Lesley Bowling Associate technology and communications 1 0 0
Patton Boggs LLP Stolbach, Richard Partner technology and communications 1 0 0
Patton Boggs LLP Turner, Jeffrey Partner technology and communications 1 0 1
Patton Boggs LLP Yarowsky, Jonathan Partner technology and communications 1 0 1
Notes: Employee listings and biographies as of November 2010. Bar indicates bar associaion membership. Issue-specific training indicates the academic or professional technical background, including military.Reference web pages: http://www.pattonboggs.com/attorneys/List.aspx and http://www.cassidy.com/team/
Appendix Table A1: Technical Expertise in Two Large Lobbying Firms (cont.)
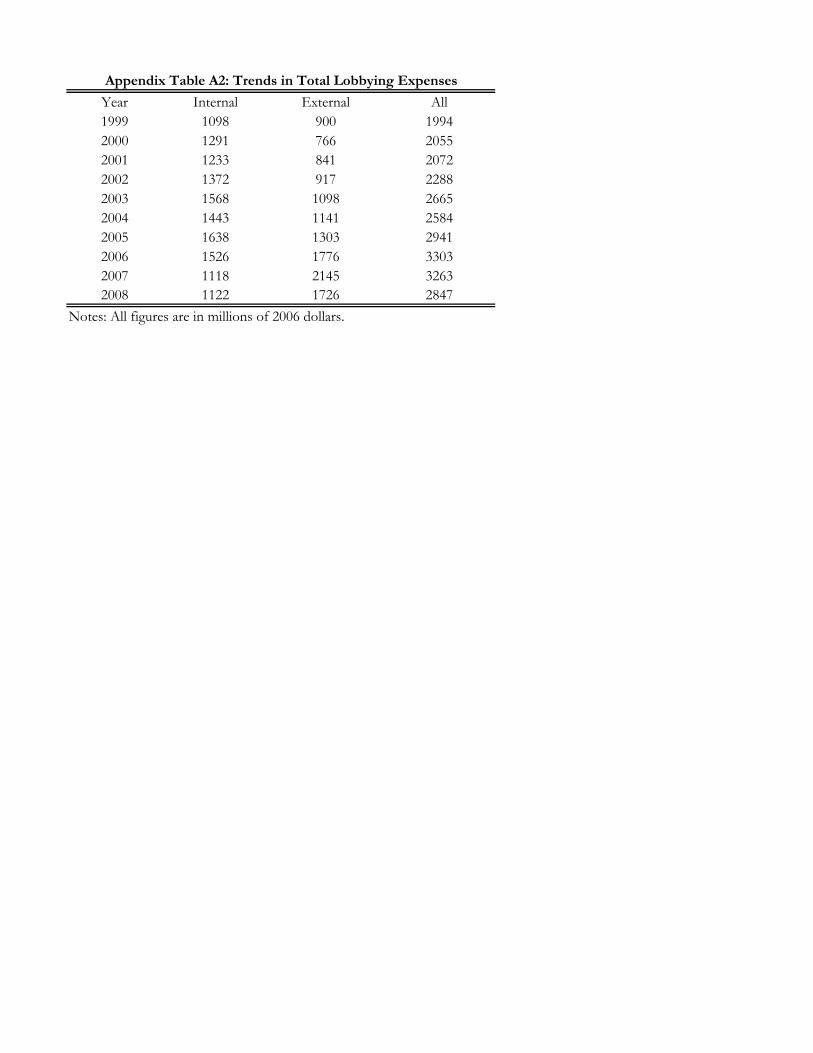
Year Internal External All1999 1098 900 19942000 1291 766 20552001 1233 841 20722002 1372 917 22882003 1568 1098 26652004 1443 1141 25842005 1638 1303 29412006 1526 1776 33032007 1118 2145 32632008 1122 1726 2847
Notes: All figures are in millions of 2006 dollars.
Appendix Table A2: Trends in Total Lobbying Expenses

Year In House Republican Democrat
Former Member of Congress
Republican Democrat Senator House Rep.White House Aide Clerk Counsel House Senate
Sample: All
1999 0.491 0.118 0.108 0.017 0.008 0.009 0.004 0.015 0.033 0.134 0.019 0.114 0.026 0.1302000 0.595 0.119 0.109 0.018 0.008 0.009 0.005 0.015 0.030 0.136 0.019 0.110 0.027 0.1302001 0.563 0.122 0.115 0.018 0.009 0.009 0.004 0.015 0.032 0.139 0.019 0.109 0.027 0.1322002 0.561 0.122 0.112 0.019 0.010 0.009 0.004 0.016 0.033 0.139 0.016 0.105 0.026 0.1312003 0.555 0.122 0.113 0.018 0.010 0.008 0.004 0.015 0.032 0.135 0.015 0.101 0.024 0.1282004 0.556 0.125 0.110 0.016 0.009 0.007 0.003 0.014 0.030 0.136 0.014 0.097 0.022 0.1272005 0.558 0.128 0.107 0.015 0.008 0.007 0.004 0.013 0.028 0.135 0.013 0.091 0.021 0.1272006 0.425 0.125 0.104 0.014 0.007 0.006 0.004 0.012 0.027 0.130 0.013 0.088 0.020 0.1232007 0.359 0.119 0.104 0.013 0.006 0.006 0.003 0.011 0.025 0.125 0.013 0.083 0.019 0.1192008 0.379 0.114 0.102 0.012 0.006 0.006 0.003 0.010 0.023 0.121 0.012 0.077 0.017 0.114
Sample: External Lobbyists
1999 0.147 0.144 0.026 0.012 0.014 0.006 0.022 0.046 0.173 0.030 0.161 0.039 0.1752000 0.158 0.166 0.032 0.014 0.017 0.009 0.025 0.047 0.194 0.035 0.184 0.047 0.1962001 0.160 0.169 0.034 0.017 0.017 0.008 0.028 0.052 0.188 0.034 0.177 0.049 0.1922002 0.168 0.169 0.034 0.018 0.017 0.008 0.029 0.054 0.192 0.028 0.171 0.046 0.1922003 0.172 0.167 0.031 0.016 0.015 0.008 0.026 0.051 0.187 0.028 0.164 0.041 0.1892004 0.176 0.160 0.028 0.014 0.014 0.006 0.024 0.047 0.190 0.026 0.156 0.038 0.1902005 0.185 0.153 0.026 0.013 0.013 0.007 0.022 0.043 0.187 0.023 0.143 0.036 0.1902006 0.159 0.131 0.019 0.010 0.009 0.005 0.016 0.036 0.163 0.019 0.120 0.027 0.1602007 0.146 0.129 0.017 0.009 0.008 0.005 0.014 0.032 0.153 0.017 0.109 0.023 0.1502008 0.141 0.127 0.015 0.008 0.008 0.004 0.013 0.030 0.148 0.017 0.100 0.022 0.144
Sample: In-House Lobbyists
1999 0.076 0.056 0.005 0.003 0.002 0.001 0.004 0.015 0.077 0.005 0.047 0.008 0.0652000 0.084 0.057 0.005 0.003 0.002 0.001 0.005 0.014 0.084 0.005 0.042 0.008 0.0702001 0.084 0.062 0.003 0.002 0.001 0.001 0.003 0.013 0.093 0.005 0.044 0.006 0.0752002 0.078 0.057 0.004 0.002 0.001 0.001 0.004 0.012 0.086 0.004 0.041 0.007 0.0712003 0.074 0.060 0.004 0.003 0.002 0.001 0.004 0.014 0.083 0.003 0.040 0.008 0.0672004 0.076 0.063 0.005 0.003 0.001 0.001 0.004 0.014 0.085 0.003 0.041 0.008 0.0672005 0.074 0.063 0.004 0.003 0.002 0.001 0.004 0.013 0.085 0.003 0.040 0.007 0.0672006 0.070 0.060 0.005 0.002 0.002 0.001 0.004 0.012 0.075 0.002 0.036 0.010 0.0632007 0.064 0.055 0.004 0.002 0.002 0.001 0.004 0.011 0.070 0.003 0.033 0.010 0.0592008 0.065 0.056 0.005 0.002 0.002 0.001 0.005 0.011 0.072 0.002 0.033 0.009 0.060
Appendix Table A3: Trends in Lobbyists' Background Characteristics
Of Which: Experience in/as:

Year Specialist Issue-Based HHINumber of Issues of Specialization Generalist Year Specialist
Issue-Based HHI
Number of Issues of
Specialization Generalist1999 0.24 0.33 0.33 0.32 1999 0.17 0.32 0.19 0.232000 0.22 0.33 0.29 0.29 2000 0.17 0.32 0.20 0.232001 0.22 0.35 0.27 0.25 2001 0.18 0.33 0.21 0.232002 0.22 0.34 0.26 0.25 2002 0.19 0.33 0.22 0.232003 0.23 0.35 0.28 0.24 2003 0.19 0.34 0.23 0.222004 0.23 0.35 0.29 0.24 2004 0.20 0.33 0.23 0.222005 0.24 0.35 0.31 0.25 2005 0.20 0.33 0.24 0.222006 0.26 0.35 0.34 0.26 2006 0.20 0.33 0.23 0.212007 0.28 0.34 0.36 0.27 2007 0.19 0.32 0.22 0.212008 0.29 0.34 0.40 0.29 2008 0.19 0.32 0.21 0.21Across all years 0.25 0.34 0.32 0.27 Across all years 0.19 0.33 0.22 0.22
Year Specialist Issue-Based HHINumber of Issues of Specialization Generalist Year Specialist
Issue-Based HHI
Number of Issues of
Specialization Generalist1999 0.28 0.39 0.35 0.19 1999 0.20 0.28 0.30 0.462000 0.29 0.43 0.33 0.09 2000 0.18 0.27 0.26 0.442001 0.27 0.43 0.31 0.07 2001 0.18 0.28 0.24 0.392002 0.27 0.42 0.30 0.08 2002 0.18 0.28 0.23 0.382003 0.27 0.42 0.31 0.07 2003 0.19 0.29 0.26 0.372004 0.28 0.42 0.31 0.07 2004 0.19 0.29 0.26 0.372005 0.28 0.41 0.31 0.09 2005 0.22 0.30 0.31 0.382006 0.28 0.38 0.33 0.15 2006 0.23 0.31 0.34 0.392007 0.30 0.37 0.38 0.18 2007 0.22 0.30 0.34 0.422008 0.31 0.36 0.39 0.21 2008 0.26 0.30 0.41 0.41Across all years 0.29 0.40 0.34 0.13 Across all years 0.20 0.29 0.29 0.40
Panel D: In-House Lobbyists
Appendix Table A4: Trends in Lobbyists' ExpertisePanel A: All Panel B: At Least 4 Active Years
Panel C: External Lobbyists
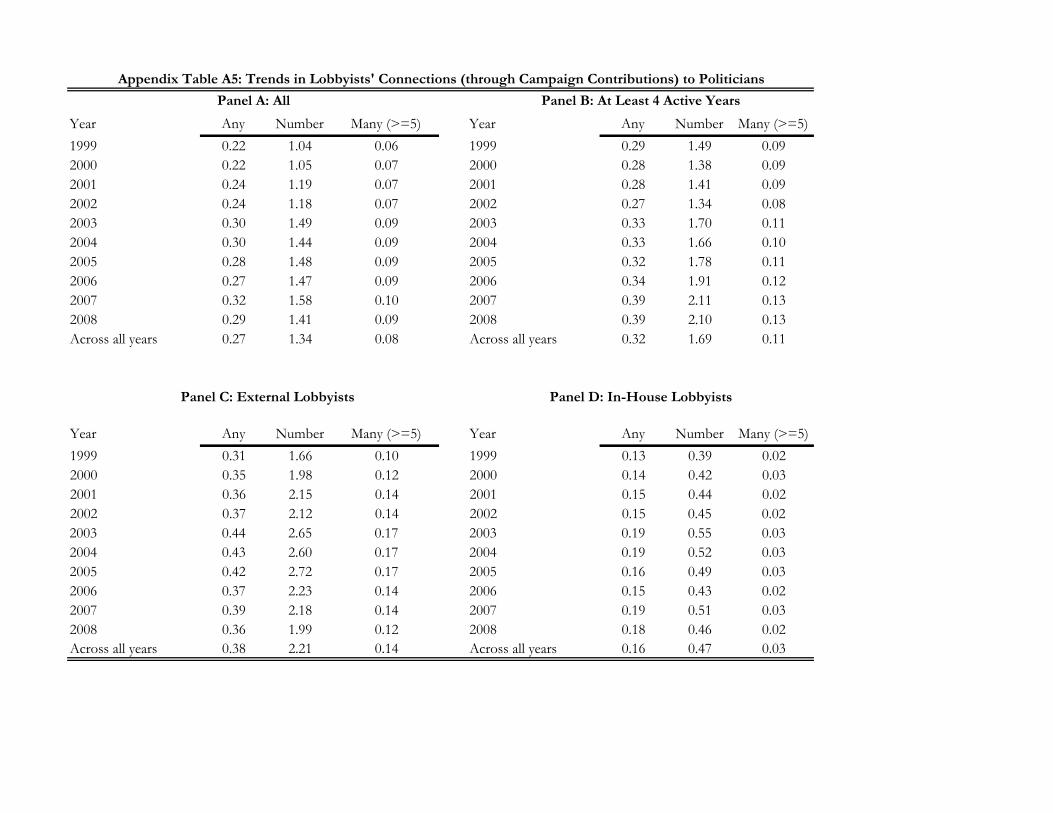
Year Any Number Many (>=5) Year Any Number Many (>=5)1999 0.22 1.04 0.06 1999 0.29 1.49 0.092000 0.22 1.05 0.07 2000 0.28 1.38 0.092001 0.24 1.19 0.07 2001 0.28 1.41 0.092002 0.24 1.18 0.07 2002 0.27 1.34 0.082003 0.30 1.49 0.09 2003 0.33 1.70 0.112004 0.30 1.44 0.09 2004 0.33 1.66 0.102005 0.28 1.48 0.09 2005 0.32 1.78 0.112006 0.27 1.47 0.09 2006 0.34 1.91 0.122007 0.32 1.58 0.10 2007 0.39 2.11 0.132008 0.29 1.41 0.09 2008 0.39 2.10 0.13Across all years 0.27 1.34 0.08 Across all years 0.32 1.69 0.11
Year Any Number Many (>=5) Year Any Number Many (>=5)1999 0.31 1.66 0.10 1999 0.13 0.39 0.022000 0.35 1.98 0.12 2000 0.14 0.42 0.032001 0.36 2.15 0.14 2001 0.15 0.44 0.022002 0.37 2.12 0.14 2002 0.15 0.45 0.022003 0.44 2.65 0.17 2003 0.19 0.55 0.032004 0.43 2.60 0.17 2004 0.19 0.52 0.032005 0.42 2.72 0.17 2005 0.16 0.49 0.032006 0.37 2.23 0.14 2006 0.15 0.43 0.022007 0.39 2.18 0.14 2007 0.19 0.51 0.032008 0.36 1.99 0.12 2008 0.18 0.46 0.02Across all years 0.38 2.21 0.14 Across all years 0.16 0.47 0.03
Appendix Table A5: Trends in Lobbyists' Connections (through Campaign Contributions) to PoliticiansPanel A: All Panel B: At Least 4 Active Years
Panel C: External Lobbyists Panel D: In-House Lobbyists
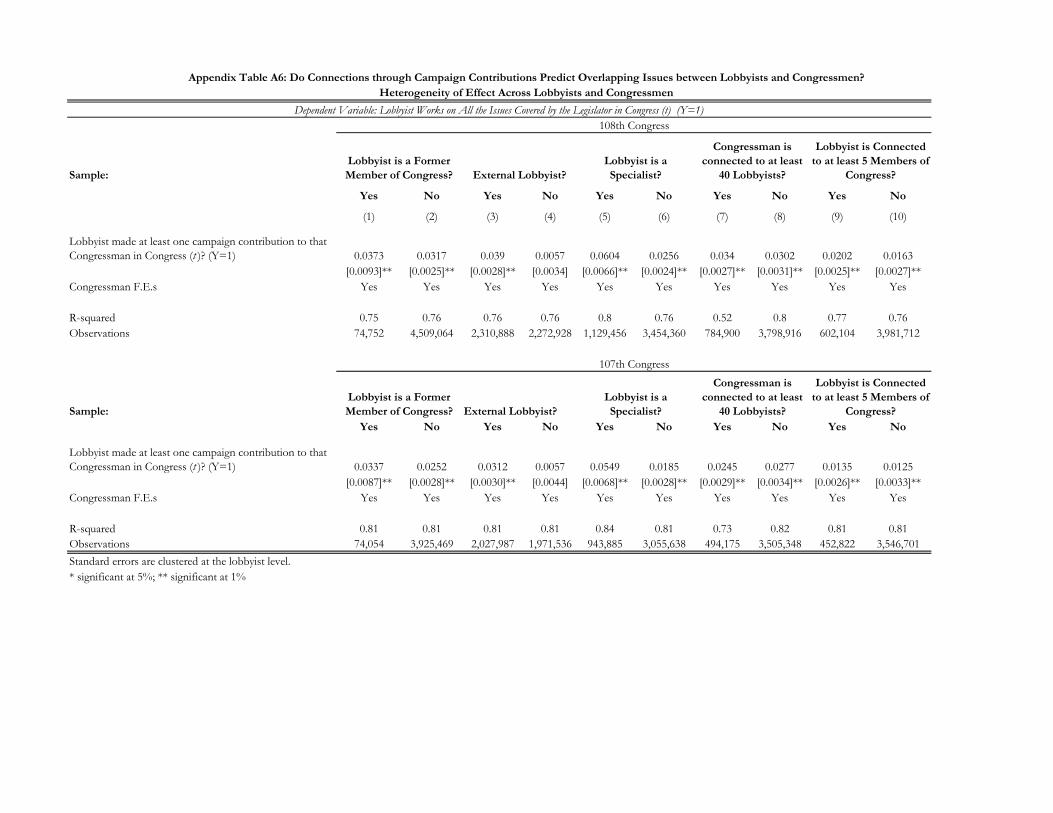
Sample:
Yes No Yes No Yes No Yes No Yes No
(1) (2) (3) (4) (5) (6) (7) (8) (9) (10)
Lobbyist made at least one campaign contribution to that Congressman in Congress (t )? (Y=1) 0.0373 0.0317 0.039 0.0057 0.0604 0.0256 0.034 0.0302 0.0202 0.0163
[0.0093]** [0.0025]** [0.0028]** [0.0034] [0.0066]** [0.0024]** [0.0027]** [0.0031]** [0.0025]** [0.0027]**Congressman F.E.s Yes Yes Yes Yes Yes Yes Yes Yes Yes Yes
R-squared 0.75 0.76 0.76 0.76 0.8 0.76 0.52 0.8 0.77 0.76Observations 74,752 4,509,064 2,310,888 2,272,928 1,129,456 3,454,360 784,900 3,798,916 602,104 3,981,712
Sample: External Lobbyist?Yes No Yes No Yes No Yes No Yes No
Lobbyist made at least one campaign contribution to that Congressman in Congress (t )? (Y=1) 0.0337 0.0252 0.0312 0.0057 0.0549 0.0185 0.0245 0.0277 0.0135 0.0125
[0.0087]** [0.0028]** [0.0030]** [0.0044] [0.0068]** [0.0028]** [0.0029]** [0.0034]** [0.0026]** [0.0033]**Congressman F.E.s Yes Yes Yes Yes Yes Yes Yes Yes Yes Yes
R-squared 0.81 0.81 0.81 0.81 0.84 0.81 0.73 0.82 0.81 0.81Observations 74,054 3,925,469 2,027,987 1,971,536 943,885 3,055,638 494,175 3,505,348 452,822 3,546,701Standard errors are clustered at the lobbyist level.* significant at 5%; ** significant at 1%
Lobbyist is a Former Member of Congress?
Lobbyist is a Specialist?
Congressman is connected to at least
40 Lobbyists?
Lobbyist is Connected to at least 5 Members of
Congress?
108th Congress
107th Congress
External Lobbyist?
Appendix Table A6: Do Connections through Campaign Contributions Predict Overlapping Issues between Lobbyists and Congressmen?Heterogeneity of Effect Across Lobbyists and Congressmen
Dependent Variable: Lobbyist Works on All the Issues Covered by the Legislator in Congress (t) (Y=1)
Lobbyist is a Former Member of Congress?
Lobbyist is a Specialist?
Congressman is connected to at least
40 Lobbyists?
Lobbyist is Connected to at least 5 Members of
Congress?

(1) (2) (3) (4)Lobbyists made at least one campaign contribution to that Congressman in Congress (t )? (Y=1) 0.330 0.293 0.173 0.111
[.0306]** [.01244]** [.0307]** [.0207]**Number of new issues for the legislator in Congress (t+1 ) that the Lobbyist covers in Congress (t ) 0.160 0.145 0.043 0.002
[.0032]** [.0033]** [.0032]** [.0017]Observations 1,892,714 1,892,714 1,892,714 1,892,714Congress F.E.s Yes Yes Yes YesLobbyist F.E.s No No Yes YesCongressman F.E.s No Yes No Yes
(1) (2) (3) (4)Lobbyists made at least one campaign contribution to that Congressman in Congress (t )? (Y=1) 0.294 0.256 0.151 0.087
[.0274]** [.0273]** [.0192]** [.0186]**Number of new issues for the legislator in Congress (t+1 ) that the Lobbyist covers in Congress (t ) 0.171 0.159 0.050 0.013
[.0029]** [.0030]** [.0022]** [.0023]**Observations 2,074,584 2,074,584 2,074,584 2,074,584Congress F.E.s Yes Yes Yes YesLobbyist F.E.s No No Yes YesCongressman F.E.s No Yes No Yes
Appendix Table A7: Do Lobbyists Follow Freshmen They Are Connected to as Those Politicians Are Elected and Gain CommitteeAssignments?
106th-107th Congress. Dependent Variable: Number of new issues for the legislator and for the lobbyist in Congress (t+1)
For each freshman legislator we include all lobbyists active during his/her first Congress, as previous issue overlap between lobbyists and politicians is not available for first term congressmen (see restriction imposed in Table 7). Sample is restricted to 106 and 107 Congresses and 108 and 109 separately for computational reasons. Standard errors clustered at the lobbyist level in all specifications. * significant at 5%; ** significant at 1%.
108th-109th Congress. Dependent Variable: Number of new issues for the legislator and for the lobbyist in Congress (t+1)

Year Total Lobbying Connected Very Connected Specialist Not Connected
SpecialistConnected
Not Specialist
1999 1,650,000,000$ 37% 14% 22% 13% 28%2000 1,760,000,000$ 37% 13% 19% 12% 29%2001 1,820,000,000$ 38% 14% 19% 11% 30%2002 2,040,000,000$ 37% 14% 18% 11% 30%2003 2,430,000,000$ 42% 17% 18% 10% 34%2004 2,420,000,000$ 45% 18% 20% 11% 36%2005 2,850,000,000$ 43% 18% 21% 11% 34%2006 3,300,000,000$ 44% 17% 20% 11% 35%2007 3,360,000,000$ 47% 19% 23% 12% 37%2008 3,040,000,000$ 42% 16% 24% 15% 33%
1999 909,000,000$ 48% 21% 24% 13% 36%2000 698,000,000$ 57% 27% 27% 13% 42%2001 777,000,000$ 58% 29% 27% 12% 43%2002 856,000,000$ 57% 27% 26% 12% 43%2003 1,060,000,000$ 65% 34% 26% 11% 50%2004 1,130,000,000$ 65% 34% 28% 12% 48%2005 1,330,000,000$ 63% 35% 28% 12% 47%2006 2,090,000,000$ 56% 25% 23% 11% 43%2007 2,330,000,000$ 56% 25% 26% 12% 42%2008 1,910,000,000$ 54% 24% 26% 13% 41%
Appendix Table A8: Dollar Shares Across Lobbyists' TypesFull Sample Shares
External Lobbyists Only Shares
Notes: Shares of total lobbying amount reported by different types of lobbyists.

YearRepublican Democratic Gap Republican Democratic Gap
1999 127.84 113.86 13.98 589 530 592000 157.64 122.94 34.70 619 556 632001 167.53 152.00 15.53 659 614 452002 201.22 168.73 32.49 711 646 652003 262.22 209.42 52.80 795 722 732004 305.84 212.25 93.59 881 766 1152005 373.71 263.05 110.66 1022 848 1742006 521.13 293.00 228.13 1110 920 1902007 449.21 370.07 79.14 1178 1029 1492008 368.94 404.62 -35.69 1230 1097 133Lobbying expenses are in millions of dollars.
Appendix Table A9: Political Cycles and Republican and Democratic LobbyistsLobbying Expenses Number of Lobbyists

Figure A1 (a): Distribution of the Share of Specialists Across Lobbying Organizations
Figure A1 (b): Distribution of the Share of Lobbyists with at least one Connection to Politicians Across Lobbying Organizations
Note: :"External" refers to external lobbying; "Internal" refers to in-house lobbying. We restrict the sample to those organizations that employ at least 2 lobbyists over the sample period. See text for details.
01
23
Den
sity
0 .2 .4 .6 .8 1(mean) specialist
ExternalInternal
kernel = epanechnikov, bandwidth = 0.0575
Kernel density estimate0
12
3D
ensit
y
0 .2 .4 .6 .8 1(mean) any_connection
ExternalInternal
kernel = epanechnikov, bandwidth = 0.0541
Kernel density estimate
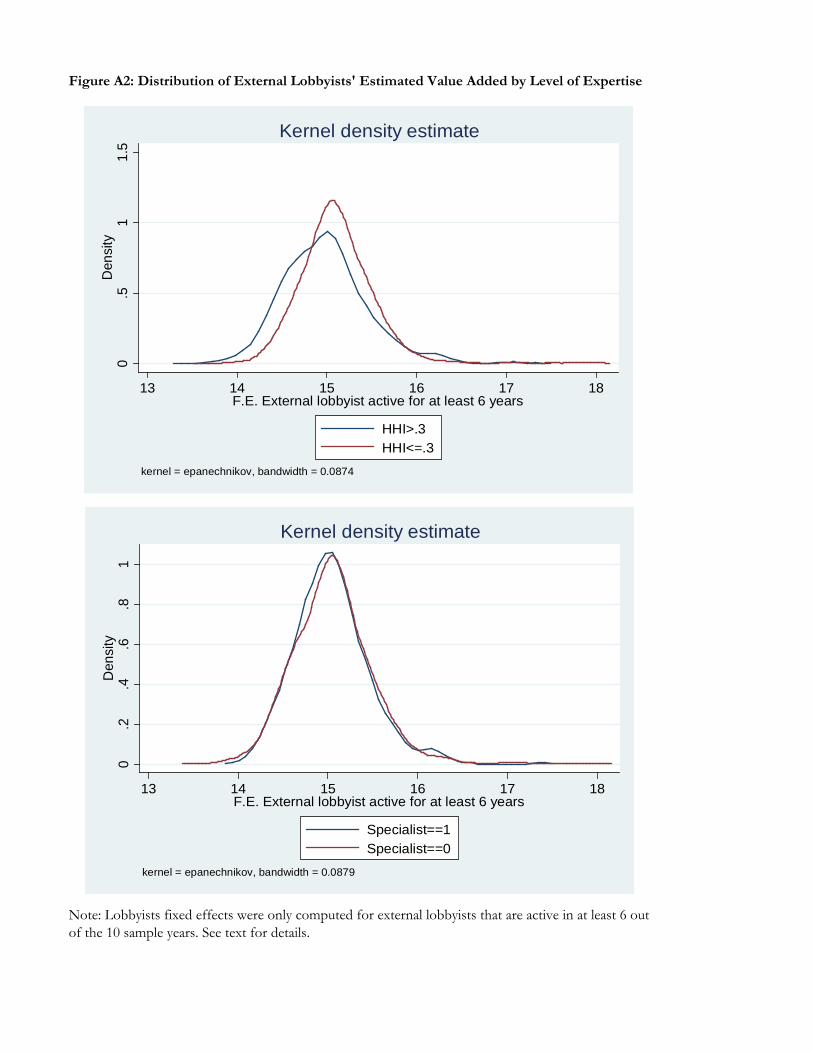
Figure A2: Distribution of External Lobbyists' Estimated Value Added by Level of Expertise
Note: Lobbyists fixed effects were only computed for external lobbyists that are active in at least 6 out of the 10 sample years. See text for details.
0.5
11.
5D
ensi
ty
13 14 15 16 17 18F.E. External lobbyist active for at least 6 years
HHI>.3HHI<=.3
kernel = epanechnikov, bandwidth = 0.0874
Kernel density estimate0
.2.4
.6.8
1D
ensi
ty
13 14 15 16 17 18F.E. External lobbyist active for at least 6 years
Specialist==1Specialist==0
kernel = epanechnikov, bandwidth = 0.0879
Kernel density estimate
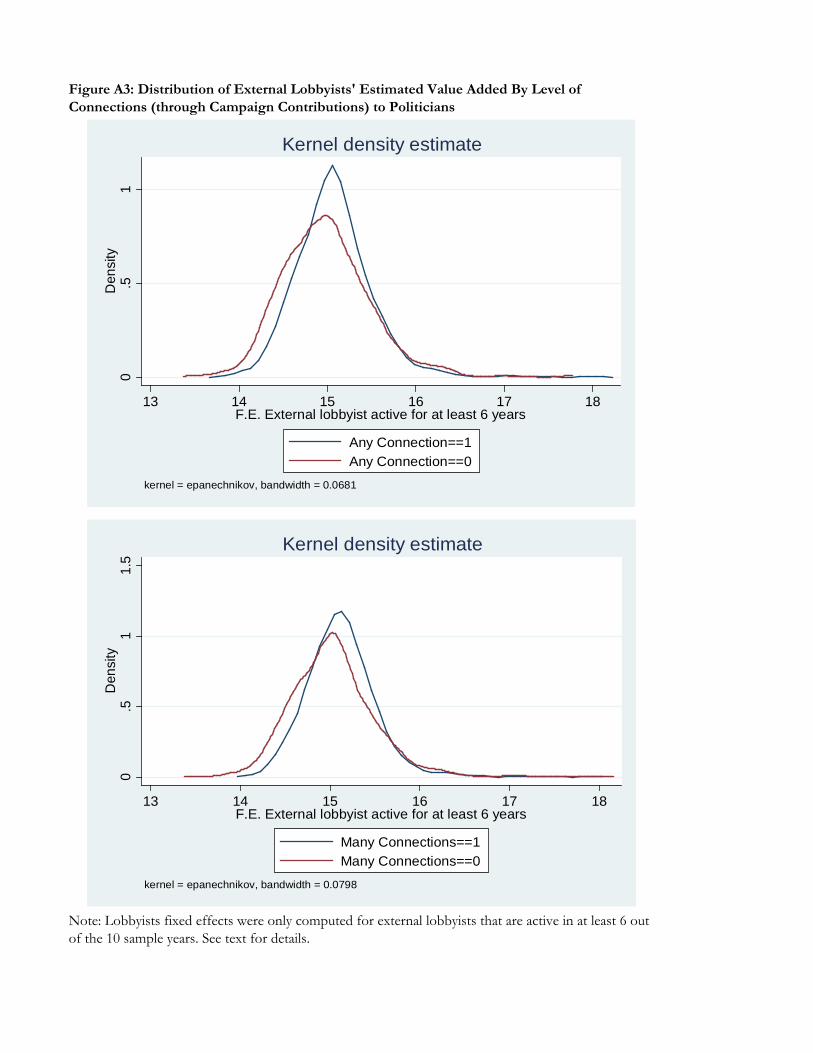
Note: Lobbyists fixed effects were only computed for external lobbyists that are active in at least 6 out of the 10 sample years. See text for details.
Figure A3: Distribution of External Lobbyists' Estimated Value Added By Level of Connections (through Campaign Contributions) to Politicians
0.5
1D
ensi
ty
13 14 15 16 17 18F.E. External lobbyist active for at least 6 years
Any Connection==1Any Connection==0
kernel = epanechnikov, bandwidth = 0.0681
Kernel density estimate0
.51
1.5
Den
sity
13 14 15 16 17 18F.E. External lobbyist active for at least 6 years
Many Connections==1Many Connections==0
kernel = epanechnikov, bandwidth = 0.0798
Kernel density estimate

Appendix A1: Lobbying Report Issue List
ACC Accounting HCR Health Issues ADV Advertising HOU Housing AER Aerospace IMM Immigration AGR Agriculture IND Indian/Native American Affairs ALC Alcohol & Drug Abuse INS Insurance ANI Animals LBR Labor Issues/Antitrust/ Workplace APP Apparel/Clothing Industry/Textiles LAW Law Enforcement/Crime/ Criminal Justice ART Arts/Entertainment MAN Manufacturing AUT Automotive Industry MAR Marine/Maritime/ Boating/Fisheries AVI Aviation/Aircraft/ Airlines MIA Media (Information/ Publishing) BAN Banking MED Medical/Disease Research/ Clinical Labs BNK Bankruptcy MMM Medicare/Medicaid BEV Beverage Industry MON Minting/Money/ Gold Standard BUD Budget/Appropriations NAT Natural Resources CHM Chemicals/Chemical Industry PHA Pharmacy CIV Civil Rights/Civil Liberties POS Postal CAW Clean Air & Water (Quality) RRR Railroads CDT Commodities (Big Ticket) RES Real Estate/Land Use/Conservation COM Communications/ Broadcasting/Radio/TV REL Religion CPI Computer Industry RET Retirement CSP Consumer Issues/Safety/ Protection ROD Roads/Highway CON Constitution SCI Science/Technology CPT Copyright/Patent/ Trademark SMB Small Business DEF Defense SPO Sports/Athletics DOC District of Columbia TAX Taxation/Internal Revenue Code DIS Disaster Planning/Emergencies TEC Telecommunications
ECN Economics/Economic Development TOB Tobacco EDU Education TOR Torts ENG Energy/Nuclear TRD Trade (Domestic & Foreign) ENV Environmental/Superfund TRA Transportation FAM Family Issues/Abortion/ Adoption TOU Travel/Tourism FIR Firearms/Guns/ Ammunition TRU Trucking/Shipping FIN Financial Inst.s/Investments/Securities URB Urban Development/ Municipalities FOO Food Industry (Safety, Labeling, etc.) UNM Unemployment FOR Foreign Relations UTI Utilities FUE Fuel/Gas/Oil VET Veterans GAM Gaming/Gambling/ Casino WAS Waste (hazard/solid/interstate/nuclear) GOV Government Issues WEL Welfare
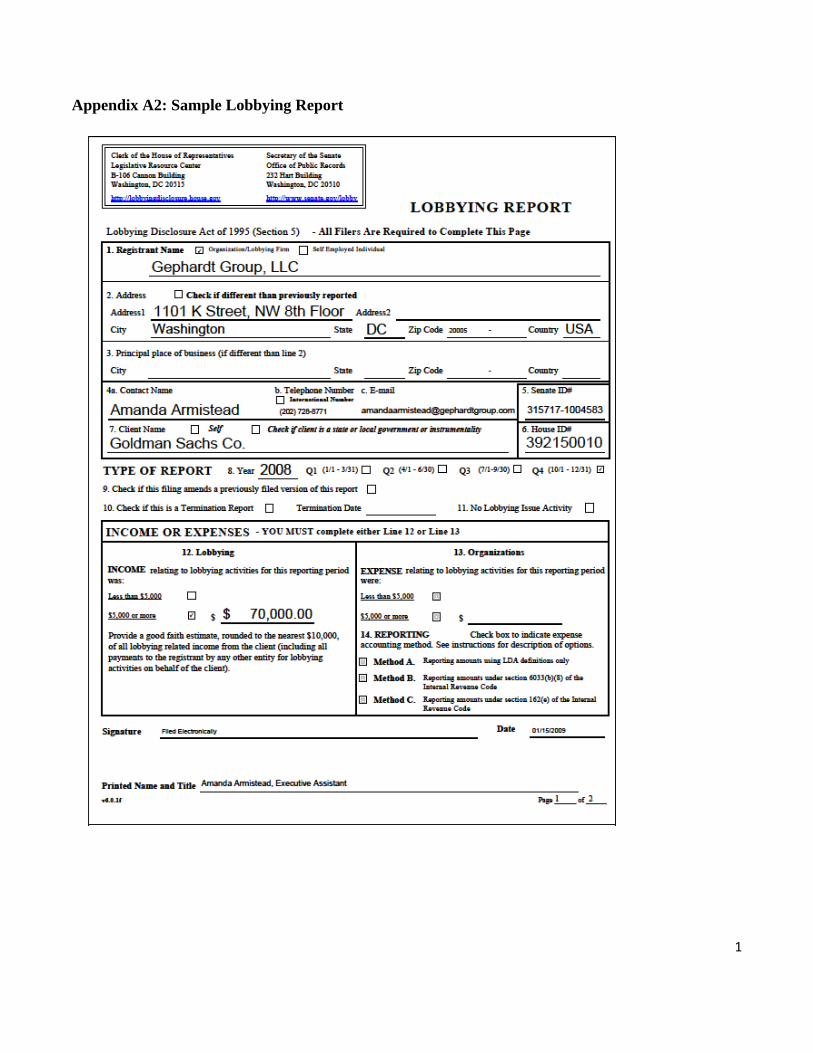
1
Appendix A2: Sample Lobbying Report

2

3
Appendix A3: Chamber, Congressional Committee, Lobbying Issues _________________________________ House, Agriculture: AGR, FOO, TOB, ANI, CDT House, Appropriations: BUD House, Armed Services (103rd, 109-110th): AER, DEF, HOM, INT House, National Security (104th - 108th): AER, DEF, HOM, INT House, Banking, Finance and Urban Affairs (103rd): HOU, FIN, INS, RES, MON, BAN, BNK, URB, GAM House, Banking and Financial Services (104th - 106th): HOU, FIN, INS, RES, TUE, BAN, BNK, URB, GAM House, Financial Services (106th - 110th): HOU, FIN, INS, RES, WED, BAN, BNK, URB, GAM House, Budget: BUD House, District of Columbia (103rd): DOC House, Education and Labor (103rd, 110th): EDU, FAM, LBR, RET, ALC, WEL, REL, ART House, Economic and Educational Opportunities (104th): EDU, FAM, LBR, RET, ALC, WEL, REL, ART House, Education and the Workplace (105th - 109th): EDU, FAM, LBR, RET, ALC, WEL, REL, ART House, Energy and Commerce (103rd, 107th - 110th): ACC, CSP, ENG, TEC, FOO, FUE, ALC, MMM, MED, ENV, SPO, TRD, TOU, HCR, CAW, WAS, UTI, PHA, MAN, ADV, MIA, CPI, COM, CDT, CHM, BEV, AUT, APP House, Commerce (104th - 106th): ACC, CSP, ENG, TEC, FOO, FUE, ALC, MMM, MED, ENV, SPO, TRD, TOU, HCR, CAW, WAS, UTI, PHA, MAN, ADV, MIA, CPI, COM, CDT, CHM, BEV, AUT, APP House, Foreign Affairs (103rd, 110th): FOR, ECN, REL House, International Relations (104th - 109th): FOR, ECN, REL House, Government Operations (103rd): GOV, POS, DOC House, Government Reform and Oversight (104th - 109th): GOV, POS, DOC House, Oversight and Government Reform (110th): GOV, POS, DOC House, House Administration (103rd, 109-110th): GOV House, House Oversight (104th - 108th): GOV House, Judiciary: LAW, CON, CPT, IMM, CIV, TOR, FIR House, Merchant Marine and Fisheries (103rd): MAR House, Natural Resources (103rd, 110th): MAR, NAT, IND, RES, GAM, CDT House, Resources (104h - 109th): APR, NAT, IND, RES, GAM, CDT House, Post Office and Civil Service (103rd): POS House, Public Works and Transportation (103rd): MAR, RRR, ROD, TRA, TRU, DIS House, Transportation and Infrastructure (104th - 110th): APR, RRR, ROD, TRA, TRU, DIS House, Rules, GOV House, Science, Space, and Technology (103rd): ENG, SCI, AER, AVI, CPI House, Science (104th - 109th): ENG, SCI, AER, AVI, CPI House, Science and Technology (110th): ENG, SCI, AER, AVI, CPI House, Small Business: SMB House, Standards of Official Conduct: GOV House, Veterans Affairs: VET House, Ways and Means: UNM, TRD, TAX, WEL, RET House, Intelligence (Select): INT, HOM House, Homeland Security (Select 107th and 108th; Standing, 109th-110th): HOM House, Energy Independence and Global Warming (Select, 110th): ENG, FUE, CDT, CAW, ENV House, Investigate the Voting Irregularities of August 2, 2007 (Select, 110th): GOV Senate, Agriculture, Nutrition, and Forestry: AGR, FOO, TOB, ANI, CDT Senate, Appropriations: BUD Senate, Armed Services: AER, DEF, HOM, INT

4
Senate, Banking, Housing, and Urban Affairs: HOU, URB, INS, RES, GAM, BAN, CDT, FIN, TRD, ECN, MON, BNK, ACC Senate, Budget: BUD Senate, Commerce, Science, and Transportation: AVI, ADV, AER, APP, AUT, COM, CPI, CSP, MAN, MAR, MIA, RRR, ROD, SCI, TEC, SPO, PHA, TRD, TRA, TOU, TRU, CHM, BEV Senate, Energy and Natural Resources: ENG, NAT, FUE, WAS, CDT, UTI Senate, Environment and Public Works: ENV, DIS, CAW, ROD, ECN, WAS Senate, Finance: UNM, TRD, TAX, WEL, RET, MMM Senate, Foreign Relations: FOR, ECN, REL Senate, Governmental Affairs (103rd to 108th): GOV, HOM, INT, POS Senate, Homeland Security and Governmental Affairs (109th): GOV, HOM, INT, POS Senate, Judiciary: LAW, CON, CPT, IMM, CIV, TOR, FIR Senate, Labor and Human Resources (103rd to 106th): EDU, FAM, LBR, RET, ALC, WEL, REL, ART, HCR, MED Senate, Health, Education, Labor, and Pensions (107th to 109th): EDU, FAM, LBR, RET, ALC, WEL, REL, ART, HCR, MED Senate, Rules and Administration: GOV Senate, Small Business (103rd to 107th): SMB Senate, Small Business and Entrepreneurship (108th and 109th): SMB Senate, Veterans Affairs: VET Senate, Aging (Special): RET, HCR Senate, Intelligence (Select): INT, HOM Senate, Ethics (Select): GOV Senate, Indian Affairs (Select): IND, GAM Joint, Library: GOV Joint, Printing: GOV Joint, Taxation: TAX Joint, Economic: ECN


![An Analysis of Indo-Pakistan Nuclear Doctrines 33 (June. 2016) An Analysis of Indo-Pakistan Nuclear Doctrines 51 them whom you do not know [but] whom Allah knows. And whatever you](https://img.dokumen.tips/doc/110x75/5aaa5cd37f8b9a7c188e024a/an-analysis-of-indo-pakistan-nuclear-doctrines-33-june-2016-an-analysis-of-indo-pakistan.jpg)