Embed Size (px)
Citation preview

Is depression associated with edentulism in Canadian adults?
by
Muneera Al Shamrany
A thesis submitted in conformity with the requirements
for the degree of Master of Science in Dental Public Health
Graduate Department of Dentistry
University of Toronto
© Copyrights by Muneera Al Shamrany (2008)

ii
ABSTRACT
Is depression associated with edentulism in Canadian adults?
Muneera Al Shamrany
Master of Science in Dental Public Health
Graduate Department of Dentistry
University of Toronto
2008
It has been hypothesized that depression can be both a risk factor and a consequence of
oral diseases. Tooth loss leads to discomfort, pain, and functional limitations which could
lead to disability and, subsequently, to handicap. However, the association between
depression and edentulism has not been established yet. Data from the Canadian
Community Health Survey (CCHS) Cycle 2.1 were used to examine the association
between edentulism and depression in community-dwelling Canadians 45 years of age
and older. Separate logistic regression models were developed for dentate and edentulous
groups as well. Different regression selection methods were implemented and the area
under the ROC curve was used to select models with the highest predictability. Analysis
showed that edentulism was not associated with depression. For the edentulous group,
oral/facial pain was the only oral health factor predicting depression, whereas avoiding
smiling or laughing, dry mouth, oral/facial pain predicted depression in the dentate
individuals.

iii
Dedication
gÉ `ç WxtÜ ctÜxÇàá ã|à{ _Éàá Éy _ÉäxA

iv
Acknowledgements
I would like to express my greatest gratitude to my parents who gave me the choice to
follow my passion in life. Next, I would like to express great appreciation and admiration
for my beloved partner in life, my husband Naeem for being by my side all the time.
I’m deeply grateful and extremely thankful to my supervisor, Dr. Herenia Lawrence who
helped me, guided me and cared for me. She has always been available and exceptionally
generous with her time and adamant to resolve difficulties along the way.
I’m also very grateful to the members of my committee, Drs. Rosemary Meier and
Asbjørn Jokstad for their valuable comments and guidance.
Special thanks to the department of Community Dentistry at the Faculty of Dentistry for
giving me such nice memories.
Last, but not least, I would like to extent my thanks to my colleagues for the positive
experience as graduate student and beyond.

v
TABLE OF CONTENTS
Abstract ii
Dedication iii
Acknowledgments iv
List of tables vi
List of Figures vii
List of abbreviations viii
Chapter 1: Introduction and overview
1. Edentulism 2
1.1 Prevalence and risk factors 3
1.2 Effect of edentulism 4
2. Depressive disorders 8
2.1 Definition of depression 8
2.2 Epidemiology of depression 9
2.3 Measurement of depression 11
2.4 Depression and oral health 13
2.5 Depression and edentulism 14
3. Aim of the study 17
Sampling Processes 18
Chapter 2: Manuscript 1 21
Chapter 3: Manuscript 2 47
Chapter 4: General discussion 70
4.1 Methodology 71
4.2 Study results 74
Chapter 5: Summary and conclusion 79
References 83
Tables 94

vi
LIST OF TABLES
Table 1. Cross-national lifetime prevalence of Major Depression Disorder (MDD) 95
Table 2. Depressive symptoms and their epidemiologic correlates 96
Table 3. Item contents of the Oral Health1 (OH1) module 103
Table 4. Item contents of the Oral Health2 (OH2) module 104
Table 5. Item contents of the Depression (DPS) module 105

vii
LIST OF FIGURES
Figure 1: Relationship between edentulism and depression 16
Figure 2: Sample extraction process for this study 20
Figure 3: Theoretical framework for variable selection 42, 66
Figure 4: ROC of the logistic regression models predicting depression for the
whole study population 67
Figure 5: ROC of the logistic regression models predicting depression for the
dentate participants 67
Figure 6: ROC of the logistic regression models predicting depression for the
edentulous participants 68

viii
LIST OF ABBREVIATIONS
ADL Activity of Daily Living AOR Adjusted odds ratio APA American Psychiatric Association AUC Area under the curve BDI Beck’s Depression Inventory BSI Brief Symptom Inventory BW Backward selection (Regression) CCHS Canadian Community Health Survey CES-D Center for Epidemiological Studies Depression Scale CI Confidence interval CIDI Composite International Diagnostic Interview CIDI-SFMD Composite International Diagnostic Interview-Short Form for Major
Depression CIHI Canadian Institute of Health Information CV Coefficient of Variation DALYs Disability Adjusted Life Years DIS Diagnostic Interview Schedule DPS Depression module DSM Diagnostic and Statistical Manual of Mental Disorders FW-Block Forward stepwise selection Block entry (Regression) FW-Item Forward stepwise selection Item-by-item entry (Regression) HAD Hospital Anxiety and Depression Scale HRSD Hamilton Rating Scale for Depression IADL Instrumental Activities of Daily Living ICD-10 International Classification of Diseases, 10th revision NCS National Comorbidity Survey NPHS National Population Health Survey MDD Major Depression Disorder OH1 Oral Health 1 module OH2 Oral Health 2 module OHRQoL Oral Health-related Quality of Life OR Odds ratio PAL Participation and Activity Limitation PDS Temporomandibular joint pain and dysfunction PSE Present State Examination PUMF Public use microdata file RAC Restriction of Activity module ROC Receiver Operating Characteristic SCAN Schedules for Clinical Assessment in Neuropsychiatry SPSS Statistical Package for the Social Sciences WHO World Health Organization WMH-CIDI World Mental Health-Composite International Diagnostic Interview ZSDS Zung Self-Rating Depression Scale

1
CHAPTER 1:
INTRODUCTION AND OVERVIEW
2
1. Edentulism
Tooth loss can affect people of all ages. Although there is a decrease in the prevalence
of edentulism over the last years, the rate of this condition still increases with age (1-4).
Prevention of tooth loss has improved tremendously in the developed world, yet studies
have shown that the mean number of teeth retained declines with aging worldwide (5).
It may seem logical that as individuals retain their natural teeth, with age they become
more vulnerable to repeated attacks of oral diseases such as dental caries and periodontal
diseases. However, the natural history of tooth loss should be clearly distinguished from
common misconceptions about “aging of the oral cavity” (6). In the past, we used to
think that tooth loss is an inevitable part of the normal aging process because of
advancing periodontal disease. In addition, we used to believe that all adults are
susceptible to severe periodontal disease and that dental caries is not a common disease in
the elderly. Nevertheless, longitudinal dental studies and laboratory investigations of
older populations have refuted those misconceptions and advanced our knowledge
regarding the natural history and prevention of oral diseases. Now, we are aware that not
all oral diseases are “aging changes”. More importantly, we learned that oral conditions
such as coronal and root caries, periodontal diseases, tooth loss, and oral mucosal
problems are “age-related changes”. These age-related changes indicate the cumulative
effect of oral diseases, stress, trauma, medications, and other health conditions over time
(6).

3
1.1. Prevalence and risk factors
Numerous studies have been conducted to examine the underlying etiology and to
predict risks of tooth loss in the adult population. For example, research from the United
States (US) showed an increase in the prevalence of edentulism with age: <1% among
adults aged 20-39 years, 4.9% among those aged 40-59 years, and 24.9% among those
aged >60 years (7). A correlation was observed between edentulism and lower family
incomes (14.6% for lower family income compared to 4.8% for high family income) and
smoking (14.4% among current smokers, 7.9% among former smokers, and 4.5% among
those who never smoked). An inverse correlation was observed between edentulism and
education: 13.5% of adults with less than a high school education, 9.1% of adults who
graduated from high school and 3.5% of adults with more than a high school education
were edentulous.
Several subgroups also have been disproportionately affected by tooth loss and
edentulism, including Black Americans, Native American Indians and Australian
Aboriginals (6). Other studies have focused on identifying risk indicators of edentulism
in community-dwelling, functionally independent older adults. Several risk indicators
were associated with tooth loss in these populations such as clinical indicators of existing
disease, history of tooth loss, smoking, race, marital status, and education (8, 9, 10).
A secondary analysis of data from the Ontario Study of the Oral Health of Older
Adults in the province of Ontario, Canada was carried out to describe the burden of oral
disorders in a population of adults of 50 years of age and older living independently in
the community (7). Approximately, 2 in 10 (24.1 %) of the participants were edentulous.
Moreover, marital status, educational status and household income were significantly

4
associated with the condition. For example, those not currently married, those with less
than high school education and those with an annual income of less than $ 20,000 had the
highest levels of edentulism.
The article "Edentulism and denture use," in the November 2005 release of Health
Reports published by Statistics Canada provides the most recent data on edentulism in
Canada (11). According to this article, about 9% of Canadians aged 15 or older reported
to the Canadian Community Health Survey in 2003 that they had no natural teeth. This
was down from 16% in 1990 (11).
1.2. Effect of edentulism
Negative impacts associated with edentulism are well-documented in the literature
(12-14). Edentulism causes a decreased ability to chew and speak, increased disability
and handicap, poor nutrition and potential harm to general health.
Physical health:
Teeth are tools for chewing a wide variety of food of different textures and nutritional
values. When teeth are lost, masticatory function declines leading to changes in dietary
intake. Evidence suggests that edentulous individuals avoid hard-to-chew foods such as
fruits, vegetables and meats and tend to choose softer, more processed foods (15).
Consequently, a typical diet of an edentulous person lacks major sources of vitamins,
minerals and proteins and is high in fat and cholesterol. Moreover, Wayler and Chauncey
examined four groups of subjects with different degrees of tooth loss and found that the
shift patterns in food selection depended on the severity of impairment (16). Other

5
researchers also documented similar findings where subjects with more teeth tended to
consume more hard-to-chew foods (17-19).
Because edentulous people alter their diet, they are at higher risk of malnutrition
compared to dentate individuals even when confounding effects of age, gender and other
socioeconomic factors were taken into account in the statistical analysis (20). Sheiham
and co-workers conducted a dental examination and collected 4-day weighted diet
diaries, blood samples and urine samples from elderly people who lived independently in
order to determine whether oral health had an impact on their consumption of essential
nutrients (20). Findings of the study showed that dentate subjects significantly consumed
higher intake of vitamin C, vitamin E, calcium, protein, fiber, non-haem iron, thiamin,
riboflavin, niacin, pantothenic acid, and intrinsic and milk sugars. In addition, the
findings suggested a dose-response effect where mean daily intake of each nutrient and
total caloric intake increased with an increase in the number of teeth retained.
There is no sufficient evidence to support the direct adverse effect of the compromised
nutritional status of edentulous individuals on their general health. However, it might be
possible to conclude that edentulous people are at greater risk for a variety of chronic
diseases such as various forms of cancer, diabetes, hypertension and heart disease due to
nutrient deficiencies (15).
Psychological health
The teeth and mouth have social, psychological and cultural significance due to their
importance in verbal and nonverbal communication (1). Research has indicated that
individuals tend to avoid social interactions due to embarrassment and/or functional
problems with perceived inadequate dentition. For example, Smith and Sheiham have
6
shown that 9% of the elderly participants in their study felt uncomfortable chewing in
front of others and 13% reported embarrassment during social interactions due to tooth
loss (21). On a more personal level, people without natural teeth avoid close relationships
because they fear rejection when the other party discovers their edentulousness (22).
Other authors have indicated that tooth loss in adults is a serious life event which requires
a more difficult readjustment period than retirement (23).
The concept of Oral Health Related Quality of Life (OHRQoL) has been used to
capture physical and psychological impacts of tooth loss since the late 1980’s. Extensive
research was conducted in the area of OHRQoL measures and, consequently, we became
able to quantify the impact of a wide variety of oral conditions in a form of score (24). A
comparison between two national samples from the United Kingdom (UK) and Australia
revealed a similar effect of tooth loss on OHRQoL (25). Findings from this study showed
that tooth loss, corrected for age, was an independent determinant of OHRQoL. A worse
effect on OHRQoL was observed with fewer than 17 natural teeth in the UK sample and
fewer than 21 teeth in the Australians. More significantly, other studies reported a dose-
response relationship between how people perceive their OHRQoL and the number of
remaining natural teeth; as the number of teeth retained decreased, people perceived their
OHRQoL more negatively (26, 27).
Others have measured psychological stress associated with oral conditions, mainly
those that cause pain, affect appearance or involve extensive tooth loss (1). Different
measures have been utilized, ranging from a single question to more standardized and
lengthy questionnaires. Findings indicated that individuals suffering from oral health

7
problems including tooth loss tend to avoid social contact, while those with persisting
pain were isolated and depressed (1).
Locker’s conceptual model of oral health explains the impact of a variety of oral
disorders including tooth loss in older adults (28). According to the model, tooth loss
leads to discomfort, pain, and functional limitations which could lead to disability and,
subsequently, to handicap. It is conceivable to hypothesize that this process could lead to
a sense of loss or feeling of depression (29).

8
2. Depressive disorders
2.1. Definition of depression
The World Health Organization (WHO) defines depression as “a common mental
disorder that presents with depressed mood, loss of interest or pleasure, feelings of guilt
or low self-worth, disturbed sleep or appetite, low energy, poor concentration and
recurrent thoughts of death and suicide” (30). According to the 2001 WHO report on
mental health, depression is a common mental disorder, causing a very high level of
disease burden, and is expected to show a rising trend during the coming 20 years as
predicted from previous trends (30).
A more comprehensive definition of depression is provided by the American
Psychiatric Association (APA) in the Diagnostic and Statistical Manual Disorders (DSM)
(31-34). In all of the four DSM versions, the APA identifies three “depressive disorders”
which are: major depression, dysthymia, and depressive disorder not otherwise specified.
Major depression or Major Depressive Disorder (MDD) is defined as a depressive
episode that lasts at least two weeks and includes at least five of the following symptoms:
depressed mood, loss of interest or pleasure in all or almost all activities, significant
weight loss or gain, insomnia or hypersomnia, psychomotor agitation or retardation,
fatigue or loss of energy, feeling of worthlessness, diminished ability to think or
concentrate and recurrent thoughts of death.
In contrast, dysthymia is a chronic condition involving depressed mood for at least two
years, during which the condition has not met the criteria of major depression and should
have at least two of the following symptoms: poor appetite or overeating, insomnia or

9
hypersomnia, low energy or fatigue, low self-esteem, poor concentration or difficulty in
making decisions, and feeling hopelessness (32-34).
Depressive disorder not otherwise specified includes conditions with depressive
features that do not meet the criteria for MDD or dysthymia disorder such as
premenstrual dysphonic disorder and minor depressive disorder. This category is defined
as at least two but fewer than five of the symptoms of the MDD in a given 2 week period
with the presence of either depressed mood or loss of interest or pleasure in activities and
significant impairment of functional status (33). The Canadian Psychiatric Association
adopted the Diagnostic and Statistical Manual Disorders IV-Text Revised (DSM IV-TR)
classification to define and diagnose depression and depressive symptoms (35).
Another important aspect of depression is how it manifests itself in the affected
individuals. Many have looked at the complex nature of depression and described several
subclassifications such as those depressive episodes present in various other mental
illness and subsyndromal depression (35). Others have looked at whether major
depression, minor depression or dysthymia, and subsyndromal depression symptoms vary
over time in the same patients as a symptomatic continuum of a single clinical disease
(34).
2.2. Epidemiology of depression
Today, MDD is the leading cause of disability globally and ranks fourth in the ten
leading causes of the global burden of disease. If projections are accurate, within the next
20 years, depression may become the second cause of the global disease burden. By the
year 2020, if current demographic and epidemiological trends continue, the burden of

10
depression will increase to 5.7% of the total burden of disease, becoming the second
leading cause of the Disability Adjusted Life Years lost (DALYs), a measure of the time
lived with disability and the time lost due to premature mortality. Worldwide depression
will be second to ischemic heart disease for DALYs lost (36). In the developed regions,
depression will then be the highest ranking cause of burden of disease. MDD, in
particular, is highly prevalent (37). Table 1 shows lifetime prevalence of MDD in ten
countries (21).
Up to 2002, the annual prevalence of MDD in Canada was available from five
Canadian surveys (38). The first three surveys of the National Population Health Surveys
(NPHS) in 1994, 1996, and 1998 reported an annual MDD prevalence of 7.5%, 5.2%, and
6.3%, respectively in people 45 years or older (38). The Canadian Community Health
Survey (CCHS) Cycle 1.1 (2000-2001) and Cycle 1.2 (2002) reported 10.1 % and 6.4%,
respectively in the same population. In Cycle 1.1, the Composite International Diagnostic
Interview-Short Form for Major Depression (CIDI-SFMD) was used, while in Cycle 1.2
the full World Mental Health-Composite International Diagnostic Interview (WMH-
CIDI) (39), a more lengthy and detailed instrument, was implemented; hence, this may
have led to the difference in MDD prevalence between 2000 and 2002.
There is a long standing perception that depression is, naturally, associated with aging.
However, studies suggest that the current and lifetime prevalence of MDD in people aged
45 years or over is significantly lower than that at younger ages (40-42). Depression is
more common among adults with physically disabling disorders (43). The presence of
depression further increases disability among this population. Moreover, depressive
disorders among elderly people (65 years and older) can go undetected even more often

11
than in younger adults because in older adults depression is often mistakenly considered a
part of the aging process. Also, depression is significantly associated with income. In the
National Comorbidity Survey (NCS) in the US, the odds ratio for MDD was significantly
higher for those individuals earning less than $20,000 a year, and declined as income
increased (40). Marital status was found to be highly associated with depression, with
those divorced and separated having over two-fold increase in depression compared to
married and never-married individuals (40). Depression may also develop as a co-morbid
condition with a wide range of chronic conditions associated with physical illness such as
cardiovascular diseases (44, 45) and diabetes (46). As part of this thesis, the literature on
correlates of depression was searched for large community/ epidemiological studies.
Articles that were identified during the search were examined and factors associated with
depressive symptoms were summarized from four countries, including Canada, in Table
2.
2.3. Measurement of depression
A large number of standardized instruments are available for measuring depression in
research and clinical settings. Those instruments can be classified according to the mode
of administration and whether or not the instrument is specific to depression. According
to the mode of administration, there are self-administrated rating and interviewer-
administrated scales. The Hamilton Rating Scale for Depression (HRSD), which was
developed to measure the severity of depression in clinical and experimental settings (47,
48), is an example of the interviewer-rated scales. The Beck Depression Inventory (BDI)
(49), the Zung Self-Rating Depression Scale (ZSDS) (50), and the Center for

12
Epidemiological Studies Depression Scale (CES-D) (51) are the most widely used self-
rating scales. Some multidimensional or generic mental assessment scales have subsets of
items specific to depression, while other scales are entirely specific to depression.
Examples of the most frequently used multidimensional scales are the Present State
Examination (PSE) (52), the Diagnostic Interview Schedule (DIS) (53), the Composite
International Diagnostic Interview (CIDI) (54) and the Schedules for Clinical Assessment
in Neuropsychiatry (SCAN) (55). Additionally, there are several shortened versions of
the original, longer scales such as the CIDI-depression short-form (CIDI-SFMD) (56)
which was designed to provide an operationalization of the DSM-IV diagnostic criteria
for major depression. The CIDI-SFMD is sufficiently brief that it can be included in
general health surveys. It detects symptoms indicative of major depression where
identification of five such symptoms (one of which must be depressed mood or loss of
interest) indicates a high probability that the person fulfilled DSM-IV criteria for major
depression in the 12 months preceding the interview. It should be noted, however, that
the short-form does not contain all exclusion items pertaining to organic conditions that
are included in the full CIDI, and may therefore detect some sub-clinical episodes (57).
The CIDI-SFMD has been developed to reduce costs in large-scale epidemiologic
studies and surveys; on the other hand, its accuracy is likely to be less than that of the full
questionnaire. When Kessler and colleagues (1998) developed the CIDI-SFMD, they
assessed its accuracy against the original CIDI. They reported overall classification
accuracy from a low of 93% for MDD episode to a high of over 99% for generalized
anxiety disorder. However, these findings are limited because the authors validated the
short-form on the same data set used to develop it (32). It is highly recommended that a

13
newly developed or shortened questionnaire be validated in an independent data set and
not in the same data set used during the development of the questionnaire (58). Patten et
al. (2000) compared the positive and negative predictive values of the CIDI-SFMD to
those of the full CIDI on a sample of 561 of subjects (57). The short-form was found to
have excellent negative predictive ability of 97.8% and a good positive predictive ability
of 75.1%.
On the other hand, there are measurement issues inherited to depression which could
limit cross-studies comparisons. The first issue is whether a study is reporting depression
at current time (current prevalence), 12-months prevalence, 6-months prevalence, 1-
month prevalence, or sometime in the past (lifetime prevalence). The second issue is the
use of different diagnostic definitions of depression. Third, most of the studies reporting
depression prevalence have limited their research to MDD type, which represents the
most extensively studied category world wide (30).
2.4. Depression and oral health
The causal relationship between depression and deteriorated oral health has not been
established yet. Nevertheless, some studies have suggested that depression could
predispose to oral diseases through some biological alterations, seen in depression, and
behavioral alterations such as loss of motivation (4), dietary changes and smoking. On
the contrary, others have indicated that the consequences of dental diseases may interfere
with positive self-esteem and OHRQoL and therefore adversely affect psychological
wellbeing (29, 59). Some researches, however, found that there is a relationship between
depression and a range of oral conditions. Dry mouth, temporomandibular joint pain and

14
dysfunction syndrome (PDS), burning mouth syndrome, and recurrent aphthous
stomatitis have been linked to depression (60-62).
The relationship between periodontal disease, a reason for tooth loss, and depression
was investigated in a number of observational studies with contradicting results. For
example, Monteiro da Silva et al. (1996) and Elter et al. (2002) have reported significant
association between depression and periodontal disease (63, 64). Examples of studies that
found no relationship between depression and periodontal disease are the investigations
conducted by Solis et al. (2004) on a sample of 153 adults, and Persson et al. (2003) on
701 older subjects (65, 66).
2.5. Depression and edentulism
Few studies have investigated the relationship between tooth loss and depression.
Drake et al. (1995) assessed the predictors of tooth loss over a three-year period among
Black and White older adults in North Carolina (9). Although tooth loss was not
associated with depression in Whites, it was significantly related with having fewer
depressive symptoms in Blacks. In another study, Hayashi et al. (2001) assessed the
association between tooth loss and a group of psychological factors, including
depression, among Japanese male factory workers and found no significant association
between depression and tooth loss (67). Anttila et al. investigated the relationship
between depression and edentulousness in a 55-year-old population in a Finnish town,
where 780 adults were included (68). They found that depressive symptoms were not
associated with edentulousness except among non-smoker men. Also, they reported that
dentate women with high rates of depressive symptoms had a more negative attitude

15
towards preserving their natural teeth, used sugary products more frequently, reported a
longer time since their last dental visit, and tended to have a lower percentage of filled
tooth surfaces than the non-depressed dentate women.
Common epidemiologic correlates
Edentulism and depression share many similar correlates such as being female, having
lower income, being divorced, widowed or separated and smoking. Although age was
also related to both conditions, evidence indicates that there is an opposite trend. While
depression is more common in younger adults, edentulism incidence increases with age
leading to higher prevalence in the elderly. As stated earlier, edentulism is correlated with
lower education; depression is related to chronic diseases leading to physical disability.
Therefore, we hypothesized a conceptual relationship between depression and
edentulism, as outlined in Figure 1 below.

16
Figure 1: Relationship between edentulism and depression
Edentulism Depression
Low Education
Low Income
Marital Status (being divorced,
widowed or separated)
Gender (being female)
Chronic disease
Physical Disability
OHRQoL

17
3. Aim of the study
Edentulism is a chronic condition known to cause physical as well as psychological
disability. Without proper oral health rehabilitation, the edentulous individual would not
have normal performance of eating, speaking, and smiling (69). Depression is known to
be related to chronic disabling conditions. Research into this topic is important especially
in the new era of holistic approach to health which is advocated as a requirement for
successful outcome in patient care.
The aim of this study is to examine the association between edentulism and depression
in individuals 45 years old or over who live independently in the community.
Specific Objectives
• Use the CCHS Cycle 2.1 data to assess the association between edentulism and
depression in participants who were 45 years or older.
• Assess the relationship of interest, controlling for known confounders or factors
associated with depression and/or edentulism in this age cohort (Figure 1).

18
Sampling processes
Since the sampling process of the CCHS was complex, it might be appropriate to
discuss the sample design of the original survey. The target population of the CCHS
Cycle 2.1 was household Canadians aged 12 years or older who are living in private
dwellings in the ten provinces and the three territories. Persons living on Indian Reserves
or Crown lands, clientele of institutions, full-time members of the Canadian Forces and
residents of certain remote regions were excluded from this survey. The CCHS covered
approximately 98% of the Canadian population aged 12 or older (70).
Sample allocation
Each province was divided into health regions (HR) and each territory was designated
as a single HR. Cycle 2.1 of the CCHS collected data in 123 HRs in the ten provinces, in
addition to one HR per territory, totaling 126 HRs. To provide reliable estimates for these
126 HRs, and given the budget allocated, a sample of 130,700 respondents was desired.
Although producing reliable estimates at the HR level was a primary objective, the
quality of the estimates for certain key characteristics at the provincial level was also
deemed important. Therefore, the sample allocation strategy, consisting of three steps,
gave relatively equal importance to the HRs and the provinces. In the first two steps, the
sample was allocated among the provinces according to their respective populations and
the number of HRs they contained. In the third step, each province’s sample was
allocated among its HRs proportionally to the square root of the estimated population in
each HR. This three-step approach guaranteed each HR sufficient sample with minimal
disturbance to the provincial allocation of sample sizes. The sample sizes were enlarged
before data collection to take into account out-of-scope and vacant dwellings and

19
anticipated non-response (70).
Sampling frames and household Sampling Strategies
The CCHS used three sampling frames to select the sample of households:
• Area frame: 48% of the sample of households came from this frame
• Telephone numbers frame: this frame contributed to 50% of the sample of
households
• Random Digit Dialling (RDD) sampling frame: was used for the remaining
2% of the sample
The rule for selecting persons from households was defined as a function of the
household composition by assigning varying probabilities of selection to individuals.
Cycle 2.1 of the CCHS included “Common” and “Optional” modules. Common
modules were the mandatory questionnaires where every participant responded to. On the
other hand, Optional modules were discretionary questionnaires planned for sub-sample
content, also available for selection by health region as optional content. In the present
study, we were primarily interested in the Depression module (DPS) and the Oral Health
2 module (OH2) to ensure measurement of the outcome and the main predictor (70).
We accessed the CCHS data electronically through the data centre of the Computing
in the Humanities and Social Sciences (CHASS). The CHASS provides support to a
number of institutes, centers, and other units within the University of Toronto. The
CHASS electronic data centre is also used by over 25 subscribing universities from
Canada and the United States. In the present study, we selectively obtained a sample from
the original sample by using the automated filtering options available on the webpage of

20
the CHASS which included removal of participants who were less than 45 years of age
and did not respond to the DPS and the OH2 questionnaires (Figure 2).
Original sample of CCHS
Cycle 2.1
Filter by age &
questionnaires completed
Sample of this study (7.5% of the original sample)
Figure 2: Sample extraction process for this study
134, 072 participants ≥ 12 yrs Responded to variety of
questionnaires (common and /or optional)
10,036 participants) ≥ 45 yrs Must have responded to
DPS & OH2 with other questionnaires

21
CHAPTER 2:
MANUSCRIPT 1
A submission to Community Dentistry and Oral Epidemiology

22
“Is depression associated with edentulism in Canadian adults?”
Muneera Al Shamrany, BDS, MSc (Dental Sciences),1 Herenia P Lawrence, DDS, MSc, PhD,2
Rosemary Meier, MB, ChB, MSc, FRCPsych, FRCPC,3 and Asbjørn Jokstad, DDS, PhD4
1MSc candidate (Dental Public Health program). Faculty of Dentistry, University of
Toronto.
2Associate Professor. Department of Biological and Diagnostic Sciences, Discipline of
Community Dentistry. Faculty of Dentistry, University of Toronto. 124 Edward Street,
Rm 515D. Toronto, Ontario, Canada. M5G 1G6
Phone: 416-979-4908 ext. 4492, Fax: 416-979-4936
E-mail: [email protected]
3Assistant Professor. Department of Psychiatry & Department of Public Health Sciences.
Faculty of Medicine , University of Toronto. Saint Joseph’s Health Centre, Toronto.
4Professor and Head. Department of Clinical Sciences, Discipline of Prosthodontics.
Faculty of Dentistry, University of Toronto.
Contact HP Lawrence for reprint requests
Muneera Al Shamrany was sponsored by the Ministry of Higher Education, Saudi Arabia
to conduct this study and fulfill one of the requirements for the degree of Master of
Sciences in Dental Public Health.

23
Abstract – Background: Negative impacts associated with edentulism, such as a
decreased ability to chew and speak, discomfort and pain, disability and handicap, poor
nutrition and potential harm to general health are well documented. Some studies
indicated that this process could lead to a sense of loss or feeling of depression. However,
the association between depression and deteriorated oral health has not been established
yet. It has been hypothesized that depression can be both a risk factor and a consequence
of oral diseases. Objective: To examine the association between edentulism and
depression in community-dwelling adults aged 45 years old and over. Methods: This was
a secondary data analysis of cross-sectional data from the Canadian Community Health
Survey (CCHS) Cycle 2.1. The strength of the relationship between edentulism and
depression was measured using ORs (95% CI), and adjusted for potential confounders.
Separate models were also developed for dentate and edentulous groups. Results: In this
large sample of the Canadian population, 14.4% (1450/10036) were completely
edentulous. The prevalence of ‘90% probability’ of depression, as measured by the CIDI-
SFMD scale, was 5% (503/10036). Conclusions: Borderline association (p=0.056)
between complete edentulism and depression showed that people who are completely
edentulous are less likely to be depressed. This association became non-significant once
the effects of potential confounders were controlled for in the multivariate analysis. For
the edentulous group, oral/facial pain was the only oral health factor predicting
depression, whereas avoiding smiling or laughing, dry mouth, oral/facial pain among
other factors predicted depression in the dentate individuals.

24
Background
Despite the fact that tooth loss prevention has improved tremendously in the
developed world, studies have shown that the mean number of teeth retained declines
with aging worldwide (1-4). For example, research from the United States (US) showed
an increase in prevalence of edentulism with age: <1% among adults aged 20-39 years,
4.9% among those aged 40-59 years, and 24.9% among those aged >60 years (5). In
Canada, about 9% of Canadians aged 15 or older who participated in the Canadian
Community Health Survey in 2003 reported that they had no natural teeth. This was
down from 16% in 1990 (6). Negative physical impacts associated with edentulism, such
as a decreased ability to chew and speak, increased disability and handicap, poor nutrition
and potential harm to general health are well-documented in the literature. Furthermore,
edentulism is associated with decreased psychological and social functioning. Therefore,
it is conceivable to hypothesize that edentulism could lead to a sense of loss or feeling of
depression (7).
The World Health Organization (WHO) defines depression as “a common mental
disorder that presents with depressed mood, loss of interest or pleasure, feelings of guilt
or low self-worth, disturbed sleep or appetite, low energy, poor concentration and
recurrent thoughts of death and suicide” (8). At present, depression is the leading cause of
disability globally and ranks fourth in the ten leading causes of the global burden of
disease. If projections are accurate, within the next 20 years, depression may become the
second cause of the global disease burden (8). The Canadian Community Health Survey
(CCHS) Cycle 1.1 (2000-2001) and Cycle 1.2 (2002) reported prevalence of depression
in 10.1% and 6.4% of the population, respectively (9). Depression is more common

25
among adults with chronic conditions that lead to physical illness such as cardiovascular
diseases, asthma and diabetes (10). Edentulism is a chronic condition, and unless the
edentulous individual receives proper oral health rehabilitation, eating, speaking, and
smiling would not be performed normally (11).
The causal relationship between depression and deteriorated oral health has not been
established yet. Some studies suggested that depression could predispose to oral diseases
through some biological alterations, seen in depression, and behavioral alterations such as
loss of motivation (4), dietary changes and smoking. On the contrary, others have
indicated that the consequences of dental diseases may interfere with positive self-esteem
and oral-health-related quality of life (OHRQoL) and therefore adversely affect
psychological wellbeing (7, 12). Some researches, however, found that there is a
relationship between depression and a range of oral conditions. Dry mouth,
temporomandibular joint pain and dysfunction syndrome, burning mouth syndrome, and
recurrent aphthous stomatitis have been linked to depression (13-15). The relationship
between depression and edentulism, on the other hand, has been less extensively
investigated. For example, Drake et al. (1995) assessed the predictors of tooth loss over a
three-year period among Black and White older adults in North Carolina (16). Although
tooth loss was not associated with depression in Whites, it was significantly related to
having fewer depressive symptoms in Blacks. In another study, Hayashi et al. (2001)
assessed the association between tooth loss and a group of psychological factors
including depression among male Japanese factory workers and found no significant
association between depression and tooth loss (17). Anttila et al. (2001) investigated the
relationship between depression and edentulousness in a 55-year-old population in a

26
Finnish town, where 780 adults were included (18). It was found that depressive
symptoms were not associated with edentulousness except among non-smoker males.
Also, it was reported that dentate women with high rates of depressive symptoms had a
more negative attitude towards preserving their natural teeth, used sugary products more
frequently, reported a longer time since their last dental visit, and tended to have a lower
percentage of filled tooth surfaces than the non-depressed dentate women.
Research into the relationship between tooth loss and depressive disorders is very
important especially in this new era of a holistic approach to health which is advocated as
a requirement for successful outcome in patient care. The aim of this study was to
examine the potential association between edentulism and depression in adults who were
living independently in the community. Specifically, the CCHS Cycle 2.1 data were used
to assess the association between edentulism and depression in participants who were 45
years and older.
Material and methods
Selection and description of participants
This study was a secondary data analysis of cross-sectional data from the Canadian
Community Health Survey (CCHS) Cycle 2.1. Participants in the current investigation
were individuals who were 45 years of age and older who participated in the CCHS
Cycle 2.1, particularly those who responded to the Oral Health 2 (OH2) and Depression
(DPS) modules in addition to other selected modules. The CCHS Cycle 2.1 was
conducted by Statistics Canada, in partnership with Health Canada, the Canadian Institute
of Health Information (CIHI), and provincial and territorial health ministries. Health

27
information for 133 health regions was collected on household-dwelling Canadians 12
years old and older. Data collection started in January 2003 and was completed in
December 2003 through personal and telephone interviews, using computer-assisted
interviewing software (19).
Measurement of dentate status
The oral health component was measured using the Oral Health 1 (OH1) and Oral
Health 2 (OH2) questionnaires. The OH1 questionnaire assesses self-perceived health of
mouth and teeth, ability to chew different foods, and frequency of pain in teeth and gums
(in the past month). The OH2 questionnaire is a more comprehensive assessment of oral
health status; it is longer and more detailed than the OH1. Specifically, edentulism is
defined as having no remaining natural teeth (complete edentulism) and is measured in
the OH2 Questionnaire by the ‘oh2c_20’ item: Has one/more of own teeth. We identified
individuals who chose the response 2 =NO as edentulous.
Measurement of depressive disorder
In the CCHS Cycle 2.1, the items used to measure depression were based on the work
of Kessler and Mroczek (20). They selected a subset of items from the Composite
International Diagnostic Interview (CIDI) (21) to develop the Short-Form for Major
Depression (CIDI-SFMD) which measures the occurrence of depressive symptoms in the
same 2-week period (in the same individuals) during the preceding years. Each
participant was asked to identify the frequency of feeling sad, blue or depressed or loss of
interest that lasted for a period of two weeks in the past 12 months before the interview.
Next, participants were asked about the frequency of feeling tired, weight gain or loss,
trouble falling asleep, trouble concentrating, feelings of worthlessness, thoughts about

28
death during the worst two-week period in the past year. Identification of five symptoms
(one of which was either a depressed mood or loss of interest) indicated a high
probability that the person fulfilled the criteria for Major Depressive Disorder (MDD) in
the 12 months preceding the interview.
Hence, in the present study depressive disorder was defined according to the
Diagnostic and Statistical Manual of Mental Disorders, 4th edition (DSM-IV).
Specifically, the item ‘dpscdpp’ in the DPS modules: Probability of Caseness to
Respondents calculates the probability, expressed as a proportion from 0 to 1, that the
respondent would have been diagnosed as having experienced MDD in the past 12
months, if they had completed the original Composite International Diagnostic Interview
(CIDI). We selected 0.9 as a cut-off value for this item indicating a 90% probability of
Caseness that the respondent would have been diagnosed as having experienced a major
depressive episode in the past 12 months. From this point further, we will refer to the
participants who had 90% probability of depression as “depressed”, “had depression” or
“had depressive disorder”.
Other covariates
Data obtained from other modules included age, gender, marital status, level of
education, income, chronic conditions, and restriction of activities. Chronic conditions
included a variety of illnesses from allergies to heart diseases, defined in the original
survey, and subsequently in this study, as conditions lasting 6 months or more. The
interviewers specified to participants that the questions were inquiring about “long-term
conditions” which has been expected to last or had already lasted 6 months or more and
should have been diagnosed by a health professional. Responses to each question were

29
not verified by the medical history. The Restriction of Activity module (RAC) used in the
original interview consisted of the Instrumental Activities of Daily Living (IADL) and
the Participation and Activity Limitation (PAL) global rating among other questions.
Statistical analyses
To address the research question, the ‘oh2c_20’ variable – “Has one/more of own”
teeth in the OH2 module was used as the main explanatory variable, while the variable
‘dpscdpp’ – “Probability of Caseness” to respondents in the DPS module was considered
the outcome measure. Bivariate analyses were conducted by performing cross-tabulations
to analyze the variation in the distributions of the variables. Statistical tests at this level
included the Chi-squared test, Fisher’s exact test and estimates of the risks (odds ratio
and 95% confidence intervals). At the multivariate level, the association between
depressive disorder and dentate status was examined controlling for confounders such as
dental and socio-demographic characteristics, dental visit patterns, chewing ability,
(removable) denture wearing, chronic conditions, and physical function. We combined
statistical and expert approaches in conducting the multivariate analyses to ensure
inclusion of factors found statistically significant in bivariate analyses as well as those
found very well documented in the literature, even though they were not statistically
significant at the bivariate level. A hierarchical regression approach was employed to
control the order of variables entry. Figure 3 shows the order in which variables were
entered into the model.
Different selection procedures were used including: 1) forward stepwise selection
where models were built by adding items in blocks (FW-Block), 2) item-by-item forward
stepwise selection (FW-Item) and 3) backward stepwise selection (BW). First, those

30
methods were applied to the entire study population which included both dentate and
edentulous individuals to examine the association between depression and edentulism.
Because some variables were specific to the dentate cases such as experiencing
toothache, bleeding gums and frequency of tooth brushing, models were also constructed
for dentate and edentulous groups separately (using the 3 methods of variables selection)
to improve the fit of each model. We anticipated that the final models would be different
in terms of number and what variables they included; thus the Receiver Operating
Characteristic (ROC) curve was employed to compare the predictive abilities of the
models for each group. Models with the greater area under the curve were selected as
final models.
Since a complex sampling process had been used in the original CCHS Cycle 2.1
where every participant was assigned a probability value to be included in the survey,
coefficients of variation (CV) approximation tables were obtained from Statistics Canada
and were used in our study to estimate the precise 95% CI around the Adjusted Odds
Ratios (AOR). This method was necessary to avoid underestimating the variance. Data
analyses were carried out using SPSS, Version 15.0.
Results
Out of 134,072 participants in the CCHS original survey, a sample size of 10,036
(7.49%) was extracted through the inclusion process. This sample consisted of 43.1%
males and 31% were aged 45 to 54 years (Table 1). Most of the participants, 61.9%, were
married or had a common-law partner. Also, 53% had more than secondary school
education and only 9.2% had low income. While the prevalence of edentulism was

31
14.4%, the 1-year prevalence of depressive disorder was 5%. A high proportion of
participants (85.1%) reported that they had one or more chronic condition and 46%
experienced limitations in participation and activity ‘sometimes’ or ‘often’.
Only 58 individuals were identified as being both edentulous and having a depressive
disorder; they constituted 11.5% of all depressed individuals and only 4% of the
edentulous populations (Table 2). Interestingly, while the prevalence of edentulism
increased consistently with age, the prevalence of depressive disorder showed an opposite
trend. Seventy percent of the edentulous population reported having secondary school
grade education or less. In addition, the proportion of individuals who suffered one or
more chronic conditions was very large in the edentulous and the depressed populations,
91.7% and 96.6%, respectively. Females were nearly as twice as likely to be depressed
compared to males. The OR of being socially limited such as having difficulty making
new friends, dealing with unknown people, and starting and/ or maintaining
conversations among the edentate individuals ranged from 1.57 to 1.86. Similarly, the
likelihood of social limitation among the depressed group was extremely high (OR=
8.32-10.10). Table 2 summarizes demographic, socioeconomic, and other characteristics
by the main predictor and outcome.
Some oral symptoms were negatively associated with being edentulous such as
experiencing bleeding gums, bad breath, and oral or facial pain (Table 3). On the
contrary, dentates were 1.21 more times more likely to report dry mouth compared to
edentates. It is important, however, to mention that only 67 (4.6%) individuals in the
edentulous population of this study reported that they did not wear dentures (bare gums).
More importantly, almost one-third of the dentate population (32.7%) in this study

32
reported wearing dentures. Still the OR of wearing dentures among the edentulous
participants was as high as 42.41. Oral functional disability was reported more frequently
by the edentulous individuals compared to the dentates. On the other hand, there were no
statistically significant differences between the two groups concerning the avoidance of
smiling or laughing and conversation; and whether the individuals felt that they were
socially limited due to their oral health conditions. The frequency of dental visits showed
an opposite trend for the two groups of dentate and edentulous participants. Among the
edentulous study population, 84.3% reported that they visited the dentist on an
emergency basis only. Moreover, when we combined the proportion of edentulous
individuals who reported visiting a dentist more than once a year and those who visited a
dentist only once a year, the combined proportion is still very small (11%). Among the
dentate population the largest proportion (47.1%) reported visiting their dentists more
than once a year; still, 17.8% of the dentates reported visiting the dentist on an
emergency basis only.
Individuals who were identified as depressed were more likely to have dental
insurance and less likely to wear dentures (Table 3). However, they were more likely to
experience oral health symptoms and have oral functional disability compared to the non-
depressed participants. In terms of oral functions, depressed individuals were more likely
to experience inability to chew when compared to non-depressed participants. More
significantly, dry mouth and orofacial pain were 3 times more likely to be reported by
depressed adults compared to the non-depressed. Regarding negative social impact, the
ORs ranged from 2.80 to 4.61 among the depressed individuals.

33
Table 4 presents the final models predicting depression for the study population,
dentate participants, and edentulous participants. The model for the study population
showed that the relationship between depression and dentate status was not significant.
However, this model included other oral health variables such as bleeding gums, dry
mouth, orofacial pain and avoidance of laughing/smiling. The model predicting
depression in edentulous participants had nearly half (8 variables) the number of
variables retained in the model developed for the dentate participants (14 variables). Age,
orofacial pain, and back pain were retained in the three models in Table 4. The
interaction term of age and edentulism was not associated with depression (p = 0.847).
The models displayed in Table 4 were selected as final models because they had the
highest AUC compared to the rest of the models, not presented in this paper. The models
predicting depression for the entire study sample had very similar AUC: FW-Block
model =0.812 (95% CI = 0.791-0.832), FW-Item model =0.817 (95% CI = 0.797-0.837),
and BW model =0.816 (95% CI = 0.796-0.836).
The AUC for the models for the edentulous individuals were: FW-Block
model=0.859 (95% CI = 0.804-0.914), FW-Item model =0.850 (95% CI = 0.795-0.907),
and BW model =0.863 (95% CI = 0.806-0.921).
Finally, the AUC values for the dentate models were: FW-Block model=0.813 (95%
CI = 0.793-0.833), FW-Item model =0.827 (95% CI = 0.792-0.832), and BW model
=0.809 (95% CI = 0.788-0.829).
In general, the predictability for all models ranged from a low of AUC= 0.809 to as
high as 0.863 which is considered as excellent predictability.

34
Discussion
At the bivariate level of analysis, borderline association (p=0.056) existed between
dentate status and depression. The association showed that people who are completely
edentulous are less likely to be depressed. But, this borderline association became non-
significant once the joint effect of potential confounders was controlled for in the
multivariate analysis. Results from the bivariate analysis were consistent with those of
Drake’s et al. (1995) study where tooth loss was significantly related to having fewer
depressive symptoms in Blacks (16). In our study, the final logistic regression model
indicated that in adults aged 45 years or older, dentate status is not associated with being
depressed, which confirmed the general findings of all previous studies (16-18).
Although smoking was not related to depression or edentulism at the bivariate level,
we included it in the multivariate modeling because there is evidence supporting the
relationship among smoking, tooth loss, and depression (18). Also, experts advise against
using the bivariate associations as a method of screening risk factors for use in
multivariate analysis because important predictors may be excluded if their effect is
masked by others (22). Nevertheless, smoking was not retained in any of the models
indicating that it was not an important correlate of depression in our sample. This finding
contradicts that reported by Ohayon et al. (1999) which showed a dose-response
relationship between cigarette consumption and depression where the risk of depression
increased with an increase in the number of cigarettes consumed (23).
Although edentulism was not a significant predictor of depression, the final model for
the entire study sample included oral health-related predictors that were confirmed to be
related to depression by previous evidence. The model explains that not only are chronic

35
conditions such as migraine headaches, fibromyalgia, and back problems associated with
depression, but also oral health problems such as avoidance of smiling or laughing, dry
mouth and oral/facial pain are significant predictors of depression.
One important observation is the difference between the final model for the dentate
and that for the edentulous groups in terms of the number and type of variables retained.
Initially, we resorted to the apparent difference in age between dentate and edentulous
populations, as shown in Table 2, to explain the difference between the models for each
group. The bivariate analysis indicated that as age increased, edentulism prevalence
increased and depression prevalence decreased steadily. Yet, the interaction term between
age, edentulism and depression was not significant. This led us to become more inclined
to believe that having teeth is the only explanation for more dental-related predictors in
the dentate regression model. Specifically, depression was associated with symptoms
related to “having teeth” in the dentate population.
The prevalence of edentulism and depression in this selected study sample was 14.4%
and 5%, respectively. It is important to be extremely cautious when citing these statistics
as estimates for edentulism and depression in Canadian adults 45 years or older. The
estimates we reported are restricted to the sample we selected through specific selection
criteria and, therefore, not absolutely applicable to this age group in Canada.
Nevertheless, the estimates are in agreement with the previously reported national
statistics. About 9% of Canadians aged 15 or older reported to the Canadian Community
Health Survey in 2003 that they had no natural teeth. This was down from 16% in 1990
(24). Also, the annual prevalence of MDD was 4.8% as reported in the CCHS 1.2 (25).

36
The main limitation of this study is the weak discriminative ability of the question
assessing dentate status because it classifies people with as few as one remaining tooth as
dentate. Also, the original survey did not account for implant supported dentures versus
conventional dentures. On the other hand, the large sample size allowed for a large
number of potential confounders to be controlled for in the analysis. In addition, choosing
strict cut-off point for depression at 90% probability increased the accuracy of identifying
cases of depression (26).
Depression should be one of the conditions included in the medical history taking
prior to dental treatment. One study has shown that self-reported depression was second
only to hypertension in frequency of all diseases and disorders recorded in the medical
history (27). We highly encourage dental professionals to be aware of what oral health
factors are associated with depression in order to identify those at high risk. Evidence
indicates that having dental symptoms such as dry mouth, pain and cosmetic concerns
that interfere with social activities are linked with depression. Dental factors along with
other factors known to increase the probability of depression should be kept in mind and
used as a screening tool to identify potentially depressed patients visiting the dental
office. Having said so, it is important to be always cautious when extrapolating clinical
data, in this instance clinical correlates of depression, from community surveys due to the
methodological limitations inherited to such surveys.
Nonetheless, dental professionals are encouraged to refer potential patients for
psychiatric care and utilize already available community and local resources targeted to
prevent and treat depression. This approach has a significant implication in dentistry
given that depressed patients require special management because of the negative

37
behavioral and biological impacts of depression (28). Further, the outcomes of successful
dental interventions for edentulism can be underestimated by the depressed patients
leading to dissatisfaction of those patients (29). An inter-disciplinary approach is an
important determinant of successful, long-term dental intervention outcomes.
As a final note, we found that the lack of association between depression and
edentulism is a counter-intuitive. However, this finding was consistent with what has
been previously reported. We suspect that depression could be more related to the
incidence of edentulism rather than the prevalence. In another word, we hypothesized that
depression could manifest with rapid onset of edentulism where the individual does not
have enough time to adapt to the condition. The previous studies that investigated the
relationship between depression and edentulism did not control for the onset of
edentulism. Unfortunately, the CCHS surveys do not contain items that allow us to
assess this hypothesis as well.
Acknowledgements
The authors especially wish to thank: Laine Ruus, University of Toronto, Data
Library Service; Andrew Turvey, Statistics Canada / Statistique Canada, Central
Region / Région du Centre; and Chee Wong, Public Health Branch, Ministry of
Health Promotion, Ontario, Canada for their assistance in accessing and weighting
the CCHS data.

38
Reference
1. US Department of Health and Human Services. Oral health in America: a report of
the Surgeon General. Rockville (MD): US Department of Health and Human
Services, national Institute of Dental and Cranofacial Research, National Institute of
Health, 2000.
2. Kelly M, Steele J, Nuttall N, Bradnock G, Morris J, Nunn J, et al. Adult Dental
Health Survey: Oral Health in the United Kingdom 1998. London: The Stationary
Office. 2000.
3. World Health Organization. WHO oral health country/ area profile programme.
Malmo University, Sweden: WHO Division of Non-communicable Disease/Oral
Health, WHO Collaborating Center; 2003.
4. Douglass CW, Shih A, Ostry L. Will there be a need for complete dentures in the
United States in 2020? J Prosthet Dent 2002;87(1):5–8.
5. Beltrán-Aguilar ED, Baker LK, Canto MT, Dye BA, Gooch BF, Griffin SO and
others. Surveillance for Dental Caries, Dental Sealants, Tooth Retention,
Edentulism, and Enamel Fluorosis -United States, 1988-1994 and 1999-2002.
MMWR August 26, 2005; 54(03):1-44.
6. Statistic Canada, Health Reports. Edentulism in Canada. The Daily, November 16,
2005. November issue of Health Reports, Vol. 17, No. 1.
7. Kressin NR, Spiro A 3rd, Atchison KA, Kazis L, Jones JA. Is depressive
symptomatology associated with worse oral functioning and well-being among
older adults? J Public Health Dent. 2002 Winter; 62(1):5-12.

39
8. The World Health Report 2001 - Mental Health: New Understanding, New Hope.
Geneva World Health Organization, 2001.
9. Kessler RC, Ustun TB. The World Mental Health (WMH) Survey Initiative Version
of the World Health Organization (WHO) Composite International Diagnostic
Interview (CIDI). Int J Methods Psychiatr Res. 2004;13(2):93-121.
10. Patten SB, Wang JL, Beck CA, Maxwell CJ. Measurement issues related to the
evaluation and monitoring of major depression prevalence in Canada. Chronic Dis
Can. 2005 Fall;26(4):100-6.
11. Heydecke G, Locker D, Awad MA, Lund JP, Feine JS. Oral and general health-
related quality of life with conventional and implant dentures. Community Dent
Oral Epidemiol. 2003 Jun;31(3):161-8.
12. Sheiham A, Cushing AM, Maizels J. The social impacts of dental disease. In: Slade
GD (ed) Measuring oral heath and quality of life. University of North Carolina,
Dental Ecology, Chapel Hill. 1997.
13. Anttila SS, Knuuttila ML, Sakki TK. Depressive symptoms as an underlying factor
of the sensation of dry mouth. Psychosom Med. 1998 Mar-Apr;60(2):215-18.
14. Soto Araya M, Rojas Alcayaga G, Esguep A. Association between psychological
disorders and the presence of Oral lichen planus, Burning mouth syndrome and
Recurrent aphthous stomatitis. Med Oral. 2004; Jan-Feb;9(1):1-7.
15. Gatchel RJ, Stowell AW, Buschang P. The relationships among depression, pain,
and masticatory functioning in temporomandibular disorder patients. J Orofac Pain.
2006 Fall;20(4):288-96.

40
16. Drake CW, Hunt RJ, Koch GG. Three-year Tooth Loss among Black and White
Older Adults in North Carolina. J Dent Res 1995;74(2): 675-80.
17. Hayashi N, Tamagawa H, Tanaka M, Hanioka T, Maruyama S, Takeshita T and
others. Association of tooth loss with psychological factors in male Japanese
employee. J Occup Health 2001; 43:351-55.
18. Anttila SS, Knuuttila MLE & Sakki TK. Relationship of depressive symptoms to
edentulousness, dental health, and dental health behavior. Acta Odontol Scand
2001; 59:406–12.
19. Statistics Canada. The CCHS Cycle 2.1 available from the URL:
<http://www.statcan.ca/english/concepts/health/cycle2_1/index.htm>
20. Kessler RC, Andrews G, Mroczek D, Üstün TB, Wittchen H-U. The World Health
Organization Composite International Diagnostic Interview Short-Form (CIDI-SF).
Int J Methods Psychiatr Res. 1998;7:171-85.
21. World Health Organization. Composite International Diagnostic Interview (CIDI).
WHO, Division of Mental Health 1990, Geneva.
22. Sun GW, Shook TL, Kay GL. Inappropriate use of bivariable analysis to screen risk
factors for use in multivariable analysis. J Clin Epidemiol 1996; 49:907-16.
23. Ohayon MM, Priest RG, Guilleminault C, Caulet M. The prevalence of depressive
disorders in the United Kingdom. Biol Psychiatry 1999; 45:300-07.
24. Statistic Canada, Health Reports. Edentulism in Canada. The Daily, November 16,
2005. November issue of Health Reports, Vol. 17, No. 1.

41
25. Patten SB, Wang JL, Williams J VA, Currie S, Beck CA, Maxwell CJ, el-Guebaly
N. Descriptive Epidemiology of Major Depression in Canada. Can J Psychiatry
2006; 51(2): 84-90.
26. Patten SB. Long-term medical conditions and major depression in the Canadian
population. Can J Psychiatry. 1999 Mar; 44(2):151-7.
27. Woods CD. Self-Reported Mental Illness in a Dental School Clinic Population.
Journal of Dental Education 2003; 67(5): 500-504.
28. Friedlander AH, Mahler ME. Major depressive disorder. Psychopathology, medical
management and dental implications. JADA 2001; 132: 629-38.
29. John M, Micheelis W, Steele J G. Depression as a Risk Factor for Denture
Dissatisfaction. Journal of Dental Research; Sep 2007; 86(9): 852-7.

42
Figure 3: Theoretical framework for variable selection
5th Horizontal Selection
4th Horizontal Selection 3rd Horizontal Selection 2nd Horizontal Selection 1st Horizontal Selection Outcome
Physical Disability variables
Chronic conditions
Socio-economic variables
Dentate status (main predictor) & Demographic variables
Depression
Oral health variables

43
Table 1: General characteristics of the study population
Variable Frequency (%)
Gender (Female) 5707 (56.9) Age
45-54 yrs 55-64 yrs 65-74 yrs ≥ 75 yrs
3067 (30.6) 2842 (28.3) 2366 (23.6) 1761 (17.5)
Marital status Married/ Common-law Widow/Separated/ Divorced Single/Never Married
6203 (61.9) 3106 (31) 717 (7.2)
Education ≤ Secondary Grad > Secondary Grad
4601 (46.8) 5223 (53.2)
Income* Low Income Middle or High Income
834 (9.2)
8231 (90.8) Has depression (at 90% probability)** 503 (5) Has no teeth (edentulism) 1450 (14.4) Has a chronic condition 8533 (85.1) Participation and activity limitation
Sometimes Often Never
2448 (24.5) 2167 (21.7) 5382 (53.8)
* This variable classifies the total household income into 2 categories based on total household
income and the number of people living in the household. Low Income includes: < $15,000 if 1
or 2 people, <$20,000 if 3 or 4 people, and <$30,000 if 5+ people. Middle or High Income
includes: ≥$15,000 if 1 or 2 people, ≥$20,000 if 3 or 4 people, and ≥$ 30,000 if 5+ people.
** Depression was measured using the Composite International Diagnostic Interview -Short-
Form for Major Depression (CIDI-SFMD).

44
Tabl
e 2.
Pre
vale
nce
of d
emog
raph
ic, s
ocio
econ
omic
and
oth
er c
hara
cter
istic
s by
dent
ate
and
depr
essi
on st
atus
Com
plet
ely
Ede
ntul
ous
90%
Pro
babi
lity
of
Dep
ress
ion
Var
iabl
e Y
es %
n*
OR
(95%
C.I.
)
Yes
%
n*
O
R (9
5%C
.I.)
Dep
ress
ion
4 85
86
0.76
^ (0
.58-
1.01
)
- -
- Ed
entu
lism
-
- -
95
33 (1
4.6)
50
3 (1
1.5)
0.
76^
(0.5
8-1.
01)
Gen
der (
Fem
ale)
60
.4
8586
1.
19b (1
.06-
1.33
)
9533
(56.
2)
503
(70.
4)
1.86
c (1.5
3-2.
26)
Age
45
-54
yrs
55-6
4 yr
s 65
-74
yrs
≥ 75
yrs
8.
6 20
.4
33.8
37
.2
85
86
1 2.
76c (2
.22-
3.42
) 6.
20c (5
.05-
7.61
) 10
.50c (8
.54-
12.9
0)
52
.1
29.6
11
.1
7.2
95
33
1 0.
59c (0
.48-
0.73
) 0.
26c (0
.19-
0.35
) 0.
22c (0
.16-
0.32
) M
arita
l sta
tus
Mar
ried/
Com
mon
-law
Wid
ow/S
epar
ated
/ Div
orce
d Si
ngle
/Nev
er M
arrie
d
49
.2
46.8
4
85
77
1 2.
15c (1
.92-
2.43
) 0.
68b (0
.51-
0.90
)
48
.4
40.2
11
.4
95
24
1 1.
71c (1
.42-
2.07
) 2.
12c (1
.57-
2.86
) N
umbe
r of p
erso
ns ≥
12
year
s old
in h
ouse
hold
N
one
≥ 1
15
5.9
85
86
0.
36c (0
.25-
0.51
)
93
7
95
33
1.
28
(0.9
0-1.
83)
Num
ber o
f per
sons
6-1
1 ye
ars o
ld in
hou
seho
ld
Non
e ≥
1
14
.9
5.3
85
86
0.
32c (0
.21-
0.49
)
95
5
95
33
1.
16 (0
.77-
1.75
)
Num
ber o
f per
sons
≤ 5
yea
rs o
ld in
hou
seho
ld
Non
e ≥
1
14
.6
7.1
85
86
8586
0.
45b (0
.27-
0.76
)
97
.6
2.4
95
33
1.
15 (0
.64-
2.08
)
Educ
atio
n (≤
Sec
onda
ry G
rad)
70
.1
8405
3.
12c (2
.77-
3.53
)
44.4
93
28
0.90
(0.7
5-1.
08)
Low
-Inco
me
20.1
77
99
3.12
c (2.6
6-3.
67)
16
.9
8593
2.
12c (1
.65-
2.73
) Sm
okin
g (D
aily
/ Occ
asio
nal)
20.6
85
53
1.03
(0.9
0-1.
19)
21
.5
9494
1.
09 (0
.87-
1.35
) H
as a
chr
onic
con
ditio
n 91
.7
8580
2.
12c (1
.74-
2.58
)
96.6
95
28
5.25
c (3.2
2-8.
54)
Nee
ded
help
with
serie
s of t
asks
(IA
DL)
40
.3
8567
2.
24c (2
.00-
2.52
)
48.1
95
10
2.87
c (2.3
9-3.
44)
Parti
cipa
tion
and
Act
ivity
Lim
itatio
n (P
AL)
N
ever
So
met
imes
O
ften
41
.3
33.5
25
.2
85
55
1 2.
31c (2
.02-
2.63
) 1.
41c (1
.22-
1.62
)
29
.3
42.4
28
.3
94
95
1 3.
88c (3
.13-
4.82
) 2.
19c (1
.73-
2.78
) D
iffic
ulty
- m
akin
g ne
w fr
iend
s 23
.6
8579
1.
86c (1
.39-
2.49
)
16.1
95
26
10.1
0c (7.6
4-13
.37)
D
iffic
ulty
- de
alin
g w
ith u
nkno
wn
peop
le
22.7
85
78
1.77
c (1.3
1-2.
38)
14
.5
9524
8.
69c (6
.51-
11.5
9)
Diff
icul
ty -
star
ting/
mai
ntai
ning
con
vers
atio
n 20
.7
8583
1.
57b (1
.13-
2.16
)
12.9
95
28
8.32
c (6.1
5-11
.25)
^B
orde
rline
sig
nific
ance
(p =
0.0
56),
a p
< 0.
05, b p
< 0
.005
, c p <
0.0
01
* n
repr
esen
ts th
e nu
mbe
r of r
espo
nden
ts in
eac
h qu
estio
n. T
he n
umbe
r var
ies d
ue to
diff
eren
ces i
n th
e re
spon
se ra
te fo
r eac
h qu
estio
n. T
he n
umbe
r of p
artic
ipan
ts re
spon
ded
“Yes
” ca
n be
obt
aine
d by
mul
tiply
ing
the
% b
y th
e n
for e
ach
row
. The
tota
l num
ber o
f the
ede
ntul
ous p
artic
ipan
ts is
145
0, a
nd th
e to
tal n
umbe
r of t
he p
artic
ipan
ts w
ith 9
0%
prob
abili
ty o
f dep
ress
ion
is 5
03.
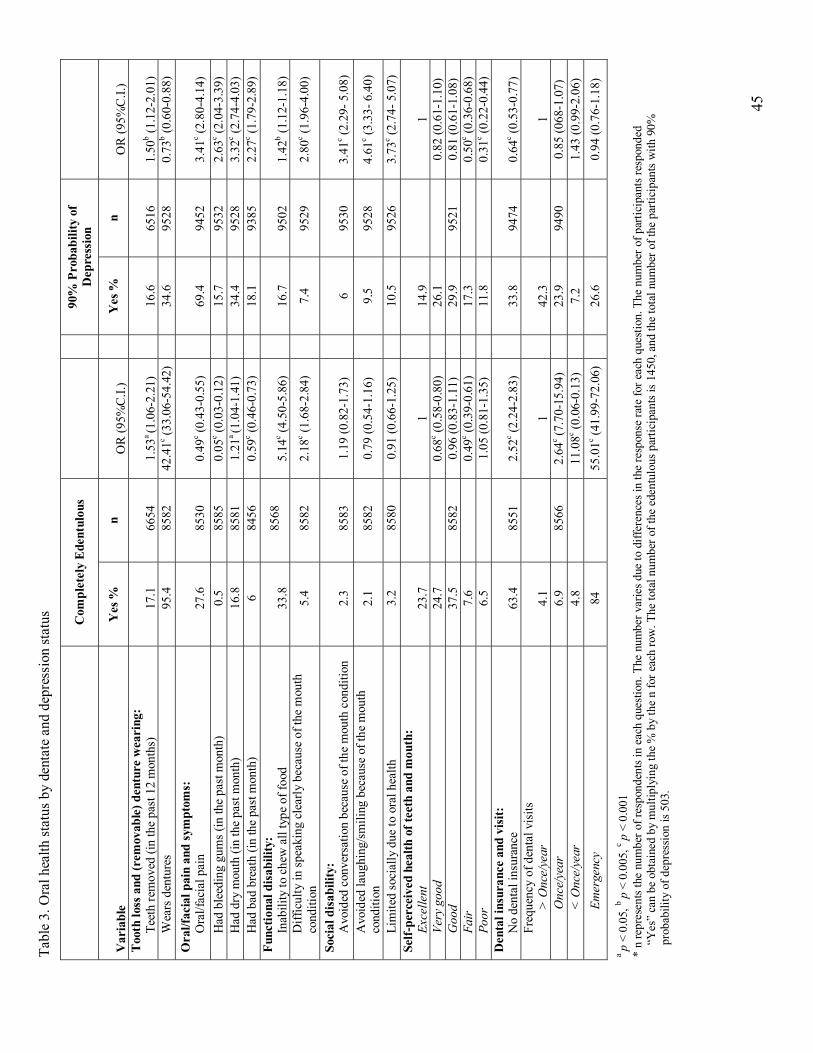
45
Tabl
e 3.
Ora
l hea
lth st
atus
by
dent
ate
and
depr
essi
on st
atus
Com
plet
ely
Ede
ntul
ous
90%
Pro
babi
lity
of
Dep
ress
ion
Var
iabl
e Y
es %
n
O
R (9
5%C
.I.)
Y
es %
n
O
R (9
5%C
.I.)
Too
th lo
ss a
nd (r
emov
able
) den
ture
wea
ring
: Te
eth
rem
oved
(in
the
past
12
mon
ths)
17.1
6654
1.53
a (1
.06-
2.21
)
16
.6
65
16
1.
50b (1
.12-
2.01
) W
ears
den
ture
s 95
.4
8582
42
.41c (3
3.06
-54.
42)
34
.6
9528
0.
73b (0
.60-
0.88
) O
ral/f
acia
l pai
n an
d sy
mpt
oms:
O
ral/f
acia
l pai
n
27
.6
85
30
0.
49c (0
.43-
0.55
)
69
.4
94
52
3.
41c (2
.80-
4.14
) H
ad b
leed
ing
gum
s (in
the
past
mon
th)
0.5
8585
0.
05c (0
.03-
0.12
)
15.7
95
32
2.63
c (2.0
4-3.
39)
Had
dry
mou
th (i
n th
e pa
st m
onth
) 16
.8
8581
1.
21a (1
.04-
1.41
)
34.4
95
28
3.32
c (2.7
4-4.
03)
Had
bad
bre
ath
(in th
e pa
st m
onth
) 6
8456
0.
59c (0
.46-
0.73
)
18.1
93
85
2.27
c (1.7
9-2.
89)
Func
tiona
l dis
abili
ty:
Inab
ility
to c
hew
all
type
of f
ood
33
.8
8568
5.14
c (4.5
0-5.
86)
16.7
9502
1.42
b (1.1
2-1.
18)
Diff
icul
ty in
spea
king
cle
arly
bec
ause
of t
he m
outh
co
nditi
on
5.4
8582
2.
18c (1
.68-
2.84
)
7.4
9529
2.
80c (1
.96-
4.00
)
Soci
al d
isab
ility
: A
void
ed c
onve
rsat
ion
beca
use
of th
e m
outh
con
ditio
n 2.3
85
83
1.
19 (0
.82-
1.73
)
6
9530
3.41
c (2.2
9- 5
.08)
A
void
ed la
ughi
ng/sm
iling
bec
ause
of t
he m
outh
co
nditi
on
2.1
8582
0.
79 (0
.54-
1.16
)
9.5
9528
4.
61c (3
.33-
6.4
0)
Lim
ited
soci
ally
due
to o
ral h
ealth
3.
2 85
80
0.91
(0.6
6-1.
25)
10
.5
9526
3.
73c (2
.74-
5.0
7)
Self-
perc
eive
d he
alth
of t
eeth
and
mou
th:
Exce
llent
23.7
1
14
.9
1
Very
goo
d 24
.7
0.
68c (0
.58-
0.80
)
26.1
0.82
(0.6
1-1.
10)
Goo
d 37
.5
8582
0.
96 (0
.83-
1.11
)
29.9
95
21
0.81
(0.6
1-1.
08)
Fair
7.
6
0.49
c (0.3
9-0.
61)
17
.3
0.
50c (0
.36-
0.68
) Po
or
6.5
1.
05 (0
.81-
1.35
)
11.8
0.31
c (0.2
2-0.
44)
Den
tal i
nsur
ance
and
vis
it:
No
dent
al in
sura
nce
63
.4
85
51
2.
52c (2
.24-
2.83
)
33
.8
94
74
0.
64c (0
.53-
0.77
) Fr
eque
ncy
of d
enta
l vis
its
> O
nce/
year
4.1
1
42.3
1 O
nce/
year
6.
9 85
66
2.64
c (7.7
0-15
.94)
23.9
94
90
0.85
(068
-1.0
7)
< O
nce/
year
4.
8
11.0
8c (0.0
6-0.
13)
7.
2
1.43
(0.9
9-2.
06)
Emer
genc
y 84
55.0
1c (41.
99-7
2.06
)
26.6
0.94
(0.7
6-1.
18)
a p
< 0.
05, b p
< 0
.005
, c p <
0.0
01
* n
repr
esen
ts th
e nu
mbe
r of r
espo
nden
ts in
eac
h qu
estio
n. T
he n
umbe
r var
ies d
ue to
diff
eren
ces i
n th
e re
spon
se ra
te fo
r eac
h qu
estio
n. T
he n
umbe
r of p
artic
ipan
ts re
spon
ded
“Yes
” ca
n be
obt
aine
d by
mul
tiply
ing
the
% b
y th
e n
for e
ach
row
. The
tota
l num
ber o
f the
ede
ntul
ous p
artic
ipan
ts is
145
0, a
nd th
e to
tal n
umbe
r of t
he p
artic
ipan
ts w
ith 9
0%
prob
abili
ty o
f dep
ress
ion
is 5
03.

46
Table 4. Logistic regression models predicting depression for all study sample, dentate group, and edentulous group
All study sample Dentate group Edentulous group
Variable AOR* (95% CI) AOR (95% CI) AOR (95% CI) Edentulism 0.94 (0.66-1.33) Gender (female) 1.41b (1.13-1.77) 1.50 b (1.18-1.91) - Age
45-54 yrs 55-64 yrs 65-74 yrs ≥ 75 yrs
1
0.56c (0.44-0.71) 0.24 c (0.17-0.34) 0.16 c (0.10-0.24)
1 c 0.54 c (0.42-0.69) 0.20 c (0.13-0.29) 0.12 c (0.07-0.19)
1 b
0.63 (0.27-1.47) 0.24 b (0.09-0.66) 0.25 c (0.09-0.56)
Marital status Married/ Common-law Widow/Separated/ Divorced Single/Never Married
1 c
1.69 c (1.34-2.14) 1.35 (0.95-1.93)
1 c 1.73 c (1.35)
1.28 (0.88-1.88)
-
Income (Low) 1.51a (1.10-2.07) - 2.02 a (1.04-3.90) Dental insurance 0.78 a (0.62-0.98) - 0.51 a (0.26-1.00) Avoided laughing/smiling because of the mouth condition 1.65 a (1.09-2.50) 1.94 b (1.26-2.97) -
Bleeding gum 1.36 a (1.00-1.85) - - Dry mouth 1.68 c (1.30-2.19) 1.72 c (1.31-2.27) - Orofacial pain 1.51 b (1.17-1.94) 1.57 b (1.21-2.04) 3.34 c (1.74-6.38) Participation and Activity Limitation (PAL)
Often Sometimes Never
1 b
1.65 b (1.21-2.26) 1.41 a (1.07-1.87)
1 b
0.66 b (0.49-0.89) 1.19 (0.90-1.59)
-
Need help with series of tasks 1.47 b (1.12-1.94) 1.56 b (1.17-2.07) - Difficulties in social situations 3.53 c (2.60-4.80) 2.88 c (2.04-4.07) 9.39 c (4.63-19.06) Has food allergies - - 3.27 b (1.41-7.58) Has fibromyalgia 1.74 b (1.17-2.60) - - Has back problems 1.62 c (1.31-2.02) 1.51 b (1.20-1.92) 2.41 b (1.28-4.51) Chronic fatigue syndrome - 1.77 a (1.07-2.93) - Has migraine headaches 1.41 a (1.08-1.83) 1.49 b (1.13-1.97) - Has cancer 1.68 a (1.09-2.58) - 2.76 a (1.03-7.41) Has glaucoma - 1.79 a (1.02-3.14) - Has stomach or intestinal ulcers - - - Has bowel disorder
1.71 b (1.19-2.45)
2.04 c (1.39-2.98)
-
* Adjusted Odds Ratio, a p < 0.05, b p < 0.005, c p < 0.001

47
CHAPTER 3:
MANUSCRIPT 2
A submission to Statistical Methods in Medical Research

48
“Comparing predictability of logistic regression models using different selection
methods” Muneera Al Shamrany BDS, MSc (Dental Sciences) 1
Herenia P Lawrence DDS, MSc, PhD 2
1 MSc candidate (Dental Public Health program)
Faculty of Dentistry, University of Toronto.
2 Associate Professor
Dept. of Biological and Diagnostic Sciences / Community Dentistry
Faculty of Dentistry, University of Toronto.
124 Edward Street, Rm 515D. Toronto, Ontario, Canada. M5G 1G6
Phone: 416-979-4908 ext. 4492
Fax: 416-979-4936
E-mail: [email protected]
Contact HP Lawrence for reprint requests
Muneera Al Shamrany was sponsored by the Ministry of Higher Education, Saudi Arabia
to conduct this study and fulfill one of the requirements for the degree of Master of
Sciences in Dental Public Health.

49
Abstract: Researchers face the challenge of dealing with large number of variables when
they analyze data from large epidemiological surveys. Various multivariate modeling
methods are available to help eliminate noise variables and control for confounding
effects in order to identify true predictors for the outcome of interest. However, each
method has its limitations. Further, when different regression selection procedures are
applied to the same data set, they could yield different prediction models. One important
criterion to keep in mind when selecting among different models is the model’s ability to
predict the outcome of interest. In this paper we demonstrated a practical example of
utilizing the Receiver Operating Characteristics (ROC) curve as a decision tool to select
among different binary regression models constructed using three selection procedures.
The results from this study showed slight differences in the area under the curve (AUC);
nevertheless, it provided us with a yardstick to choose one model for each population. We
anticipate that the similarity in variable contents and the AUC is due to the large data set
we used. We recommend the ROC as a decision tool to help researchers select among
several candidate models. It is an easy, automated procedure, yet, it offers statistical
information that can be used along with the expert judgment.

50
1. Introduction
Researchers face the challenge of dealing with large number of variables when they
analyze data from large epidemiological surveys. Typically, such data are used to explore
underlying relationships between one or more outcomes to several predictors that could
be continuous, ordinal, categorical or simply binary. Several multivariate modeling
methods are available to help eliminate noise variables and control for confounding
effects in order to identify true predictors for the outcome of interest. None of those
methods is the perfect approach and each method has its limitations (1).
Binary logistic regression is a method of choice for outcomes that have two events,
typically caseness and non-caseness, with categorical and continuous predictors (2). It is
important to point out the sensitive nature of the regression algorithms in terms of
variable selection process. Statistical packages allow researchers to control entry and exit
of variables in analysis through different selection methods. Most of these packages have
the options of forward, backward and stepwise selection procedures to build a prediction
model. The final models constructed using different methods from the same data set are
extremely unlikely to be identical. Further, a particular selection method could produce
virtually an infinite number of models depending on what variables would be entered first
to the model and, subsequently, researchers often find themselves in a position to select
among different potential models (1). This, especially, is a bigger challenge in case of
large epidemiologic surveys with large number of predictors (3).
Checking model fit is an important step once a model has been developed in order to
verify model assumptions. However, this step does not provide a base to choose among
several models because it is highly likely that most of the models would have the same

51
degree of fit because they have all been built using the same data set (1). One criterion
that is important to keep in mind when selecting among different models is the model’s
ability to predict the outcome of interest. Different methods were proposed to facilitate
comparing predictability of two or more models such as Monte Carlo simulation (4),
bootstrapping (5) and the receiver operating characteristics (ROC) (6).
In this paper we demonstrated a practical example of utilizing the ROC as a decision
tool to select among different binary regression models constructed using three selection
procedures. The data set used for this demonstration was obtained from the Canadian
Community Health Survey (CCHS) Cycle 2.1 (7).
2. Methods
Description of study design and participants
This investigation was a secondary analysis of the CCHS Cycle 2.1 data in order to
identify predictors of depression in a sample of 10,036 Canadian adults who were 45
years of age or older. The CCHS Cycle 2.1 was collected on household Canadians 12
years or older from January 2003 to December 2003 through personal and telephone
interviews (7).
Measurements
Depressive disorder was defined according to the Diagnostic and Statistical Manual
of Mental Disorders, 4th edition (DSM)-V (8). The Composite International Diagnostic
Interview-Short Form (CIDI-SFMD) was used, which measures the occurrence of
depressive symptoms in the same 2-week period (in the same individuals) during the 12
months preceding the interview (9). Specifically, the item ‘dpscdpp’: Probability of

52
Caseness to Respondents calculates the probability (0-1) of caseness of depression where
0 was assigned to respondents who denied the two stem questions: feeling depressed or
loss of interest in things. We selected 0.9 as a cut-off value for this item indicating a 90%
probability of caseness that the respondent would have been diagnosed as having
experienced a major depressive episode in the past 12 months. From this point further, we
will refer to the participants who had 90% probability of depression as “depressed”, “had
depression” or “had depressive disorder”. Therefore, depression was coded as a binary
variable where each participant was classified into the ‘depressed’ or ‘non-depressed’
category. Moreover, depressed participants were identified as such according to their
responses to the DPS questionnaire with no clinical verification.
The CCHS included several modules measuring socio-demographic variables,
chronic conditions, physical disability, and smoking habits among a vast number of
variables. The literature was reviewed for evidence on epidemiologic correlates of
depression in this age group as part of another study which investigated the association
between complete loss of natural teeth (edentulism) and depression (10). All potential
predictors were categorical variables, mainly binary response variables.
Preliminary data management
First, we ensured that variables had the proper coding for the regression analysis to
predict the caseness of depression; for instance, we assigned 0 to “non-depressed” and 1
to “depressed”. Some examples of coding of predictors are smoking: 0= no and 1= yes,
gender: 0= male and 1= female, complete edentulism: 0= no and 1= yes and so forth.
Before we started the regression modeling, we had a large number of variables that
needed to be reduced due to small frequencies of responses. We elected to use the bi-

53
variable analysis to assess underlying patterns of association between predictor variables
and depression. We combined this approach with evidence from the literature on
epidemiologic depression correlates to guide us to keep important predictors even if they
had no significant association with depression at the bivariate level. Bivariate analyses
were done by performing cross-tabulations to analyze the variation in the distributions of
the variables. Statistical tests at this level included the Chi-squared-test, Fisher’s exact
test and estimates of the risks (odds ratio and 95% confidence intervals). Further,
multicolinearity was assessed and was found more evident among variables measuring
psychological impact. We used the authors consensus to select between highly correlated
variables and a third party, a psychiatrist, was consulted when the authors did not reach
an agreement.
Binary regression modeling
At the stage of multivariate analysis, we have already reduced the number of
predictors to about 30 variables at the bivariate analysis. A hierarchical logistic
regression approach was employed in order to decide the order of variables entry. Figure
1 shows the general order in which variables were entered into each model. We used the
SPSS to conduct different regression procedures including: 1) forward stepwise selection
where models were built by adding variables in blocks (FW-Block), 2) forward stepwise
selection item-by-item (FW-Item) and 3) backward stepwise selection (BW).
Details of selection procedures:
1. Forward stepwise selection block entry (FW-Block): The SPSS allows an
automated block entry of variables. We used Figure 3 as a guide to select what
group of variables would be block 1, block 2 and so forth. For example, block 1

54
included the predictor of interest (edentulism) and the demographic variables.
Block 2 included the socioeconomic variables such as income, education, marital
status and etc. Also, we elected to run the regression analysis every time we
added a block. For instance, regression analysis was conducted at the stage of
block 1 entry and before block 2 entry of variables. This allowed us to examine
block 1 variables that were retained in the model in order to manually remove
those that did not stay in the model before proceeding to adding block 2.
2. Forward stepwise selection Item-by-item entry (FW-Item): This model was built
by adding items one at a time and assessing the model at each entry to facilitate
manual removal of variables that were not significant.
3. Backward stepwise selection (BW): We followed the typical backward stepwise
procedures which consisted of starting a “full model” that included all variables
eligible for the multivariate analysis. After running the algorithm, we manually
removed variables that were not significant and re-run the algorithm. The process
of manual elimination of non-significant variables and re-running the logistic
regression was repeated until we obtain the final model that contained the
significant variables only.
Since we used SPSS, we chose to keep the default variable entry and retention
criterion of 0.05 and 0.10, respectively, for all regression algorithms (11).
First, the three procedures were applied to the entire study population (n= 10,036)
which included both dentate and edentulous individuals to facilitate the comparison
between the two groups. Because some variables were specific to the dentate cases such
as experiencing toothache, bleeding gums and frequency of tooth brushing, separate

55
models were also constructed for dentate (n= 8586) and edentulous (n= 1450)
populations to improve the fit of each model. Therefore, we ended up with a total of 9
candidate models; 3 for each population. We anticipated that the models could be
different in terms of number and what variables they included; thus the Receiver
Operating Characteristics (ROC) curve was used to compare the predictive abilities of
these models. Models with the greater area under the curve (AUC) were selected as final
models.
Since complex sampling process has been used in the original CCHS Cycle 2.1 where
every participant was assigned a probability value to be included in the survey,
coefficients of variation (CV) approximation tables were obtained from Statistics Canada
and were used in our study to estimate the precise 95% confidence interval around the
Adjusted Odds Ratios (AOR).
3. Results
The models developed for the entire study population were very similar but not
identical (Table 1). The model with the most predictors was the FW-Item (17 variables).
For the dentate participants, Table 2, all three models contained 14 predictors with some
variation on the variables retained. The BW method yielded the largest number of
predictors (8 variables) of depression in the model for edentulous individuals compared
to the FW-Block and FW-Item selection methods. Nevertheless, Tables 1, 2 and 3 show
striking similarity in the strength of the odds ratio across the three models for each
population.

56
The areas under the ROC curve for all the models are presented in Table 4. For each
population, the AUCs were very close to each other with overlapping confidence
intervals. The graphic presentation for the ROC comparisons, Figures 2, 3 and 4, reflect
the similar predictability of the three models constructed for the entire study population,
dentate and edentulous participants, respectively. In Table 4, the model with the largest
AUC was the FW-Item for the entire study population, FW-Block for the dentate
participants, and BW for the edentulous participants. All the areas under the ROC curve
were statistically different from the reference line which represents 0.5 chance
predictability. In general, the predictability for all models ranged from a low of AUC=
0.809 to as high as 0.863 which is considered as excellent predictability.
4. Discussion
When different regression selection procedures are applied to the same data set, they
could yield different prediction models (12). In the example we presented, the three
models constructed from specific data sets were not identical, although they were highly
similar in content and number of predictors. This particular finding addresses the
objective of this paper and emphasizes the need for a tool that assists researchers to
choose among more than one potential final model. Also, the results demonstrated the
sensitivity of commonly used regression algorithms (13). Automated regression analyses
in statistical packages are a convenient way of making predictions by eliminating the
noise and identifying true risk factors. Investigators need to realize that this convenience
comes at a price of robustness, especially when dealing with small data sets. The main
reason for poor robustness of regression modeling is the boundless possibilities of how a

57
variable could enter the analysis (12). In other words, one can choose from several
regression methods, and further; even within a chosen method one can choose the order
of variables entry in an unrestricted fashion. For example, if we have 10 variables at the
stage of multivariate modeling that include “preventive therapy” as a predictor for an
outcome of interest, we would be able to choose when this particular predictor enters the
model; we might decide to add it at the beginning, second, third, or forth, and so on. The
same applies to the rest of the variables. This leads to unlimited number of combinations
of variables entering the model at the same time, and subsequently, a huge number of
comparisons to be carried out by the regression algorithm.
The ability of the regression model to predict the outcome of interest should be the
guiding criterion to choose among candidate models. In the case of binary logistic
analysis, the model should have good ability to discriminate between people who have
the outcome and those who do not. In this practical example, we compared the ability of
the models to discriminate between those who had depression and those who did not.
Model validation methods can be classified as external and internal methods (14).
External validation has been described as the most stringent; where the developed model
is tested on different data set than that used in constructing it. In order to achieve this type
of validation, Harrell et al. (1996) described the application of the “frozen model” to a
new population (15). Nonetheless, unbiased internal validation should precede any
external validation.
The purpose of this paper was to assess the performance of logistic regression by
comparing the AUC of each of three models developed for separate study populations.
The area under the ROC curve has been used by others to assess the effectiveness of

58
several logistic regression models in making accurate prediction (6, 10, 16). The results
from this study showed slight difference in the AUC; nevertheless, it provided us with a
yardstick to choose one model for each population. We anticipated that the similarity in
variable contents and the AUCs among the three models is due to the large data set we
used. We are more inclined to expect larger variation, in both AUC and variable contents,
among regression models in case of small data sets. The reason for such a problem is the
fact that the number of the predictors in most of the studies is relatively large for the data
set leading to multiple comparisons that require larger sample to be accurate (17).
While forward variable selection is typically recommended to build a model;
backward selection is recommended as a “check method” against the result of the
forward procedures and not as a method of choice for building a regression model (11).
The result in this study indicated that none of the selection procedures used was
consistently superior to the others and, hence, each selection method is suitable for
variable selection. Instead, more attention should be given to checking the fit and the
performance of candidate regression models to select the best model. Careful testing of
the model fit is a very crucial step to ensure satisfaction of the regression model
assumptions; however, this subject is beyond the scope of the present paper.
Graphic presentation of the ROC curve offers a useful visual tool to examine the
AUC and can be obtained directly from most statistical packages. The three ROC curves
were overlapped for the entire study population and for the dentate individuals. On the
other hand, we observed relatively more variation in the AUC and the shape of the ROC
among the three models developed for the edentulous population. The sample size for the
latter is roughly one-fifth (14.9%) the size of the entire study population and less than a

59
quarter (18 %) of the size of the dentate population which indicates the impact of sample
size on the performance of regression models.
In general, we presented a way of using the ROC as a method of assessing regression
models performance and we used a real data example for this purpose. We recommend
this method as a decision tool to help researchers choose among several candidate
models. It is an easy, automated procedure, yet, it offers statistical information that can be
used to add to expert’s judgment.
Acknowledgements
The authors would like to express their gratitude to Laine Ruus, University of
Toronto, Data Library Service; Andrew Turvey, Statistics Canada / Statistique
Canada, Central Region / Région du Centre; and Chee Wong, Public Health
Branch, Ministry of Health Promotion, Onatrio, Canada for their assistance in
accessing and handling the CCHS data.
60
References
1. Greenland S. Modeling and variable selection in epidemiologic analysis.
Commentary. Am J Public Health 1989; 79(3):340-49.
2. Lemeshow S, Hosmer DW, Applied Logistic Regression, 2nd Ed. Wiley-
Interscience, 2001.
3. Dohoo IR, Ducrot C, Fourichon C, Donald A, Hurnik D. An overview of
techniques for dealing with large numbers of independent variables in
epidemiologic studies. Preventive Veterinary Medicine 1997; 29(3):221-239.
4. O’Gorman TW, Woolson RF. Variable selection to discriminate between two
groups: Stepwise logistic regression or stepwise discriminant analysis. The
American Statistician 1991; 45(3):187-93.
5. Wählby U, Jonsson EN, Karisson MO. Comparison of stepwise covariate model
building strategies in population pharmacokinetic- pharmacodynamic analysis.
AAPS PharmSci 2002; 4(4): article 27.
6. Hedgewald J, Pfahlberg A, Uter W. A backwards-manual selection macro for
binary logistic regression in the SAS v.8.02 PROC LOGESTIC procedure.
Available from the URL:
< http://www.imbe.med.uni-erlangen.de/issan/SAS/bms/bms_manuel.pdf >
7. Statistic Canada, Health Reports. Edentulism in Canada. The Daily, November
16, 2005. November issue of Health Reports, Vol. 17, No. 1.
8. American Psychiatric Association. Diagnostic and statistical manual of mental
disorders, 3rd edn. revised. American Psychiatric Association, Washington,
DC;1987.

61
9. Kessler RC, Andrews G, Mroczek D, Üstün TB, Wittchen H-U. The World
Health Organization Composite International Diagnostic Interview Short-Form
(CIDI-SF). Int J Methods Psychiatr Res. 1998;7:171-85.
10. Al Shamrany M, Lawrence HP, Meier RM, Jokstad A. Is depression associated
with edentulism in Canadian adults? Unpublished paper. (under editing)
11. SPSS 15.0 Base User’s Guide. SPSS.
12. Lagakos SW. Effects of mismodeling and mismeasuring explanatory variables on
tests of their association with a response variable. Stat Med 1988; 7:257-74.
13. Vandenbroucke JP. Should we abandon statistical modeling altogether? Am J
Epidemiol 1987; 126:10-13.
14. Efron B. How biased is the apparent error rate of a prediction rule? J Am Stat
Assoc 1986; 81:461-70.
15. Harrell F, Lee K, Mark D. Multivariable prognostic models: issues in developing
models, evaluating assumptions and adequacy, and measuring and reducing
errors. Stat in Med 1996; 15:361-87.
16. Jaimes F, Farbiarz J, Alvarez D, Marines C. Comparison between logistic
regression and neural networks to predict death in patients with suspected sepsis
in the emergency room. Cri Care 2005; 9(2):R150-55.
17. Styerberg EW, Eijkmans MJ, Harrell FE, Habbema JD. Prognostic modeling with
logistic regression analysis: in search of a sensible strategy in small data. Med
Decision making 2001; 21(1):45-56.
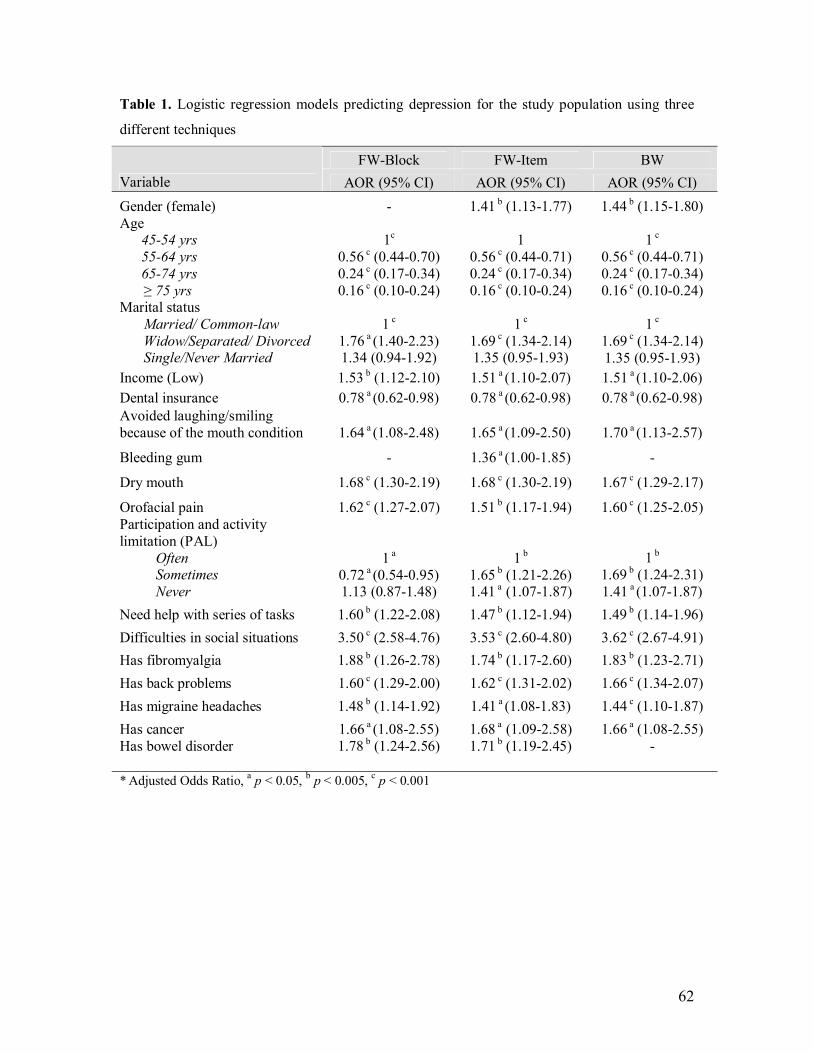
62
Table 1. Logistic regression models predicting depression for the study population using three
different techniques
FW-Block FW-Item BW Variable AOR (95% CI) AOR (95% CI) AOR (95% CI) Gender (female) - 1.41 b (1.13-1.77) 1.44 b (1.15-1.80) Age
45-54 yrs 55-64 yrs 65-74 yrs ≥ 75 yrs
1c
0.56 c (0.44-0.70) 0.24 c (0.17-0.34) 0.16 c (0.10-0.24)
1
0.56 c (0.44-0.71) 0.24 c (0.17-0.34) 0.16 c (0.10-0.24)
1 c
0.56 c (0.44-0.71) 0.24 c (0.17-0.34) 0.16 c (0.10-0.24)
Marital status Married/ Common-law Widow/Separated/ Divorced Single/Never Married
1 c
1.76 a (1.40-2.23) 1.34 (0.94-1.92)
1 c
1.69 c (1.34-2.14) 1.35 (0.95-1.93)
1 c 1.69 c (1.34-2.14) 1.35 (0.95-1.93)
Income (Low) 1.53 b (1.12-2.10) 1.51 a (1.10-2.07) 1.51 a (1.10-2.06) Dental insurance 0.78 a (0.62-0.98) 0.78 a (0.62-0.98) 0.78 a (0.62-0.98) Avoided laughing/smiling because of the mouth condition 1.64 a (1.08-2.48) 1.65 a (1.09-2.50) 1.70 a (1.13-2.57)
Bleeding gum - 1.36 a (1.00-1.85) -
Dry mouth 1.68 c (1.30-2.19) 1.68 c (1.30-2.19) 1.67 c (1.29-2.17)
Orofacial pain 1.62 c (1.27-2.07) 1.51 b (1.17-1.94) 1.60 c (1.25-2.05) Participation and activity limitation (PAL)
Often Sometimes Never
1 a
0.72 a (0.54-0.95) 1.13 (0.87-1.48)
1 b
1.65 b (1.21-2.26) 1.41 a (1.07-1.87)
1 b 1.69 b (1.24-2.31) 1.41 a (1.07-1.87)
Need help with series of tasks 1.60 b (1.22-2.08) 1.47 b (1.12-1.94) 1.49 b (1.14-1.96) Difficulties in social situations 3.50 c (2.58-4.76) 3.53 c (2.60-4.80) 3.62 c (2.67-4.91) Has fibromyalgia 1.88 b (1.26-2.78) 1.74 b (1.17-2.60) 1.83 b (1.23-2.71) Has back problems 1.60 c (1.29-2.00) 1.62 c (1.31-2.02) 1.66 c (1.34-2.07) Has migraine headaches 1.48 b (1.14-1.92) 1.41 a (1.08-1.83) 1.44 c (1.10-1.87) Has cancer 1.66 a (1.08-2.55) 1.68 a (1.09-2.58) 1.66 a (1.08-2.55) Has bowel disorder
1.78 b (1.24-2.56)
1.71 b (1.19-2.45)
-
* Adjusted Odds Ratio, a p < 0.05, b p < 0.005, c p < 0.001
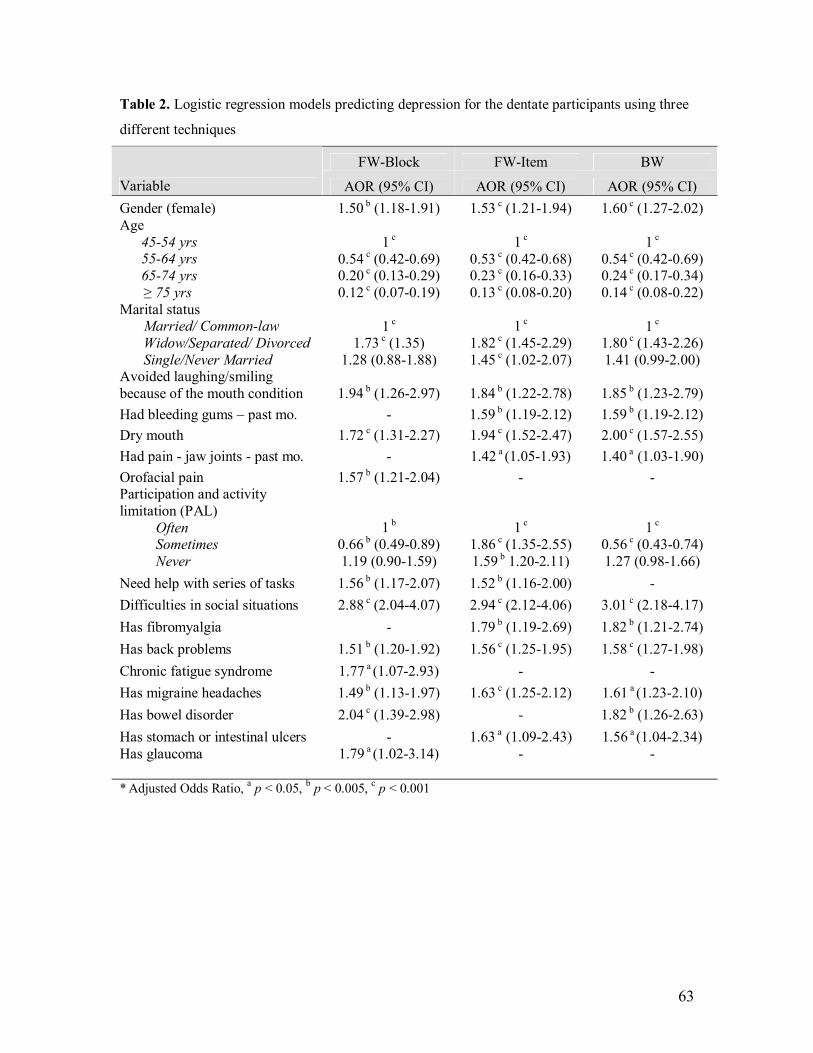
63
Table 2. Logistic regression models predicting depression for the dentate participants using three
different techniques
FW-Block FW-Item BW Variable AOR (95% CI) AOR (95% CI) AOR (95% CI) Gender (female) 1.50 b (1.18-1.91) 1.53 c (1.21-1.94) 1.60 c (1.27-2.02) Age
45-54 yrs 55-64 yrs 65-74 yrs ≥ 75 yrs
1 c 0.54 c (0.42-0.69) 0.20 c (0.13-0.29) 0.12 c (0.07-0.19)
1 c 0.53 c (0.42-0.68) 0.23 c (0.16-0.33) 0.13 c (0.08-0.20)
1 c 0.54 c (0.42-0.69) 0.24 c (0.17-0.34) 0.14 c (0.08-0.22)
Marital status Married/ Common-law Widow/Separated/ Divorced Single/Never Married
1 c 1.73 c (1.35)
1.28 (0.88-1.88)
1 c
1.82 c (1.45-2.29) 1.45 c (1.02-2.07)
1 c 1.80 c (1.43-2.26) 1.41 (0.99-2.00)
Avoided laughing/smiling because of the mouth condition 1.94 b (1.26-2.97) 1.84 b (1.22-2.78) 1.85 b (1.23-2.79) Had bleeding gums – past mo. - 1.59 b (1.19-2.12) 1.59 b (1.19-2.12) Dry mouth 1.72 c (1.31-2.27) 1.94 c (1.52-2.47) 2.00 c (1.57-2.55) Had pain - jaw joints - past mo. - 1.42 a (1.05-1.93) 1.40 a (1.03-1.90) Orofacial pain 1.57 b (1.21-2.04) - - Participation and activity limitation (PAL)
Often Sometimes Never
1 b 0.66 b (0.49-0.89) 1.19 (0.90-1.59)
1 c 1.86 c (1.35-2.55) 1.59 b 1.20-2.11)
1 c 0.56 c (0.43-0.74) 1.27 (0.98-1.66)
Need help with series of tasks 1.56 b (1.17-2.07) 1.52 b (1.16-2.00) - Difficulties in social situations 2.88 c (2.04-4.07) 2.94 c (2.12-4.06) 3.01 c (2.18-4.17) Has fibromyalgia - 1.79 b (1.19-2.69) 1.82 b (1.21-2.74) Has back problems 1.51 b (1.20-1.92) 1.56 c (1.25-1.95) 1.58 c (1.27-1.98) Chronic fatigue syndrome 1.77 a (1.07-2.93) - - Has migraine headaches 1.49 b (1.13-1.97) 1.63 c (1.25-2.12) 1.61 a (1.23-2.10) Has bowel disorder 2.04 c (1.39-2.98) - 1.82 b (1.26-2.63) Has stomach or intestinal ulcers - 1.63 a (1.09-2.43) 1.56 a (1.04-2.34) Has glaucoma
1.79 a (1.02-3.14)
-
-
* Adjusted Odds Ratio, a p < 0.05, b p < 0.005, c p < 0.001

64
Table 3. Logistic regression models predicting depression for the edentulous participants using
three different techniques
FW-Block FW-Item BW Variable AOR (95% CI) AOR (95% CI) AOR (95% CI) Age
45-54 yrs 55-64 yrs 65-74 yrs ≥ 75 yrs
1 c
0.53 (0.24-1.19) 0.17 c (0.07-0.45) 0.19 c (0.08-0.45)
1 c
0.55 (0.25-1.24) 0.19 c (0.07-0.47) 0.15 c (0.06-0.38)
1 b 0.63 (0.27-1.47) 0.24 b (0.09-0.66)
0.25 c Income (Low) - - 2.02 a (1.04-3.90) Dental insurance - - 0.51 a (0.26-1.00) Dry mouth - 2.80 b (1.50-5.22) - Orofacial pain 2.56 b (1.41-4.67) - 3.34 c (1.74-6.38) Difficulty with social situations 8.65 c 4.53 16.53) 8.56 c 4.50-16.28) 9.39 c (4.63-19.06) Has food allergies 3.06 b (1.38-6.80) 3.21 b (1.45-7.15) 3.27 b (1.41-7.58) Has back problems 2.27 b 1.25-4.14) 2.21 b (1.22-3.98) 2.41 b (1.28-4.51) Has cancer
2.91a (1.12-7.59)
2.63 b (1.01-6.85)
2.76 a (1.03-7.41)
* Adjusted Odds Ratio, a p < 0.05, b p < 0.005, c p < 0.001

65
Table 4. Comparison of the area under the curve (AUC) for each population
Test Result Variable(s) AUC* 95% CI
Models for the entire study population
Predicted probability of Model using FW-Block 0.812 0.791-0.832
Predicted probability of Model using FW-Item 0.817 0.797-0.837
Predicted probability of Model using BW 0.816 0.796-0.836
Models for the dentate participants
Predicted probability of Model using FW-Block 0.813 0.793- 0.833 Predicted probability of Model using FW-Item 0.812 0.792- 0.832 Predicted probability of Model using BW 0.809 0.788- 0.829
Models for the edentulous participants
Predicted probability of Model using F- Block 0.859 0.804-0.914 Predicted probability of Model using FW-Item 0.850 0.795-0.906 Predicted probability of Model using BW 0.863 0.806-0.921
* All AUCs in this table are statistically significant (p<0.001)

66
Figure 3: Theoretical framework for variable selection
5th Horizontal Selection
4th Horizontal Selection 3rd Horizontal Selection 2nd Horizontal Selection 1st Horizontal Selection Outcome
Physical Disability variables
Chronic conditions
Socio-economic variables
Dentate status (main predictor) & Demographic variables
Depression
Oral health variables

67
1.00.80.60.40.20.0
1 - Specificity
1.0
0.8
0.6
0.4
0.2
0.0
Sens
itivi
ty Reference Line
Predicted Probability of FW-Item
Predicted probability of FW-Block
Predicted probability of BW
Source of the Curve
ROC Curve
Diagonal segments are produced by ties.
Figure 4: ROC of the logistic regression models predicting depression for the whole study
population

68
1.00.80.60.40.20.0
1 - Specificity
1.0
0.8
0.6
0.4
0.2
0.0
Sens
itivi
ty Reference Line
Predicted probability of FW-Item
Predicted probability of FW-Block
Predicted probability of BW
Source of the Curve
ROC Curve
Diagonal segments are produced by ties.
Figure 5: ROC of the logistic regression models predicting depression for the dentate participants

69
1.00.80.60.40.20.0
1 - Specificity
1.0
0.8
0.6
0.4
0.2
0.0
Sens
itivi
ty Reference Line
Predicted probability of FW-Item
Predicted probability of FW-Block
Predicted probability of BW
Source of the Curve
ROC Curve
Diagonal segments are produced by ties.
Figure 6: ROC of the logistic regression models predicting depression for the edentulous
participants

70
Chapter 4:
GENERAL DISCUSSION

71
4.1 Methodology
Measurement issues
The prevalence of edentulism and depression in this national sample was 14.4% and
5%, respectively. It is important to be extremely cautious when citing these statistics as
estimates for edentulism and depression in Canadian adults 45 years or older. The
estimates reported are restricted to the sample we selected through specific selection
criteria and, therefore, not absolutely applicable to this age group in Canada. During
synthesis of the data from the Public Use Microdata File (PUMF), we selected only
participants 45 years of age or older, who responded to the DPS, OH2 and other modules
to ensure that we can measure the outcome and main predictor. This step was necessary
because the DPS was an optional module which means not all participants in the original
CCHS had responded to it. Nevertheless, the estimates are in agreement with the
previously reported national statistics. About 9% of Canadians aged 15 or older reported
to the Canadian Community Health Survey in 2003 that they had no natural teeth. This
was down from 16% in 1990 (11). Also, the annual prevalence of MDD was 4.8% as
reported in the CCHS 1.2 (71).
Tables 3, 4 and 5 summarize contents of the OH1, OH2 and DPS modules. It is
noteworthy to indicate that the PUMF does not include data on each item of the DPS
modules. Alternatively, Statistics Canada released data from the DPS modules in a form
of pre-calculated scores. In other words, we were limited to the depression probability
score (0-0.9) according to the CIDI-SFMD without being allowed to view the individual
item responses for the participants.

72
On the contrary, data from the IADL index were released as items and not as a score.
In this case, using an overall score in our analysis would have been more sound
methodologically because the sum score would naturally reduce the variables entering
multivariate analysis and solve the issue of multicolinearity (72).
Logistic regression modeling
Regression modeling is known to be very sensitive to the selection strategies used and
the order of variable entry (73-75). Because we were aware of this challenge prior to
conducting the analysis, we decided to use two strategies to address this issue.
First, we developed a hierarchical framework for variable selection where variables
were systematically grouped into categories for horizontal entry. This strategy ensures a
more systematic approach based on the theoretical relationship between the outcome and
different predictors. Similar approach was described by Nicolau et al. (2003) (76).
Second, we explored different modeling methods and selected the model with the
highest predictability based on the area under the ROC curve. Nine models were
developed; 3 for the entire study population, 3 for the dentate participants and 3 for the
edentulous population. The ROC was constructed to compare among three models
separately for each population. The ROC has typical application in medical research
where it serves as a tool to assess accuracy of diagnostic tests (77). Regression models
can be powerful tools in predicting outcomes when they have good accuracy, a parallel
function to that of a predictive screening test. The area under the ROC curve was also
employed by researchers to test how regression models perform (78-80).

73
We observed high similarity in the variables content, strength of association and the
AUC among the three models. Also, the AUC for all models ranged from a low of 0.809
to as high as 0.863 indicating excellent predictability of those models. These two
observations could be explained by the large sample size available. Moreover, we can
conclude from the results of this study that none of the selection procedures was superior
to the others and each selection method is suitable for variable selection. Instead,
researchers should pay more attention to checking the fit and the performance of the
candidate regression models to select the best model. Careful testing of the model fit is a
crucial step to ensure satisfaction of the regression model assumptions; however, this
subject is beyond the scope of the present paper.
In the next sections, we only discussed the study results of the final models with the
highest predictability (see Table 4 in manuscript #1).

74
4.2 Study results
Depression and dentate status
The main purpose of this study was to determine the association between dentate
status and being depressed. The dentate status was measured by asking participants “do
you have one or more natural teeth?” Response options for this question were ‘yes’ or
‘no’. This question is considered a valid, objective and true measure for the “complete
edentulism” criterion because, conventionally, people would know if they still have any
of their natural teeth. However, we were limited in terms of ensuring better measurement
of the “dentate status” since we used secondary data. Consequently, the major limitation
of this study was the lack of discrimination among participants according to the number
of teeth they have. Such a distinction is very important since a participant who had only
one tooth left is expected to be different than the one with 20 teeth in terms of the extent
of disability. Unfortunately, the survey classifies both participants as dentate regardless
of the severity of disability. Few original studies have examined the relationship between
teeth number and depression, for example, Anttila (2003) found that depressive
symptoms were not associated with the mean number of teeth among middle-aged men or
women (81). In that particular study, the number of teeth was measured as a discrete
variable; however, in another paper Anttila et al. (2001) used the same data set and
presented participants as edentulous and dentates and reached similar conclusions (68). In
both papers, Anttila found no association between tooth loss and depression except for
non-smoker men. Hayashi et al. (2001) used a different definition of tooth loss where
participants were grouped into two categories using a cutoff point of having lost 4 or

75
more teeth that may affect chewing function (67). The results showed no association
between depression and tooth loss, but the study was limited to male adults.
In our study, findings confirmed previous evidence about the lack of association
between edentulism and depression. On the other hand, Drake’s et al. (1995) study
indicated that depression was significantly related to having less depressive symptoms in
Blacks (9), which is in disagreement with the hypothesis that tooth loss could increase
risk of depression. In our study, results from the bivariate analysis indicated that people
who are completely edentulous are less likely to be depressed but this borderline
association became non-significant once the joint effect of potential confounders was
controlled for in the multivariate analysis. This particular finding indicates that
edentulism was not significant correlate of depression and that other factors were more
important correlates of depression in this age group.
Depression and oral health
The model predicting depression for the entire study population included having
dental insurance, avoiding laughing/smiling because of the mouth condition, and
experiencing bleeding gums, dry mouth, and orofacial pain. This is an indication that
individuals experiencing oral symptoms such as bleeding gum, dry mouth, and pain may
be more likely to have depression. Also, dentists should keep in mind the likelihood of
depression when patients report avoiding laughing and smiling due to their oral
conditions because they might be twice as likely to be depressed. Regarding dental
insurance, the model shows that those who have dental insurance are, marginally, more
likely to be depressed.

76
Since our study population included dentate and edentulous individuals, this model
may have poor fit when applied to the edentulous individuals only. This assumption was
confirmed by the obvious difference between the models constructed for each population
separately. Dentate participants had more oral conditions that predict depression
compared to edentulous participants, but, the latter group had higher impact of the
orofacial pain on the probability of suffering depression. Similarly, edentulous
participants who had dental coverage were almost twice as likely to have depression
when compared to those who did not. Initially, we resorted to the apparent difference in
age between dentate and edentulous populations in our study, as shown in Table 2 in
manuscript #1, to explain the difference between the models for each group. The
bivariate analysis indicated that as age increased, edentulism prevalence increased but
depression prevalence decreased steadily. Yet, the interaction term between age,
edentulism and depression was not significant. This led us to become more inclined to
believe that retaining teeth is the only explanation for more dental-related predictors in
the dentate regression model. Specifically, depression was associated with symptoms
related to “teeth” in the dentate population.
Previous studies found that there is a relationship between depression and a range of
oral conditions. Dry mouth, temporomandibular joint pain and dysfunction syndrome,
burning mouth syndrome, and recurrent aphthous stomatitis have been linked to
depression (60-62).

77
Other correlates of depression
Our findings were consistent with previous evidence supporting the positive
relationship between depression and being female, younger, having less income, and
suffering chronic conditions and physical disabilities. The evidence was summarized and
presented in Table 2 at the tables section.
Although smoking was not related to depression or edentulism at the bivariate level,
we included it in the multivariate modeling because there is evidence supporting the
relationship among smoking, tooth loss and depression (68). Also, experts advise against
using the bivariate associations as a method of screening risk factors for use in
multivariate analysis because important predictors may be excluded if their effect is
masked by another (75). Nevertheless, smoking was not retained in any of the models
indicating that it was not an important correlate of depression in our sample. This finding
was in contrast to that reported by Ohayon et al. (1999) who showed a dose-response
relationship where the risk of depression increased with an increase in the number of
cigarettes consumed (82).
Finally, it is important to elaborate on the discrepancy in depression measurement
among epidemiological surveys, which is considered a huge limitation of cross-studies
comparability. In our study, depression was measured using what is considered a scale -
score; however, measurement of depression varied across the other studies we cited, from
number of symptoms to continuous/scale-score system. The scale used in the original
CCHS survey, and subsequently in our study, was the CIDI-SFMD; however, other
studies used the ZSDS, HAD, and BDI (59-61). Moreover, we decided to choose an

78
extreme cutoff point (90% probability of depression) based on the previous work of
Patten et al. (83) to ensure the accuracy of identifying cases of depression.
It would have been interesting to explore the relationship between the two stem
depression symptoms, feeling depressed or loosing interest in things. Unfortunately,
Statistics Canada restricts access to individual items of the CIDI-SFMD to prevent the
release of estimates which may contain distortion of data.

79
Chapter 5:
SUMMARY AND CONCLUSION

80
Depression is a public health problem because it is a major cause of disability
globally, ranks fourth in the ten leading causes of global burden of disease and is the
leading cause for suicide (36). Individuals who suffer depression are at high risk of
severe relapse in the next 10 years if they do not receive proper medical attention (35).
Fortunately, several therapies are available with high success rate. Depression should be
one of the conditions included in the medical history taking prior to dental treatment. One
study has shown that self-reported depression was second only to hypertension in
frequency of all diseases and disorders recorded in the medical history (84). Dental
professionals need to be aware of what oral health factors are associated with depression
in order to identify those at high risk. Findings from this study indicate that having dental
symptoms such as dry mouth, pain and cosmetic concerns that interfere with social
activities are linked with depression, but being completely edentulous, without these
symptoms, was not found to be a risk factor for depression. Dental factors along with
other factors known to increase the probability of depression should be kept in mind and
used as screening tools to identify potentially depressed patients visiting the dental office.
Having said so, it is important to be always cautious when extrapolating clinical data, in
this instance clinical correlates of depression, from community surveys due to the
methodological limitations inherited to such surveys.
Nevertheless, dental professionals are encouraged to refer potential patients for
psychiatric and mental health care and utilize already available community and local
resources targeted to prevent and treat depression. An inter-disciplinary approach is an
important determinant of successful, long term dental intervention outcomes. This
approach has a significant implication in dentistry given that depressed patients require

81
special management because of the negative behavioral and biological impacts of
depression (85). Depressed patients may be uncooperative and irritable during dental
treatment, appear unappreciative and have numerous complaints that are inconsistent
with objective findings. Also, precautions should be taken to avoid adverse interaction
between antidepressants and some medications used in dentistry. Depressed patients may
be more likely to view efficacious interventions as less beneficial for them because
depression is known to influence major outcomes such as satisfaction with TMD
treatment success (86), periodontal treatment outcome (87), or dental fear treatment (88).
Recently, John et al reported that depression has negative effects on the satisfaction of
older patients with their dentures (89).
Therefore, we highly recommend that dental educators should include depression in
the dental curriculum; especially how to identify undiagnosed depressed individuals in
the dental office. Also, some patients who receive psychiatric treatment for depression
may be reluctant to admit it because of the perceived stigma associated with mental
illness (85). Hence, it is important to teach dental students interaction tactics to overcome
those barriers such as how to exhibit a supportive, nonjudgmental attitude and advise
patients that such information will be held confidential and is indispensable to the
provision of safe dental care (85).
As a final note, we found that the lack of association between depression and
edentulism is a counter-intuitive. However, this finding was consistent with what has
been previously reported. We suspect that depression could be more related to the
incidence of edentulism rather than the prevalence. In another word, we hypothesized that
depression could manifest with rapid onset of edentulism where the individual does not

82
have enough time to adapt to the condition. The previous studies that investigated the
relationship between depression and edentulism did not control for the onset of
edentulism. Unfortunately, the CCHS surveys do not contain items that allow us to
assess this hypothesis as well.
The CCHS surveys do not contain clinical data however some of the oral health items
can be improved. Thus, we believe that Statistics Canada could benefit from this study by
introducing modifications to the oral health modules in order to enhance research in this
area. Specifically, transforming the item OH2_22 (Do you have one or more of your own
teeth? Yes/no) to account for the number of remaining natural teeth in such away that it
can be grouped into 3 or 4 categories and also indicating whether or not there is at least
one opposing pair of teeth for those retaining their natural teeth. It will be also valuable to
record whether dentures are conventional or implant-supported. We expect that such
modifications can be introduced without compromising the validity of these questions.

83
REFERENCES
1. US Department of Health and Human Services. Oral health in America: a report
of the Surgeon General. Rockville (MD): US Department of Health and Human
Services, national Institute of Dental and Craniofacial Research, National Institute
of Health, 2000.
2. Kelly M, Steele J, Nuttall N, Bradnock G, Morris J, Nunn J, et al. Adult Dental
Health Survey: Oral Health in the United Kingdom 1998. London: The Stationery
Office. 2000.
3. World Health Organization. WHO oral health country/ area profile programme.
Malmo University, Sweden: WHO Division of Non-communicable Disease/Oral
Health, WHO Collaborating Center; 2003.
4. Douglass CW, Shih A, Ostry L. Will there be a need for complete dentures in the
United States in 2020? J Prosthet Dent 2002;87(1):5–8.
5. Jones JA, Orner MB, Spiro III A, Kressin NR. Tooth loss and dentures: patients’
perspectives. Int Dent J 2003; 53: 327-34.
6. Chalmers JM, Ettinger RL, Thomson WM, Spencer AJ. Aging and dental health.
Australian Institute of Health and Welfare. Dental Statistics and Research Series
1999; Number 19.
7. Beltrán-Aguilar ED, Baker LK, Canto MT, Dye BA, Gooch BF, Griffin SO and
others. Surveillance for Dental Caries, Dental Sealants, Tooth Retention,
Edentulism, and Enamel Fluorosis -United States, 1988-1994 and 1999-2002.
MMWR August 26, 2005; 54(03):1-44.

84
8. Slade GD, Gansky SA, Spencer AJ. Two-year incidence of tooth loss among
South Australians aged 60+ years. Community Dent Oral Epidemiol. 1997
Dec;25(6):429-37.
9. Drake CW, Hunt RJ, Koch GG. Three-year tooth loss among black and white
older adults in North Carolina. J Dent Res. 1995; 74(2):675-80.
10. Hunt RJ, Drake CW, Beck JD. Eighteen-month incidence of tooth loss among
older adults in North Carolina. Am J Public Health. 1995 Apr;85(4):561-63.
11. Statistic Canada, Health Reports. Edentulism in Canada. The Daily, November
16, 2005. November issue of Health Reports, Vol. 17, No. 1.
12. Atchison KA, Dolan TA. Development of the Geriatric Oral Health Assessment
Index. J Dent Educ. 1990 Nov;54(11):680-87.
13. Joshipura K, Ritchie C, Douglass C. Strength of evidence linking oral conditions
and systemic disease. Compend Contin Educ Dent Suppl. 2000;(30):12-23.
14. Slade GD, Spencer AJ. Development and evaluation of the Oral Health Impact
Profile. Community Dent Health. 1994 Mar;11(1):3-11.
15. Hutton B, Feine J, Morais J. Is there an association between edentulism and
nutritional state? J Can Assoc 2002; 68(3): 182-87.
16. Wayler AH, Chauncey HH. Impact of complete dentures and impaired natural
dentition on masticatory performance and food choice in healthy aging men. J
Prosthet Dent 1983; 49(3): 427-33.
17. Hartsook EI. Food selection, dietary adequacy, and related dental problems of
patients with dental prostheses. J Prosthet Dent 1974; 32(1): 32-40.

85
18. Joshipura KH, Willett WC, Douglass CW. The impact of edentulousness on food
and nutrient intake. J Am Dent Assoc 1996; 127(4): 459-67.
19. Österberg T, Steen B. relationship between dental state and dietary intake in 70-
years-old males and females in Göteborg, Sweden: a population study. J Oral
Rehabil 1982; 9(6): 509-21.
20. Sheiham A, Steele JG, Marcenes W, Lowe C, Finch S, Bates CJ, and others. The
relationship among dental status, nutrient intake, and nutritional status of older
people. J Dent Res 2001; 80(2): 403-13.
21. Smith JM, Sheiham A. How dental conditions handicap the elderly. Community
Dent Oral Epidemiol 1979; 7(6): 305-10.
22. Fiske J, Davis DM, Frances C, Gelbier S. The emotional effects of tooth loss on
edentulous people. Br Dent J 1998; 184(2):90-3.
23. Bergendal B. The relative importance of tooth loss and denture wearing in
Swedish adults. Community Dent Health 1989; 6: 103-11.
24. Al Shamrany M. Oral health-related quality of life: a broader perspective. East
Mediterr Health J 2006; 12(6):894-901.
25. Steele JG, Sanders AE, Slade GD, Allen PF, Lahti S, Nuttal N, Spencer AJ. How
do age and tooth loss affect oral health impacts and quality of life? A study
comparing two national samples. Community Dent Oral Epidemiol 2004; 32:
107-14.
26. Tsakos G, Steele JG, Marcenes W, Walls AWG, Sheiham A. Clinical correlates
of oral health-related quality of life: evidence from a national sample of British
older people. Eur J Oral Sci 206; 114: 391-95.

86
27. Astrøm AN, Haugejorden O, Skaret E, Trovik TA, Klock KS. Oral Impacts on
Daily Performance in Norwegian adults: the influence of age, number of missing
teeth, and socio-demographic factors. Eur J Oral Sci 2006; 114: 115–21.
28. Locker D. Measuring oral health: a conceptual framework. Community Dent
Health. 1988;5(1):3-18.
29. Kressin NR, Spiro A 3rd, Atchison KA, Kazis L, Jones JA. Is depressive
symptomatology associated with worse oral functioning and well-being among
older adults? J Public Health Dent 2002; 62(1):5-12.
30. The World Health Report 2001 - Mental Health: New Understanding, New Hope.
Geneva World Health Organization, 2001.
31. American Psychiatric Association. Diagnostic and statistical manual of mental
disorders, 3rd edn. American Psychiatric Association, Washington, DC;1980.
32. American Psychiatric Association. Diagnostic and statistical manual of mental
disorders, 3rd edn. revised. American Psychiatric Association, Washington,
DC;1987.
33. American Psychiatric Association. Diagnostic and statistical manual of mental
disorders, 4th edn. American Psychiatric Association, Washington, DC;1994.
34. American Psychiatric Association. Diagnostic and statistical manual of mental
disorders, 4th edn., text revision. American Psychiatric Association, Washington,
DC; 2000.
35. Parikh SV, Lam RW. Clinical Guidelines for the Treatment of Depressive
Disorders. I. Definitions, Prevalence, and Health Burden. Available from:
http://www.cpa-

87
apc.org/Publications/Clinical_Guidelines/depression/clinicalGuidelinesDepressio
n.asp/
36. Murray CJL, Salomon JA, Mathers CD, Lopez AD. Summary measures of
population health: concepts, ethics, measurement and applications. (eds.) (2002).
WHO, Geneva.
37. Weissman MM, Bland RC, Canino GJ, et al. Cross-national epidemiology of
major depression and bipolar disorder. JAMA 1996;276(4):293–99.
38. Patten SB, Wang JL, Beck CA, Maxwell CJ. Measurement issues related to the
evaluation and monitoring of major depression prevalence in Canada. Chronic Dis
Can. 2005 Fall;26(4):100-6.
39. Kessler RC, Ustun TB. The World Mental Health (WMH) Survey Initiative
Version of the World Health Organization (WHO) Composite International
Diagnostic Interview (CIDI). Int J Methods Psychiatr Res. 2004;13(2):93-121.
40. Regier DA, Boyd JH, Burke JD Jr, Rae DS, Myers JK, Kramer M, One month
prevalence of mental disorders in the United States. Based on 5 epidemiologic
catchments area sites. Arch Gen Psychiatry 1988;45:977–86.
41. Bland RC, Newman SC, Orn H. Prevalence of psychiatric disorders in the elderly
in Edmonton. Acta Psychiatr Scand Suppl 1988;338:57–63.
42. National population health survey–public use micro data files–house hold
component. Ottawa: Statistics Canada; 1998. Cat. No. 82M0009XCB.
43. Katona C, Livingston G. Impact of screening old people with physical illness for
depression? Lancet. 2000 Jul 8;356(9224):91-2.

88
44. Aromaa A, Raitasalo R, Reunanen A, Impivaara O, Heliovaara M, Knekt P, et al.
Depression and cardiovascular diseases. Acta Psychiatr Scand Suppl.
1994;377:77-82.
45. Pratt LA, Ford DE, Crum RM, Armenian HK, Gallo JJ & Eaton WW. Depression,
psychotropic medication, and risk of myocardial infarction. Circulation 1996;94:
3123–29.
46. Anderson RJ, Freedland KE, Clouse RE & Lustman PJ. The prevalence of
comorbid depression in adults with diabetes: a meta-analysis. Diabetes Care
2001;24: 1069–78.
47. Hamilton M. A rating scale for depression. J Neurol Neurosurg Psychiatry. 1960
Feb;23:56-62.
48. Hamilton M. Development of a rating scale for primary depressive illness. Br J
Soc Clin Psychol. 1967 Dec;6(4):278-96.
49. Beck AT, Ward CH, Mendelson M, Mock J, Erbaugh J. An inventory for
measuring depression. Arch Gen Psychiatry. 1961 Jun;4:561-71.
50. Zung WW. A Self-rating depression scale. Arch Gen Psychiatry. 1965 Jan;12:63-
70.
51. Radloff LS. The CES-D scale: a self-report depression scale for research in the
general population. Appl Psychol Measurement 1977;1: 385–401.
52. Wing JK, Cooper JE & Sartorius N. The measurement and classification of
Psychiatric Symptoms: An instructional manual for the PSE and CATEGO
Program. Cambridge University Press, New York;1974.

89
53. Robins LN, Helzer JE, Croughan J & Ratcliff KS. National Institute of Mental
Health Diagnostic Interview Schedule. Its history, characteristics, and validity.
Arch Gen Psychiatry 1981;38: 381–89.
54. World Health Organization. Composite International Diagnostic Interview
(CIDI). WHO, Division of Mental Health 1990, Geneva.
55. World Health Organization. SCAN: Schedules for Clinical Assessment in
Neuropsychiatry. WHO 1994, Geneva.
56. Kessler RC, Andrews G, Mroczek D, Üstün TB, Wittchen H-U. The World
Health Organization Composite International Diagnostic Interview Short-Form
(CIDI-SF). Int J Methods Psychiatr Res. 1998;7:171-85.
57. Patten SB. Performance of the Composite International Diagnostic Interview
Short Form for major depression in community and clinical samples. Chronic Dis
Can. 1997;18(3):109-12.
58. Striner DL, Normal GR. Validity. In: Striner DL, Normal GR. Health
measurement scales. A practical guide to their development and use (2nd ed). New
York, NY, Oxford University Press, Oxford. 1995.
59. Sheiham A, Cushing AM, Maizels J. the social impacts of dental disease. In:
Slade GD. Measuring oral heath and quality of life. University of North Carolina,
Dental Ecology, Chapel Hill. 1997.
60. Anttila SS, Knuuttila ML, Sakki TK. Depressive symptoms as an underlying
factor of the sensation of dry mouth. Psychosom Med. 1998 Mar-Apr;60(2):215-
18.

90
61. Soto Araya M, Rojas Alcayaga G, Esguep A. Association between psychological
disorders and the presence of Oral lichen planus, Burning mouth syndrome and
Recurrent aphthous stomatitis. Med Oral. 2004; Jan-Feb;9(1):1-7.
62. Gatchel RJ, Stowell AW, Buschang P. The relationships among depression, pain,
and masticatory functioning in temporomandibular disorder patients. J Orofac
Pain. 2006 Fall;20(4):288-96.
63. Monteiro da Silva AM, Oakley DA, Newman HN, Nohl FS, Lloyd HM.
Psychological factors and adults onset rapidly progressive periodontitis. J Clin
Periodontol 1996; 23: 789-94.
64. Saletu A, Pirker-Fru¨hauf H, Saletu F, Linzmayer L, Anderer P, Matejka M.
Controlled clinical and psychometric studies on the relation between periodontitis
and depressive mood. J Clin Periodontol 2005; 32: 1219–25.
65. Solis ACO, Lotufo RFM, Pannuti CM, Brunheiro EC, Marques AH, Lotufo-Neto
F: Association of periodontal disease to anxiety and depression symptoms, and
psychosocial stress factors. J Clin Periodontol 2004; 31: 633–38.
66. Persson GR, Persson RE, MacEntee CI, Wyatt CCJI, Hollender LG, Kiyak HA:
Periodontitis and perceived risk for periodontitis in elders with evidence of
depression. J Clin Periodontol 2003; 30: 691–96.
67. Hayashi N, Tamagawa H, Tanaka M, Hanioka T, Maruyama S, Takeshita T and
others. Association of tooth loss with psychological factors in male Japanese
employee. J Occup Health 2001; 43:351-55.

91
68. Anttila SS, Knuuttila MLE & Sakki TK. Relationship of depressive symptoms to
edentulousness, dental health, and dental health behavior. Acta Odontol Scand
2001; 59:406–12.
69. Heydecke G, Locker D, Awad MA, Lund JP, Feine JS. Oral and general health-
related quality of life with conventional and implant dentures. Community Dent
Oral Epidemiol. 2003 Jun;31(3):161-8.
70. Canadian Community Health Survey 2003. User Guide for the Public Use
Microdata File. Statistics Canada, Catalogue no. 82M0021GPE.
71. Patten SB, Wang JL, Williams J VA, Currie S, Beck CA, Maxwell CJ, el-Guebaly
N. Descriptive Epidemiology of Major Depression in Canada. Can J Psychiatry
2006; 51(2): 84-90.
72. Dohoo IR, Ducrot C, Fourichon C, Donald A, Hurnik D. An overview of
techniques for dealing with large numbers of independent variables in
epidemiologic studies. Preventive Veterinary Medicine 1997; 29(3):221-239.
73. Lagakos SW. Effects of mismodeling and mismeasuring explanatory variables on
tests of their association with a response variable. Stat Med 1988; 7:257-74.
74. Vandenbroucke JP. Should we abandon statistical modeling altogether? Am J
Epidemiol 1987; 126:10-13.
75. Sun GW, Shook TL, Kay GL. Inappropriate use of bivariable analysis to screen
risk factors for use in multivariable analysis. J Clin Epidemiol 1996; 49:907-16.
76. Nicolau B,Marcenes W; Bartley M; Sheiham, A. A Life Course Approach to
Assessing Causes of Dental Caries Experience: The Relationship between

92
Biological, Behavioural, Socio-Economic and Psychological Conditions and
Caries in Adolescents. Caries Res 2003;37:319-326.
77. Pape MS. Receiver operating characteristic methodology. J Am Stat Assoc 2000;
95: 308-11.
78. Hedgewald J, Pfahlberg A, Uter W. A backwards-manual selection macro for
binary logistic regression in the SAS v.8.02 PROC LOGESTIC procedure.
Available from the URL:
< http://www.imbe.med.uni-erlangen.de/issan/SAS/bms/bms_manuel.pdf >
79. SPSS 15.0 Base User’s Guide. SPSS.
80. Jaimes F, Farbiarz J, Alvarez D, Marines C. Comparison between logistic
regression and neural networks to predict death in patients with suspected sepsis
in the emergency room. Cri Care 2005; 9(2):R150-55.
81. Anttila SS. Depressive symptoms in relation to oral health and related factors in a
middle-aged population. Analytical approach. 2003 (thesis) Available from:
http://herkules.oulu.fi/isbn9514270215/
82. Ohayon MM, Priest RG, Guilleminault C, Caulet M. The prevalence of
depressive disorders in the United Kingdom. Biol Psychiatry 1999; 45:300-07.
83. Patten SB, Beck CA, Kassam A, Williams JV, Barbui C, Metz LM. Long-term
medical conditions and major depression: strength of association for specific
conditions in the general population. Can J Psychiatry. 2005 Mar; 50(4):195-202.
84. Woods CD. Self-Reported Mental Illness in a Dental School Clinic Population.
Journal of Dental Education 2003; 67(5): 500-504.
93
85. Friedlander AH, Mahler ME. Major depressive disorder. Psychopathology,
medical management and dental implications. JADA 2001; 132: 629-38.
86. Riley JL 3rd, Myers CD, Robinson ME, Bulcourf B, Gremillion HA. Factors
predicting orofacial pain patients satisfaction with improvement. J Orofac Pain
2001; 15:29-35.
87. Elter JR, White BA, Gaynes BN, Bader JD. Relationship of clinical depression to
periodontal treatment outcome. J Periodontal 2002; 73:441:9.
88. Abrahamsson KH, Berggen U, Hakeberg M, Carlsson SG. The importance of
dental beliefs for the outcome of dental-fear treatment. Euro J Oral Sci 2003;
111:99-105.
89. John M, Micheelis W, Steele J G. Depression as a Risk Factor for Denture
Dissatisfaction. Journal of Dental Research; Sep 2007; 86(9): 852-7.

94
TABLES

95
Table 1. Cross-national lifetime prevalence of Major Depression Disorder*
Lifetime Ratio/ 100
Country Overall Females Males F/M Ratio
Mean Age at
Onset United States (ECA, 1980) 5.2 7.4 2.8 2.6 25.6
United States (NCS, 1990) 17.1 21.3 12.7 1.7 23.8
Canada 9.6 12.3 6.8 1.9 24.8 Puerto Rico 4.3 5.5 3.1 1.8 29.5 France 16.4 21.9 10.5 2.1 29.2 Germany 9.2 13.5 4.4 3.1 29.7 Italy 12.4 18.1 6.1 3.0 34.8 Lebanon 19.0 23.1 14.7 1.6 25.2 Taiwan (Taipei) 1.5 1.8 1.1 1.6 29.3 Korea (Seoul) 2.9 3.8 1.9 2.0 29.3 New Zealand 11.6 15.5 7.5 2.1 27.3
ECA: Epidemiologic Catchment Area Study, NCA: National Comorbidity Survey.
All studies used the Diagnostic Interview Schedule (DIS) with the exception of the NCS, which used the
Composite International Diagnostic Interview (CIDI)
* Source: Parikh SV, Lam RW. Clinical Guidelines for the Treatment of Depressive Disorders. I.
Definitions, Prevalence, and Health Burden.

96
Tab
le 2
. Dep
ress
ive
sym
ptom
s and
thei
r epi
dem
iolo
gic
corr
elat
es
Aut
hor(
s)
Stud
y de
sign
O
bjec
tive
Po
pula
tion
Mea
sure
men
t Fi
ndin
gs
Rem
arks
Cana
da
Patte
n SB
,
1999
1
Cro
ss-s
ectio
nal
• To
eval
uate
asso
ciat
ion
betw
een
long
-term
med
ical
cond
ition
s and
MD
• Exa
min
e th
e
impa
ct o
f the
se
cond
ition
s on:
1.
Hea
lth
care
serv
ice
use
2.
Dis
abili
ty
• Su
bjec
ts o
ver 1
2yrs
who
par
ticip
ated
in
the
first
wav
e of
NPH
S w
ho h
ad M
D.
• D
epre
ssio
n pr
eval
ence
: CID
I-
SFM
D, u
sing
pred
ictiv
e
instr
umen
t (+
at 9
0% c
ut-o
ff)
• Lo
ng-te
m m
edic
al c
ondi
tion:
self-
repo
rted,
not
inde
pend
ently
con
firm
ed b
y
the
inte
rvie
wer
s, ho
wev
er, i
t
was
spec
ified
that
DX
shou
ld
have
bee
n m
ade
by a
hea
lth
prof
essi
onal
.
• Ove
rall
prev
alen
ce o
f MD
=
6.7%
• Mos
t chr
onic
con
ditio
ns
eval
uate
d in
the
NPH
S
wer
e as
soci
ated
with
stat
istic
al si
gnifi
canc
e
incr
ease
in M
D p
reva
lenc
e.
• Mig
rain
e he
adac
hes a
nd
stom
ach
or in
test
inal
ulc
ers
had
the
stron
gest
asso
ciat
ion
with
MD
.
• Th
ose
who
hav
e M
D w
ith
co-m
orbi
d co
nditi
ons d
id
NO
T ha
ve e
xces
sive
hea
lth
serv
ices
util
izat
ion
BUT
had
mor
e di
sabi
lity
days
than
the
othe
r gro
up.
• Evi
denc
e le
vel I
I-3
• Sec
onda
ry a
naly
sis
• Sta
tistic
s: pr
eval
ence
Rat
io
and
Prev
alen
ce d
iffer
ence
.
• Pr
oble
m w
ith a
naly
sis d
ue
to sm
all s
ize
cells
.
• Con
trolle
d fo
r con
foun
ding
effe
ct o
f age
and
gen
der.
Patte
n SB
,
2000
2
Cro
ss-s
ectio
nal
surv
ey
To e
valu
ate
asso
ciat
ion
betw
een
depr
essi
ve
epis
odes
and
a se
t
• Su
bjec
ts ≥
18
yrs
who
wer
e re
side
nts
of te
leph
one-
cont
aini
ng
• D
epre
ssio
n pr
eval
ence
: CID
I-
SFM
D (2
bran
ches
: 2w
ks o
f
depr
esse
d m
ood
vs. 2
wks
of
loss
of i
nter
est)
• D
epre
ssio
n pr
eval
ence
:
15.6
%.
• Bi
olog
ical
cor
rela
tes:
stre
et
drug
s, be
ing
fem
ale,
fam
ily
• Evi
denc
e le
vel I
I-3
• Sta
tistic
s: pr
eval
ence
Rat
io.
Con
foun
ding
by
age
and
sex
cont
rolle
d fo
r in

97
of b
io-p
sych
o-
soci
al d
eter
min
ants
in C
alga
ry,
Can
ada.
hous
ehol
d in
Cal
gary
.
• Po
tent
ial d
eter
min
ants
: sel
f-
repo
rted.
Hx
then
alc
ohol
.
• So
cial
cor
rela
tes:
low
inco
me,
less
edu
catio
n,
mar
ital s
tatu
s, la
ck o
f
soci
al su
ppor
t, th
en
disa
bilit
y or
unem
ploy
men
t.
• Psy
chol
ogic
al c
orre
late
s: #
of R
LE \
goin
g on
wel
fare
,
incr
ease
d ar
gum
ent w
ith
partn
er, u
nwan
ted
preg
nanc
y th
en m
ajor
finan
cial
cris
is ha
d th
e
stro
nges
t ass
ocia
tion.
logi
stic
regr
essi
on m
odel
.
• Val
idity
of t
he C
IDI-
SFM
D:
posi
tive
pred
ictiv
e va
lue
is
betw
een
75-9
0%. N
egat
ive
pred
ictiv
e va
lue
is n
early
100
%.
Patte
n SB
,
2001
3
Coh
ort
With
a
com
paris
on
grou
p.
To d
eter
min
e
whe
ther
subj
ects
with
one
or m
ore
long
-term
med
ical
cond
ition
had
an
elev
ated
inci
denc
e
of m
ajor
depr
essi
on.
• Sub
ject
s ove
r 12y
rs
who
par
ticip
ated
in
the
first
and
seco
nd
wav
es o
f NPH
S.
• “N
on-e
xpos
ed
grou
p”: n
o m
ajor
depr
essi
on +
no
long
-term
med
ical
cond
ition
s
• “Ex
pose
d gr
oup”
: no
• Dep
ress
ion
Inci
denc
e: C
IDI-
SFM
D, u
sing
pred
ictiv
e
instr
umen
t (+
at 9
0% c
ut-o
ff)
• Lon
g-te
m m
edic
al c
ondi
tion:
self-
repo
rted,
not
inde
pend
ently
con
firm
ed b
y
the
inte
rvie
wer
s, ho
wev
er, i
t
was
spec
ified
that
DX
shou
ld
have
bee
n m
ade
by a
hea
lth
prof
essi
onal
.
• Ove
rall
inci
denc
e of
MD
=
3.5%
• H
avin
g a
on-te
rm m
edic
al
cond
ition
~ d
oubl
e th
e ris
k
of M
D
• Mig
rain
e he
adac
hes,
sinu
sitis
and
bac
k pa
in h
ad
the
stron
gest
ass
ocia
tion
with
MD
.
• Evi
denc
e le
vel I
I-2
• Sec
onda
ry a
naly
sis
• Sta
tistic
s: C
umul
ativ
e
Inci
denc
e Ra
tio.
• Pro
blem
with
ana
lysi
s due
to sm
all s
ize
cells
.
• Ins
ensi
tive
mea
sure
of
depr
essi
on (1
2 vs
. 24
mon
ths)
fa
lse
nega
tives
• Sel
f-rep
orte
d da
ta
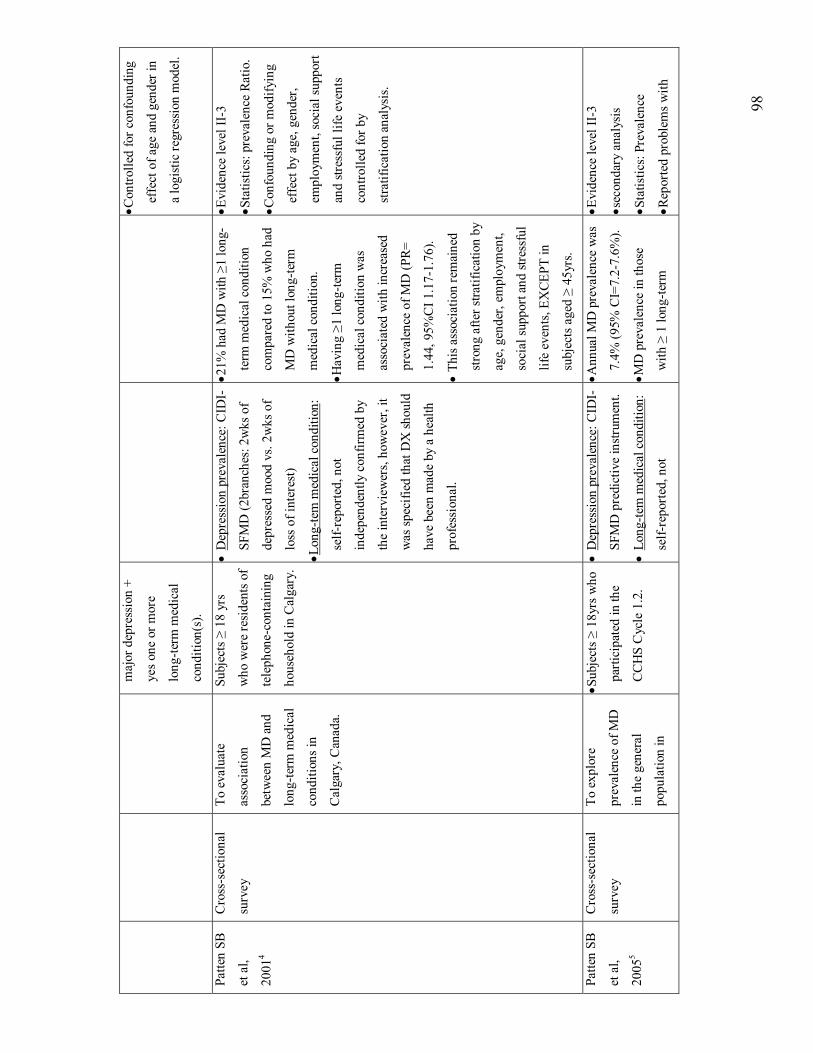
98
maj
or d
epre
ssio
n +
yes o
ne o
r mor
e
long
-term
med
ical
cond
ition
(s).
• C
ontro
lled
for c
onfo
undi
ng
effe
ct o
f age
and
gen
der i
n
a lo
gist
ic re
gres
sion
mod
el.
Patte
n SB
et a
l,
2001
4
Cro
ss-s
ectio
nal
surv
ey
To e
valu
ate
asso
ciat
ion
betw
een
MD
and
long
-term
med
ical
cond
ition
s in
Cal
gary
, Can
ada.
Subj
ects
≥ 1
8 yr
s
who
wer
e re
side
nts o
f
tele
phon
e-co
ntai
ning
hous
ehol
d in
Cal
gary
.
• D
epre
ssio
n pr
eval
ence
: CID
I-
SFM
D (2
bran
ches
: 2w
ks o
f
depr
esse
d m
ood
vs. 2
wks
of
loss
of i
nter
est)
• Lon
g-te
m m
edic
al c
ondi
tion:
self-
repo
rted,
not
inde
pend
ently
con
firm
ed b
y
the
inte
rvie
wer
s, ho
wev
er, i
t
was
spec
ified
that
DX
shou
ld
have
bee
n m
ade
by a
hea
lth
prof
essi
onal
.
• 21%
had
MD
with
≥1
long
-
term
med
ical
con
ditio
n
com
pare
d to
15%
who
had
MD
with
out l
ong-
term
med
ical
con
ditio
n.
• Hav
ing ≥1
long
-term
med
ical
con
ditio
n w
as
asso
ciat
ed w
ith in
crea
sed
prev
alen
ce o
f MD
(PR=
1.44
, 95%
CI 1
.17-
1.76
).
• Th
is a
ssoc
iatio
n re
mai
ned
stro
ng a
fter s
tratif
icat
ion
by
age,
gen
der,
empl
oym
ent,
soci
al su
ppor
t and
stre
ssfu
l
life
even
ts, E
XCE
PT in
subj
ects
age
d ≥
45yr
s.
• Evi
denc
e le
vel I
I-3
• Sta
tistic
s: pr
eval
ence
Rat
io.
• Con
foun
ding
or m
odify
ing
effe
ct b
y ag
e, g
ende
r,
empl
oym
ent,
soci
al su
ppor
t
and
stres
sful
life
eve
nts
cont
rolle
d fo
r by
stra
tific
atio
n an
alys
is.
Patte
n SB
et a
l,
2005
5
Cro
ss-s
ectio
nal
surv
ey
To e
xplo
re
prev
alen
ce o
f MD
in th
e ge
nera
l
popu
latio
n in
• Sub
ject
s ≥ 1
8yrs
who
parti
cipa
ted
in th
e
CC
HS
Cyc
le 1
.2.
• D
epre
ssio
n pr
eval
ence
: CID
I-
SFM
D p
redi
ctiv
e in
strum
ent.
• Lo
ng-te
m m
edic
al c
ondi
tion:
self-
repo
rted,
not
• Ann
ual M
D p
reva
lenc
e w
as
7.4%
(95%
CI=
7.2-
7.6%
).
• MD
pre
vale
nce
in th
ose
with
≥ 1
long
-term
• Evi
denc
e le
vel I
I-3
• sec
onda
ry a
naly
sis
• Sta
tistic
s: Pr
eval
ence
• Rep
orte
d pr
oble
ms w
ith

99
rela
tion
to v
ario
us
long
-term
med
ical
cond
ition
s.
inde
pend
ently
con
firm
ed b
y
the
inte
rvie
wer
s, ho
wev
er, i
t
was
spec
ified
that
DX
shou
ld
have
bee
n m
ade
by a
hea
lth
prof
essi
onal
.
cond
ition
was
9.2
% (9
5%
CI=
8-9.
4%) c
ompa
red
to
4% (9
5% C
I= 3
.7-4
.3%
)
for t
hose
with
out
cond
ition
(s).
logi
stic
regr
essi
on (O
Rs)
anal
ysis
due
to d
ata
rele
ase
proh
ibiti
ons p
ut in
pla
ce b
y
Stat
Can
to d
eter
the
rele
ase
of h
ighl
y im
prec
ise
estim
ates
.
Stei
n M
B
et a
l,
2006
6
Cro
ss-s
ectio
nal
surv
ey
To e
xam
ine
the
rela
tive
and
com
bine
d im
pact
of d
epre
ssiv
e an
d
chro
nic
phys
ical
cond
ition
s on
func
tiona
l sta
tus
and
heal
th c
are
use
in th
e ge
nera
l
popu
latio
n.
Subj
ect ≥
12yr
s who
parti
cipa
ted
in th
e
CC
HS
Cyc
le 1
.2.
• M
D p
reva
lenc
e: th
e C
IDI-
SFM
D p
redi
ctiv
e in
strum
ent
(at 9
0% p
roba
bilit
y).
• O
ther
cor
rela
tes:
self-
repo
rted.
• The
pre
senc
e of
co-
mor
bid
MD
was
ass
ocia
ted
with
sign
ifica
ntly
gre
ater
(~ X
2)
likel
ihoo
d of
hea
lth c
are
utili
zatio
n an
d in
crea
sed
func
tiona
l disa
bilit
y an
d
wor
k ab
senc
e co
mpa
red
to
the
pres
ence
of a
chr
onic
phys
ical
illn
ess w
ithou
t
MD
.
• Evi
denc
e le
vel I
I-3
• Sec
onda
ry a
naly
sis
• Sta
tistic
s: A
ORs
\ log
istic
regr
essi
on.
• Con
serv
ativ
e P=
0.00
5 w
as
used
due
to la
rge
sam
ple
size
and
mul
tiple
com
paris
ons.
• Det
aile
d sta
tistic
al a
naly
ses
wer
e re
porte
d in
clud
ing
mis
sing
data
.
USA
Regi
er
et a
l,
1984
7
(EC
A)
Cro
ss-s
ectio
nal
surv
ey
To e
stim
ate
6-
mon
ths p
reva
lenc
e
of M
D in
the
gene
ral p
opul
atio
n
Subj
ects
≥18
yrs
who
parti
cipa
ted
in th
e
Epid
emio
logi
c
Cat
chm
ent A
rea
(EC
A) s
tudy
in
Balti
mor
e, M
d.
• M
D p
reva
lenc
e: D
iagn
ostic
Inte
rvie
w S
ched
ule
(DIS
)
base
d on
DSM
-III
• 6-m
onth
s MD
pre
vale
nce
was
2.2
%.
• MD
pre
vale
nce
is lo
wer
(%)
for ≥
65y
rs.
• Evi
denc
e le
vel I
I-2
• Sec
onda
ry a
naly
sis
• Sta
tistic
s: Pr
eval
ence
• Met
hodo
logy
was
crit
iciz
ed

10
0
Blaz
er
et a
l,
1994
8
(NC
S)
Cro
ss-s
ectio
nal
surv
ey
To e
stim
ate
prev
alen
ce
distr
ibut
ion
and
risk
fact
ors f
or M
D
in n
atio
nal
com
mun
ity sa
mpl
e.
Subj
ects
15-
54 y
rs o
f
age
who
par
ticip
ated
in th
e N
atio
nal C
o-
mor
bidi
ty S
urve
y
(NC
S).
• M
D p
reva
lenc
e:
CID
I.
• Oth
er c
orre
late
s: se
lf-re
porte
d.
• Ove
rall
curr
ent 3
0-da
ys
prev
alen
ce o
f MD
was
2.2%
.
• The
hig
hest
MD
pre
vale
nce
was
in th
e 15
-24
age
(6.1
%) w
ith a
smal
ler p
eak
in th
e 35
-44
age
band
(5.3
%)
• Cor
rela
tes a
re: b
eing
fem
ale,
low
er e
duca
tion,
low
er in
com
e.
• Evi
denc
e le
vel I
I-2
• Sec
onda
ry a
naly
sis
• Sta
tistic
s: Pr
eval
ence
&
AO
Rs\ l
ogis
tic re
gres
sion
.
UK
Jenk
ins e
t
al, 1
9989
(BPM
S)
Cro
ss-s
ectio
nal
surv
ey
To p
rovi
de d
ata
on
the
prev
alen
ce a
nd
corr
elat
es o
f
psyc
hiat
ric d
isor
der
on a
nat
ionw
ide
sam
ple.
Subj
ects
16-
65 y
rs o
f
age
who
par
ticip
ated
in th
e Br
itish
Psyc
hiat
ric M
orbi
dity
Surv
ey
(BPM
S).
• 1-w
k M
D p
reva
lenc
e:
by th
e
Revi
sed
Clin
ical
Inte
rvie
w
Sche
dule
(CIS
-R) a
t a c
ut-o
ff
poin
t of 1
2. A
lso,
the
ICD
-10
was
use
d to
est
ablis
hed
singl
e
prim
ary
diag
nosi
s.
• Oth
er c
orre
late
s: se
lf-re
porte
d.
• Ove
rall
1-w
k pr
eval
ence
of
MD
was
2.7
% fo
r fem
ales
and
1.8%
for m
ales
.
• Evi
denc
e le
vel I
I-2
• Sta
tistic
s: Pr
eval
ence
Austr
alia

10
1
Wilh
elm
K e
t al,
2003
10
Cro
ss-s
ectio
nal
surv
ey
To e
xam
ine
the
curr
ent (
30-d
ay)
prev
alen
ce a
nd
corr
elat
es o
f
men
tal d
isor
der
incl
udin
g M
D in
the
adul
ts
Aus
tralia
n
popu
latio
n.
Subj
ects
≥18
yrs w
ho
parti
cipa
ted
in th
e
Nat
iona
l Sur
vey
of
Men
tal H
ealth
and
Wel
l-Bei
ng
(NSM
HW
B)
• D
epre
ssio
n Pr
eval
ence
the
full
CID
I
• D
isab
ility
: SF-
12 &
“D
ays
out o
f rol
e” –
self-
repo
rted
• Oth
er c
orre
late
s: se
lf-re
porte
d. •
Ove
rall
depr
essi
on
Prev
alen
ce w
as 3
.2%
.
• Th
e hi
ghes
t pre
vale
nce
was
in th
e 45
-54
age.
• Be
ing
fem
ale,
sepa
rate
d
/wid
owed
/div
orce
d,
unem
ploy
men
t has
the
stro
nges
t ass
ocia
tion.
• Ev
iden
ce le
vel I
I-3
• Se
cond
ary
anal
ysis
• St
atis
tics:
Cru
de &
Adj
uste
d O
R\ lo
gist
ic
regr
essi
on (b
ack
elim
inat
ion)
Ref
eren
ce:
1.
Patte
n SB
. Lo
ng-te
rm m
edic
al c
ondi
tions
and
maj
or d
epre
ssio
n in
the
Can
adia
n po
pula
tion.
Can
J P
sych
iatr
y. 1
999
Mar
;
44(2
):151
-7.
2.
Patte
n SB
. M
ajor
dep
ress
ion
prev
alen
ce in
Cal
gary
. Can
J Ps
ychi
atry
. 200
0 D
ec; 4
5(10
):923
-6.
3.
Patte
n SB
. Lon
g-te
rm m
edic
al c
ondi
tions
and
maj
or d
epre
ssio
n in
a C
anad
ian
popu
latio
n st
udy
at w
aves
1 a
nd 2
. J A
ffect
Diso
rd. 2
001
Mar
; 63(
1-3)
:35-
41.
4.
Patte
n SB
. Des
crip
tive
epid
emio
logy
of
a de
pres
sive
syn
drom
e in
a W
este
rn C
anad
ian
com
mun
ity p
opul
atio
n. C
an J
Pub
lic
Hea
lth. 2
001
Sep-
Oct
; 92(
5):3
92-5
.
5.
Patte
n SB
, Bec
k C
A,
Kas
sam
A, W
illia
ms
JV, B
arbu
i C, M
etz
LM.
Long
-term
med
ical
con
ditio
ns a
nd m
ajor
dep
ress
ion:
stre
ngth
of a
ssoc
iatio
n fo
r spe
cific
con
ditio
ns in
the
gene
ral p
opul
atio
n. C
an J
Psyc
hiat
ry. 2
005
Mar
; 50(
4):1
95-2
02.

10
2
6.
Stei
n M
B, C
ox B
J, A
fifi T
O, B
elik
SL,
Sar
een
J. D
oes
co-m
orbi
d de
pres
sive
illn
ess
mag
nify
the
impa
ct o
f chr
onic
phy
sica
l
illne
ss?
A p
opul
atio
n-ba
sed
pers
pect
ive.
Psy
chol
Med
. 200
6 M
ay; 3
6(5)
:587
-96.
7.
Reg
ier
DA
, Sha
piro
S, K
essl
er L
G, T
aube
CA
. Epi
dem
iolo
gy a
nd h
ealth
ser
vice
res
ourc
e al
loca
tion
polic
y fo
r al
coho
l, dr
ug
abus
e, a
nd m
enta
l diso
rder
s. Pu
blic
Hea
lth R
ep. 1
984
Sep-
Oct
; 99(
5):4
83-9
2.
8.
Bla
zer
DG
, K
essl
er R
C,
McG
onag
le K
A,
Swar
tz M
S. T
he p
reva
lenc
e an
d di
strib
utio
n of
maj
or d
epre
ssio
n in
a n
atio
nal
com
mun
ity s
ampl
e: th
e N
atio
nal C
omor
bidi
ty S
urve
y. A
m J
Psyc
hiat
ry. 1
994
Jul;
151(
7):9
79-8
6.
9.
Jenk
ins
R, L
ewis
G, B
ebbi
ngto
n P,
Bru
gha
T, F
arre
ll M
, Gill
B, M
eltz
er H
. The
Nat
iona
l Psy
chia
tric
Mor
bidi
ty S
urve
ys o
f
Gre
at B
ritai
n--in
itial
find
ings
from
the
hous
ehol
d su
rvey
. Int
Rev
Psy
chia
try.
200
3 Fe
b-M
ay; 1
5(1-
2):2
9-42
.
10.
Wilh
elm
K,
Mitc
hell
P, S
lade
T, B
row
nhill
S,
And
rew
s G
. Pr
eval
ence
and
cor
rela
tes
of D
SM-I
V m
ajor
dep
ress
ion
in a
n
Aus
tralia
n na
tiona
l sur
vey.
J A
ffect
Diso
rd. 2
003
Jul;
75(2
):155
-62.

103
Table 3. Item contents of the Oral Health1 (OH1) module
1. Self-rated oral health
2. Usually able to:
• Chew firm meat
• Bite off and chew piece of fresh apple
• Chew boiled vegetables
3. Frequency of pain or discomfort in teeth or gums in the past month

104
Table 4. Item contents of the Oral Health2 (OH2) module
1. When usually visit dentist
2. Dental insurance coverage
3. Any teeth removed and reason for removal
4. Any natural teeth
5. Wears dentures or false teeth
6. Because of condition of teeth, mouth or dentures:
• Has difficulty pronouncing words or speaking clearly
• Avoids conversation or contact with others
• Avoids laughing or smiling
7. In past month, had
• Toothache
• Pain in teeth with hot or cold
• Pain around jaw joints
• Other pain in mouth or face
• Bleeding gums
• Dry mouth
• Bad breath
8. Frequency of brushing teeth

105
Table 5. Item contents of the Depression (DPS) module
1. Past 12 month frequency of two-week period of feeling sad, blue or
depressed or loss of interest
2. In worst two-week period, frequency of loss of interest, feeling tired,
weight gain or loss, trouble falling asleep, trouble concentrating,
feelings of worthlessness, thoughts about death