Embed Size (px)
Citation preview
IS A GROWING MIDDLE CLASS GOOD FOR THE POOR?SOCIAL POLICY IN A TIME OF GLOBALIZATION
Raj M. DesaiHomi Kharas
GLOBAL ECONOMY & DEVELOPMENT WORKING PAPER 105 | JULY 2017


Raj M. Desai is a visiting fellow in the Global Economy
and Development program at the Brookings Institution,
and Associate Professor of International Development
in the Walsh School of Foreign Service at Georgetown
University.
Homi Kharas is a a senior fellow and co-director in
the Global Economy and Development program at the
Brookings Institution.
Acknowledgments:
The Brookings Institution is a nonprofit organization devoted to independent research and policy solutions. Its
mission is to conduct high-quality, independent research and, based on that research, to provide innovative, prac-
tical recommendations for policymakers and the public. The conclusions and recommendations of any Brookings
publication are solely those of its author(s), and do not reflect the views of the Institution, its management, or its
other scholars.
This paper was prepared for the sixth annual seminar of Advancing Good Governance in International Development
in June 2017. Support for this publication was provided by the Skoll Centre for Social Entrepreneurship, the Said
Business School, and Linklaters LLP. Brookings recognizes that the value it provides is in its absolute commitment
to quality, independence and impact. Activities supported by its donors reflect this commitment and the analysis
and recommendations are not determined or influenced by any donation. A full list of contributors to the Brookings
Institution can be found in the Annual Report at https://www.brookings.edu/about-us/annual-report/.
The authors thank Rebecca Holmes, Santiago Levy, Judith Randel, Ulysses Smith, and the participants of the sem-
inar on “Advancing Good Governance in International Development” at Oxford University for comments on previous
drafts. Data on Social Policies around the World (SPAW) was generously provided by Magnus Rasmussen and Carl
Henrik Knutsen. The authors are grateful to Brina Seidel for invaluable research. All conclusions, errors, and omis-
sions are the authors’ own.

Abstract
Despite much analysis of the rise of the middle class, little is known about the effects of an expanding middle class
on the poorest in society. In the late 19th century, Europe’s middle class played a critical role in the creation of so-
cial protections aimed at reducing poverty and shielding vulnerable groups from shocks. This was achieved when a
political alliance was formed between the working poor and white-collar professionals—a “red-white” alliance. We
examine the role of the middle class and social spending on the extreme poor using data covering a range of early-
and late-industrializing countries between 1870 and the present. We find that poverty reduction occurs alongside
a growing middle class, mediated in part through greater spending on health, education, and welfare, but that
the effect of such social spending on poverty diminishes as the middle class expands. We then examine various
components of the current social safety net in developing countries and find that, while targeted transfers to the
poor are associated with a larger middle class, social insurance benefits that accrue to the upper quintiles increase
three times as quickly. Given that antipoverty policies are not likely to be sustained without the tacit support of the
middle class, a central implication of our findings is that developing countries aiming to eradicate extreme poverty
will need to focus on raising the volume of social assistance in a package with universal programs designed so as
to cover groups in nonstandard jobs.

CONTENTS
Introduction . . . . . . . . . . . . . . . . . . . . . . . . . . . . . . . . . . . . . . . . . . . . . . . . . . . . . . . . . . . . . . . . . . . . . . . 1
Poverty, Welfare, and Social Class . . . . . . . . . . . . . . . . . . . . . . . . . . . . . . . . . . . . . . . . . . . . . . . . . . . . . 3Class and Social Protection: Some Stylized Facts from European History . . . . . . . . . . . . . . . . . . 3The Limits to Cross-Class Solidarity . . . . . . . . . . . . . . . . . . . . . . . . . . . . . . . . . . . . . . . . . . . . . . . . 4Implications . . . . . . . . . . . . . . . . . . . . . . . . . . . . . . . . . . . . . . . . . . . . . . . . . . . . . . . . . . . . . . . . . . . . 5
Measurement and Data . . . . . . . . . . . . . . . . . . . . . . . . . . . . . . . . . . . . . . . . . . . . . . . . . . . . . . . . . . . . . 7The Middle Class and the Extreme Poor . . . . . . . . . . . . . . . . . . . . . . . . . . . . . . . . . . . . . . . . . . . . . 7Social Protection . . . . . . . . . . . . . . . . . . . . . . . . . . . . . . . . . . . . . . . . . . . . . . . . . . . . . . . . . . . . . . . 8
Methods and Results . . . . . . . . . . . . . . . . . . . . . . . . . . . . . . . . . . . . . . . . . . . . . . . . . . . . . . . . . . . . . . 10Panel Regression Results . . . . . . . . . . . . . . . . . . . . . . . . . . . . . . . . . . . . . . . . . . . . . . . . . . . . . . . 10Causal Mediation Analysis . . . . . . . . . . . . . . . . . . . . . . . . . . . . . . . . . . . . . . . . . . . . . . . . . . . . . . . 12Sensitivity Analysis . . . . . . . . . . . . . . . . . . . . . . . . . . . . . . . . . . . . . . . . . . . . . . . . . . . . . . . . . . . . . 16Determinants of Current Social Protection in Developing Countries . . . . . . . . . . . . . . . . . . . . . . . 16
Conclusion . . . . . . . . . . . . . . . . . . . . . . . . . . . . . . . . . . . . . . . . . . . . . . . . . . . . . . . . . . . . . . . . . . . . . . 20
References . . . . . . . . . . . . . . . . . . . . . . . . . . . . . . . . . . . . . . . . . . . . . . . . . . . . . . . . . . . . . . . . . . . . . . 23
Appendix . . . . . . . . . . . . . . . . . . . . . . . . . . . . . . . . . . . . . . . . . . . . . . . . . . . . . . . . . . . . . . . . . . . . . . . . 27
FIGURESFigure 1. The Middle Class and Extreme Poverty, 1870 – 2010 . . . . . . . . . . . . . . . . . . . . . . . . . . . . . . 8Figure 2. Poverty and Income for OECD and non-OECD Countries . . . . . . . . . . . . . . . . . . . . . . . . . . . 9Figure 3. Middle-Class Size and Social Spending, Interactive Effects . . . . . . . . . . . . . . . . . . . . . . . . 12Figure 4. Average Causal Mediation Effects, Sensitivity to Violation of Sequential Ignorability . . . . . 17Figure 5. Distribution of Per-Capita Social Benefits and Coverage by Quintile . . . . . . . . . . . . . . . . . . 18
TABLESTable 1. Extreme Poverty and the Middle Class, Panel Results . . . . . . . . . . . . . . . . . . . . . . . . . . . . . 11Table 2. Poverty and the Middle Class, Causal Mediation Analysis . . . . . . . . . . . . . . . . . . . . . . . . . . . 14Table 3. Poverty and the Middle Class, Causal Mediation Analysis by Sub-Sample . . . . . . . . . . . . . . 15Table 4. Benefits per Capita, Seemingly Unrelated Regressions . . . . . . . . . . . . . . . . . . . . . . . . . . . . 19

IS A GROWING MIDDLE CLASS GOOD FOR THE POOR? 1
IS A GROWING MIDDLE CLASS GOOD FOR THE POOR?SOCIAL POLICY IN A TIME OF GLOBALIZATION
Raj M. DesaiHomi Kharas
INTRODUCTION
Does an expanding middle class benefit society’s
poorest? Much has been written recently about
the rapid growth of the middle class as well as the
rapid fall in absolute poverty (Kharas 2017; Kochar
and Oates 2015; Burrows 2015). However, few stud-
ies seek to link these two trends. It is worth empha-
sizing at the outset that a growing middle class and
a falling poverty rate are not simply two sides of the
same coin; there is a large “vulnerable” (or near poor)
cohort between the poorest individuals and the middle
class. Additionally, the trends can be quite different.
In the United States, for example, the percentage of
middle-class households has steadily fallen since the
1970s, while the portion of households in the low-
est income brackets has remained steady (Kochhar,
Fry, and Rohal 2015). Similar trends have occurred
in the European Union since the early 2000s (ILO
2015). By contrast, in sub-Saharan Africa and Latin
America, most of those lifted out of poverty appear to
have joined the ranks of the vulnerable rather than the
middle class (Calvo-Gonzalez 2017; Chandy 2015).
There, the middle class has stagnated despite reduc-
tions in poverty.
In richer nations, the industrial revolution that shaped
the political identity of the working poor also gave
rise to a strata of salaried professionals who helped
administer the private and public services that sup-
ported manufacturing and urbanization—the so-called
“middling sort” (Hunt 1996). This middle class formed
political alliances with the working poor against pre-
dominantly rural elites, and was largely responsible
for, among other achievements, the expansion of the
voting franchise (Moore 1966; Lang 1999; Acemoglu
and Robinson 2005), the legalization of trade unions
(Pelling 1963), and ultimately, the creation of the mod-
ern welfare state (Hay 1975; Esping-Andersen 1990).
We examine the effect of the rise and evolution of
the middle class on extreme poverty, using the World
Bank’s international poverty line of $1.90 per per-
son per day in 2011 purchasing power parity (PPP)-
adjusted terms. Like the definition of poverty, the
definition of the middle class used here is also set in
absolute terms, comprising households where per cap-
ita income or consumption lies between $11 and $110
per person per day in 2011 PPP terms—referred to as
a “global,” as opposed to national, definition of the mid-
dle class (Kharas, 2017). We argue that middle-class

2 GLOBAL ECONOMY AND DEVELOPMENT PROGRAM
expansion initially is pro-poor given the incentives of
the emerging middle class and the working poor to co-
operate on matters of social policy. As citizens join the
ranks of the middle class, they lobby for programs that
provide them income stability and protections against
shocks (social insurance). By allying with the working
poor who seek social assistance (income transfers),
middle-class constituents increase their bargaining
power relative to elites who seek labor flexibility and
lower taxes in a competitive global economy. Over
time, however, as the middle class prospers and ac-
quires greater political influence, the balance of pro-
grams shifts increasingly toward social insurance and
away from social assistance. In this way, the middle
class begins to capture an increasing proportion of the
benefits of social spending, leaving less for welfare
services targeted exclusively at the poorest. One im-
plication of this is that the emerging middle class has
never been truly progressive, because progressivity
ultimately comes at its own expense.
We attempt three separate, but related tasks. First, we
investigate the effect of the middle class on the degree
of extreme poverty across countries and over time.
Second, we estimate the mediating effect of the middle
class on poverty through social spending and through
social policy choices regarding citizen eligibility for
benefits. Third, we examine the effect of middle-class
size on the size and distribution of benefits per capita
of social assistance and social insurance programs in
developing countries.
Examining cross-country, time-series (unbalanced)
data covering more than 100 countries from 1870 to
the present, we find a strong effect of the middle class
on poverty, even correcting for country income levels,
but this effect has diminished over time. Today’s rich
countries had far lower levels of poverty between 1870
and 1920 than today’s developing countries have,
even though per capita income levels are roughly
equivalent. We also find evidence that the middle-class
impact on poverty reduction is both direct and medi-
ated through social spending, but the marginal effect of
the latter declines as middle-class size expands, with
social spending having no marginal effect on poverty
reduction once the size of the middle class approaches
30 percent of the population. On average, half of the
total effect of middle-class size on poverty is mediated
through social spending.
Turning to an analysis of current developing countries
since 2000, we find that the dollar benefits available to
the poorest quintile within each country get larger in the
presence of a larger middle class. In contrast, the size
of absolute benefits to those in the top quintile (which
usually includes most of the middleclass households in
a developing country context) that is about three times
as great as the poorest quintile, suggesting that the
middle class is capturing significantly greater benefits
from national social spending programs than are the
poor. Our results highlight the politically pivotal role that
the middle class plays in supporting the expansion of
social protection—and thus the need for cross-class
solidarity—but also illustrates the disproportionate in-
fluence of the middle class in shaping a country’s social
protection regime. A major conclusion is that it is criti-
cally important to distinguish between social assistance
and social insurance. In most countries, assistance
programs are funded at relatively modest rates and pro-
gressivity is modest. Social insurance tends to be more
universal in terms of coverage (and enjoys stronger
political support from the middle class) and dispenses
far larger amounts of money, but benefits are strongly
oriented toward the richest quintiles.1 Our analysis sug-
gests that increasing the volume of resources going
toward social assistance and altering the design and re-
gressivity of social insurance are the policy areas most
likely to benefit the poor.

IS A GROWING MIDDLE CLASS GOOD FOR THE POOR? 3
POVERTY, WELFARE, AND SOCIAL CLASS
Attention to social protection as an area of devel-
opment policy is relatively new. During adjust-
ment programs in the 1980s and 1990s, efforts were
principally focused on the appropriate mix of policies
to achieve stabilization and reform, with comparatively
little attention paid to the problem of social costs and
risks to vulnerable groups (Graham 2002). Even where
issues of social welfare were addressed, the focus
tended to be on short-term consequences of public
sector retrenchment (see, e.g., Galal, et al. 1994).
Since the early 2000s, however, developing countries
have expanded their safety nets to include almost 2
billion people (World Bank 2015).
Two distinguishing features of advice given to develop-
ing countries on the design of social protection can be
contrasted with the practice in advanced, industrialized
countries (Barrientos 2010). First, social protection in
developing countries has often had a stronger “target-
ing” preference toward the poorest rather than featuring
the universality of richer countries that aim to protect liv-
ing standards of their workforce. Second, social protec-
tion in developing countries tends to be complex, and
fragmentary, with the average developing country now
having over 20 distinct social programs, each aimed at
a different sub-population (World Bank 2015).
While the development of large-scale social protec-
tion may be relatively recent in developing countries,
this is not the case in most developed nations, where
the creation of universal forms of social protection oc-
curred at early stages of development and state forma-
tion. Indeed, one of the innovations of the European
Enlightenment was that poverty should not be thought
of as a necessary condition for economic development
to occur. As Ravallion has argued, under mercantilist
principles, it was widely accepted that the afflictions of
extreme poverty were needed to encourage industri-
ousness, a mindset that the Enlightenment sought to
change: “The key contribution… was in establishing
the moral case for the idea of public effort toward elim-
inating poverty” (Ravallion 2013). For the better part
of a century, that “public effort” largely took the form of
mutual aid societies, the workhouse, as well as com-
pulsory education laws. It did not include any form of
protection against shocks or any social “floor,” however.
Class and Social Protection: Some Stylized Facts from European History
Much has been written about the class-origins of the
European welfare state and the political alliances that
undergird them (Esping-Andersen and Korpi 1985;
Baldwin 1990; Esping-Andersen 1992). Most critical
for poverty reduction is the nature of the alliance that
incorporated the working poor, since as a constituency,
they were too weak to impose their will unilaterally on
others. In this regard, the middle class has historically
proven to be a pivotal group in facilitating the develop-
ment of social policy. In 19th century Britain, the essay-
ist William Carpenter argued in his address to workers:
“[T]he middle classes are not only not a class
of persons having interests different from your
own… they are not a different class from your
own. They are the same class; they are, gener-
ally speaking, working or laboring men” (1831).
In Scandinavian countries, the establishment of so-
cial protections such as pensions resulted from the
famous “red-green” alliance of urban workers and the
rural middle class—a coalition that, in Sweden, thwarted
legislation until they were granted a pension law
extending benefits to all citizens. As industrialization and

4 GLOBAL ECONOMY AND DEVELOPMENT PROGRAM
urbanization proceeded, white-collar professionals who
formed a “red-white alliance” gradually replaced farmers in
the alliance (Pempel 1998: 207). In subsequent decades,
this (often-uneasy) alliance remained powerful enough to
fight against predominantly rural, aristocratic elites.
Because the middle-class valued stability, its interests
coincided with those of the working class; social “pro-
tection”—the collection of policies designed to reduce
poverty and vulnerability by limiting people’s expo-
sure to risk—was used to tamp down radicalization
and social upheaval among the industrial workforce
and its accompanying political movements—socialist
parties and revolutionary communes. Between 1883
and 1889, largely with middle-class support and the
support of “bourgeois parties” against a social-dem-
ocratic threat, Bismarck’s government enacted three
basic components of social protection: healthcare
(1883), accident insurance (1884), and unemployment
and old age pensions (1889) (Blackbourn and Evans,
2014; Spohn 1991; Holborn 1969). Similarly, France
established free medical assistance and support pro-
grams for the elderly in the 1890s.2 Facing similar
trade union mobilization and electoral threats from the
newly formed Labour Party, the governing Liberals in
Britain established worker pensions, unemployment,
and health insurance between 1906 and 1911. In each
case, these programs were universal and, as we shall
show below, a feature that ultimately allowed the mid-
dle-class to capture the lion’s share of the monetary
benefits.
The Limits to Cross-Class Solidarity
The working poor are not the only group with an inter-
est in expanding social insurance. As Baldwin put it,
“[T]he proletariat has had no monopoly on uncertainty
or on an interest to ameliorate such circumstances”
(1990: 12). The middle class are also predisposed
to supporting social insurance against risk, but their
demands for social policy do not always match the
preferences of the working poor. For example, wher-
ever they appeared, the new middle classes enjoyed
a relatively privileged position in the workforce, and
thus full employment for them was a “peripheral con-
cern” while it was of central importance for the working
class (Esping-Andersen 1992: 31). While middle-class
groups had incentives to ally with the poor to obtain
larger welfare state protections, they also resisted ef-
forts to expand non-contributory, pro-poor programs
financed out of taxes, pushing instead for contributory
schemes in which they were participants.
Consequently, in each period of red-white solidarity,
tensions inevitably appeared between the universal-
ism preferred by the middle classes and the more
progressive demands of the working poor. In Germany
following the Second World War, for example, alliance
between the middle class and working class splin-
tered over means testing of unemployment assistance
(Mares 2003). In Britain, the red-white coalition broke
apart following the First World War, when Labour as-
cendancy created divisions within the Liberal Party
over the role of trade unions funding political parties,
as well as social programs that targeted the increas-
ingly vocal working poor. In The Strange Death of
Liberal England, Dangerfield wrote of the middle-class
reaction to David Lloyd George’s support of reforms to
the Health Insurance Act:
“[H]e represented—or seemed to represent—
all those dangerous and possibly subversive
opinions which Liberalism, in its grave game
of progress, was forced to tolerate… If his con-
victions had been otherwise than emotional,
he would have been a Socialist by this time”
(Dangerfield 1935: 29).

IS A GROWING MIDDLE CLASS GOOD FOR THE POOR? 5
The story of welfare state building in industrialized na-
tions, in sum, is that policymakers strove to dampen
social unrest through the extension of benefits to the
working poor, but at the same time, to accommodate
the needs of the growing middle class by providing ser-
vices for which they would be willing to pay taxes. The
middle classes—initially including farmers, artisans,
clerks, shopkeepers, and managers—each facing their
own unique vulnerabilities, also had pressing needs
for social protection, and the red-white alliance guar-
anteed the political success of those protections. With
middle-class expansion, however, policy differences
within the red-white alliance widened, with the middle
class resisting most programs aimed at more dramatic
income redistribution.
Implications
One of the enduring puzzles in the development of
social protection around the world is the divergence
between welfare-state development in high-income
OECD, when contrasted with developing countries in
this regard (Rudra 2003; 2010). Social protection in
low- and middle-income countries today has evolved in
an environment in which labor movements have found
themselves in a weaker bargaining position relative to
the emerging middle class. For developing nations with
large surpluses of low-skilled labor, global pressures
for lower unit-labor costs and, in many countries, re-
pressive policies toward organized labor in the face of
capital mobility, have left workers in a weaker relative
bargaining position (Rodrik 1999; Bellin 2000; Berliner
et al., 2015). Many workers end up in non-standard
jobs, often in the informal sector (Auer 2006).3 Another
feature of developing countries is sharp sectoral cleav-
ages between workers within sectors facing shocks—
e.g., manufacturing sectors exposed to international
competition—relative to workers in more protected
sectors. Distributional conflict between high- and low-
risk sectors, rather than between classes, has led both
workers and middle-class members facing high volatil-
ity to support social insurance programs that compen-
sate them for losses of income (Zeitinoglu, et al. 2000).
Meanwhile, workers and the middle class in low-risk
sectors (such as teachers and nurses in the public
sector) have opposed the programs that turn them into
subsidizers of high-risk sectors (Mares 2005).
The size of the middle class has two effects—direct
and indirect—on poverty. The direct effects reflect the
composition and structure of the economy. Comparing
two countries with the same income levels, the one
with the larger middle class would have lower poverty
because the middle class would be a source of en-
trepreneurship and small enterprise creation, result-
ing in opportunities for more employment and higher
wages. Similarly, middle-class consumption contrib-
utes to aggregate demand and more economic growth.
Additionally, improvements in agricultural productivity
on the part of middle-class family farmers can result in
lower food prices paid by the poorest.
The indirect effects take place through middle-class ef-
forts to expand the social protection regime. It follows
that cross-class alliances supporting expanded social
protection are also more likely in countries where
the middle class has significant political influence.
Marginalized groups may be critical political allies for
middle-class groups vying for benefits. For the poorest
citizens, middle-class allies are needed to maintain
critical support for social programs. As the middle class
expands, however, we expect the red-white alliance to
fray for two reasons. First, as additional programs are
added to the social protection regime, there is a nat-
ural tendency for social planners, in order to restrain
costs, to shift toward means-testing or other forms of
targeting of social assistance programs in order to sep-

6 GLOBAL ECONOMY AND DEVELOPMENT PROGRAM
arate the non-poor from the poor. These programs then
quickly lose the political support of the middle class,
who have little stake in policies from which they de-
rive little benefit and become quantitatively modest in
size (Besley and Kanbur 1990; Gelbach and Pritchett
2002). Second, there is a parallel tendency for mid-
dle-class groups, as their political weight increases,
to rely less on their solidarity with the poor, and to
capture a larger share of the benefits of social policies
by placing a greater emphasis on contributory social
insurance programs.
IS A GROWING MIDDLE CLASS GOOD FOR THE POOR? 7
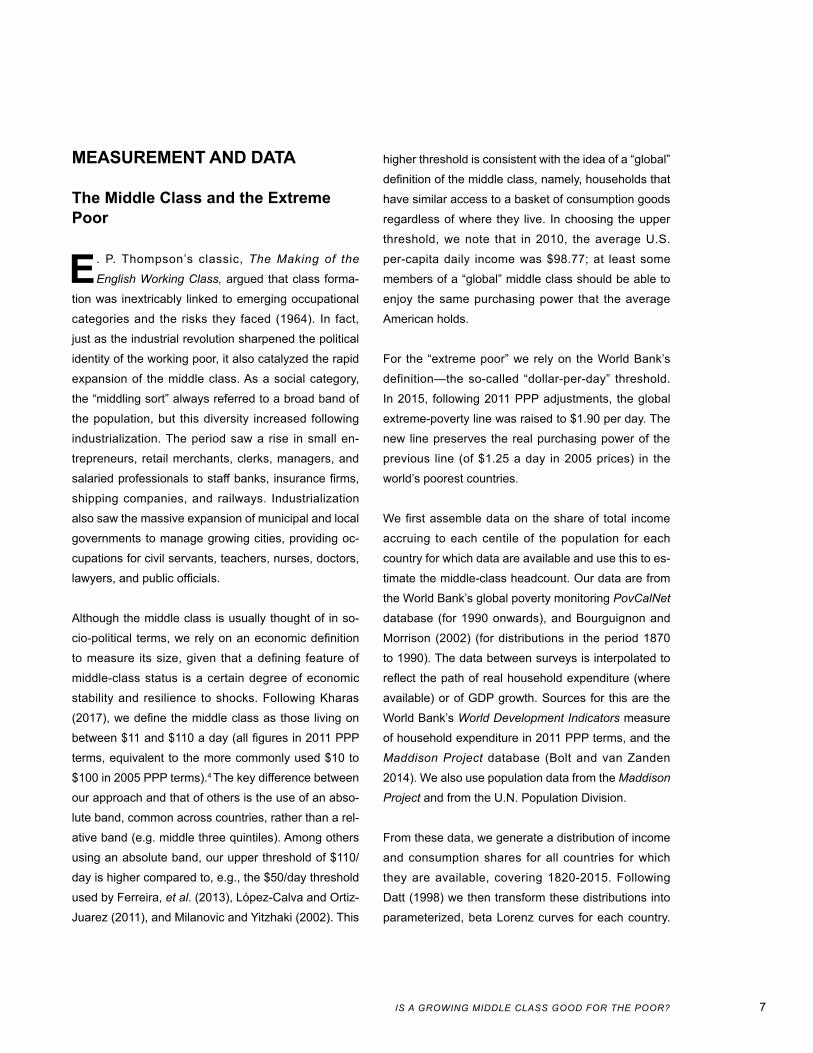
MEASUREMENT AND DATA
The Middle Class and the Extreme Poor
E. P. Thompson’s classic, The Making of the
English Working Class, argued that class forma-
tion was inextricably linked to emerging occupational
categories and the risks they faced (1964). In fact,
just as the industrial revolution sharpened the political
identity of the working poor, it also catalyzed the rapid
expansion of the middle class. As a social category,
the “middling sort” always referred to a broad band of
the population, but this diversity increased following
industrialization. The period saw a rise in small en-
trepreneurs, retail merchants, clerks, managers, and
salaried professionals to staff banks, insurance firms,
shipping companies, and railways. Industrialization
also saw the massive expansion of municipal and local
governments to manage growing cities, providing oc-
cupations for civil servants, teachers, nurses, doctors,
lawyers, and public officials.
Although the middle class is usually thought of in so-
cio-political terms, we rely on an economic definition
to measure its size, given that a defining feature of
middle-class status is a certain degree of economic
stability and resilience to shocks. Following Kharas
(2017), we define the middle class as those living on
between $11 and $110 a day (all figures in 2011 PPP
terms, equivalent to the more commonly used $10 to
$100 in 2005 PPP terms).4 The key difference between
our approach and that of others is the use of an abso-
lute band, common across countries, rather than a rel-
ative band (e.g. middle three quintiles). Among others
using an absolute band, our upper threshold of $110/
day is higher compared to, e.g., the $50/day threshold
used by Ferreira, et al. (2013), López-Calva and Ortiz-
Juarez (2011), and Milanovic and Yitzhaki (2002). This
higher threshold is consistent with the idea of a “global”
definition of the middle class, namely, households that
have similar access to a basket of consumption goods
regardless of where they live. In choosing the upper
threshold, we note that in 2010, the average U.S.
per-capita daily income was $98.77; at least some
members of a “global” middle class should be able to
enjoy the same purchasing power that the average
American holds.
For the “extreme poor” we rely on the World Bank’s
definition—the so-called “dollar-per-day” threshold.
In 2015, following 2011 PPP adjustments, the global
extreme-poverty line was raised to $1.90 per day. The
new line preserves the real purchasing power of the
previous line (of $1.25 a day in 2005 prices) in the
world’s poorest countries.
We first assemble data on the share of total income
accruing to each centile of the population for each
country for which data are available and use this to es-
timate the middle-class headcount. Our data are from
the World Bank’s global poverty monitoring PovCalNet
database (for 1990 onwards), and Bourguignon and
Morrison (2002) (for distributions in the period 1870
to 1990). The data between surveys is interpolated to
reflect the path of real household expenditure (where
available) or of GDP growth. Sources for this are the
World Bank’s World Development Indicators measure
of household expenditure in 2011 PPP terms, and the
Maddison Project database (Bolt and van Zanden
2014). We also use population data from the Maddison
Project and from the U.N. Population Division.
From these data, we generate a distribution of income
and consumption shares for all countries for which
they are available, covering 1820-2015. Following
Datt (1998) we then transform these distributions into
parameterized, beta Lorenz curves for each country.

8 GLOBAL ECONOMY AND DEVELOPMENT PROGRAM
These parameters are then used to calculate both the
share of the middle class ($11 to $110) and of the ex-
treme poor (<$1.90) in the population. Full details on
the methodology used to calculate the middle class
and the extreme poor are in the appendix.
Figure 1 shows the trends for the size of the middle
class, and the percent of extreme poor in the popula-
tion, between 1870 and 2000 for current OECD and
non-OECD countries. Both have seen rapid expansion
in the middle class and falls in extreme poverty. The
middle class surpassed the poor in advanced, indus-
trialized nations in about 1920, but this crossover has
only happened very recently in developing countries,
within the past decade. For comparison, we add the
percentage of agricultural land held as family farms
from Vanhannen (1997; 2005). This has been used
elsewhere as an historic proxy for the size of the mid-
dle class (Boix 2003; Easterly 2007; Houle 2009). Our
measure of the middle class mostly conforms to the
family farms measure across OECD and non-OECD
countries, although the percentage of family farms
does appear to “top out” at approximately 65 percent in
OECD countries and at about 40 percent in developing
countries.
Figure 2 shows the relationship between extreme pov-
erty rates and GDP per capita for advanced and devel-
oping countries, at equivalent income levels, smoothed
over five year periods. The data in span country-years
between 1820 and 2015. The first graph indicates that,
at every level of per-capita income, today’s developing
countries have rates of extreme poverty that are 5-10
percentage points higher than today’s rich countries.
This gap can be seen—dramatically, in some cases—in
the bottom graph, which compares five richer and five
poorer countries. Once again poorer nations consis-
tently suffer from higher rates of extreme poverty than
OECD counterparts at each comparable income level
(with the exception of China and India in earlier years).
Social Protection
We assemble two datasets—one historical, another
contemporary. For the historical data, we rely on: (i)
benchmark data on social spending across a number
of countries from 1880 to 1930, as detailed in Lindert
(2004); (ii) OECD data on social spending covering
OECD countries between 1930 and 1980; (iii) OECD
data on social spending—with adjustments to the
Figure 1. The Middle Class and Extreme Poverty, 1870 – 2010
0
20
40
60
80
100
Per
cent
1850 1900 1950 2000Year
OECD
$11–110/day
Family farms
<$1.90/day0
20
40
60
80
100
Per
cent
1850 1900 1950 2000Year
Non−OECD
$11–110/day
Family farms
<$1.90/day

IS A GROWING MIDDLE CLASS GOOD FOR THE POOR? 9
methodology used for the 1930-1980 data, covering
OECD countries from 1960 to the present; and (iv)
the World Bank’s data on social spending comprising
public health, education, and welfare expenditures, be-
tween 1960 and 2000.
Our contemporary data relies on the World Bank’s
Atlas of Social Protection—Indicators of Resilience and
Equity (ASPIRE) database for indicators of social pro-
tection, covering a sporadic number of years between
2004 and 2011. We rely on a simple measure of total
expenditure on all forms of social protection, as well as
measures of coverage of various components of social
protection, i.e., the percentage of population participat-
ing in social protection and labor programs (including
direct and indirect beneficiaries) by program type.
Programs are divided into social assistance and social
insurance. Social assistance consists of non-contrib-
utory programs that generally involve transfers tar-
geted toward the poor, such as cash transfers, in-kind
provisions, subsidies, fee waivers, (non-contributory)
pensions, as well as public works and workfare. By
contrast, social insurance refers to contributory pro-
grams aimed at reducing exposure to risks, including
old age, survivors’, and disability pensions, along with
employment-related benefits such as paid leave for
sickness, parental benefits, as well as health and inju-
ries benefits.
0
20
40
60
80
Pov
erty
Hea
dcou
nt R
ate
($1.
90/d
ay)
1000 2000 4000 8000 16000 36000
OECDNon−OECD
100
GDP Per Capita (2011 PPP)
0
20
40
60
80
100
Pov
erty
Hea
dcou
nt R
ate
($1.
90/d
ay)
1000 2000 4000 8000 16000GDP Per Capita (2011 PPP)
United States ChinaUnited Kingdom IndiaGermany MexicoSweden BrazilCanada South Africa
36000
Figure 2. Poverty and Income for OECD and non-OECD Countries

10 GLOBAL ECONOMY AND DEVELOPMENT PROGRAM
METHODS AND RESULTS
The data are used to investigate the impact of the mid-
dle class on extreme poverty, mediated through social
spending. We also review the effect of the middle class
on the level and composition of social assistance and
social protection programs.
Our benchmark specifications take a simple interactive
form:
Hi,t = β0 + β1Hi,t – 1 + β2si,t + β3(Hi,t – 1 × si,t) +
β4Xi,t + βti,t + εi,t
P M M
(1)
Where HP is the headcount ratio of the extreme poor
in the population (those with consumption of less than
$1.90/day in constant 2011 PPP-adjusted dollars). HM
is the size of the middle class (consumption between
$11 and $110 per day in constant 2011 PPP-adjusted
dollars), s is any measure of social protection benefits
per capita in natural logs, X a vector of controls, and t a
trend. For controls, we include GDP per capita (also in
constant PPP-adjusted dollars), total trade (gross im-
ports + exports as a percentage of GDP) as a proxy for
the effects of greater global integration and openness,
and a Herfindahl index of ethnolinguistic fractionaliza-
tion , where Fc is the fractionalization score for country
c, and x is the fraction of ethnic group g in country c,
on the assumption that ethnic fragmentation can influ-
ence poverty levels. We also include the Polity index of
democracy, ranging from -10 (autocracy) to +10 (de-
mocracy), to allow for the fact that democratic govern-
ments may be more pro-poor (Ross 2006). As we have
social spending data from four sources that may have
differences in coverage, (Lindert 1994, old OECD,
new OECD, and World Bank), we include dummy vari-
ables for each data source. All variables are indexed
by country i and time period t, and ε is a random, i.i.d.
disturbance. We use lustrum (five-year) averages, thus
each period represents a five-year timespan. We lag
the middle-class indicator by one five-year period to
control for potential simultaneity.
We begin with an analysis of long time-span data
(roughly 1870 to 2015) using pooled ordinary least
square (OLS) and fixed-effects models with error cor-
rections for contemporaneous and serial autocorrela-
tion, where we model the error term as a first-order
autocorrelated AR(1) process: εi,t = ρεi,t-1 + μi,t. We also
estimate a more complex, dynamic-panel model using
a system-generalized method of moments (GMM) es-
timator that is well suited for persistent cross-country,
time-series data, and which can also address endog-
eneity concerns regarding some of our independent
variables.
Panel Regression Results
Our benchmark cross-national types of time-series
panel regression results are presented in Table 1:
pooled OLS, OLS with fixed effects, and system GMM.5
In column (1) we show results from a pooled OLS re-
gression with error correction for contemporaneous
correlation as suggested by Beck and Katz (1995). We
also structure the within-panel error as an AR(1) pro-
cess to correct for country-specific serial correlation.
Column (2) shows results from a standard fixed-effects
regression where the disturbance is, similarly, modeled
as first-order autoregressive term. Both sets of results
show that the independent effects of middle-class
size and per-capita social spending reduce extreme
poverty. These effects occur across as well as within
countries over the period. The effect of the interaction
term combining middle-class size and social spend-
ing, however, is positive on poverty, indicating that the
negative effect of social protection on poverty reduc-
tion gets smaller as the middle class expands. This

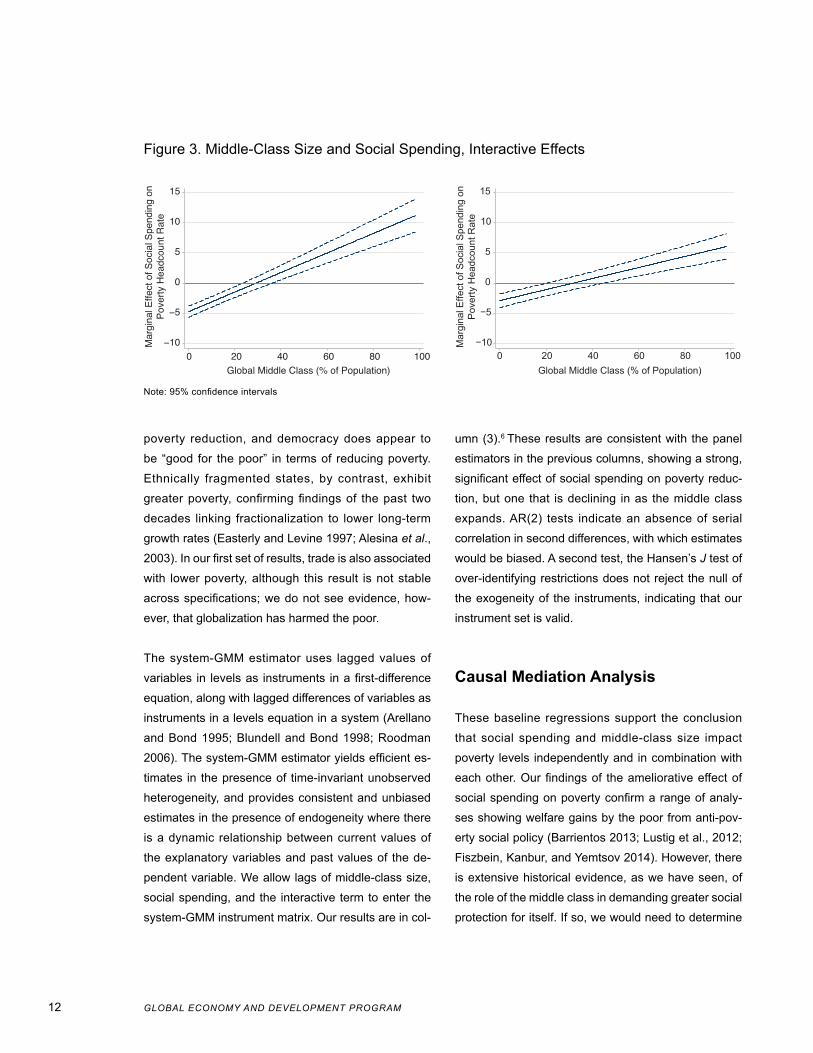
IS A GROWING MIDDLE CLASS GOOD FOR THE POOR? 11
interactive relationship is graphically presented in
Figure 3, in which we can analyze marginal effects
based on the error-correction regressions in columns
(1) and (2). The graph on the left is derived from the
pooled OLS results, while the one on the right is from
our fixed effects estimates. In both cases, the mar-
ginal effect of social spending per capita on the pov-
erty headcount is negative. However, as the middle
class approaches 30 percent of the population, the
effect of social spending on poverty approaches zero.
Thereafter, the effect reverses itself, although the er-
rors are much larger given the small number of coun-
tries where the middle class is larger than 60 percent.
Other variables behave as expected. Average per-cap-
ita income provides a large-magnitude effect on
(1) (2) (3)
Panel-corrected standard errors Fixed effects System GMM
Middle class headcount ratio (% of population) -1.064***(0.134)
-0.565***(0.103)
-0.955***(0.145)
Social spending/capita (US$, Ln) -4.574***(0.476)
-2.890***(0.587)
-5.333***(1.957)
Middle class × Social spending 0.163***(0.015)
0.091***(0.012)
0.142***(0.016)
Polity score -0.102(0.093)
-0.220**(0.085)
-0.370*(0.214)
Trade (% of GDP) -0.057**(0.022)
-0.009(0.024)
-0.073(0.050)
GDP/capita (US$, Ln) -16.639***(2.211)
-19.205***(2.535)
-12.858***(4.131)
Ethnic fractionalization 8.195***(3.040)
6.302(5.787)
Trend -0.035(0.022)
0.101***(0.010)
0.052(0.062)
Nn
676111
575105
676111
R2
ρCountry-fixed effectsRegion-fixed effectsp > χ2, F
0.8040.603
noyes
0.000
0.7670.691
yesno
0.000
noyes
0.000AR(2) test (p-value)Hansen’s J (p-value)
0.7380.958
Notes: Dependent variable is share of population living below $1.90/day (2011 PPP-adjusted US$). Estimates are gener-ated with OLS with errors corrected for contemporaneous correlation and within-panel first-order autocorrelation in paren-theses in column (1). Column (2) presents results from a within-country estimator (with fixed effects) where the disturbance term is first-order autoregressive, and with errors clustered at the country level in parentheses. Results from a dynamic two-step system-GMM estimation, with robust standard errors in parentheses, are in column (3), with two lags (one and two 5-year periods). Intercepts are estimated but not reported. * p < 0.10; ** p < 0.05; *** p < 0.01.
Table 1. Extreme Poverty and the Middle Class, Panel Results
12 GLOBAL ECONOMY AND DEVELOPMENT PROGRAM
poverty reduction, and democracy does appear to
be “good for the poor” in terms of reducing poverty.
Ethnically fragmented states, by contrast, exhibit
greater poverty, confirming findings of the past two
decades linking fractionalization to lower long-term
growth rates (Easterly and Levine 1997; Alesina et al.,
2003). In our first set of results, trade is also associated
with lower poverty, although this result is not stable
across specifications; we do not see evidence, how-
ever, that globalization has harmed the poor.
The system-GMM estimator uses lagged values of
variables in levels as instruments in a first-difference
equation, along with lagged differences of variables as
instruments in a levels equation in a system (Arellano
and Bond 1995; Blundell and Bond 1998; Roodman
2006). The system-GMM estimator yields efficient es-
timates in the presence of time-invariant unobserved
heterogeneity, and provides consistent and unbiased
estimates in the presence of endogeneity where there
is a dynamic relationship between current values of
the explanatory variables and past values of the de-
pendent variable. We allow lags of middle-class size,
social spending, and the interactive term to enter the
system-GMM instrument matrix. Our results are in col-
umn (3).6 These results are consistent with the panel
estimators in the previous columns, showing a strong,
significant effect of social spending on poverty reduc-
tion, but one that is declining in as the middle class
expands. AR(2) tests indicate an absence of serial
correlation in second differences, with which estimates
would be biased. A second test, the Hansen’s J test of
over-identifying restrictions does not reject the null of
the exogeneity of the instruments, indicating that our
instrument set is valid.
Causal Mediation Analysis
These baseline regressions support the conclusion
that social spending and middle-class size impact
poverty levels independently and in combination with
each other. Our findings of the ameliorative effect of
social spending on poverty confirm a range of analy-
ses showing welfare gains by the poor from anti-pov-
erty social policy (Barrientos 2013; Lustig et al., 2012;
Fiszbein, Kanbur, and Yemtsov 2014). However, there
is extensive historical evidence, as we have seen, of
the role of the middle class in demanding greater social
protection for itself. If so, we would need to determine
−10
−5
0
5
10
15
Mar
gina
l Effe
ct o
f Soc
ial S
pend
ing
onP
over
ty H
eadc
ount
Rat
e
0 20 40 60 80 100Global Middle Class (% of Population)
−10
−5
0
5
10
15
Mar
gina
l Effe
ct o
f Soc
ial S
pend
ing
onPo
verty
Hea
dcou
nt R
ate
0 20 40 60 80 100Global Middle Class (% of Population)
Figure 3. Middle-Class Size and Social Spending, Interactive Effects
Note: 95% confidence intervals
IS A GROWING MIDDLE CLASS GOOD FOR THE POOR? 13
the extent to which the effect of middle-class size on
poverty is “mediated” through the social-spending
channel.
In the classic framework, mediation analysis is con-
ducted in a system of three equations: the outcome is
regressed on a “treatment” indicator, the mediator is
regressed on the treatment, and the outcome is then
regressed on both the treatment and the mediator:7
E(Hi, t |Hi, t–1), Xi, t)P M (2)
E(si, t│Hi, t–1, Xi, t)M (3)
E(Hi, t│Hi, t–1, si, t, Xi, t)P M (4)
where the variables HP, HM, and s, and the vector X are
identical to those specified in equation (1) above.
A mediation path, to be valid, requires “sequential ig-
norability”—first, that the treatment is “ignorable” given
observed confounders and second, that the mediator
is “ignorable” given both the treatment and confound-
ers. In randomized experiments, of course, the first
condition is satisfied. In observational analyses, how-
ever, regression techniques requiring control variables
related to the treatment are required to satisfy this
assumption. For the second condition, observational
analyses require controls for variables related to both
the mediator and the outcome.
In our example, the first assumption implies that that
no confounding differences between countries with
different middle-class sizes exist once controls are in-
cluded to correct for confounding factors. The second
condition presupposes that different levels of social
spending occur randomly within groups of countries
that are roughly similar in terms of middle-class size.
These conditions, especially the ignorability of the
mediator, are extremely onerous and can never be
fully verified with observational data where there are
multiple potential mediators—some of which may be
unobserved. Mediation tests constitute the best avail-
able method for investigating causal mechanisms
in a cross-country context, but sensitivity analysis is
needed to evaluate the robustness of results to the ex-
istence of such confounders. Imai, et al. (2010) argue,
given that the errors co-vary across equations (2), (3),
and (4), a linear system of equations does not satisfy
the sequential ignorability assumption. As an alterna-
tive, therefore, they rely on the non-parametric tech-
nique that resolves some of the problems surrounding
the assumptions required to identify causal mecha-
nisms (Imai, et al. 2011).
Our mediation analysis is presented in Table 2, in
which we consider whether the effect of middle-class
size is mediated through different channels. The co-
efficients in column (1) are consistent with our base-
line results that middle-class size reduces extreme
poverty. The average causal mediated effect (ACME)
and average direct effects (ADE), which represent
the sample averages of the causal and direct effects,
respectively, confirm that social policy constitutes an
important mechanism for poverty reduction. We find
that over one-half of the effect of middle-class size on
poverty reduction is mediated through per-capita social
spending.
In columns (2) and (3) we analyze the degree of
universalism in welfare states, measured as an in-
dex representing the legal eligibility of citizens to
receive benefits in each country for six types of
benefits: pensions, unemployment compensation,
maternity, sickness, family allowances, and disabil-
ity (Knutsen and Rasmussen, 2017). This universal
welfare index is scored from zero to 54 representing
the sum of all six scores (each is scored from zero
to 6). The results indicate that universalism is also
a mediating channel, although the effect is weaker.8

14 GLOBAL ECONOMY AND DEVELOPMENT PROGRAM
But with 20 percent of the middle-class effect on pov-
erty mediated through universalism, it seems as if this
captures some of the indirect effect of the middle-class
impact on poverty through social spending. Given that
universalism is strongly increasing for each country
over time (as legal changes expand the range of eligi-
ble citizens), we regress universalism on a trend with
fixed-effects, and generating the residual. This residual
can be considered a “de-trended” universalism index.
The de-trended index appears to be identical to the
regular universalism channel as a mediator, suggest-
ing that the effect is not due to some unobserved,
temporal factor. Finally, we examine total per-capita
government expenditures as a channel given that gen-
eral government spending can also affect the level of
poverty. Expenditures are a weak mediating channel,
(1) (2) (3) (4)
Middle-class size -0.227***(0.045)
-0.550***(0.043)
-0.550***(0.043)
-0.499***(0.034)
Polity -0.417***(0.122)
-0.379***(0.119)
-0.377***(0.119)
-0.697***(0.113)
Ethnic fractionalization 12.226***(2.702)
10.895***(2.794)
10.819***(2.793)
14.519***(2.616)
Trade (% of GDP) -0.018(0.026)
-0.131***(0.030)
-0.132***(0.030)
-0.046(0.029)
GDP/capita (US$, Ln) -10.805**(4.608)
-24.479***(5.006)
-24.437***(5.003)
-29.031***(5.224)
Trend 0.227***(0.034)
0.093***(0.027)
-0.115***(0.026)
0.031(0.023)
Mediator:
Social spending/capita (US$, Ln) -7.358***(0.572)
Universalism index -0.761***(0.091)
De-trended universalism index -0.766***(0.091)
Government revenue (% GDP) 0.217***(0.075)
N 678 887 887 805R2 0.653 0.522 0.522 0.495ACME -18.181*** -40.944*** -15.411*** -75.141***Direct Effect 11.759*** -25.809*** -29.281*** -57.059***Total Effect -6.422*** -66.754*** -44.692*** -132.200***Total Effect Mediated 2.831*** 0.613*** 0.345*** 0.568***
Notes: Dependent variable is share of population living below $1.90/day (2011 PPP-adjusted US$). Estimates are from linear equations, with robust standard errors in parentheses. Mediating variables for the causal effect of middle class on poverty are estimated using the non-parametric procedures described in Imai, et al. (2010). P values for mediating effects are derived from 95 percent confidence intervals based on non-parametric bootstrapped errors with 1,000 resamples. Intercepts are estimated but not reported. * p < 0.10; ** p < 0.05; *** p < 0.01.
Table 2. Poverty and the Middle Class, Causal Mediation Analysis

IS A GROWING MIDDLE CLASS GOOD FOR THE POOR? 15
and explain less than one-tenth of one percent of the
total middle-class effect.
In Table 3 we examine mediating effects by sub-sam-
ple, spl i t t ing the sample between OECD and
non-OECD countries, and by democracies and autoc-
racies. We focus on social spending and universalism.9
The causal mediated effects for both are the largest in
non-OECD countries and in non-democracies. Over
60 percent of the effect of middle-class size on poverty
reduction is mediated in later-industrializing nations,
while 57 percent of the effect is mediated through so-
cial spending in non-democratic states.
(1) (2) (3) (4) (5) (6) (7) (8)O
ECD
Non
-OEC
D
Dem
ocra
cy
Aut
ocra
cy
OEC
D
Non
-OEC
D
Dem
ocra
cy
Aut
ocra
cy
Middle-class size
0.118**(0.049)
-0.258***(0.073)
-0.293***(0.039)
-0.571***(0.128)
-0.124(0.102)
-0.756***(0.060)
-0.506***(0.038)
-1.164***(0.089)
Polity score-0.433***(0.157)
-0.135(0.169)
-0.084(0.186)
-0.094(0.334)
-0.468*(0.280)
-0.094(0.147)
0.425**(0.195)
-0.816***(0.235)
Ethnic fractionalization
-10.514***(2.706)
17.897***(4.126)
13.543***(2.792)
8.300*(4.896)
-14.656**(6.348)
11.187***(3.328)
17.032***(3.447)
10.655***(3.554)
Trade (% GDP)0.004
(0.018)-0.092*(0.048)
0.018(0.024)
-0.290***(0.057)
-0.081**(0.039)
-0.225***(0.040)
-0.042(0.031)
-0.262***(0.043)
GDP/capita (US$, Ln)
6.074(6.726)
-6.531(6.029)
-17.183***(5.198)
-14.383*(7.512)
-6.951(14.866)
-28.294***(5.593)
-26.625***(5.890)
-32.394***(6.547)
Trend -0.021(0.042)
0.119(0.073)
0.229***(0.034)
-0.381***(0.112)
-0.212**(0.095)
-0.037(0.037)
0.200***(0.031)
0.062*(0.036)
Mediator:
Social spending/capita(US$, Ln)
-5.467***(0.526)
-8.285***(0.928)
-4.442***(0.585)
-10.812***(1.159)
Universalism index
-0.231(0.150)
-0.888***(0.124)
-0.538***(0.089)
-1.096***(0.151)
N 302 376 417 211 136 621 400 487
R2 0.689 0.626 0.621 0.655 0.608 0.508 0.599 0.486
ACME -18.181*** -40.944*** -15.411*** -75.141*** 2.061 -18.111*** -6.661*** -24.999***
Direct Effect 11.759*** -25.809*** -29.281*** -57.059*** -12.408 -75.628*** -50.588*** -116.373***
Total Effect -6.422 -66.754*** -44.692*** -132.2*** -10.347 -93.739*** -57.249*** -141.372***
Total Effect Mediated
2.831 0.613*** 0.345*** 0.568*** -0.199 0.193*** 0.116*** 0.177***
Notes: Dependent variable is share of population living below $1.90/day (2011 PPP-adjusted US$). Estimates are from linear equations, with robust standard errors in parentheses. Mediating variables for the causal effect of middle class on poverty are estimated using the non-parametric procedures described in Imai, et al. (2010). P values for mediating effects are derived from 95 percent confidence intervals based on non-parametric bootstrapped errors with 1,000 resamples. Intercepts are estimated but not reported. * p < 0.10; ** p < 0.05; *** p < 0.01.
Table 3. Poverty and the Middle Class, Causal Mediation Analysis by Sub-Sample
16 GLOBAL ECONOMY AND DEVELOPMENT PROGRAM
Sensitivity Analysis
These findings, as indicated, are meant to be suggestive
of possible causal mechanisms rather than conclusive.
Sensitivity analysis probes the sequential ignorability
assumption, evaluates the validity of findings under
potential violation of the sequential ignorability rule, and
thus provides benchmarks for interpreting mediation re-
sults causally (Imai et al., 2011). Whenever the assump-
tion is not rejected, estimated mediation effects can be
interpreted as valid causal mediation effects. If media-
tion results are sensitive, they can change substantially
when the sequential ignorability assumption is violated.
The sensitivity parameter ρ (rho), measures the correla-
tion between the errors in the mediation model and the
error in the outcome model. This correlation arises if
unobserved confounders affect both mediator and out-
come variables, because these variables are part of the
two error terms. The sequential ignorability assumption
implies that ρ equals zero.
Figure 4 shows the sensitivity of the ACMEs to viola-
tions in sequential ignorability. The mediation effects
are plotted against deviations in the sensitivity param-
eter from zero. The dashed lines show the ACME as
estimated. Where the ACME = 0, if |ρ| is large, then
the implication is that some unobserved confounder is
biasing the ACME estimate. We see in all graphs, that
where ACME = 0, ρ is between 0.10 and 0.40—indi-
cating relatively good sensitivity to violations in critical
conditions for valid causality.
Determinants of Current Social Protection in Developing Countries
Our analyses indicate that social policy plays a criti-
cal role in the effect of middle-class size on poverty.
Our panel results combined with our causal-mediation
analysis, moreover, raises the question of whether
the types of social policies—and the specific social
program expenditures associated—are differentially
influenced by middle-class size. To what extent does
the expansion of the middle class benefit the poorest
in terms of social benefits? More importantly, to what
extent is the middle class capturing a greater share
of those benefits? To examine these effects more di-
rectly, we turn to an investigation of more recent social
protection measures in developing countries. From the
World Bank’s Atlas of Social Protection, we can esti-
mate the effects of middle-class size on the distribution
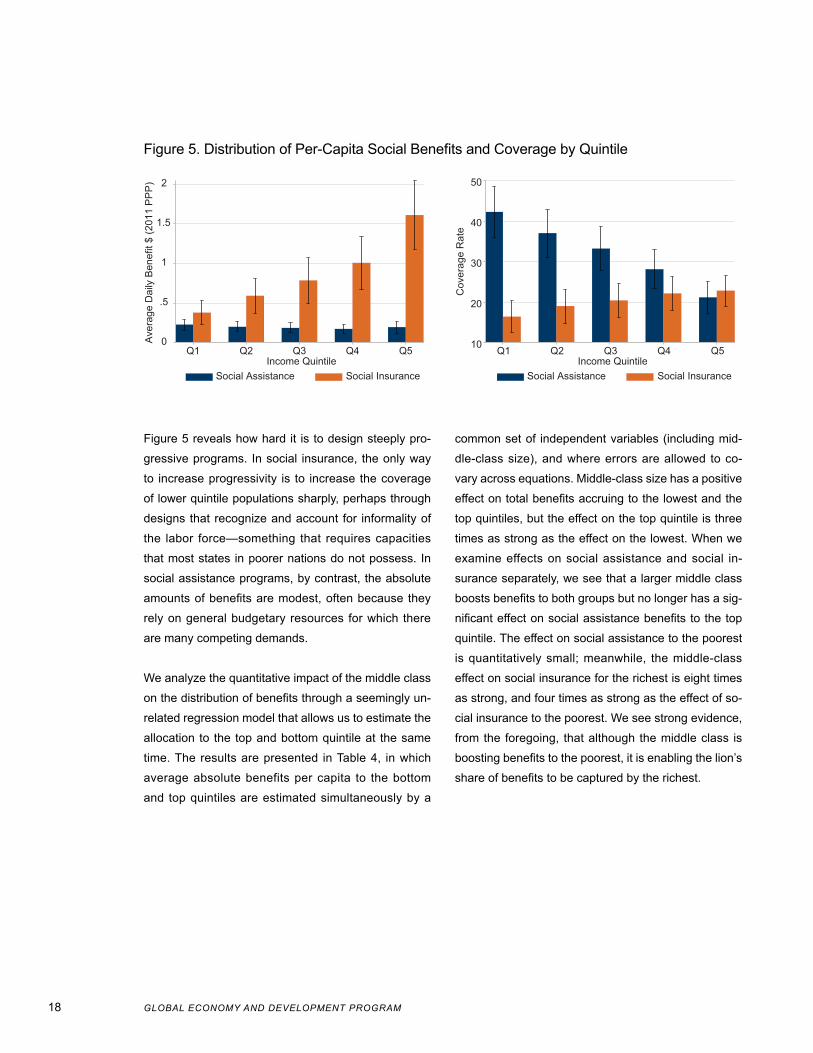
of the benefits of social protection by quintile. Figure 5
shows the distribution of benefits from two types of so-
cial programs, social “insurance,” covering programs
that minimize the negative impact of economic shocks,
and social “assistance,” or non-contributory transfers
in cash or in-kind that are usually targeted at the poor
and vulnerable.10 The top graph shows average ben-
efits per person by program and by quintile, while the
bottom graph shows coverage (as percent of the eligi-
ble population). The figure shows a sharp regressivity
of social insurance, by which the top quintile captures
three times the benefits going to the lowest quintile.
It also shows that social assistance is only mildly
progressive, despite the coverage ratios being more
so—with almost 45 percent of the bottom quintile being
covered by some form of social assistance.
These results are not unusual. The higher average
benefits that accrue from social insurance programs
to the top quintile reflects the basic design of such
programs to link benefits and contributions to income
levels. Thus, higher wage earners pay more into social
insurance schemes and correspondingly receive more.
Looking at the lower panel, it is also clear that social
assistance coverage declines with income, as is to be
expected.

IS A GROWING MIDDLE CLASS GOOD FOR THE POOR? 17
−1.0 −0.5 0.0 0.5 1.0
−2−1
01
Social Spending
Sensitivity Parameter: ρ
Aver
age
Med
iatio
n E
ffect
−1.0 −0.5 0.0 0.5 1.0−3
−10
12
3
Universalism
Sensitivity Parameter: ρ
Aver
age
Med
iatio
n E
ffect
−1.0 −0.5 0.0 0.5 1.0
−3−1
01
23
Universalism (Detrended)
Sensitivity Parameter: ρ
Aver
age
Med
iatio
n E
ffect
−1.0 −0.5 0.0 0.5 1.0
−2−1
01
2
Government Expenditures
Sensitivity Parameter: ρ
Aver
age
Med
iatio
n E
ffect
Notes: Graphs average causal mediation effect (ACME) plotted against sensitivity parameter ρ, which is the correlation between the error terms in the mediator and outcome regression equations, for different mediators. Dashed lines represent show the estimated ACME when the sequential ignorability assumption holds. The shaded region is the 95 percent confi-dence interval for each value of ρ.
Figure 4. Average Causal Mediation Effects, Sensitivity to Violation of Sequential Ignorability
18 GLOBAL ECONOMY AND DEVELOPMENT PROGRAM
Figure 5 reveals how hard it is to design steeply pro-
gressive programs. In social insurance, the only way
to increase progressivity is to increase the coverage
of lower quintile populations sharply, perhaps through
designs that recognize and account for informality of
the labor force—something that requires capacities
that most states in poorer nations do not possess. In
social assistance programs, by contrast, the absolute
amounts of benefits are modest, often because they
rely on general budgetary resources for which there
are many competing demands.
We analyze the quantitative impact of the middle class
on the distribution of benefits through a seemingly un-
related regression model that allows us to estimate the
allocation to the top and bottom quintile at the same
time. The results are presented in Table 4, in which
average absolute benefits per capita to the bottom
and top quintiles are estimated simultaneously by a
common set of independent variables (including mid-
dle-class size), and where errors are allowed to co-
vary across equations. Middle-class size has a positive
effect on total benefits accruing to the lowest and the
top quintiles, but the effect on the top quintile is three
times as strong as the effect on the lowest. When we
examine effects on social assistance and social in-
surance separately, we see that a larger middle class
boosts benefits to both groups but no longer has a sig-
nificant effect on social assistance benefits to the top
quintile. The effect on social assistance to the poorest
is quantitatively small; meanwhile, the middle-class
effect on social insurance for the richest is eight times
as strong, and four times as strong as the effect of so-
cial insurance to the poorest. We see strong evidence,
from the foregoing, that although the middle class is
boosting benefits to the poorest, it is enabling the lion’s
share of benefits to be captured by the richest.
0
.5
1
1.5
2
Ave
rage
Dai
ly B
enef
it $
(201
1 P
PP
)
Q1 Q2 Q3 Q4 Q5Income Quintile
Social Assistance Social Insurance
10
20
30
40
50
Cov
erag
e R
ate
Q1 Q2 Q3 Q4 Q5Income Quintile
Social Assistance Social Insurance
Figure 5. Distribution of Per-Capita Social Benefits and Coverage by Quintile

IS A GROWING MIDDLE CLASS GOOD FOR THE POOR? 19
Total Benefits Social Assistance Social Insurance (1) (2) (3) (4) (5) (6)
Dependent variables: Bottom quintile
Top quintile
Bottom quintile
Top quintile
Bottom quintile
Top quintile
Middle-class headcount 0.014***(0.004)
0.037***(0.010)
0.004***(0.002)
0.001(0.002)
0.008***(0.003)
0.032***(0.011)
Polity score 0.027**(0.012)
0.051(0.031)
0.017***(0.005)
0.010(0.006)
0.017*(0.010)
0.055(0.034)
Ethnic fractionalization -0.115(0.241)
-0.033(0.643)
-0.022(0.098)
-0.113(0.120)
-0.099(0.200)
0.018(0.706)
Trade (% GDP) 0.008***(0.003)
-0.002(0.007)
0.003***(0.001)
0.002(0.001)
0.004**(0.002)
-0.005(0.007)
GDP per capita (Ln) -0.064(0.108)
0.162(0.290)
0.062(0.049)
0.107*(0.059)
-0.075(0.089)
0.189(0.315)
N 121 121 107 107 112 112n 78 78 69 69 74 74R2 0.657 0.565 0.556 0.245 0.629 0.533Region-fixed effects yes yes yes yes yes yes
Notes: Dependent variables are average benefits per person for the bottom quintile and for the top quintile by country (in 2011 PPP-adjusted US dollars), estimated with seemingly unrelated regressions, with standard errors in parentheses. Intercepts are estimated but not reported. * p < 0.10; ** p < 0.05; *** p < 0.01.
Table 4. Benefits per Capita, Seemingly Unrelated Regressions
20 GLOBAL ECONOMY AND DEVELOPMENT PROGRAM
CONCLUSION
Today’s developing countries have a higher inci-
dence of extreme poverty than advanced econ-
omies did at equivalent income levels. The formation
of welfare states in advanced, industrialized econo-
mies highlights the pivotal role of the growing middle
class, following industrialization, in forming coalitions
with the working poor to secure social benefits—the
so-called “red-white” alliance. We examined the effect
of middle-class size and social spending on poverty
rates across richer and poorer countries, using data
covering almost a century and a half. Our results show
a strong, significant, and negative combined effect of
middle-class size and social spending on poverty when
controlling for average wealth and other country-spe-
cific factors. This effect, however, is diminishing in mid-
dle-class size; the larger the middle class, the smaller
is the impact of social spending on reducing poverty.
Causal-mediation analysis confirms that the middle
class has both a direct and indirect effect on reduc-
ing poverty, the latter being mediated through social
spending. About half the impact of the middle class on
poverty takes place because the middle class affects
the size and composition of social programs. Given the
inherent difficulties in identifying mediation channels in
observational studies, we undertake a number of ro-
bustness checks that yield similar results.
An examination of the history of the red-white alliance,
moreover, suggests that there is an inherent tension.
A larger middle class supports more social spending,
but it is also more likely to demand programs in which
they benefit most. As the middle class grows, the mix
of social programs shifts toward those whose benefits
mostly accrue to the highest quintile (where most of
the middle class in developing countries reside). Our
results from estimates of the different components of
social protection in today’s lower- and middle-income
countries confirms this expectation. We find that a
growing middle class expands transfers to the poor,
but the benefits in terms of social insurance—which
disproportionately benefit the upper quintiles in which
the middle class in developing countries resides—in-
creases three times as fast. Coverage of social assis-
tance is progressive, but absolute amounts devoted to
these programs are small and the incidence of benefits
is neutral—similar absolute amounts accrue, on aver-
age, to people regardless of their place in the income
distribution. By contrast, larger amounts are spent on
social insurance, but the incidence of benefits is highly
regressive. The role of the middle class is found to be
significant in these trends.
Our findings carry implications for the recent debate
on the merits of targeting in anti-poverty programs
versus a universal approach. Targeted programs have
detractors. Identifying precisely who is and is not poor
remains complicated due to unreliable data, imper-
fect information, and a lack of fiscal capacity in poor
countries (Brown, Ravallion, and van de Walle 2016;
Jhabvala and Standing 2010; Mkandawire 2005).
Others have pointed out the ability of politicians to
convert targeted programs into instruments of patron-
age (Schady 2000; Chisala and Hempill 2014). On the
other hand, universal programs are far more costly, al-
though advocates of a universal or basic income guar-
antee argue that a fixed transfer to all adult citizens
regardless of income can entail lower administrative
costs while avoiding some of the distortions in incen-
tives associated with targeted transfers (Ravallion
2016).11
Our results suggest that historically middle-class sup-
port is necessary for poverty reduction but limits the
progressivity of such programs. New technologies,
like cash transfers through mobile money, with very

IS A GROWING MIDDLE CLASS GOOD FOR THE POOR? 21
low administrative costs could offer the possibility for
breakthroughs in social assistance but they will have to
be properly “marketed” to the middle class to counter-
act the often-widespread belief that poor households
will misuse income transfers, and that welfare creates
dependency (Harvey, 2007; Holmes and Jackson,
2007). Indeed, this was one of the great achievements
of conditional cash transfers. But there may be limits
to such an approach. In many low- and middle-income
countries, the growing middle class has little stake
in a system of social assistance from which they are
excluded (Subramanian 2013). In these countries, the
middle classes send their children to private schools,
use private healthcare, dig their own boreholes for
water, and buy their own generators. That degree of
middle-class exit means there are few demands by
the middle classes to improve the public provision of
services. In these cases, moving toward a universal
system in which the middle class have a stake can
potentially rebuild the “red-white,” cross-class alli-
ances. “Universalizing” social insurance by, for exam-
ple, changing eligibility rules in order to cover a larger
proportion of those in the lower quintiles and ensuring
that design includes the self-employed and those in the
informal sector, could simultaneously secure critical
middle-class support while providing greater gains for
the poorest.
These two ideas—building support for a larger volume
of social assistance and redesigning social insurance
to reduce the degree of regressivity—have the poten-
tial to reduce extreme poverty sharply and sustainably
if presented as a package that benefits both parts of
the “red-white” alliance.

22 GLOBAL ECONOMY AND DEVELOPMENT PROGRAM
ENDNOTES
1. This is to be expected, as contributions are also disproportionately made by the richest quintile.
2. In France, in contrast to the German case, the middle classes were more radicalized, and “white-collar unionism” was more widespread. According to Suh: middle-class shopkeepers participated in the founding of the Confédéra-cion Générale du Travail (CGT), traditionally under strong communist influence; postal work-ers played an important role in the public-sector labor movement; white-collar workers participat-ed in one of the first post-World War I general strikes; and even bank workers became union-ized after 1919 (Suh 2002).
3. “Nonstandard jobs” refer to jobs that tend to be temporary, time-limited contracts, often part-time, and offer limited job protections, such as from dismissal.
4. Note that income/consumption range is based on 2005 PPP adjustments. Under 2011 PPP ad-justments, the gap is actually $11 to $110 per day.
5. Table 1 presents results using 5-year aver-ages constructed from country-year incomes that are interpolated between years for which Bourguignon-Morrison data exist, and between survey years since 1980. All results in Table 1 are robust to the exclusion of interpolated coun-try-years.
6. To avoid over-fitting by having too many instru-ments, we limit lags of potentially endogenous variables to two.
7. In order to claim mediation, the treatment should precede and be significantly related to the out-come and the mediator in the first two regres-sions. In the third regression, the treatment and the mediator precede the outcome, the mediator is significantly related to the outcome, and the effect of the treatment has reduced or disap-peared compared to the first regression. Indirect
or mediation effects are captured by this reduc-tion. Direct effects are treatment effects in the third regression.
8. We note that the effect of universalism on pov-erty is negative, implying that targeting does not necessarily yield stronger effects on poverty re-duction. Although countries at the lower end of the scale may have weak or non-existent social protection of any kind, the higher end of the uni-versal welfare index implies a lack of targeting via means-testing or group-identity (Rasmussen 2016).
9. We refer to the advanced, industrialized OECD members, i.e., excluding middle-income coun-tries, countries that industrialized in the latter half of the 20th century (e.g., Israel and Korea), and the Eastern European states: Australia, Austria, Belgium, Canada, Denmark, Finland, France, Germany, Greece, Iceland, Ireland, Ita-ly, Japan, Luxembourg, Netherlands, New Zea-land, Norway, Poland, Portugal, Spain, Sweden, Switzerland, the United Kingdom, and the Unit-ed States.
10. Social insurance includes publicly provided or mandated insurance schemes against old age, disability, death of the main household provider, maternity leave and sickness cash benefits, and social-health insurance. Social insurance pro-grams are contributory and beneficiaries receive benefits or services in recognition of contribu-tions to an insurance scheme.
11. A claim made by those recently proposing a uni-versal basic income (UBI) scheme for India is that it will actually be more pro-poor than the ex-isting collection of “leaky,” targeted anti-poverty programs. If the UBI replaces a series of poorly targeted subsidies, it can also remain budget neutral (Government of India 2017: 189-190).

IS A GROWING MIDDLE CLASS GOOD FOR THE POOR? 23
REFERENCES
Acemoglu, D. and J. A. Robinson (2005). Economic
Origins of Dictatorship and Democracy. New York,
NY, Cambridge University Press.
Alesina, A., et al. (2003). “Fractionalization.” Journal of
Economic Growth 8(2): 155–194.
Arellano, M. and O. Bover (1995). “Another Look at
the Instrumental Variable Estimation of Error-
Components Models” Journal of Econometrics
68(1): 29-51.
Auer, P. (2006). “Protected Mobility for Employment
and Decent Work: Labour Market Security in a
Globalized World.” Journal of Industrial Relations
48: 21-40.
Baldwin, P. (1990). The Politics of Social Solidarity:
Class Bases of the European Welfare State, 1875-
1975. Cambridge University Press.
Barrientos, A. (2013). “Inequality, Poverty, and
Antipoverty Transfers.” Background Research
Paper Series No. 3. High Level Panel on the Post-
2015 Development Agenda.
Beck, N. and J. N. Katz (1995). “What To Do (and Not
To Do) with Time-Series Cross-Section Data.” The
American Political Science Review 83(3): 634-647.
Bellin, E. R. (2000). “Contingent Democrats: Industrialists,
Labor, and Democratization in Late-Developing
Countries.” World Politics 52(2) : 175-205.
Berliner, D., et al. (2015). Labor Standards in
International Supply Chains: Aligning Rights and
Incentives. Cheltenham, Edward Elgar Publishing.
Besley, T. and R. Kanbur (1990). “The Principles of
Targeting.” Policy Research Working Paper Series
No. 385. World Bank.
Blackbourn, D. and R. J. Evans (1991). The German
Bourgeoisie: Essays on the Social History of the
German Middle Class from the Late Eighteenth to
the Early Twentieth Century. London, Routledge.
Blundell, R. and S. Bond (1998). “Initial Conditions
and Moment Restrictions in Dynamic Panel Data
Models.” Journal of Econometrics 87(1): 115-143.
Boix, C. (2003). Democracy and Redistribution. New
York, NY, Cambridge University Press.
Bolt, J. and J. L. van Zanden (2014). “The Maddison
Project: Collaborative Research On Historical
National Accounts.” Economic History Review
67(3): 627-651.
Bourguignon, F. and C. Morrisson (2002). “Inequality
Among World Citizens: 1820-1992.” American
Economic Review 92(4): 727-744.
Brown, C., et al. (2016). “A Poor Means Test?
Econometric Targeting in Africa.” NBER Working
Paper No. 22919. National Bureau of Economic
Research.
Burrows, M. (2015). “The Emerging Global Middle
Class - So What?” Washington Quarterly 38(1):
7-22.
Calvo-González, O., et al. (2017). “How is the
Slowdown Affecting Households in Latin America
and the Caribbean?” Policy Research Working
Paper No. 7948. World Bank.

24 GLOBAL ECONOMY AND DEVELOPMENT PROGRAM
Carpenter, W. (1831). An Address to the Working
Classes on the Reform Bill. London, Strange.
Chandy, L. (2015). “Why is the Number of Poor People
in Africa Increasing when Africa’s Economies are
Growing?” Africa in Focus Blog, The Brookings
Institution.
Chisala, T. and C. Hemphill (2014). “The Political
Challenges of Targeting the Poor” in Frontiers in
Development. Washington, D.C., USAID.
Dangerfield, G. (1935). The Strange Death of Liberal
England. New York, Harrison Smith & Robert
Haas.
Datt, G. (1998). “Computational Tools for Poverty
Measurement and Analysis.” FCND Discussion
Paper No. 50. International Food Policy Research
Institute.
Easter ly, W. (2007). “ Inequal i ty Does Cause
Underdevelopment: Ins ights f rom a New
Instrument “ Journal of Development Economics
84(2): 755–776.
Easterly, W. and R. Levine (1997). “Africa’s Growth
Tragedy: Policies and Ethnic Divisions.” The
Quarterly Journal of Economics 112(4): 1203-1250.
Esping-Andersen, G. (1990). The Three Worlds of
Welfare Capitalism, Princeton, NJ, Princeton
University Press.
Esping-Andersen, G. and W. Korpi (1985). “Social
Policy as Class Politics in Post-War Capitalism:
Scandinavia, Austria, Germany” in Order and
Conflict in Contemporary Capitalism. J. Goldthorpe,
ed. Oxford, Oxford University Press: 179-208.
Ferreira, F. H. G., et al. (2015). “A Global Count of the
Extreme Poor in 2012 : Data Issues, Methodology
and Initial Results.” World Bank Policy Research
Working Paper No. 7432. World Bank.
Ferreira, F. H. G., et al. (2013). Economic Mobility
and the Rise of the Latin American Middle Class.
Washington, DC, World Bank.
Fiszbein, A., et al. (2014). “Social Protection and
Poverty Reduction: Global Patterns and Some
Targets.” World Development 61: 167-177.
Gelbach, J. B. and L. Pritchett (2002). “Is More for the
Poor Less for the Poor? The Politics of Means-
Tested Targeting.” BEP Topics in Economic
Analysis and Policy 2(1): 1-25.
Government of India (2017). “Universal Basic Income:
A Conversation With and Within the Mahatma” in
Economic Survey 2016-2017, New Delhi, Ministry
of Finance.
Harvey, P. (2007). “Cash-Based Responses in
Emergencies.” Humanitarian Policy Group
Briefing Paper No. 25. London, Overseas
Development Institute.
Hay, J. R. (1975). The Origins of the Liberal Welfare
Reforms, 1906-1914. London, Macmillan Publishers.
Holborn, H. (1969). A History of Modern Germany, 1840–
1945. Princeton, NJ, Princeton University Press.
Holmes, R. and A. Jackson (2007). “The Institutional
R o o t s o f P o p u l a r M o b i l i z a t i o n : S t a t e
Transformation and Rural Politics in Brazil and
Chile, 1960–1995.” Comparative Studies in
Society and History 42(2): 394-424.

IS A GROWING MIDDLE CLASS GOOD FOR THE POOR? 25
Houle, C. (2009). “Inequality and Democracy: Why
Inequality Harms Consolidation but Does Not Affect
Democratization.” World Politics 61(4): 589-622.
Imai, K., et al. (2011). “Unpacking the Black Box of
Causality: Learning about Causal Mechanisms
from Experimental and Observational Studies.”
American Political Science Review 105(4): 765-
789.
Imai, K., et al. (2010). “Identification, Inference and
Sensitivity Analysis for Causal Mediation Effects.”
Statistical Science 25(1): 51–71.
International Labor Organization (2014). World Social
Protection Report 2014/15: Building economic re-
covery, inclusive development and social justice.
Geneva, ILO.
Kharas, H. (2017). “The Unprecedented Expansion
of the Global Middle Class: An Update.” Global
Economy and Development Working Paper No.
100. The Brookings Institution.
Knutsen, C. H. and M. Rasmussen (2017). “The
Autocratic Welfare State: Old-Age Pensions,
Credible Commitments, and Regime Survival.”
Comparative Pol i t ical Studies onl ine ver-
sion available at http://journals.sagepub.com/
doi/10.1177/0010414017710265.
Kochhar, R., R. Fry and M. Rohal (2015). The
American Middle Class Is Losing Ground: No lon-
ger the Majority and Falling Behind Financially.
Washington, D.C., Pew Research Center.
Kochhar, R. and R. Oates (2015). A Global Middle
Class Is More Promise than Reality. Washington,
DC, Pew Research Center.
Lang, S. (1999). Parliamentary Reform, 1785-1928.
London, Routledge.
Lindert, P. (2004). Growing Public: Social Spending
and Economic Growth Since the Eighteenth
Century. New York, NY, Cambridge University
Press.
Lopez-Calva, L. F. and E. Ortiz-Juarez (2011). “A
Vulnerability Approach to the Definition of the
Middle Class.” Policy Research Working Paper
No. 5902. World Bank.
Lustig, N., et al. (2011). “The Impact of Taxes and
Social Spending on Inequality and Poverty in
Argentina, Bolivia, Brazil, Mexico, and Peru: A
Synthesis of Results “ CGD Working Paper Series
No. 311. Center for Global Development.
Mares, I. (2003). The Politics of Social Risk: Business
and Welfare State Development. New York,
Cambridge University Press.
Mares, I. (2005). “Social Protection Around the World:
External Insecurity, State Capacity, and Domestic
Political Cleavages.” Comparative Political
Studies 38(6): 623-651
Milanovic, B. and S. Yitzhaki (2002). “Decomposing
World Income Distribution: Does the World Have
a Middle Class?” Review of Income and Wealth
48(2): 155-178
Mkandawire, T. (2005). “Targeting and Universalism
in Poverty Reduct ion.” Social Pol icy and
Development Programme Papers No. 23.
United Nations Research Institute for Social
Development.

26 GLOBAL ECONOMY AND DEVELOPMENT PROGRAM
Moore, B. (1966). Social Origins of Dictatorship and
Democracy: Lord and Peasant in the Making of
the Modern World. Boston, Beacon Press.
Pelling, H. (1963). History of British Trade Unionism.
London, Palgrave Macmillan UK.
Pempel, T. J. (1998). Regime Shift: Comparative
Dynamics of the Japanese Political Economy.
Ithaca, NY, Cornell University Press.
Ravallion, M. (2013). “The Idea of Antipoverty Policy.”
NBER Working Paper No. 19210. National Bureau
of Economic Research.
Rodrik, D. (1999). “Globalisation and Labour, or If
Globalisation is a Bowl Of Cherries, Why Are There
So Many Glum Faces Around the Table?” in Market
Integration, Regionalism and the Global Economy.
R. Baldwin, D. Cohen, A. Sapir and A. Venables,
eds. New York, Cambridge University Press.
Roodman, D. (2006). “How To Do XTABOND2: An
Introduction to Difference and System GMM in
Stata.” Stata Journal 9(1): 86-136.
Rudra, N. (2002). “Globalization and the Decline of
the Welfare State in Less-Developed Countries.”
International Organization 56(2): 411-445.
Rudra, N. (2008). Globalization and the Race to the
Bottom in Developing Countries. New York, NY,
Cambridge University Press.
Schady, N. R. (2000). “The Political Economy of
Expenditures by the Peruvian Social Fund
(FONCODES), 1991–95.” American Political
Science Review 94(2): 289-304.
Spohn, W. (1991). “Religion and Working-Class
Formation in Imperial Germany 1871-1914.”
Politics & Society 19(1): 109-132.
Standing, G. and R. Jhabvala (2010). “Targeting to the
‘Poor’: Clogged Pipes and Bureaucratic Blinkers.”
Economic & Political Weekly 45: 26-27.
Subramanian, A. (2013). “The Economic Consequences
of Professor Amartya Sen: Redistributive Policies
via Rights and Entitlements are Ultimately Self-
Defeating.” Business Standard, July 9.
Suh, D. (2002). “Middle-Class Formation and Class
Alliance.” Social Science History 26(1): 105-137.
Thompson, E. P. (1963). The Making of the English
Working Class. London, Victor Gollancz Ltd.
Vanhanen, T. (1997). Prospects of Democracy.
London, Routledge.
Vanhanen, T. (2003). Democratization: A Comparative
Analysis of 170 Countries. London, Routledge.
Zeytinoglu, I. U. and J. K. Muteshi (2000). “Gender,
Race and Class Dimensions of Non-Standard
Work.” Industrial Relations 55(1): 133-167.

IS A GROWING MIDDLE CLASS GOOD FOR THE POOR? 27
APPENDIX
This paper is built upon a database of coun-
try-by-country estimations of the poor and the
middle class that was formed as described below. For
each country, data on the income distribution, mean
household expenditure, and population are needed.
The dataset covers all countries and territories (like
Kosovo and the West Bank and Gaza) for which these
variables were found. This covers 165 countries, rep-
resenting 98 percent of the world’s population in 2015,
96 percent of the world’s GDP, and 97 percent of total
world household expenditure.1
We assign countries to standard geographic groupings.
Several clarifications: we assign Russia to Europe due
to its population center lying much closer to Europe
than Asia, Iran to the Middle East and North Africa,
Australia and New Zealand to Asia Pacific, and Turkey
to Europe in line with World Bank country groupings.
Our source for historical income distributions is
Bourguignon Morrison 2002, who provide nearly
global coverage from 1820 through 1990. From 1990
onwards, we use distributional data from the house-
hold surveys included in the World Bank’s PovCalNet
database. We supplement this in the case of four
countries (New Zealand, South Korea, Zimbabwe,
Myanmar) with household survey information available
through the United Nations University World Institute
for Development Economics Research (UNU-WIDER)
1 The following countries with a population greater than 1 million that are excluded from this study either because of an absence of survey data or household expenditure information, or both: Bahrain, Cuba, Eritrea, North Korea, Kuwait, Lebanon, Libya, Oman, Qatar, Saudi Arabia, Singapore, Somalia, Syria, and the United Arab Emirates.
2 For countries with missing values for the mean, we use alternate sources. For Kiribati and Micronesia, we use current house-hold final consumption expenditure in current LCU and then use the country-specific PPP conversion factor. For Papua New Guinea and Solomon Islands, we use the current Household Final Consumption Expenditure, PPP series and deflate to 2011 dollars. We use the survey mean in the case of Samoa, Marshall Islands, and Tuvalu.
World Income Inequality Database (WIID). We use dis-
tributional data from household consumption surveys if
available and household income surveys otherwise. In
between years in which distributional data is available,
we assume distributionally-neutral growth.
When calculating the size of the middle class, we
use household expenditure data that is derived from
national accounts. Our primary source of data from
1990 to 2015 is household expenditure in 2011 PPP
terms taken from the World Bank’s World Development
Indicators database. We use GDP data from The
Maddison Project Database as a guide to determine
household expenditure in 2011 PPP from 1820 to 1990
(Bolt and van Zanden 2014). Assuming that house-
hold expenditures and GDP grow at the same rate, we
apply the GDP growth rate to the earliest household
expenditure data available in WDI to estimate histor-
ical household expenditures. These values, divided
by population, are used as the mean consumption
level in each country.2 Use of national-accounts based
household expenditure mean values helps overcome
two problems. It imposes consistency across countries
with household income surveys and those with house-
hold expenditure surveys. It also is one mechanism to
distribute all sources of income to households within
a country, thereby correcting for cross-country differ-
ences in the coverage of surveys, for example in the
treatment of imputed housing services or self-employ-
ment income. This method is similar to that used by
Pinkovskiy and Sala-i-Martin (2016).

28 GLOBAL ECONOMY AND DEVELOPMENT PROGRAM
When calculating the number of people in extreme
poverty, we use household expenditure means derived
from household surveys instead of from national ac-
counts. National accounts tend to record higher con-
sumption than surveys, a pattern that is due in large
part to consumption by wealthier households that are
not captured by surveys.3 When the focus is on the
upper end of the distribution, as when calculating the
size of the middle class, it is preferable to use national
account means because to do otherwise could re-
sult in significant amounts of household consumption
being excluded from the analysis. However, surveys
do effectively capture the bottom of the distribution,
and survey non-response has little impact on poverty
estimates (see for example Korinek, Mistiaen, and
Ravallion 2006). We therefore use survey means in-
stead of national account means to estimate poverty.
This follows the World Bank’s method for computing
global poverty aggregates, which uses exclusively
survey means (Ferreira et al 2015). As with the distri-
butional data, we use household consumption surveys
if available. In years in which data is not available, we
impute household expenditures in 2011 PPP based
on the growth rate of GDP, as described above.
Population from 1980 to 2015, finally, is taken from
United Nations Population Division, while earlier popu-
lation data is from The Maddison Project.
Computing Breakdown of Household Expenditure
We use a beta Lorenz specification using the cu-
mulative percent of population and of income from
household surveys to estimate the full distribution of
all households in each country. For estimation of distri-
3 See Deaton (2005) for an overview of the survey-national accounts discrepancy, and Bricker et al. (2016) for empirical evidence of missing top incomes in the United States.
butional parameters and beta-Lorenz functional forms,
see Datt (1998). The most common alternative, the
general quadratic specification, returned occasional
negative values of people living below some thresh-
olds and so was rejected as an alternative. For each
beta Lorenz curve, the survey mean was replaced by
household expenditure per capita data drawn from the
national accounts.
The latest household survey is used for each country
in projections.
Once the distributions are known, it is possible to com-
pute the percent of the population below any given
threshold of expenditure using the following formula:
ΘHCRz (1–HCRz)δ [ ] = 1 – μ
γ zHCRz
YHCRz
δ– (1)
Where z corresponds to the thresholds ($1.90 a day for
the extreme poor, and $11 to $110 a day for the middle
class in constant 2011 PPP-adjusted dollars), µ corre-
sponds to the mean consumption per capita for a given
country in a given year, and Θ, γ, and δ are parameters
calculated from the cumulative percent of population
and income of household surveys. See Datt (1998) for
further explanation.
The headcount rate calculated based on z = 1.90 tells
us directly the percent of the population living in ex-
treme poverty. To find the percent of the population
in the middle class, we subtract the percent living be-
neath the $11 threshold from the percent living beneath
the $110 threshold.

REFERENCES
Bolt, J. and J. L. van Zanden (2014). “The Maddison
Project: Collaborative Research on Historical
National Accounts.” Economic History Review
67 (3): 627–651.
Bourguignon, F. and C. Morrisson (2002). “Inequality
Among World Citizens: 1820-1992.” American
Economic Review 92(4): 727-744.
Bricker, J. , A. Henriques, J. Krimmel, and J.
Sabelhaus (2016). “Measuring Income and
Wealth at the Top Using Administrative and
Survey Data.” Brookings Papers on Economic
Activity 2016(1): 261-331.
Datt, G. (1998). “Computational Tools For Poverty
Measurement and Analysis.” FCND Discussion
Paper 50, International Food Policy Research
Institute, Washington, DC.
Deaton, A. (2005). “Measuring Poverty in a Growing
World (or Measuring Growth in a Poor World).”
Review of Economics and Statistics 87(1): 1-19.
Korinek, A., J. A. Mistiaen, and M. Ravallion (2006).
Survey Nonresponse and the Distribution of
Income. Journal of Economic Inequality 4(1):
33-55.
Pinkovskiy, M., and X. Sala-i-Martin (2016). “Lights,
Camera… Income! Illuminating the National
Accoun ts -Househo ld Su rveys Deba te . ”
Quarterly Journal of Economics 131(2): 579-
631.

The views expressed in this working paper do not necessarily
reflect the official position of Brookings, its board or the advisory
council members.
© 2017 The Brookings Institution
1775 Massachusetts Avenue, NW Washington, DC 20036 202-797-6000 www.brookings.edu/global