Embed Size (px)
DESCRIPTION
Irrigation Policies for peanut production
Citation preview

AGRICULTURAL EXPERIMENT STATION / AUBURN UNIVERSITYR. DENNIS ROUSE, Director AUBURN, ALABAMA
+Y ~ ~ ~ ~ ~ ~ r °' {7A .. u;.
CIRCULAR 241AUGUST 1978
* A ~ 4A~x. >~
'4 -
At
-'-4A,-A
44~-- ~--- A4'r,- ~.
a
4At
V "' s- w
a ' 'M ,.# wa i' ,'ar _.
rMMl.x -a-a

CONTENT S
Page
INTRODUCTION. .......................................... 3
EXPERIMENTAL PROCEDURE...................................5
RESULTS.................................................... 7
Soil Moisture...................................... 8
Yield ............................................ 12
SUMMARY AND CONCLUSIONS.................................. 13
ACKNOWLEDGMENT.......................................... 15
LITERATURE CITED.......................................... 15
FIRST PRINTING 3M, AUGUST 1978
Information contained herein is available to all persons without regard torace, color, or national origin.

Irrigotion Policies For Peanut Production
E. W. ROCHESTER, P. A. BACKMAN, S. C. YOUNG, and J. M. HAMMOND*
INTRODUCTION
PEANUT IRRIGATION in the Southeast is rapidly becoming acommon practice as growers seek to boost yields. Equipmentwith low labor requirements, such as the center pivot andcable tow traveler, as well as recent droughts, have acceler-ated interest in irrigation in Alabama where peanuts are tradi-tionally a big money crop. Farmers in Alabama sold 583 mil-lion pounds of peanuts for $122 million in 1977. Productionincreases, due in part to irrigation and improved managementpractices, are predicted to increase sales to 750 million poundsby 1980 (1).
Efficient use of irrigation for increased peanut yield andquality in the normally humid Southeast requires proper irri-gation timing as well as effective soil moisture policies. Inrelated research, Stansell et al. (7) noted that irrigation in-creased the quality and yield of peanuts in Georgia. Theypresented data, figure 1, relating water use of Florunnerpeanuts to plant age when grown under optimum soil waterconditions. Optimum soil water conditions were defined aswetting the top 24 inches of the soil profile to field capacitywhen the average water tension in the top 12 inches of theprofile reached 20 centibars. Figure 1 shows that the waterdemand starts low, increases to a maximum value at aboutmidseason, and then decreases gradually. Stansell et al. alsofound that plants were able to extract water from depths
*Associate Professor, Department of Agricultural Engineering; Associate Professor,Department of Botany and Microbiology; Research Associate, Department of Agricul-tural Engineering; and Research Associate, Department of Botany and Microbiology.

Water useper day, inches
0.25
0.20
0.15
0.10
0.05
0 I I I I I
0 20 40 60 80 00 120 140 160
Age (days)
FIG. 1. Estimated daily water use by Florunner peanuts (from Stansell, J.R. et al.) (7).
greater than 24 inches after about 75 days of age. They con-eluded that the ability of peanuts to utilize water at suchdepths explains, to some extent, their ability to withstandextended drought stress. Water extraction to a depth of 42inches was recorded for Florigiant, Florunner, and Tifspanpeanuts; however, the authors state that restrictive zones,either mechanical or chemical, may prevent deep profilewater extraction.
In addition to determining water needs of the peanut plant,there have been efforts to identify periods in the plant's devel-opment which are more susceptible to stress. This follows thewidely accepted principle that most nonforage crops are moresensitive to water deficits at certain growth stages than atothers (3,5,6). Hiler and Clark (4) developed a "stress dayindex method" to account for these differences in a quantita-tive manner. This method uses a stress day factor and a cropsusceptibility factor to arrive at a plant's stress index. Sixstages of growth for the peanut plant were identified andsusceptibility factors were assigned to each stage. This dimen-sionless factor indicates the susceptibility of the plant to givenmagnitudes of stress. The larger the crop susceptibility factor,the more susceptible the plant is to drought stress. The stages
[4]
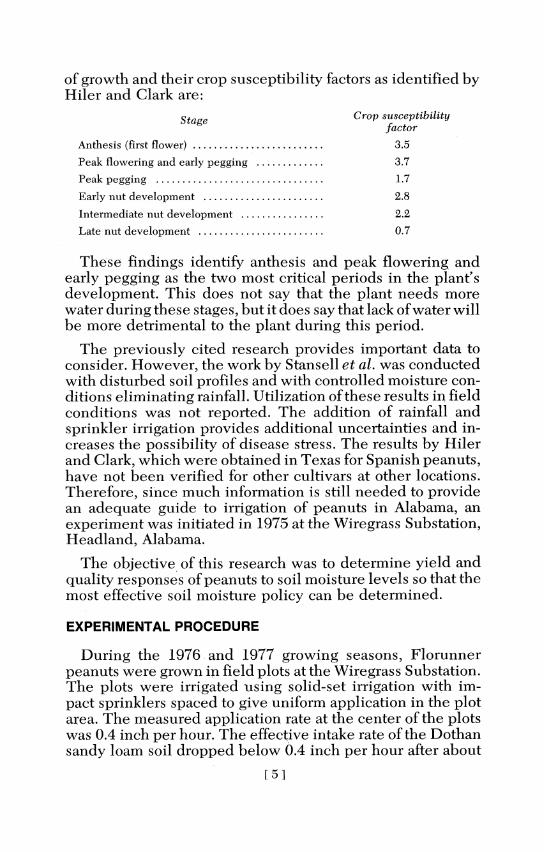
of growth and their crop susceptibility factors as identified byHiler and Clark are:
Stage Crop susceptibilityfactor
Anthesis (first flower) ......................... 3.5
Peak flowering and early pegging ............... 3.7
Peak pegging ................................ .1.7
Early nut development ........................... 2.8
Intermediate nut development ................. 2.2
Late nut development ........................ 0.7
These findings identify anthesis and peak flowering andearly pegging as the two most critical periods in the plant'sdevelopment. This does not say that the plant needs morewater during these stages, but it does say that lack of water willbe more detrimental to the plant during this period.
The previously cited research provides important data toconsider. However, the work by Stansell et al. was conductedwith disturbed soil profiles and with controlled moisture con-ditions eliminating rainfall. Utilization of these results in fieldconditions was not reported. The addition of rainfall andsprinkler irrigation provides additional uncertainties and in-creases the possibility of disease stress. The results by Hilerand Clark, which were obtained in Texas for Spanish peanuts,have not been verified for other cultivars at other locations.Therefore, since much information is still needed to providean adequate guide to irrigation of peanuts in Alabama, anexperiment was initiated in 1975 at the Wiregrass Substation,Headland, Alabama.
The objective of this research was to determine yield andquality responses of peanuts to soil moisture levels so that themost effective soil moisture policy can be determined.
EXPERIMENTAL PROCEDURE
During the 1976 and 1977 growing seasons, Florunnerpeanuts were grown in field plots at the Wiregrass Substation.The plots were irrigated using solid-set irrigation with im-pact sprinklers spaced to give uniform application in the plotarea. The measured application rate at the center of the plotswas 0.4 inch per hour. The effective intake rate of the Dothansandy loam soil dropped below 0.4 inch per hour after about
[51

TABLE 1. SOIL CHARACTERISTICS OF DOTHAN SANDY LOAM
Soil compositionHorizon Depth Sand Silt Clay Texture
In. Pct. Pct. Pct.Ap 0-10 80.0 10.1 9.9 Sandy loamB1 10-14 64.3 12.5 23.2 Light sandy clay loamB21t 14-36 57.4 9.2 33.4 Sandy clay loamB22t 36-50 56.1 7.5 36.4 Sandy clay loam
13/4 hours of irrigation. Table 1 data on the soil characteristicsof Dothan sandy loam indicate a gradual decrease in sand andan increase in clay content with depth. Samples taken over theentire plot area indicated no significant variation in profilecharacteristics with respect to location.
Tensiometers were installed at depths of 6, 12, and 18inches in the center of each plot to monitor soil moisture,figure 2. The 6-inch tensiometer was located approximately inthe middle of the surface horizon, the 12-inch tensiometer inthe middle of the thin transitional B1 layer, and the 18-inchtensiometer in the upper part of the B21t horizon. Tensi-ometer readings were taken at approximately 8 a.m. on Mon-day, Wednesday, and Friday. The 18-inch soil moisture ten-sion was monitored but not used in irrigation decisions.
Irrigation treatments were assigned to randomized plotswith each treatment having four replications. The irrigationtreatments were:
(1) No irrigationl-No irrigation water was applied.
(2) 60-centibar-Approximately 0.7 inch of irrigation waterwas applied when the soil tension at either the 6- or 12-inchdepth was 60 centibars or greater.
(3) 40-centibar-Approximately 0.7 inch of irrigation waterwas applied when the soil tension at either the 6- or 12-inchdepth was 40 centibars or greater.
(4) 20-centibar-Approximately 0.7 inch of irrigation waterwas applied when the soil tension at either the 6- or 12-inchdepth was 20 centibars or greater.
Treatment 4 was not included in 1976 but was added to the1977 study. Rainfall was measured daily using a non-recordingweather bureau rain gauge located approximately 1,000 feetfrom the plot area. No attempt was made to measure runofffrom rainfall.
1All treatments were initially irrigated 1 inch in 1977 to obtain a good crop stand.
[6]

FIG. 2. Tensiometer-soil profile relationship.
Other than irrigation treatments, conventional managementpractices were followed. This included a full season leafspotcontrol program consisting of applications of Bravo 6F at therate of 11/2 pints per acre on 14-day intervals. The peanuts wereplanted in 36-inch rows at the rate of 100 pounds per acre. Theplot area used was planted in an annual corn-peanut rotation tosuppress weeds and diseases. Digging dates for the individualtreatments were determined by the arginine maturity index(AMI) (2) and the peanuts were dug by machine on or near thedate predicted for optimum maturity.
RESULTS
Rainfall in southeastern Alabama during the 1976 and 1977growing seasons provided contrasting drought conditions. In1976, August rainfall was more than 3 inches below normal (38percent of normal), table 2. Conversely, an early seasondrought occurred during the 1977 growing season when rain-fall was nearly 6 inches below normal for the 3-month periodof April, May, and June. The conditions afforded by these 2years will be used to compare the effects of early and lateseason drought on peanuts.
[7]
Depth,inches
0
I0
- 20
-30
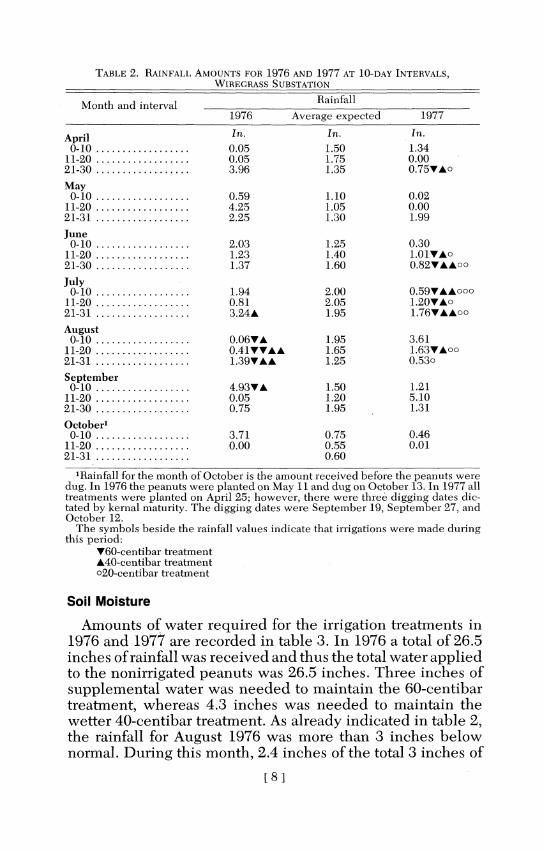
TABLE 2. RAINFALL AMOUNTS FOR 1976 AND 1977 AT 10-DAY INTERVALS,WIREGRASS SUBSTATION
Month and interval Rainfall
1976 Average expected 1977
April In. In. In.
0-10 .................. 0.05 1.50 1.3411-20 .................. 0.05 1.75 0.0021-30 .................. 3.96 1.35 0.75VAo
May0-10 .................. 0.59 1.10 0.02
11-20 ................. 4.25 1.05 0.0021-31 .................. 2.25 1.30 1.99
June0-10 ................ .. 2.03 1.25 0.30
11-20 .................. 1.23 1.40 1.01VAo21-30 .................. 1.37 1.60 0.82VAAoo
July0-10 .................. 1.94 2.00 0.59VAAooo
11-20 .................. 0.81 2.05 1.20YAo21-31 .................. 3.24A 1.95 1.76YAAoo
August0-10 ................ .. 0.06YA 1.95 3.61
11-20 .................. 0.41VVAA 1.65 1.63YAoo21-31 .............. ... 1.39VAA 1.25 0.530
September0-10 .................. 4.93VA 1.50 1.21
11-20 ................ .. 0.05 1.20 5.1021-30 .................. 0.75 1.95 1.31
October1
0-10 .......... 3.71 0.75 0.4611-20 ................ .. 0.00 0.55 0.0121-31 .................. 0.60
1Rainfall for the month of October is the amount received before the peanuts weredug. In 1976 the peanuts were planted on May 11 and dug on October 13. In 1977 alltreatments were planted on April 25; however, there were three digging dates dic-tated by kernal maturity. The digging dates were September 19, September 27, andOctober 12.
The symbols beside the rainfall values indicate that irrigations were made duringthis period:
V60-centibar treatmentA40-centibar treatmento20-centibar treatment
Soil Moisture
Amounts of water required for the irrigation treatments in1976 and 1977 are recorded in table 3. In 1976 a total of 26.5inches of rainfall was received and thus the total water appliedto the nonirrigated peanuts was 26.5 inches. Three inches ofsupplemental water was needed to maintain the 60-centibartreatment, whereas 4.3 inches was needed to maintain thewetter 40-centibar treatment. As already indicated in table 2,the rainfall for August 1976 was more than 3 inches belownormal. During this month, 2.4 inches of the total 3 inches of
[8]

TABLE 3. TOTAL WATER APPLIED FOR PEANUT IRRIGATION IN 1976 AND 1977,WIREGRASS SUBSTATION
Year and Total water Time toirrigation treatment Rainfall Irrigation applied mature'
1976 In. In. In. Days
Nonirrigated ....... 26.5 0.0 26.5 15660-centibar ........ 26.5 3.0 29.5 15640-centibar ........ 26.5 4.3 30.3 156
1977Nonirrigated ....... 21.6 1.0 22.6 16760-centibar ........ 20.0 5.8 25.8 15640-centibar ........ 20.0 8.5 28.5 15620-centibar ........ 19.8 11.6 31.4 148
'As determined by the Arginine Maturity Index.
irrigation water for the 60-centibar treatment was applied.Similarly, 3.7 inches of the 4.3-inch total irrigation for the40-centibar treatment was applied during this month. Thetotal water application ranged from about 26 to 31 inchesapplied to the crop in 1976.
Rainfall in 1977 ranged from 19.8 inches to 21.6 inchesdepending on harvest date. All treatments received an initial1-inch irrigation at planting to assure germination. This isreflected in table 3 where even the nonirrigated treatmentshows 1 inch of irrigation. The 60-centibar treatment required5.8 inches of supplemental water, whereas the wetter 40-centibar treatment required 8.5 inches. The wettest treatment,
Soil tension,centibars
[9]
Age (days)
FIG. 3. Average soil tension, 40-centibar treatment, 1976.

the 20-centibar policy, required 11.6 inches of irrigation wa-ter. These volumes all include the initial 1-inch applicationapplied before emergence. The total water (irrigation andrain) applied in 1977 ranged from about 23 to 31 inches.
Since a plant must overcome the soil tension to extract waterfrom a soil, the tensiometer data offer an indication of thestress under which the peanuts were growing during the sea-son. Figure 3 is a plot of the average soil tension at the 6-, 12-,and 18-inch depths for the 40-centibar treatment in 1976. Theplanned soil moisture range is indicated to be between thehorizontal axis and the horizontal dashed line. Soil moisturesabove the dashed line represent unplanned deviations. Inonly one instance in 1976 was the average soil tension greaterthan 40 centibars at any time during the growing season. Thisperiod of higher stress occurred near the end of the season andcorresponds to the August drought.
Figures 4 and 5 are graphs of the average soil tension at the40- and 20-centibar treatments, respectively, in 1977. Theaverage soil moisture tension was greater than planned in fiveperiods for the 40-centibar treatment and in seven periods forthe 20-centibar treatment. Air temperatures of 100°F or higherand evaporation rates as high as 0.4 inch per day contributed tothese deviations from the planned moisture range.
FIG. 4. Average soil tension, 40-centibar treatment, 1977.
[10]

Age (days)
FIG. 5. Average soil tension, 20-centibar treatment, 1977.
The cumulative soil moisture tension for the various treat-ments beginning on day 41 is presented in table 4. Thecumulative tension measured in centibar-days is obtained byadding the daily average tension. During the 41- to 130-dayperiod in 1977, the 60-centibar treatment had the greatestcumulative tension. The 10-day sums indicate a greatercumulative tension during the early period in 1977 and in thelater period in 1976.
TABLE 4. CUMULATIVE SOIL-MOISTURE TENSION IN CJENTIBAR-DAYS FOR FLORUNNERPEANUTS, 1976 AND 1977, WIREGRASS SUBSTATION
Interval(days afterplanting)
41-50 ................51-60 ................61-70 ................71-80 ................81-90 ................91-100 ...............101-110 ..............111-120 ..............121-130 ..............
TOTAL ..............
Soil-moisture tension by treatment
20-centibar 40-centibar 60-centibar
1976 1977 1976 1977 1976 1977
345 151 208 136 632177 120 140 106 495474 203 369 252 548261 140 394 315 389274 166 460 334 428101 264 314 270 14486 194 125 405 169
147 183 239 251 239126 127 205 163 190
1,991 1,548 2,454 2,233 3,234
[11]
Soil tension,centi bars

Yield
In 1976, peanut production was increased by decreasingmoisture stress with irrigation during the August droughtperiod, table 5. Nonirrigated peanuts produced 3,404 poundsper acre. The peanuts which were maintained at 60 centibarsproduced 4,660 pounds per acre (a 37 percent increase) withthe application of 3.0 inches of supplemental water. The wet-ter 40-centibar treatment produced even more, 4,873 poundsper acre, with 4.3 inches of supplemental water applied. Irri-gation also increased quality, table 5.
Based on 1976 prices, the nonirrigated peanuts were valuedat $358 per ton, significantly less than both irrigated treat-ments, table 6. The highest quality peanuts, valued at $412 perton, were obtained with the wettest treatment of 40 centibars.The overall effect of irrigation was an increased value of al-most $400 per acre ($610 compared to $1,003).
The 1977 growing season (an early season drought) pro-duced considerably different results than were obtained in1976. Yields from the nonirrigated, 60-centibar, and 40-centibar treatments were not statistically different. However,all three were significantly less than the 20-centibar treat-ment, which produced 3,836 pounds per acre, table 5. Thiswas an increase of 389 pounds per acre. Nut quality for 1977was statistically the same for all treatments. As a result, peanutquality (dollars per ton) was nearly the same for all treatmentsand differences in peanut value (dollars per acre) rose largelybecause of differences in yield and irrigation worth for theother treatments.
A striking result was the general lack of response to irriga-
TABLE 5. YIELDS AND GRADES OF PEANUTS IN 1976 AND 1977, WIREGRASS SUBSTATION
Year andirrigation treatment
Yield/acre
T1,
Seed quality'
SMK+SS OK
Pft P('t
1976 ... ,Nonirrigated ................. . 3,404b 62.6c 460-centibar................... 4,6 6 0 b 66.5cd 240-centibar................... 4,873b 72.3 d
1977Nonirrigated ................. . 3,447e 76.1 g60-centibar ................... 3,366e 77.540-centibar ................... . 3,283e 7 7 .6g20-centibar................... 3,836 75 .3g
'Seed quality as determined by Federal-State inspection procedures.Values with like superscripts are not significantly different.No statistical analysis was made between treatments of different years.
[ 12]
[.5[.5
2.52.31.12.9

TABLE 6. IRRIGATION WORTH IN 1976 AND 1977, WIREGRASS SUBSTATION
Year and Yield Peanut Peanut' Irrigation2
irrigation (lb./in. of quality value worthtreatment total water) ($/ton) ($/acre) ($/acre)
1976Nonirrigated .............. 128 358 61060-centibar ................ 158 378 880 27040-centibar ................ 161 412 1,003 393
1977Nonirrigated .............. 153 450 77560-centibar ................ 130 463 779 440-centibar ................ 115 461 770 - 520-centibar ................ 122 458 878 103
'Because peanut quality is extremely important in determining gross return, peanutvalue is a better indicator of worth than raw yield data for comparisons betweentreatments of a given year. However, because of fluctuations in the economy, peanutvalue does not offer a valid comparison between years.
2Irrigation worth is the increase in value due to irrigation.Irrigation worth = value of irrigated peanuts - value ofnonirrigated peanuts.
tion in 1977 when there was an early season drought, table 5.The maximum yield of4,873 pounds per acre achieved in 1976was not obtained in 1977 despite the application of more than11 inches of water to the 20-centibar treatment. In fact theyield was more than 1,000 pounds less in 1977. In 1976, 128 to161 pounds of peanuts were produced for each inch of totalwater received by the crop, table 6. The highest return wasobtained from the wettest irrigated plots. In 1977, from 122 to153 pounds of nuts were produced for each inch of total water,with the most efficient utilization of water by the nonirrigatedtreatments.
SUMMARY AND CONCLUSIONS
The 2-year continuing study of peanut irrigation has pro-vided two contrasting drought conditions. In 1976, the lateseason drought produced somewhat predictable results: yieldand quality improved with increases in soil moisture. The1977 early season drought influenced peanuts in a more unex-pected manner and demonstrated the capabilities of thepeanut to withstand certain early season droughts. Of particu-lar interest was the lower maximum yields obtained in theirrigated treatments in 1977 as compared to 1976. The cause ofthese lower yields cannot be ascertained with certainty at thistime. Possible causes are a different location, soil moisturestresses during different portions of the season, or perhapsother physiological factors, such as higher than normal soil and
[13]

air temperatures. However, in addition to the yield increasesshown in 1977, additional benefits were obtained even in thenonirrigated plots, which were irrigated to ensure a uniformstand. Although this benefit was not measured quantitatively,it could have had a major impact on production of the nonirri-gated plots.
A summary of the results obtained thus far follows:1. All irrigation treatments increased yield and quality in
1976 when there was a late season drought.
2. The 1977 early season drought delayed maturity ofpeanuts in nonirrigated treatments.
3. With the 1977 early season drought, irrigation causedyields to be produced in a growing period shorter than thenonirrigated peanuts, but did not necessarily increase yieldsor quality.
4. In the 2-year study the greatest yield and quality wereobtained from the wettest irrigation treatments.
Results obtained indicate that the period of the growingseason during which drought occurs has an effect on the yieldpotential of peanuts grown in the Southeast. Early seasondrought proved less damaging to total yield. State yield aver-ages support this conclusion. The 1976 yield (2,400 poundsper acre) was depressed over the previous year's yield (2,605pounds per acre). In contrast, the 1977 yield of 2,750 poundsper acre was a state record yield even with early seasondrought. These observations do not agree with Hiler andClark's crop susceptibility factors which indicate that earlyseason stress is the most damaging for Spanish peanuts. Cli-mate, peanut variety, and soil factors may in part be responsi-ble for these differing conclusions.
The 2 years of field studies certainly leave several unan-swered questions regarding peanut irrigation. Of particularinterest is the effect of drought periods during different por-tions of the growing season, and also heat and drought alteredphysiology of the peanut plant.
[14]

ACKNOWLEDGMENT
The authors express their appreciation to the Department ofResearch Data Analysis for contributions in the selection of theexperimental design and in the analysis of data. Appreciationis extended to personnel of the Wiregrass Substation for theirhelp and cooperation in maintaining this experiment. Theauthors also appreciate the contributions of Larry Ratliff, SoilConservation Service, USDA, and Ben Hajek, Department ofAgronomy and Soils, for their help in the collection andanalysis of soils used in this study. Appreciation is expressedto John Weete and Bill Branch, Department of Botany andMicrobiology, for their assistance in determining peanutmaturity.
LITERATURE CITED
(1) ANONYMOUS. 1977. Impact 80. Ala. Coop. Ext. Serv. Auburn Univ. Au-burn, Ala.
(2) CRAWFORD, MARK. 1977. AMI Determines Maturity. The Peanut Farmer13(7):14-15.
(3) HAGAN, R. M. AND J. I. STEWART. 1972. Water Deficits-Irrigation Designand Programming. Journal of the Irrigation and Drainage Division.Proceedings of the American Society of Civil Engineers. 98(IR2):215-237.
(4) HILER, E. A. AND R. N. CLARK. 1971. Stress Day Index to CharacterizeEffects of Water Stress on Crop Yields. Trans. ASAE. 14(4):757-761.
(5) SALTER, P. J. AND J. E. GOODE. 1967. Crop Responses to Water at DifferentStages of Growth. Commonwealth Agricultural Bureaux, 246pp.
(6) SHIPLEY, J. AND C. REIGER. 1970. Water Response in the Production ofIrrigated Grain Sorghum, High Plains of Texas, 1969. Texas Agr. Exp.Sta. Prog. Rept. No. 2829.
(7) STANSELL, J. R., et al. 1976. Peanut Responses to Soil Water Variables inthe Southeast. Peanut Science. 3(1):44-48.
[15]

AUBURN UNIVERSITY
With an agriculturalresearch unit in everymajor soil area, Auburn OUniversity serves theneeds of field crop, Olivestock, forestry, andhorticultural producersin each region in Ala- 0bama. Every citizen ofthe State has a stake in ® ® ®this research program,since any advantagefrom new and moreeconomical ways of 'producing and han-dling farm productsdirectly benefits the C I)consuming public.
Main Agricultural Experiment Station, Auburn.1 Tennessee Valley Substation, Belle Mina2. Sand Mountain Substation, Crossville.3 North Alabama Horticulture Substation, Cullman4 Upper Coastal Plain Subsiation, Winfield5 Forestry Unii, Fayeite County6 Thorsby Foundation Seed Stocks Farm, Thorsby7 Chilton Area Horticulture Substation, Clanton8. Forestry Unit, Coosa County.9 Piedmont Substation, Camp Hill
10. Plant Breeding Unit, Tallassee11 Forestry Unit, Autauga County.12 Prattville Experiment Field, Prattville13. Black Belt Substation, Marion Junction14 Lower Coastal Plain Substation, Camden.15 Forestry Unit, Barbour County16. Monroeville Experiment Field, Monroeville17 Wiregrass Substation, Headland18 Brewton Experiment Field, Brewton19 Ornamental Horticulture Field Station, Spring Hill.20. Gult Coast Substation, Fairhope