Embed Size (px)
Citation preview

1
Irrigated Crop Management Effects On Productivity, Soil Nitrogen, and
Soil Carbon
Dr. Ardell D. HalvorsonDr. Arvin R. MosierMr. Curtis A. Reule
UDSA, Agricultural Research Service2150 Centre Avenue, Bldg. D, Suite 100
Fort Collins, CO 80526
Email: [email protected]
Background Information:• Conversion of Grassland to Cropland– conventional tillage (CT) practices – loss of soil organic matter (SOM)– release of carbon dioxide (CO2) to the air
• Global Warming – Greenhouse Gases– CO2 increased from 280 ppm (pre-industrial) to
370 ppm in 2000– Nitrous Oxide (N2O) – increased from 275 ppb to
317 ppb in 2000– Methane (CH4) – increased from 700 ppm to 1800
ppm in 2000• Reduced-Till (RT) and No-Till (NT) Farming
Systems– reduce SOM decomposition and reduce CO2
emissions

2
Background Information:• Fertilization for Optimum Grain Yield and
Economic Returns– also maximizes crop residue production– enhances potential for SOC sequestration.
• Nitrogen Fertilization– may enhance residue decomposition and SOC
sequestration– may increase residual soil NO3-N available for
leaching – increases nitrous oxide (N2O) emissions
• Limited Information Is Available Under Irrigated Conditions– For RT and NT systems– N and Tillage affects on SOC sequestration
Research Objectives:
• Document the influence of N and tillage management on irrigated:
• Corn yields• Corn residue production• Soil organic C (SOC) sequestration• Total Soil N (TSN)• NO3-N leaching potential• N2O emissions

3
Research Sites and Environment:• Locations and Soil Texture:
– Dalhart, TX -- Dallam fine sandy loam soil– Texline, TX -- Conlen and Dumas clay loam soils– Fort Collins, CO – Fort Collins clay loam soil
• Cropping System: Continuous Corn• Irrigation: Center Pivot (Texas) or Linear Move (Colorado)• Tillage Systems
– Texas sites used RT (disk/ripper implement)– Colorado site used NT system and CT system (disk,
moldboard plow, mulcher, land leveler, etc.)• N Treatments – Texas Sites
– N1 (N fertilizer for >250 bu/a corn yield)– N2 (N1 rate plus additional liquid N applied to residue)
• N Treatments – Fort Collins Site– CT – four N rates from 0 to 180 lb N/a– NT – six N rates from 0 to 180 lb N/a
Texas Sites

4
DMI Eco-Tiller used at Dalhart, Nov. 1999
DMI Eco-Tiller Shank, tillage about 12 to 15 inches deep

5
ARROYO FARMS
x N1R1x N1R2
x N1R3x N1R4
x N2R1x N2R2
x N2R3x N2R4
Normal Fertilizer Rate = N1
High Fertilizer Rate = N2
Pivot #8
N
x Marks Sampling spot in Corn
located past 3rd tower wheel track
located past 2nd tower wheel track
Dalhart, TX
1
12
23
34
4 55
6 78
6 7 8 New Sampling Locations (30 Oct 01)
Dalhart, Oct. 2001
6
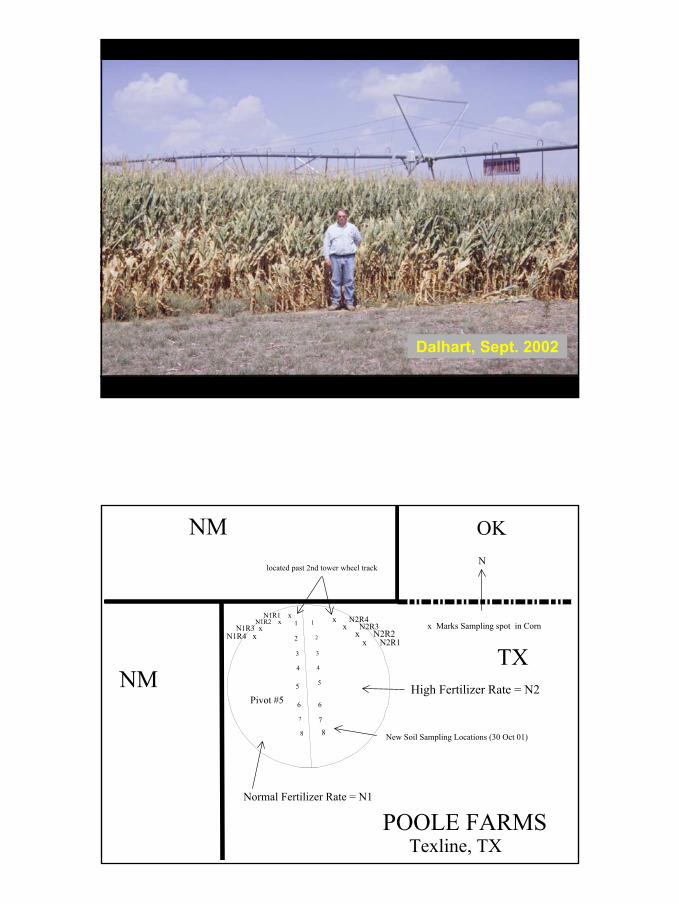
Dalhart, Sept. 2002
POOLE FARMS
N1R1 xN1R2 x
N1R3 xN1R4 x
x N2R1x N2R2
x N2R3x N2R4
Normal Fertilizer Rate = N1
High Fertilizer Rate = N2Pivot #5
N
x Marks Sampling spot in Corn
located past 2nd tower wheel track
Texline, TX
OKNM
NMTX
1
2
3
4
5
6
7
8
1
2
3
4
5
6
7
8 New Soil Sampling Locations (30 Oct 01)

7
Texline, Nov. 2002, corn residue
Texline, May 2000

8
Texas Nitrogen Treatments
• N1 = normal N rate applied to achieve >250 bu/a corn yields. Desired yield goal is 300+ bu/a corn.
• N2 = normal N rate plus liquid N fertilizer applied to corn residues after harvest to aid residue decomposition.
• N Rates varied with year and location.• Other nutrients were also applied.
Fertilizer N Program - Texas Sites
Crop Year
Fert
ilize
r N A
pplie
d ( l
b N
/a)
0
100
200
300
400
500N1N2
'99 '00 '01 '02 '99 '00 '01 '02Dalhart Texline

9
Average Yield from Combine Yield Monitor
Crop Year
Cor
n G
rain
Yie
ld (b
u/a)
0
50
100
150
200
250
300Normal N (N1)Normal + Fall N (N2)
'99 '00 '01 '02 Avg '99 '00 '01 '02 AvgDalhart Texline
Estimated in Early-Mid September
Crop Year
Cor
n R
esid
ue (l
b/a)
0
2000
4000
6000
8000
10000
12000
14000
16000N1N2
'99 '00 '01 '02 Avg '99 '01'00 '02 AvgDalhart Texline

10
September Biomass Sampling
Crop Year
Cor
n R
esid
ue C
(lb
C/a
)
0
1000
2000
3000
4000
5000
6000
7000N1N2
'99 '00 '01 '02 Avg '99 '00 '01 '02 AvgDalhart Texline
Change in SOC (0 - 6" soil depth)
After Crop Year1 2 3 4
Soil
Org
anic
C (t
/a)
8
9
10
11
12
13
14
15
16
Y = 7.652 + 0.895X r2 = 0.81
Y = 11.630 + 0.779X r2 = 0.87
Texline
Dalhart

11
Change in TSN (0 - 6" soil depth)
After Crop Year1 2 3 4
Tota
l Soi
l N (l
b N
/a)
1600180020002200240026002800300032003400
Y = 1570 + 175X r2 = 0.79
Y = 2235 + 229X r2 = 0.90
Texline
Dalhart
Soil NO3-N After Corn Harvest - Texas Sites
Crop Year
Soil
NO
3-N (0
- 6 ft
), lb
N/a
0
100
200
300
400
500
600N1 N2
Sod'99 '00 '01 '02'99 Sod'99 '99 '00 '01 '02Dalhart Texline

12
Colorado Site

13
Fort Collins Site (2000-2002)
Fertilizer Rate (lb N/a)0 30 60 90 120 150 180
Gra
in Y
ield
(lb/
a)
4000
5000
6000
7000
8000
9000
10000
NT(C-C)
CT(C-C)

14
Fort Collins Site (2000-2002)
Fertilizer Rate (lb N/a)0 30 60 90 120 150 180
Cro
p R
esid
ue (l
b/a)
5500
6000
6500
7000
7500
8000
8500
9000
CT(C-C)
NT(C-C)
Fort Collins Site (2000-2002)
Fertilizer Rate (lb N/a)0 30 60 90 120 150 180
Res
idue
C (l
b C
/a)
2400260028003000320034003600380040004200
NT(C-C)
CT(C-C)

15
Average of 2000-2002
Fertilizer Rate (lb N/a)0 25 50 75 100 125 150 175
Res
idue
C/N
Rat
io
50
60
70
80
90
100
CT(C-C)
NT(C-C)
Change in SOC (0 - 6 inch depth)
Time (years)0 1 2 3 4
Soil
Org
anic
C (t
/a)
9
10
11
12
13
14
15
CT(C-C)
NT(C-C)Fort Collins Site
Y = 11.17 + 0.641X r2 = 0.93
Y = 10.5 + 0.071X r2 = 0.02

16
Soil N After Harvest 2002 - Ft. Collins Site
N Fertilizer rate (lb N/a)0 30 60 90 120 150 180
Res
idua
l Soi
l NO
3-N
(lb
N/a
)
40
60
80
100
120
140
160
180
200
NT
CT(0 - 6 ft depth)
Greenhouse Gas Emissions and Global Warming
Potential
Fort Collins, CO Site

17
Nitrous Oxide (N2O) Flux (April '02 to April '03)
N Fertilizer Rate, kg N/ha
N2O
Flu
x (u
g N
m-2
hr-1
)
0
5
10
15
20
25CTNT
0 134 202

18
Carbon Dioxide (CO2) Flux (January to April '03)
N Fertilizer Rate (kg N ha-1)
CO
2 Flu
x (u
g C
m-2
hr-1
)
0
5
10
15
20
25
30
35CTNT
0 134 202
Net Global Warming Potential (GWP)(April 2002 to April 2003 in CO2 equivalents)
N Fertilizer rate (kg N ha-1)
GW
P (k
g C
O2 h
a-1 y
r-1)
-2000-1500-1000-500
0500
10001500200025003000
CT(C-C) NT(C-C)
0 134 202

19
Summary of Findings - Texas
• Applying liquid N to corn residue after harvest has not enhanced SOC sequestration after 4 corn crops, but did increase residual soil N levels.
• N1 fertilizer rate exceeded N needs for yield potential, therefore, excess N available for leaching.
• SOC – increased with each additional crop year in these RT irrigated systems.
• SOC in cropped area exceeds that in native sod.
• Changes in TSN follow same trends as SOC.
Summary of Findings - Colorado• N fertilization is essential to optimize grain
yield potential.• Residue C returned to soil increased with
increasing N rate in CT and NT systems.• SOC increased each year in NT system but not
in CT system.• N rate has not influenced SOC sequestration
significantly after only 4 corn crops.• N2O emissions increased with increasing N
rate.• GWP was decreased by converting from CT to
NT, but increased with increasing N rate.

20
THANKS!!!
Jim Poole, Poole ChemicalFLUID FERTILIZER FOUNDATION
USDA-CSREES-NRI GrantCASMGS Grant
FOR SUPPORTINGTHESE PROJECTS