Embed Size (px)
Citation preview

choicesVol. 14, no. 5, May 2008 ISSN 0711-0677 www.irpp.org
Diversity, Imm
igration and IntegrationIIRRPPPP
Lesleyanne Hawthorne
The Impact of EconomicSelection Policyon Labour MarketOutcomes for Degree-Qualified Migrants inCanada and Australia
F ounded in 1972, the Institute for Research onPublic Policy is an independent, national,nonprofit organization.
IRPP seeks to improve public policy in Canada bygenerating research, providing insight and sparkingdebate that will contribute to the public policydecision-making process and strengthen the quality ofthe public policy decisions made by Canadiangovernments, citizens, institutions and organizations.
IRPP's independence is assured by an endowment fundestablished in the early 1970s.
F ondé en 1972, l’Institut de recherche enpolitiques publiques (IRPP) est un organismecanadien, indépendant et sans but lucratif.
L’IRPP cherche à améliorer les politiques publiquescanadiennes en encourageant la recherche, en mettantde l’avant de nouvelles perspectives et en suscitant desdébats qui contribueront au processus décisionnel enmatière de politiques publiques et qui rehausseront laqualité des décisions que prennent les gouvernements,les citoyens, les institutions et les organismescanadiens.
L’indépendance de l’IRPP est assurée par un fonds dedotation établi au début des années 1970.
Lesleyanne Hawthorne is associate dean,international, at the University of Melbourne.Previously she was research manager at Australia’sBureau of Immigration, Multicultural and Popu-lation Research. She has 20 years of experienceresearching high skill migration. Most recently shewas recruited by the Organisation for EconomicCo-operation and Development to compare highskill migration patterns across 10 member nations.In 2005-06 Professor Hawthorne was appointed toan Expert Panel of Three by Australia’s federalcabinet to do the most extensive evaluation of thenation’s skill migration program since 1988 (allprofessional fields). Since September 2007 thepanel’s recommendations have governed theselection of all economic migrants. In 2004-06 shewas commissioned by Citizenship and ImmigrationCanada, Statistics Canada and Human Resourcesand Social Development Canada to compare labourmarket outcomes for migrant professionals inCanada and Australia in 10 key fields. In 2006-07she completed the most complete Australian studyto date on foreign medical graduates (following themain Australian studies on global mobility in theengineering and nursing professions). Additionalmajor consultancies include studies on globalhigh-skill migration and foreign credentialrecognition for the OECD and UNESCO.
This publication was produced under the directionof Geneviève Bouchard, Research Director, IRPP.The manuscript was copy-edited by Mary Williams,proofreading was by Barbara Czarnecki, productionwas by Chantal Létourneau, art direction was bySchumacher Design, and printing was by AGLGraphiques.
Copyright belongs to IRPP. To order or requestpermission to reprint, contact:
IRPP1470 Peel Street, Suite 200Montreal, Quebec H3A 1T1Telephone: 514-985-2461Fax: 514-985-2559E-mail: [email protected]
All IRPP Choices and IRPP Policy Matters areavailable for download at www.irpp.org
To cite this document:
Hawthorne, Lesleyanne. 2008. “The Impact ofEconomic Selection Policy on Labour MarketOutcomes for Degree-Qualified Migrants in Canadaand Australia.” IRPP Choices 14 (5).
The opinions expressed in this paper are those of the author and do not necessarily reflect the views of IRPP or its Board of Directors.

Diversity, Immigration andIntegration / Diversité, immigrationet intégration Research Director / Directrice de rechercheGeneviève Bouchard
T his series comprises individual IRPP Choicesand IRPP Policy Matters studies on Canadianimmigration policy and its challenges, and also
on other countries’ immigration and refugee policies.Issues discussed in this research program include therelationship between sovereignty and economic inte-gration, security and border control, and reconcilia-tion of economic and humanitarian objectives.
C ette série comprend des études Choix IRPP etEnjeux publics IRPP qui portent sur la poli-tique canadienne d’immigration et ses nou-
veaux défis, mais également sur les différentespolitiques d’immigration et de protection de réfugiéspartout au monde. Les questions abordées dans ceprogramme de recherche touchent aux rapports entresouveraineté et intégration économique, sécurité etcontrôle des frontières, conciliation des objectifséconomiques et humanitaires.
Contents2 The Policy Context
7 Canada’s and Australia’s Selection of Degree-Qualified Migrants
12 Employment Outcomes for Degree-QualifiedMigrants: The 2001 Census
30 Employment Outcomes for Economic PrincipalApplicants
36 Conclusion
39 Appendix
42 Notes
44 References

IRP
P C
ho
ice
s, V
ol.
14
, n
o.
5,
Ma
y 2
00
8
2
The Impact of EconomicSelection Policy on LabourMarket Outcomes forDegree-QualifiedMigrants in Canadaand Australia*Lesleyanne Hawthorne
The Policy ContextEconomic migration trends
G lobal migration is a defining phenomenon ofthe early twenty-first century. Migrationembraces every category of people — skilled
and unskilled, family member and refugee, legal andillegal, permanent and temporary. Temporary peoplemovement is rising markedly. The relative accessibili-ty of one immigrant-receiving country may lower thenumber of immigrants seeking to enter another.Given the dynamism of these trends, the few nationswith active1 immigration programs are constantlyobliged to modify their entry policies, while encoun-tering “difficulties in harnessing their immigrationprograms to achieve diverse and often incompatiblepolicy goals...to utilise immigration selection proce-dures to ensure positive outcomes in a diverse rangeof policy areas: economic development, humanresource development, population and foreign affairs”(Stahl, Ball, Inglis and Gutman 1993, xiv).
Canada and Australia are global exemplars ofnation building through government planned andadministered economic, family and humanitarianmigration programs. By 2005, Australia had theworld’s highest percentage of foreign-born residents(24.6 percent of the population, representing over 240nationalities), followed by Canada at 19.2 percentand the United States at 11.7 percent (Miller 2005).Over the past decade, both Canada and Australiahave placed extraordinary emphasis on the recruit-ment of migrants with skills (Organisation forEconomic Co-operation and Development [OECD]2006, 2008). In 2004, Canada selected 133,746 peoplein the economic category — in particular, it took sub-stantial numbers of points-tested principal applicants(PAs) qualified in the professions. Skilled migrants
* This IRPP Choices is an abridged, revised and updated version ofa study commissioned by Statistics Canada, Citizenship andImmigration Canada, and Human Resources and SocialDevelopment Canada, entitled “Labour Market Outcomes forMigrant Professionals: Canada and Australia Compared”(Hawthorne 2007a). Like all papers in the series, it has been peerreviewed by two anonymous referees.
are, in order: China, India, Philippines,Pakistan, United States, Colombia, UnitedKingdom, South Korea, Iran andFrance…Canada plans to admit between240,000 and 265,000 immigrants in 2007. Ofthose about 60% are to be economic class,meaning skilled workers, 25% family class,and 15% protected persons. (2007, A4)
Differences in Canadian and Australianeconomic migration policy, 1999 to the presentWithin this context, Canada competes for economicmigrants with Australia and other Western nations, aswell as with select parts of Africa, Asia and the GulfStates. In the recent period, to address the needs of theirknowledge economies, Canada and Australia have: • Prioritized economic migration• Diversified immigrant source countries and skill levels• Utilized points systems designed to improve selection
objectivity while maximizing employment outcomes• Strengthened regional initiatives to encourage more
geographically dispersed settlement patterns throughpolicy input and expanded settlement options
• Enhanced scope for two-step migration (the transi-tion from temporary to permanent status)
• Attempted to minimize program abuse through theintroduction of more coherent and transparent selec-tion systemsWhile both Canada and Australia use points-based
selection criteria designed to support economic categorydevelopment and growth (based on a system devised byCanada in the 1970s), it is essential to note the sharpdivergence in the strategies used that has emerged in thepast decade. According to a recent paper,
The human capital model…has dominatedCanada’s selection of skilled migrants —endorsed in its most recent migration review(2002), and standing in sharp contrast toAustralia’s intensification of screening forselect employment attributes. While educa-tion level matters for principal applicants,field and place of qualification do not, in acontext where labour market demand is seenas hard to predict and ‘individuals can expectto have several careers over their workinglives.’ According to Hiebert (2006) the pre-vailing Canadian view is that ‘well-trainedflexible individuals…who have experience inthe labour force’ should be able to ‘adapt torapidly changing labour market circum-stances.’ In consequence ‘general’ rather than‘specific’ competence is sought — Canadianselection criteria admitting PAs with limitedhost country language skills, non-recognisedqualifications, and in fields of minimallabour market demand on an equal basis tothose with more immediately sought afterattributes. (Birrell, Hawthorne andRichardson 2006; 130-1)
constituted 59.6 percent of the total planned intake(224,346 people) at this time, far exceeding the tar-gets set for family (51,500 to 56,800) and humanitari-an (30,800 to 33,800) entrants. By 2005, the numberof economic migrants to Canada had risen to 156,310(counting business immigrants and provincial/territo-rial nominees), and an estimated 138,193 were due toarrive in 2006 (Cardozo and Guilfoyle 2007;Citizenship and Immigration Canada 2007). The pro-portion of economic migrants selected by Australia in2004-05 was virtually identical to that selected byCanada (58 percent), including 77,800 applicants outof a permanent migrant/humanitarian intake of133,000 people.
Australia’s preference for economic migrants hasremained dynamic, with targets of 97,500 achievedfor 2005-06 and 2006-07, and 102,500 set for 2007-08 — the largest in the country’s history (Birrell,Hawthorne and Richardson 2006; Australia,Department of Immigration and Citizenship 2007a,2008). Canada’s current immigration program allo-cates 138,257 places for economic migrants out of atotal annual quota of 240,000 to 265,000 (reduced toabout 57 percent ), including 67,000 places for skilledworkers, 22,000 for provincial nominees and up to12,000 for those in the new Canadian ExperienceClass (Mamann 2007). It is important to note here thedecreasing proportion of landed immigrants derivedfrom OECD nations by both countries, a trend associ-ated with the growing problem of overqualification(OECD 2008).2
In March 2007, Canada’s first release of 2006Census data confirmed the significance of migrationto the country’s population growth and economicdevelopment in a context where “[i]mmigration andan unprecedented economic boom in Alberta fuelled apopulation surge in the country that outpaced everyother G8 industrialized nation from 2001 to 2006,including the United States” (Weeks and Leong 2007,1). Between 2001 and 2006, Canada’s population grewby 1.6 million, despite a declining fertility rate of 1.5— close to two-thirds of this a consequence of recentmigration. The impact of migration flows was strikingin Toronto, Montreal, Vancouver and to a lesser extentCalgary, with 90 percent of all national growth con-centrated in cities (O’Neil 2007). According to Brean,
Of the 1.2 million international immigrantsover the five year census period, fully halfwent to Ontario. Roughly 44% of immigrantsto Canada are female, a proportion that hasbeen increasing by about one percentagepoint a year. The 10 largest source countries
3
Th
e Im
pa
ct of E
con
om
ic Se
lectio
n P
olicy
on
La
bo
ur M
ark
et O
utco
me
s for D
eg
ree
-Q
ua
lified
Mig
ran
ts in C
an
ad
a a
nd
Au
stralia
, by
Le
sley
an
ne
Ha
wth
orn
e

IRP
P C
ho
ice
s, V
ol.
14
, n
o.
5,
Ma
y 2
00
8
4
By 1991, the overseas-born constituted 49 percent ofAustralia’s mechanical engineers, 48 percent of itselectrical/electronic engineers, 43 percent of its com-puter professionals and 40 percent of its doctors —and the proportions in other key professions were ris-ing. Within one to five years of arrival, however, just30 percent of these degree-qualified migrants wereemployed; few diploma holders from the same migra-tion period found work in any profession (Birrell andHawthorne 1997). Labour market outcomes remaineddisappointing for many migrants long settled inAustralia: just 41 percent of 1981-85 and 49 percentof 1986-91 degree-qualified arrivals found profes-sional work, and NESB workers were invariably dis-advantaged.
The election of Australia’s Liberal governmentunder John Howard in 1996 coincided with a pro-found selection policy shift from altruism to pragma-tism (Hawthorne 2005). While Australia’s family andhumanitarian migration intakes were endorsed forserving broad social purposes, high and persistentunemployment among recently arrived skilledmigrants was perceived to undermine the effective-ness of the economic migration program — oneexplicitly devised in 1988 to support Australia’s eco-nomic development (Committee to Advise onAustralia’s Immigration Policy 1988).
Jettisoning the former Labor government’s strate-gy as “out of balance and out of control,” the incom-ing government aimed to “return the balance in theprogram to one that is in the national interest.” Instating its determination to change economic selec-tion, the Department of Immigration andMulticultural Affairs defined six key attributes thatmake “a good skill[ed] applicant,” most notably,“obtaining a job soon after arrival that uses theirskills…becom[ing] quickly established…not requir[ing]benefits,” while “quickly mak[ing] a positive contri-bution to the Australian economy, labour market andbudget” (Ruddock 1996, 1).
From 1996 to 1999, Australia’s Department ofImmigration and Multicultural Affairs systematicallyreviewed and transformed its economic selectionprocess, abolishing social security benefits formigrants in the first two years after their arrival andactively “selecting for success” from among principalapplicants. Following a preliminary audit conductedin 1997-98, the department initiated a major reviewto evaluate the effectiveness of the points test(Australia, Department of Immigration andMulticultural Affairs 1999, vii). In the decade since,
While Canada’s Immigration and RefugeeProtection Act, 2002 (IRPA) heralded economic selec-tion changes, in the view of a number of seniorCanadian officials interviewed for this study it repre-sented a lost opportunity to re-examine the funda-mentals and grapple with global realities (thoughviews do vary on this). Key IRPA modificationsincluded:• Heavier weighting for educational qualifications
(to a maximum of 25 points), with years of school-ing taken into account and several bonus pointsfor doctoral-level degrees
• Reduced points for work experience (a measuredesigned to encourage the entry of recent tertiary-educated graduates)
• Increased points for host-country language ability • Extension of the age range for which points are
awarded (up to age 53)• Modest capacity for temporary entrants to shift to
permanent resident status in the context of a clearpreference for permanent migration (Citizenshipand Immigration Canada 2002)Despite such innovations, after the IRPA all for-
eign credentials were still treated as equal to eachother for selection purposes — the certainty of differ-ential recognition rates in Canada notwithstanding(OECD 2007; Kustec, Thompson and Li 2007). Therewas no mandatory requirement for host-country lan-guage testing or defined levels of English/Frenchcompetency, with self-assessment by applicants stillallowed. Substantial points were still allocated towork experience (close to one-third of the totalrequired), despite research evidence confirming “verysubstantial decline in the economic return to pre-Canadian labour market experience” (particularlywhen gained in non-OECD nations) (Sweetman 2004,8; OECD 2008; Aydemir and Skuterud 2005). For acomprehensive comparison of Canada’s andAustralia’s points systems in 2005, see the appendix,which also includes further details of the selectioncriteria of the United Kingdom and New Zealand.
Over the past 10 years, Australia, in marked con-trast to Canada, has largely abandoned the humancapital model for selecting economic migrants(though some vestiges remain). From 1980 to 1996,researchers had consistently identified inferior labourmarket outcomes for professionals from non-English-speaking-background (NESB) source countries.Between 1986 and 1991, 91,193 degree-qualifiedmigrant professionals arrived in Australia, in additionto the 39,239 migrants who arrived with diplomas.
Australia’s recently completed 2005-06 economicmigration review (the most extensive since 1988) hasconfirmed the effectiveness of these policy initiatives indelivering superior labour market outcomes (Birrell,Hawthorne and Richardson 2006). To fine-tune the pro-gram further, additional measures were introduced(starting in September 2007) related to enhancedEnglish-language ability, level of domestic labour mar-ket demand and work experience of former internation-al students (who, by 2005, constituted 52 percent ofeconomic migrants).
Comparative economic migration labour marketoutcomes: recent dataHow do the results of Australia’s decisive economicmigration policy change compare with the outcomes ofCanada’s human capital selection model? A decade ago,labour market integration rates for economic migrantsto Canada and Australia were virtually identical: about60 percent of principal applicants secured some form ofwork six months after their arrival. Since then,Australia’s outcomes have dramatically improved whileCanada’s have stood still. This is despite the near-iden-tical economic cycles of the two countries, and the factthat they are equivalent settlement sites for degree-qualified migrants across all immigration categories(economic, family and humanitarian), as demonstratedby the 2001 Census analysis.
Major gains have been achieved in Australia by tra-ditionally disadvantaged groups. Employment rateswithin six months of arrival for principal applicantsfrom Eastern Europe rose from 31 percent to 79 percentbetween 1993-95 and 1999-2000, compared to 57 to76 percent for migrants from the Philippines, 56 to 73percent for those from India and 45 to 61 percent forthose from China. The negative impacts of older ageand female gender have been greatly reduced.According to the most recent available data (May2006), 83 percent of principal economic applicants arenow employed in Australia within six months ofarrival, with 60 percent immediately using their cre-dentials and skills. Their salary levels have risen astro-nomically. Their average weekly wage is nowAUD$1,015, compared to AUD$769 for Australiangraduates in their first full-time job (Birrell, Hawthorneand Richardson 2006).
In Canada, by contrast, wage outcomes have wors-ened to the point where it may take 20 to 30 years forprincipal economic applicants to achieve parity (if theyever do) with comparably qualified Canadians(Frenette, Green and Picot 2004; Pendakur and
Australia has sought early and positive employmentintegration rates from the program — given thatresults at six months are strongly correlated withlong-term labour market performance (Birrell,Hawthorne and Richardson 2006). To facilitate thisprocess, the review drew on two definitive databases:the Longitudinal Survey of Immigrants to Australia(LSIA) (based on a representative sample of 5 percentof migrants/refugees from successive cohorts of1990s migration); and a comparative analysis ofemployment outcomes for migrant professionals froma variety of countries/regions of origin (based on1996 Census data).
In line with the review’s findings, since 1999 anincreasing number of principal applicants at per-ceived risk of delayed or deskilled employment inAustralia have been excluded from economic migra-tion at point of entry through rigorous expansion ofpremigration English-language testing (extended tofamily-skill categories), mandatory credential assess-ment and a range of additional modifications to thepoints selection process. Key Australian policy initia-tives have included:• Allocation of greatest points weighting to “the
core employability factors of skill, age and Englishlanguage ability” based on the establishment of“minimum threshold standards” for each of theseaspects (Australia, Department of Immigration andMulticultural Affairs 1999, 12)
• Additional points weighting for occupations indemand, along with degree-level qualificationsrelated to specific (rather than generic3) profession-al fields
• Allocation of bonus points for former internationalstudents with credentials recently completed inAustralia (a minimum of one and subsequentlytwo years)
• Abolition of age-related points for applicants aged45 and over and English-language points forapplicants possessing less than “vocational” levelsof English
• Allocation of further bonus points for those withrecent continuous Australian or internationalexperience in a professional field, for those with a“genuine job offer” in an occupation in demand,for those with a spouse satisfying economic appli-cation criteria, for those bringing “a high level ofcapital with them to Australia” (AUD$100,000 ormore) and for those sponsored by close Australia-based relatives (Australia, Department ofImmigration and Multicultural Affairs 1999)
5
Th
e Im
pa
ct of E
con
om
ic Se
lectio
n P
olicy
on
La
bo
ur M
ark
et O
utco
me
s for D
eg
ree
-Q
ua
lified
Mig
ran
ts in C
an
ad
a a
nd
Au
stralia
, by
Le
sley
an
ne
Ha
wth
orn
e

IRP
P C
ho
ice
s, V
ol.
14
, n
o.
5,
Ma
y 2
00
8
6
Australia, from 1996 to 2001 it was 3.8 percent forCanada compared to 3.9 percent for Australia. In thecourse of the decade, real GDP rose annually on aver-age by almost identical rates in each country (2.8percent in Canada; 2.7 percent in Australia). From1996 to 2001, 69.5 percent of Canada’s populationwas employed, compared to 69 percent of Australia’s,with an average annual employment growth of about0.2 to 0.3 percent in each country. Unemploymentrates were also similar: Canada averaged 8.1 percent;Australia averaged 7.4 percent. Such comparabilityprovides an excellent base for a contrasting policystudy. According to Richardson and Lester, from aneconomic perspective, Australia and Canada “lookvery alike”: “Whereas Australia’s economy did per-form well during the decade to 2001, it was only dur-ing the 1991-1996 period that Australia’s growth wassuperior to that of Canada. During the 1996-2001period, during which migrants [included in bothcountries’ longitudinal and census surveys] arrivedand were looking for employment, both economiesperformed equally well. Thus [any] superior labourforce performance of migrants to Australia…cannotbe explained simply in terms of economic perform-ance” (2004, 10).
I should briefly note four additional methodologi-cal issues here: • While the findings of this study shed light on
important policy choices, the terms of reference ofthe initial report on which it is based did notextend to policy recommendations on economicmigration, which therefore cannot be providedhere.
• Employment outcomes rather than earnings levelsare the primary focus of the analysis to follow,given that the former are the measure more com-monly used in Australia.
• In line with census and LSIC/LSIA practice, theInternational Labour Organization’s (ILO) defini-tion of “employment” was used throughout,except in relation to Australia’s LSIA 3 outcomes(where “main activity” rather than the more gen-erous ILO definition of employment was used toassess the proportion of newly arrived migrants insignificant work).6
• Careful categorization at the start of the studyensured direct comparability of degree- and diplo-ma-level qualifications between Canada andAustralia,7 as well as field of qualification andlevel of employment, based on expert advice fromStatistics Canada.
Pendakur 1998, 2004; Reitz 2004; Aydemir andSkuterud 2005). As summarized in a recent study,economic migration is newly associated withentrenched disadvantage: “[B]y the early 2000s,skilled class entering immigrants [to Canada] wereactually more likely to enter low-income and be inchronic low-income than their family class counter-parts, and the small advantage that the universityeducated entering immigrants had over, say, the highschool educated in the early 1990s had largely disap-peared by 2000, as the number of highly educatedrose. What did change was the face of the chronicallypoor immigrant; by the late 1990s one-half were inthe skilled economic class, and 41% had degrees (upfrom 13% in the early 1990s)” (Picot, Hou andCoulombe 2007, 5-6).
This study investigates a range of data relevant tothis issue. The research was based on the followingdefinitive Canadian and Australian data sets and sup-ported by extended interviews with 32 key Canadianinformants:4
• Immigration arrival statistics for degree-qualifiedmigrants in 10 professional fields — allowing defi-nition of the scale of inflows of skilled migrants toCanada and Australia within the economic andassisted family streams, compared to all otherimmigration categories
• 2001 Census data — allowing analysis of theextent to which Canada and Australia offer similaremployment opportunities for degree-qualifiedmigrants (across all immigration categories), aswell as the factors associated with positive versusnegative labour market outcomes5
• The Longitudinal Survey on Immigrants to Canada(LSIC), the Immigration Database (IMDB) and theLongitudinal Survey on Immigrants to Australia(LSIA) data — allowing comparison of labour mar-ket integration rates for points-tested economicprincipal applicants between 1994-95 and 2000-01in order to assess the influence of Canadian andAustralian policy differences on labour marketoutcomes (the latest Australian LSIA data, to May2006, is also provided)The study focuses on recent immigrants with
degree- rather than diploma-level credentials. In ana-lyzing their labour market experiences, it is importantto affirm that Canada and Australia have hadremarkably similar economic cycles in the pastdecade. While the average annual growth in realgross domestic product from 1991 to 1996 was 1.7percent for Canada compared to 3.0 percent for
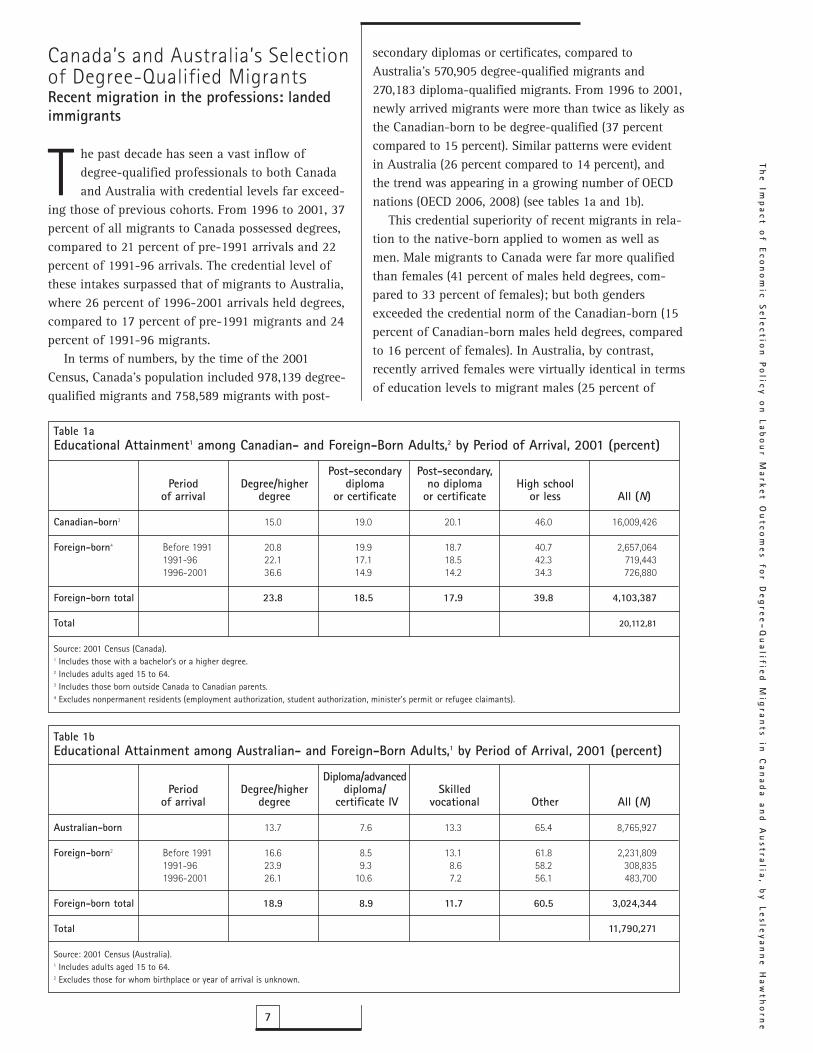
secondary diplomas or certificates, compared toAustralia’s 570,905 degree-qualified migrants and270,183 diploma-qualified migrants. From 1996 to 2001,newly arrived migrants were more than twice as likely asthe Canadian-born to be degree-qualified (37 percentcompared to 15 percent). Similar patterns were evidentin Australia (26 percent compared to 14 percent), andthe trend was appearing in a growing number of OECDnations (OECD 2006, 2008) (see tables 1a and 1b).
This credential superiority of recent migrants in rela-tion to the native-born applied to women as well asmen. Male migrants to Canada were far more qualifiedthan females (41 percent of males held degrees, com-pared to 33 percent of females); but both gendersexceeded the credential norm of the Canadian-born (15percent of Canadian-born males held degrees, comparedto 16 percent of females). In Australia, by contrast,recently arrived females were virtually identical in termsof education levels to migrant males (25 percent of
Canada’s and Australia’s Selectionof Degree-Qualified MigrantsRecent migration in the professions: landedimmigrants
T he past decade has seen a vast inflow ofdegree-qualified professionals to both Canadaand Australia with credential levels far exceed-
ing those of previous cohorts. From 1996 to 2001, 37percent of all migrants to Canada possessed degrees,compared to 21 percent of pre-1991 arrivals and 22percent of 1991-96 arrivals. The credential level ofthese intakes surpassed that of migrants to Australia,where 26 percent of 1996-2001 arrivals held degrees,compared to 17 percent of pre-1991 migrants and 24percent of 1991-96 migrants.
In terms of numbers, by the time of the 2001Census, Canada’s population included 978,139 degree-qualified migrants and 758,589 migrants with post-
7
Th
e Im
pa
ct of E
con
om
ic Se
lectio
n P
olicy
on
La
bo
ur M
ark
et O
utco
me
s for D
eg
ree
-Q
ua
lified
Mig
ran
ts in C
an
ad
a a
nd
Au
stralia
, by
Le
sley
an
ne
Ha
wth
orn
e
Table 1aEducational Attainment1 among Canadian- and Foreign-Born Adults,2 by Period of Arrival, 2001 (percent)
Post-secondary Post-secondary,Period Degree/higher diploma no diploma High school
of arrival degree or certificate or certificate or less All (N)
Canadian-born3 15.0 19.0 20.1 46.0 16,009,426
Foreign-born4 Before 1991 20.8 19.9 18.7 40.7 2,657,0641991-96 22.1 17.1 18.5 42.3 719,4431996-2001 36.6 14.9 14.2 34.3 726,880
Foreign-born total 23.8 18.5 17.9 39.8 4,103,387
Total 20,112,81
Source: 2001 Census (Canada).1 Includes those with a bachelor’s or a higher degree.2 Includes adults aged 15 to 64.3 Includes those born outside Canada to Canadian parents.4 Excludes nonpermanent residents (employment authorization, student authorization, minister's permit or refugee claimants).
Table 1bEducational Attainment among Australian- and Foreign-Born Adults,1 by Period of Arrival, 2001 (percent)
Diploma/advancedPeriod Degree/higher diploma/ Skilled
of arrival degree certificate IV vocational Other All (N)
Australian-born 13.7 7.6 13.3 65.4 8,765,927
Foreign-born2 Before 1991 16.6 8.5 13.1 61.8 2,231,8091991-96 23.9 9.3 8.6 58.2 308,8351996-2001 26.1 10.6 7.2 56.1 483,700
Foreign-born total 18.9 8.9 11.7 60.5 3,024,344
Total 11,790,271
Source: 2001 Census (Australia).1 Includes adults aged 15 to 64.2 Excludes those for whom birthplace or year of arrival is unknown.

IRP
P C
ho
ice
s, V
ol.
14
, n
o.
5,
Ma
y 2
00
8
8
• Architecture and building• Medicine• Nursing• Teacher, education• Accounting
For contrastive purposes, employment outcomesfor migrants were also examined in three generic cre-dential fields, since there is strong representation ofthese in contemporary migration flows: rest of man-agement, commerce; society and culture, creativearts; natural and physical sciences.
By 2001, Canada and Australia were home to veryhigh proportions of foreign-born professionals in all10 qualification fields, constituting approximately
females and 27 percent of males held degrees). (As weshall see, the gender of skilled migrants is an issuewith significant employment ramifications.)
The recent sustained entry of tertiary-qualifiedmigrants has a clear potential to impact the profes-sions in Canada and Australia. To inform future poli-cy formation, the current study assessed factorsassociated with greater or lesser rates of economicintegration for degree-qualified migrants in sevenvocational fields (including virtually all of the majorregulatory professions in Canada and Australia aswell as information technology): • Information technology (IT)• Engineering
Table 2aCanadian- and Foreign-Born Professional1 Workforce, by Field and Period of Arrival, 2001 (percent)
Foreign-born by period of arrivalCanadian- Foreign-
Vocational/credential field born2 born3 Before 1991 1991-96 1996-2001 All (N)
Information technology 49.1 50.9 19.4 9.4 22.1 109,292Engineering 49.6 50.4 21.9 8.7 19.8 287,723Architecture and building 51.3 48.7 23.7 9.2 15.9 76,749Medical studies 64.7 35.3 20.9 5.5 8.8 208,140Nursing 76.6 23.4 15.3 3.5 4.6 91,337Teacher, education 84.8 15.2 11.4 1.8 2.1 515,503Accounting 64.7 35.3 19.0 6.8 9.6 152,245Rest of management, commerce 72.7 27.3 14.7 5.0 7.6 384,653Society and culture, creative arts 75.7 24.3 15.5 3.6 5.2 1,106,842Natural and physical sciences 64.5 35.5 19.9 5.8 9.8 312,154Other 77.8 22.2 11.9 3.8 6.5 129,420
Total 71.0 29.0 16.4 4.7 7.9 3,374,057
Source: 2001 Census (Canada).1 Includes those with a bachelor’s or a higher degree.2 Includes those born outside Canada to Canadian parents.3 Excludes nonpermanent residents (employment authorization, student authorization, minister's permit or refugee claimants).
Table 2bAustralian- and Foreign-Born Professional1 Workforce, by Field and Period of Arrival, 2001 (percent)
Foreign-born by period of arrivalAustralian- Foreign-
Vocational/credential field born born2 Before 1991 1991-96 1996-2001 All (N)
Information technology 51.2 48.8 27.4 7.2 14.2 69,694Engineering 52.2 47.8 27.7 8.5 11.6 136,454Architecture and building 66.3 33.7 22.3 4.4 7.0 32,554Medical studies 54.2 45.8 30.1 5.8 9.9 47,251Nursing 75.9 24.1 19.2 2.2 2.7 137,949Teacher, education 80.2 19.8 15.2 1.8 2.8 285,971Accounting 64.2 35.7 23.4 4.6 7.7 100,923Rest of management, commerce 64.4 35.6 20.1 5.0 10.5 218,339Society and culture, creative arts 68.8 31.1 20.5 3.6 7.0 405,391Natural and physical sciences 62.6 37.4 23.8 5.4 8.2 145,453Other 71.2 28.8 19.4 3.6 5.8 189,175
Total 67.7 32.3 21.0 4.2 7.1 1,769,154
Source: 2001 Census (Australia), 2001 Census (Canada).1 Includes those with a bachelor’s or a higher degree.2 Excludes those for whom birthplace or year of arrival is unknown.
family/humanitarian categories; 38 percent of nurseswere in economic categories and 62 percent infamily/humanitarian categories; 58 percent of doctorswere in economic categories and 42 percent infamily/humanitarian categories. It seems reasonable toassume that such migrants would experience greaterdifficulty securing appropriate work in Canada, giventhat they did not undergo premigration screening bymeans of points-tested criteria.
Temporary migration flows and domesticemployer preferencesWhile this study is primarily concerned with employ-ment outcomes for landed immigrants (in both Canadaand Australia), it is important to acknowledge thatmost professional fields are also characterized bystrong temporary worker flows — a process that pro-vides insight into domestic employer preference.
Between 1991 and 2003, 2,063,022 temporary for-eign workers reached Canada, including 443,799 in2001-03 alone. Teachers (66,435) and engineers(38,572) dominated these flows, but there were alsonumerous arrivals in the field of management andcommerce (65,505). While many professionals enteredfor relatively short stays, 2004 data provided byHuman Resources and Social Development Canada(HRSDC) showed the planned arrival the following yearof 7,437 additional sponsored foreign workers, includ-ing 2,545 doctors (34 percent), 2,362 engineers (32 per-cent) and 890 nurses (12 percent). The 2005 data onplanned arrivals indicate that this momentum was sus-tained, particularly in the fields of medicine (2,926workers), mechanical engineering/technology (1,498workers), university professors (878 workers) and nurs-ing (738 workers) (HRSDC 2005, 2006).
From 2003 to 2004, the number of temporary workersresiding in OECD nations increased by 7 percent (about1.5 million people) (OECD 2006). In line with this, highlevels of temporary skilled migration also prevail inAustralia, with demand for workers varying significantlyby field and period (McDonald, Khoo and Hugo 2005;Birrell et al. 2005). There were 40,124 long-stay visasissued to temporary workers for the period 2003-04 — arise of 6 percent over the previous year. Computing pro-fessionals10 dominated in the employer-nominated cate-gories (17 percent), followed by nurses (12 percent),managers (11 percent) and accountants (3 percent)(Australia, Department of Immigration and Multiculturaland Indigenous Affairs 2005, 67-8). More recent datashow 202,195 long-term arrivals in 2004-05, of whom158,311 were students and 48,000 were temporary work-
half of all degree-qualified workers in engineering(50 percent in Canada, 48 percent in Australia), IT (51percent in Canada, 49 percent in Australia), architec-ture and building (49 percent in Canada), and medicalstudies (46 percent in Australia) (see tables 2a and2b). The proportion of 1996-2001 arrivals in selectoccupations was striking, most notably in Canada inthe fields of IT (22 percent of the total IT workforce),engineering (20 percent), and architecture and build-ing (16 percent). The suddenness of these inflowsclearly posed some risk of “flooding the market,” ashad occurred in Australia in the field of engineeringfrom 1986 to 1993 (Hawthorne 1994). The concentra-tions of professional migrants entering Australia weresomewhat lower, with key clusters located in thefields of IT (14 percent), engineering (12 percent), restof management, commerce (11 percent), and medicalstudies (10 percent).
It is also important to note the high number ofdegree-qualified arrivals in nonvocational fields — inparticular, there were 268,963 migrants with societyand culture or creative arts degrees in Canada (allperiods) and 126,077 in Australia.8 As we shall see,possession of generic rather than vocationally linkedqualifications is consistently associated with inferiorlabour market outcomes for migrants, particularly inthe first five years after arrival (Birrell andHawthorne 1997, 1999).
The immigration category of recent migrantprofessionalsAccording to Citizenship and Immigration Canada,85,363 engineers arrived in Canada between 1991 and2003 as principal applicants under the two primaryeconomic categories: 90 percent as “skilled workers”(equivalent to the “independent” category inAustralia) and 10 percent as “assisted relatives”(equivalent to the “skilled Australia-linked” category).9
Of the total 95,285 engineers who arrived in Canadaduring this period, just 10 percent (9,922) were accept-ed under the non-economic family or humanitarianprograms. We see the same pattern in IT, with 91 per-cent of degree-qualified arrivals selected in points-tested economic categories. In principle, if Canada’seconomic selection strategy is effective, such migrantsshould have an excellent chance of securing work,particularly once they are established.
By contrast, teachers, nurses and doctors oftenentered Canada through non-economic categoriesfrom 1991 to 2003: 37 percent of teachers were ineconomic categories and 63 percent in
9
Th
e Im
pa
ct of E
con
om
ic Se
lectio
n P
olicy
on
La
bo
ur M
ark
et O
utco
me
s for D
eg
ree
-Q
ua
lified
Mig
ran
ts in C
an
ad
a a
nd
Au
stralia
, by
Le
sley
an
ne
Ha
wth
orn
e

IRP
P C
ho
ice
s, V
ol.
14
, n
o.
5,
Ma
y 2
00
8
10
largely employer-driven (OECD 2006). In selectingtemporary workers, employers signal to governmentthe types of migrants they deem most immediatelyemployable. “The process generally starts whenHRSDC receives a request for a temporary foreignworker from an employer. There are no numericallimits/quotas. Employers may hire temporary foreignworkers in any occupation provided that the job offermeets a set of standard criteria. Employers recruit
ers (with a substantial number qualified in the profes-sions) (Australia, Department of Immigration andMulticultural and Indigenous Affairs 2005). Demandfor short-term migration remains strong — in 2006-07,for example, Australia selected 5,500 medical and2,500 nursing temporary migrants to meet urgentworkforce shortages.
Intakes such as this directly reflect employers’preferences; in Canada, as in Australia, they are
Table 3Number of Permanent Economic Immigrants to Canada, by Country/Region of Birth and Period of Arrival,1991-2003
Period of arrival
Category Country/region of birth 1991-96 1996-2001 2001-03 Total
Skilled worker China 16,215 42,739 25,711 84,664(principal applicants) India 5,723 18,159 12,680 36,561
Philippines 16,199 5,606 3,928 25,732Pakistan 2,432 12,666 556 21,054Hong Kong 9,537 4,653 351 14,541UK/Ireland 6,042 3,833 1,995 11,870Taiwan 2,510 6,256 999 9,764Lebanon 4,409 1,683 1,608 7,700US 3,370 2,395 875 6,639South Africa 1,556 1,560 698 3,814Malaysia/Singapore 1,069 698 450 2,216Australia 551 415 220 1,185Iraq 428 783 481 1,692Indonesia 133 581 423 1,136New Zealand 283 159 131 572Vietnam 252 189 115 555Other Europe 32,531 38,555 21,274 92,360Other Africa and Middle East 15,541 24,429 18,910 58,879Other South/Central America 12,498 9,588 7,249 29,334Other Asia/Pacific 5,937 10,874 6,718 23,528Not stated 264 192 42 497
Subtotal 137,476 186,009 110,809 434,293
Assisted relative Hong Kong 11,477 5,961 304 17,741(principal applicants) China 3,812 4,578 2,120 10,509
India 3,594 4,969 2,969 11,531Philippines 4,246 3,489 1,936 9,670Pakistan 1,092 3,166 1,878 6,135UK/Ireland 1,933 1,067 386 3,385Taiwan 1,030 2,012 249 3,290Lebanon 1,582 467 389 2,437Vietnam 1,263 150 22 1,434South Africa 528 510 158 1,195Malaysia/Singapore 523 245 128 896Iraq 309 368 160 837US 194 101 16 310Australia 34 23 2 58New Zealand 15 8 8 30Indonesia 94 109 63 265Other Europe 8,054 3,186 1,571 12,810Other Africa/Middle East 3,826 4,196 2,532 10,554Other South/Central America 4,609 2,079 1,142 7,830Other Asia/Pacific 2,738 2,335 1,405 6,478Not stated 195 103 6 304
Subtotal 51,143 39,118 17,438 107,699
Total 1,294,607 1,046,001 575,696 2,916,304
Source: Compiled by author based on landed immigrant arrivals data provided by Citizenship and Immigration Canada, 2005.

groups. By 2003-04, the UK/Ireland (22 percent), India(13 percent), China (9 percent) and South Africa (6 per-cent) were Australia’s major source countries for eco-nomic migration. By 2005-06, the figures were: India,19 percent; China, 18 percent; the UK/Ireland, 16 per-cent; and Malaysia, 4 percent (Birrell, Hawthorne andRichardson 2006; Australia, Department of Immigrationand Multicultural and Indigenous Affairs 2005).
In contrast, Canada has recently selected minus-cule numbers of degree-qualified ESB migrants aslanded immigrants: just 7 percent in 1991-96 and 5percent in 1996-2001, compared to 25 percent adecade or more earlier (before 1991) (see table 4). Theextent to which Canada’s and Australia’s migrationsystems have diverged on this score is worth high-lighting for select professional fields. From 1996 to2001, for example, just 6 percent of doctors, 4 per-cent of nurses, 2 percent of engineers and 2 percentof IT professionals migrating to Canada were derivedfrom ESB source countries. This was in contrast to,respectively, the 30 percent, 43 percent, 22 percentand 18 percent in these fields migrating to Australia.The latest indications suggest that the flow ofEnglish-speaking migrants to Canada will remainslight (Hiebert 2006).
This poses a significant policy question. Are ESBprofessionals attracted to Australia rather than toCanada, or is there some current policy impedimentto their selection that did not exist before 1991? It isworth noting here that New Zealand’s economicselection system now prioritizes ESB migration: theUK is the source of 49 percent of all New Zealand’seconomic migrants; South Africa, 12 percent; andthe US, 4 percent (Bedford 2006). Such professionals,by definition, migrate from nations that have terti-ary training systems and technological developmentlevels similar to those of Canada and Australia. Theyencounter fewer barriers related to credential recog-nition, the relevance of past work experience or pos-session of host-country language ability for theknowledge economy (a context where sophisticatedcommunication is viewed as vital). In the pastdecade, such issues have increasingly become thefocus of Canadian research as labour market out-comes for economic migrants have deteriorated andcritics have questioned the human capital model(see, for example, Picot and Hou 2003; Thompsonand Worswick 2004; Sweetman and McBride 2004;Ferrer, Green and Riddell 2004; Reitz 2005;Sweetman 2004, 2005, b; Hiebert 2006; Picot, Houand Coulombe 2007).
foreign workers who are seen as appropriate candi-dates for [the] company regardless of country of ori-gin” (Aceytuno 2004, 9).
Over time, Canadian and Australian employers havedemonstrated a marked preference for English- and (inthe case of Quebec) French-speaking background pro-fessionals (“language” also being a proxy for perceivedsimilarity in education systems). Between 1991 and2003, for instance, the primary source countries for the2,063,022 temporary foreign workers selected to enterCanada were the United States (14 percent), theUK/Ireland (4 percent), Australia (2 percent) and thePhilippines (2 percent),11 along with France and Mexico(the latter mainly providing agricultural workers). By2006, the US was supplying 16,841 (15 percent) of thetotal of 112,658 foreign workers selected, compared tothe 13,933 (12 percent) supplied by Mexico, 8,681 (8percent) by France, 8,529 by the Philippines (8 percent)and 7,442 (7 percent) by Australia. (The comparable2005 figures were: the US, 17 percent; Mexico, 13 per-cent; the UK/Ireland, 8 percent; Australia, 8 percent; andFrance, 7 percent [Hiebert 2006, 2007].) Primary tempo-rary workers for Australian employers in recent yearshave come from the UK/Ireland (35 percent), India (10percent), the US (7 percent) and South Africa and Japan(5 percent each) (Australia, Department of Immigrationand Multicultural and Indigenous Affairs 2005).
As shown in table 3, there is now a major discon-nect between the top recent source countries of eco-nomic migrants and employer choice in Canada. From1991 to 2003, the main countries of origin of landedskilled workers in Canada were China, India, thePhilippines and Pakistan (all of whom have experienceda relatively lower rate of success at securing profession-al work). From 2001-02 to 2005-06, when the LSIC wasadministered, the top three PA source countries wereChina, India and Pakistan, while English-speaking-background (ESB) migration had decreased to negligi-ble levels (Schellenberg and Maheux 2007).
The decline of English-speaking professionalmigration to Canada Australia differs markedly from Canada in maintain-ing strong ESB migration (from the UK/Ireland, SouthAfrica, New Zealand, the US and Canada) while alsoexpanding and more effectively screening its domi-nant flows from China and India. After the propor-tion of ESB migrants decreased from 38 percent to 20percent in 1991-96, it reverted to 28 percent in 1996-2001 due to persistent evidence of the inferior labourmarket integration rates secured by select NESB
11
Th
e Im
pa
ct of E
con
om
ic Se
lectio
n P
olicy
on
La
bo
ur M
ark
et O
utco
me
s for D
eg
ree
-Q
ua
lified
Mig
ran
ts in C
an
ad
a a
nd
Au
stralia
, by
Le
sley
an
ne
Ha
wth
orn
e

IRP
P C
ho
ice
s, V
ol.
14
, n
o.
5,
Ma
y 2
00
8
12
within the first five years after arrival, given virtuallyidentical economic cycles?
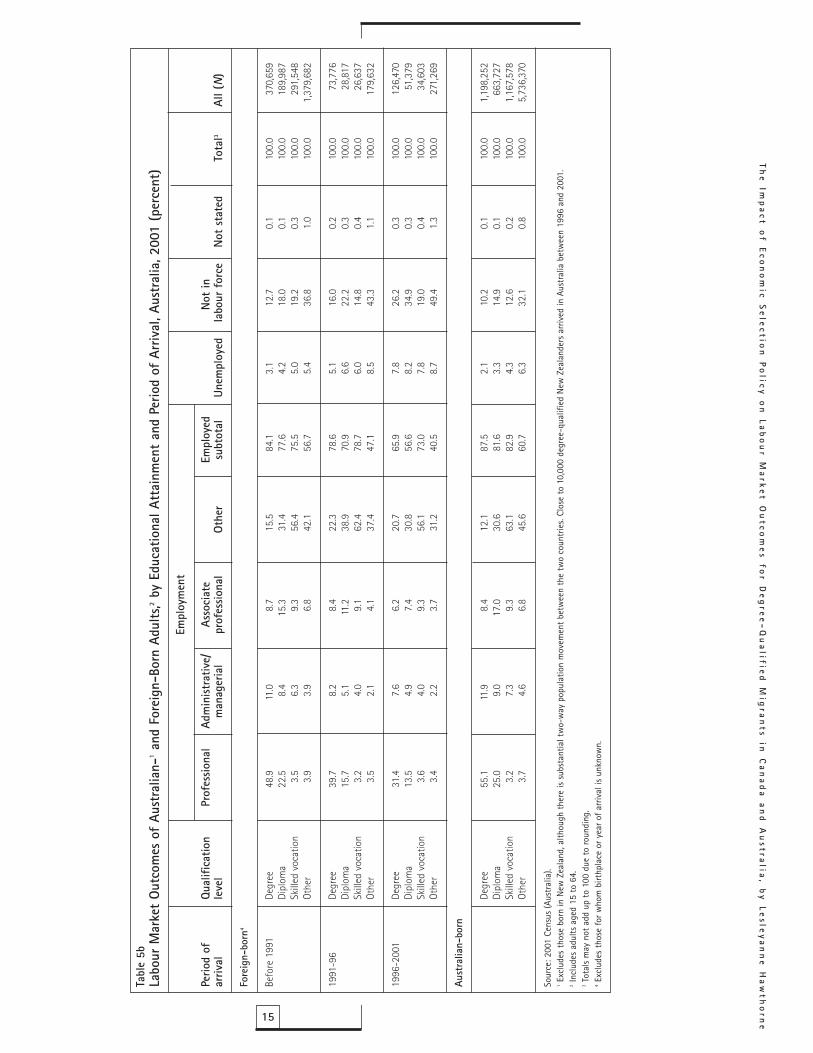
In brief, this study found that Canada and Australiarepresent highly comparable settlement sites for foreign-trained professionals (see tables 5a and 5b on pp. 16-17):• Degree- and higher-degree-qualified migrants
enjoyed a substantial labour market advantagein both countries relative to migrants withdiploma-level credentials — a finding that
strongly affirms contemporary economic migra-tion priorities.
• In general, degree-qualified migrants secured pro-fessional employment at double or more the rateof migrants who were diploma-qualified, althoughoutcomes for diploma-level migrants were some-what better in Australia.
• By 2001, 65 percent of degree-qualified 1996-2001arrivals had secured work of some kind in Canada,compared to 66 percent of these arrivals inAustralia.
• Overall, 29.8 percent of recent degree-qualifiedmigrants in Canada had secured professional posi-tions within five years of arrival, compared to 31.4
While governments frame economic migrationpolicy, employers retain the power to offer or with-hold work. Rightly or wrongly, as we have seen,patterns of temporary worker selection demonstratethe strength of employer preference for high-levelhost-country language ability, similar educationsystems and a perceived capacity to integrate athigh speed.
Employment Outcomes forDegree-Qualified Migrants: The2001 CensusLabour market integration rates for 1996-2001 arrivals
T he 2001 Census allows assessment of the degree ofsimilarity between Canada and Australia as settle-ment sites for otherwise comparable degree-quali-
fied migrants (in all immigration categories — economic,family and humanitarian). How quickly and at whatlevel do recent arrivals secure work in each country
Table 4Proportion of Degree-Qualified Immigrants from English-Speaking-Background (ESB) Countries, by SelectVocational Field and Period of Arrival, Canada and Australia, 2001
Canada Australia
Degree-qualified ESB Degree-qualified ESBimmigrants countries1 immigrants countries2
Period of arrival N N % N N %
Before 1991
All fields 537,565 136,280 25 347,815 131,803 38Engineers 15 24Doctors 27 30Nurses 25 56Information technology 2 21
1991-96
All fields 154,160 11,477 7 70,702 13,999 20Engineers 3 11Doctors 13 22Nurses 5 38Information technology 3 11
1996-2001
All fields 257,714 12,762 5 116,986 32,777 28Engineers 2 22Doctors 6 30Nurses 4 43Information technology 2 18
Source: 2001 Census (Canada), Statistics Canada and Australian Bureau of Statistics.1 UK/Ireland, South Africa, Australia, New Zealand and the US.2 UK/Ireland, South Africa, Canada and the US.

were less likely to be out of the workforce. Canada’sawarding of bonus points for higher education is thus asound policy decision. However, possession of a graduatedegree had minimal influence on unemployment levels,and Canadian-born professionals with similar credentialsalso outperformed migrants across all arrival periods.
The significance of birthplace to immigrants’employment outcomesTo what extent does birthplace influence employmentoutcomes when migrants seeking host-country employ-ment are degree-qualified? The Census provides unam-biguous insight on this question, strongly affirmingemployer preferences as previously described in rela-tion to temporary workers (see page 11).
The primary source countries for economic prin-cipal applicants to Canada in 2001-03 were: China, 22percent; India, 12 percent; Pakistan, 6 percent; and thePhilippines, 5 percent. (To compare, the UK/Irelandaccounted for just 2 percent.) When major regions oforigin are also considered, the top eight source coun-tries/regions for economic PAs in this period were:China, 21.7 percent; Northwestern Europe, 17.8 percent;Other Africa12/Middle East, 16.7 percent; India, 12.2percent; Other South/Central America, 6.5 percent;Other Asia/Pacific, 6.3 percent; Pakistan, 6.1 percent;and the Philippines, 4.6 percent.
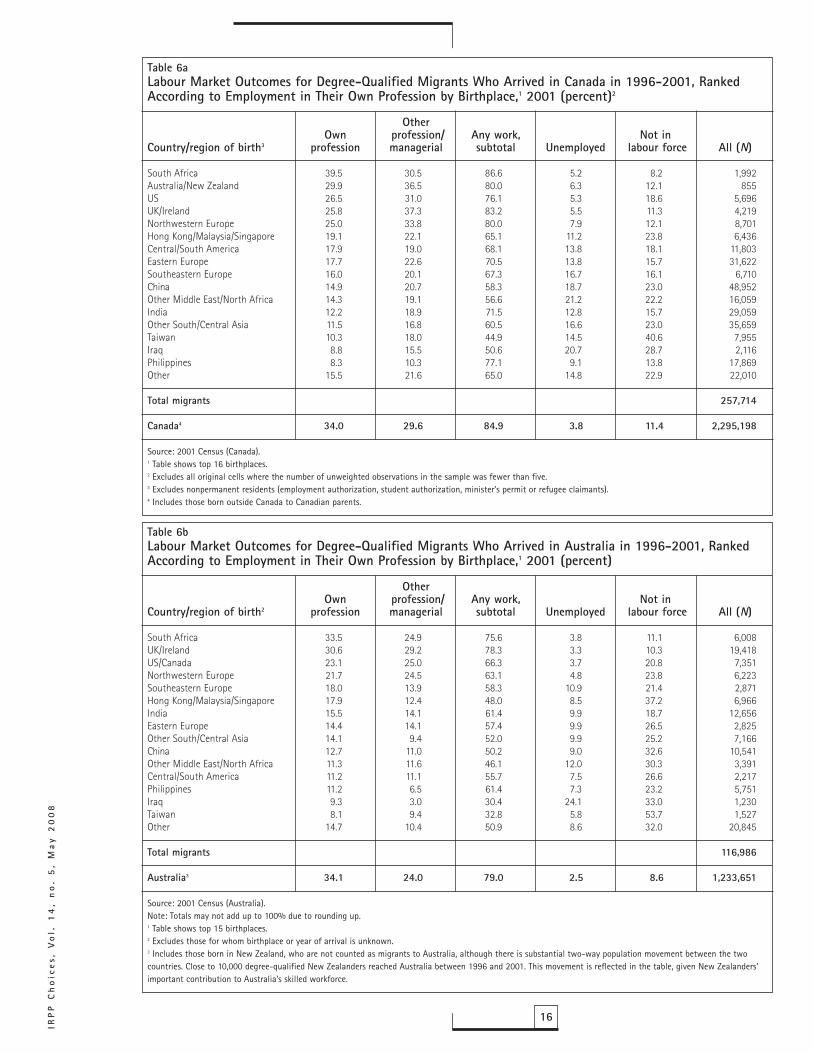
As we shall see, recent changes in the source coun-tries for immigrants (all categories) drawn on by bothCanada and Australia had a negative impact on employ-ment outcomes. Degree-qualified 1996-2001 arrivals toCanada from the following countries/regions were mostlikely to have secured professional work by 2001: SouthAfrica (70 percent of migrants working in their own oranother profession); Australia/New Zealand (over 66 per-cent); UK/Ireland (63 percent) and Northwestern Europe(59 percent); and the US (58 percent) (see table 6a, p. 18).The rank order for 1996-2001 arrivals securing earlyprofessional employment in Australia was virtually iden-tical: UK/Ireland (60 percent); South Africa (58 percent);US/Canada, 48 percent; and Northwestern Europe(46 percent) (see table 6b, p. 18). The corresponding ratefor New Zealand is 48 percent (not shown).
In both Canada and Australia, the likelihood ofrecent degree-qualified migrants securing professionalwork within five years of arrival dropped substantiallyamong other birthplace groups, with many arrivals atrisk of severe skills discounting (tables 6a and 6b).Similar migrants faced the greatest level of disadvan-tage in each country: those from Iraq, Taiwan andOther North and Southeast Asia ranked lowest in terms
percent in Australia. In Canada, 5.0 percent hadswitched to administrative or managerial work, com-pared to 7.6 percent in Australia; substantial numbersin both nations also clustered in lower-skill positions.
• Unemployment was a greater problem in Canadathan in Australia: 14.7 percent of 1996-2001degree-qualified Canadian arrivals remained out ofwork, compared to 7.8 percent of Australianarrivals.
• Australia, by contrast, had larger numbers of recentdegree-qualified arrivals categorized as “not in thelabour force” (typically applying themselves tolearning English or securing credential recognition):26.2 percent of 1996-2001 Australian arrivals, com-pared to 20.4 percent of Canadian ones. This almostcertainly reflects Australia’s sustained investment inlanguage and labour market training programssince the mid-1980s — a strategy currently receiv-ing impressive funding and attention in Canada(Reitz 2005; Orme 2007; Alboim and Cohl 2007;Lemay 2007; Cardozo and Guilfoyle 2007).
• As noted earlier, migrants to both Canada andAustralia holding trade/vocational qualifications alsoperformed well; their employment rates were similarto those of degree-qualified migrants in every periodof arrival. For example, in Canada, 65 percent ofdegree-qualified 1996-2001 arrivals had securedwork by 2001, compared to 62 percent of migrantswith post-secondary diplomas. The outcomes forAustralia were 66 percent employment within thefirst five years for degree-qualified migrants, com-pared to an impressive 73 percent for those in skilledvocational fields. This finding supports the contem-porary policy decisions made in each country to ele-vate the level of trades-qualified migration.Unlike the Australian Census, the Canadian Census
allows analysis of employment outcomes for recentand long-established migrants by degree type. In brief,highly superior outcomes were secured by migrantsholding a master’s degree or a Ph.D. in Canada in allarrival periods. By 2001, 61 percent of pre-1991arrivals with higher degrees had secured professionalpositions, compared to 45 percent of arrivals withbachelor’s degrees. The comparable rate for 1991-96arrivals was 53 percent (versus 31 percent), and for1996-2001 it was 44 percent (versus 24 percent). Thesefindings were reasonably similar to figures for theCanadian-born: 64 percent of those holding master’sdegrees or Ph.D.s had professional positions by 2001,compared to 52 percent of those with bachelor’sdegrees. Furthermore, higher-degree-qualified migrants
13
Th
e Im
pa
ct of E
con
om
ic Se
lectio
n P
olicy
on
La
bo
ur M
ark
et O
utco
me
s for D
eg
ree
-Q
ua
lified
Mig
ran
ts in C
an
ad
a a
nd
Au
stralia
, by
Le
sley
an
ne
Ha
wth
orn
e

IRP
P C
ho
ice
s, V
ol.
14
, n
o.
5,
Ma
y 2
00
8
14
Tabl
e 5a
Labo
ur M
arke
t Ou
tcom
es o
f Ca
nadi
an-
and
Fore
ign-
Born
Adu
lts,1
by E
duca
tiona
l Att
ainm
ent
and
Perio
d of
Arr
ival
, Can
ada,
200
1 (p
erce
nt)
Empl
oym
ent
Educ
atio
nal
Prof
essio
nal
Adm
inist
rativ
e/As
soci
ate
Empl
oyed
Not
inFo
reig
n-bo
rn2
atta
inm
ent
man
ager
ial
prof
essio
nal
Othe
r su
btot
alUn
empl
oyed
labo
ur f
orce
Tota
l3Al
l (N)
Befo
re 1
991
Degr
ee49
.09.
55.
818
.382
.74.
113
.210
0.0
552,
971
Post
-sec
onda
ryw
ith d
iplo
ma
20.2
9.4
11.0
38.6
79.2
5.1
15.7
100.
052
7,58
5Po
st-s
econ
dary
no d
iplo
ma
8.7
8.5
5.7
52.2
75.1
6.3
18.7
100.
049
6,08
0Hi
gh s
choo
l or l
ess
3.8
6.6
2.4
50.8
63.6
5.3
31.1
100.
01,
080,
428
1991
-96
Degr
ee36
.47.
47.
125
.876
.77.
915
.410
0.0
159,
059
Post
-sec
onda
ryw
ith d
iplo
ma
13.8
6.6
9.8
43.9
74.0
8.6
17.4
100.
012
2,94
5Po
st-s
econ
dary
no d
iplo
ma
5.1
5.0
5.1
49.5
64.7
11.0
24.4
100.
013
3,18
1Hi
gh s
choo
l or l
ess
1.8
3.5
1.9
47.1
54.3
8.7
37.1
100.
030
4,24
8
1996
-200
1De
gree
29.8
5.0
6.3
23.8
64.9
14.7
20.4
100.
026
6,10
9Po
st-s
econ
dary
with
dip
lom
a10
.35.
17.
139
.061
.513
.025
.510
0.0
108,
059
Post
-sec
onda
ryno
dip
lom
a4.
93.
83.
844
.657
.112
.930
.010
0.0
103,
199
High
sch
ool o
r les
s1.
62.
41.
439
.544
.810
.644
.610
0.0
249,
514
Cana
dian
-bor
n4
Degr
ee53
.89.
45.
116
.584
.83.
811
.410
0.0
2,39
5,91
8Po
st-s
econ
dary
with
dip
lom
a19
.48.
212
.740
.981
.15.
513
.410
0.0
3,04
2,52
9Po
st-s
econ
dary
no d
iplo
ma
7.6
6.8
5.8
55.4
75.6
8.5
16.0
100.
03,
215,
110
High
sch
ool o
r les
s3.
34.
82.
550
.460
.98.
230
.910
0.0
7,35
5,87
0
Sour
ce: 2
001
Cens
us (C
anad
a)1
Incl
udes
adu
lts a
ged
15 t
o 64
.2
Excl
udes
non
perm
anen
t re
siden
ts (t
hose
with
em
ploy
men
t au
thor
izat
ion,
stu
dent
aut
horiz
atio
n or
a m
inist
er’s
perm
it, o
r ref
ugee
cla
iman
ts).
3To
tals
may
not
add
up
to 1
00 d
ue t
o ro
undi
ng.
4In
clud
es t
hose
bor
n ou
tsid
e Ca
nada
to
Cana
dian
par
ents
.
15
Th
e Im
pa
ct of E
con
om
ic Se
lectio
n P
olicy
on
La
bo
ur M
ark
et O
utco
me
s for D
eg
ree
-Q
ua
lified
Mig
ran
ts in C
an
ad
a a
nd
Au
stralia
, by
Le
sley
an
ne
Ha
wth
orn
e
Tabl
e 5b
Labo
ur M
arke
t Ou
tcom
es o
f Au
stra
lian-
1an
d Fo
reig
n-Bo
rn A
dults
,2by
Edu
catio
nal A
ttai
nmen
t an
d Pe
riod
of A
rriv
al, A
ustr
alia
, 200
1 (p
erce
nt)
Empl
oym
ent
Perio
d of
Qual
ifica
tion
Prof
essio
nal
Adm
inist
rativ
e/As
soci
ate
Empl
oyed
Not
inar
rival
leve
lm
anag
eria
lpr
ofes
siona
lOt
her
subt
otal
Unem
ploy
edla
bour
for
ceN
ot s
tate
dTo
tal3
All (
N)
Fore
ign-
born
4
Befo
re 1
991
Degr
ee48
.911
.08.
715
.584
.13.
112
.70.
110
0.0
370,
659
Dipl
oma
22.5
8.4
15.3
31.4
77.6
4.2
18.0
0.1
100.
018
9,98
7Sk
illed
voc
atio
n3.
56.
39.
356
.475
.55.
019
.20.
310
0.0
291,
548
Othe
r3.
93.
96.
842
.156
.75.
436
.81.
010
0.0
1,37
9,68
2
1991
-96
Degr
ee39
.78.
28.
422
.378
.65.
116
.00.
210
0.0
73,7
76Di
plom
a15
.75.
111
.238
.970
.96.
622
.20.
310
0.0
28,8
17Sk
illed
voc
atio
n3.
24.
09.
162
.478
.76.
014
.80.
410
0.0
26,6
37Ot
her
3.5
2.1
4.1
37.4
47.1
8.5
43.3
1.1
100.
017
9,63
2
1996
-200
1De
gree
31.4
7.6
6.2
20.7
65.9
7.8
26.2
0.3
100.
012
6,47
0Di
plom
a13
.54.
97.
430
.856
.68.
234
.90.
310
0.0
51,3
79Sk
illed
voc
atio
n3.
64.
09.
356
.173
.07.
819
.00.
410
0.0
34,6
03Ot
her
3.4
2.2
3.7
31.2
40.5
8.7
49.4
1.3
100.
027
1,26
9
Aust
ralia
n-bo
rn
Degr
ee55
.111
.98.
412
.187
.52.
110
.20.
110
0.0
1,19
8,25
2Di
plom
a25
.09.
017
.030
.681
.63.
314
.90.
110
0.0
663,
727
Skill
ed v
ocat
ion
3.2
7.3
9.3
63.1
82.9
4.3
12.6
0.2
100.
01,
167,
578
Othe
r3.
74.
66.
845
.660
.76.
332
.10.
810
0.0
5,73
6,37
0
Sour
ce: 2
001
Cens
us (A
ustr
alia
).1
Excl
udes
tho
se b
orn
in N
ew Z
eala
nd, a
lthou
gh t
here
is s
ubst
antia
l tw
o-w
ay p
opul
atio
n m
ovem
ent
betw
een
the
two
coun
trie
s. Cl
ose
to 1
0,00
0 de
gree
-qua
lifie
d N
ew Z
eala
nder
s ar
rived
in A
ustr
alia
bet
wee
n 19
96 a
nd 2
001.
2
Incl
udes
adu
lts a
ged
15 t
o 64
.3
Tota
ls m
ay n
ot a
dd u
p to
100
due
to
roun
ding
.4
Excl
udes
tho
se fo
r who
m b
irthp
lace
or y
ear o
f arr
ival
is u
nkno
wn.
IRP
P C
ho
ice
s, V
ol.
14
, n
o.
5,
Ma
y 2
00
8
16
Table 6aLabour Market Outcomes for Degree-Qualified Migrants Who Arrived in Canada in 1996-2001, RankedAccording to Employment in Their Own Profession by Birthplace,1 2001 (percent)2
OtherOwn profession/ Any work, Not in
Country/region of birth3 profession managerial subtotal Unemployed labour force All (N)
South Africa 39.5 30.5 86.6 5.2 8.2 1,992Australia/New Zealand 29.9 36.5 80.0 6.3 12.1 855US 26.5 31.0 76.1 5.3 18.6 5,696UK/Ireland 25.8 37.3 83.2 5.5 11.3 4,219Northwestern Europe 25.0 33.8 80.0 7.9 12.1 8,701Hong Kong/Malaysia/Singapore 19.1 22.1 65.1 11.2 23.8 6,436Central/South America 17.9 19.0 68.1 13.8 18.1 11,803Eastern Europe 17.7 22.6 70.5 13.8 15.7 31,622Southeastern Europe 16.0 20.1 67.3 16.7 16.1 6,710China 14.9 20.7 58.3 18.7 23.0 48,952Other Middle East/North Africa 14.3 19.1 56.6 21.2 22.2 16,059India 12.2 18.9 71.5 12.8 15.7 29,059Other South/Central Asia 11.5 16.8 60.5 16.6 23.0 35,659Taiwan 10.3 18.0 44.9 14.5 40.6 7,955Iraq 8.8 15.5 50.6 20.7 28.7 2,116Philippines 8.3 10.3 77.1 9.1 13.8 17,869Other 15.5 21.6 65.0 14.8 22.9 22,010
Total migrants 257,714
Canada4 34.0 29.6 84.9 3.8 11.4 2,295,198
Source: 2001 Census (Canada).1 Table shows top 16 birthplaces.2 Excludes all original cells where the number of unweighted observations in the sample was fewer than five.3 Excludes nonpermanent residents (employment authorization, student authorization, minister's permit or refugee claimants).4 Includes those born outside Canada to Canadian parents.
Table 6bLabour Market Outcomes for Degree-Qualified Migrants Who Arrived in Australia in 1996-2001, RankedAccording to Employment in Their Own Profession by Birthplace,1 2001 (percent)
OtherOwn profession/ Any work, Not in
Country/region of birth2 profession managerial subtotal Unemployed labour force All (N)
South Africa 33.5 24.9 75.6 3.8 11.1 6,008UK/Ireland 30.6 29.2 78.3 3.3 10.3 19,418US/Canada 23.1 25.0 66.3 3.7 20.8 7,351Northwestern Europe 21.7 24.5 63.1 4.8 23.8 6,223Southeastern Europe 18.0 13.9 58.3 10.9 21.4 2,871Hong Kong/Malaysia/Singapore 17.9 12.4 48.0 8.5 37.2 6,966India 15.5 14.1 61.4 9.9 18.7 12,656Eastern Europe 14.4 14.1 57.4 9.9 26.5 2,825Other South/Central Asia 14.1 9.4 52.0 9.9 25.2 7,166China 12.7 11.0 50.2 9.0 32.6 10,541Other Middle East/North Africa 11.3 11.6 46.1 12.0 30.3 3,391Central/South America 11.2 11.1 55.7 7.5 26.6 2,217Philippines 11.2 6.5 61.4 7.3 23.2 5,751Iraq 9.3 3.0 30.4 24.1 33.0 1,230Taiwan 8.1 9.4 32.8 5.8 53.7 1,527Other 14.7 10.4 50.9 8.6 32.0 20,845
Total migrants 116,986
Australia3 34.1 24.0 79.0 2.5 8.6 1,233,651
Source: 2001 Census (Australia).Note: Totals may not add up to 100% due to rounding up.1 Table shows top 15 birthplaces.2 Excludes those for whom birthplace or year of arrival is unknown.3 Includes those born in New Zealand, who are not counted as migrants to Australia, although there is substantial two-way population movement between the twocountries. Close to 10,000 degree-qualified New Zealanders reached Australia between 1996 and 2001. This movement is reflected in the table, given New Zealanders’important contribution to Australia’s skilled workforce.
of work access, with the worst employment ratesbeing experienced by the Lebanese in Canada and theVietnamese in Australia (not shown). Large numbersof degree-qualified migrants from the Philippines,India, Vietnam and Other South/Central Asia securedemployment only by taking low-skill positions — asignificant migration policy issue, given the scale ofcurrent migration from these regions.
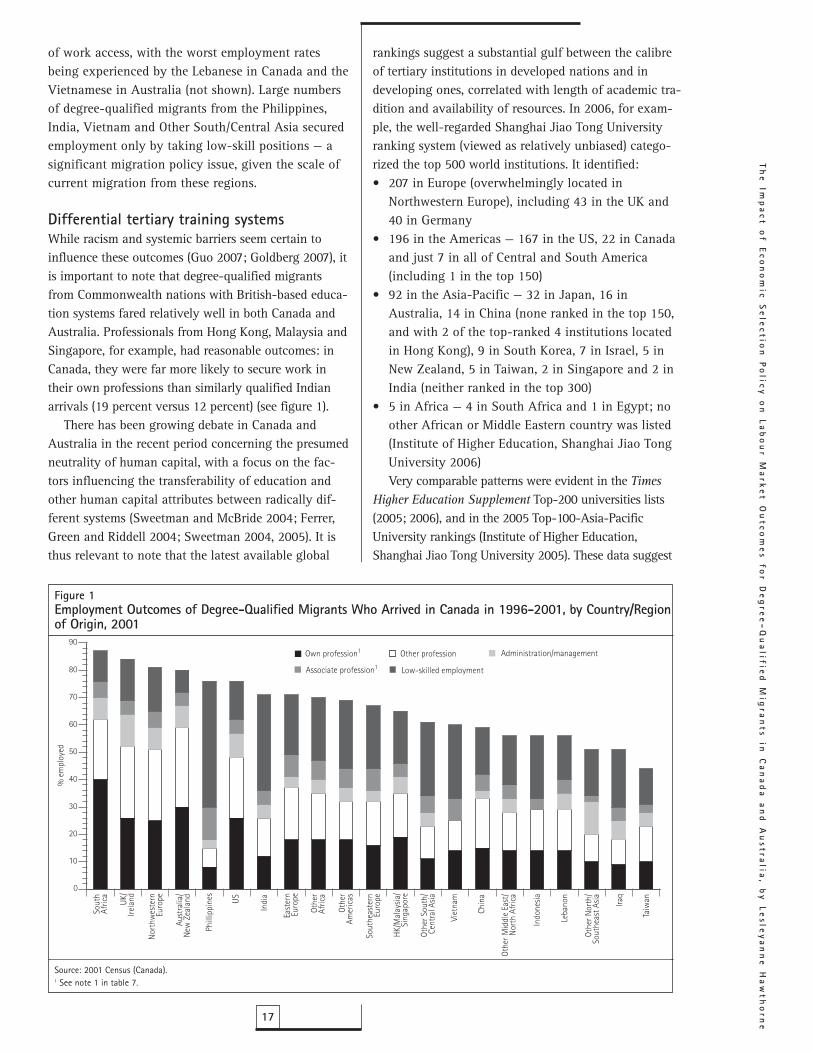
Differential tertiary training systemsWhile racism and systemic barriers seem certain toinfluence these outcomes (Guo 2007; Goldberg 2007), itis important to note that degree-qualified migrantsfrom Commonwealth nations with British-based educa-tion systems fared relatively well in both Canada andAustralia. Professionals from Hong Kong, Malaysia andSingapore, for example, had reasonable outcomes: inCanada, they were far more likely to secure work intheir own professions than similarly qualified Indianarrivals (19 percent versus 12 percent) (see figure 1).
There has been growing debate in Canada andAustralia in the recent period concerning the presumedneutrality of human capital, with a focus on the fac-tors influencing the transferability of education andother human capital attributes between radically dif-ferent systems (Sweetman and McBride 2004; Ferrer,Green and Riddell 2004; Sweetman 2004, 2005). It isthus relevant to note that the latest available global
rankings suggest a substantial gulf between the calibreof tertiary institutions in developed nations and indeveloping ones, correlated with length of academic tra-dition and availability of resources. In 2006, for exam-ple, the well-regarded Shanghai Jiao Tong Universityranking system (viewed as relatively unbiased) catego-rized the top 500 world institutions. It identified: • 207 in Europe (overwhelmingly located in
Northwestern Europe), including 43 in the UK and40 in Germany
• 196 in the Americas — 167 in the US, 22 in Canadaand just 7 in all of Central and South America(including 1 in the top 150)
• 92 in the Asia-Pacific — 32 in Japan, 16 inAustralia, 14 in China (none ranked in the top 150,and with 2 of the top-ranked 4 institutions locatedin Hong Kong), 9 in South Korea, 7 in Israel, 5 inNew Zealand, 5 in Taiwan, 2 in Singapore and 2 inIndia (neither ranked in the top 300)
• 5 in Africa — 4 in South Africa and 1 in Egypt; noother African or Middle Eastern country was listed(Institute of Higher Education, Shanghai Jiao TongUniversity 2006)Very comparable patterns were evident in the Times
Higher Education Supplement Top-200 universities lists(2005; 2006), and in the 2005 Top-100-Asia-PacificUniversity rankings (Institute of Higher Education,Shanghai Jiao Tong University 2005). These data suggest
17
Th
e Im
pa
ct of E
con
om
ic Se
lectio
n P
olicy
on
La
bo
ur M
ark
et O
utco
me
s for D
eg
ree
-Q
ua
lified
Mig
ran
ts in C
an
ad
a a
nd
Au
stralia
, by
Le
sley
an
ne
Ha
wth
orn
e
0
10
20
30
40
50
60
70
80
90Own profession1 Other profession
Sout
hAf
rica
UK/
Irela
nd
Nor
thw
este
rnEu
rope
Aust
ralia
/N
ew Z
eala
nd
Phill
ippi
nes
US
Indi
a
East
ern
Euro
pe
Othe
rAf
rica
Othe
rAm
eric
as
Sout
heas
tern
Euro
pe
HK/M
alay
sia/
Sing
apor
e
Othe
r Sou
th/
Cent
ral A
sia
Viet
nam
Taiw
anIraq
Othe
r Nor
th/
Sout
heas
t Asia
Leba
non
Indo
nesia
Othe
r Mid
dle
East
/N
orth
Afr
ica
Chin
a
Administration/management
Associate profession1 Low-skilled employment
% e
mpl
oyed
Figure 1Employment Outcomes of Degree-Qualified Migrants Who Arrived in Canada in 1996-2001, by Country/Regionof Origin, 2001
Source: 2001 Census (Canada).1 See note 1 in table 7.
IRP
P C
ho
ice
s, V
ol.
14
, n
o.
5,
Ma
y 2
00
8
18
employed in their own profession in Canada by 2001(compared to 21.7 percent in Australia), 19.1 percentfrom Hong Kong/Malaysia/Singapore (compared to 17.9percent), 17.9 percent from Central/South America (com-pared to 11.2 percent), 14.9 percent from China (com-pared to 12.7 percent). However, the percentage ofdegree-qualified migrants from India employed in theirown profession was higher in Australia (15.5 percent)than in Canada (12.2 percent). Factoring employment inother professions or managerial positions into the analy-sis intensified this pattern (see tables 6a and 6b).
Overall, however, newly arrived degree-qualifiedmigrants from disadvantaged birthplace groups reportedlower unemployment levels in Australia than in Canadaat a time when national unemployment rates for thenative-born with degrees were 4 percent in Canada and 2percent in Australia. The unemployment rate for migrantsfrom Other Middle East/North Africa was 21 percent inCanada (compared to 12 percent in Australia), 19 percentfor China (compared to 9 percent), 17 percent for OtherSouth/Central Asia (compared to 10 percent), 17 percentfor Southeastern Europe (compared to 11 percent), 15 per-cent for Taiwan (compared to 6 percent), 14 percent forEastern Europe (compared to 10 percent) and 13 percentfor India (compared to 10 percent) (see tables 6a and 6b).
Many birthplace groups in Canada and Australiahad high proportions of members categorized as not inthe labour force — most notably, migrants from Taiwan,other North and Southeast Asia, Indonesia, Lebanonand Iraq. Substantial numbers of these migrants, itseems fair to presume, were learning English or Frenchor repositioning themselves to enter the labour marketby following a program of study related to achievingcredential recognition (Hawthorne 2007b).
Length of residence and employment outcomesIn line with the research literature, superior employmentoutcomes were achieved by long-established degree-qualified migrants in both Canada and Australia (definedas resident 10 years or more in the host country).Encouragingly, this pattern included initially disadvan-taged groups, whose unemployment rates more nearlyapproximated host country norms. For example, by 2001ESB migrants who had been in Canada 10 years or morehad achieved representation in the professions that wasequal or superior to the Canadian-born. As in Australia,South Africans represented the most elite migrant groupoverall, with 87 percent of South African migrants work-ing, compared to 85 percent of the Canadian-born, and ahigh 71 percent were occupying professional or manage-rial positions (compared to 64 percent of the Canadian-
that the quality of higher education is highly variable inthe contemporary economic migrant source countries ofCanada and Australia — the ranking of Indian institu-tions being particularly low, with just 2 listed in the top500. In medicine, for instance, schools have proliferatedglobally in the past 30 years, principally in Asia (India,China and the Philippines) and Africa. By March 2005,1,981 courses were listed by the International MedicalEducation Directory across 170 nations, with half ofthem in 10 countries (Foundation for Advancement ofInternational Medical Education and Research 2005).Minimal data, however, are available concerning the cal-ibre of curricula and clinical training, student selectionand the length of training in many Asian and Africandegree programs (Boulet et al. 2005).
Perceived educational quality powerfully influencesthe decision of employers to hire professional staff,despite the undoubted intellectual and adaptive capaci-ty of incoming migrants. Adams maintains that “[a]sthe number of foreign-trained professionals in Canadaincreases, professional bodies are faced with an eclec-tic array of practitioners with training that may differsubstantially from our own. There is no guarantee thatthey possess the skills, background and approachdeemed essential by practitioners in Canada” (2007,15). In dealing with the unknown, regulatory bodiesand employers typically adopt risk-averse strategies.According to Kustec, Thompson and Li, “The extent towhich credential recognition problems result from alack of knowledge on newcomers’ part on how to haveskills recognised, a lack of knowledge on employers’part of foreign credentials, a lower quality of foreigncredentials relative to domestic qualifications, versusmarket barriers caused by professional association pro-tectionism, or broader societal discrimination, is notwell understood” (2007, 26).
Despite such barriers, it is encouraging to note thatthe 2001 Census analysis confirmed outcomes to be fair-ly positive for degree-qualified migrants in both Canadaand Australia. A total of 31.4 percent of recent migrantswith degrees were employed in their own or some otherprofession by 2001 in Australia, compared to 23.5 per-cent of migrants with bachelor’s degrees and 43.9 per-cent with master’s degrees in Canada. Among 1996-2001arrivals in Australia, 7.6 percent had found managerialor administrative work, compared to 5.2 percent withbachelor’s degrees and 4.6 percent with master’s degreesin Canada. In terms of outcomes by birthplace, a rangeof recently arrived degree-qualified migrants had per-formed better in Canada than in Australia. For example,25.0 percent of Northwestern European migrants were

tials, lack of computer training, the need to acquire field-specific English language terminology or lack of localindustrial experience. Despite fewer economic migrantsnow requiring such courses, this level of funding has beenmaintained (Australia, Department of Immigration andCitizenship 2007b).
The influence of domestic labour demand byfield on absorptive capacityGeneral employment patterns aside, to what extentdoes supply and demand in specific professions influ-ence labour market integration for recent degree-quali-fied migrants? A number of immigrant-receivingnations affirm the value of factoring in domesticdemand — for example, the US Independent Task Forceon Immigration and America’s Future has recommend-ed to Congress the introduction of “a new provisionalcategory designed to allow workers meeting long-termlabor market needs to transition from an initially tem-porary to a permanent immigration status” (MigrationPolicy Institute 2006; Abraham and Hamilton 2006).
Australia restored labour demand as a key selectioncriteria as of 1999, following a decade of evidence show-ing outcomes for skilled migrants to be strongly affectedby domestic supply (Birrell and Hawthorne 1999). By July2005, Australia’s Migration Occupations in Demand List(MODL) had become the critical determinant of economicselection of migrants, including which principal appli-cants could avoid regional entry and enjoy unconstrainedlocational choice. Based on twice-yearly labour marketanalyses, 20 points are allocated to PAs in high-demandfields13 (one-sixth of the total points required). MODLapplications have risen dramatically as a consequence,from 9 percent of all skilled PAs in 2003-04 to 42 percentin 2004-05. Within the current environment this favoursthe selection of accountants, nurses, doctors and selecttradespeople — fields characterized by sustained labourundersupply (Birrell, Hawthorne and Richardson 2006).
Canada, by contrast, does not factor employmentdemand by field into its economic selection process,reflecting:• A national commitment to achieving 1 percent
annual population growth (designed to nation-buildwhile offsetting an aging population)
• The time lags inherent in the immigrant selectionand arrival processes
• The difficulty of accurately predicting labour marketdemand by field
• The adoption of a human capital model of economicimmigration based on the presumed flexibility of skilledmigrant workers (Beach, Green and Reitz 2003)
born). Select Asian groups had also achieved representa-tion in the professions equivalent to the Canadian-born,including those from Vietnam and Hong Kong,Singapore and Malaysia, with those born in Indonesiaand China also faring well. Good rates of access to theprofessions had been achieved by other visible minoritygroups, including migrants from Other Middle East/NorthAfrica — all had better representation in their own andother professions than migrants born in Eastern andSoutheastern Europe, India, other parts of Asia, Taiwanand the Philippines.
Contemporary research, however, challenges the per-sistence of this pattern in Canada in the future(Thompson and Worswick 2004; Picot, Hou andCoulombe 2007). Moreover, long-established degree-qualified migrants in Australia have achieved higherlevels of employment in their own professions thanthose in Canada: most notably, those qualified in HongKong/Malaysia/Singapore (34 percent in Australia, com-pared to 25 percent in Canada); Other South/CentralAsia (27 percent, compared to 18 percent); India (26percent, compared to 18 percent); Southeastern Europe(24 percent, compared to 20 percent); and Iraq (18 per-cent, compared to 14 percent). This gives credence to theview that visible minorities experience greater disadvan-tage in Canada, despite the fact that 1996-2001 arrivalsfrom a range of such groups had less initial access totheir professions in Australia.
Australia’s lower unemployment rates may reflectmajor investment in language and employment settle-ment services for disadvantaged groups — a strategy nowstrongly endorsed by Canada, and supported by a veryimpressive level of funding (Reitz 2005; Alboim and Cohl2007; Hawthorne 2007b). By the early 1990s, Australiahad developed the world’s most comprehensive settle-ment services for skilled migrants, located primarily inSydney and Melbourne (the major immigrant-receivingsites). English courses were free, and migrants were paidto take them, supported by immediate access to socialsecurity benefits. The Australian government simultane-ously invested heavily in employment and credentialrecognition bridging programs, supported by payment ofadditional incentive allowances. As early as 1992-93,$AUD99.7 million was being spent per year on specialistlabour market programs for NESB professionals, in addi-tion to $AUD110.6 on English-language instruction, anda further $AUD42.2 million was channelled through thetechnical education sectors (Hawthorne 2005, 1994). Tendifferent models of bridging courses had been developedfor engineers, addressing, for instance, specific labourmarket disadvantages such as nonrecognition of creden-
19
Th
e Im
pa
ct of E
con
om
ic Se
lectio
n P
olicy
on
La
bo
ur M
ark
et O
utco
me
s for D
eg
ree
-Q
ua
lified
Mig
ran
ts in C
an
ad
a a
nd
Au
stralia
, by
Le
sley
an
ne
Ha
wth
orn
e
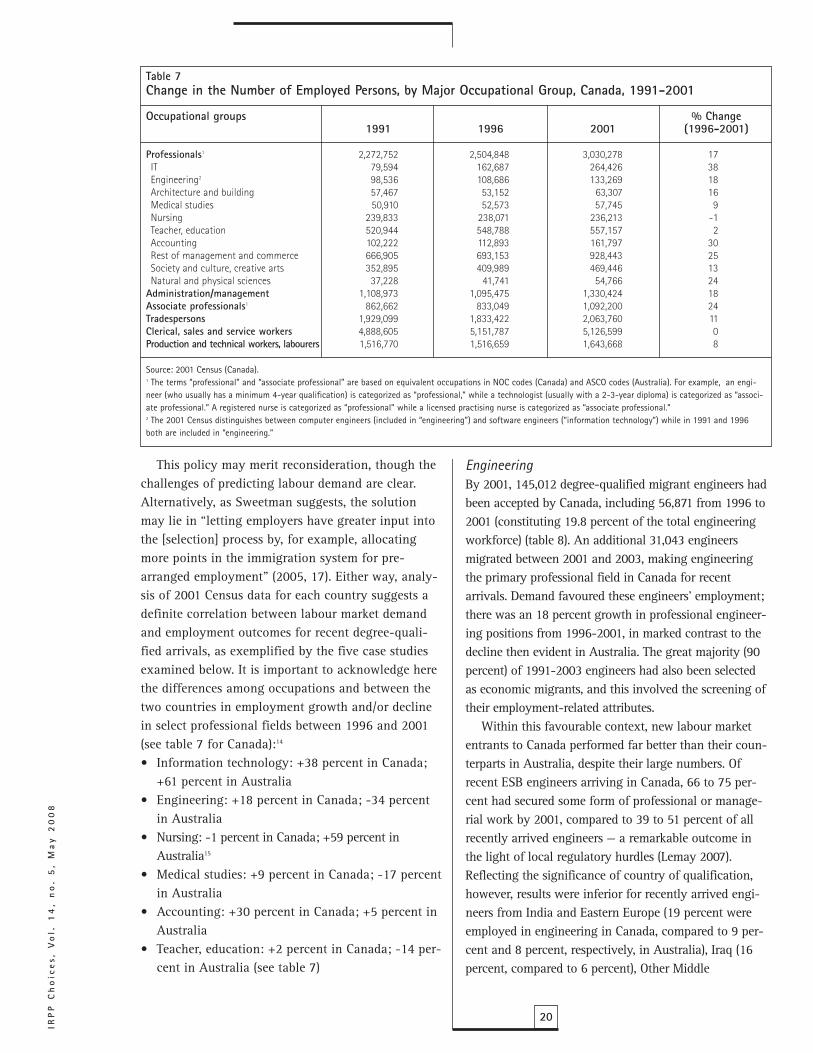
IRP
P C
ho
ice
s, V
ol.
14
, n
o.
5,
Ma
y 2
00
8
20
EngineeringBy 2001, 145,012 degree-qualified migrant engineers hadbeen accepted by Canada, including 56,871 from 1996 to2001 (constituting 19.8 percent of the total engineeringworkforce) (table 8). An additional 31,043 engineersmigrated between 2001 and 2003, making engineeringthe primary professional field in Canada for recentarrivals. Demand favoured these engineers’ employment;there was an 18 percent growth in professional engineer-ing positions from 1996-2001, in marked contrast to thedecline then evident in Australia. The great majority (90percent) of 1991-2003 engineers had also been selectedas economic migrants, and this involved the screening oftheir employment-related attributes.
Within this favourable context, new labour marketentrants to Canada performed far better than their coun-terparts in Australia, despite their large numbers. Ofrecent ESB engineers arriving in Canada, 66 to 75 per-cent had secured some form of professional or manage-rial work by 2001, compared to 39 to 51 percent of allrecently arrived engineers — a remarkable outcome inthe light of local regulatory hurdles (Lemay 2007).Reflecting the significance of country of qualification,however, results were inferior for recently arrived engi-neers from India and Eastern Europe (19 percent wereemployed in engineering in Canada, compared to 9 per-cent and 8 percent, respectively, in Australia), Iraq (16percent, compared to 6 percent), Other Middle
This policy may merit reconsideration, though thechallenges of predicting labour demand are clear.Alternatively, as Sweetman suggests, the solutionmay lie in “letting employers have greater input intothe [selection] process by, for example, allocatingmore points in the immigration system for pre-arranged employment” (2005, 17). Either way, analy-sis of 2001 Census data for each country suggests adefinite correlation between labour market demandand employment outcomes for recent degree-quali-fied arrivals, as exemplified by the five case studiesexamined below. It is important to acknowledge herethe differences among occupations and between thetwo countries in employment growth and/or declinein select professional fields between 1996 and 2001(see table 7 for Canada):14
• Information technology: +38 percent in Canada;+61 percent in Australia
• Engineering: +18 percent in Canada; -34 percentin Australia
• Nursing: -1 percent in Canada; +59 percent inAustralia15
• Medical studies: +9 percent in Canada; -17 percentin Australia
• Accounting: +30 percent in Canada; +5 percent inAustralia
• Teacher, education: +2 percent in Canada; -14 per-cent in Australia (see table 7)
Table 7Change in the Number of Employed Persons, by Major Occupational Group, Canada, 1991-2001
Occupational groups % Change1991 1996 2001 (1996-2001)
Professionals1 2,272,752 2,504,848 3,030,278 17IT 79,594 162,687 264,426 38Engineering2 98,536 108,686 133,269 18Architecture and building 57,467 53,152 63,307 16Medical studies 50,910 52,573 57,745 9Nursing 239,833 238,071 236,213 -1Teacher, education 520,944 548,788 557,157 2Accounting 102,222 112,893 161,797 30Rest of management and commerce 666,905 693,153 928,443 25Society and culture, creative arts 352,895 409,989 469,446 13Natural and physical sciences 37,228 41,741 54,766 24
Administration/management 1,108,973 1,095,475 1,330,424 18Associate professionals1 862,662 833,049 1,092,200 24Tradespersons 1,929,099 1,833,422 2,063,760 11Clerical, sales and service workers 4,888,605 5,151,787 5,126,599 0Production and technical workers, labourers 1,516,770 1,516,659 1,643,668 8
Source: 2001 Census (Canada).1 The terms “professional” and “associate professional” are based on equivalent occupations in NOC codes (Canada) and ASCO codes (Australia). For example, an engi-neer (who usually has a minimum 4-year qualification) is categorized as “professional,” while a technologist (usually with a 2-3-year diploma) is categorized as “associ-ate professional.” A registered nurse is categorized as “professional” while a licensed practising nurse is categorized as “associate professional.” 2 The 2001 Census distinguishes between computer engineers (included in “engineering”) and software engineers (“information technology”) while in 1991 and 1996both are included in “engineering.”

them selected in the major economic categories. Until2001, dynamic IT demand existed in both countries,facilitating the swift absorption of most recent arrivals.In Australia, 9,528 degree-qualified IT professionals wereaccepted from 1996 to 2001. Over this period, in virtual-ly every birthplace group examined, the proportion ofrecent IT migrants working in their own profession wasdouble or triple the standard employment outcome ofrecent degree-qualified migrants from the same sourcecountries in all fields. Clearly, employers willingly over-looked perceived deficits in prior training or languageability due to their need for IT workers (see figure 2).
Very positive outcomes also prevailed for 1996-2001arrivals in Canada in the IT sector: 57 percent of recentimmigrants from Eastern Europe had secured professionalwork in their fields by 2001 (compared to 63 percent inAustralia); 49 percent of those from Southeastern Europe(compared to 68 percent); 43 percent of those from HongKong/Malaysia/Singapore (compared to 27 percent); 37 per-cent of those from India (compared to 34 percent); 41 per-cent of those from China (compared to 36 percent); 38percent of those from Other Middle East/North Africa (com-pared to 37 percent); 37 percent of those fromSouth/Central Asia (compared to 46 percent); and 32 per-cent of those from the Philippines (compared to 42 percent).
21
Th
e Im
pa
ct of E
con
om
ic Se
lectio
n P
olicy
on
La
bo
ur M
ark
et O
utco
me
s for D
eg
ree
-Q
ua
lified
Mig
ran
ts in C
an
ad
a a
nd
Au
stralia
, by
Le
sley
an
ne
Ha
wth
orn
e
East/North Africa (15 percent, compared to 6 percent),China (12 percent, compared to 8 percent) and thePhilippines (5 percent, compared to 6 percent). Manysuch engineers had struggled to secure professional orsubprofessional status — a serious issue, given the domi-nance of migrants from these source countries in con-temporary Canadian flows (Canadian Council ofProfessional Engineers 2004).
As shown, outcomes were infinitely worse inAustralia, where a contracting employment situationin engineering gave rise to a problem of labour over-supply similar to what had occurred a decade earlier.Within a low-demand context, employers becamehighly discriminatory toward migrant engineers, par-ticularly those trained in parts of the Middle East andAsia (Hawthorne 1994).
Information technologyIn information technology, 55,630 degree-qualifiedworkers had migrated to Canada by 2001. Those whoarrived between 1996 and 2001 represented 22.1 per-cent of the total IT workforce (24,192) (table 9); inAustralia, the corresponding figure was 14.2 percent(see table 2b). An additional 9,320 IT professionalsreached Canada between 2001 and 2003, 91 percent of
Table 8Labour Market Outcomes for Degree-Qualified Migrant Engineers Who Arrived in Canada in 1996-2001, byCountry/Region of Birth (percent)
Employed
Own Other profession/ Other Not inCountry/region of birth1 profession managerial work Subtotal Unemployed labour force All (N)
UK/Ireland 25.2 48.7 12.6 86.5 ~ ~ 633US 17.6 48.4 11.9 77.9 ~ ~ 392South Africa 19.0 56.2 0.0 75.2 ~ ~ 215Australia/New Zealand ~ 75.3 0.0 75.3 ~ ~ 81Southeastern Europe 15.1 24.9 35.1 75.1 12.8 12.13 2,074Eastern Europe 19.2 23.8 31.7 74.7 12.9 12.4 10,280Northwestern Europe 17.4 53.1 13.9 84.3 8.2 4.55 1,110India 19.0 30.9 33.0 82.9 9.6 7.49 4,933Other South/Central Asia 15.9 22.3 31.2 69.4 17.1 13.53 7,632Hong Kong/Malaysia/Singapore 16.7 29.3 17.2 63.2 11.7 20.9 817China 12.0 24.4 23.5 59.8 21.0 19.17 15,234Taiwan 8.3 20.8 18.8 47.9 16.9 31.38 1,020Philippines 5.3 14.2 58.7 78.2 11.4 10.38 2,844Iraq 15.6 27.0 17.6 60.2 14.4 17.6 572Other Middle East/North Africa 14.9 23.7 24.2 62.8 22.1 15.09 3,566Central/South America 20.5 30.4 28.3 79.2 9.3 11.54 2,190Other 17.8 34.7 22.4 74.9 20.2 15.6 3,278
Total migrants 56,871
Canadian-born2 27.9 45.1 15.2 88.2 3.7 8.1 142,774
Source: 2001 Census (Canada).~ number of observations in sample (unweighted observations) is fewer than five and is therefore excluded.1 Excludes nonpermanent residents (employment authorization, student authorization, minister's permit or refugee claimants).2 Includes those born outside Canada to Canadian parents.
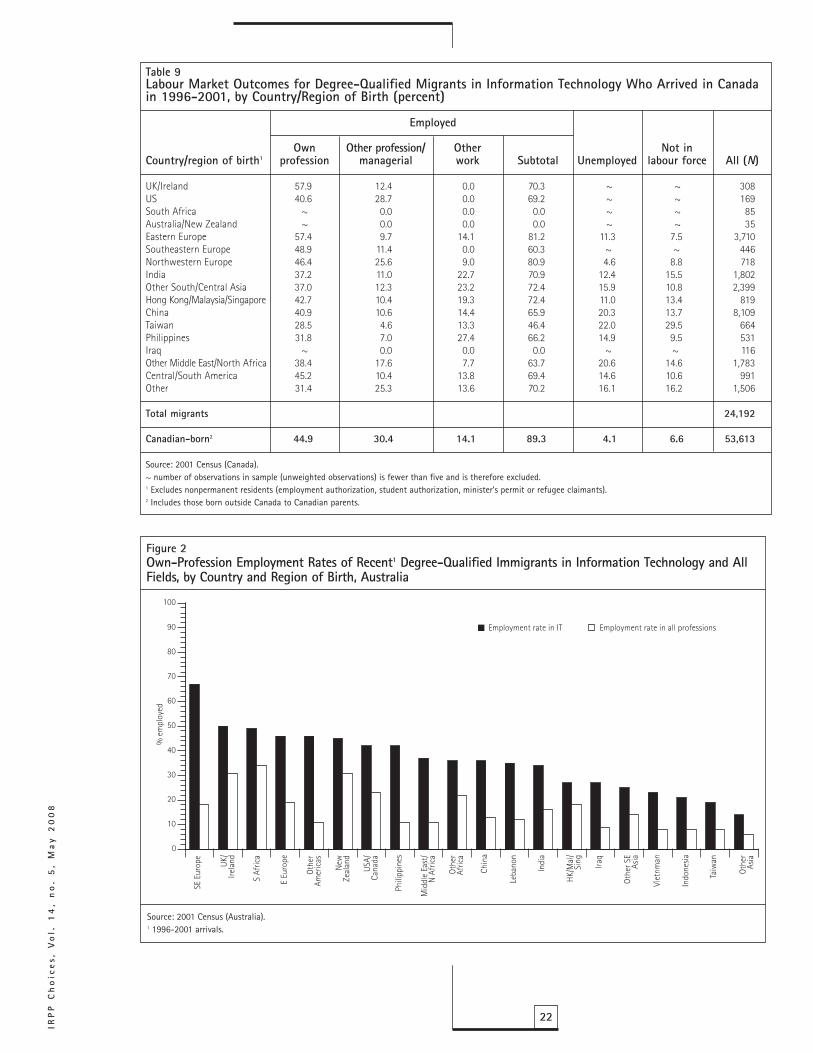
IRP
P C
ho
ice
s, V
ol.
14
, n
o.
5,
Ma
y 2
00
8
22
Table 9Labour Market Outcomes for Degree-Qualified Migrants in Information Technology Who Arrived in Canadain 1996-2001, by Country/Region of Birth (percent)
Employed
Own Other profession/ Other Not inCountry/region of birth1 profession managerial work Subtotal Unemployed labour force All (N)
UK/Ireland 57.9 12.4 0.0 70.3 ~ ~ 308US 40.6 28.7 0.0 69.2 ~ ~ 169South Africa ~ 0.0 0.0 0.0 ~ ~ 85Australia/New Zealand ~ 0.0 0.0 0.0 ~ ~ 35Eastern Europe 57.4 9.7 14.1 81.2 11.3 7.5 3,710Southeastern Europe 48.9 11.4 0.0 60.3 ~ ~ 446Northwestern Europe 46.4 25.6 9.0 80.9 4.6 8.8 718India 37.2 11.0 22.7 70.9 12.4 15.5 1,802Other South/Central Asia 37.0 12.3 23.2 72.4 15.9 10.8 2,399Hong Kong/Malaysia/Singapore 42.7 10.4 19.3 72.4 11.0 13.4 819China 40.9 10.6 14.4 65.9 20.3 13.7 8,109Taiwan 28.5 4.6 13.3 46.4 22.0 29.5 664Philippines 31.8 7.0 27.4 66.2 14.9 9.5 531Iraq ~ 0.0 0.0 0.0 ~ ~ 116Other Middle East/North Africa 38.4 17.6 7.7 63.7 20.6 14.6 1,783Central/South America 45.2 10.4 13.8 69.4 14.6 10.6 991Other 31.4 25.3 13.6 70.2 16.1 16.2 1,506
Total migrants 24,192
Canadian-born2 44.9 30.4 14.1 89.3 4.1 6.6 53,613
Source: 2001 Census (Canada).~ number of observations in sample (unweighted observations) is fewer than five and is therefore excluded.1 Excludes nonpermanent residents (employment authorization, student authorization, minister's permit or refugee claimants).2 Includes those born outside Canada to Canadian parents.
0
10
20
30
40
50
60
70
80
90
100
% e
mpl
oyed
Employment rate in IT Employment rate in all professions
SE E
urop
e
UK/
Irela
nd
S Af
rica
E Eu
rope
Othe
rAm
eric
as
New
Zeal
and
USA/
Cana
da
Phili
ppin
es
Mid
dle
East
/N
Afr
ica
Othe
rAf
rica
Chin
a
Leba
non
Indi
a
HK/M
al/
Sing Iraq
Othe
r SE
Asia
Viet
nman
Indo
nesia
Taiw
an
Othe
rAs
ia
Figure 2Own-Profession Employment Rates of Recent1 Degree-Qualified Immigrants in Information Technology and AllFields, by Country and Region of Birth, Australia
Source: 2001 Census (Australia).1 1996-2001 arrivals.
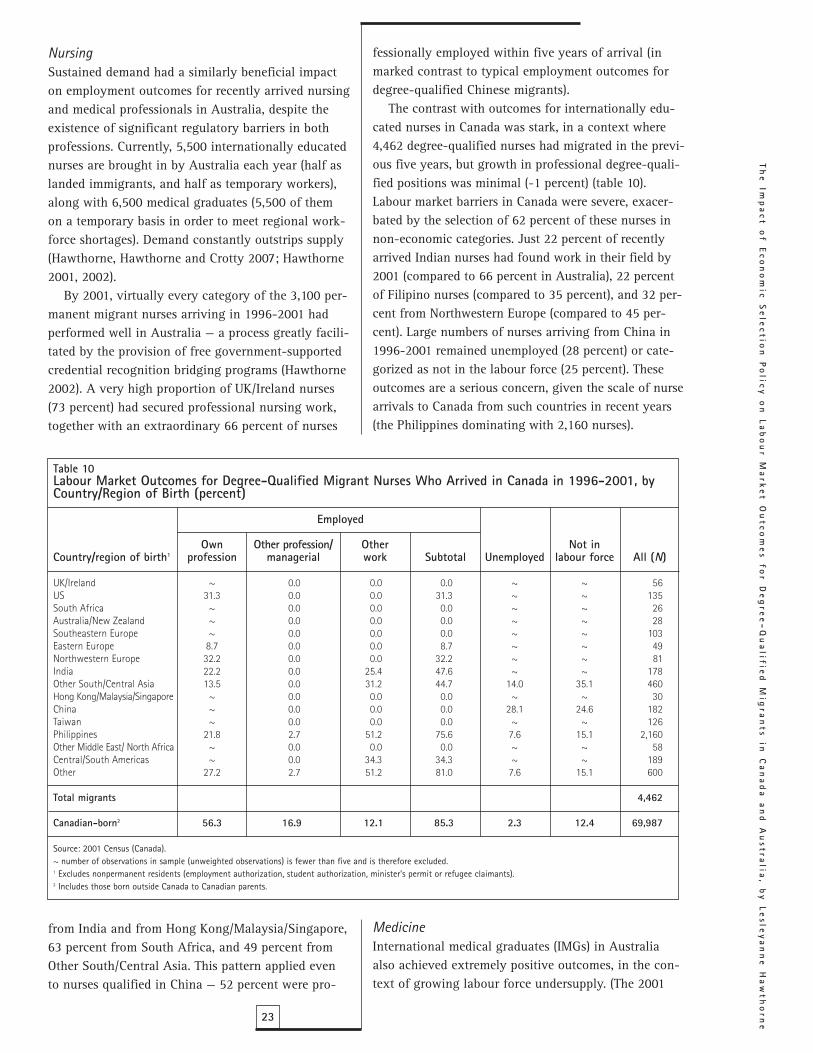
fessionally employed within five years of arrival (inmarked contrast to typical employment outcomes fordegree-qualified Chinese migrants).
The contrast with outcomes for internationally edu-cated nurses in Canada was stark, in a context where4,462 degree-qualified nurses had migrated in the previ-ous five years, but growth in professional degree-quali-fied positions was minimal (-1 percent) (table 10).Labour market barriers in Canada were severe, exacer-bated by the selection of 62 percent of these nurses innon-economic categories. Just 22 percent of recentlyarrived Indian nurses had found work in their field by2001 (compared to 66 percent in Australia), 22 percentof Filipino nurses (compared to 35 percent), and 32 per-cent from Northwestern Europe (compared to 45 per-cent). Large numbers of nurses arriving from China in1996-2001 remained unemployed (28 percent) or cate-gorized as not in the labour force (25 percent). Theseoutcomes are a serious concern, given the scale of nursearrivals to Canada from such countries in recent years(the Philippines dominating with 2,160 nurses).
MedicineInternational medical graduates (IMGs) in Australiaalso achieved extremely positive outcomes, in the con-text of growing labour force undersupply. (The 2001
NursingSustained demand had a similarly beneficial impacton employment outcomes for recently arrived nursingand medical professionals in Australia, despite theexistence of significant regulatory barriers in bothprofessions. Currently, 5,500 internationally educatednurses are brought in by Australia each year (half aslanded immigrants, and half as temporary workers),along with 6,500 medical graduates (5,500 of themon a temporary basis in order to meet regional work-force shortages). Demand constantly outstrips supply(Hawthorne, Hawthorne and Crotty 2007; Hawthorne2001, 2002).
By 2001, virtually every category of the 3,100 per-manent migrant nurses arriving in 1996-2001 hadperformed well in Australia — a process greatly facili-tated by the provision of free government-supportedcredential recognition bridging programs (Hawthorne2002). A very high proportion of UK/Ireland nurses(73 percent) had secured professional nursing work,together with an extraordinary 66 percent of nurses
from India and from Hong Kong/Malaysia/Singapore,63 percent from South Africa, and 49 percent fromOther South/Central Asia. This pattern applied evento nurses qualified in China — 52 percent were pro-
23
Th
e Im
pa
ct of E
con
om
ic Se
lectio
n P
olicy
on
La
bo
ur M
ark
et O
utco
me
s for D
eg
ree
-Q
ua
lified
Mig
ran
ts in C
an
ad
a a
nd
Au
stralia
, by
Le
sley
an
ne
Ha
wth
orn
e
Table 10Labour Market Outcomes for Degree-Qualified Migrant Nurses Who Arrived in Canada in 1996-2001, byCountry/Region of Birth (percent)
Employed
Own Other profession/ Other Not inCountry/region of birth1 profession managerial work Subtotal Unemployed labour force All (N)
UK/Ireland ~ 0.0 0.0 0.0 ~ ~ 56US 31.3 0.0 0.0 31.3 ~ ~ 135South Africa ~ 0.0 0.0 0.0 ~ ~ 26Australia/New Zealand ~ 0.0 0.0 0.0 ~ ~ 28Southeastern Europe ~ 0.0 0.0 0.0 ~ ~ 103Eastern Europe 8.7 0.0 0.0 8.7 ~ ~ 49Northwestern Europe 32.2 0.0 0.0 32.2 ~ ~ 81India 22.2 0.0 25.4 47.6 ~ ~ 178Other South/Central Asia 13.5 0.0 31.2 44.7 14.0 35.1 460Hong Kong/Malaysia/Singapore ~ 0.0 0.0 0.0 ~ ~ 30China ~ 0.0 0.0 0.0 28.1 24.6 182Taiwan ~ 0.0 0.0 0.0 ~ ~ 126Philippines 21.8 2.7 51.2 75.6 7.6 15.1 2,160Other Middle East/ North Africa ~ 0.0 0.0 0.0 ~ ~ 58Central/South Americas ~ 0.0 34.3 34.3 ~ ~ 189Other 27.2 2.7 51.2 81.0 7.6 15.1 600
Total migrants 4,462
Canadian-born2 56.3 16.9 12.1 85.3 2.3 12.4 69,987
Source: 2001 Census (Canada).~ number of observations in sample (unweighted observations) is fewer than five and is therefore excluded.1 Excludes nonpermanent residents (employment authorization, student authorization, minister's permit or refugee claimants).2 Includes those born outside Canada to Canadian parents.
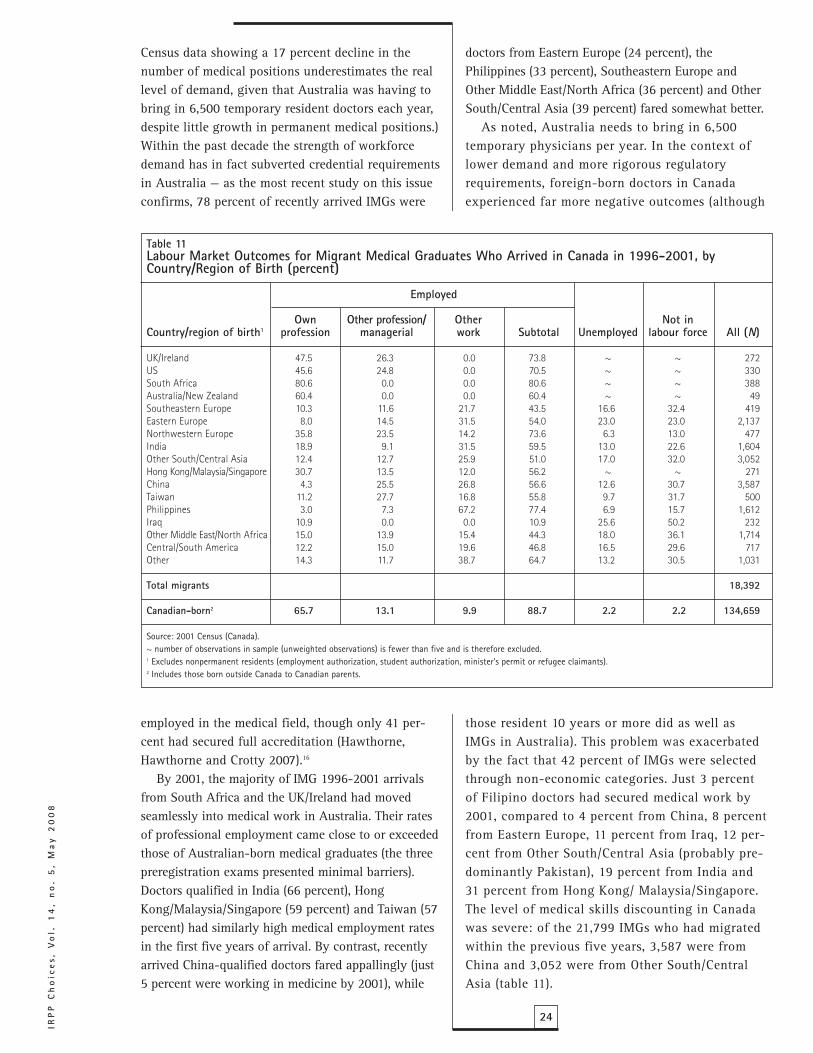
IRP
P C
ho
ice
s, V
ol.
14
, n
o.
5,
Ma
y 2
00
8
24
doctors from Eastern Europe (24 percent), thePhilippines (33 percent), Southeastern Europe andOther Middle East/North Africa (36 percent) and OtherSouth/Central Asia (39 percent) fared somewhat better.
As noted, Australia needs to bring in 6,500temporary physicians per year. In the context oflower demand and more rigorous regulatoryrequirements, foreign-born doctors in Canadaexperienced far more negative outcomes (although
those resident 10 years or more did as well asIMGs in Australia). This problem was exacerbatedby the fact that 42 percent of IMGs were selectedthrough non-economic categories. Just 3 percentof Filipino doctors had secured medical work by2001, compared to 4 percent from China, 8 percentfrom Eastern Europe, 11 percent from Iraq, 12 per-cent from Other South/Central Asia (probably pre-dominantly Pakistan), 19 percent from India and31 percent from Hong Kong/ Malaysia/Singapore.The level of medical skills discounting in Canadawas severe: of the 21,799 IMGs who had migratedwithin the previous five years, 3,587 were fromChina and 3,052 were from Other South/CentralAsia (table 11).
Census data showing a 17 percent decline in thenumber of medical positions underestimates the reallevel of demand, given that Australia was having tobring in 6,500 temporary resident doctors each year,despite little growth in permanent medical positions.)Within the past decade the strength of workforcedemand has in fact subverted credential requirementsin Australia — as the most recent study on this issueconfirms, 78 percent of recently arrived IMGs were
employed in the medical field, though only 41 per-cent had secured full accreditation (Hawthorne,Hawthorne and Crotty 2007).16
By 2001, the majority of IMG 1996-2001 arrivalsfrom South Africa and the UK/Ireland had movedseamlessly into medical work in Australia. Their ratesof professional employment came close to or exceededthose of Australian-born medical graduates (the threepreregistration exams presented minimal barriers).Doctors qualified in India (66 percent), HongKong/Malaysia/Singapore (59 percent) and Taiwan (57percent) had similarly high medical employment ratesin the first five years of arrival. By contrast, recentlyarrived China-qualified doctors fared appallingly (just5 percent were working in medicine by 2001), while
Table 11Labour Market Outcomes for Migrant Medical Graduates Who Arrived in Canada in 1996-2001, byCountry/Region of Birth (percent)
Employed
Own Other profession/ Other Not inCountry/region of birth1 profession managerial work Subtotal Unemployed labour force All (N)
UK/Ireland 47.5 26.3 0.0 73.8 ~ ~ 272US 45.6 24.8 0.0 70.5 ~ ~ 330South Africa 80.6 0.0 0.0 80.6 ~ ~ 388Australia/New Zealand 60.4 0.0 0.0 60.4 ~ ~ 49Southeastern Europe 10.3 11.6 21.7 43.5 16.6 32.4 419Eastern Europe 8.0 14.5 31.5 54.0 23.0 23.0 2,137Northwestern Europe 35.8 23.5 14.2 73.6 6.3 13.0 477India 18.9 9.1 31.5 59.5 13.0 22.6 1,604Other South/Central Asia 12.4 12.7 25.9 51.0 17.0 32.0 3,052Hong Kong/Malaysia/Singapore 30.7 13.5 12.0 56.2 ~ ~ 271China 4.3 25.5 26.8 56.6 12.6 30.7 3,587Taiwan 11.2 27.7 16.8 55.8 9.7 31.7 500Philippines 3.0 7.3 67.2 77.4 6.9 15.7 1,612Iraq 10.9 0.0 0.0 10.9 25.6 50.2 232Other Middle East/North Africa 15.0 13.9 15.4 44.3 18.0 36.1 1,714Central/South America 12.2 15.0 19.6 46.8 16.5 29.6 717Other 14.3 11.7 38.7 64.7 13.2 30.5 1,031
Total migrants 18,392
Canadian-born2 65.7 13.1 9.9 88.7 2.2 2.2 134,659
Source: 2001 Census (Canada).~ number of observations in sample (unweighted observations) is fewer than five and is therefore excluded.1 Excludes nonpermanent residents (employment authorization, student authorization, minister's permit or refugee claimants).2 Includes those born outside Canada to Canadian parents.
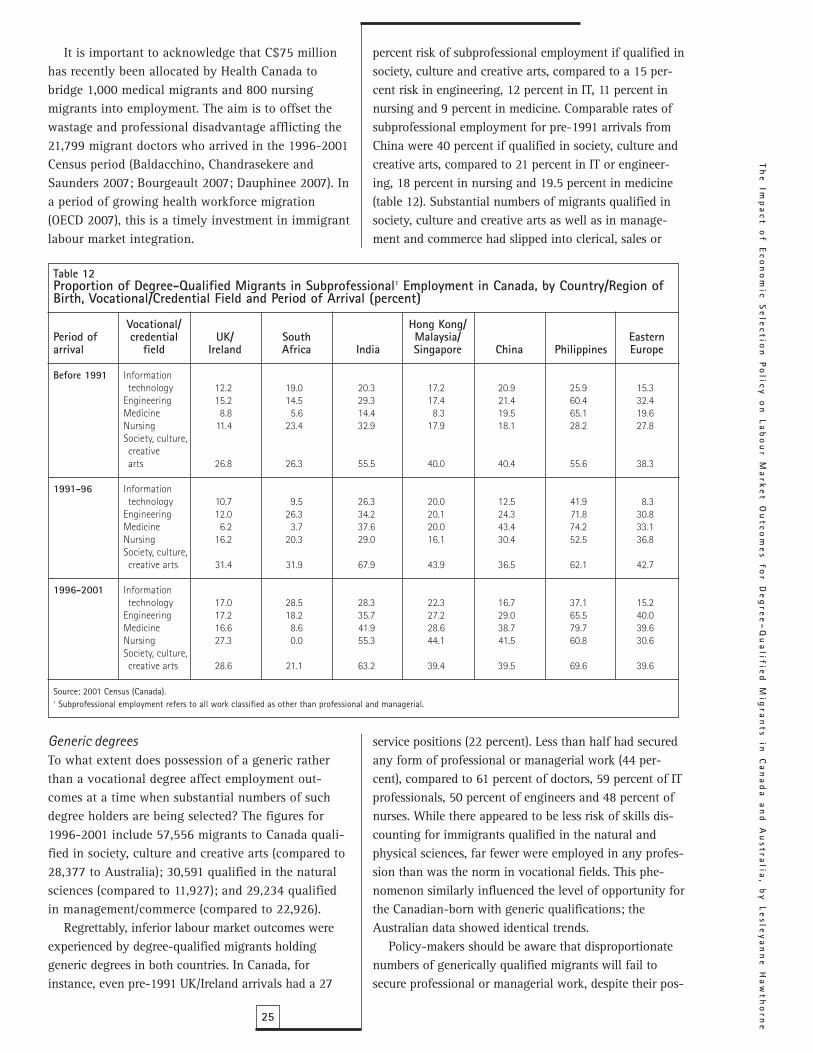
percent risk of subprofessional employment if qualified insociety, culture and creative arts, compared to a 15 per-cent risk in engineering, 12 percent in IT, 11 percent innursing and 9 percent in medicine. Comparable rates ofsubprofessional employment for pre-1991 arrivals fromChina were 40 percent if qualified in society, culture andcreative arts, compared to 21 percent in IT or engineer-ing, 18 percent in nursing and 19.5 percent in medicine(table 12). Substantial numbers of migrants qualified insociety, culture and creative arts as well as in manage-ment and commerce had slipped into clerical, sales or
service positions (22 percent). Less than half had securedany form of professional or managerial work (44 per-cent), compared to 61 percent of doctors, 59 percent of ITprofessionals, 50 percent of engineers and 48 percent ofnurses. While there appeared to be less risk of skills dis-counting for immigrants qualified in the natural andphysical sciences, far fewer were employed in any profes-sion than was the norm in vocational fields. This phe-nomenon similarly influenced the level of opportunity forthe Canadian-born with generic qualifications; theAustralian data showed identical trends.
Policy-makers should be aware that disproportionatenumbers of generically qualified migrants will fail tosecure professional or managerial work, despite their pos-
It is important to acknowledge that C$75 millionhas recently been allocated by Health Canada tobridge 1,000 medical migrants and 800 nursingmigrants into employment. The aim is to offset thewastage and professional disadvantage afflicting the21,799 migrant doctors who arrived in the 1996-2001Census period (Baldacchino, Chandrasekere andSaunders 2007; Bourgeault 2007; Dauphinee 2007). Ina period of growing health workforce migration(OECD 2007), this is a timely investment in immigrantlabour market integration.
Generic degreesTo what extent does possession of a generic ratherthan a vocational degree affect employment out-comes at a time when substantial numbers of suchdegree holders are being selected? The figures for1996-2001 include 57,556 migrants to Canada quali-fied in society, culture and creative arts (compared to28,377 to Australia); 30,591 qualified in the naturalsciences (compared to 11,927); and 29,234 qualifiedin management/commerce (compared to 22,926).
Regrettably, inferior labour market outcomes wereexperienced by degree-qualified migrants holdinggeneric degrees in both countries. In Canada, forinstance, even pre-1991 UK/Ireland arrivals had a 27
25
Th
e Im
pa
ct of E
con
om
ic Se
lectio
n P
olicy
on
La
bo
ur M
ark
et O
utco
me
s for D
eg
ree
-Q
ua
lified
Mig
ran
ts in C
an
ad
a a
nd
Au
stralia
, by
Le
sley
an
ne
Ha
wth
orn
e
Table 12Proportion of Degree-Qualified Migrants in Subprofessional1 Employment in Canada, by Country/Region ofBirth, Vocational/Credential Field and Period of Arrival (percent)
Vocational/ Hong Kong/Period of credential UK/ South Malaysia/ Easternarrival field Ireland Africa India Singapore China Philippines Europe
Before 1991 Informationtechnology 12.2 19.0 20.3 17.2 20.9 25.9 15.3
Engineering 15.2 14.5 29.3 17.4 21.4 60.4 32.4Medicine 8.8 5.6 14.4 8.3 19.5 65.1 19.6Nursing 11.4 23.4 32.9 17.9 18.1 28.2 27.8Society, culture,creativearts 26.8 26.3 55.5 40.0 40.4 55.6 38.3
1991-96 Informationtechnology 10.7 9.5 26.3 20.0 12.5 41.9 8.3
Engineering 12.0 26.3 34.2 20.1 24.3 71.8 30.8Medicine 6.2 3.7 37.6 20.0 43.4 74.2 33.1Nursing 16.2 20.3 29.0 16.1 30.4 52.5 36.8Society, culture,creative arts 31.4 31.9 67.9 43.9 36.5 62.1 42.7
1996-2001 Informationtechnology 17.0 28.5 28.3 22.3 16.7 37.1 15.2
Engineering 17.2 18.2 35.7 27.2 29.0 65.5 40.0Medicine 16.6 8.6 41.9 28.6 38.7 79.7 39.6Nursing 27.3 0.0 55.3 44.1 41.5 60.8 30.6Society, culture,creative arts 28.6 21.1 63.2 39.4 39.5 69.6 39.6
Source: 2001 Census (Canada).1 Subprofessional employment refers to all work classified as other than professional and managerial.
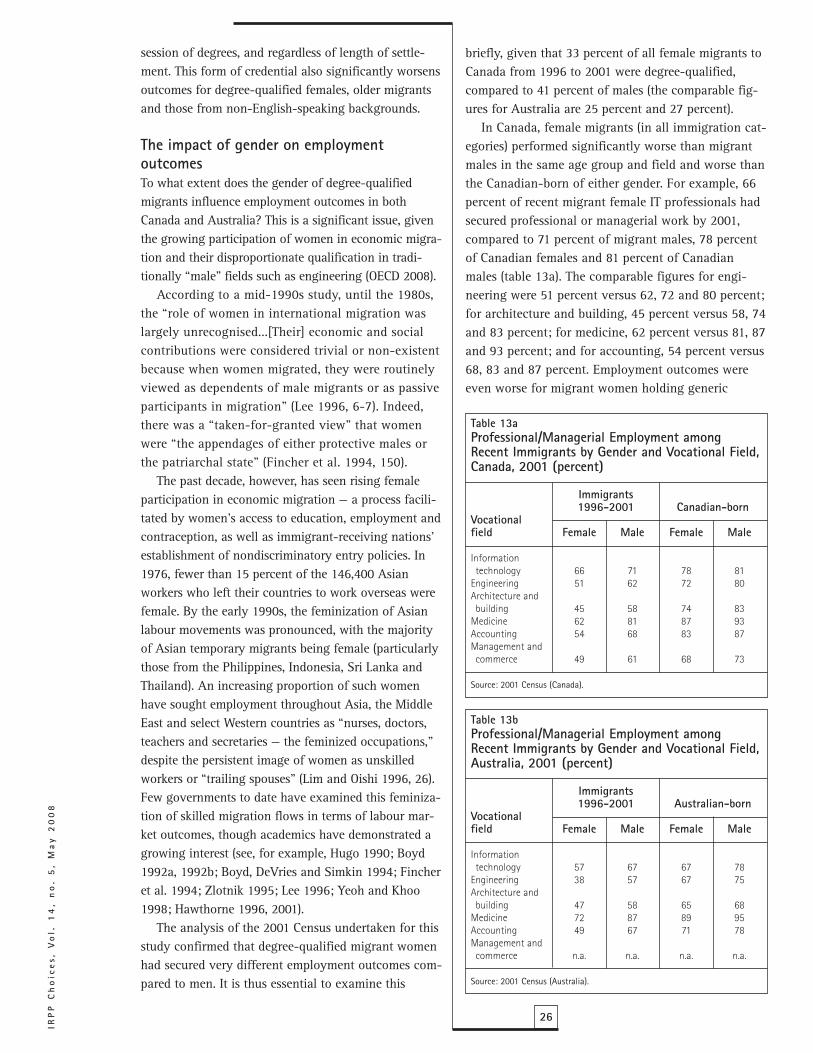
IRP
P C
ho
ice
s, V
ol.
14
, n
o.
5,
Ma
y 2
00
8
26
briefly, given that 33 percent of all female migrants toCanada from 1996 to 2001 were degree-qualified,compared to 41 percent of males (the comparable fig-ures for Australia are 25 percent and 27 percent).
In Canada, female migrants (in all immigration cat-egories) performed significantly worse than migrantmales in the same age group and field and worse thanthe Canadian-born of either gender. For example, 66percent of recent migrant female IT professionals hadsecured professional or managerial work by 2001,compared to 71 percent of migrant males, 78 percentof Canadian females and 81 percent of Canadianmales (table 13a). The comparable figures for engi-neering were 51 percent versus 62, 72 and 80 percent;for architecture and building, 45 percent versus 58, 74and 83 percent; for medicine, 62 percent versus 81, 87and 93 percent; and for accounting, 54 percent versus68, 83 and 87 percent. Employment outcomes wereeven worse for migrant women holding generic
session of degrees, and regardless of length of settle-ment. This form of credential also significantly worsensoutcomes for degree-qualified females, older migrantsand those from non-English-speaking backgrounds.
The impact of gender on employmentoutcomesTo what extent does the gender of degree-qualifiedmigrants influence employment outcomes in bothCanada and Australia? This is a significant issue, giventhe growing participation of women in economic migra-tion and their disproportionate qualification in tradi-tionally “male” fields such as engineering (OECD 2008).
According to a mid-1990s study, until the 1980s,the “role of women in international migration waslargely unrecognised...[Their] economic and socialcontributions were considered trivial or non-existentbecause when women migrated, they were routinelyviewed as dependents of male migrants or as passiveparticipants in migration” (Lee 1996, 6-7). Indeed,there was a “taken-for-granted view” that womenwere “the appendages of either protective males orthe patriarchal state” (Fincher et al. 1994, 150).
The past decade, however, has seen rising femaleparticipation in economic migration — a process facili-tated by women’s access to education, employment andcontraception, as well as immigrant-receiving nations’establishment of nondiscriminatory entry policies. In1976, fewer than 15 percent of the 146,400 Asianworkers who left their countries to work overseas werefemale. By the early 1990s, the feminization of Asianlabour movements was pronounced, with the majorityof Asian temporary migrants being female (particularlythose from the Philippines, Indonesia, Sri Lanka andThailand). An increasing proportion of such womenhave sought employment throughout Asia, the MiddleEast and select Western countries as “nurses, doctors,teachers and secretaries — the feminized occupations,”despite the persistent image of women as unskilledworkers or “trailing spouses” (Lim and Oishi 1996, 26).Few governments to date have examined this feminiza-tion of skilled migration flows in terms of labour mar-ket outcomes, though academics have demonstrated agrowing interest (see, for example, Hugo 1990; Boyd1992a, 1992b; Boyd, DeVries and Simkin 1994; Fincheret al. 1994; Zlotnik 1995; Lee 1996; Yeoh and Khoo1998; Hawthorne 1996, 2001).
The analysis of the 2001 Census undertaken for thisstudy confirmed that degree-qualified migrant womenhad secured very different employment outcomes com-pared to men. It is thus essential to examine this
Table 13aProfessional/Managerial Employment amongRecent Immigrants by Gender and Vocational Field,Canada, 2001 (percent)
Immigrants1996-2001 Canadian-born
Vocationalfield Female Male Female Male
Informationtechnology 66 71 78 81
Engineering 51 62 72 80Architecture andbuilding 45 58 74 83
Medicine 62 81 87 93Accounting 54 68 83 87Management andcommerce 49 61 68 73
Source: 2001 Census (Canada).
Table 13bProfessional/Managerial Employment amongRecent Immigrants by Gender and Vocational Field,Australia, 2001 (percent)
Immigrants1996-2001 Australian-born
Vocationalfield Female Male Female Male
Informationtechnology 57 67 67 78
Engineering 38 57 67 75Architecture andbuilding 47 58 65 68
Medicine 72 87 89 95Accounting 49 67 71 78Management andcommerce n.a. n.a. n.a. n.a.
Source: 2001 Census (Australia).

performing the older age group (45 to 64 years) and doinginfinitely better than newly arrived young graduates (aged15 to 24 years; see the next section). Of the recentlyarrived 25-to-44-year-old male graduates from UK/Irelandin Canada, for example, 75 percent had secured work intheir own or another profession by 2001, compared to 57percent of 45-to-64-year-olds (the comparable figures forAustralia were 74 percent and 67 percent).
A recent OECD analysis confirmed that young, over-seas-qualified graduates, by contrast, faced catastrophiclevels of labour market rejection if they did not comefrom ESB source countries (OECD 2006). For example,just 9 percent of young foreign-born accountants hadfound work in their field in Canada within the first fiveyears of arrival, compared to 8 percent of engineers, 11percent of commerce graduates, 16 percent of teachersand 22 percent of IT professionals (table 14). The com-parable figures for Australia were: accounting, 20 per-cent; teaching, 26 percent; commerce, 5 percent; and IT,16 percent. Given a choice between degree-qualifiedlocals or new migrant graduates of identical age,Canadian and Australian employers emphatically pre-ferred the former — this at a time when Canada wascharacterized by a more difficult employment contextfor young graduates.
The value of host-country degrees toemployment outcomesThe Census confirmed that it is highly advantageousfor young, degree-qualified migrants to possess host-country rather than overseas degrees. This findingaffirms Australia’s growing selection of “onshore” (thatis, former international student) applicants (Birrell,Hawthorne and Richardson 2006; Birrell 2008). Lengthof residence in the host country mattered, however, asemployers sought a high degree of acculturation.
Young migrants with local degrees residing inAustralia between 5 and 10 years achieved less positiveoutcomes than those residing in Australia 10 years ormore. For example, 77 percent of Australian-born newaccounting graduates had secured work in 2001 com-pared to 70 percent of overseas-born local graduatesresident 10 years or more, and just 55 percent of 1991-96 arrivals. Overall employment rates for 1991-96arrivals with Australian degrees were 34 percent foryouth born in UK/Ireland, 39 percent for those born inEastern Europe, 38 percent for Other Middle East/NorthAfrica, 34 percent for Northwestern Europe, 31 percentfor India and Other South/Central Asia, 28 percent forthe Philippines, 26 percent for Hong Kong/Malaysia/Singapore and 19 percent for China.
degrees. In management and commerce, for instance,49 percent of migrant females had secured profession-al or managerial work, compared to 61 percent ofmigrant males, 68 percent of Canadian females and73 percent of Canadian males.
Highly comparable trends were evident for womenwho had recently migrated to Australia. For example,57 percent of migrant female IT professionals hadsecured professional or managerial work, compared to67 percent of migrant males, 67 percent of Australianfemales and 78 percent of Australian males. The figuresfor engineering were 38 percent (far worse than inCanada) versus 57, 67 and 75 percent; for architectureand building, 47 percent versus 58, 65 and 68 percent;for medicine, 72 percent versus 87, 89 and 95 percent;and for accounting 49 percent, versus 67, 71 and 78percent. As in Canada, outcomes were inferior formigrant women qualified in generic fields (table 13b).
On a more positive note, the study found thatyoung, recently arrived migrant women in Australiahad approximated or exceeded male migrants’ profes-sional integration rates across a range of fields.Furthermore, they had achieved higher professionalor managerial employment levels than comparablemales in the natural and physical sciences, medicine,nursing, education, and management and commerce,with near equivalence in all other fields examined.Within this context, gender-related outcomes meritcareful policy monitoring by the Canadian andAustralian governments.
The impact of age on employment outcomesTo what extent does age at time of migration affectemployment outcomes for recent degree-qualifiedprofessionals? Australia awards no economic pointsfor applicants older than 44, while Canada deductstwo points per year for PAs who are 50 and over. Isthis policy decision justified by the Census analysis(in all immigration categories)? The answer is yes.
Age significantly influenced employment outcomesfor 1996-2001 degree-qualified arrivals, although thispattern was mediated by level of demand by field. Inboth Canada and Australia, native-born recent graduatesenjoyed greater access to work in every professionexamined than 1996-2001 migrant arrivals (of all ages).Outcomes by age and gender were most similar tonative-born workers for migrants from ESB source coun-tries (UK/Ireland, US, Australia/New Zealand, Canadaand South Africa), in addition to those fromNorthwestern Europe. Degree-qualified male migrantsaged 25 to 44 fared best in Canada and Australia, out-
27
Th
e Im
pa
ct of E
con
om
ic Se
lectio
n P
olicy
on
La
bo
ur M
ark
et O
utco
me
s for D
eg
ree
-Q
ua
lified
Mig
ran
ts in C
an
ad
a a
nd
Au
stralia
, by
Le
sley
an
ne
Ha
wth
orn
e
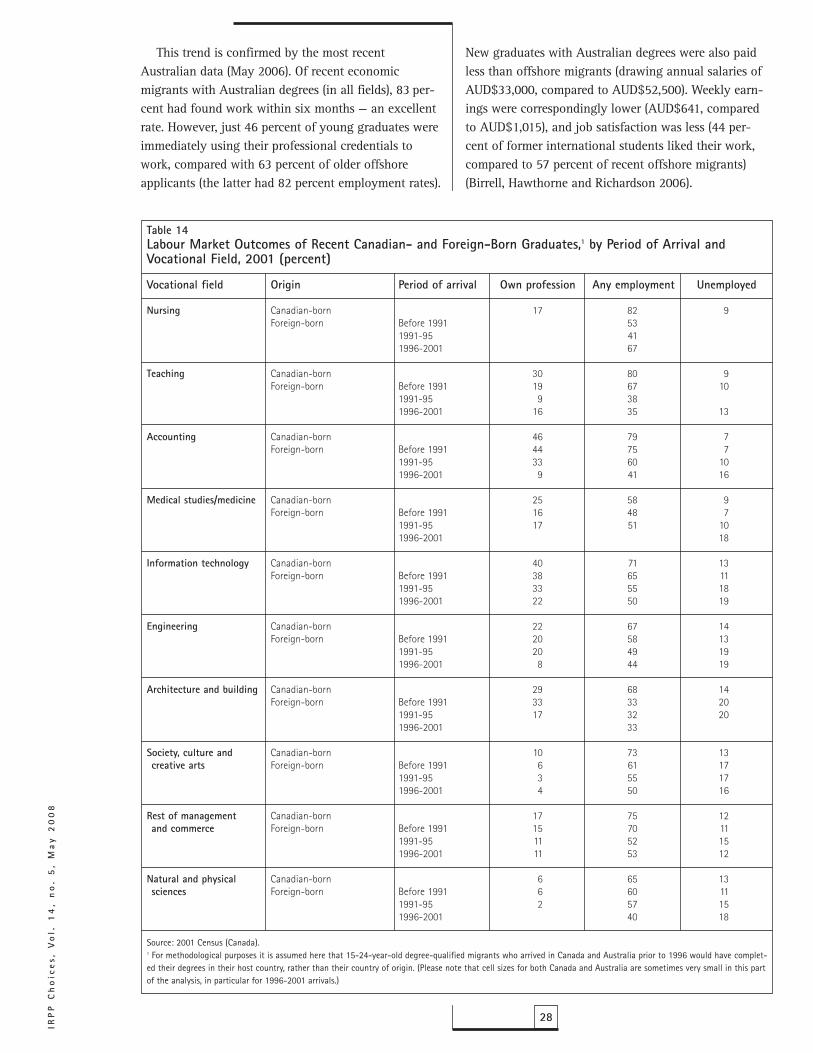
IRP
P C
ho
ice
s, V
ol.
14
, n
o.
5,
Ma
y 2
00
8
28
New graduates with Australian degrees were also paidless than offshore migrants (drawing annual salaries ofAUD$33,000, compared to AUD$52,500). Weekly earn-ings were correspondingly lower (AUD$641, comparedto AUD$1,015), and job satisfaction was less (44 per-cent of former international students liked their work,compared to 57 percent of recent offshore migrants)(Birrell, Hawthorne and Richardson 2006).
This trend is confirmed by the most recentAustralian data (May 2006). Of recent economicmigrants with Australian degrees (in all fields), 83 per-cent had found work within six months — an excellentrate. However, just 46 percent of young graduates wereimmediately using their professional credentials towork, compared with 63 percent of older offshoreapplicants (the latter had 82 percent employment rates).
Table 14Labour Market Outcomes of Recent Canadian- and Foreign-Born Graduates,1 by Period of Arrival andVocational Field, 2001 (percent)
Vocational field Origin Period of arrival Own profession Any employment Unemployed
Nursing Canadian-born 17 82 9Foreign-born Before 1991 53
1991-95 411996-2001 67
Teaching Canadian-born 30 80 9Foreign-born Before 1991 19 67 10
1991-95 9 381996-2001 16 35 13
Accounting Canadian-born 46 79 7Foreign-born Before 1991 44 75 7
1991-95 33 60 101996-2001 9 41 16
Medical studies/medicine Canadian-born 25 58 9Foreign-born Before 1991 16 48 7
1991-95 17 51 101996-2001 18
Information technology Canadian-born 40 71 13Foreign-born Before 1991 38 65 11
1991-95 33 55 181996-2001 22 50 19
Engineering Canadian-born 22 67 14Foreign-born Before 1991 20 58 13
1991-95 20 49 191996-2001 8 44 19
Architecture and building Canadian-born 29 68 14Foreign-born Before 1991 33 33 20
1991-95 17 32 201996-2001 33
Society, culture and Canadian-born 10 73 13creative arts Foreign-born Before 1991 6 61 17
1991-95 3 55 171996-2001 4 50 16
Rest of management Canadian-born 17 75 12and commerce Foreign-born Before 1991 15 70 11
1991-95 11 52 151996-2001 11 53 12
Natural and physical Canadian-born 6 65 13sciences Foreign-born Before 1991 6 60 11
1991-95 2 57 151996-2001 40 18
Source: 2001 Census (Canada). 1 For methodological purposes it is assumed here that 15-24-year-old degree-qualified migrants who arrived in Canada and Australia prior to 1996 would have complet-ed their degrees in their host country, rather than their country of origin. (Please note that cell sizes for both Canada and Australia are sometimes very small in this partof the analysis, in particular for 1996-2001 arrivals.)
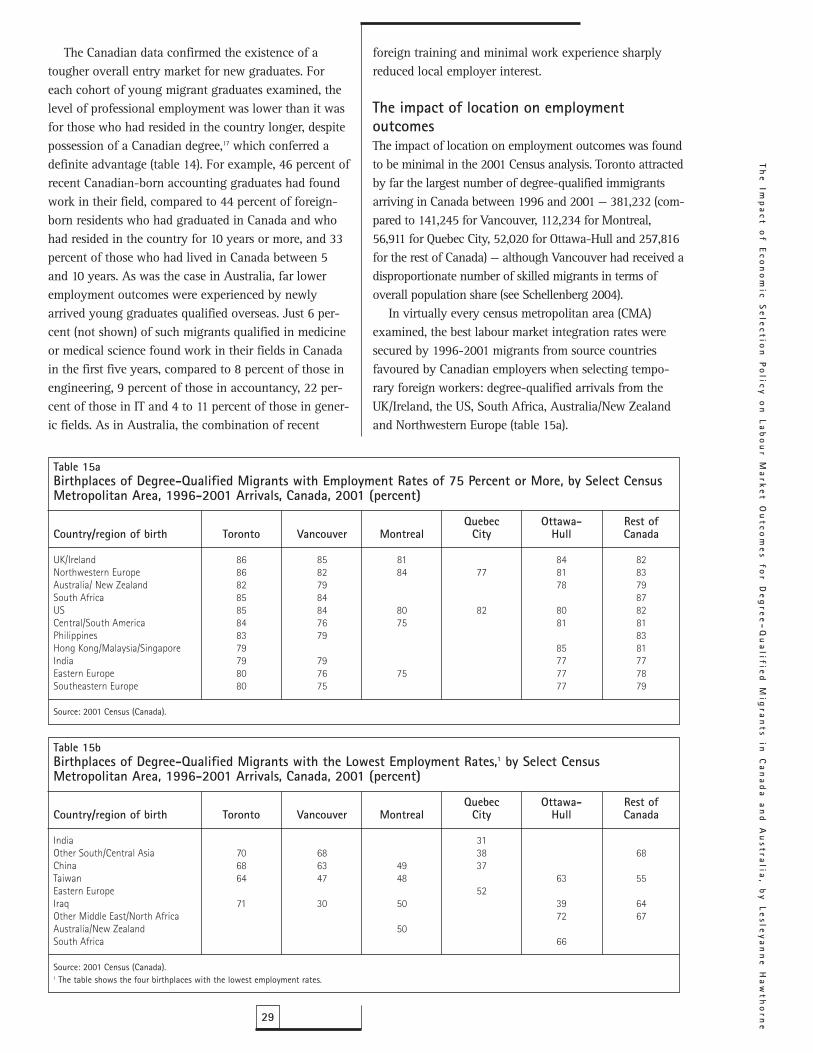
foreign training and minimal work experience sharplyreduced local employer interest.
The impact of location on employmentoutcomesThe impact of location on employment outcomes was foundto be minimal in the 2001 Census analysis. Toronto attractedby far the largest number of degree-qualified immigrantsarriving in Canada between 1996 and 2001 — 381,232 (com-pared to 141,245 for Vancouver, 112,234 for Montreal,56,911 for Quebec City, 52,020 for Ottawa-Hull and 257,816for the rest of Canada) — although Vancouver had received adisproportionate number of skilled migrants in terms ofoverall population share (see Schellenberg 2004).
In virtually every census metropolitan area (CMA)examined, the best labour market integration rates weresecured by 1996-2001 migrants from source countriesfavoured by Canadian employers when selecting tempo-rary foreign workers: degree-qualified arrivals from theUK/Ireland, the US, South Africa, Australia/New Zealandand Northwestern Europe (table 15a).
The Canadian data confirmed the existence of atougher overall entry market for new graduates. Foreach cohort of young migrant graduates examined, thelevel of professional employment was lower than it wasfor those who had resided in the country longer, despitepossession of a Canadian degree,17 which conferred adefinite advantage (table 14). For example, 46 percent ofrecent Canadian-born accounting graduates had foundwork in their field, compared to 44 percent of foreign-born residents who had graduated in Canada and whohad resided in the country for 10 years or more, and 33percent of those who had lived in Canada between 5and 10 years. As was the case in Australia, far loweremployment outcomes were experienced by newlyarrived young graduates qualified overseas. Just 6 per-cent (not shown) of such migrants qualified in medicineor medical science found work in their fields in Canadain the first five years, compared to 8 percent of those inengineering, 9 percent of those in accountancy, 22 per-cent of those in IT and 4 to 11 percent of those in gener-ic fields. As in Australia, the combination of recent
29
Th
e Im
pa
ct of E
con
om
ic Se
lectio
n P
olicy
on
La
bo
ur M
ark
et O
utco
me
s for D
eg
ree
-Q
ua
lified
Mig
ran
ts in C
an
ad
a a
nd
Au
stralia
, by
Le
sley
an
ne
Ha
wth
orn
e
Table 15aBirthplaces of Degree-Qualified Migrants with Employment Rates of 75 Percent or More, by Select CensusMetropolitan Area, 1996-2001 Arrivals, Canada, 2001 (percent)
Quebec Ottawa- Rest ofCountry/region of birth Toronto Vancouver Montreal City Hull Canada
UK/Ireland 86 85 81 84 82Northwestern Europe 86 82 84 77 81 83Australia/ New Zealand 82 79 78 79South Africa 85 84 87US 85 84 80 82 80 82Central/South America 84 76 75 81 81Philippines 83 79 83Hong Kong/Malaysia/Singapore 79 85 81India 79 79 77 77Eastern Europe 80 76 75 77 78Southeastern Europe 80 75 77 79
Source: 2001 Census (Canada).
Table 15bBirthplaces of Degree-Qualified Migrants with the Lowest Employment Rates,1 by Select CensusMetropolitan Area, 1996-2001 Arrivals, Canada, 2001 (percent)
Quebec Ottawa- Rest ofCountry/region of birth Toronto Vancouver Montreal City Hull Canada
India 31Other South/Central Asia 70 68 38 68China 68 63 49 37Taiwan 64 47 48 63 55Eastern Europe 52Iraq 71 30 50 39 64Other Middle East/North Africa 72 67Australia/New Zealand 50South Africa 66
Source: 2001 Census (Canada).1 The table shows the four birthplaces with the lowest employment rates.
IRP
P C
ho
ice
s, V
ol.
14
, n
o.
5,
Ma
y 2
00
8
30
basis of relationship to family members establishedin the host country, in addition to the allocation ofpoints (as above) related to their perceived capaci-ty for labour market integration.Three longitudinal data sources were used:
• The Longitudinal Survey of Immigrants toAustralia (LSIA), based on recurrent interviews,commencing six months after arrival, with a rep-resentative sample (5 percent) of migrants andrefugees entering Australia, administered to datethree times (LSIA 1 in 1993-95, LSIA 2 in 1999-2000 and LSIA 3 in October 2005)
• The Longitudinal Survey of Immigrants to Canada(LSIC), based on recurrent interviews with a repre-sentative sample of migrants and refugees to Canadaconducted six months, two years and four yearsafter arrival (LSIC 1 was administered in 2000-01)
• The Longitudinal Immigration Database Canada(IMDB), a semilongitudinal database that tracks indi-vidual migrants through tax returns from their firstyear of filing. For this study, analysis of data forrecently arrived economic migrants who had filedtheir first returns in 1994-95 and in 1999-2000 (upto a year after arrival) was used, facilitating compar-ison with LSIA 1 and LSIA 2 data for similar vin-tages of degree-qualified migrants. By definition, theIMDB provides indicative rather than identical data.The research assessed employment patterns of
recently arrived economic PAs in their first 6 to 12months of residence in Canada and Australia18 — a farmore immediate time frame than that accessiblethrough 2001 Census data, and one that is highly pre-dictive of longer-term outcomes (Birrell, Hawthorneand Richardson 2006). Key findings from this analy-sis are summarized in turn below.
Employment outcomes for economic migrants toCanada and Australia were comparable in the mid-1990s, but only those of Australian economic PAs hadgreatly improved by 1999-2000
Following the significant changes to migrationselection criteria that were introduced in Australia in1999, independent migrants’ employment rates withinsix months of arrival had surged from 57 percent in1993-95 to 81 percent in 1999-2000. Unemploymenthad dropped, and labour market participation rates hadincreased. Excellent employment gains were also evi-dent for the concessional family category (rising from46 percent to 69 percent). By contrast, in Canada,where immigrants’ education levels were higher butthe source countries were rapidly diversifying, there
As table 15b shows, certain birthplace groups ofrecently arrived degree-qualified migrants were the leastlikely to have found any form of work in the CMAsexamined, with strikingly poor employment outcomesfor select birthplace groups in Montreal, Quebec City andVancouver (although they had a lower risk of pooremployment outcomes in Toronto and the rest ofCanada). It is important to note the numerical impor-tance of some groups who were among the least likely tobe employed in the stated CMA, but also happened tobelong to the top-four arrival groups for each location in1996-2001: • Toronto — Other South/Central Asia (42,264) and
China (33,887)• Vancouver — China (17,857) and Taiwan (11,554)• Montreal — China (9,390)
Identical trends were found in the impact of loca-tion on employment outcomes in Australia.
Employment Outcomes forEconomic Principal ApplicantsThe migration context
H aving demonstrated with the 2001 Censusanalysis that there are minor differences inemployment outcomes for most recent
degree-qualified migrants to Canada and Australia (inall immigration categories), this study will now assessthe extent to which Australia’s divergence from thehuman capital model of economic selection hadresulted in improved economic outcomes.
Canada’s and Australia’s economic migration pro-grams include a range of subcategories, with variableterms and conditions. For the purposes of the currentstudy, the two numerically dominant and most direct-ly equivalent subcategories were selected for all dataanalysis; both are points-tested: • The “skilled worker” category for Canada and the
“independent” category for Australia — where PAsare selected wholly on the basis of their perceivedcapacity for labour market integration, includingthe potential to use their skills at an appropriatelevel (points allocated on the basis of attributessuch as qualification level, prior work experience,age, etc); and
• The “assisted relatives” category for Canada andthe “concessional family/skilled Australia-Linked”category for Australia — where PAs require slightlylower points for eligibility, given selection on the
(the latter were far more likely to be working in less-skilled positions, given their new graduate status).
Data categorizing the type of positions secured byemployed economic PAs in Canada were not provided inLSIC 1. However, IMDB data suggested that positivetrends occurred from 1994-95 to 1999-2000: 32 percentof skilled workers had managerial or professional workby the mid-1990s, compared to 54 percent by the end ofthe decade. Growth in professional/managerial positionsfrom 22 to 36 percent also occurred for assisted relatives.The IMDB does not provide job satisfaction data; howev-er, LSIC 1 demonstrated that 73 percent of skilled work-ers in Canada were “positive” about their employment by2000-01, along with 70 percent of assisted relatives. LSICdata confirmed that two years after arrival, 84 percent ofthose in work were satisfied with their employment.
Salaries had risen markedly for economic PAs inAustralia by 1999-2000, but not for those in Canada
In Australia, weekly earnings also greatly improved foremployed independent PAs between 1993-95 and 1999-2000: 57 percent earned AUD$674 or more, compared tojust 39 percent six years earlier. By 1999-2000, 76 percentof employed independent migrants were earning morethan the median wage (AUD$154), along with 63 percentof concessional family migrants. Growth in income wasalso positive for concessional family workers, with theproportion of PAs in this category earning above themedian wage rising from 23 to 34 percent. While trenddata for Canada were not available, earnings at the timeof LSIC 1 (2000-01) were significantly lower in Canadathan in Australia: 33 percent of skilled economic migrantswere paid C$618 or more per week, compared to just 11percent of employed assisted relatives.
Australian data for 2005 reveal that income levelsrose even higher after 1999-2000 (in stark contrast tothe trend now evident in Canada): 65 percent of inde-pendent PAs were earning over AUD$674 per week; theiraverage weekly wage was an extraordinary AUD$1,015.This compared to 46 percent of offshore Australian-sponsored PAs (who earned an average weekly wage ofAUD$779) and 40 percent of onshore former interna-tional students, who were new graduates lacking profes-sional experience (they averaged AUD$641 per week, butthis will likely increase over time).
Employment outcomes had also improved for economicPAs in Australia for all birthplace groups, includingthose that were typically disadvantaged
As established by the Census data analysis, selectdeveloping-country birthplace groups were at risk of
appeared to have been a slight decline in employmentrates for skilled workers (from 64 percent in 1994-95to 60 percent in 2000-01, with assisted relatives faringmuch worse (dropping from 57 percent in 1994-95[IMDB approximation] to just 36 percent in 2000-01).
Outcomes have continued to improve for PAs inboth economic categories in Australia in the past fiveyears: LSIA 3 data for 2005 confirm that 83 percent ofindependent PAs have found work within six months(as have 72 percent of comparable Australian-spon-sored migrants); 12 percent of economic PAs wereunemployed, and just 5 percent were not in the labourforce — a marked improvement since 1999-2000,when the corresponding rate was 15 percent.
Levels of employment and job satisfaction hadsubstantially improved for economic PAs in Australiasince the mid-1990s; select outcomes were alsoimproving in Canada
In line with Australia’s generally superior employ-ment outcomes, professional/managerial positionsproved more accessible to independent migrants inAustralia, the rates rising from 55 percent in 1993-95to 60 percent by 1999-2000. Concessional familyrates, however, remained comparable to those inCanada (reflecting these migrants’ lower pointsrequirement): just 32 percent of the employed foundhigh-skilled positions by 1999-2000. At that time, 85percent of employed independent PAs also stated theywere actively using their credentials within sixmonths, compared to just 64 percent of concessionalfamily workers (a modest improvement over 1993-95).
The latest available Australian data, for 2005, con-firm that 63 percent of all independent arrivals wereusing their qualifications to work, compared to 49 per-cent of the Australian-sponsored. This is a positive out-come, given that the figures now include substantialnumbers of recently graduated international students.(Comparable data were not available for Canada.)
The data confirmed job satisfaction to be good butstatic for concessional family PAs in Australia — about45 percent for both 1993-95 and 1999-2000. By con-trast, independent PAs had become increasingly satis-fied with their positions: in 1999-2000 61 percentclaimed to “love or really like” their work, compared to50 percent six years earlier. Data for 2005 confirmedthis generally positive result: 57 percent of independ-ent migrants liked their work and 31 percent consid-ered it “okay,” compared to 50 and 37 percent,respectively, of offshore Australian-sponsored migrantsand 44 and 40 percent of former international students
31
Th
e Im
pa
ct of E
con
om
ic Se
lectio
n P
olicy
on
La
bo
ur M
ark
et O
utco
me
s for D
eg
ree
-Q
ua
lified
Mig
ran
ts in C
an
ad
a a
nd
Au
stralia
, by
Le
sley
an
ne
Ha
wth
orn
e
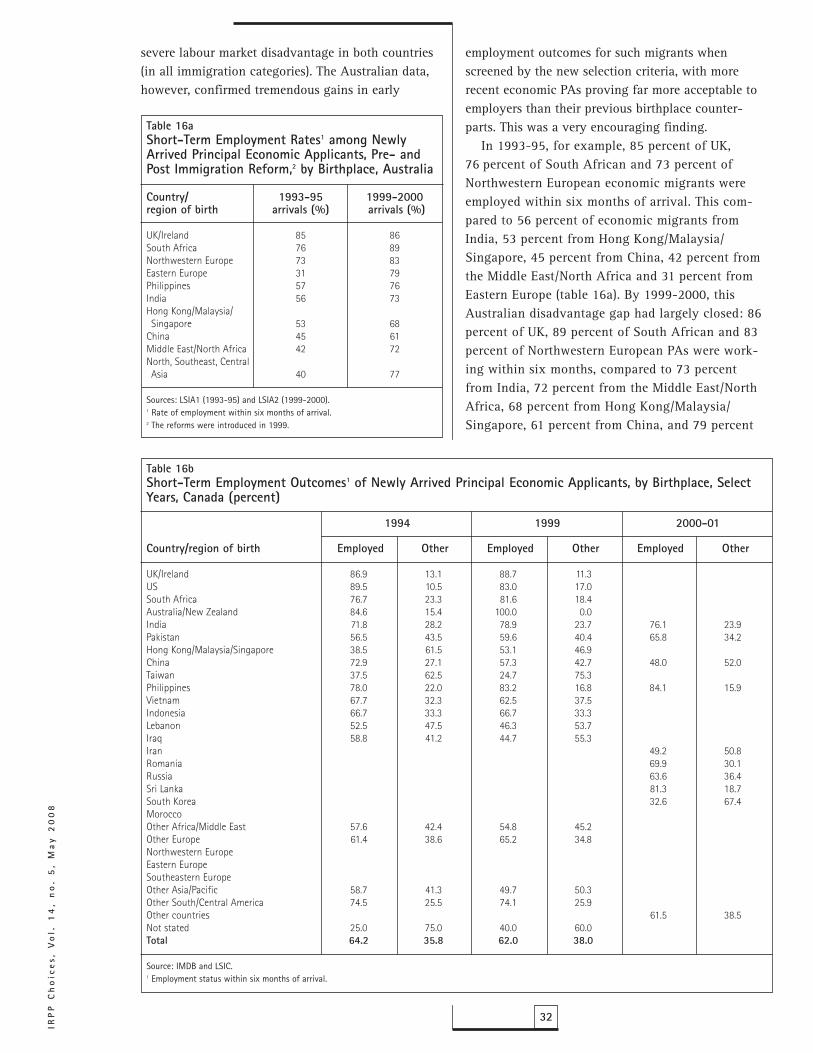
IRP
P C
ho
ice
s, V
ol.
14
, n
o.
5,
Ma
y 2
00
8
32
employment outcomes for such migrants whenscreened by the new selection criteria, with morerecent economic PAs proving far more acceptable toemployers than their previous birthplace counter-parts. This was a very encouraging finding.
In 1993-95, for example, 85 percent of UK,76 percent of South African and 73 percent ofNorthwestern European economic migrants wereemployed within six months of arrival. This com-pared to 56 percent of economic migrants fromIndia, 53 percent from Hong Kong/Malaysia/Singapore, 45 percent from China, 42 percent fromthe Middle East/North Africa and 31 percent fromEastern Europe (table 16a). By 1999-2000, thisAustralian disadvantage gap had largely closed: 86percent of UK, 89 percent of South African and 83percent of Northwestern European PAs were work-ing within six months, compared to 73 percentfrom India, 72 percent from the Middle East/NorthAfrica, 68 percent from Hong Kong/Malaysia/Singapore, 61 percent from China, and 79 percent
severe labour market disadvantage in both countries(in all immigration categories). The Australian data,however, confirmed tremendous gains in early
Table 16aShort-Term Employment Rates1 among NewlyArrived Principal Economic Applicants, Pre- andPost Immigration Reform,2 by Birthplace, Australia
Country/ 1993-95 1999-2000region of birth arrivals (%) arrivals (%)
UK/Ireland 85 86South Africa 76 89Northwestern Europe 73 83Eastern Europe 31 79Philippines 57 76India 56 73Hong Kong/Malaysia/Singapore 53 68
China 45 61Middle East/North Africa 42 72North, Southeast, CentralAsia 40 77
Sources: LSIA1 (1993-95) and LSIA2 (1999-2000).1 Rate of employment within six months of arrival.2 The reforms were introduced in 1999.
Table 16bShort-Term Employment Outcomes1 of Newly Arrived Principal Economic Applicants, by Birthplace, SelectYears, Canada (percent)
1994 1999 2000-01
Country/region of birth Employed Other Employed Other Employed Other
UK/Ireland 86.9 13.1 88.7 11.3US 89.5 10.5 83.0 17.0South Africa 76.7 23.3 81.6 18.4Australia/New Zealand 84.6 15.4 100.0 0.0India 71.8 28.2 78.9 23.7 76.1 23.9Pakistan 56.5 43.5 59.6 40.4 65.8 34.2Hong Kong/Malaysia/Singapore 38.5 61.5 53.1 46.9China 72.9 27.1 57.3 42.7 48.0 52.0Taiwan 37.5 62.5 24.7 75.3Philippines 78.0 22.0 83.2 16.8 84.1 15.9Vietnam 67.7 32.3 62.5 37.5Indonesia 66.7 33.3 66.7 33.3Lebanon 52.5 47.5 46.3 53.7Iraq 58.8 41.2 44.7 55.3Iran 49.2 50.8Romania 69.9 30.1Russia 63.6 36.4Sri Lanka 81.3 18.7South Korea 32.6 67.4MoroccoOther Africa/Middle East 57.6 42.4 54.8 45.2Other Europe 61.4 38.6 65.2 34.8Northwestern EuropeEastern EuropeSoutheastern EuropeOther Asia/Pacific 58.7 41.3 49.7 50.3Other South/Central America 74.5 25.5 74.1 25.9Other countries 61.5 38.5Not stated 25.0 75.0 40.0 60.0Total 64.2 35.8 62.0 38.0
Source: IMDB and LSIC.1 Employment status within six months of arrival.

percent). By contrast, female economic PAs in Canadaappeared to have experienced employment decline inthis period (assuming comparability between the LSICand the IMDB). The 2000-01 employment rate forfemale immigrants six months after arrival was 55 per-cent, compared to 63 percent in 1994-95. For maleimmigrants, the rates were 62 and 65 percent. Thisfinding is problematic, given the increasing flow toCanada of female immigrants with relatively high qual-ifications, as demonstrated in the previous analysis(OECD 2008).
Age-related selection changes have also been beneficialto Australia. By the late 1990s, older migrants (44 yearsand older) were receiving no economic category points forage at all. This change is associated with very positiveoutcomes (older applicants are now obliged to score highon other employment-related measures). By 1999-2000,77 percent of 25-to-44-year-old economic PAs hadsecured work in Australia within six months, compared to70 percent of 15-to-24-year-olds and 59 percent of 45-to-64-year olds. These results for older workers are notewor-thy: their employment rate nearly doubled within sixyears (reflecting their premigration screening for creden-tial recognition, English-language ability and otheremployer-desired attributes that offset the disadvantagetypically associated with older age) (see table 17).
Canada continued to accept substantial numbers ofeconomic PAs over 45 years of age from 1991 to 2003,despite some decline in this trend. However, Canadian
from Eastern Europe (the improved outcomes forEastern European arrivals are particularly notable).
In Canada, improved labour market integrationrates were also achieved by economic PAs from the UK(87 percent in 1994-95, rising to 89 percent in 1999-2000 based on IMDB data), from the Philippines (78percent, rising to 84 percent in 2000-01), from India(72 percent, rising to 76 percent) and from Pakistan(57 percent, rising to 66 percent). However, far morevariable labour market integration rates remained thenorm for other economic PA groups: 53 percent fromHong Kong/Malaysia/Singapore were employed in1999 (compared to 39 percent in the mid-1990s) and48 percent from China in 2000-01 (apparently declin-ing from 73 percent). These outcomes almost certainlyreflected nonrecognized credentials, as well asCanadian employer wariness regarding the calibre offoreign training systems and applicants’ ability tospeak French or English (see table 16b).
Australian labour market integration rates hadmarkedly improved for both male and femaleeconomic PAs, as well as across all age groups
Australia’s changed economic selection criteriahave diminished both female and male economicmigrants’ disadvantage to a high degree: employmentrates for female PAs rose from 49 to 71 percentbetween 1993-94 and 1999-2000; comparable malerates were only slightly higher (rising from 53 to 78
33
Th
e Im
pa
ct of E
con
om
ic Se
lectio
n P
olicy
on
La
bo
ur M
ark
et O
utco
me
s for D
eg
ree
-Q
ua
lified
Mig
ran
ts in C
an
ad
a a
nd
Au
stralia
, by
Le
sley
an
ne
Ha
wth
orn
e
Table 17Short-Term Employment Outcomes1 among Newly Arrived Economic Principal Applicants, by Age, SelectYears, Canada and Australia (percent)
Canada
1994 1999 2000-01
Age group Employed Other Employed Other Employed Other
15-24 years 78.8 21.2 76.4 23.6 80.4 19.625-44 years 64.9 35.1 62.5 37.5 60.7 39.345-64 years 51.6 48.4 50.3 49.7 50.2 49.8All 64.4 35.6 62.1 37.9 60.0 40.0
Australia
1993-95 1999-2000
Unemployed/ Unemployed/Age group Employed not in labour force Employed not in labour force
15-24 years 54.7 45.3 69.6 30.425-44 years 53.3 46.7 77.1 22.945-64 years 32.1 67.9 59.4 40.6All 51.9 48.1 75.8 24.2
Sources: Canada — IMDB and LSIC: Australia — LSIA.1 Employment status within six months of arrival.
IRP
P C
ho
ice
s, V
ol.
14
, n
o.
5,
Ma
y 2
00
8
34
cial-language capability, the greater that person’semployment and earnings opportunities (see, forexample, Citizenship and Immigration Canada 1998;Chiswick and Miller 2000a, 2000b). Analyzing theeffect of language literacy on earnings based onnational data, a recent Canadian study stated that
immigrants and the native born appear toobtain the same return for their literacyskills. We argue that this does not support adiscrimination explanation for immigrant-born earnings differentials. Immigrant short-falls in literacy can account for aboutone-half of the earnings gap between uni-versity educated immigrants and similarlyeducated native-born workers. However, lowreturns to foreign acquired experience have alarger impact in the differential and thoselow returns are not related to literacy differ-ences. Thus, low literacy among immigrantsis an important input to understandingimmigrant-native born earnings differentialsbut is not the dominant explanation. (Ferrer,Green and Riddell 2004, 3)
Increasingly, the argument is made that migrantscannot take their place in the knowledge economywithout spoken and written fluency in the host-country language(s). Host-country language facilityalso interacts with other labour market attributes,such as gender (Boyd, De Vries and Simkin 1994);and in communicative professions such as medicine,nursing, teaching and engineering, it is regarded ascritical (see, for example, Hawthorne and Toth 1996;Pawlikowska-Smith 2000; Centre for CanadianLanguage Benchmarks 2002). Canada’s medical,nursing and engineering regulatory bodies, forexample, have now all identified high-levelEnglish/French language ability as an essentialentry requirement for professional practice.
To what extent are these language-related findingsconfirmed by the longitudinal data analysis, now thatAustralia has mandated externally validated pre-migration English-language assessment for economicPAs while Canada continues to allow forEnglish/French self-assessment?20
The LSIA showed a marked recent increase in theproportion of economic PAs using English well orvery well in Australia (45 percent in 1993-95, com-pared to 73 percent in 1999-2000). The employmentgap between immigrants with high-level and low-level English was also vast by 1999-2000: 73 percentof the former secured work, compared to just 41 per-cent of the latter (table 18). The LSIA further allows usto assess English-language ability for recent immi-grants by gender. Female economic PAs selected byAustralia had matched or exceeded comparable males
employers strongly favoured young skilled workers inall three periods examined: 80 percent of 15-to-24-year-olds were employed in 2000-01 (in all fields,compared to 79 percent in 1994), 61 percent of 25-to-44-year-olds (compared to 65 percent) and 50 percentof 45-to-64-yearolds (compared to 52 percent). Thispolicy issue may be worth examining.
Externally validated host-country languagescreening was associated with greatly improved workoutcomes
As has been established by many reports, facility inthe host-country language(s) is a critical determinantof employment outcomes in knowledge economies, anissue not examined with 2001 Census data, given thenotorious unreliability of self-reporting.19
According to two recent Canadian studies, host-country language ability is “the particular form ofhuman capital that seems to matter most,” while“the higher…an immigrant’s official language capa-bility, the greater the employment and earningsopportunities” (Thompson and Worswick 2004;Hiebert 2006). An identical trend is evident inAustralia. A series of labour market reports on eco-nomic migrants have confirmed the inferior employ-ment outcomes achieved by NESB migrants, despitetheir possession of generally higher qualifications.NESB workers secured worse outcomes at every age,with recessions rendering them particularly vulnera-ble in terms of employment. They had difficultyconverting overseas credentials into appropriate-sta-tus work, locating this work in the fields for whichthey were qualified and securing adequate earnings.By 1981, it had been demonstrated that poorEnglish-language competence “doubled the proba-bility of [males] being unemployed”; with unem-ployment predictors including English-languageability, birthplace, period of residence in Australiaand country in which formal qualifications had beengained (Australia, Bureau of Labour Market Research1986, 86). By 1989, poor English-language abilitywas considered to represent “an awesome and dev-astating barrier” at every stage of the employmentlife cycle in Australia (Australia, Office ofMulticultural Affairs 1989, 39). Moreover, theAustralian evidence up to 1994 demonstrated thatas the education level increased, “the labour marketposition of immigrants vis à vis the Australian-bornsystematically deteriorate[d]” (Wooden 1994, 230).
Comparable trends are evident in Canada,demonstrating that the higher an immigrant’s offi-

Improved employment outcomes for economicmigrants were found in major migration settlementlocations in both countries
In line with the 2001 Census data, employment outcomesfor economic PAs varied across the Australian locationsanalyzed: by 1999-2000, 81 percent had secured work with-in six months of arrival in Sydney, compared to 73 percentin other Australia and 70 percent in Melbourne; there weremarkedly better outcomes in each location than there werein 1993-95. Similarly, analysis of the longitudinal data con-firmed that economic PAs located in Toronto (65 percent)and in other Canadian CMAs (69 percent) had better imme-diate employment outcomes than migrants settling inVancouver (56 percent) or Montreal (just 38 percent).
Welfare dependence had also declined amongeconomic PAs in both countries
Welfare dependence had virtually disappeared inAustralia for independent and concessional family immi-grants by 1999-2000, reflecting government policy barringaccess to welfare in the first two years of arrival. While in2005, 12 percent of economic PAs were categorized asunemployed after six months of arrival, these people wouldhave been ineligible to receive benefits. In Canada, reliancewas also very low for other skilled worker and assisted rela-tive PAs in 2000-01 (just 8 percent of households).
in terms of host-country language ability: 93 to 98percent of female independent PAs spoke English wellor very well, despite somewhat lower rates in the con-cessional family category. This seems certain to havecontributed to the positive employment outcomesreported by females.
Australia’s 2005-06 skilled migration review con-firmed the critical association between independentlyassessed English-language ability and the speed withwhich migrants integrated into the labour market: 89percent of economic PAs with English as their “onlyor best” language were employed within six monthsof arrival, compared to 86 percent of those who spokeEnglish “very well,” 76 percent of those who spoke it“well” and 59 percent of those who spoke it “notwell.” PAs with the best command of English werealso the most likely to be using their professionalqualifications to work (61 percent, compared to 60,44 and 37 percent), and they were most likely to beemployed in professional or managerial positions.
The LSIC data confirmed that migrants withknowledge of English and/or French were highlyadvantaged in terms of access to employment. Giventhe lack of language levels for LSIC and IMDB data,however, it was not possible to make more meaning-ful comparisons in relation to this over time.
35
Th
e Im
pa
ct of E
con
om
ic Se
lectio
n P
olicy
on
La
bo
ur M
ark
et O
utco
me
s for D
eg
ree
-Q
ua
lified
Mig
ran
ts in C
an
ad
a a
nd
Au
stralia
, by
Le
sley
an
ne
Ha
wth
orn
e
Table 18Short-Term Employment Outcomes among Newly Arrived1 Principal Economic Applicants, by LanguageAbility, Various Survey Years, Canada and Australia (percent)
Canada
1994 1999 2000-01
Language Level Employed Other Employed Other Employed Other
English 64.6 35.4 62.9 37.1French 65.6 34.4 62.3 37.7English and French 64.7 35.3 62.9 37.1Neither 62.3 37.8 52.9 47.1English and/or French Knows very well/well 61.5 38.5
Knows not well/not at all 50.8 49.2
All 64.5 35.5 62.2 37.8 60.0 40.0
Australia
1993-95 1999-2000
Unemployed/ Unemployed/Category Level Employed not in labour force Employed not in labour force
English Knows very well/well 44.5 55.5 73.1 26.9Knows not well/
not at all 28.1 71.9 40.9 59.1All 39.8 60.2 71.1 28.9
Sources: Canada — IMDB and LSIC: Australia — LSIA.1 Employment status within six months of arrival.

IRP
P C
ho
ice
s, V
ol.
14
, n
o.
5,
Ma
y 2
00
8
36
national or state licensing bodies (typically, a three-month postal process). This strategy is designed toavoid years of forced labour market displacement dueto nonrecognition of skills. Given the existence ofniche economies, priority processing has been grant-ed and up to 20 bonus points awarded to applicantsqualified in high-demand fields, a measure clearlyassociated with beneficial outcomes. In recognition ofthe importance of host-country language ability, can-didates have been required to achieve vocational- orhigher-level scores on the independently adminis-tered International English Language Testing System(or an approved equivalent), administered interna-tionally and monthly by the British Council for amodest fee. The standard is not draconian: the mini-mum for economic eligibility is defined as “Has par-tial command of the language, coping with overallmeaning in most situations, though is likely to makemany mistakes. Should be able to handle basic com-munication in own field” (English for InternationalOpportunity 2007).
It is essential to note that in terms of overallimpact, these policy changes from 1999 have not dis-couraged or distorted skilled migrant flows toAustralia. Intakes of economic immigrants increasedto 97,500 in 2005-06 from 77,800 in 2004-05 (theywere a third that level in the mid-1990s); the 2007-08target has since been raised to 102,500. Racial andethnic diversity have been maintained: in 2006-07,the top five source countries were the UK (18 percent),India (15 percent), China (11 percent), Malaysia (4 per-cent) and the Philippines (3 percent). Two years earli-er, the top 10 were India (19 percent), China (18percent), the UK (16 percent), Malaysia (4 percent), thePhilippines (3 percent), Indonesia (3 percent), HongKong (3 percent), Korea (3 percent), Sri Lanka (3 per-cent) and Singapore (2 percent). Rather than diminish-ing ethnic diversity, Australia’s changed selectioncriteria have resulted in applicants being far moreeffectively screened.
In terms of Australia’s changed selection frame-work, it is important, finally, to highlight the positiveemployment gains achieved by traditionally disad-vantaged groups (see table 16a). While the labourmarket integration of economic PAs from all sourcecountries had improved by 1999-2000, in the case ofeconomic PAs from Eastern Europe, the MiddleEast/North Africa, India, the Philippines and China,the scale of change had been dramatic. For example,79 percent of economic PAs arriving from EasternEurope had found work within six months of arrival
Conclusion
A s established by the Census data analysis,Canada and Australia are highly comparablesettlement sites for degree-qualified
migrants (in all immigration categories). However,economic immigrants perform indisputably betterin Australia: their employment outcomes within sixmonths of arrival are also strongly correlated withlonger-term labour market integration rates (Birrell,Hawthorne and Richardson 2006). Compared totheir counterparts in Canada, far greater propor-tions of new immigrants in Australia secure posi-tions fast, gain professional or managerial status,earn high salaries and use their credentials to work.In the process, unprecedented numbers are avoidingthe labour market displacement typically associatedwith select birthplace, language, age and gendergroups. The latest available Australian data(released in May 2006) confirm the ongoing bene-fits of recent policy refinements.
In redesigning its economic selection criteria in1999, the Australian government affirmed the pro-gram’s original intent: to select economic migrantswho can make an immediate contribution to theeconomy by employing their skills at an appropriateplace in the labour market. Parallel goals were toreduce skills wastage among recent arrivals and toreduce the level of government investment requiredto support their labour market adjustment needs (bythe mid-1990s, this amounted to some AUD$250 mil-lion of annual federal funding for employment, cre-dential recognition and English-language bridgingprograms, and even this was inadequate).
The transformation of Australia’s economic migra-tion program was viewed as legitimate and essential,given that in Australia, government frames policy butemployers retain the power to offer or withhold work.The previous model of selection had proven to beflawed: it delivered PAs lacking the knowledge econ-omy attributes employers sought (sophisticatedEnglish-language ability, recognized credentials andqualification in fields associated with buoyant labourmarket demand).
Since 1999, in consequence of research findings,perceived “employability” has determined PAs’ capac-ity to proceed with economic migration to Australia.In terms of credential recognition, PAs qualified inregulated fields have been required to apply for pre-migration screening by the relevant Australian

IELTS 7 or above), now a major determinant of selec-tion. The practices of education providers will be bettermonitored — in particular, those providers operating inthe fast-growing, migration-driven vocational trainingsector. More migration points will be awarded to gradu-ates of Australian institutions who have completedpostgraduate programs: most notably, those possessingdoctoral degrees (25 points) or three-year qualifications(15 points) (Australia, Department of Immigration andCitizenship 2007a).
Such steps are viewed as essential to maintainingthe integrity of Australia’s skill migration program. Interms of language measures, they are justified by thereview’s finding that English-language ability is themajor determinant of professional employment out-comes: “We conclude that in most dimensions of labourmarket success, the key is to have a level of Englishlanguage competence that enables the respondent toreport that they speak English at least ‘verywell’...[Those who do not] were much more likely to beunemployed; about half as likely as those with betterEnglish to be employed in a job commensurate withtheir skills; and about twice as likely to be employed ina relatively low skilled job” (Birrell, Hawthorne andRichardson 2006, 86-7).
It is beyond the scope of this paper to conclude withpolicy recommendations, since the mandate of thereport on which it is based (as commissioned byCitizenship and Immigration Canada, Statistics Canadaand Human Resources and Skills Development Canada)was to compare labour market outcomes for degree-qualified professionals in Canada and Australia basedon the available statistical evidence. At the same time,the study demonstrates the extent to which labour mar-ket outcomes are amenable to influence by policychange, given the sustained benefits flowing toAustralia, following its skilled migration reform under-taken in 1999.22
The impact of Canada’s Immigration and RefugeeProtection Act will be assessed at a later date.Important Canadian initiatives are also underway inrelation to foreign credential recognition, the transitionof former international students and temporary workersto economic migration (the “Canadian experience”class) and the growth of the Provincial NomineeProgram (Citizenship and Immigration Canada 2008;Hawthorne 2007b). Major sums are currently beinginvested to address labour market barriers for skilledmigrants, including well-targeted language and labourmarket interventions. Alongside such measures, intro-duction of mandatory premigration English/French-
by 1999-2000, compared to 31 percent in 1993-95.The comparable rate for the Philippines was 76 per-cent (versus 57 percent), with further gains beingreported by the time the LSIA 3 was conducted inOctober 2005. Impressive employment rates had alsobeen achieved by other at-risk groups, includingwomen of all ages and older skilled migrants.
Many former international students had becomeeconomic migrant program participants by 2005(accounting for 52 percent of the total). By definition,such migrants had paid out of their own pockets tomeet Australian employers’ English-language andcredential needs, thus supporting the development ofthe country’s education export industry. Their selec-tion as economic migrants was not viewed as ethical-ly problematic, despite the international debate onthis issue. Parents, rather than source countries, hadfinanced these students’ tertiary education, withscholarship holders systematically excluded fromselection. From an ethical perspective, the recruit-ment of mature-age professionals who have beenfully trained abroad could seem less defensible, eventhough this has been the recruitment norm in Canadaand Australia for many years. Finally, it is importantto acknowledge that Australia’s skilled migrationreview uncovered emerging problems in relation tointernational student flows, most notably a degree ofinstitutional compromise on training quality andacceptable English-language standards (Birrell,Hawthorne and Richardson 2006; Hawthorne 2007b;Birrell, Healy and Kinnaird 2007; Watty 2007).
Since September 2007, decisive steps have beentaken to address this issue. Former international stu-dents are no longer exempt from English-languagetesting because it is impossible for the Department ofImmigration and Citizenship to police educationproviders’ academic entry and progression standards.For all economic migrants, the International EnglishLanguage Testing Scheme (IELTS) band 6 has beendeclared the threshold competence score in the fourlanguage skills — significantly up from band 521 (thereare 9 bands in all). Liberalized access to postcoursevisas will allow former international students an addi-tional 18 months’ stay (if required) to gain work expe-rience, improve their English-language skills orundertake a “professional year” related to their field ofstudy. Only passport holders from the UK, Ireland, theUS, Canada and New Zealand will be exempt fromEnglish testing on transition to economic migration.Significant bonus points will also be awarded to profi-cient English speakers (25 points for candidates rated
37
Th
e Im
pa
ct of E
con
om
ic Se
lectio
n P
olicy
on
La
bo
ur M
ark
et O
utco
me
s for D
eg
ree
-Q
ua
lified
Mig
ran
ts in C
an
ad
a a
nd
Au
stralia
, by
Le
sley
an
ne
Ha
wth
orn
e

IRP
P C
ho
ice
s, V
ol.
14
, n
o.
5,
Ma
y 2
00
8
38
language assessment may seem warranted for eco-nomic PAs, with threshold levels of ability set andtest results externally validated. Furthermore, it couldmake sense to re-evaluate the proportion of pointsallocated to premigration work experience in a con-text where “[v]irtually all of the decline in immigrantentry earnings since the 1980s can be explained by acombination of: (1) a change in the source countrycomposition and associated factors including Englishand French language skills and discrimination, (2) afall in the return to pre-Canadian labour marketexperience, and (3) a general fall in new [labour mar-ket] entrant earnings” (Sweetman 2005, 8).23 Recently,the federal government proposed changes to theImmigration and Refugee Protection Act to modern-ize the immigration system and make it more respon-sive to Canada’s labour market needs. Under theproposed changes, the minister would get the author-ity to identify priority occupations and issue instruc-tions to officers to enable rapid acceptance ofapplicants with skills and experience that correspondto employers’ needs.
In an increasingly competitive global environmentwhere governments promote economic migration tosupport national development goals, the stakes willremain high for both economic migrants and Canada.As established by a recent Statistics Canada review,“If immigrants [escape] low income in their first year,the likelihood of entry in subsequent years [will fall]dramatically to below 10 percent.” However, “by theearly 2000s, skilled class entering immigrants [toCanada] were actually more likely to enter low-income and be in chronic low-income than their fam-ily class counterparts, and the small advantage thatthe university educated entering immigrants hadover, say, the high school educated in the early 1990shad largely disappeared by 2000, as the number ofhighly educated rose. What did change was the faceof the chronically poor immigrant; by the late 1990sone-half were in the skilled economic class, and 41%had degrees (up from 13% in the early 1990s)” (Picot,Hou and Coulombe 2007, 5-6).
Given that newly arrived migrants are more thantwice as likely as the Canadian-born to possessdegrees, it seems essential to redress this skillswastage.
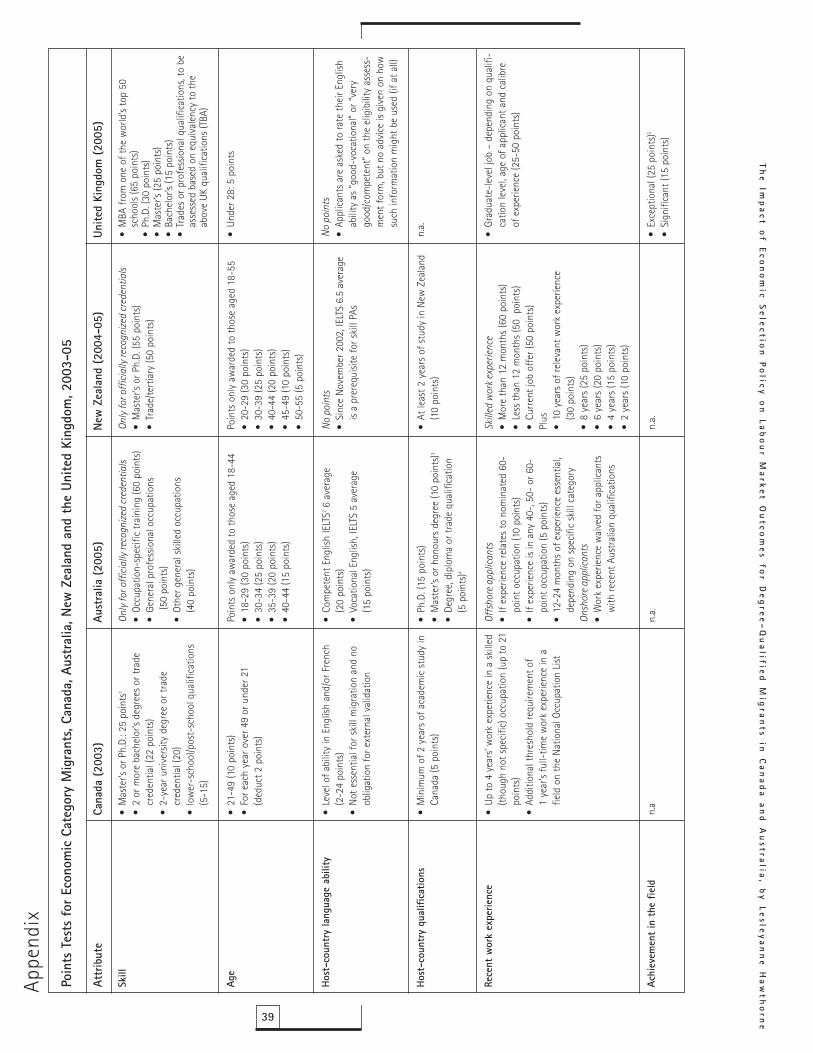
39
Th
e Im
pa
ct of E
con
om
ic Se
lectio
n P
olicy
on
La
bo
ur M
ark
et O
utco
me
s for D
eg
ree
-Q
ua
lified
Mig
ran
ts in C
an
ad
a a
nd
Au
stralia
, by
Le
sley
an
ne
Ha
wth
orn
e
Poin
ts T
ests
for
Eco
nom
ic C
ateg
ory
Mig
rant
s, Ca
nada
, Aus
tral
ia, N
ew Z
eala
nd a
nd t
he U
nite
d Ki
ngdo
m, 2
003-
05
Attr
ibut
eCa
nada
(20
03)
Aust
ralia
(20
05)
New
Zea
land
(20
04-0
5)Un
ited
King
dom
(20
05)
Skill
Age
Host
-cou
ntry
lang
uage
abi
lity
Host
-cou
ntry
qua
lific
atio
ns
Rece
nt w
ork
expe
rienc
e
Achi
evem
ent
in t
he f
ield
•M
aste
r’s o
r Ph.
D.: 2
5 po
ints
1
•2
or m
ore
bach
elor
’s de
gree
s or
trad
ecr
eden
tial (
22 p
oint
s)
•2-
year
uni
vers
ity d
egre
e or
trad
ecr
eden
tial (
20)
•lo
wer
-sch
ool/p
ost-
scho
ol q
ualif
icat
ions
(5-1
5)
•21
-49
(10
poin
ts)
•Fo
r eac
h ye
ar o
ver 4
9 or
und
er 2
1 (d
educ
t 2 p
oint
s)
•Le
vel o
f abi
lity
in E
nglis
h an
d/or
Fre
nch
(2-2
4 po
ints
)•
Not
ess
entia
l for
ski
ll m
igra
tion
and
noob
ligat
ion
for e
xter
nal v
alid
atio
n
•M
inim
um o
f 2 y
ears
of a
cade
mic
stu
dy in
Cana
da (5
poi
nts)
•Up
to 4
yea
rs’ w
ork
expe
rienc
e in
a s
kille
d(th
ough
not
spe
cific
) occ
upat
ion
(up
to 2
1po
ints
)•
Addi
tiona
l thr
esho
ld re
quire
men
t of
1 ye
ar’s
full-
time
wor
k ex
perie
nce
in a
field
on
the
Nat
iona
l Occ
upat
ion
List
n.a
Only
for o
ffic
ially
reco
gnize
d cr
eden
tials
•Oc
cupa
tion-
spec
ific
trai
ning
(60
poin
ts)
•Ge
nera
l pro
fess
iona
l occ
upat
ions
(50
poin
ts)
•Ot
her g
ener
al s
kille
d oc
cupa
tions
(40
poin
ts)
Poin
ts o
nly
awar
ded
to th
ose
aged
18-
44•
18-2
9 (3
0 po
ints
)•
30-3
4 (2
5 po
ints
)•
35-3
9 (2
0 po
ints
)•
40-4
4 (1
5 po
ints
)
•Co
mpe
tent
Eng
lish
IELT
S26
aver
age
(20
poin
ts)
•Vo
catio
nal E
nglis
h, IE
LTS
5 av
erag
e(1
5 po
ints
)
•Ph
.D. (
15 p
oint
s)•
Mas
ter’s
or h
onou
rs d
egre
e (1
0 po
ints
)3
•De
gree
, dip
lom
a or
trad
e qu
alifi
catio
n(5
poi
nts)
4
Offs
hore
app
lican
ts•
If ex
perie
nce
rela
tes
to n
omin
ated
60-
poin
t occ
upat
ion
(10
poin
ts)
•If
expe
rienc
e is
in a
ny 4
0-, 5
0- o
r 60-
poin
t occ
upat
ion
(5 p
oint
s)
•12
-24
mon
ths
of e
xper
ienc
e es
sent
ial,
depe
ndin
g on
spe
cific
ski
ll ca
tego
ryOn
shor
e ap
plic
ants
•W
ork
expe
rienc
e w
aive
d fo
r app
lican
tsw
ith re
cent
Aus
tral
ian
qual
ifica
tions
n.a.
Only
for o
ffic
ially
reco
gnize
d cr
eden
tials
•M
aste
r’s o
r Ph.
D. (5
5 po
ints
)•
Trad
e/te
rtia
ry (5
0 po
ints
)
Poin
ts o
nly
awar
ded
to th
ose
aged
18-
55•
20-2
9 (3
0 po
ints
)•
30-3
9 (2
5 po
ints
)•
40-4
4 (2
0 po
ints
)•
45-4
9 (1
0 po
ints
)•
50-5
5 (5
poi
nts)
No p
oint
s•
Sinc
e N
ovem
ber 2
002,
IELT
S 6.
5 av
erag
eis
a pr
ereq
uisit
e fo
r ski
ll PA
s
•At
leas
t 2 y
ears
of s
tudy
in N
ew Z
eala
nd(1
0 po
ints
)
Skill
ed w
ork e
xper
ienc
e•
Mor
e th
an 1
2 m
onth
s (6
0 po
ints
)•
Less
than
12
mon
ths
(50
poi
nts)
•Cu
rren
t job
off
er (5
0 po
ints
)Pl
us•
10 y
ears
of r
elev
ant w
ork
expe
rienc
e(3
0 po
ints
)•
8 ye
ars
(25
poin
ts)
•6
year
s (2
0 po
ints
)•
4 ye
ars
(15
poin
ts)
•2
year
s (1
0 po
ints
)
n.a.
•M
BA fr
om o
ne o
f the
wor
ld’s
top
50sc
hool
s (6
5 po
ints
) •
Ph.D
. (30
poi
nts)
•M
aste
r’s (2
5 po
ints
)•
Bach
elor
’s (1
5 po
ints
)•
Trad
es o
r pro
fess
iona
l qua
lific
atio
ns, t
o be
asse
ssed
bas
ed o
n eq
uiva
lenc
y to
the
abov
e UK
qua
lific
atio
ns (T
BA)
•Un
der 2
8: 5
poi
nts
No p
oint
s•
Appl
ican
ts a
re a
sked
to ra
te th
eir E
nglis
hab
ility
as
“goo
d-vo
catio
nal”
or “v
ery
good
/com
pete
nt” o
n th
e el
igib
ility
ass
ess-
men
t for
m, b
ut n
o ad
vice
is g
iven
on
how
such
info
rmat
ion
mig
ht b
e us
ed (i
f at a
ll)
n.a.
•Gr
adua
te-l
evel
job
– de
pend
ing
on q
ualif
i-ca
tion
leve
l, ag
e of
app
lican
t and
cal
ibre
of e
xper
ienc
e (2
5-50
poi
nts)
•Ex
cept
iona
l (25
poi
nts)
5
•Si
gnifi
cant
(15
poin
ts)
Appe
ndix
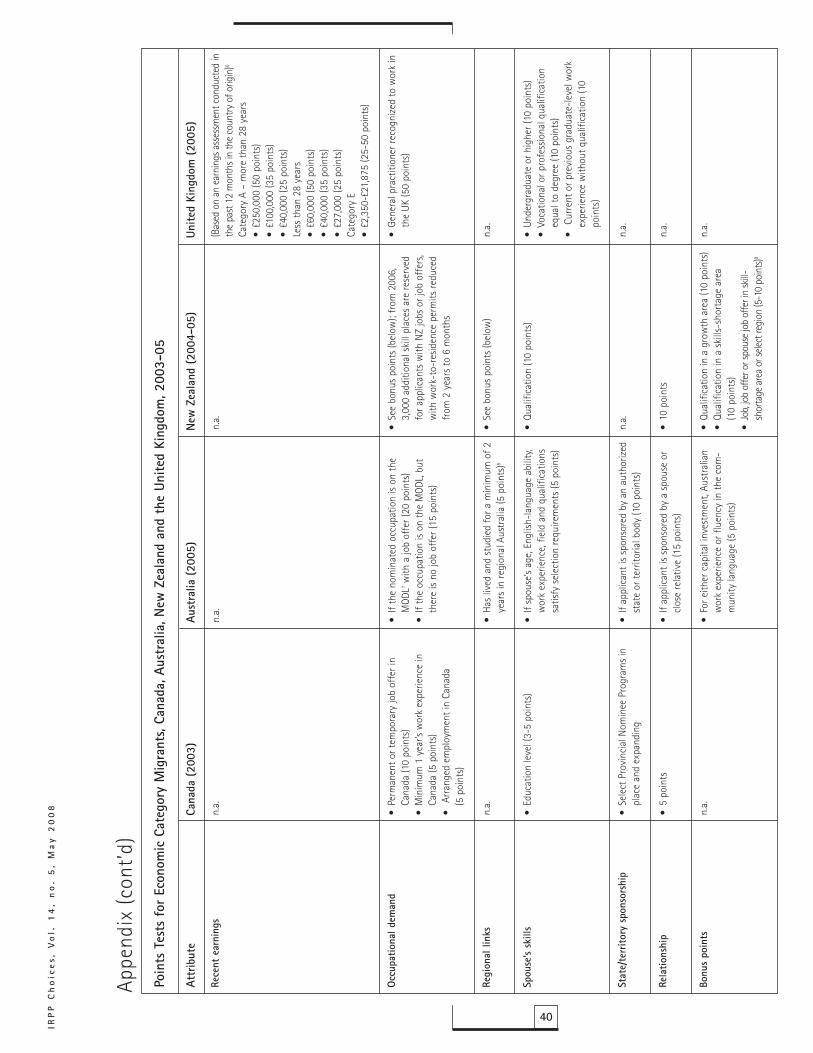
IRP
P C
ho
ice
s, V
ol.
14
, n
o.
5,
Ma
y 2
00
8
40
Poin
ts T
ests
for
Eco
nom
ic C
ateg
ory
Mig
rant
s, Ca
nada
, Aus
tral
ia, N
ew Z
eala
nd a
nd t
he U
nite
d Ki
ngdo
m, 2
003-
05
Attr
ibut
eCa
nada
(20
03)
Aust
ralia
(20
05)
New
Zea
land
(20
04-0
5)Un
ited
King
dom
(20
05)
Rece
nt e
arni
ngs
Occu
patio
nal d
eman
d
Regi
onal
link
s
Spou
se’s
skill
s
Stat
e/te
rrito
ry s
pons
orsh
ip
Rela
tions
hip
Bonu
s po
ints
n.a.
•Pe
rman
ent o
r tem
pora
ry jo
b of
fer i
nCa
nada
(10
poin
ts)
•M
inim
um 1
yea
r’s w
ork
expe
rienc
e in
Cana
da (5
poi
nts)
•Ar
rang
ed e
mpl
oym
ent i
n Ca
nada
(5 p
oint
s)
n.a.
•Ed
ucat
ion
leve
l (3-
5 po
ints
)
•Se
lect
Pro
vinc
ial N
omin
ee P
rogr
ams
inpl
ace
and
expa
ndin
g
•5
poin
ts
n.a.
n.a.
•If
the
nom
inat
ed o
ccup
atio
n is
on th
eM
ODL7
with
a jo
b of
fer (
20 p
oint
s)•
If th
e oc
cupa
tion
is on
the
MOD
L, bu
tth
ere
is no
job
offe
r (15
poi
nts)
•Ha
s liv
ed a
nd s
tudi
ed fo
r a m
inim
um o
f 2ye
ars
in re
gion
al A
ustr
alia
(5 p
oint
s)8
•If
spou
se’s
age,
Eng
lish-
lang
uage
abi
lity,
wor
k ex
perie
nce,
fiel
d an
d qu
alifi
catio
nssa
tisfy
sel
ectio
n re
quire
men
ts (5
poi
nts)
•If
appl
ican
t is
spon
sore
d by
an
auth
oriz
edst
ate
or te
rrito
rial b
ody
(10
poin
ts)
•If
appl
ican
t is
spon
sore
d by
a s
pous
e or
clos
e re
lativ
e (1
5 po
ints
)
•Fo
r eith
er c
apita
l inv
estm
ent,
Aust
ralia
nw
ork
expe
rienc
e or
flue
ncy
in th
e co
m-
mun
ity la
ngua
ge (5
poi
nts)
n.a.
•Se
e bo
nus
poin
ts (b
elow
); fr
om 2
006,
3,00
0 ad
ditio
nal s
kill
plac
es a
re re
serv
edfo
r app
lican
ts w
ith N
Z jo
bs o
r job
off
ers,
with
wor
k-to
-res
iden
ce p
erm
its re
duce
dfr
om 2
yea
rs to
6 m
onth
s
•Se
e bo
nus
poin
ts (b
elow
)
•Qu
alifi
catio
n (1
0 po
ints
)
n.a.
•10
poi
nts
•Qu
alifi
catio
n in
a g
row
th a
rea
(10
poin
ts)
•Qu
alifi
catio
n in
a s
kills
-sho
rtag
e ar
ea(1
0 po
ints
)•
Job,
job
offe
r or s
pous
e jo
b of
fer i
n sk
ill-sh
orta
ge a
rea
or se
lect r
egio
n (5
-10
poin
ts)9
(Bas
ed o
n an
ear
ning
s ass
essm
ent c
ondu
cted
inth
e pa
st 1
2 m
onth
s in
the
coun
try o
f orig
in)6
Cate
gory
A –
mor
e th
an 2
8 ye
ars
•£2
50,0
00 (5
0 po
ints
)•
£100
,000
(35
poin
ts)
•£4
0,00
0 (2
5 po
ints
)Le
ss th
an 2
8 ye
ars
•£6
0,00
0 (5
0 po
ints
)•
£40,
000
(35
poin
ts)
•£2
7,00
0 (2
5 po
ints
)Ca
tego
ry E
•
£2,3
50-£
21,8
75 (2
5-50
poi
nts)
•Ge
nera
l pra
ctiti
oner
reco
gniz
ed to
wor
k in
the
UK (5
0 po
ints
)
n.a.
•Un
derg
radu
ate
or h
ighe
r (10
poi
nts)
•Vo
catio
nal o
r pro
fess
iona
l qua
lific
atio
neq
ual t
o de
gree
(10
poin
ts)
•Cu
rren
t or p
revi
ous
grad
uate
-lev
el w
ork
expe
rienc
e w
ithou
t qua
lific
atio
n (1
0po
ints
)
n.a.
n.a.
n.a.
Appe
ndix
(con
t’d)
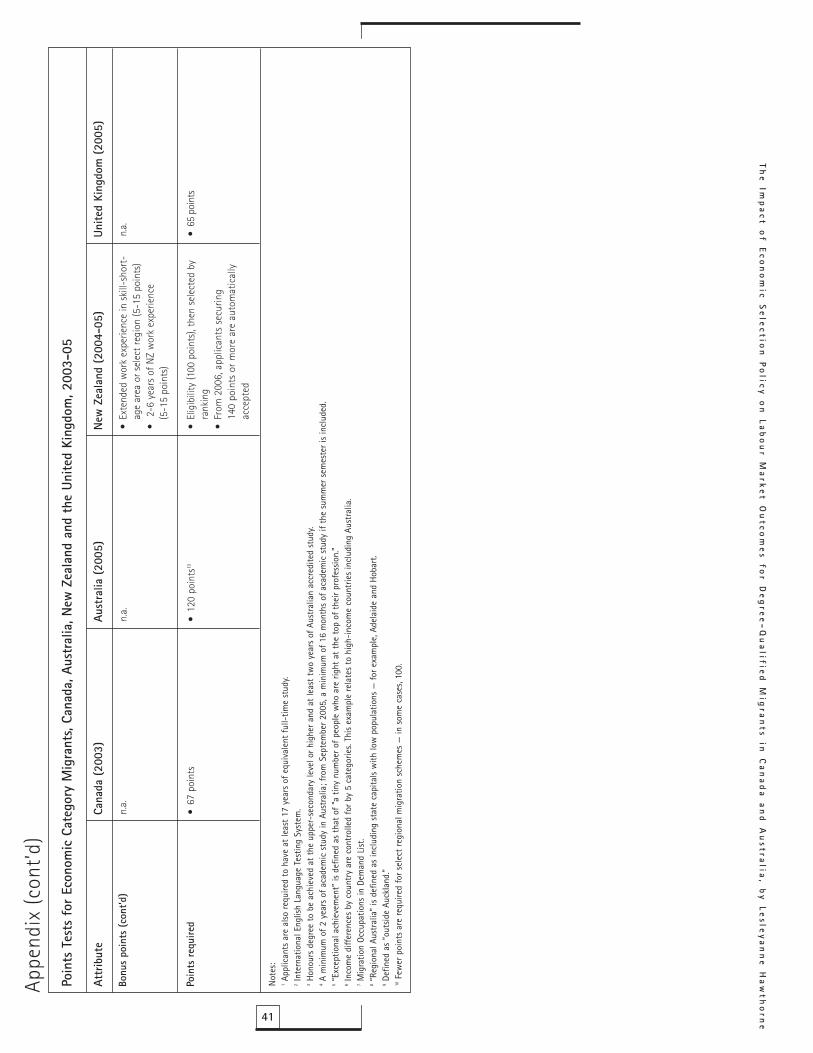
41
Th
e Im
pa
ct of E
con
om
ic Se
lectio
n P
olicy
on
La
bo
ur M
ark
et O
utco
me
s for D
eg
ree
-Q
ua
lified
Mig
ran
ts in C
an
ad
a a
nd
Au
stralia
, by
Le
sley
an
ne
Ha
wth
orn
e
Poin
ts T
ests
for
Eco
nom
ic C
ateg
ory
Mig
rant
s, Ca
nada
, Aus
tral
ia, N
ew Z
eala
nd a
nd t
he U
nite
d Ki
ngdo
m, 2
003-
05
Attr
ibut
eCa
nada
(20
03)
Aust
ralia
(20
05)
New
Zea
land
(20
04-0
5)Un
ited
King
dom
(20
05)
Bonu
s po
ints
(co
nt’d
)
Poin
ts r
equi
red
n.a.
•67
poi
nts
n.a.
•12
0 po
ints
10
•Ex
tend
ed w
ork
expe
rienc
e in
ski
ll-sh
ort-
age
area
or s
elec
t reg
ion
(5-1
5 po
ints
)•
2-6
year
s of
NZ
wor
k ex
perie
nce
(5-1
5 po
ints
)
•El
igib
ility
(100
poi
nts)
, the
n se
lect
ed b
yra
nkin
g•
From
200
6, a
pplic
ants
sec
urin
g14
0 po
ints
or m
ore
are
auto
mat
ical
lyac
cept
ed
n.a.
•65
poi
nts
Not
es:
1Ap
plic
ants
are
also
requ
ired
to h
ave
at le
ast
17 y
ears
of e
quiv
alen
t fu
ll-tim
e st
udy.
2In
tern
atio
nal E
nglis
h La
ngua
ge T
estin
g Sy
stem
.3
Hono
urs
degr
ee t
o be
ach
ieve
d at
the
upp
er-s
econ
dary
leve
l or h
ighe
r and
at
leas
t tw
o ye
ars
of A
ustr
alia
n ac
cred
ited
stud
y.4
A m
inim
um o
f 2 y
ears
of a
cade
mic
stu
dy in
Aus
tral
ia; f
rom
Sep
tem
ber 2
005,
a m
inim
um o
f 16
mon
ths
of a
cade
mic
stu
dy if
the
sum
mer
sem
este
r is
incl
uded
.5
“Exc
eptio
nal a
chie
vem
ent”
is d
efin
ed a
s th
at o
f “a
tiny
num
ber o
f peo
ple
who
are
righ
t at
the
top
of t
heir
prof
essio
n.”
6In
com
e di
ffer
ence
s by
cou
ntry
are
con
trol
led
for b
y 5
cate
gorie
s. Th
is ex
ampl
e re
late
s to
hig
h-in
com
e co
untr
ies
incl
udin
g Au
stra
lia.
7M
igra
tion
Occu
patio
ns in
Dem
and
List
.8
“Reg
iona
l Aus
tral
ia”
is de
fined
as
incl
udin
g st
ate
capi
tals
with
low
pop
ulat
ions
— fo
r exa
mpl
e, A
dela
ide
and
Hoba
rt.
9De
fined
as
“out
side
Auck
land
.”10
Few
er p
oint
s ar
e re
quire
d fo
r sel
ect
regi
onal
mig
ratio
n sc
hem
es —
in s
ome
case
s, 10
0.
Appe
ndix
(con
t’d)
IRP
P C
ho
ice
s, V
ol.
14
, n
o.
5,
Ma
y 2
00
8
42
diploma/diploma/Certificate IV; 4) no college/universi-ty certificate or with diploma/skilled vocational; 5) ele-mentary — secondary/other.
8 These are estimates calculated on the basis of percentagesprovided in tables 2a and 2b. See note 5 for more details.
9 All information on Canadian immigration flows isderived from the author’s analysis of data provided byCitizenship and Immigration Canada in 2005; compa-rable data was provided by Australia’s Department ofImmigration and Multicultural Affairs.
10 Employer demand for temporary computing profes-sionals remained high in 2003-04, accounting for2,808 new arrivals. By September 2006, reflecting fur-ther demand for experienced professionals, six IT fieldshad also been reinstated on Australia’s MigrationOccupations in Demand List (20 bonus points) for theselection of landed immigrants.
11 Most Filipino temporary workers have entered Canadato date through the low-skill, employer-driven live-incaregiver category. In December 2007, CIC informedme that this category has been rapidly expanding;workers are required, and CIC can facilitate their tran-sition to permanent resident status. Filipino profes-sionals selected as economic category principalapplicants have a very different employment trajectoryfrom those entering through low-skill schemes. Manyappear to be of minimal interest to Canadian employ-ers of high-skill workers, and their skills are often seri-ously discounted due to barriers related to languageand credential recognition requirements.
12 “Other Africa” excludes data from South Africa in theCensus analysis. Data also had to be aggregated for arange of source countries to allow for meaningful sta-tistical analysis — for example, Hong Kong/Malaysia/Singapore data were aggregated for these comparableCommonwealth Asian source countries. Please seeappendix A in the full report for detail on regionalcategorizations (Hawthorne 2007a).
13 It is challenging to establish an effective methodologyfor predicting labour market demand by field.Established in 1999, the MODL was designed to factorlabour market demand back into selection and to target“occupations or specialisations that are in widespread,persistent and ongoing shortage” in fields “sufficientlylarge that increased entry by [skilled migrants] wouldnot lead to surpluses in the Australian labour market.”The federal Department of Employment and WorkplaceRelations (DEWR) was charged with providing expertadvice in relation to demand and with preparing a listto be updated once (now twice) per year. In formulatingthe MODL, DEWR assesses the scale of Australian labourmarket demand in occupations with 1,500 positions ormore, leaving the needs of smaller occupations to beaddressed by the Employment Nomination Scheme. Skilllevels — as designated by degree, diploma or trade qual-ifications — are expected to be reasonably high. Supplyprofiles by field are developed by drawing on labourmarket surveys, graduate employment outcomes, cur-rent and future growth trends (including demographic
NotesThis paper is based on a study commissioned in 2004 byStatistics Canada, Citizenship and Immigration Canadaand Human Resources and Social Development Canadaentitled “Labour Market Outcomes for MigrantProfessionals: Canada and Australia Compared”(Hawthorne 2007a). I would like to acknowledge thefunding support of these bodies and to thank them forgranting permission to release an abridged, revised andupdated version of the report as an IRPP publication. Ialso appreciate the statistical assistance provided byGraeme Hawthorne (University of Melbourne), YuriOstrovsky and Jessie-Lynn McDonald (Statistics Canada)and Sebastien Vachon and Stanley Kustec (CIC); and theproject support of Garnett Picot (Statistics Canada),Elizabeth Ruddick (CIC) and Louis Grignon (HRSDC).
1 This refers to countries that choose to actively seek toexpand population and/or recruit migrants by a rangeof immigration program means.
2 The OECD defines an overqualified individual as one who“hold[s] a job that requires lesser qualifications than onethat would theoretically be available at his educationlevel” (OECD 2008). See tables 6a and 6b for quantifica-tion of the prevalence of this in Canada and Australia,compared to other member nations, circa 2000.
3 “Generic qualifications” are defined for the purpose ofthis study as those not immediately correlating to a pro-fessional field of practice (for example, a BA or B.Sc.).
4 Comprehensive methodological detail for the study isprovided in the full Citizenship and ImmigrationCanada (CIC) report (Hawthorne 2007a), available byrequest from CIC. Extended interviews were conductedwith 32 policy-makers (from CIC and HumanResources and Social Development Canada);researchers (from selected universities as well asStatistics Canada); language and bridging courseproviders; key personnel in engineering, nursing andmedical regulatory bodies (in Ottawa, Toronto andVancouver); and staff of the nonprofit foreign creden-tial evaluation organization World Education Services.All were selected for their expertise related to labourmarket outcomes for migrant professionals.
5 For confidentiality reasons, Statistics Canada suppressedsmall cell counts (less than 5) in the data provided. Thisprocedure was slightly different from other analyses ofthe census data, where the number of small cell countssuppressed was either less than 5 or less than 10,depending upon the analysis. Therefore, numbers in thisreport will differ from numbers obtained in other reportswhere the less-than-10-cases-per-cell rule was used. It isalso important to note that Statistics Canada supplied usnot with actual figures but with percentages.
6 The aim in doing this for the LSIA 3 was to avoidcounting only part-time work as a positive employmentoutcome — for example, for international students.
7 The educational attainment codes that were used inthis study were: 1) Ph.D./master’s; 2) bachelor’s degreeor university certificate above a bachelor’s degree; 3)college/university certificate or diploma/advanced
shifts), variations in employment demand by state andstudies of the ease with which advertised vacancies canbe filled (factoring in the source and perceived standardof recent appointees). Key criteria for inclusion of anoccupation on the MODL include evidence of a nationaldemand for it (based on DEWR’s “skills in demand”research); the skill level of the occupation and the exis-tence of an Australian assessment authority; employ-ment size of the occupation; unemployment rate of theoccupation; employment growth in the occupation; andthe persistence of skill shortages (Australia, Departmentof Immigration and Multicultural Affairs 2006, chap. 3).
14 Please note that the Australian Census favours therecording of “highest qualification” in terms of field.Given this, where postgraduate qualifications havebeen secured (for example, an MBA), the originalvocational field will not be counted (for example,engineering or IT).
15 This level of growth would have been influenced bysustained nurse migration to Australia (by comparison,nurse migration levels to Canada were low). It wouldalso have been boosted by the number of diploma-qualified local nurses attaining bachelor’s degrees (agrowing trend since 1986).
16 It is a demand-driven anomaly that temporary residentIMG arrivals are permitted to work in Australia imme-diately, bypassing all credential examinations, whilelanded immigrant IMGs are required to take theseexams. New South Wales, the major immigrant-receiv-ing province, does not even seek information on theAustralian Medical Council examination status ofIMGs (Hawthorne, Hawthorne and Crotty 2007).
17 The Census data do not give us precise detail on thisscore. However (as stated in the methodological expla-nation), it is reasonable to deduce this based on arrivaldate and date of qualification.
18 Please see section 8 of the full report for methodologi-cal detail (Hawthorne 2007a). It is important to notehere that LSIC and LSIA data were collected six monthsafter arrival, compared to IMDB data, which were col-lected within the first year. Some additional caveatsrelated to direct comparability are noted in section 8.
19 Analyses of census and other data in Australia confirmmigrants may overestimate or underestimate theirhost-country language ability, with no evidence thatself-reporting is a reliable measure, or one that corre-lates with employer expectations of performance.
20 Please note that 14 percent of migrants in Canada statethat French is their first or second language at point ofmigration. However, substantial numbers may encounteremployment problems if they settle outside Quebec.
21 Speaking, listening, reading and writing — the thresh-old score must be reached on independently validatedlanguage tests in all four skills.
22 The merits of the Australian model have recently beenacknowledged by the UK as a major influence on itsnewly designed skill migration scheme from 2008.
23 For more on the discounting of labour market experi-ence, see also Boudarbat and Boulet (2007).
43
Th
e Im
pa
ct of E
con
om
ic Se
lectio
n P
olicy
on
La
bo
ur M
ark
et O
utco
me
s for D
eg
ree
-Q
ua
lified
Mig
ran
ts in C
an
ad
a a
nd
Au
stralia
, by
Le
sley
an
ne
Ha
wth
orn
e
IRP
P C
ho
ice
s, V
ol.
14
, n
o.
5,
Ma
y 2
00
8
44
Immigration Policy for the 21st Century. Montreal andKingston: McGill-Queen’s University Press.
Bedford, R. 2006. “Skilled Migration Policy in Australia andNew Zealand: Similarities and Differences.” InEvaluation of the General Skilled Migration Categories,edited by B. Birrell, L. Hawthorne, and S. Richardson.Canberra: Department of Immigration andMulticultural Affairs.
Birrell, B. 2008, “Some Migrants Not Skilled Enough.” TheAge, April 30, p 17.
Birrell, B., I. Dobson, V. Rapson, and F.T. Smith. 2005.Immigration in a Time of Domestic Skilled Shortages:Skilled Movement in 2003-04. Melbourne: Centre forPopulation and Urban Research, Monash University.
Birrell, B., and L. Hawthorne. 1997. Immigrants and theProfessions in Australia. Melbourne: Centre forPopulation and Urban Research, Monash University.
_____. 1999. “Skilled Migration Outcomes as of 1996: AContribution to the Review of the Independent andSkilled-Australian Linked Categories BeingConducted by the Department of Immigration andMulticultural Affairs” [DIMA]. In Review of theIndependent and Skilled-Australian LinkedCategories. Canberra: DIMA.
Birrell, B., L. Hawthorne, and S. Richardson, eds. 2006.Evaluation of the General Skilled Migration Categories.Canberra: Department of Immigration andMulticultural Affairs.
Birrell, B., E. Healy, and B. Kinnaird. 2007. “Cooks Galoreand Hairdressers Aplenty.” People and Place 15 (1)..
Boudarbat, B. and Boulet, M. 2007. “Détérioration dessalaires des nouveaux immigrants au Québec par rap-port à l’Ontario et à la Colombie-Britannique.” ChoixIRPP 13 (7).
Boulet, J., J. Bede, D. McKinley, and J. Norcini. 2005. “AnOverview of the World’s Medical Schools.” Paper pre-sented at the conference of the Association for MedicalEducation in Europe, September, Amsterdam.
Bourgeault, I. 2007. “Brain Drain, Brain Gain and BrainWaste Programs: Programs Aimed at Integrating andRetaining the Best and Brightest in Health Care.” In“Foreign Credential Recognition and Assessment,” ed.L. Hawthorne, special issue, Canadian Issues/Thèmescanadiens (spring): 96-9.
Boyd, M. 1992a. “Gender Issues in Immigration andLanguage Fluency Issues: Canada and the UnitedStates.” Canadian Review of Anthropology andSociology 18 (5): 657-73.
_____. 1992b. “Gender, Visible Minority and ImmigrantEarnings Inequality: Reassessing an EmploymentEquity Premise.” In Deconstructing a Nation:Immigration, Multiculturalism and Racism in 90sCanada, edited by V. Satzewitch. Halifax: FernwoodPublishing.
Boyd, M., J. DeVries, and K. Simkin. 1994. “Language,Economic Status and Immigration.” In Immigrationand Refugee Policy: Australia and Canada Compared,edited by H. Adelman, A. Borowski, M. Burstein, and L.Foster. Toronto: University of Toronto Press.
ReferencesAbraham, S., and L.H. Hamilton. 2006. Immigration and
America’s Future: A New Chapter. Final Report of theIndependent Taskforce. New York: Migration PolicyInstitute.
Aceytuno, J. 2004. “You’re Hired: Employer Demand andAbsorptive Capacity in Canada.” Paper presented atthe ninth annual International Metropolis Conference,September 27-October 1, Geneva.
Adams, T. 2007. “Professional Regulation in Canada: Pastand Present.” In “Foreign Credential Recognition andAssessment,” ed. L. Hawthorne, special issue, CanadianIssues/Thèmes canadiens (spring): 14-16.
Alboim, N., and K. Cohl. 2007. “Centres of Expertise: AnExpanded Role for Colleges and Institutes in ImmigrantEducation.” In “Foreign Credential Recognition andAssessment,” ed. L. Hawthorne, special issue, CanadianIssues/Thèmes canadiens (spring): 50-4.
Australia. Bureau of Labour Market Research (BLMR). 1986.Migrants in the Australian Labour Market. BLMRResearch Report 10. Canberra: Australian GovernmentPublishing Service.
_____. Department of Immigration and Citizenship. 2006.Evaluation of the General Skilled Migration CategoriesReport. Canberra: Australian Government PublishingService, p. 119.
_____. Department of Immigration and Citizenship. 2007a.“Changes to the General Skilled Migration.” AccessedMarch 25, 2008. http://www.immi.gov.au/skilled/gener-al-skilled-migration/changes/_pdf/GSMchange_options.pdf
_____. 2007b. “English Language Tuition for AdultMigrants.” Fact Sheet 24. Accessed March 25, 2008.http://www.immi.gov.au/media/fact-sheets/24amep.htm
_____. 2007c. “Migration Program Planning Levels.” FactSheet 20. Accessed March 25, 2008. http://www.immi.gov.au/media/fact-sheets/20planning.htm
_____. 2008. Data related to skilled migration quotas (allsubcategories), sourced March 15.
_____. Department of Immigration and Multicultural Affairs(DIMIA). 1999. Review of the Independent and Skilled-Australian Linked Categories. Canberra: DIMIA.
_____. Department of Immigration and Multicultural andIndigenous Affairs (DIIMA). 2005. Population Flows:Immigration Aspects, January. Canberra: DIMIA.
_____. Office of Multicultural Affairs. 1989. Towards aNational Agenda for a Multicultural Australia —Sharing Our Future. Canberra: Australian GovernmentPublishing Service.
Aydemir, A., and M. Skuterud. 2005. “Explaining theDeteriorating Entry Earnings of Canada’s ImmigrantCohorts: 1966-2000.” Canadian Journal of Economics38 (2): 641-72.
Baldacchino, G., S. Chandrasekere, and P. Saunders. 2007.“Internationally Educated Health Professionals inAtlantic Canada.” In “Foreign Credential Recognitionand Assessment,” ed. L. Hawthorne, special issue,Canadian Issues/Thèmes canadiens (spring): 104-7.
Beach, C.M., A.G. Green, and J.G. Reitz, eds. 2003. Canadian

Fincher, R., L. Foster, W. Giles, and V. Preston. 1994. “Genderand Migration Policy.” In Immigration and RefugeePolicy: Australia and Canada Compared, vol. 1, edited byH. Adelman, A. Borowski, M. Burstein, and L. Foster.Melbourne: Melbourne University Press.
Foundation for Advancement of International MedicalEducation and Research (FAIMER). 2005. InternationalMedical Education Directory. Philadelphia: FAIMER.
Frenette, M., D. Green, and G. Picot. 2004. Rising IncomeInequality amid the Economic Recovery of the 1990s: AnExploration of Three Data Sources. Business and LabourMarket Analysis Research Paper 215. Ottawa: StatisticsCanada.
Goldberg, M. 2007. “How Current Globalization DiscoursesShape Access: Professions and Trades Policy in Ontario.”In “Foreign Credential Recognition and Assessment,” ed.L. Hawthorne, special issue, Canadian Issues/Thèmescanadiens (spring): 31-6.
Guo, S. 2007. “Tracing the Roots of Non-recognition ofForeign Credentials.” In “Foreign Credential Recognitionand Assessment,” ed. L. Hawthorne, special issue,Canadian Issues/Thèmes canadiens (spring): 36-8.
Hawthorne, L. 1994. Labour Market Barriers for ImmigrantEngineers in Australia. Canberra: Australian GovernmentPublishing Service.
_____. 1996. “Reversing Past Stereotypes: Skilled Non EnglishSpeaking Background Women in Australia.” Journal ofIntercultural Studies 17 (1-2): 41-52.
_____. 2001. “The Globalisation of the Nursing Workforce:Barriers Confronting Overseas-Qualified Nurses inAustralia.” Nursing Inquiry 8 (4): 213-29.
_____. 2002. “Qualifications Recognition Reform for SkilledMigrants in Australia: Applying Competency-BasedAssessment to Overseas-Qualified Nurses.” InternationalMigration Quarterly Review 40 (6): 55-92.
_____. 2005. “Picking Winners: The Recent Transformation ofAustralia’s Skill Migration Policy.” InternationalMigration Review 39 (2): 663-96.
_____. 2007a. “Labour Market Outcomes for MigrantProfessionals: Canada and Australia Compared.” Ottawa:Citizenship and Immigration Canada.
_____. 2007b. “Foreign Credential Recognition andAssessment: An Introduction.” In “Foreign CredentialRecognition and Assessment,” ed. L. Hawthorne, specialissue, Canadian Issues/Thèmes canadiens (spring): 3-13.
Hawthorne, L., G. Hawthorne, and B. Crotty. 2007. TheRegistration and Training Status of Overseas TrainedDoctors in Australia. Canberra: Department of Healthand Ageing.
Hawthorne, L., and J. Toth. 1996. “The Impact of LanguageTesting on the Registration of Immigrant Doctors.”People and Place 4 (3): 47-54.
Hiebert, D. 2006. “Skilled Immigration in Canada: Context,Patterns and Outcomes.” In Evaluation of the GeneralSkilled Migration Categories, edited by B. Birrell, L.Hawthorne, and S. Richardson. Canberra: Department ofImmigration and Multicultural Affairs.
_____. 2007. Skill Migration Statistical Update, August.Vancouver: University of British Columbia.
Brean, J. 2007. “Immigrants Account for Our Growth.”National Post, March 14.
Canadian Council of Professional Engineers (CCPE). 2004.From Consideration to Integration: Recommendationsto Help Integrate International Engineering Graduatesinto the Canadian Profession and Workforce. FinalReport from Phase 11. Ottawa: CCPE.
Cardozo, A., and S. Guilfoyle. 2007. “Foreign CredentialRecognition in Key Sectors of the Economy.” In“Foreign Credential Recognition and Assessment,” ed.L. Hawthorne, special issue, Canadian Issues/Thèmescanadiens (spring): 133-5.
Centre for Canadian Language Benchmarks (CCLB). 2002.Benchmarking the English Language Demands of theNursing Profession across Canada, July. Ottawa: CCLB.Accessed March 31, 2008. http://www.celban.org/celban/doc_viewer_dex.asp?doc_id=19&page_id=32
Chiswick, B., and P. Miller. 2000a. The Complementarity ofLanguage and Other Human Capital: ImmigrantEarnings in Canada. RIIM Working Paper 00-08.Vancouver: Research on Immigration and Integrationin the Metropolis.
_____. 2000b. A Model of Destination LanguageAcquisition: Application to Male Immigrants inCanada. RIIM Working Paper 00-13. Vancouver:Research on Immigration and Integration in theMetropolis.
Citizenship and Immigration Canada (CIC). 1998. “SkilledWorker Immigrants: Towards a New Model ofSelection,” November. Ottawa: CIC.
_____. 2002. “Immigration and Refugee Protection Act(IRPA) News Release.” Ottawa: CIC.
_____. 2007. “CIC Canada Facts and Figures 2006:Immigration Overview Permanent Residents.” Ottawa:CIC. Accessed March 25, 2008. http://www.cic.gc.ca/english/pub/facts2006_category.html
_____. 2008. “Canadian Experience Class,” January.Description paper, working draft.
Committee to Advise on Australia’s Immigration Policy.1988. Immigration: A Commitment to Australia.Report of the Committee to Advise on Australia’sImmigration Policy. Canberra: Australian GovernmentPrinting Service.
Dauphinee, D. 2007. “Credentials Recognition in Medicine:History, Progress and Lessons.” In “Foreign CredentialRecognition and Assessment,” ed. L. Hawthorne, spe-cial issue, Canadian Issues/Thèmes canadiens (spring):100-103.
English for International Opportunity. 2007. InternationalEnglish Language Testing System (IELTS) Informationfor Candidates. Accessed March 31, 2008.http://www.ielts.org/_lib/pdf/Information_for_Candidates_2007.pdf#
Ferrer, A., D.A. Green, and W.C. Riddell. 2004. InternationalAdult Literacy Survey: The Effect of Literacy onImmigrant Earnings, cat. no. 89-552-MIE, no. 12.Ottawa: Statistics Canada. Accessed April 3, 2008.http://www.statcan.ca/english/research/89-552-MIE/89-552-MIE2004012.pdf
45
Th
e Im
pa
ct of E
con
om
ic Se
lectio
n P
olicy
on
La
bo
ur M
ark
et O
utco
me
s for D
eg
ree
-Q
ua
lified
Mig
ran
ts in C
an
ad
a a
nd
Au
stralia
, by
Le
sley
an
ne
Ha
wth
orn
e
IRP
P C
ho
ice
s, V
ol.
14
, n
o.
5,
Ma
y 2
00
8
46
_____. 2008. A Profile of Immigrant Populations in the 21st
Century: Data from OECD Countries. Paris: OECD.Orme, L. 2007. “Immigrant Workforce Integration: The
Hamilton Experience.” In “Foreign CredentialRecognition and Assessment,” ed. L. Hawthorne, spe-cial issue, Canadian Issues/Thèmes canadiens (spring):75-8.
Pawlikowska-Smith, G. 2000. Canadian LanguageBenchmarks 2000: English as a Second Language forAdults. Ottawa: Centre for Canadian LanguageBenchmarks.
Pendakur, K., and R. Pendakur. 1998. “The Colour of Money:Earnings Differentials among Ethnic Groups in Canada.”Canadian Journal of Economics 31 (3): 518-48.
_____. 2004. Colour My World: Has the Majority-MinorityEarnings Gap Changed over Time? RIIM WorkingPaper 04-11. Vancouver: Research on Immigration andIntegration in the Metropolis.
Picot, G., and F. Hou. 2003. The Rise in Low-Income Ratesamong Immigrants in Canada, June, cat. no. 11F0019,no. 198. Ottawa: Business and Labour Market AnalysisDivision, Statistics Canada. Accessed April 3, 2008.http://www.statcan.ca/english/research/11F0019MIE/11F0019MIE2003198.pdf
Picot, G., F. Hou, and S. Coulombe. 2007. Chronic Low-Income and Low-Income Dynamics among RecentImmigrants, January 30. Analytical Studies BranchResearch Paper Series cat. no. 11F0019MIE, no. 294.Ottawa: Statistics Canada. Accessed April 3, 2008.http://www.statcan.ca/english/research/11F0019MIE/11F0019MIE2007294.pdf
Reitz, J.G. 2004. “Immigrant Earnings Performance inCanadian Cities: 1981 through 2001.” CanadianJournal of Urban Research 13 (1): 62-84.
_____. 2005. “Tapping Immigrants’ Skills: New Directionsfor Canadian Immigration Policy in the KnowledgeEconomy.” IRPP Choices 11 (1).
Richardson, S., and L. Lester. 2004. “A Comparison ofAustralian and Canadian Immigration Policies andLabour Market Outcomes.” Paper presented at theNational Institute of Labour Studies, FlindersUniversity, Adelaide, September.
Ruddock, P. 1996. Interview with Elaine Harris, 26 April1996. Croll’s Monitoring Australia.
Schellenberg, G. 2004. Immigrants in Canada’s CensusMetropolitan Areas, cat. no. 89-613, no. 003. Ottawa:Statistics Canada.
Schellenberg, G., and H. Maheux. 2007. Immigrants’Perspectives on Their First Four Years in Canada:Canadian Social Trends, April, Publications WebsiteModule 11-008-XWE. Ottawa: Citizenship andImmigration Canada.
Stahl, C., R. Ball, C. Inglis, and P. Gutman. 1993. GlobalPopulation Movements and Their Implications forAustralia. Canberra: Australian GovernmentPublishing Service.
Sweetman, A. 2005. “Immigration as a Labour MarketStrategy: European and North American Perspectives.Canada.” In Immigration as a Labour Market Strategy:
Hugo, G. 1990. “The Adaptation of Asian Migrants toAustralia.” Paper presented at the United Nations ExpertGroup Meeting on International Migration Policies andthe Status of Female Migrants, March 27-30, SanMiniato, Italy.
Human Resources and Social Development Canada(HRSDC). 2005. Report on Labour Market Requests bySkill Level and Most Requested NOCs. Ottawa: HRSDC.
_____. 2006. Report on Labour Market Requests by SkillLevel and Most Requested NOCs. Ottawa: HRSDC.
Institute of Higher Education, Shanghai Jiao TongUniversity. 2006. “Top 100 Asia Pacific Universities.”Accessed March 27, 2008. http://ed.sjtu.edu.cn/rank/2006/ARWU2005_TopAsia.htm
_____. 2006. “Top 100 Asia Pacific Universities.” AccessedMarch 27, 2008. http://ed.sjtu.edu.cn/rank/2005/ARWU2006_TopAsia.htm
Kustec, S., E. Thompson, and X. Li. 2007. “ForeignCredentials: The Tools for Research.” In “ForeignCredential Recognition and Assessment,” ed. L.Hawthorne, special issue, Canadian Issues/Thèmescanadiens (spring): 26-30.
Lee, S. 1996. “Issues in Research on Women, InternationalMigration and Labor.” Asian and Pacific MigrationJournal 5 (1): 5-26.
Lemay, M. 2007. “From Consideration to Integration:Canadian Engineering and International EngineeringGraduates.” In “Foreign Credential Recognition andAssessment,” ed. L. Hawthorne, special issue, CanadianIssues/Thèmes canadiens (spring): 81-4.
Lim, L., and N. Oishi. 1996. “International Labor Migrationof Asian Women: Distinctive Characteristics and PolicyConcerns.” In Asian Women in Migration, edited by G.Battistella and A. Paganoni. Quezon City, Philippines:Scalabrini Migration Center.
Mamann, G. 2007. “Skilled Workers Lose Big.” Metro[Toronto], November 5.
McDonald, P., S.E. Khoo, and G. Hugo, 2005. TemporarySkilled Migrants’ Employment and Resident Outcomes.Canberra: Department of Immigration and Citizenship.
Migration Policy Institute. 2006. “Bipartisan Panel Calls for‘New Chapter’ in U.S. Immigration Policy: Current ImpasseHighlights Need for Forward-Looking Policies.” Pressrelease, September 20. Washington, DC: Independent TaskForce on Immigration and America’s Future. AccessedMarch 28, 2008. http://www.migration policy.org/ITFI-AF/news_ 092006.php
Miller, C. 2005. “240 Part Harmony and a CulturalKaleidoscope We Can All Call Home.” Sunday Age[Melbourne], July 24.
O’Neil, P. 2007. “Vancouver Sees Population Soar.” NationalPost, March 14.
Organisation for Economic Co-operation and Development(OECD). 2006. International Migration Outlook, SOPE-MI 2006. Paris: OECD.
_____. 2007. “Migration Policies and Recognition ofForeign Qualifications for Health Professionals.”International Migration Outlook, SOPEMI 2007. Paris:OECD.

European and North American Perspectives, edited by J.Niessen and Y. Schibel. Brussels: Migration Policy Group.
_____. 2004. Immigrant Source Country EducationalQuality and Canadian Labour Market Outcomes.Analytical Studies Branch Research Paper Series cat.no. 11F0019MIE, no. 234. Ottawa: Statistics Canada.Accessed April 4, 2008. http://www.statcan.ca/english/research/11F0019MIE/11F0019MIE2004234.pdf
Sweetman, A., and S. McBride. 2004. Postsecondary Fieldof Study and the Canadian Labour Market Outcomes ofImmigrants and Non-immigrants. Analytical StudiesBranch Research Paper Series cat. no. 11F0019MIE, no.223. Ottawa: Statistics Canada. Accessed April 4, 2008.http://www.statcan.ca/english/research/11F0019MIE/11F0019MIE2004233.pdf
Thompson, E., and C. Worswick. 2004. Canadian Researchon Immigration and the Labour Market: An Overview,July 21. Ottawa: Human Resources and SocialDevelopment Canada.
Times Higher Education. 2005. The World’s Top 200Universities. Accessed April 3, 2008.http://www.timeshighereducation.co.uk/hybrid.asp?typeCode=175
_____. 2006. The World’s Top 200 Universities. AccessedApril 3, 2008. http://www.timeshighereducation.co.uk/shybrid.asp?typeCode=161
Watty, K. 2007. “Quality in Accounting Education and LowEnglish Language Standards among Overseas Students:Is There a Link?” People and Place 15 (1).
Weeks, C., and M. Leong. 2007. “Census Shows PopulationBoom around Cities.” National Post, March 14.
Wooden, M. 1994. “The Labour Market Experience ofImmigrants.” In Australian Immigration: A Survey ofthe Issues, edited by M. Wooden, R. Holton, G. Hugo,and J. Sloan. Canberra: Australian GovernmentPublishing Service.
Yeoh, B., and L. Khoo. 1998. “Home, Work and Community:Skilled International Migration and Expatriate Womenin Singapore.” International Migration QuarterlyReview 36 (2): 159-85.
Zlotnik, H. 1995. “Migration and the Family: The FemalePerspective.” Asian and Pacific Migration Journal 4 (2-3): 253-71.
47
Th
e Im
pa
ct of E
con
om
ic Se
lectio
n P
olicy
on
La
bo
ur M
ark
et O
utco
me
s for D
eg
ree
-Q
ua
lified
Mig
ran
ts in C
an
ad
a a
nd
Au
stralia
, by
Le
sley
an
ne
Ha
wth
orn
e


49
À l’inverse, l’Australie, depuis 1999, a exclu les immi-grants économiques qui auraient eu peu de chances de trou-ver un travail correspondant à leurs qualifications. En sebasant sur des résultats de recherche, elle a étendu les tests deconnaissances linguistiques, augmenté les exigences relativesaux titres de compétences et accordé des points de bonifica-tion aux professions en forte demande. La sélection fondéesur le capital humain avait révélé ses lacunes en retenant desdemandeurs principaux dépourvus des aptitudes recherchéespar les employeurs. Depuis, les anciens étudiants interna-tionaux participent massivement au nouveau programme(52 p. 100 en 2005). En principe, ils ont financé leurs effortspour satisfaire les employeurs australiens : jeunes et accul-turés, ils possèdent une solide connaissance de l’anglais etdes titres de compétences pleinement reconnus.
Dans quelle mesure ces nouveaux critères ont-ils amélioréla situation d’emploi en Australie par rapport au Canada, carmême si les gouvernements élaborent les politiques d’immi-gration, ce sont les employeurs qui ont le pouvoir d’offrir oude refuser du travail ? Les données disponibles révèlent que,depuis 10 ans, les immigrants économiques diplômés ont net-tement mieux réussi en Australie. Ils sont plus nombreux àtrouver rapidement du travail, à occuper des emplois profes-sionnels ou de direction, à toucher des salaires élevés et tirerprofit de leurs titres de compétences. Dans la foulée, un nom-bre record d’immigrants économiques ont évité les déplace-ments et la surqualification. Ces changements n’ont ni entravéni perturbé les flux migratoires, le nombre d’immigrantséconomiques ayant augmenté de 77 800 en 2004-2005 à102 500 en 2007-2008. On a aussi maintenu la diversité eth-nique et raciale. Surtout, la situation d’emploi des immigrantstraditionnellement désavantagés, y compris ceux d’Europe del’Est, de l’Inde, des Philippines et de la Chine, s’est grande-ment améliorée. Et tout indique que cette réussite austra-lienne est le fruit de l’intervention politique.
Au Canada, d’importantes initiatives sont en cours en vued’améliorer la reconnaissance des titres de compétences, latransition vers l’immigration économique des anciens étu-diants internationaux et des travailleurs temporaires, et depermettre l’expansion du Programme des candidats desprovinces. Des investissements majeurs sont également con-sentis à l’élimination des obstacles rencontrés par les immi-grants qualifiés, y compris en matière de cours de langues etde formation d’appoint. Autant de mesures éclairées à l’heureoù de nombreux immigrants qualifiés risquent davantageque les cohortes précédentes de vivre de faibles revenus.L’enjeu de l’immigration économique restera donc très élevédans l’actuelle économie du savoir, pour les premiersintéressés comme pour l’ensemble du pays.
L e Canada et l’Australie sont des références mondialesen matière de développement national soutenu pardes programmes d’immigration économique, fami-
liale et humanitaire planifiés et administrés par l’État. En2005, l’Australie comptait la plus forte proportion aumonde de citoyens nés à l’étranger (24,6 p. 100 de la po-pulation), devant le Canada (19,2 p. 100) et les États-Unis(11,7 p. 100). Depuis 10 ans, les deux pays privilégient lerecrutement d’immigrants qualifiés (environ 60 p. 100 desimmigrants, dont une grande majorité sont diplômés). Dès2001, cette stratégie avait transformé des secteurs clés(ingénierie, technologies de l’information, architecture/bâtiment), où les immigrants représentaient environ lamoitié des travailleurs qualifiés. Vu l’ampleur duphénomène et la demande internationale de travailleursqualifiés, la situation d’emploi des immigrantséconomiques est devenue un enjeu politique majeur.
Cette étude poursuit deux objectifs. Premièrement,analyser et comparer les taux d’intégration au marché dutravail des nouveaux immigrants diplômés de toutes caté-gories dans leurs cinq premières années au Canada et enAustralie. Selon les recensements de 2001, les deux paysaffichent sur ce plan un bilan presque identique. Parmi cesimmigrants arrivés au Canada et en Australie de 1996 à2001, respectivement 65 et 66 p. 100 avaient trouvé unemploi en 2001 (un emploi professionnel pour 30 et31 p. 100 d’entre eux). Leur pays d’origine, leur âge, leursexe et la demande par secteur ont eu une incidence déci-sive. Au Canada par exemple, ce sont les immigrants del’Afrique du Sud, de l’Australie, de la Nouvelle-Zélande, duRoyaume-Uni, de l’Irlande, de l’Europe du Nord-Ouest etdes États-Unis qui étaient les plus susceptibles d’avoirtrouvé un emploi professionnel (tout comme en Australie).Cette probabilité de succès était beaucoup moindre pourles immigrants provenant d’ailleurs. Plusieurs nouveauxarrivants des Philippines, de l’Inde, du Vietnam et d’autrespays d’Asie du Sud et centrale n’avaient trouvé que desemplois peu spécialisés. Un problème réel vu l’importancede ces groupes parmi la nouvelle immigrationéconomique.
L’étude vise ensuite à évaluer la situation d’emploi desimmigrants économiques à la lumière du cycleéconomique semblable des deux pays. Or depuis quelquesdécennies, d’importants écarts sont apparus entre lesdeux systèmes de sélection. Le Canada a maintenu unmodèle fondé sur le capital humain et accepté desdemandeurs principaux aux aptitudes linguistiques limi-tées et aux qualifications et titres de compétences nonreconnus dans des secteurs à faible demande.
RésuméThe Impact of Economic Selection Policyon Labour Market Outcomes for Degree-
Qualified Migrants in Canada and Australiaby Lesleyanne Hawthorne
50
a clear Canadian employer preference for temporary foreignworkers from the USA, France, Australia and the UK.
Since 1999, Australia, in contrast, has used research evi-dence to exclude economic category applicants at risk ofpoor employment outcomes at point of entry, by consider-ably expanding pre-migration English language testing andmandatory credential assessment, and awarding bonuspoints for high-demand occupations. In Australia’s experi-ence the human capital model of selection had provenflawed — delivering principal applicants lacking the attrib-utes employers sought. Since then former international stu-dents have become important participants in the program(52 percent by 2005). In theory, such students have financedtheir own efforts to meet domestic employers’ demand: theyare young and acculturated, and they have advancedEnglish language ability and fully recognized credentials.
To what extent have Australia’s revised selection crite-ria transformed employment outcomes relative toCanada’s, in a context where governments frame migra-tion policy but employers retain the power to offer orwithhold work? Based on analysis of available longitudi-nal data, the author finds degree-qualified economicmigrants have performed indisputably better in Australiathan in Canada in the past decade. Far greater proportionsof newcomers in Australia secure positions fast, achieveprofessional or managerial status, earn high salaries anduse their professional credentials in work. In the process,unprecedented numbers of economic migrants haveavoided labour market displacement and overqualifica-tion. These policy changes have not discouraged or dis-torted migration flows — the number of economicmigrants increased from 77,800 in 2004-05 to 102,500 in2007-08. Racial and ethnic diversity has been maintained.Most importantly, employment outcomes have dramatical-ly improved for traditionally disadvantaged groups —including economic migrants from Eastern Europe, India,the Philippines and China — as a result of more effectivescreening. The Australian experience suggests such out-comes are highly amenable to policy intervention.
Important Canadian policy initiatives are now underwayto improve foreign credential recognition, the transition offormer international students and temporary workers toeconomic migration, and to expand the ProvincialNominee Program. Major sums are being invested toaddress labour market barriers for skilled migrants, includ-ing language and bridging courses. These are timely initia-tives, given that many skilled migrants are more likelynow to face chronic low income and poverty than did pre-vious cohorts. In the knowledge economy, the stakes arehigh, both for economic migrants and for the nation.
C anada and Australia are global exemplars of nation-building through government planned and adminis-tered economic, family and humanitarian migration
programs. By 2005 Australia had the world’s highest propor-tion of foreign born (24.6 percent of the population), fol-lowed by Canada at 19.2 percent and the US at 11.7 percent.Over the past decade both countries have placed extraordi-nary emphasis on recruiting skilled migrants (around 60percent of total number, with the great majority holdingdegrees). By 2001 this strategy was transforming select pro-fessional fields, with migrants representing approximatelyhalf of all degree-qualified workers in engineering, informa-tion technology, and architecture/building. Given the scaleof these arrivals, plus unprecedented global competition forskilled workers, the employment outcomes for economiccategory migrants has become a major policy issue.
The current study has two aims. First, it seeks to examineand compare labour market integration rates in the first fiveyears of arrival for all categories of recently arrived degree-qualified migrants in Canada and Australia. Analysis of 2001Census data finds the two countries to be near identical. By2001, 65 percent of degree-qualified 1996-2001 migrants hadsecured work in Canada, compared to 66 percent in Australia.And 30 percent had found professional positions in Canada,compared to 31 percent in Australia. Migrant source coun-try, labour market demand by field, age and gender power-fully influenced such employment outcomes in bothcountries. For example, recent Canadian immigrants fromSouth Africa, Australia and New Zealand, UK/Ireland,Northwestern Europe, and the US were the most likely tohave secured professional work. A near identical patternprevailed in Australia. In both countries, the chances ofsecuring professional work dropped markedly for otherbirthplace groups. Large numbers of degree-qualifiedmigrants from the Philippines, India, Vietnam and otherSouth/Central Asia had found only low-skilled work — asignificant policy issue given the prominence of thesegroups among recent economic arrivals.
The second aim of the study is to assess economicmigrants’ labour market outcomes in Canada and Australia,in the context of similar economic cycles. In recent decades,major policy differences have emerged between Canada andAustralia in terms of points-based selection. Canada hasmaintained a human capital model of selection — its eco-nomic program admitting principal applicants with limitedhost-country language ability, nonrecognized credentialsand qualifications in fields that have weak labour marketdemand. By 2006, China, the Philippines, India, Pakistanand Korea were the primary economic category sourcecountries, despite major potential labour market barriers and
SummaryThe Impact of Economic Selection Policyon Labour Market Outcomes for Degree-
Qualified Migrants in Canada and Australiaby Lesleyanne Hawthorne