Embed Size (px)
Citation preview

8/3/2019 Iron Losses Sohail Thesis KLAR 230408
http://slidepdf.com/reader/full/iron-losses-sohail-thesis-klar-230408 1/70
!
!
"#$%#&'"$(&
()*+,--.
0

8/3/2019 Iron Losses Sohail Thesis KLAR 230408
http://slidepdf.com/reader/full/iron-losses-sohail-thesis-klar-230408 2/70
Master Thesis
Doc. Title: Revision Page
Effect of harmonics on iron losses 01 2/70
8/3/2019 Iron Losses Sohail Thesis KLAR 230408
http://slidepdf.com/reader/full/iron-losses-sohail-thesis-klar-230408 3/70
Master Thesis
Doc. Title: Revision Page
Effect of harmonics on iron losses 01 3/70
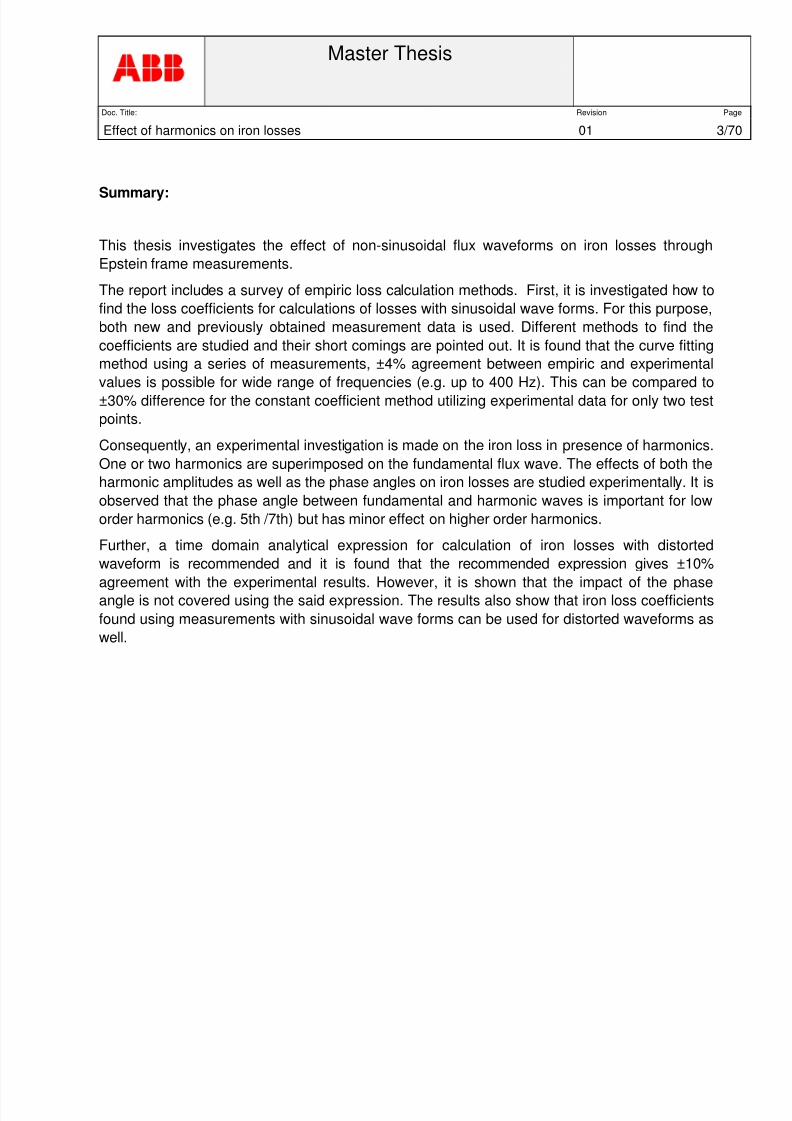
Summary:
This thesis investigates the effect of non-sinusoidal flux waveforms on iron losses through
Epstein frame measurements.
The report includes a survey of empiric loss calculation methods. First, it is investigated how to
find the loss coefficients for calculations of losses with sinusoidal wave forms. For this purpose,
both new and previously obtained measurement data is used. Different methods to find the
coefficients are studied and their short comings are pointed out. It is found that the curve fitting
method using a series of measurements, ±4% agreement between empiric and experimental
values is possible for wide range of frequencies (e.g. up to 400 Hz). This can be compared to
±30% difference for the constant coefficient method utilizing experimental data for only two test
points.
Consequently, an experimental investigation is made on the iron loss in presence of harmonics.
One or two harmonics are superimposed on the fundamental flux wave. The effects of both the
harmonic amplitudes as well as the phase angles on iron losses are studied experimentally. It is
observed that the phase angle between fundamental and harmonic waves is important for low
order harmonics (e.g. 5th /7th) but has minor effect on higher order harmonics.
Further, a time domain analytical expression for calculation of iron losses with distorted
waveform is recommended and it is found that the recommended expression gives ±10%
agreement with the experimental results. However, it is shown that the impact of the phaseangle is not covered using the said expression. The results also show that iron loss coefficients
found using measurements with sinusoidal wave forms can be used for distorted waveforms as
well.
8/3/2019 Iron Losses Sohail Thesis KLAR 230408
http://slidepdf.com/reader/full/iron-losses-sohail-thesis-klar-230408 4/70
Master Thesis
Doc. Title: Revision Page
Effect of harmonics on iron losses 01 4/70
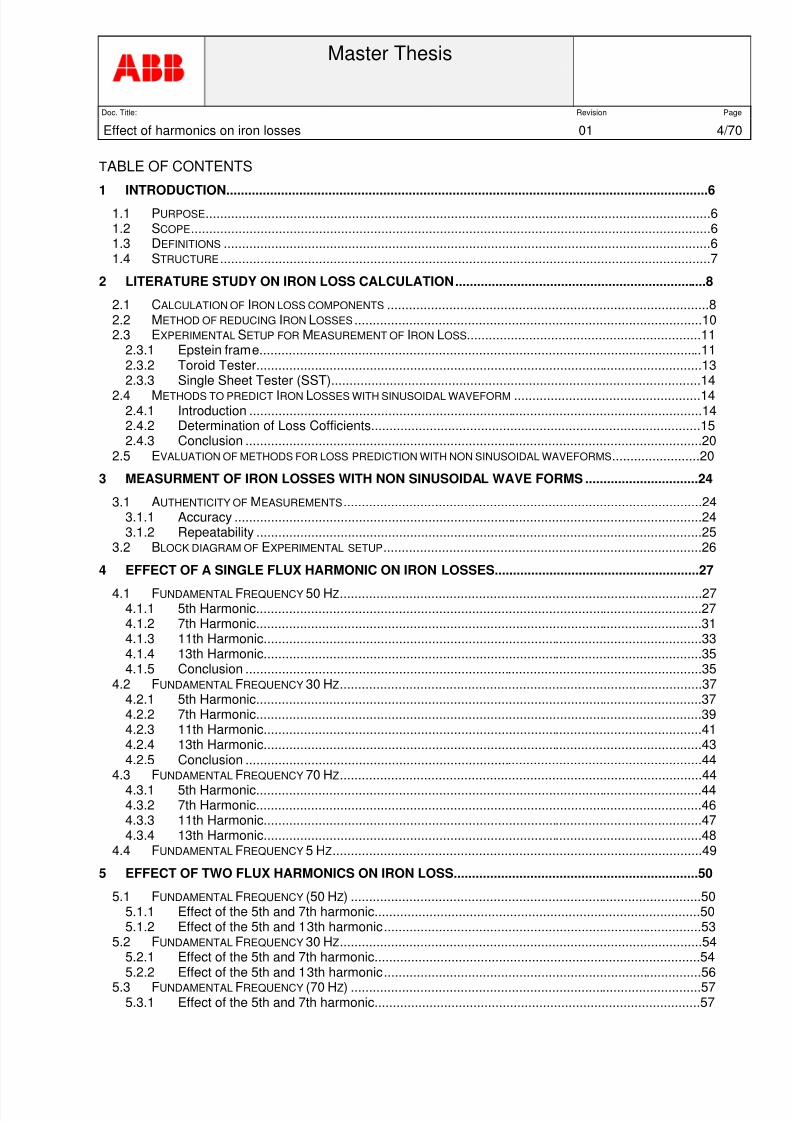
TABLE OF CONTENTS
1 INTRODUCTION....................................................................................................................................6 1.1 PURPOSE..........................................................................................................................................6 1.2 SCOPE..............................................................................................................................................6 1.3 DEFINITIONS .....................................................................................................................................6 1.4 STRUCTURE ......................................................................................................................................7
2 LITERATURE STUDY ON IRON LOSS CALCULATION.....................................................................8
2.1 CALCULATION OF IRON LOSS COMPONENTS ........................................................................................8 2.2 METHOD OF REDUCING IRON LOSSES ...............................................................................................10 2.3 EXPERIMENTAL SETUP FOR MEASUREMENT OF IRON LOSS................................................................11
2.3.1 Epstein frame.........................................................................................................................11 2.3.2 Toroid Tester..........................................................................................................................13 2.3.3 Single Sheet Tester (SST).....................................................................................................14
2.4 METHODS TO PREDICT IRON LOSSES WITH SINUSOIDAL WAVEFORM ...................................................14 2.4.1 Introduction ............................................................................................................................14 2.4.2 Determination of Loss Cofficients..........................................................................................15 2.4.3 Conclusion .............................................................................................................................20
2.5 EVALUATION OF METHODS FOR LOSS PREDICTION WITH NON SINUSOIDAL WAVEFORMS........................20
3 MEASURMENT OF IRON LOSSES WITH NON SINUSOIDAL WAVE FORMS ...............................24
3.1 AUTHENTICITY OF MEASUREMENTS..................................................................................................24 3.1.1 Accuracy ................................................................................................................................24 3.1.2 Repeatability ..........................................................................................................................25
3.2 BLOCK DIAGRAM OF EXPERIMENTAL SETUP.......................................................................................26
4 EFFECT OF A SINGLE FLUX HARMONIC ON IRON LOSSES........................................................27
4.1 FUNDAMENTAL FREQUENCY 50 HZ...................................................................................................27 4.1.1 5th Harmonic..........................................................................................................................27 4.1.2 7th Harmonic..........................................................................................................................31 4.1.3 11th Harmonic........................................................................................................................33 4.1.4 13th Harmonic........................................................................................................................35 4.1.5 Conclusion .............................................................................................................................35
4.2 FUNDAMENTAL FREQUENCY 30 HZ...................................................................................................37 4.2.1 5th Harmonic..........................................................................................................................37 4.2.2 7th Harmonic..........................................................................................................................39 4.2.3 11th Harmonic........................................................................................................................41 4.2.4 13th Harmonic........................................................................................................................43 4.2.5 Conclusion .............................................................................................................................44
4.3 FUNDAMENTAL FREQUENCY 70 HZ...................................................................................................44 4.3.1 5th Harmonic..........................................................................................................................44 4.3.2 7th Harmonic..........................................................................................................................46 4.3.3 11th Harmonic........................................................................................................................47 4.3.4 13th Harmonic........................................................................................................................48
4.4 FUNDAMENTAL FREQUENCY 5 HZ.....................................................................................................49
5 EFFECT OF TWO FLUX HARMONICS ON IRON LOSS...................................................................50
5.1 FUNDAMENTAL FREQUENCY (50 HZ) ................................................................................................50 5.1.1 Effect of the 5th and 7th harmonic.........................................................................................50 5.1.2 Effect of the 5th and 13th harmonic.......................................................................................53
5.2 FUNDAMENTAL FREQUENCY 30 HZ...................................................................................................54 5.2.1 Effect of the 5th and 7th harmonic.........................................................................................54
5.2.2 Effect of the 5th and 13th harmonic.......................................................................................56 5.3 FUNDAMENTAL FREQUENCY (70 HZ) ................................................................................................57 5.3.1 Effect of the 5th and 7th harmonic.........................................................................................57
8/3/2019 Iron Losses Sohail Thesis KLAR 230408
http://slidepdf.com/reader/full/iron-losses-sohail-thesis-klar-230408 5/70
Master Thesis
Doc. Title: Revision Page
Effect of harmonics on iron losses 01 5/70
5.3.2 Effect of the 5th and 13th harmonic.......................................................................................59 5.4 CONCLUSION ..................................................................................................................................60
6 CONCLUSIONS...................................................................................................................................62
7 FUTURE WORK ..................................................................................................................................64
8 REFERENCES.....................................................................................................................................65
9 ENCLOSURES ....................................................................................................................................67
9.1 APPENDIX – 1..................................................................................................................................67 9.2 APPENDIX – 2..................................................................................................................................68 9.3 APPENDIX – 3..................................................................................................................................69 9.4 APPENDIX – 4..................................................................................................................................70
8/3/2019 Iron Losses Sohail Thesis KLAR 230408
http://slidepdf.com/reader/full/iron-losses-sohail-thesis-klar-230408 6/70
Master Thesis
Doc. Title: Revision Page
Effect of harmonics on iron losses 01 6/70
1 INTRODUCTION
1.1 Purpose
Nowadays, variable speed drives are becoming more and more popular. Variable speed is
achieved by use of an inverter. Inverter fed drives experience more iron loss as compared to
directly connected ones. The increase in iron loss is a result of the harmonics introduced by the
inverter supply and can effect both the lifetime of a machine and efficiency as well. Therefore, it
becomes important to have a fair idea about the effect of iron loss. The suggested thesis work
deals with quantifying the iron loss due to harmonics. The effect of different harmonic amplitude
and effect of phase difference is also studied.
1.2 Scope
This report aims to quantify the increase in iron loss due to introducntion of different time
harmonics in the fundamental alternating flux wave. The effect of amplitude and phase angle
due to presence of one as well two harmonics are studied. The results described in this report
are based upon the experiments made both at Surahammar Bruks AB and KTH. It is to be
noted that this report does not describe the iron loss associated with the rotational flux density.
1.3 Definitions
P hys Hystereses Iron loss component
P classical Classical iron losss component
P excess Excess iron loss compenent
P total Total iron loss
n Hystereses loss exponent
Kh Hystereses loss coefficient
Ka Excess loss coefficient
Ke Classical loss coefficient
f Frequency
Bmax Peak flux density
l Length of test specimen strip
ma Active mass of test specimen
d Thickness
Electrical Conductivity
Ch Hystereses loss correction factor
N1 Total number of primary winding turns
8/3/2019 Iron Losses Sohail Thesis KLAR 230408
http://slidepdf.com/reader/full/iron-losses-sohail-thesis-klar-230408 7/70
Master Thesis
Doc. Title: Revision Page
Effect of harmonics on iron losses 01 7/70
N2 Total number of secondary winding turns
pw Power measured by wattmeter
W Specific iron loss in W/kg
1.4 Structure
This report has the following structure:
Chapter 2 makes an overview of some previous work that were done in order to understand and
predict iron loss with sinusoidal as well as non sinusoial wave forms.
Chapter 3 explains the experimental setup used for measurments for iron loss. Accuracy andrepeatability of the setup is also discussed.
Chapter 4 presents the results obtained from measurments in presence of one harmonic at
different fundamental frequencies. Observation and conclusions are also made on bases of
these measurments.
Chapter 5 investigates the effect of the presence of two harmonics on iron loss.
Chapter 6 presents the conclusion of this thesis work and relates the theory with results made
on basis of the Epstein frame measurments during the thesis work.
Chapter 7 includes some recommendations for the future works.
Chapter 8 Specifies a list of references for source material and further reading.
Chapter 9 Encloses some supplementary information.

8/3/2019 Iron Losses Sohail Thesis KLAR 230408
http://slidepdf.com/reader/full/iron-losses-sohail-thesis-klar-230408 8/70
Master Thesis
Doc. Title: Revision Page
Effect of harmonics on iron losses 01 8/70
2 LITERATURE STUDY ON IRON LOSS CALCULATION
In order to calculate iron loss in electrical machines, it is essential to have the information of
shape or variation of the flux density. Flux density variation can be alternating or rotational [1].
Alternating flux density can further divide in to sinusoidal or non sinusoidal (due to presence of
different harmonics). Depending on the magnitude of the harmonic; non sinusoidal flux density
may or may not cause minor loops in the BH loop. On the other hand, rotational distribution of
the flux density can also be subdivided in to circular and elliptical (in the case of orthogonal flux
density components sinusoidally varying in time with different amplitudes). This can yet be
distorted (almost any shape), as happens in the case when alternating distribution in one of the
directions is non- sinusoidal. In the case of the alternating flux, there is a quite well known
theory, which is generally accepted and essentially based on the works of Bertotti, Fiorillo and
Novikov [1]. As for the rotational loss, the situation is not so clear and the problem of measuringand calculating the rotational loss has not yet been completely resolved [1]. In the following part;
iron loss calculation due to alternating flux density (sinusoidal and non-sinusoidal) will be
discussed.
2.1 Calculation of Iron loss components
2.1.1 Iron loss calculation with sinusoidal wave forms
Traditionally iron loss had been divided up in to two components, hysteresis loss “Phys” and eddycurrent or classical loss “Pclassical”. Therefore iron loss was expressed by (2.1). A brief description
of each part is given below.
classicalhysTotal PPP += 2.1
i) Hysteresis loss
The energy required to move the magnetic domain walls in the core magnetization is calledhysteresis loss. The hysteresis loss can be calculated using the empirical Steinmetz formula
B f k Pn
hhys max
=2.2
Where “K h ” and “n” are coefficients depending upon the magnetic material used, “f” is thefrequency and “B max ” is the peak flux density.
ii) Classical loss
Classical losses are caused by circulating currents in the core induced by flux variation. It canbe calculated as
6
2max
222 B f d
P classical
σ π =
2.3
The equation 2.3 is valid only when flux penetrates in material completely; In other words, thelamination thickness must be smaller than the skin depth.
8/3/2019 Iron Losses Sohail Thesis KLAR 230408
http://slidepdf.com/reader/full/iron-losses-sohail-thesis-klar-230408 9/70
Master Thesis
Doc. Title: Revision Page
Effect of harmonics on iron losses 01 9/70
f
µπ
ρ <d 2.4
Where “ ” is the electrical conductivity, “d” is the thickness and “ ” is the resistivity of thelamination.
However, equation (2.1) has some limitations as some papers describes that it is onlyapplicable under the assumption that the maximum magnetic flux density of 1.0 T is notexceeded and the Hysteresis loop is under the static situation [17]. When P hys and P classical areadded together, the sum is always less than the measured total loss, the difference beingreferred to as the anomalous or excess loss. The excess loss accounts for 20 % or more of thetotal loss in electrical steels. In other materials it can comprise 90 % of the loss [3]. The excess
loss can be described as below.
iii) Excess loss
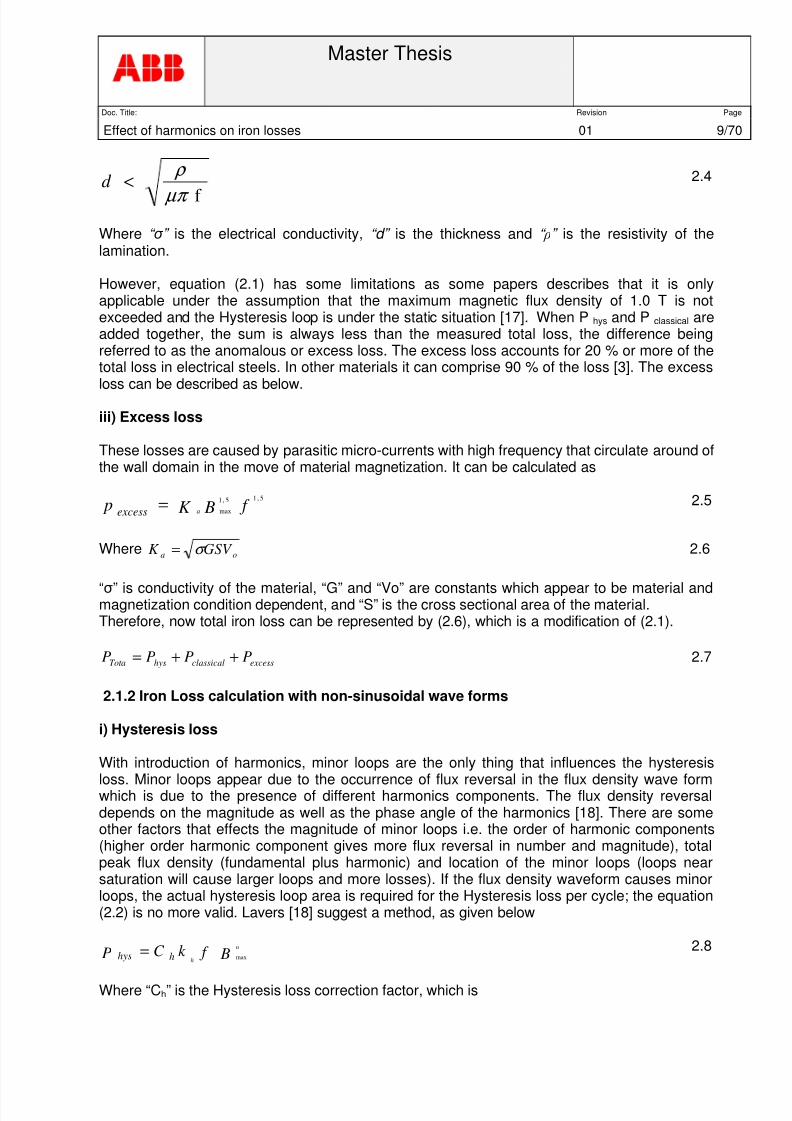
These losses are caused by parasitic micro-currents with high frequency that circulate around ofthe wall domain in the move of material magnetization. It can be calculated as
f BK p aexcess
5,15,1
max= 2.5
Whereoa GSV K σ = 2.6
“” is conductivity of the material, “G” and “Vo” are constants which appear to be material andmagnetization condition dependent, and “S” is the cross sectional area of the material.Therefore, now total iron loss can be represented by (2.6), which is a modification of (2.1).
excessclassicalhysTotaPPPP ++= 2.7
2.1.2 Iron Loss calculation with non-sinusoidal wave forms
i) Hysteresis loss
With introduction of harmonics, minor loops are the only thing that influences the hysteresis
loss. Minor loops appear due to the occurrence of flux reversal in the flux density wave formwhich is due to the presence of different harmonics components. The flux density reversaldepends on the magnitude as well as the phase angle of the harmonics [18]. There are someother factors that effects the magnitude of minor loops i.e. the order of harmonic components(higher order harmonic component gives more flux reversal in number and magnitude), totalpeak flux density (fundamental plus harmonic) and location of the minor loops (loops nearsaturation will cause larger loops and more losses). If the flux density waveform causes minorloops, the actual hysteresis loop area is required for the Hysteresis loss per cycle; the equation(2.2) is no more valid. Lavers [18] suggest a method, as given below
B f k C Pn
hhhys max=
2.8
Where “Ch” is the Hysteresis loss correction factor, which is
8/3/2019 Iron Losses Sohail Thesis KLAR 230408
http://slidepdf.com/reader/full/iron-losses-sohail-thesis-klar-230408 10/70
Master Thesis
Doc. Title: Revision Page
Effect of harmonics on iron losses 01 10/70
=+=
N
i
ih db B
k C
1max1 2.9
Where “k” varies between 0.6 and 0.7 and dbi, i = 1,2,…, n, represents the flux reversals of theflux density waveforms (the change in the flux density during the excursion around a minorloop). If the minor loops do not occur, the hysteresis loss does not depend on the flux densitywaveform and is only related to the peak value of flux density. In that case equation (2.2) is stillvalid.
ii) Classical loss
The expression for calculation of iron loss for non-sinusoidal flux can be represented as
∞
=
=
0
22
222
6 nnclassical Bn
f d P
σ π 2.10
where “Bn” are the harmonic flux densities.
iii) Excess loss
Similarly, the expression for under non-sinusoidal flux can be represented as
dt dt
dB
T p
T
excess =
0
5,11
2.11
2.2 Method of reducing Iron Losses
Following are some methods used to reduce iron losses:
a) Lamination: The core is built up by thin lamination sheets piled on each other and insulated
from each other. This has an effect of reducing eddy currents.
b) Alloying: Iron is a good conductor and it is found that the addition of alloying elements
increase the electrical resistivity of iron which could help in reducing eddy current intensity. This
is normally done by adding silicon contents. A drawback of this method is that the introduction
of silicon makes iron brittle and difficult to roll and form.
c) Purification (and annealing): In a soft magnetic material the domains need to be able to alter
their disposition rapidly and easily according to overall magnetization of the metal. Things that
can hold up the easy movement of domain walls damage this intention. Any non-metallic
inclusions in the metal impede domain activity, so great efforts are made to purify electrical
steels. Other magnetic in-homogeneties spoil domain activity, such as stressed regions and
dislocations of the crystal lattice. Careful heat treatment (annealing) can remove most of these.
8/3/2019 Iron Losses Sohail Thesis KLAR 230408
http://slidepdf.com/reader/full/iron-losses-sohail-thesis-klar-230408 11/70
Master Thesis
Doc. Title: Revision Page
Effect of harmonics on iron losses 01 11/70
d) Grain Size: Since the boundaries between adjacent crystals amount to magnetic in-
homogeneities, the less grain boundaries there are the better. As a consequence, efforts are
made to end up with grains as large as can be managed as this facilities domain boundary
motion.
2.3 Experimental Setup for Measurement of Iron Loss
2.3.1 Epstein frame
The Epstein frame is the most popular equipment used in industry to measure specific iron loss.
The detailed operating instructions are described in the international standard IEC 404-2.
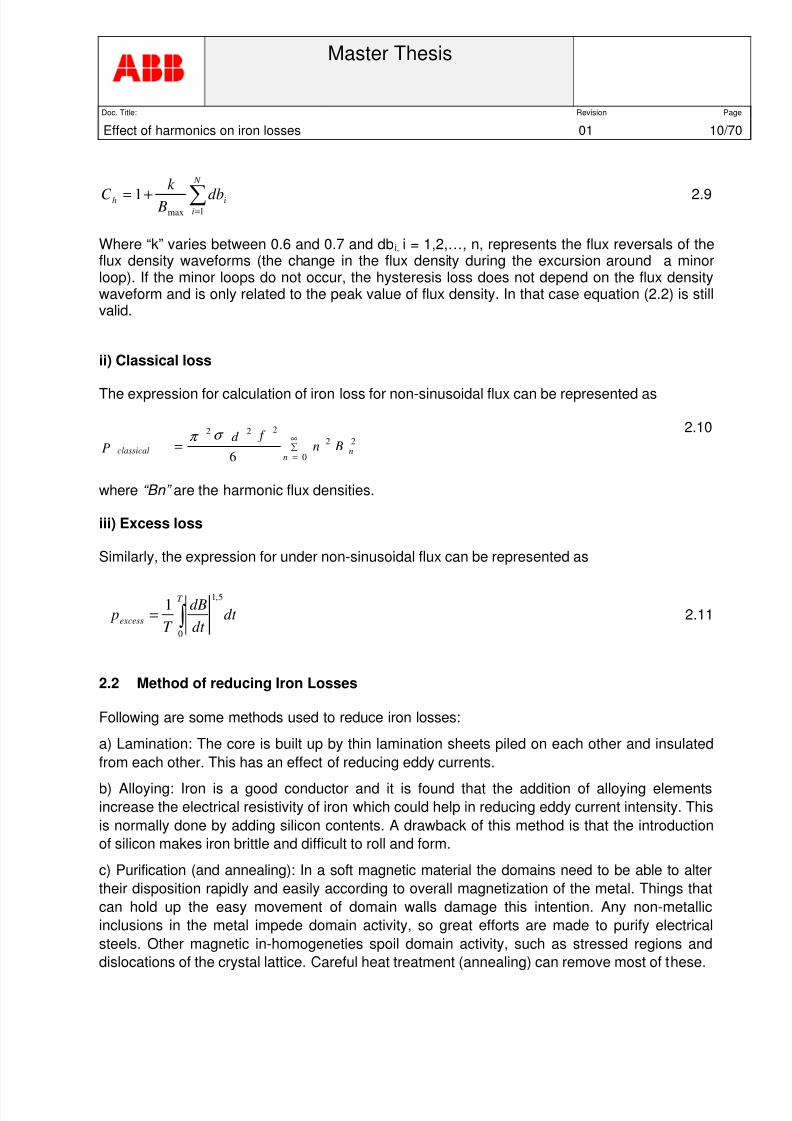
The industrial standard frame is usually a 28 cm x 28 cm frame with four coils each having 700turns both on the primary and the secondary windings [9]. Each side have a primary winding
(magnetising winding) on the outer side and a secondary winding (voltage winding) on the inner
side as shown in Fig. 2.1.
Fig. 2.1 Epstein frame
The investigated steel samples (strips) should be 28 cm long (±2.05 cm) and 3 cm wide and
must be of multiple of 4, with a recommended minimum number of 12 strips. Strips cut across
the rolling direction are loaded on the opposite sides of the frame, while those cut along the
rolling direction are loaded on the opposite sides. The strips are loaded in the Epstein frame
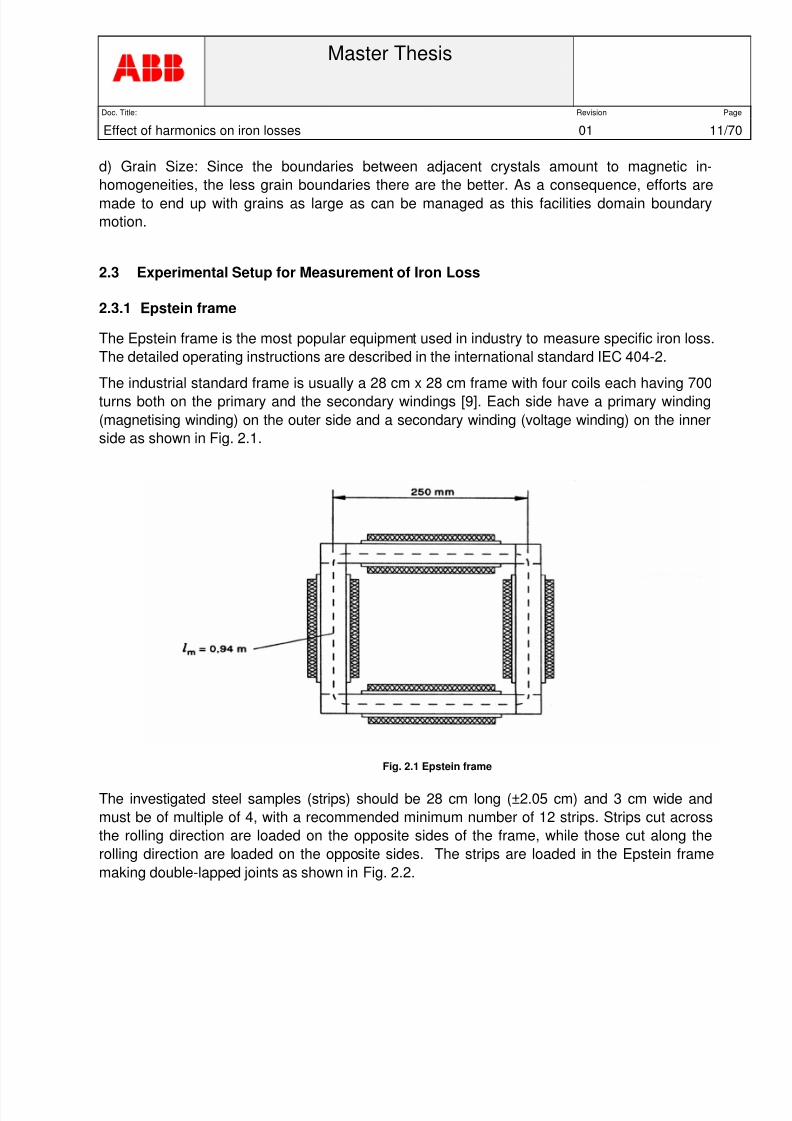
making double-lapped joints as shown in Fig. 2.2.
8/3/2019 Iron Losses Sohail Thesis KLAR 230408
http://slidepdf.com/reader/full/iron-losses-sohail-thesis-klar-230408 12/70
Master Thesis
Doc. Title: Revision Page
Effect of harmonics on iron losses 01 12/70
Fig. 2.2 Test specimen arrangements in the Epstein frame (double-lapped joint)
The total iron-loss of the test specimen, is given by
( )i
mc R
U P
N
N P
2
2
2
111,1
−=
2.12
where N1 and N2 are the total number of turns of the primary and secondary winding, “P m” is
the power measured by the wattmeter, “Ri” is the total resistance of the instruments in the
secondary circuit and 2U is the average value of the rectified voltage induced in the secondary
winding.
The measured specific total loss, W in W/kg is obtained by dividing “Pc” by the weight of the
active mass of the test specimen. Mass of the part of specimen where flux lines are existing is
called the active mass.
m
c
a
c
ml
lP
m
PW
4==
2.13
Where “l” is the length of a test specimen strip, “lm” is the conventional effective magnetic pathlength and m is the total mass of the test specimen.

8/3/2019 Iron Losses Sohail Thesis KLAR 230408
http://slidepdf.com/reader/full/iron-losses-sohail-thesis-klar-230408 13/70
Master Thesis
Doc. Title: Revision Page
Effect of harmonics on iron losses 01 13/70
Fig. 2.3 Circuit used to calculate specific loss in the Epstein frame
Some of the shortcomings of this method are that flux density is not uniformly distributed due to
leakage flux around the joints [9]. The corners have been found to cause errors. The magnetic
length (94 cm) is estimated and is not an accurate value. The 3 cm strips width is not wide
enough for cutting stresses not to propagate to the centre of the strips and influence the loss
results. Therefore, the material under test must be annealed to relieve stress before testing,
especially for grain-oriented steel. The preparation and loading of the strips on to the frame is
time consuming [9]. The magnetic flux conditions in the Epstein frame correspond to those
found in power transformers where good correspondence between calculation and
measurements is obtained. However, such correspondence is not observed for inductionmotors, where the error from the Epstein test results can be larger than 50% [11].
The standard Epstein test does not include the effect of the flux harmonics that exist in induction
motors, since sinusoidal excitation at the fundamental frequency is specified [11]. To perform
core loss measurements in electrical steel samples under non-sinusoidal excitation, various test
benches are built based on the Epstein frame [11], [12] and [13].
2.3.2 Toroid Tester
The toroid has primary and secondary windings with excitation applied to the primary and the
induced voltage measured on the secondary. Toroid geometry is more similar to the geometry
of a stator in an electrical machine [14], hence some people prefers toroids over Epstein frames.One of the problems with toroids is the non uniform distribution of flux density.
Fig. 2.4 Geometrical characteristic of the core assembled using two concentric rings
8/3/2019 Iron Losses Sohail Thesis KLAR 230408
http://slidepdf.com/reader/full/iron-losses-sohail-thesis-klar-230408 14/70
Master Thesis
Doc. Title: Revision Page
Effect of harmonics on iron losses 01 14/70
A disadvantage of this tester is that the toroid must be properly wound, which is time consuming
compared to the Epstein frame. The toroidal tester takes longer to prepare and set up for
testing.
2.3.3 Single Sheet Tester (SST)
In some of the research papers it is mentioned that due to a considerable easier sample
preparation and substantial saving of material, the single sheet tester (SST) with yokes is
increasingly replacing the Epstein frame [15] and in the future, SST may become the preferred
method [9]. In another paper [16], the single sheet method is stated to be the most precise and
economic one for magnetization characteristics measurement of the magnetic steel sheets, as
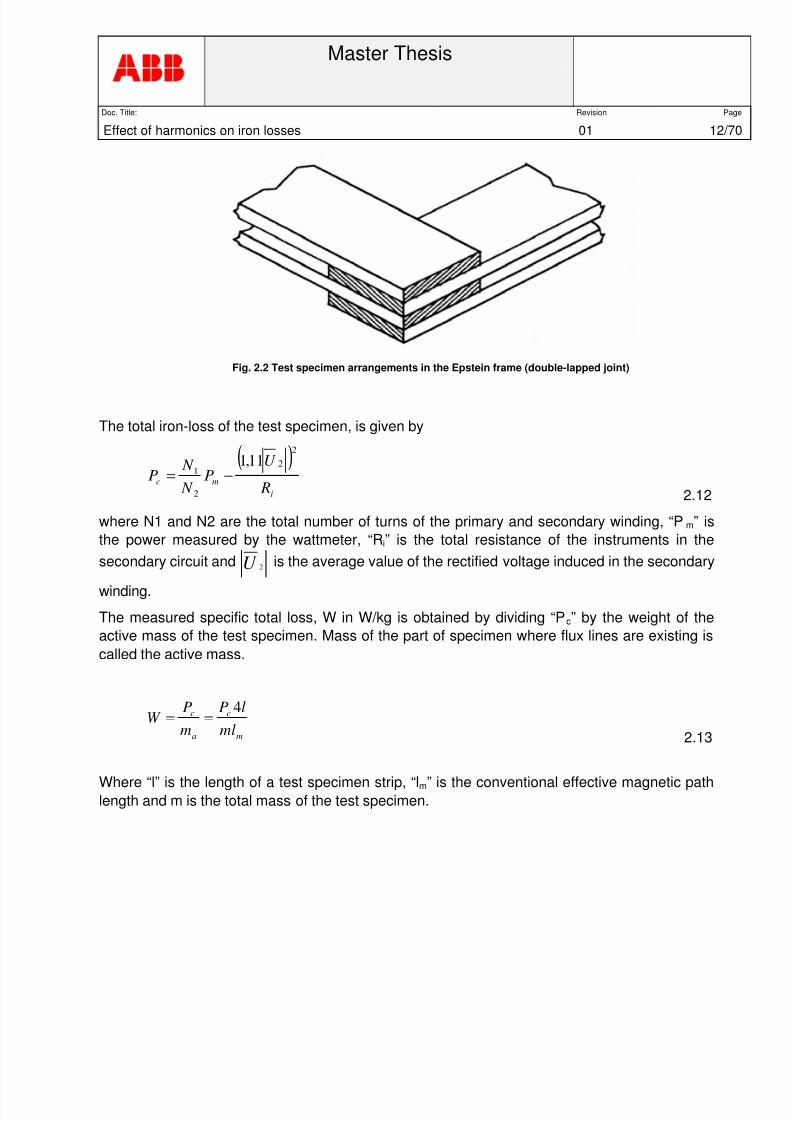
compared to Epstein frame and ring specimen method. A small description for the measurement
principle of SST is given as below, see Fig. 2.5.
Fig. 2.5 Measurement principle of SST
The significant difference between the single sheet method and the conventional method is that
in SST, an H coil is used for the measurements of magnetic field strength [16]. While a separate
B coil is used to measure flux density.
A major drawback of this tester is that it requires calibration with either an Epstein frame or atoroid tester. Moreover, the international standard recommends a double yoke tester which is
heavy, costly and large. Further some pneumatic suspension may be required to place the yoke
on the magnetic sheet to avoid damaging the sheet [9].
2.4 Methods to predict Iron Losses with sinusoidal waveform
2.4.1 Introduction
The modelling of power losses in Ferro-magnetic material has been continuously under study.
As described in section 2.1, Jordan defined the Hysteresis and eddy-current components on
8/3/2019 Iron Losses Sohail Thesis KLAR 230408
http://slidepdf.com/reader/full/iron-losses-sohail-thesis-klar-230408 15/70
Master Thesis
Doc. Title: Revision Page
Effect of harmonics on iron losses 01 15/70
which the analysis of electrical machines is still based [4]. Bertotti proposed a model including
third term excess or anomalous loss [5]; mathematical formulation is given as below.
PPPP excessclasshysTotal++=
2.14
f BK B f d
B f K P a
n
hTotal
5,15,1
max
2
max
222
max737,8
6++=
σ π
2.15
The most difficult part in finding a correct prediction of iron loss is the determination of loss
coefficients. Different researchers have proposed different methods for loss coefficient
calculation. A few of those are explained in the following section.
2.4.2 Determination of Loss Cofficients
Constant coefficient Method
One approach of calculating loss coefficients is calculating the classical loss component by the
formula stated above (2.21) and assuming n = 2. Using experimental values of total specific iron
losses measured from the Epstein frame it is possible to determine the unknown coefficients
(Kh & Ka). Hence two unknown coefficients (Kh and Ka) can be found by two known values of
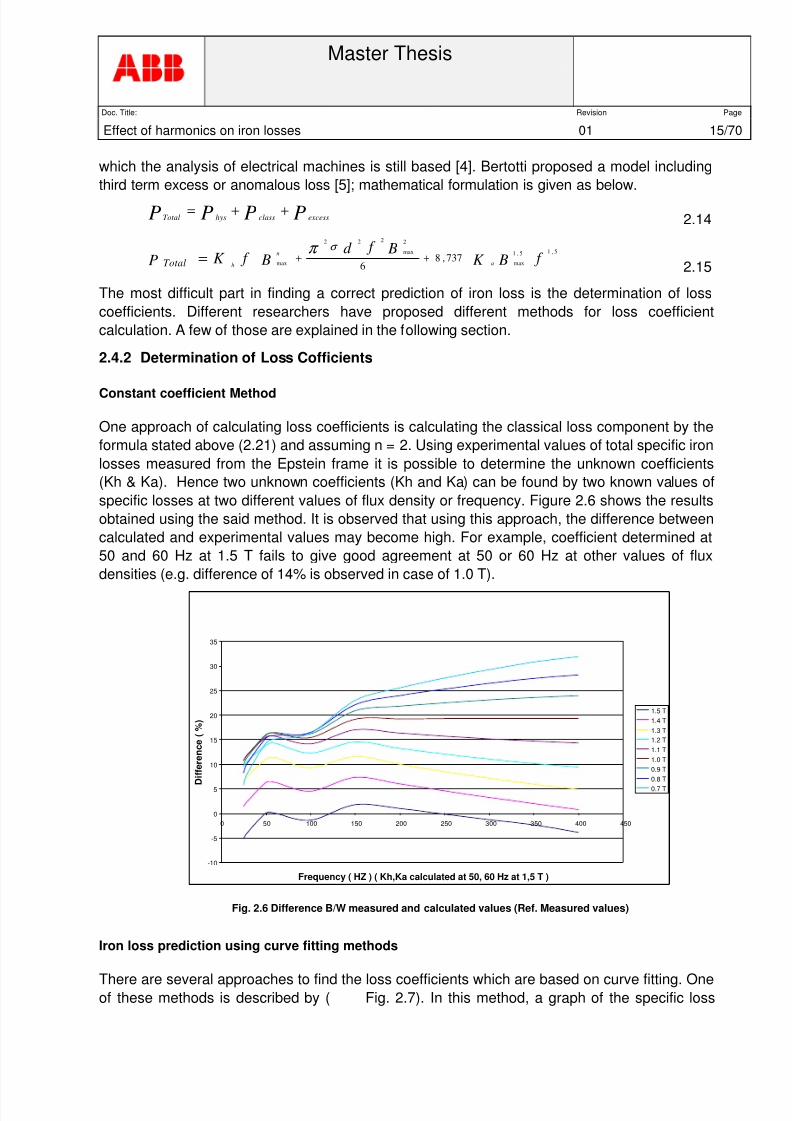
specific losses at two different values of flux density or frequency. Figure 2.6 shows the results
obtained using the said method. It is observed that using this approach, the difference between
calculated and experimental values may become high. For example, coefficient determined at
50 and 60 Hz at 1.5 T fails to give good agreement at 50 or 60 Hz at other values of flux
densities (e.g. difference of 14% is observed in case of 1.0 T).
-10
-5
0
5
10
15
20
25
30
35
0 50 100 150 200 250 300 350 400 450
Frequency ( HZ ) ( Kh,Ka calculated at 50, 60 Hz at 1,5 T )
D
i f f e r e n c e ( % )
1.5 T
1.4 T
1.3 T
1.2 T
1.1 T
1.0 T
0.9 T
0.8 T0.7 T
Fig. 2.6 Difference B/W measured and calculated values (Ref. Measured values)
Iron loss prediction using curve fitting methods
There are several approaches to find the loss coefficients which are based on curve fitting. Oneof these methods is described by ( Fig. 2.7). In this method, a graph of the specific loss

8/3/2019 Iron Losses Sohail Thesis KLAR 230408
http://slidepdf.com/reader/full/iron-losses-sohail-thesis-klar-230408 16/70
Master Thesis
Doc. Title: Revision Page
Effect of harmonics on iron losses 01 16/70
(measured from the Epstein frame) versus frequency at a given value of (B or specific loss
versus B at a given frequency) is plotted. Similarly, a plot of specific losses calculated by using
(2.21) is drawn by assuming some values of kh and ka. Then the relative differences of both
values are observed. The values of kh and ka that gives low relative difference are selected.
0
10
20
30
4050
60
70
80
90
100
0 100 200 300 400 500
Frequency
L o s s e s ( w / k g )
Experimental Values
Analytical Values
Fig. 2.7 Curve fitting Method
There are many other models that claim to give good agreement between calculated andmeasured loss values e.g. [4], [5], [6], [7]. In the following section, the approach discussed in [4]
is studied and implemented for the M400-50A material, together with some suggested changes.
In the first step of the procedure, in order to identify the values of the coefficient, (2.14) is
divided by the frequency, resulting in
( )2
f c f ba f
W ++=
2.16
Where Bk a h= 5.1
Bk b a= 2
Bk c e= 2.17
Using (2.16) and (2.17), values of a, b and c can be calculated using quadratic fitting as shownin Fig. 2.8 .

8/3/2019 Iron Losses Sohail Thesis KLAR 230408
http://slidepdf.com/reader/full/iron-losses-sohail-thesis-klar-230408 17/70
Master Thesis
Doc. Title: Revision Page
Effect of harmonics on iron losses 01 17/70
y = 0,0004x2
+ 0,0013x + 0,0416
0
0,05
0,1
0,15
0,2
0,25
0 5 10 15 20 25
Square root of frequency [Hz]
S p
e c i f i c L o s s p e r F r e q u e n c y [ W / K g / H z ]
0,1 T
0,2 T
0,4 T
0,5 T
0,6 T
0,8 T
1,0 T
1,1 T
1,2 T
1,3 T
1,4 T
1,5 T
Poly. (1,5 T)
Fig. 2.8 Ratio of core loss and frequency w/f, as function of Sqrt (f) according to (2) for 812737 F Steel
During trials, it is observed that a use of five sample points, represented by measurements at
the same induction and different frequencies, is beneficial in improving the overall stability of the
numerical procedure [4],[9]. In this case, measurements at one low frequency of 30 Hz, one
intermediate frequencies of 50, 100 and 250 Hz and one high frequency of 400 Hz are used.
The derivation and use of single ka and ke, as a polynomial function of induction for the entirefrequency range introduces very large errors and hence it is recommended to split the data and
perform fitting separately on three frequency ranges identified as low (up to 400 Hz), medium
(400 to 1000 Hz) and high [9]. The values of the fitting residual for (2.16) were very close to
unity i.e. r2, indicating a very good approximation. From (2.16) and (2.17), the eddy-current
coefficient ke and the excess loss coefficient ka are calculated. These coefficients are
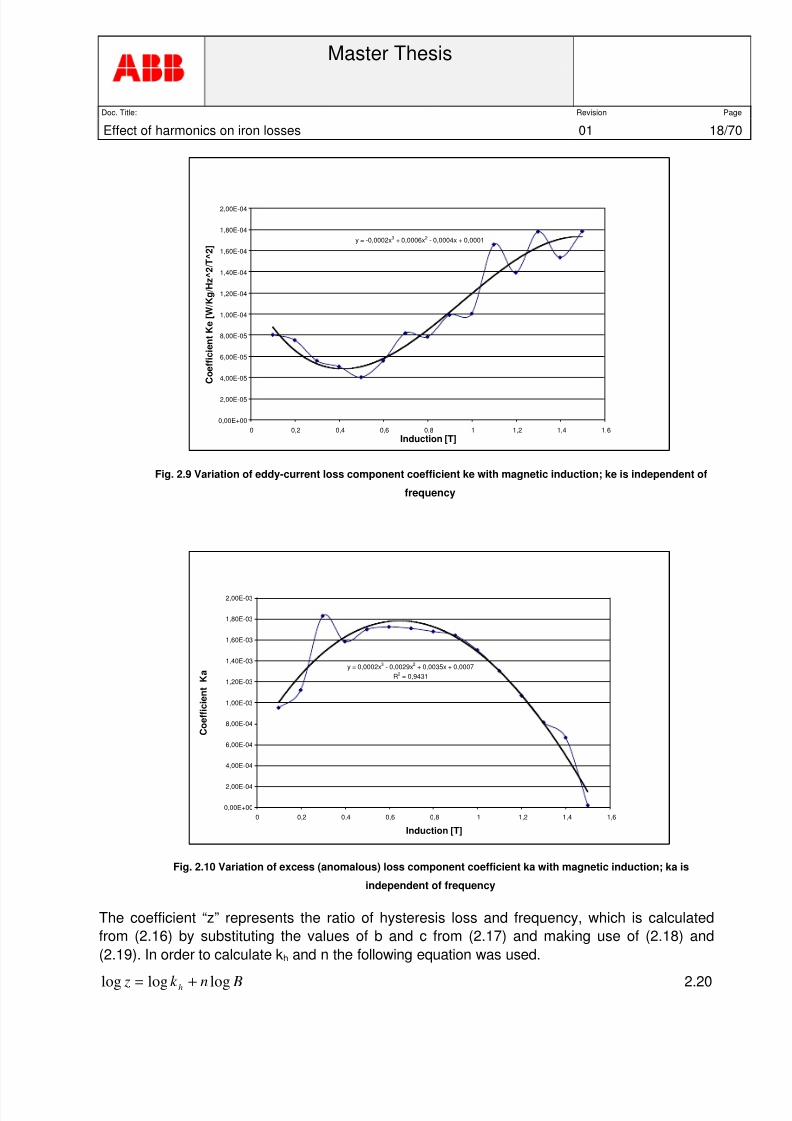
independent of frequency [4]. Third order polynomials were employed for curve fitting of ke and
ka as shown in Fig. 2.9 and Fig. 2.10. Then, r2 of 0,94 and 0,92 are obtained for ka and ke.
3
3
2
210 Bk Bk Bk k k eeeee +++=
2.18
3
3
2
210 Bk Bk Bk k k aaaaa +++=
2.19
8/3/2019 Iron Losses Sohail Thesis KLAR 230408
http://slidepdf.com/reader/full/iron-losses-sohail-thesis-klar-230408 18/70
Master Thesis
Doc. Title: Revision Page
Effect of harmonics on iron losses 01 18/70
y = -0,0002x3
+ 0,0006x2
- 0,0004x + 0,0001
0,00E+00
2,00E-05
4,00E-05
6,00E-05
8,00E-05
1,00E-04
1,20E-04
1,40E-04
1,60E-04
1,80E-04
2,00E-04
0 0,2 0,4 0,6 0,8 1 1,2 1,4 1,6
Induction [T]
C o e f f i c i e n t K e [ W / K g / H z ^ 2 / T ^ 2 ]
Fig. 2.9 Variation of eddy-current loss component coefficient ke with magnetic induction; ke is independent of
frequency
y = 0,0002x3
- 0,0029x2
+ 0,0035x + 0,0007
R2
= 0,9431
0,00E+00
2,00E-04
4,00E-04
6,00E-04
8,00E-04
1,00E-03
1,20E-03
1,40E-03
1,60E-03
1,80E-03
2,00E-03
0 0,2 0,4 0,6 0,8 1 1,2 1,4 1,6
Induction [T]
C o e f f i c i e n t K a
Fig. 2.10 Variation of excess (anomalous) loss component coefficient ka with magnetic induction; ka is
independent of frequency
The coefficient “z” represents the ratio of hysteresis loss and frequency, which is calculated
from (2.16) by substituting the values of b and c from (2.17) and making use of (2.18) and
(2.19). In order to calculate kh and n the following equation was used.
Bnk z h logloglog += 2.20
8/3/2019 Iron Losses Sohail Thesis KLAR 230408
http://slidepdf.com/reader/full/iron-losses-sohail-thesis-klar-230408 19/70
Master Thesis
Doc. Title: Revision Page
Effect of harmonics on iron losses 01 19/70
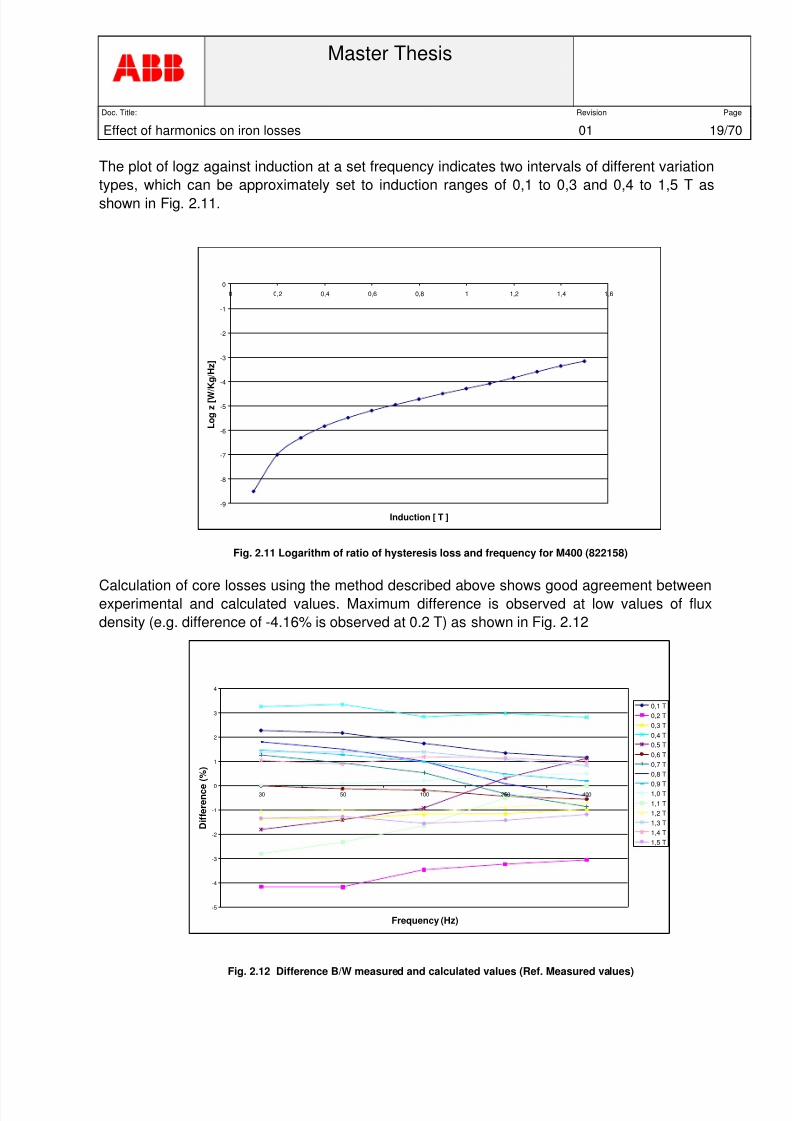
The plot of logz against induction at a set frequency indicates two intervals of different variation
types, which can be approximately set to induction ranges of 0,1 to 0,3 and 0,4 to 1,5 T as
shown in Fig. 2.11.
-9
-8
-7
-6
-5
-4
-3
-2
-1
0
0 0,2 0,4 0,6 0,8 1 1,2 1,4 1,6
Induction [ T ]
L o g z [ W / K g / H z ]
Fig. 2.11 Logarithm of ratio of hysteresis loss and frequency for M400 (822158)
Calculation of core losses using the method described above shows good agreement betweenexperimental and calculated values. Maximum difference is observed at low values of flux
density (e.g. difference of -4.16% is observed at 0.2 T) as shown in Fig. 2.12
-5
-4
-3
-2
-1
0
1
2
3
4
30 50 100 250 400
Frequency (Hz)
D i f f e r e n c e ( % )
0,1 T
0,2 T
0,3 T
0,4 T
0,5 T
0,6 T
0,7 T
0,8 T
0,9 T
1,0 T
1,1 T
1,2 T
1,3 T
1,4 T
1,5 T
Fig. 2.12 Difference B/W measured and calculated values (Ref. Measured values)
8/3/2019 Iron Losses Sohail Thesis KLAR 230408
http://slidepdf.com/reader/full/iron-losses-sohail-thesis-klar-230408 20/70
Master Thesis
Doc. Title: Revision Page
Effect of harmonics on iron losses 01 20/70
2.4.3 Conclusion
Depending on the experimental data available and accuracy required, someone can select anyof the method described above. For example if very little experiment data is available, one
would have no choice except to adopt the constant coefficient method. On the other hand,
accuracy of the result has to be compromised a bit. Similarly, curve fitting methods needs a lot
of experimental data but results in very good accuracy.
2.5 Evaluation of methods for loss prediction with non sinusoidal waveforms
Iron loss per cycle can mainly be divided in to two parts [18], [23]. One is frequency
independent (hysteresis loss or static loss) and the other is varying with frequency (“eddy +
excess loss” or dynamic losses). One way of finding hysteresis loss is to excite a test specimenat very low frequency and measure the iron loss. The iron loss at such a low frequency will
represent Hysteresis loss as the eddy currents induced in the test specimen will be negligibly
small [24]. However when higher frequencies are involved the effect of the frequency dependent
part will make the BH loop broader. Keeping above mentioned facts in mind one can say that
when higher frequencies are involved there is no or a small increase in the hysteresis loss
component. On the other hand, the effect on dynamic loss components will be much higher.
Therefore, in the following discussion when comparing experimental measured iron losses with
calculated iron losses from analytical expressions, we will assume that the effect of harmonics
on Hysteresis loss component is small. The relative difference between measured and
calculated iron losses also support the simplification that if we ignore the effect of harmonic on
hysteresis loss still an acceptable amount of accuracy can be achieved.
In literature, quite a few methods to predict iron loss with non-sinusoidal flux wave forms can be
found. These methods are based on the prior information about the iron loss with sinusoidal
waveforms. Most of the researchers have proposed different methods for loss prediction with
and without minor loops [1], [9], [19], [20]. The method explained in [1] is already discussed in
section 2.1. Whereas [18] has proposed a method comprising of different imperial multiplying
factors for hysteresis and eddy loss components without reveling any details about these.
Marubbini [22] has proposed a method that accounts both for sinusoidal and non-sinusoidal
wave forms. It can be expressed as
+ += dt
dt dB
T K dt
dt dB
T K PP aehTotal
5.12
112.21
Equation (2.21) is similar to the sum of equations (2.2, 2.3, and 2.4). The big difference is that
equation 2.21 is in time domain, in order to account for the presence of harmonics in the flux
wave forms. As a consequence, Ke must be divided by 22 and ka by (1.41) 1.5 in case of a
pure sinusoidal waveform.
For the sake of simplicity and because less knowledge of material science is needed, equation
2.21 is preferred to calculate the iron losses, and later on compared with experimental results.
Phys, Ka and Ke can be calculated using any method explained in the early part of this chapter.
However, the detail of another method used by [23] that is widely used and gives relative good
results is explained below.

8/3/2019 Iron Losses Sohail Thesis KLAR 230408
http://slidepdf.com/reader/full/iron-losses-sohail-thesis-klar-230408 21/70
Master Thesis
Doc. Title: Revision Page
Effect of harmonics on iron losses 01 21/70
In this method, information about the total iron loss at different frequencies and at a particular
flux density is required. In order to explain the method, an example to calculate the individual
loss components at 1.5 T is given. Total iron losses (WT) for 1.5 T at three different frequencies
(30, 50, 100 Hz) are measured using the Epstein frame method. At each frequency the total iron
loss (WT) is subtracted from the eddy current loss (We) and scaled by dividing by frequency;
(WT- - We) / f, whereas eddy current loss is calculated using equation 2.6. Now a graph is drawn
between scaled losses and the square root of frequency, as shown in Fig. 2.13 .
Fig. 2.13 Loss separation
The interception with the y-axis gives hysteresis loss and the excess loss can be calculated by
subtracting eddy current and hysteresis from total loss. Ka is now calculated from excess loss
while Ke is from eddy current loss component.
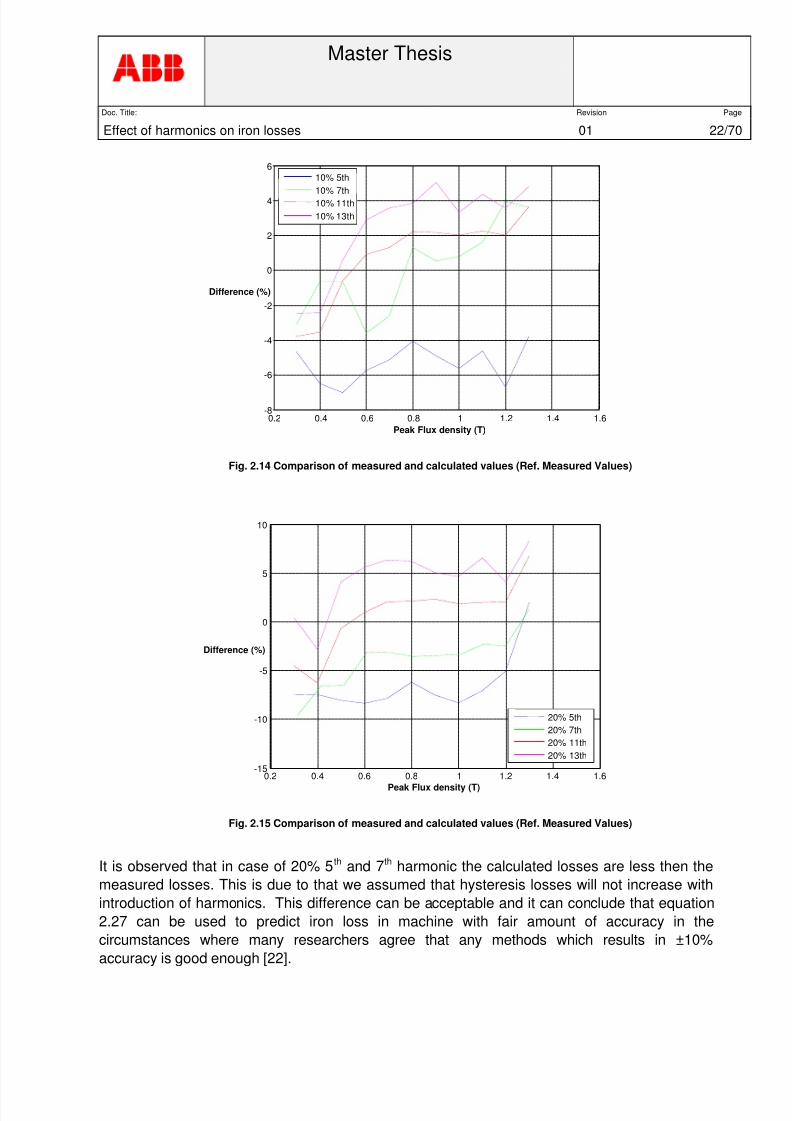
Once hysteresis loss, Ka and Ke is known equation 2.27 can be used to calculate the iron loss
with distorted waveforms. The Fig. 2.14 and Fig. 2.15 show the difference between calculated
and measured iron losses.
5 5.5 6 6.5 7 7.5 8 8.5 9 9.5 10 0.052
0.054
0.056
0.06
0.062
0.064
Square Root of Frequency
y = 0.0023*x + 0.041
Data 1 Linear
(W total - W eddy) / f
8/3/2019 Iron Losses Sohail Thesis KLAR 230408
http://slidepdf.com/reader/full/iron-losses-sohail-thesis-klar-230408 22/70
Master Thesis
Doc. Title: Revision Page
Effect of harmonics on iron losses 01 22/70
Fig. 2.14 Comparison of measured and calculated values (Ref. Measured Values)
Fig. 2.15 Comparison of measured and calculated values (Ref. Measured Values)
It is observed that in case of 20% 5 th and 7th harmonic the calculated losses are less then the
measured losses. This is due to that we assumed that hysteresis losses will not increase with
introduction of harmonics. This difference can be acceptable and it can conclude that equation
2.27 can be used to predict iron loss in machine with fair amount of accuracy in the
circumstances where many researchers agree that any methods which results in ±10%
accuracy is good enough [22].
0.2 0.4 0.6 0.8 1 1.2 1.4 1.6 -8
-6
-4
-2
0
2
4
6
Peak Flux density (T)
10% 5th
10% 7th 10% 11th 10% 13th
0.2
0.4
0.6
0.8
1
1.2
1.4
1.6
-15
-10
-5
0
5
10
Peak Flux density (T)
20% 5th 20% 7th 20% 11th 20% 13th
Difference (%)
Difference (%)
8/3/2019 Iron Losses Sohail Thesis KLAR 230408
http://slidepdf.com/reader/full/iron-losses-sohail-thesis-klar-230408 23/70
Master Thesis
Doc. Title: Revision Page
Effect of harmonics on iron losses 01 23/70
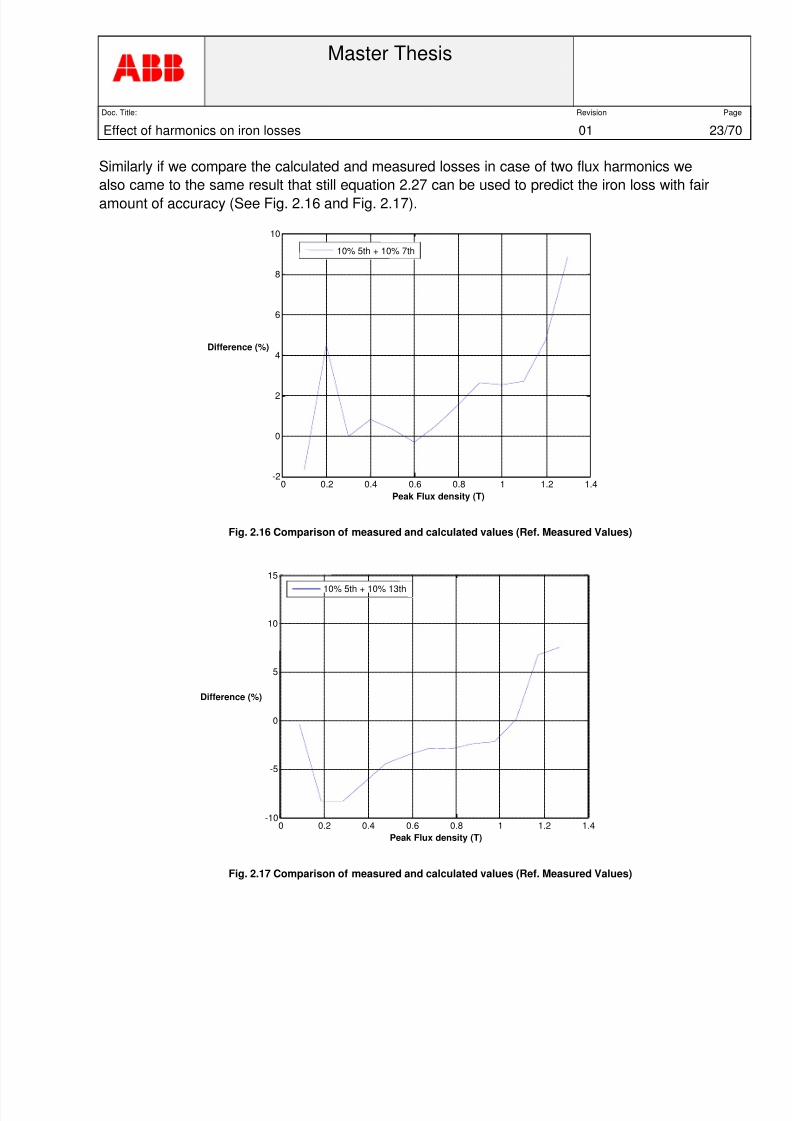
Similarly if we compare the calculated and measured losses in case of two flux harmonics we
also came to the same result that still equation 2.27 can be used to predict the iron loss with fair
amount of accuracy (See Fig. 2.16 and Fig. 2.17).
Fig. 2.16 Comparison of measured and calculated values (Ref. Measured Values)
Fig. 2.17 Comparison of measured and calculated values (Ref. Measured Values)
0 0.2 0.4 0.6 0.8 1 1.2 1.4 -2
0
2
4
6
8
10
Peak Flux density (T)
10% 5th + 10% 7th
0 0.2 0.4 0.6 0.8 1 1.2 1.4 -10
-5
0
5
10
15
Peak Flux density (T)
10% 5th + 10% 13th
Difference (%)
Difference (%)

8/3/2019 Iron Losses Sohail Thesis KLAR 230408
http://slidepdf.com/reader/full/iron-losses-sohail-thesis-klar-230408 24/70
Master Thesis
Doc. Title: Revision Page
Effect of harmonics on iron losses 01 24/70
3 MEASURMENT OF IRON LOSSES WITH NON SINUSOIDAL WAVE FORMS
The following section describes accuracy and repeatability of apparatus used for measuring iron
loss. The measurements were performed at KTH, Stockholm. The measurements from the said
setup are compared with the measurements obtained from apparatus at Cogent, Surahammar.
The apparatus at cogent is believed to be accurate and according to international standards.
In the end of this section, a brief description about the experimental setup used for
measurements is given.
3.1 Authenticity of Measurements
3.1.1 Accuracy
Iron losses at different frequencies were compared with the losses measured from apparatus atCogent. Fig. 3.1 shows the difference between the two measurements (Ref. measurements at
cogent).
-10
-5
0
5
10
15
0 0,2 0,4 0,6 0,8 1 1,2 1,4 1,6
B (T)
D i f f e r e n c e
( % )
50 Hz
30 Hz
Fig. 3.1 Comparison b/w cogent and KTH measurements (Ref. Cogent)
Following important observation are made from Fig. 3.1.
• Nearly same results are obtained for 30 and 50 Hz.
• Maximum difference is observed at low and high value of induction.
• Difference is positive (losses measured with KTH apparatus are higher) at low value of
peak flux density (<0.3 T).
•
Difference is negative (losses measured with KTH apparatus are lower) at high value ofpeak flux density (>1.2 T).
8/3/2019 Iron Losses Sohail Thesis KLAR 230408
http://slidepdf.com/reader/full/iron-losses-sohail-thesis-klar-230408 25/70
Master Thesis
Doc. Title: Revision Page
Effect of harmonics on iron losses 01 25/70
• Good agreement of measurements is obtained at flux densities between 0.3 T to 1.2 T.
Therefore we can conclude that the apparatus used during the thesis work is very accurate from0.3T to 1.4T. A small difference at very high flux density will make no difference in comparative
study.
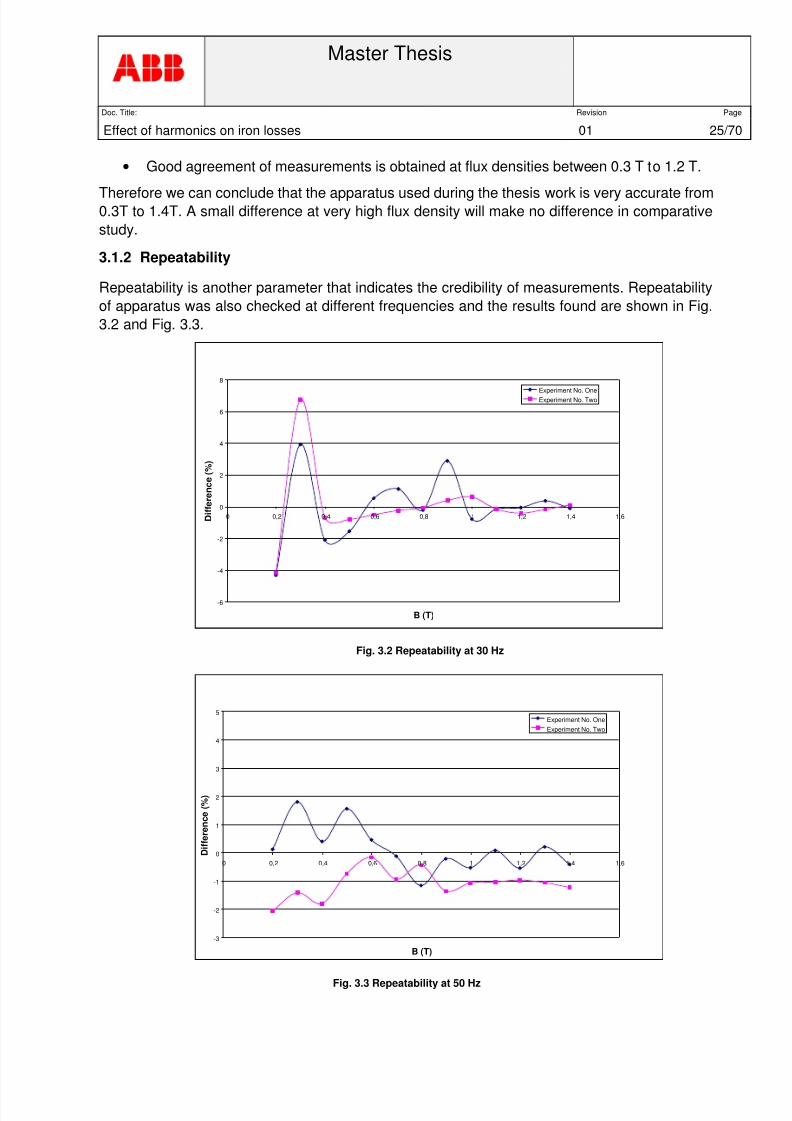
3.1.2 Repeatability
Repeatability is another parameter that indicates the credibility of measurements. Repeatability
of apparatus was also checked at different frequencies and the results found are shown in Fig.
3.2 and Fig. 3.3.
-6
-4
-2
0
2
4
6
8
0 0,2 0,4 0,6 0,8 1 1,2 1,4 1,6
B (T)
D i f f e r e n c e ( % )
Experiment No. OneExperiment No. Two
Fig. 3.2 Repeatability at 30 Hz
-3
-2
-1
0
1
2
3
4
5
0 0,2 0,4 0,6 0,8 1 1,2 1,4 1,6
B (T)
D i f f e r e n c e ( % )
Experiment No. One
Experiment No. Two
Fig. 3.3 Repeatability at 50 Hz

8/3/2019 Iron Losses Sohail Thesis KLAR 230408
http://slidepdf.com/reader/full/iron-losses-sohail-thesis-klar-230408 26/70
Master Thesis
Doc. Title: Revision Page
Effect of harmonics on iron losses 01 26/70
Following important conclusions are made from Fig. 3.2 and Fig. 3.3.
• Repeatability at 30 Hz for lower values of induction (< 0.4T) has the maximum difference
of 7%, while for higher value of peak flux density it is less then 2%. This even improves
with increasing values of peak flux density.
• At 50 Hz for lower values of induction (< 0.4T) has the maximum difference of 2.3%,
while for higher value of induction it is less then 1%.
• Repeatability graph at 70 Hz (See annexure-4) shows good agreements between
experiments with maximum difference of 2.2 % at 3 T.
• Repeatability graph at 5 Hz (See annexure-4) also shows good agreements between
experiments with maximum difference of 1.2 %.
3.2 Block diagram of Experimental setup
Fig. 3.4 Block diagram of apparatus
A block diagram of the experimental setup is shown in
Fig. 3.4. A computer is used as a signal generator, controller as well as data recorder. Theprogramming is made in Simulink. The compiled program is then downloaded to a dSpace
system. Real time control of different parameters such as the amplitude of the fundamental,
harmonics as well as the phase angle is possible via a graphical interface. Digital to analogue
converters supplies the amplifier with input signals. The signal is amplified by an amplifier and
fed to the Epstein frame.
A flux-meter and an ampere-meter are used to record flux and current through the Epstein
frame. The flux values are used in a feed-back loop so that it is possible to specify the flux
wave-form (i.e. the B-field) instead of the current wave-form (i.e. the H-field). Iron loss is
calculated by integrating the area of BH loop.
Simulink
dSPASE
DACAmplifie
Computer
ADC
A
Flux Meter
Epstein frame
8/3/2019 Iron Losses Sohail Thesis KLAR 230408
http://slidepdf.com/reader/full/iron-losses-sohail-thesis-klar-230408 27/70
Master Thesis
Doc. Title: Revision Page
Effect of harmonics on iron losses 01 27/70
4 EFFECT OF A SINGLE FLUX HARMONIC ON IRON LOSSES
To understand the effect of harmonic on iron loss, a quantitative study of the 5 th, 7th, 11th and
13th harmonic with different fundamental frequencies is made. Fundamental frequencies of 5,
30, 50 and 70Hz are selected, as a wide range of the machines operates in these frequencies.
Different graphs are shown to indicate the percentage increase of iron loss in presence of each
harmonic. Effect of the harmonic amplitude and phase angle is discussed. Reasons for increase
in loss iron with respect to pure sinusoidal wave (non harmonics) as well as the effect of change
in phase angle are also explained.
4.1 Fundamental Frequency 50 Hz
4.1.1 5th Harmonic
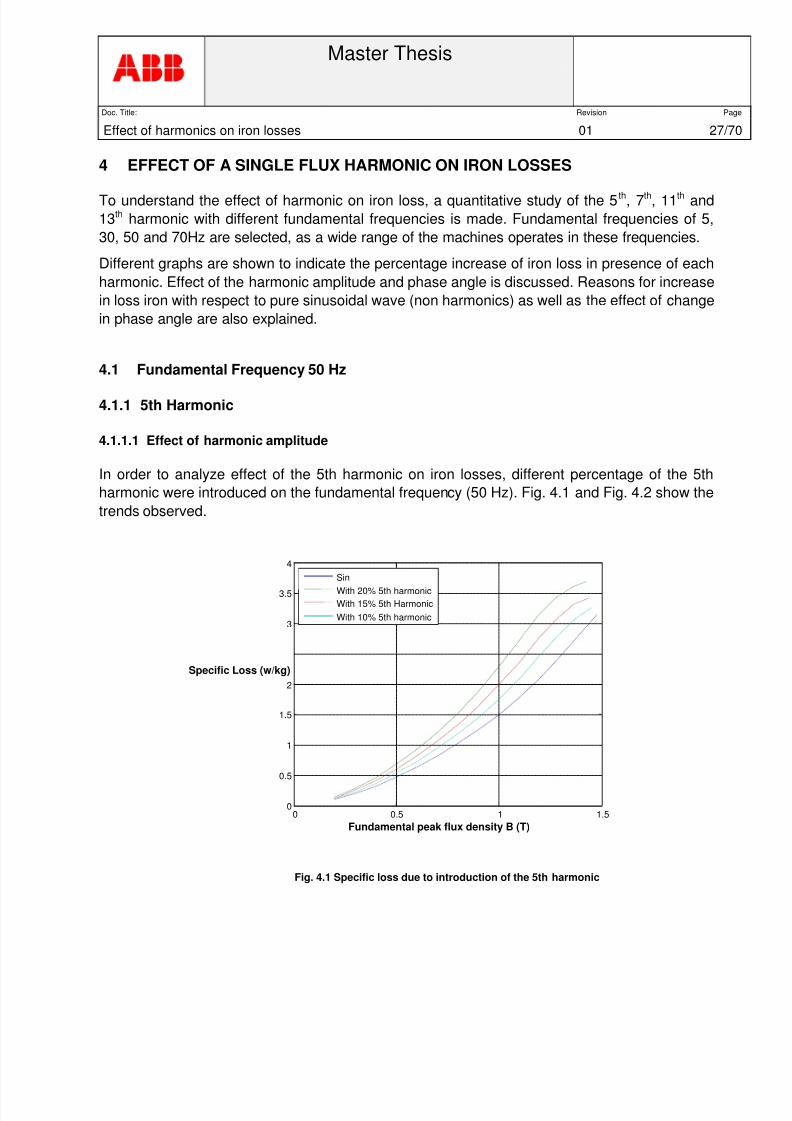
4.1.1.1 Effect of harmonic amplitude
In order to analyze effect of the 5th harmonic on iron losses, different percentage of the 5th
harmonic were introduced on the fundamental frequency (50 Hz). Fig. 4.1 and Fig. 4.2 show the
trends observed.
Fig. 4.1 Specific loss due to introduction of the 5th harmonic
0 0.5 1 1.5 0
0.5
1
1.5
2
3
3.5
4
Fundamental peak flux density B (T)
Sin With 20% 5th harmonic With 15% 5th Harmonic With 10% 5th harmonic
Specific Loss (w/kg)

8/3/2019 Iron Losses Sohail Thesis KLAR 230408
http://slidepdf.com/reader/full/iron-losses-sohail-thesis-klar-230408 28/70
Master Thesis
Doc. Title: Revision Page
Effect of harmonics on iron losses 01 28/70
0
10
20
30
40
50
60
70
0 0,2 0,4 0,6 0,8 1 1,2 1,4 1,6
Fundamental peak flux density B (T)
D i f f e r e n c e ( % )
20 % Harmonic
15 % Harmonic
10 % Harmonic
Fig. 4.2 Effect on Iron loss due to introduction of the 5th harmonic (Ref. Sin)
Following observations are made from Fig. 4.1 and Fig. 4.2
• Increase of loss is observed with increase of magnitude of 5th harmonic.
• Gradual increase in iron loss up to 1.2T.
• At higher values of peak flux density there is less effect of introduction of the 5th
harmonic as the core is already saturated and that results in a sharp decrease (
see figure 4.2 ) at higher values of peak flux densities (>1,2 T).
• A maximum Increase of 58% in case of 20% of the 5th harmonic, 37% in case of
15% of the 5th harmonic and 20% in case of 10% of the 5th harmonic is
observed.
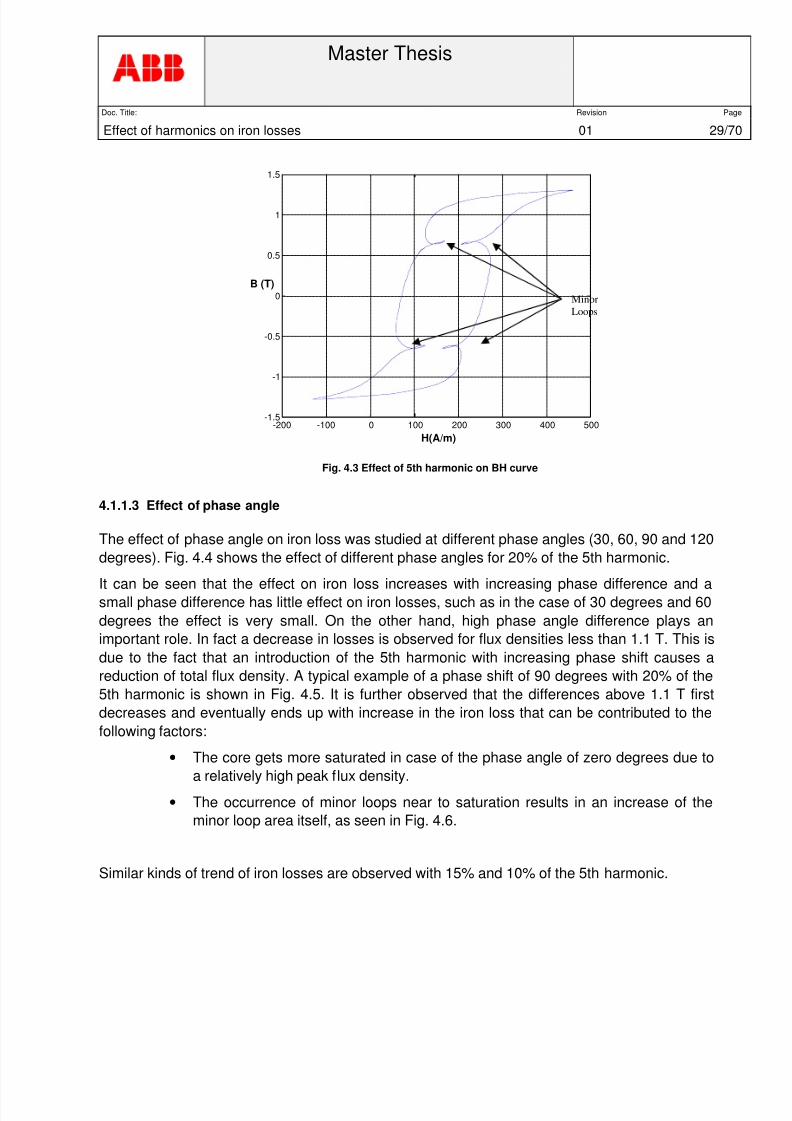
4.1.1.2 Effect on the BH loop
Fig. 4.3 shows minor loops existence due to the presence of the 5th harmonic at 1.1 T.
It can be seen that minor loops are generated with introduction of 20% 5 th harmonics as shown
in figure 4.3; however area of minor loop is not so large and no minor loop generation is
observed in case of 10% and 15% of the 5th harmonic.
8/3/2019 Iron Losses Sohail Thesis KLAR 230408
http://slidepdf.com/reader/full/iron-losses-sohail-thesis-klar-230408 29/70
Master Thesis
Doc. Title: Revision Page
Effect of harmonics on iron losses 01 29/70
Fig. 4.3 Effect of 5th harmonic on BH curve
4.1.1.3 Effect of phase angle
The effect of phase angle on iron loss was studied at different phase angles (30, 60, 90 and 120
degrees). Fig. 4.4 shows the effect of different phase angles for 20% of the 5th harmonic.
It can be seen that the effect on iron loss increases with increasing phase difference and asmall phase difference has little effect on iron losses, such as in the case of 30 degrees and 60
degrees the effect is very small. On the other hand, high phase angle difference plays an
important role. In fact a decrease in losses is observed for flux densities less than 1.1 T. This is
due to the fact that an introduction of the 5th harmonic with increasing phase shift causes a
reduction of total flux density. A typical example of a phase shift of 90 degrees with 20% of the
5th harmonic is shown in Fig. 4.5. It is further observed that the differences above 1.1 T first
decreases and eventually ends up with increase in the iron loss that can be contributed to the
following factors:
• The core gets more saturated in case of the phase angle of zero degrees due to
a relatively high peak flux density.• The occurrence of minor loops near to saturation results in an increase of the
minor loop area itself, as seen in Fig. 4.6.
Similar kinds of trend of iron losses are observed with 15% and 10% of the 5th harmonic.
-200 -100 0 100 200 300 400 500 -1.5
-1
-0.5
0
0.5
1
1.5
H(A/m)
B (T) Minor
Loops

8/3/2019 Iron Losses Sohail Thesis KLAR 230408
http://slidepdf.com/reader/full/iron-losses-sohail-thesis-klar-230408 30/70
Master Thesis
Doc. Title: Revision Page
Effect of harmonics on iron losses 01 30/70
-10
-8
-6
-4
-2
0
2
4
6
0 0,2 0,4 0,6 0,8 1 1,2 1,4 1,6
B (T)
D i f f e r e n c e ( % )
30 degree
60 degree
90 degree
120 degree
Fig. 4.4 Effect of Phase angle with 20 % of the 5th harmonic ( Ref. Zero Phase Shift)
Fig. 4.5 Effect of Phase Angle difference on the peak flux density
0 0.002 0.004 0.006 0.008 0.01 0.012 0.014 0.016 0.018 0.02 -1.5
-1
-0.5
0
0.5
1
1.5
Time (Sec)
B (T)
90 Degree phase shift Zero Degree phase Shift
8/3/2019 Iron Losses Sohail Thesis KLAR 230408
http://slidepdf.com/reader/full/iron-losses-sohail-thesis-klar-230408 31/70
Master Thesis
Doc. Title: Revision Page
Effect of harmonics on iron losses 01 31/70
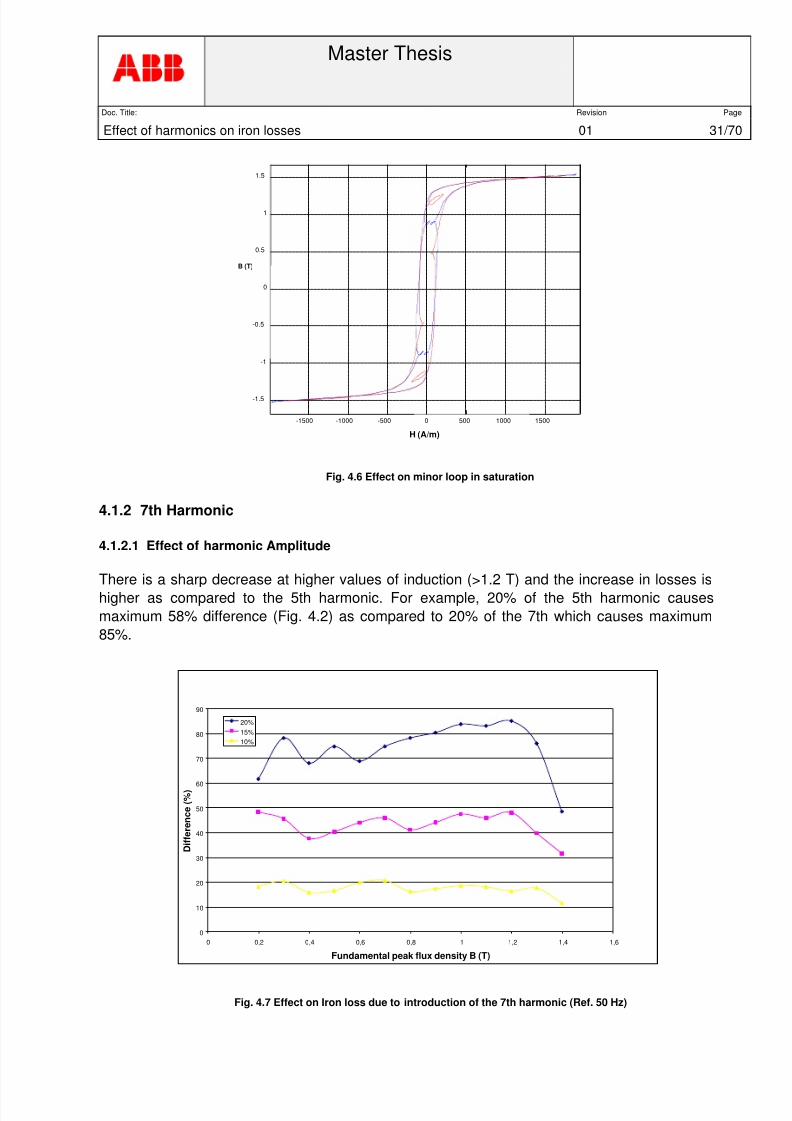
Fig. 4.6 Effect on minor loop in saturation
4.1.2 7th Harmonic
4.1.2.1 Effect of harmonic Amplitude
There is a sharp decrease at higher values of induction (>1.2 T) and the increase in losses ishigher as compared to the 5th harmonic. For example, 20% of the 5th harmonic causes
maximum 58% difference (Fig. 4.2) as compared to 20% of the 7th which causes maximum
85%.
0
10
20
30
40
50
60
70
80
90
0 0,2 0,4 0,6 0,8 1 1,2 1,4 1,6
Fundamental peak flux density B (T)
D i f f e r e n c e ( % )
20%
15%
10%
Fig. 4.7 Effect on Iron loss due to introduction of the 7th harmonic (Ref. 50 Hz)
-1500 -1000 -500 0 500 1000 1500
-1.5
-1
-0.5
0
0.5
1
1.5
H (A/m)
B (T)

8/3/2019 Iron Losses Sohail Thesis KLAR 230408
http://slidepdf.com/reader/full/iron-losses-sohail-thesis-klar-230408 32/70
Master Thesis
Doc. Title: Revision Page
Effect of harmonics on iron losses 01 32/70
The same trend is observed in the case of the 7th harmonic as in the case of the 5th harmonic:
4.1.2.2 Effect on the BH Curve
It is seen from the Fig. 4.8 that the number of minor loops appearing in the BH curve has
increased compared to the introduction of the 5th harmonic which results in an increase of iron
loss and the area covered by minor loops has become larger as compared to the 5th harmonic.
Further, maximum six numbers of minor loops are observed.
Fig. 4.8 Effect of 20% of the 7th harmonic on the BH curve
-400 -300 -200 -100 0 100 200 300 400 -1.5
-1
-0.5
0
0.5
1
1.5
B (T)
H (A/m)
Minor
Loops
8/3/2019 Iron Losses Sohail Thesis KLAR 230408
http://slidepdf.com/reader/full/iron-losses-sohail-thesis-klar-230408 33/70
Master Thesis
Doc. Title: Revision Page
Effect of harmonics on iron losses 01 33/70
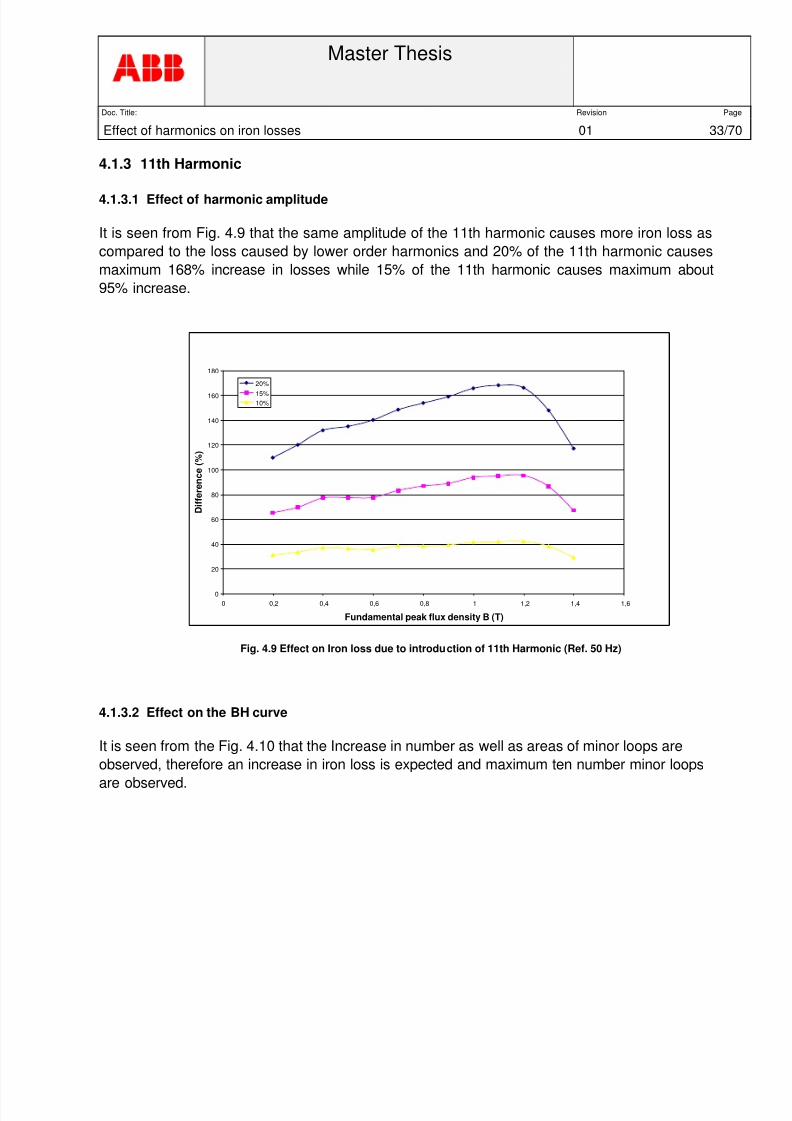
4.1.3 11th Harmonic
4.1.3.1 Effect of harmonic amplitude
It is seen from Fig. 4.9 that the same amplitude of the 11th harmonic causes more iron loss as
compared to the loss caused by lower order harmonics and 20% of the 11th harmonic causes
maximum 168% increase in losses while 15% of the 11th harmonic causes maximum about
95% increase.
0
20
40
60
80
100
120
140
160
180
0 0,2 0,4 0,6 0,8 1 1,2 1,4 1,6
Fundamental peak flux density B (T)
D i f f e r e n c e ( % )
20%
15%
10%
Fig. 4.9 Effect on Iron loss due to introduction of 11th Harmonic (Ref. 50 Hz)
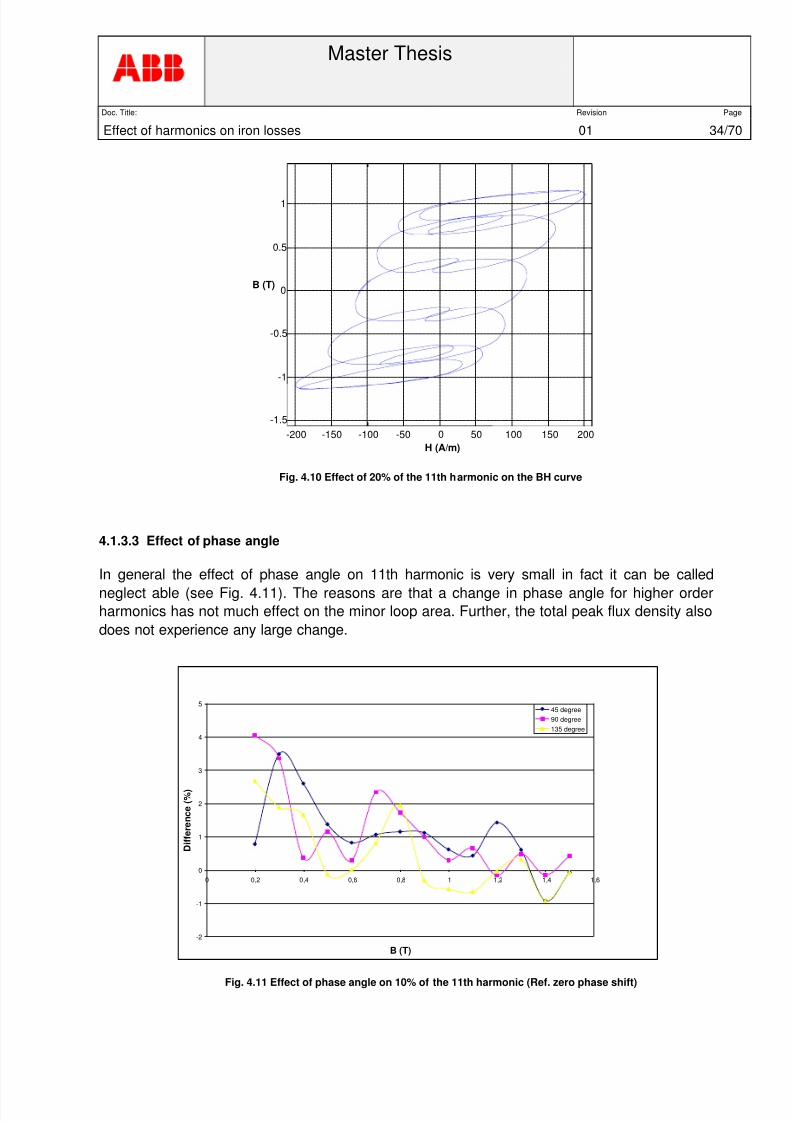
4.1.3.2 Effect on the BH curve
It is seen from the Fig. 4.10 that the Increase in number as well as areas of minor loops are
observed, therefore an increase in iron loss is expected and maximum ten number minor loops
are observed.
8/3/2019 Iron Losses Sohail Thesis KLAR 230408
http://slidepdf.com/reader/full/iron-losses-sohail-thesis-klar-230408 34/70
Master Thesis
Doc. Title: Revision Page
Effect of harmonics on iron losses 01 34/70
Fig. 4.10 Effect of 20% of the 11th harmonic on the BH curve
4.1.3.3 Effect of phase angle
In general the effect of phase angle on 11th harmonic is very small in fact it can be called
neglect able (see Fig. 4.11). The reasons are that a change in phase angle for higher order
harmonics has not much effect on the minor loop area. Further, the total peak flux density also
does not experience any large change.
-2
-1
0
1
2
3
4
5
0 0,2 0,4 0,6 0,8 1 1,2 1,4 1,6
B (T)
D i f f e r e n c e ( % )
45 degree
90 degree
135 degree
Fig. 4.11 Effect of phase angle on 10% of the 11th harmonic (Ref. zero phase shift)
-200 -150 -100 -50 0 50 100 150 200 -1.5
-1
-0.5
0
0.5
1
B (T)
H (A/m)
8/3/2019 Iron Losses Sohail Thesis KLAR 230408
http://slidepdf.com/reader/full/iron-losses-sohail-thesis-klar-230408 35/70
Master Thesis
Doc. Title: Revision Page
Effect of harmonics on iron losses 01 35/70
4.1.4 13th Harmonic
4.1.4.1 Effect of harmonic amplitude
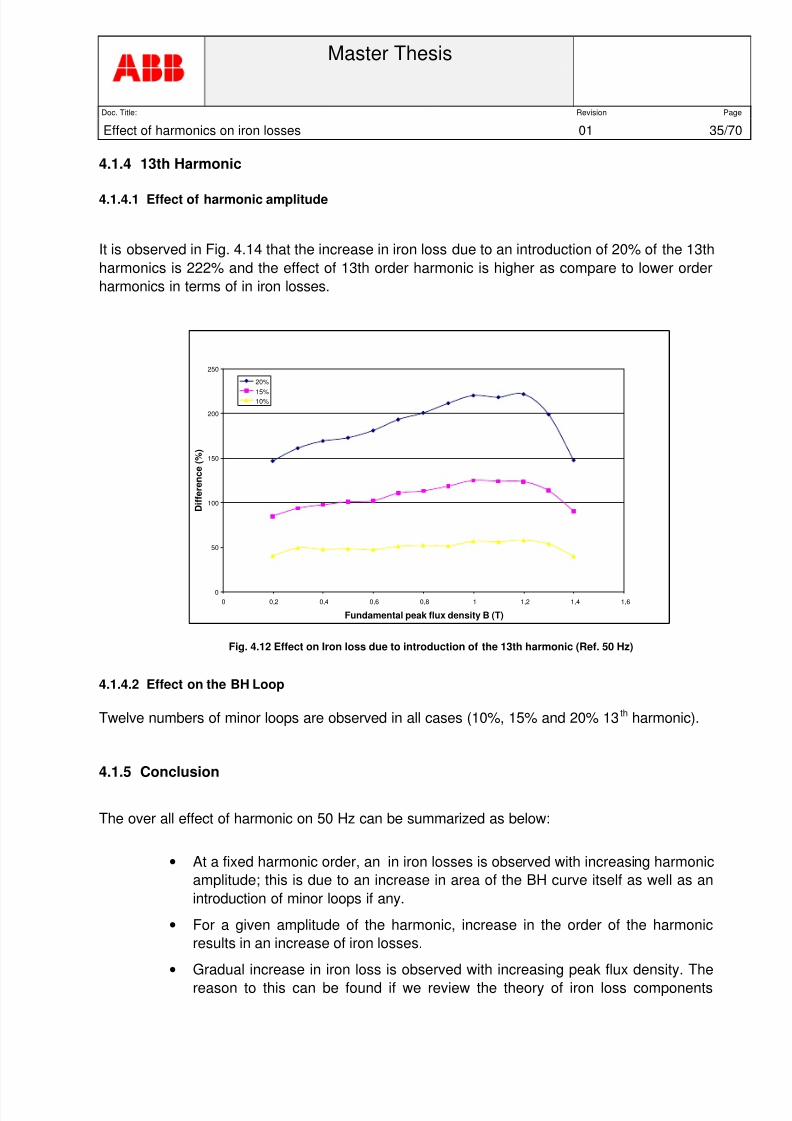
It is observed in Fig. 4.14 that the increase in iron loss due to an introduction of 20% of the 13th
harmonics is 222% and the effect of 13th order harmonic is higher as compare to lower order
harmonics in terms of in iron losses.
0
50
100
150
200
250
0 0,2 0,4 0,6 0,8 1 1,2 1,4 1,6
Fundamental peak flux density B (T)
D i f f e r e n c e ( % )
20%
15%
10%
Fig. 4.12 Effect on Iron loss due to introduction of the 13th harmonic (Ref. 50 Hz)
4.1.4.2 Effect on the BH Loop
Twelve numbers of minor loops are observed in all cases (10%, 15% and 20% 13th harmonic).
4.1.5 Conclusion
The over all effect of harmonic on 50 Hz can be summarized as below:
• At a fixed harmonic order, an in iron losses is observed with increasing harmonic
amplitude; this is due to an increase in area of the BH curve itself as well as an
introduction of minor loops if any.
• For a given amplitude of the harmonic, increase in the order of the harmonic
results in an increase of iron losses.
•
Gradual increase in iron loss is observed with increasing peak flux density. Thereason to this can be found if we review the theory of iron loss components

8/3/2019 Iron Losses Sohail Thesis KLAR 230408
http://slidepdf.com/reader/full/iron-losses-sohail-thesis-klar-230408 36/70
Master Thesis
Doc. Title: Revision Page
Effect of harmonics on iron losses 01 36/70
variations with induction in case of sinusoidal wave forms. Fig. 4.13 shows the
variation of individual iron loss components with flux density. It shows that the
hysteresis loss component decreases with increasing flux density while eddy
current and excess loss components increase with increasing in flux density.
Therefore, it can be concluded that with the introduction of harmonics eddy
current and excess losses increase, while the effect of hysteresis loss is small.
• At higher values of peak flux density, the increase in losses tends to decrease as
the iron gets more and more saturated.
• In case of low order harmonic phase angle effect iron loss to some extent but this
effect seems vanishing with increasing harmonic order.
• The number of minor loops appearing in BH curve depends on the following:
i. Relative amplitude of harmonic with fundamental signal e.g. In case of 20% 5th
harmonic total 4 minor loop are observed while no minor loop is observed in case
of 10% for the same harmonic order, as shown in Figure 1 and 2 (see annexure-
2 ).
ii. Harmonic order also plays an important role in generation of minor loops e.g. 4
no. of minor loops are generated in case of 20% 5th harmonic while number of
minor loops increases to 6 in case of 20% 7th harmonic as shown in Figure 1 and
2 (see annexure-3). This is due to the fact that minor loop appear if the dB/dt for
the harmonic is negative and bigger than for the fundamental.iii. With increasing harmonic order minor loops are more likely to appear even at
relatively low amplitude of harmonic (e.g. 15% 5th harmonic do not generate
minor loop while 15% 7th harmonic results in to generation of minor loops)
Fig. 4.13 Iron loss compenents versus flux density
0.5 1 1.5
10
20
30
40
50
60
70
Peak Flux density (T)
Hysteresis Eddy current
Excess
Percentage of total Iron loss
8/3/2019 Iron Losses Sohail Thesis KLAR 230408
http://slidepdf.com/reader/full/iron-losses-sohail-thesis-klar-230408 37/70
Master Thesis
Doc. Title: Revision Page
Effect of harmonics on iron losses 01 37/70
4.2 Fundamental Frequency 30 Hz
4.2.1 5th Harmonic
4.2.1.1 Effect of harmonic amplitude
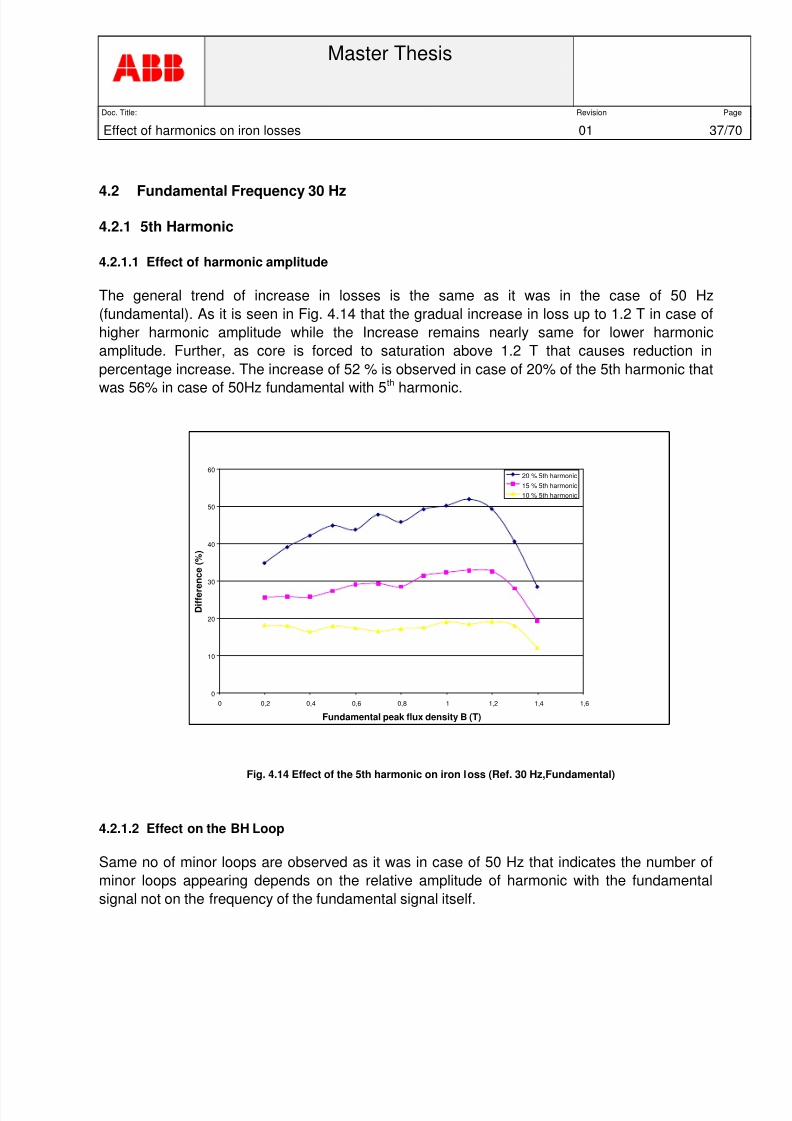
The general trend of increase in losses is the same as it was in the case of 50 Hz
(fundamental). As it is seen in Fig. 4.14 that the gradual increase in loss up to 1.2 T in case of
higher harmonic amplitude while the Increase remains nearly same for lower harmonic
amplitude. Further, as core is forced to saturation above 1.2 T that causes reduction in
percentage increase. The increase of 52 % is observed in case of 20% of the 5th harmonic that
was 56% in case of 50Hz fundamental with 5th
harmonic.
0
10
20
30
40
50
60
0 0,2 0,4 0,6 0,8 1 1,2 1,4 1,6
Fundamental peak flux density B (T)
D i f f e r e
n c e ( % )
20 % 5th harmonic
15 % 5th harmonic
10 % 5th harmonic
Fig. 4.14 Effect of the 5th harmonic on iron loss (Ref. 30 Hz,Fundamental)
4.2.1.2 Effect on the BH Loop
Same no of minor loops are observed as it was in case of 50 Hz that indicates the number of
minor loops appearing depends on the relative amplitude of harmonic with the fundamental
signal not on the frequency of the fundamental signal itself.
8/3/2019 Iron Losses Sohail Thesis KLAR 230408
http://slidepdf.com/reader/full/iron-losses-sohail-thesis-klar-230408 38/70
Master Thesis
Doc. Title: Revision Page
Effect of harmonics on iron losses 01 38/70
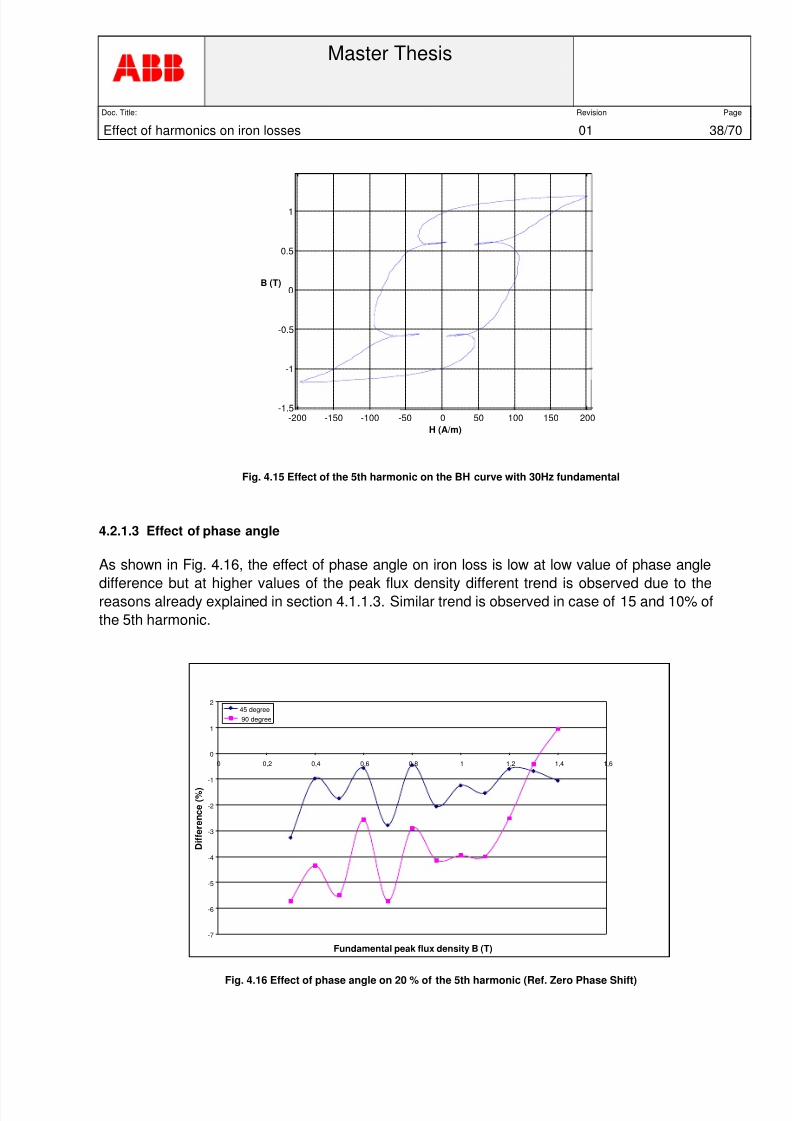
Fig. 4.15 Effect of the 5th harmonic on the BH curve with 30Hz fundamental
4.2.1.3 Effect of phase angle
As shown in Fig. 4.16, the effect of phase angle on iron loss is low at low value of phase angle
difference but at higher values of the peak flux density different trend is observed due to thereasons already explained in section 4.1.1.3. Similar trend is observed in case of 15 and 10% of
the 5th harmonic.
-7
-6
-5
-4
-3
-2
-1
0
1
2
0 0,2 0,4 0,6 0,8 1 1,2 1,4 1,6
Fundamental peak flux density B (T)
D i f f e r e n c e ( % )
45 degree
90 degree
Fig. 4.16 Effect of phase angle on 20 % of the 5th harmonic (Ref. Zero Phase Shift)
-200 -150 -100 -50 0 50 100 150 200 -1.5
-1
-0.5
0
0.5
1
H (A/m)
B (T)
8/3/2019 Iron Losses Sohail Thesis KLAR 230408
http://slidepdf.com/reader/full/iron-losses-sohail-thesis-klar-230408 39/70
Master Thesis
Doc. Title: Revision Page
Effect of harmonics on iron losses 01 39/70
4.2.2 7th Harmonic
4.2.2.1 Effect of harmonic amplitude
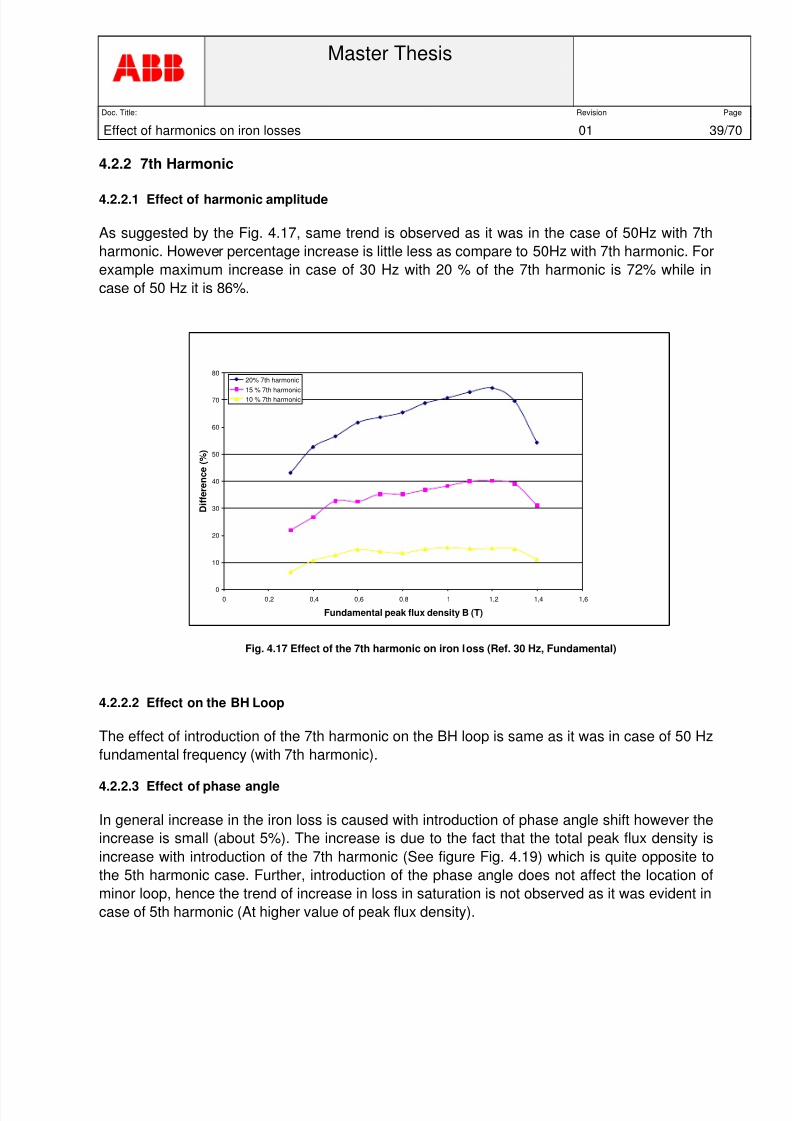
As suggested by the Fig. 4.17, same trend is observed as it was in the case of 50Hz with 7th
harmonic. However percentage increase is little less as compare to 50Hz with 7th harmonic. For
example maximum increase in case of 30 Hz with 20 % of the 7th harmonic is 72% while in
case of 50 Hz it is 86%.
0
10
20
30
40
50
60
70
80
0 0,2 0,4 0,6 0,8 1 1,2 1,4 1,6
Fundamental peak flux density B (T)
D i f f e r e n c e ( % )
20% 7th harmonic
15 % 7th harmonic10 % 7th harmonic
Fig. 4.17 Effect of the 7th harmonic on iron loss (Ref. 30 Hz, Fundamental)
4.2.2.2 Effect on the BH Loop
The effect of introduction of the 7th harmonic on the BH loop is same as it was in case of 50 Hz
fundamental frequency (with 7th harmonic).
4.2.2.3 Effect of phase angle
In general increase in the iron loss is caused with introduction of phase angle shift however the
increase is small (about 5%). The increase is due to the fact that the total peak flux density is
increase with introduction of the 7th harmonic (See figure Fig. 4.19) which is quite opposite to
the 5th harmonic case. Further, introduction of the phase angle does not affect the location of
minor loop, hence the trend of increase in loss in saturation is not observed as it was evident in
case of 5th harmonic (At higher value of peak flux density).

8/3/2019 Iron Losses Sohail Thesis KLAR 230408
http://slidepdf.com/reader/full/iron-losses-sohail-thesis-klar-230408 40/70
Master Thesis
Doc. Title: Revision Page
Effect of harmonics on iron losses 01 40/70
-5
0
5
10
15
20
25
30
0 0,2 0,4 0,6 0,8 1 1,2 1,4 1,6
Fundamental peak flux density B (T)
D i f f e r e n c e ( % )
20% 7th Harmonic
15% 7th Harmonic
10% 7th Harmonic
Fig. 4.18 Effect of 90 degree phase Shift (REF Zero degree)
Fig. 4.19 Effect of the phase angle difference on peak flux density
0.005 0.01 0.015 0.02 0.025 0.03
-1
-0.5
0.5
1
Time (Sec)
B (T)
90 Degree phase shift
Zero Degree phase Shift

8/3/2019 Iron Losses Sohail Thesis KLAR 230408
http://slidepdf.com/reader/full/iron-losses-sohail-thesis-klar-230408 41/70
Master Thesis
Doc. Title: Revision Page
Effect of harmonics on iron losses 01 41/70
Fig. 4.20 Effect of the phase angle difference on minor loops
s
4.2.3 11th Harmonic
4.2.3.1 Effect of harmonic amplitude
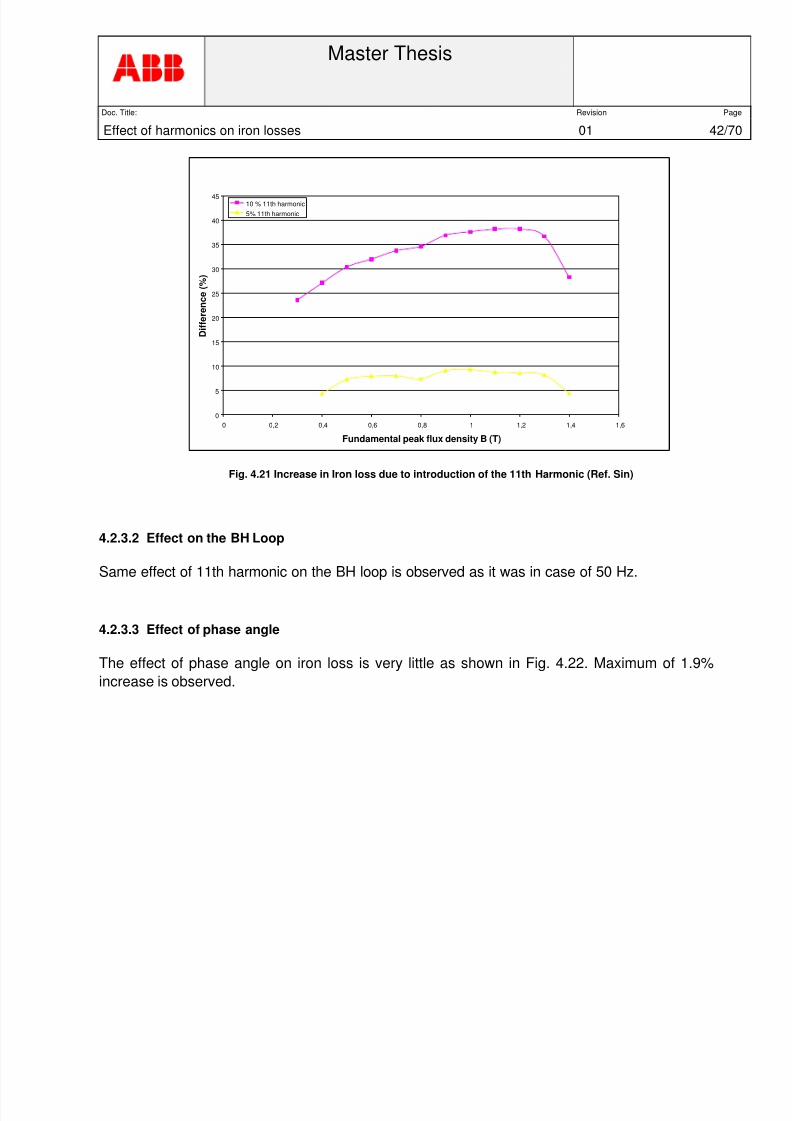
The increase in loss with introduction of 10% of the 11th harmonic is nearly same as it was in
case of 50 Hz fundamental. Maximum increase in case of 30 Hz (10% of the 11th harmonic) is
38 % while it is 41% in case of 50 Hz fundamental (10 % of the 11th harmonic).
-800 -600 -400 -200 0 200 400 600 800 -1.5
-1
-0.5
0.5
1
1.5
H(A/m)
B (T)
90 Degree phase shift In Phase
8/3/2019 Iron Losses Sohail Thesis KLAR 230408
http://slidepdf.com/reader/full/iron-losses-sohail-thesis-klar-230408 42/70
Master Thesis
Doc. Title: Revision Page
Effect of harmonics on iron losses 01 42/70
0
5
10
15
20
25
30
35
40
45
0 0,2 0,4 0,6 0,8 1 1,2 1,4 1,6
Fundamental peak flux density B (T)
D i f f e r e n c e ( % )
10 % 11th harmonic
5% 11th harmonic
Fig. 4.21 Increase in Iron loss due to introduction of the 11th Harmonic (Ref. Sin)
4.2.3.2 Effect on the BH Loop
Same effect of 11th harmonic on the BH loop is observed as it was in case of 50 Hz.
4.2.3.3 Effect of phase angle
The effect of phase angle on iron loss is very little as shown in Fig. 4.22. Maximum of 1.9%
increase is observed.

8/3/2019 Iron Losses Sohail Thesis KLAR 230408
http://slidepdf.com/reader/full/iron-losses-sohail-thesis-klar-230408 43/70
Master Thesis
Doc. Title: Revision Page
Effect of harmonics on iron losses 01 43/70
-5
0
5
10
15
20
0 0,2 0,4 0,6 0,8 1 1,2 1,4 1,6
Fundamental peak flux density B (T)
D i f f e r e n c e ( % )
90 Phase Shift
Fig. 4.22 Effect of phase shift on the iron loss (Ref. Zero Phase Shift)
4.2.4 13th Harmonic
4.2.4.1 Effect of harmonic amplitude
Maximum Increase in the iron loss with introduction of 10 % of the 13th harmonic is 37 % while
in case of 50 Hz it was above 50%. Therefore we can say that at higher harmonic order effect of
the harmonic in 30 Hz fundamental frequency is much less than 50 Hz fundamental.
0
5
10
15
20
25
30
35
40
0 0,2 0,4 0,6 0,8 1 1,2 1,4 1,6
Fundamental peak flux density B (T)
D i f f e r e n c e ( % )
10 % 13th harmonic
5% 13th harmonic
Fig. 4.23 Increase in iron loss due to the introduction of the 13th harmonic (Ref. Sin)
8/3/2019 Iron Losses Sohail Thesis KLAR 230408
http://slidepdf.com/reader/full/iron-losses-sohail-thesis-klar-230408 44/70
Master Thesis
Doc. Title: Revision Page
Effect of harmonics on iron losses 01 44/70
4.2.5 Conclusion
We can conclude that the increase in loss due to introduction of different harmonic with 30Hzfundamental is slightly less than 50Hz fundamental. However this gap seems to be increasing at
the higher order harmonic.
4.3 Fundamental Frequency 70 Hz
4.3.1 5th Harmonic
4.3.1.1 Effect of harmonic amplitude
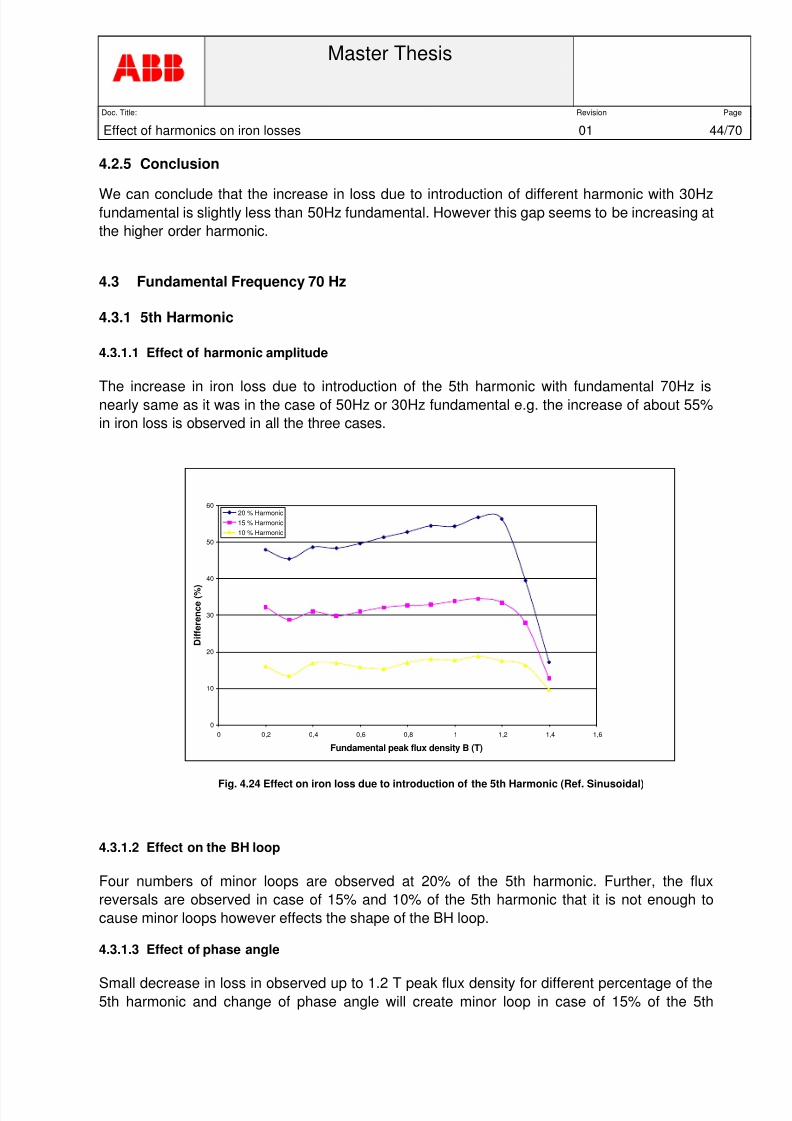
The increase in iron loss due to introduction of the 5th harmonic with fundamental 70Hz isnearly same as it was in the case of 50Hz or 30Hz fundamental e.g. the increase of about 55%
in iron loss is observed in all the three cases.
0
10
20
30
40
50
60
0 0,2 0,4 0,6 0,8 1 1,2 1,4 1,6
Fundamental peak flux density B (T)
D i f f e r e n c e ( % )
20 % Harmonic
15 % Harmonic
10 % Harmonic
Fig. 4.24 Effect on iron loss due to introduction of the 5th Harmonic (Ref. Sinusoidal)
4.3.1.2 Effect on the BH loop
Four numbers of minor loops are observed at 20% of the 5th harmonic. Further, the flux
reversals are observed in case of 15% and 10% of the 5th harmonic that it is not enough to
cause minor loops however effects the shape of the BH loop.
4.3.1.3 Effect of phase angle
Small decrease in loss in observed up to 1.2 T peak flux density for different percentage of the
5th harmonic and change of phase angle will create minor loop in case of 15% of the 5th
8/3/2019 Iron Losses Sohail Thesis KLAR 230408
http://slidepdf.com/reader/full/iron-losses-sohail-thesis-klar-230408 45/70
Master Thesis
Doc. Title: Revision Page
Effect of harmonics on iron losses 01 45/70
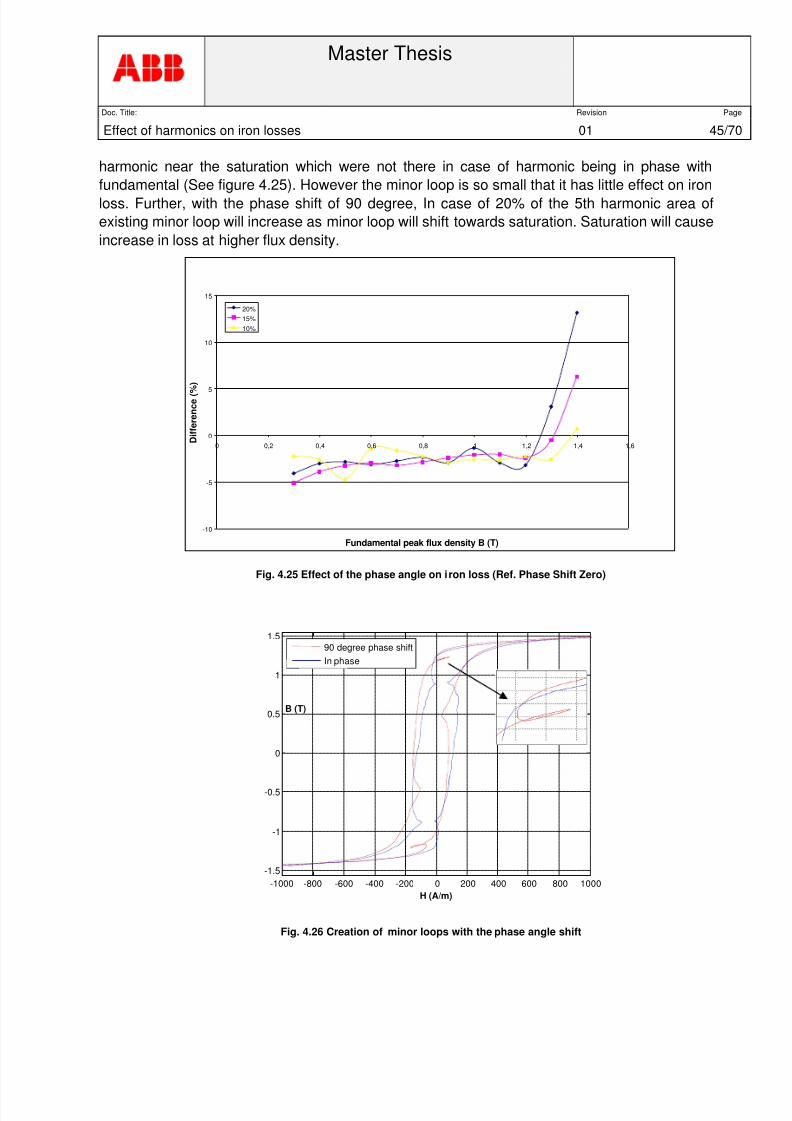
harmonic near the saturation which were not there in case of harmonic being in phase with
fundamental (See figure 4.25). However the minor loop is so small that it has little effect on iron
loss. Further, with the phase shift of 90 degree, In case of 20% of the 5th harmonic area of
existing minor loop will increase as minor loop will shift towards saturation. Saturation will cause
increase in loss at higher flux density.
-10
-5
0
5
10
15
0 0,2 0,4 0,6 0,8 1 1,2 1,4 1,6
Fundamental peak flux density B (T)
D i f f e r e n c e ( %
)
20%
15%
10%
Fig. 4.25 Effect of the phase angle on iron loss (Ref. Phase Shift Zero)
Fig. 4.26 Creation of minor loops with the phase angle shift
-1000 -800 -600 -400 -200 0 200 400 600 800 1000 -1.5
-1
-0.5
0
0.5
1
1.5
H (A/m)
B (T)
90 degree phase shift In phase
8/3/2019 Iron Losses Sohail Thesis KLAR 230408
http://slidepdf.com/reader/full/iron-losses-sohail-thesis-klar-230408 46/70
Master Thesis
Doc. Title: Revision Page
Effect of harmonics on iron losses 01 46/70
4.3.2 7th Harmonic
4.3.2.1 Effect of 7th harmonic amplitude
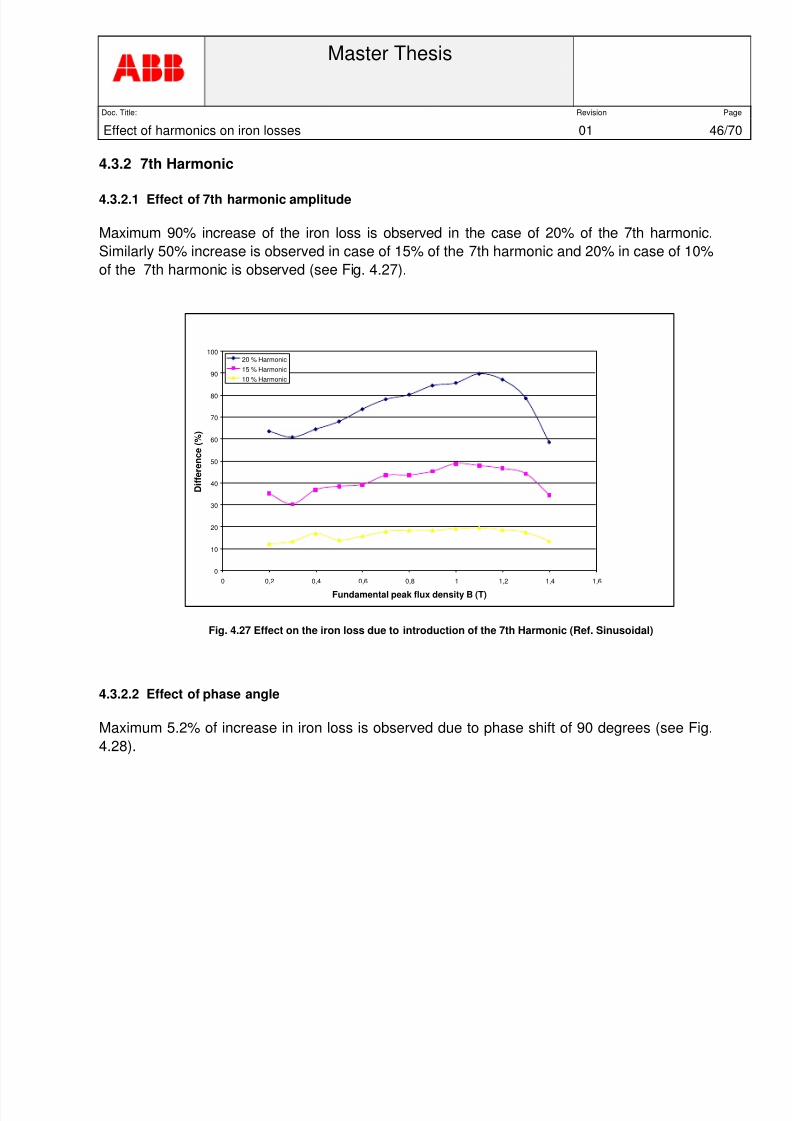
Maximum 90% increase of the iron loss is observed in the case of 20% of the 7th harmonic.
Similarly 50% increase is observed in case of 15% of the 7th harmonic and 20% in case of 10%
of the 7th harmonic is observed (see Fig. 4.27).
0
10
20
30
40
50
60
70
80
90
100
0 0,2 0,4 0,6 0,8 1 1,2 1,4 1,6
Fundamental peak flux density B (T)
D i f f e r e n c e ( % )
20 % Harmonic
15 % Harmonic
10 % Harmonic
Fig. 4.27 Effect on the iron loss due to introduction of the 7th Harmonic (Ref. Sinusoidal)
4.3.2.2 Effect of phase angle
Maximum 5.2% of increase in iron loss is observed due to phase shift of 90 degrees (see Fig.
4.28).

8/3/2019 Iron Losses Sohail Thesis KLAR 230408
http://slidepdf.com/reader/full/iron-losses-sohail-thesis-klar-230408 47/70
Master Thesis
Doc. Title: Revision Page
Effect of harmonics on iron losses 01 47/70
-5
0
5
10
15
20
0 0,2 0,4 0,6 0,8 1 1,2 1,4 1,6
Fundamental peak flux density B (T)
D i f f e r e n c e ( % )
20%
15%
10%
Fig. 4.28 Effect of the phase angle on iron loss (Ref. Phase shift Zero)
4.3.3 11th Harmonic
4.3.3.1 Effect of harmonic amplitude
Maximum increase in loss of 177% is observed with introduction of 20% of the11th harmonic
while increase in case of 15% and 10% of the 11th harmonic is about 100% and 40%
respectively.
0
20
40
60
80
100
120
140
160
180
200
0 0,2 0,4 0,6 0,8 1 1,2 1,4 1,6
Fundamental peak flux density B (T)
D i f f e r e n c e ( %
)
20 % Harmonic
15 % Harmonic
10 % Harmonic
Fig. 4.29 Effect on iron loss due to introduction of 11th Harmonic (Ref. Sinusoidal)
8/3/2019 Iron Losses Sohail Thesis KLAR 230408
http://slidepdf.com/reader/full/iron-losses-sohail-thesis-klar-230408 48/70
Master Thesis
Doc. Title: Revision Page
Effect of harmonics on iron losses 01 48/70
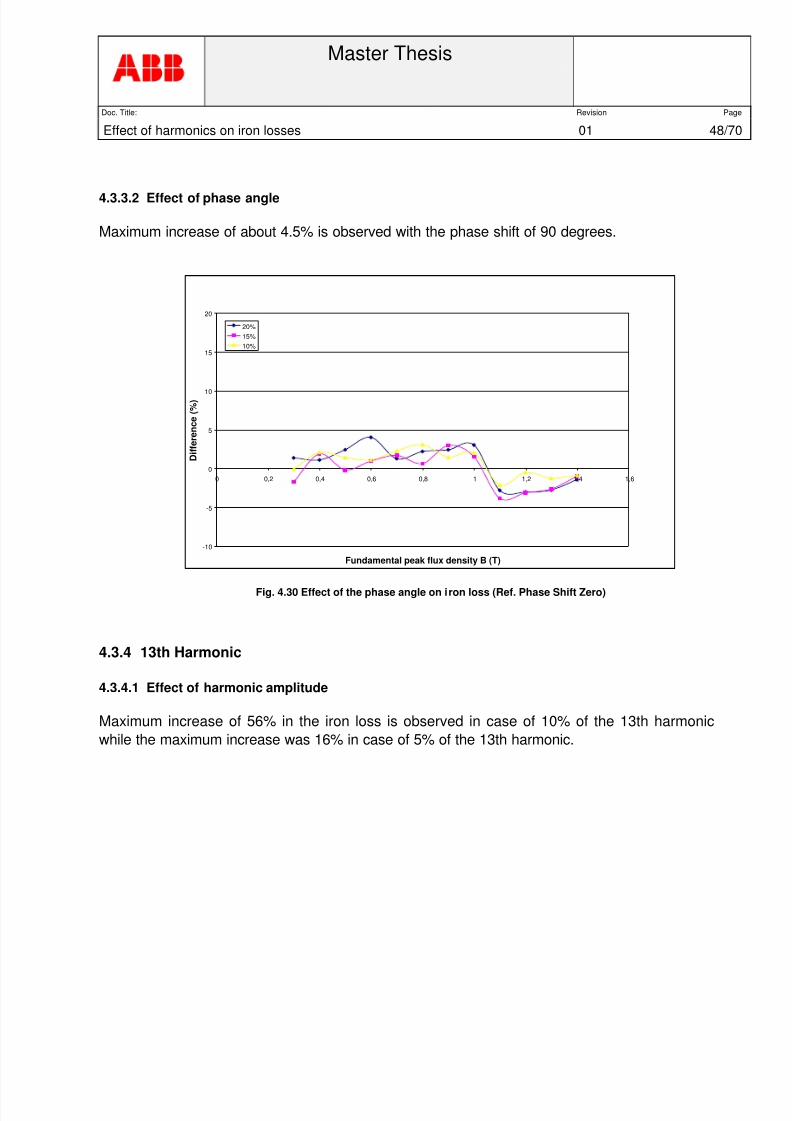
4.3.3.2 Effect of phase angle
Maximum increase of about 4.5% is observed with the phase shift of 90 degrees.
-10
-5
0
5
10
15
20
0 0,2 0,4 0,6 0,8 1 1,2 1,4 1,6
Fundamental peak flux density B (T)
D i f f e r e n c e ( % )
20%
15%
10%
Fig. 4.30 Effect of the phase angle on iron loss (Ref. Phase Shift Zero)
4.3.4 13th Harmonic
4.3.4.1 Effect of harmonic amplitude
Maximum increase of 56% in the iron loss is observed in case of 10% of the 13th harmonic
while the maximum increase was 16% in case of 5% of the 13th harmonic.

8/3/2019 Iron Losses Sohail Thesis KLAR 230408
http://slidepdf.com/reader/full/iron-losses-sohail-thesis-klar-230408 49/70
Master Thesis
Doc. Title: Revision Page
Effect of harmonics on iron losses 01 49/70
0
10
20
30
40
50
60
70
0 0,2 0,4 0,6 0,8 1 1,2 1,4 1,6
Fundamental peak flux density B (T)
D i f f e r e n c e ( % )
10 % Harmonic
5 % Harmonic
Fig. 4.31 Effect on iron loss due to introduction of the 13th harmonic (Ref. Sinusoidal)
4.4 Fundamental Frequency 5 Hz
The effect of different harmonic with the fundamental frequency 5 Hz is also studied andfollowing results can be concluded
• The increase in the iron loss due to different harmonic with the fundamental 5 Hz
is nearly same as it was for other fundamental frequencies (i.e. 50 Hz, 70 Hz and
30 Hz).
• Effect of the phase angle on iron loss is more on low order harmonic while phase
angle has less effect in case of higher order harmonics.
8/3/2019 Iron Losses Sohail Thesis KLAR 230408
http://slidepdf.com/reader/full/iron-losses-sohail-thesis-klar-230408 50/70
Master Thesis
Doc. Title: Revision Page
Effect of harmonics on iron losses 01 50/70
5 EFFECT OF TWO FLUX HARMONICS ON IRON LOSS
In electrical machines several harmonics are present simultaneously. These harmonics may or
may not be in phase with the fundamental frequency. As in section 4 it was observed that the
phase angle is important for the iron losses generated by lower order harmonics while the effect
is very minor for losses generated by higher order harmonics. In the following section, the effect
of two flux harmonics on iron loss is studied. The combination of (5 th + 7th) and (5th + 13th)
harmonic is selected because these are often dominant in electrical machines. The effect of the
phase angle is studied when:
• Two low order harmonic (5th and 7th ) are present
• One low order (5th) and one high order (13th) harmonic is present.
One should know that in the following section when the effect of phase angle is reported in caseof the 5th and 7th harmonics, the 5th harmonic is in phase with the fundamental frequency while
the 7th harmonic is having a 90 degrees phase shift.
Similarly in case of the 5th and 13th harmonics, the 5th harmonic is in phase with the fundamental
frequency while the 13th harmonic is having a 90 degrees phase shift.
However, the cases with the 5th harmonic having a phase shift of 90 degrees and the other
harmonic in phase with the fundamental frequency is also studied but this leads toward similar
kind of trends and conclusions.
5.1 Fundamental Frequency (50 Hz)
5.1.1 Effect of the 5th and 7th harmonic
5.1.1.1 Effect of the harmonic amplitude
Let us take the expample of a wave form that contains two harmonics, having amplitude of 10%
of the 5th and 7th harminics (both in phase with the fundamental frequency). It is observed that
the maximum iron loss induced by such wave form is about 23%. Further, gradual Increase in
iron loss with increasing flux density untill saturation comes in to effect, as it is the case with
single harmonic.

8/3/2019 Iron Losses Sohail Thesis KLAR 230408
http://slidepdf.com/reader/full/iron-losses-sohail-thesis-klar-230408 51/70
Master Thesis
Doc. Title: Revision Page
Effect of harmonics on iron losses 01 51/70
0
5
10
15
20
25
0 0,2 0,4 0,6 0,8 1 1,2 1,4 1,6
Fundamental peak flux density B (T)
D i f f e r e n c e ( % )
10% 5th and 10% 7th harmonic
Fig. 5.1 Effect on iron loss due to introduction of the 5th and 7th harmonic (Ref. Sin)
5.1.1.2 Effect on the BH Loop
Six minor loops are created in case 10% of the 5th and 10% of the 7th harmonics are introduced.
This suggests that the number of created minor loops are totally dependent on the wave form of
the flux density as shown in Fig. 5.3. However in this particular case the minor loops appearingat peak is so small that it is not visible in Fig. 5.2.
Fig. 5.2 Effect of 10% of the 5th and 10% of the 7th harmonic on BH curve
-150 -100 -50 0 50 100
-1
-0.8
-0.6
-0.4
-0.2
0
0.2
0.4
0.6
0.8
1
H (A/m)
B (T)

8/3/2019 Iron Losses Sohail Thesis KLAR 230408
http://slidepdf.com/reader/full/iron-losses-sohail-thesis-klar-230408 52/70
Master Thesis
Doc. Title: Revision Page
Effect of harmonics on iron losses 01 52/70
Fig. 5.3 Flux density as function of time
5.1.1.3 Effect of phase angle
It is seen in Fig. 5.4 that the increase in iron loss up to 1 T is observed in case of introduction of
the phase angle difference of 90 degrees. It is because of the increase in peak flux density. It is
also observed, the introduction of the phase angle causes increase in peak flux density it is
obvious that saturation will be reached early and the difference will tends to decrease after the
saturation reaches. Further, the percentage increase in the iron loss due to the phase shift is
nearly equal to the percentage increase in the peak flux density.
0
2
4
6
8
10
12
14
0 0,2 0,4 0,6 0,8 1 1,2 1,4 1,6
Fundamental peak flux density B (T)
D i f f e r e n c e ( % )
90 degree phase shift
Fig. 5.4 Effect of the phase angle (Ref. Phase angle zero)
0 0.002 0.004 0.006 0.008 0.01 0.012 0.014 0.016 0.018 0.02 -1.5
-1
-0.5
0
0.5
1
1.5
Time (Sec)
B (T) Flux reversal
causing minor
Loops

8/3/2019 Iron Losses Sohail Thesis KLAR 230408
http://slidepdf.com/reader/full/iron-losses-sohail-thesis-klar-230408 53/70
Master Thesis
Doc. Title: Revision Page
Effect of harmonics on iron losses 01 53/70
Fig. 5.5 Flux density as function of time
5.1.2 Effect of the 5th and 13th harmonic
5.1.2.1 Effect of harmonic amplitude
Maximum increase of 75% in iron loss is observed and the saturation effect at high peak flux
density is also evident here, as it is in almost every case.
0
10
20
30
40
50
60
70
80
0 0,2 0,4 0,6 0,8 1 1,2 1,4 1,6
Fundamental peak flux density B (T)
D i f f e r e n c e ( %
)
10% 5th and 10% 13th harmonic
Fig. 5.6 Effect on the iron loss due to introduction of the 5th and 13th harmonic (Ref. Sinusoidal)
0 0.002 0.004 0.006 0.008 0.01 0.012 0.014 0.016 0.018 0.02 -1.5
-1
-0.5
0
0.5
1
1.5
Time (Sec)
B (T)
90 Degree phase shift Zero Degree phase Shift
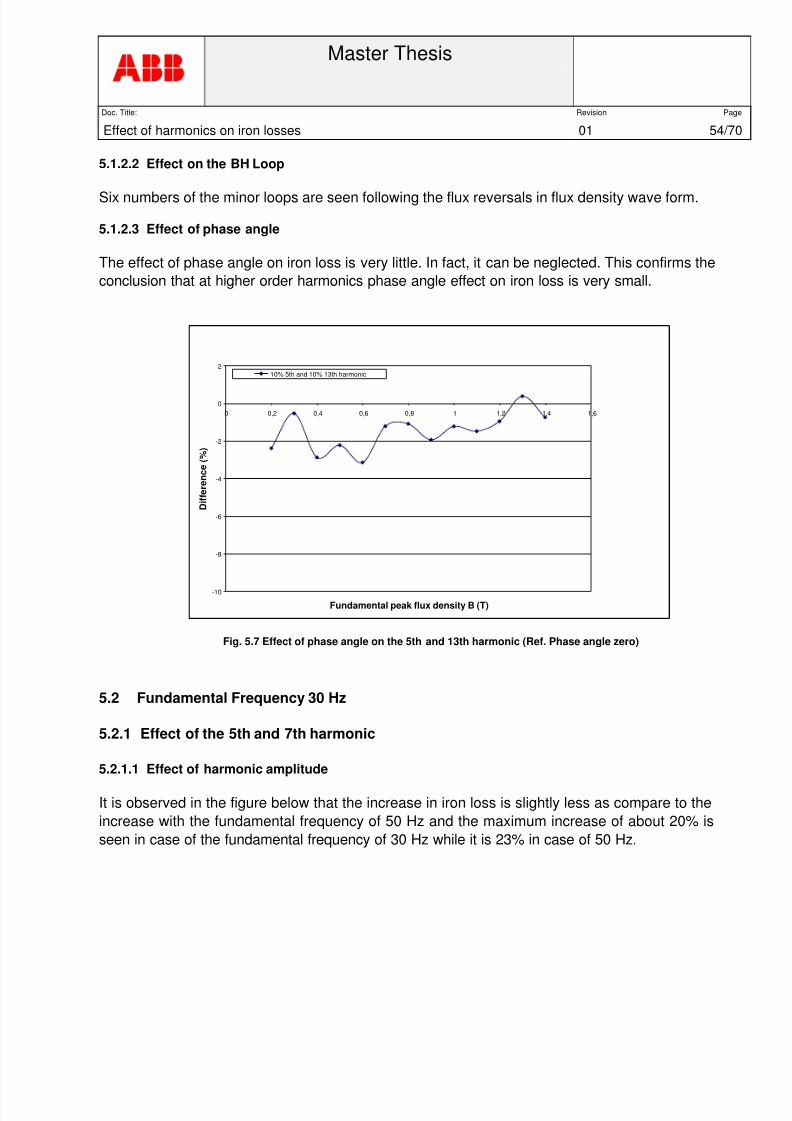
8/3/2019 Iron Losses Sohail Thesis KLAR 230408
http://slidepdf.com/reader/full/iron-losses-sohail-thesis-klar-230408 54/70
Master Thesis
Doc. Title: Revision Page
Effect of harmonics on iron losses 01 54/70
5.1.2.2 Effect on the BH Loop
Six numbers of the minor loops are seen following the flux reversals in flux density wave form.
5.1.2.3 Effect of phase angle
The effect of phase angle on iron loss is very little. In fact, it can be neglected. This confirms the
conclusion that at higher order harmonics phase angle effect on iron loss is very small.
-10
-8
-6
-4
-2
0
2
0 0,2 0,4 0,6 0,8 1 1,2 1,4 1,6
Fundamental peak flux density B (T)
D i f f e r e n c e ( % )
10% 5th and 10% 13th harmonic
Fig. 5.7 Effect of phase angle on the 5th and 13th harmonic (Ref. Phase angle zero)
5.2 Fundamental Frequency 30 Hz
5.2.1 Effect of the 5th and 7th harmonic
5.2.1.1 Effect of harmonic amplitude
It is observed in the figure below that the increase in iron loss is slightly less as compare to the
increase with the fundamental frequency of 50 Hz and the maximum increase of about 20% is
seen in case of the fundamental frequency of 30 Hz while it is 23% in case of 50 Hz.
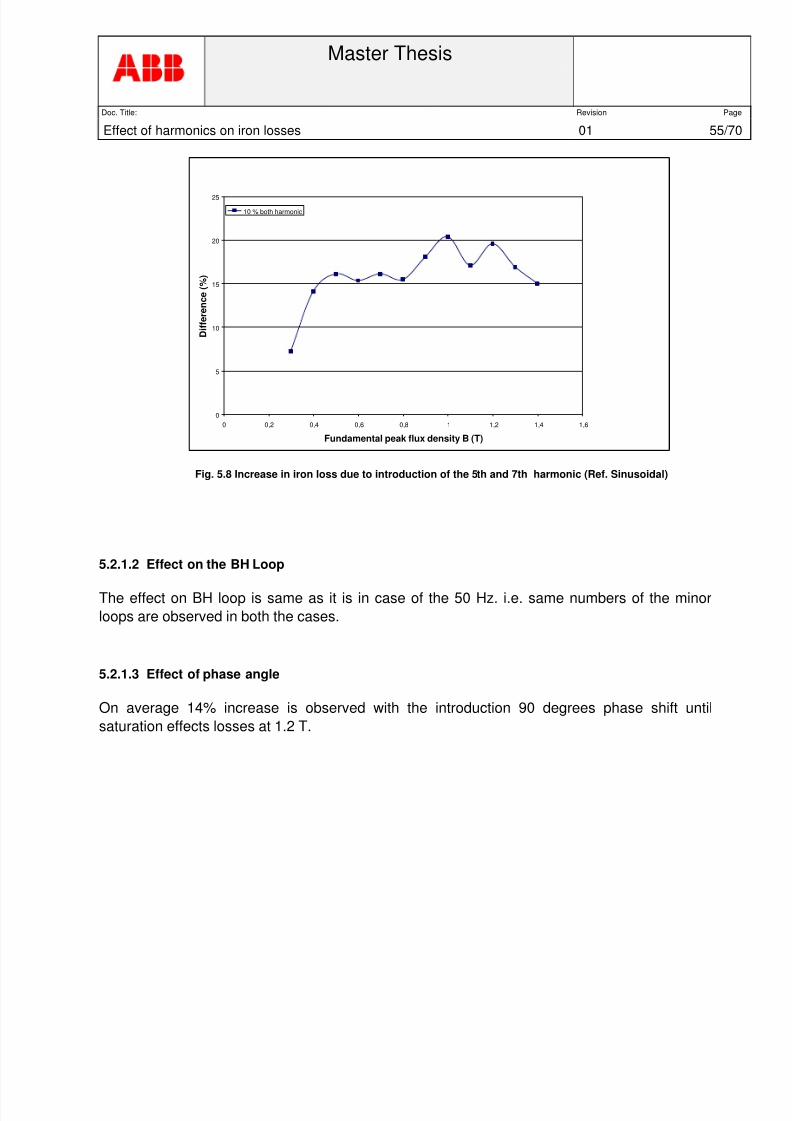
8/3/2019 Iron Losses Sohail Thesis KLAR 230408
http://slidepdf.com/reader/full/iron-losses-sohail-thesis-klar-230408 55/70
Master Thesis
Doc. Title: Revision Page
Effect of harmonics on iron losses 01 55/70
0
5
10
15
20
25
0 0,2 0,4 0,6 0,8 1 1,2 1,4 1,6
Fundamental peak flux density B (T)
D i f f e r e n c e ( % )
10 % both harmonic
Fig. 5.8 Increase in iron loss due to introduction of the 5th and 7th harmonic (Ref. Sinusoidal)
5.2.1.2 Effect on the BH Loop
The effect on BH loop is same as it is in case of the 50 Hz. i.e. same numbers of the minor
loops are observed in both the cases.
5.2.1.3 Effect of phase angle
On average 14% increase is observed with the introduction 90 degrees phase shift until
saturation effects losses at 1.2 T.

8/3/2019 Iron Losses Sohail Thesis KLAR 230408
http://slidepdf.com/reader/full/iron-losses-sohail-thesis-klar-230408 56/70
Master Thesis
Doc. Title: Revision Page
Effect of harmonics on iron losses 01 56/70
0
2
4
6
8
10
12
14
16
0 0,2 0,4 0,6 0,8 1 1,2 1,4 1,6
Fundamental peak flux density B (T)
D i f f e r e n c e ( % )
90 degree phase shift
Fig. 5.9 Effect of phase angle on the 5th and 7th harmonic (Ref. Zero degree phase shift)
5.2.2 Effect of the 5th and 13th harmonic
5.2.2.1 Effect of harmonic amplitude
Maximum 65% increase in the iron loss is observed that is slightly lower then in case of the 50
Hz fundamental frequency.
0
10
20
30
40
50
60
70
0 0,2 0,4 0,6 0,8 1 1,2 1,4 1,6
Fundamental peak flux density B (T)
D i f f e r e n c e ( % )
10 % 13th harmonic
Fig. 5.10 Increase in the iron loss due to introduction of the 5th and 13th harmonic (Ref. Sinusoidal)

8/3/2019 Iron Losses Sohail Thesis KLAR 230408
http://slidepdf.com/reader/full/iron-losses-sohail-thesis-klar-230408 57/70
Master Thesis
Doc. Title: Revision Page
Effect of harmonics on iron losses 01 57/70
5.2.2.2 Effect on the BH Loop
Similar kind of effect on the BH loop is observed as it is in case of 50Hz.
5.2.2.3 Effect of phase angle
In general decrease in iron loss is observed with introduction of phase shift of 90 degrees.
Following figure suggests that maximum decrease of 4% is observed.
-10
-8
-6
-4
-2
0
2
0 0,2 0,4 0,6 0,8 1 1,2 1,4 1,6
Fundamental peak flux density B (T)
D i f f e r e n c e ( % )
90 degree Phase shift
Fig. 5.11 Effect of the phase angle on iron loss (Ref. Zero degree phase shift)
5.3 Fundamental Frequency 70 Hz
5.3.1 Effect of the 5th and 7th harmonic
5.3.1.1 Effect of harmonic amplitude
Maximum increase due to introduction of 10% of the 5 th and 7th harmonics with 70Hz
fundamental is about 27% that is slightly larger than same harmonics with 50Hz fundamental.
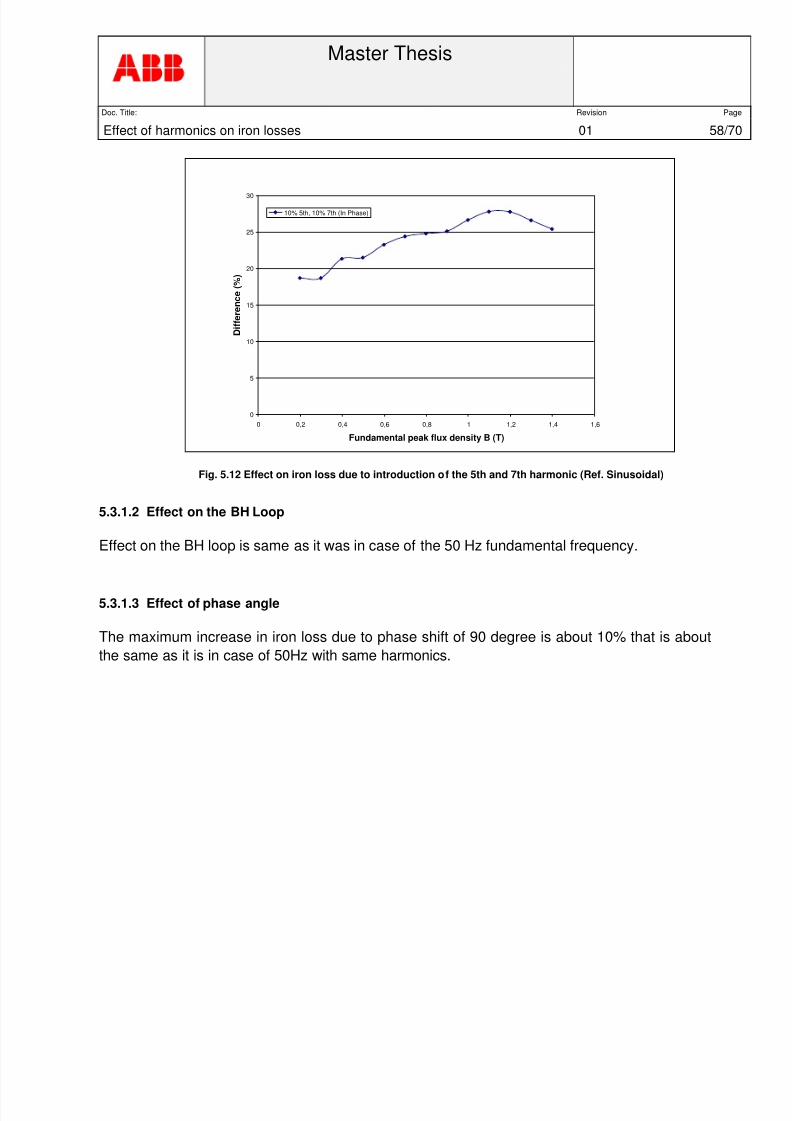
8/3/2019 Iron Losses Sohail Thesis KLAR 230408
http://slidepdf.com/reader/full/iron-losses-sohail-thesis-klar-230408 58/70
Master Thesis
Doc. Title: Revision Page
Effect of harmonics on iron losses 01 58/70
0
5
10
15
20
25
30
0 0,2 0,4 0,6 0,8 1 1,2 1,4 1,6
Fundamental peak flux density B (T)
D i f f e r e n c e ( % )
10% 5th, 10% 7th (In Phase)
Fig. 5.12 Effect on iron loss due to introduction of the 5th and 7th harmonic (Ref. Sinusoidal)
5.3.1.2 Effect on the BH Loop
Effect on the BH loop is same as it was in case of the 50 Hz fundamental frequency.
5.3.1.3 Effect of phase angle
The maximum increase in iron loss due to phase shift of 90 degree is about 10% that is about
the same as it is in case of 50Hz with same harmonics.

8/3/2019 Iron Losses Sohail Thesis KLAR 230408
http://slidepdf.com/reader/full/iron-losses-sohail-thesis-klar-230408 59/70
Master Thesis
Doc. Title: Revision Page
Effect of harmonics on iron losses 01 59/70
0
2
4
6
8
10
12
0 0,2 0,4 0,6 0,8 1 1,2 1,4 1,6
Fundamental peak flux density B (T)
D i f f e r e n c e ( % )
90 degree Phase Shift
Fig. 5.13 Effect of the phase angle on iron loss (Ref. Phase angle Zero)
5.3.2 Effect of the 5th and 13th harmonic
5.3.2.1 Effect of harmonic amplitude
Maximum increase with introduction of 10% of the 5th and 7th harmonics is about 77%. It is
further observed that the gradual increase in loss in observed with increasing the peak flux
density, the trend that is observed in almost every case.
0
10
20
30
40
50
60
70
80
90
0 0,2 0,4 0,6 0,8 1 1,2 1,4 1,6
Fundamental peak flux density B (T)
D i f f e r e n c e ( % )
10% 5th, 10% 13th (In Phase)
Fig. 5.14 Effect on iron loss due to introduction of the 5th and 13th harmonic (Ref. Sinusoidal)

8/3/2019 Iron Losses Sohail Thesis KLAR 230408
http://slidepdf.com/reader/full/iron-losses-sohail-thesis-klar-230408 60/70
Master Thesis
Doc. Title: Revision Page
Effect of harmonics on iron losses 01 60/70
5.3.2.2 Effect of phase angle
Generally small decrease in observed due to phase shift of 90 degrees phase shift. This smalldecrease is due to decrease in the peak flux density as already stated.
-10
-8
-6
-4
-2
0
2
0 0,2 0,4 0,6 0,8 1 1,2 1,4 1,6
Fundamental peak flux density B (T)
D i f f e r e n c e ( %
)
90 degrees phase shift
Fig. 5.15 Effect of the phase angle on iron loss (Ref. phase shift zero degree)
5.4 Conclusion
The overall effect of two flux harmonics is the same for all three fundamental frequencies (i.e.
30Hz, 50Hz and 70Hz). However it is noted that the increase in iron loss is slightly increasing
with increase in fundamental frequency (e.g. increase in loss in case of 50 Hz fundamental
frequency is slightly more than 30Hz while it is slightly less than 70Hz) as shown in figure 5.15.
This is due to the fact that with increasing fundamental frequency, eddy current and excess
losses becomes more and more effective or in other words; the percentage of eddy current and
excess losses in total iron loss increases with increasing fundamental frequency.In case of low order harmonic a change of phase angle may result in either a decrease or an
increase in iron loss. There may be two reasons for such a behavior.
• The main reason is “change in phase angle results into a change in total peak
flux density (fundamental + harmonic)”.
• The area of the minor loops can also be affected with a phase shift. However,
most of the time it has a less important role to play regarding the iron loss.
In case of higher order harmonics both of the factors mentioned above do not exist, hence a
change in phase angle does not change the iron loss.
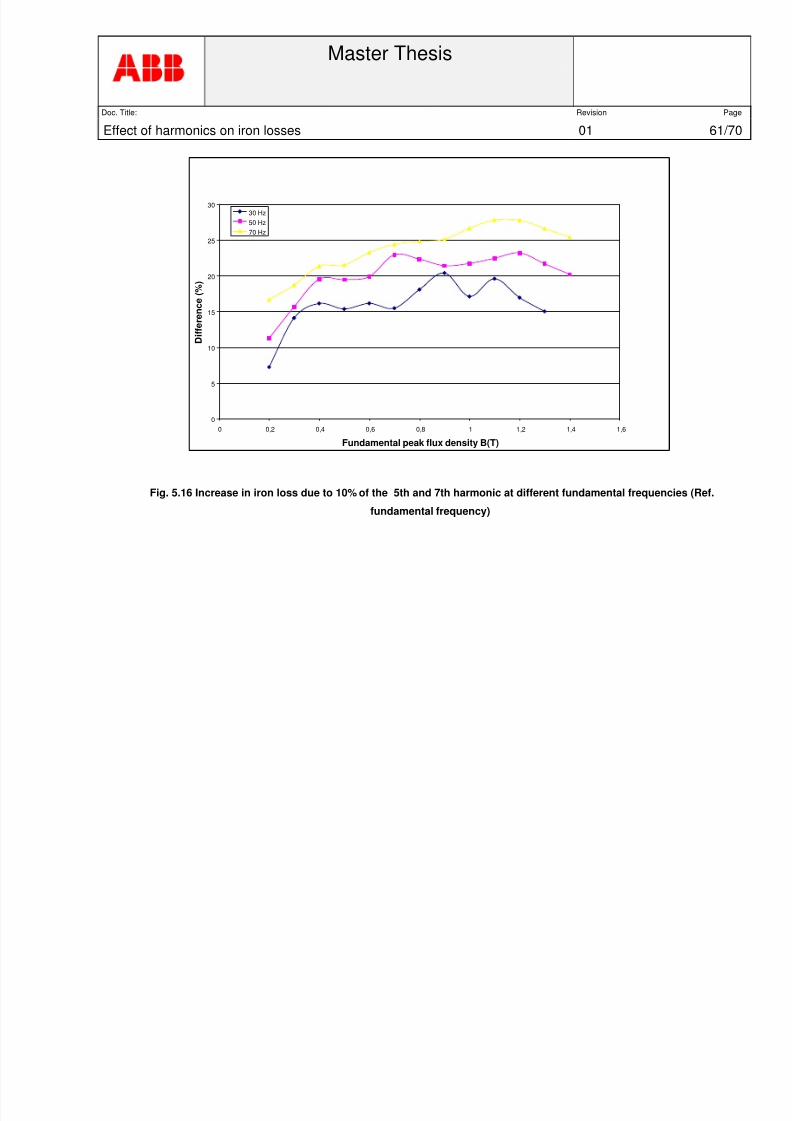
8/3/2019 Iron Losses Sohail Thesis KLAR 230408
http://slidepdf.com/reader/full/iron-losses-sohail-thesis-klar-230408 61/70
Master Thesis
Doc. Title: Revision Page
Effect of harmonics on iron losses 01 61/70
0
5
10
15
20
25
30
0 0,2 0,4 0,6 0,8 1 1,2 1,4 1,6
Fundamental peak flux density B(T)
D i f f e r e n c e ( % )
30 Hz
50 Hz
70 Hz
Fig. 5.16 Increase in iron loss due to 10% of the 5th and 7th harmonic at different fundamental frequencies (Ref.
fundamental frequency)
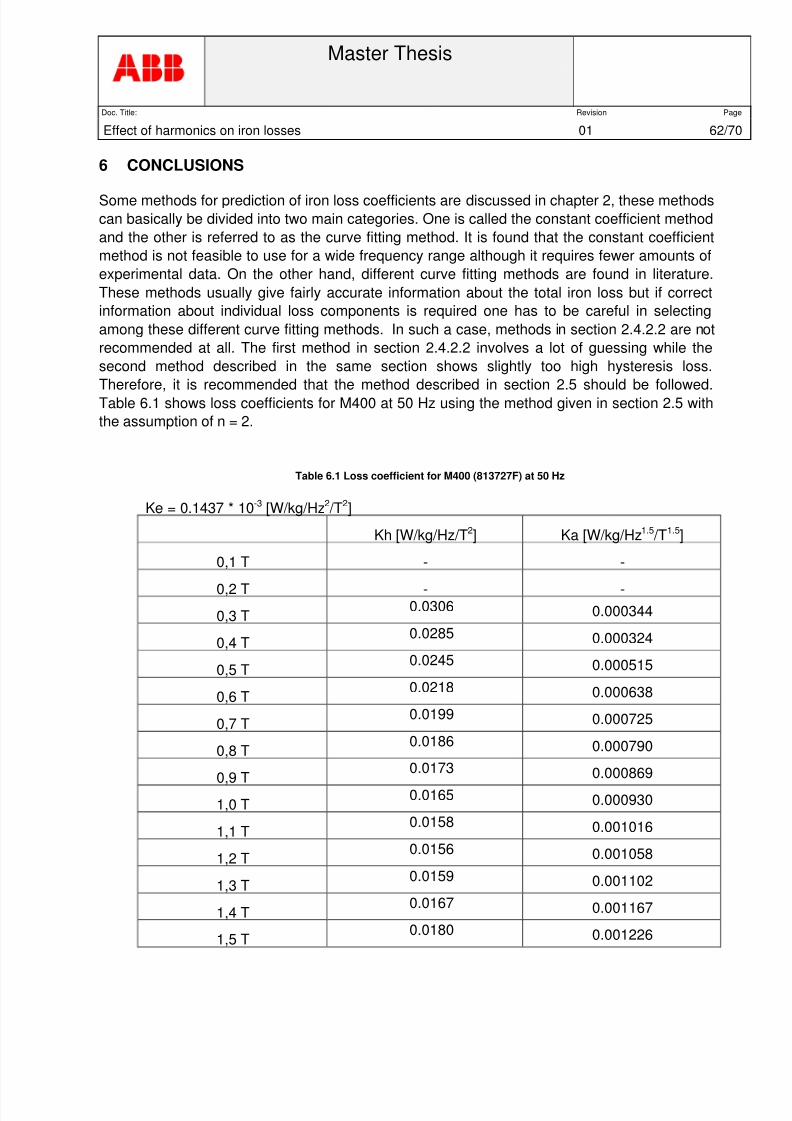
8/3/2019 Iron Losses Sohail Thesis KLAR 230408
http://slidepdf.com/reader/full/iron-losses-sohail-thesis-klar-230408 62/70
Master Thesis
Doc. Title: Revision Page
Effect of harmonics on iron losses 01 62/70
6 CONCLUSIONS
Some methods for prediction of iron loss coefficients are discussed in chapter 2, these methods
can basically be divided into two main categories. One is called the constant coefficient method
and the other is referred to as the curve fitting method. It is found that the constant coefficient
method is not feasible to use for a wide frequency range although it requires fewer amounts of
experimental data. On the other hand, different curve fitting methods are found in literature.
These methods usually give fairly accurate information about the total iron loss but if correct
information about individual loss components is required one has to be careful in selecting
among these different curve fitting methods. In such a case, methods in section 2.4.2.2 are not
recommended at all. The first method in section 2.4.2.2 involves a lot of guessing while the
second method described in the same section shows slightly too high hysteresis loss.
Therefore, it is recommended that the method described in section 2.5 should be followed.Table 6.1 shows loss coefficients for M400 at 50 Hz using the method given in section 2.5 with
the assumption of n = 2.
Table 6.1 Loss coefficient for M400 (813727F) at 50 Hz
Ke = 0.1437 * 10-3 [W/kg/Hz2 /T2]
Kh [W/kg/Hz/T2] Ka [W/kg/Hz1.5 /T1.5]
0,1 T - -
0,2 T - -
0,3 T0.0306 0.000344
0,4 T0.0285 0.000324
0,5 T0.0245 0.000515
0,6 T0.0218 0.000638
0,7 T0.0199 0.000725
0,8 T0.0186 0.000790
0,9 T
0.0173 0.000869
1,0 T0.0165 0.000930
1,1 T0.0158 0.001016
1,2 T0.0156 0.001058
1,3 T0.0159 0.001102
1,4 T0.0167 0.001167
1,5 T0.0180 0.001226

8/3/2019 Iron Losses Sohail Thesis KLAR 230408
http://slidepdf.com/reader/full/iron-losses-sohail-thesis-klar-230408 63/70
Master Thesis
Doc. Title: Revision Page
Effect of harmonics on iron losses 01 63/70
In general similar kind of trends is observed in the presence of one or two harmonics. It is found
that an increase in peak flux density, generation of minor loops and involvements of high
frequencies are the main reason of increase in losses with distorted waveforms. Table 6.2
describes the maximum increase of iron loss with an introduction of 20% of different order
harmonics at 50 Hz fundamental frequency.
Table 6.2 Maximum increase in iron loss due to an introduction of 20% of different orders of harmonics at 50 Hz
fundamental frequency.
Harmonic order 5th 7th 11th 13th
Maximum
increase58% 85% 168% 222%
It is important to note that the eddy current and excess losses increase with the introduction of
harmonics while hysteresis loss is less affected. The effect of harmonics on increase in iron loss
is observed with increasing harmonic amplitude as well as harmonic order. Further, it is found
that the higher the fundamental frequency the higher will be the increase in iron loss, as seen in
Table 6.3.
Table 6.3 Percentage increase in iron loss with the introduction of 10% of the 5th and 7th harmonics at different
fundamental frequencies
0.8 T 0.9 T 1.0 T 1.1 T 1.2 T
30 Hz 18 20 17 20 17
50 Hz 22 21 22 22 23
70 Hz 25 25 27 28 28
Section 2.5 discusses different methods to predict iron loss with distorted flux waveforms.
Following the time domain expression (6.1) to predict iron loss in such conditions isrecommended.
+
+= dt
dt
dB
T K dt
dt
dB
T K PP
aehTotal
5.12
11 6.1
It is found that no additional information is needed. However, the correct prediction of loss
coefficients is very important. Use of the time domain equation accounts for change in phase
angle in the resultant waveform. However, the change in iron loss due to a phase angle shift is
even bigger in reality. Therefore, loss coefficients need to be changed accordingly. It was found
that the percentage change (increase/decrease) in iron loss due to a phase angle shift is nearly
equal to the percentage change in peak flux density (e.g. in case of which 20% of the 5 th
harmonic 90 degrees phase shift results in average decrease of 3% in iron loss that is nearly
equal to the percentage decrease in peak flux density).

8/3/2019 Iron Losses Sohail Thesis KLAR 230408
http://slidepdf.com/reader/full/iron-losses-sohail-thesis-klar-230408 64/70
Master Thesis
Doc. Title: Revision Page
Effect of harmonics on iron losses 01 64/70
7 FUTURE WORK
For continuation of this work the following aspects should be considered:
• The impact of rotational iron losses.
• Defining an imperial coefficient to account for phase angle effects, or some other
method could be followed.
• Other iron materials, having different grades and thickness should be studied.
• Implementation of the recommended expression in suitable software and
calculation of iron loss in the complete motor.
8/3/2019 Iron Losses Sohail Thesis KLAR 230408
http://slidepdf.com/reader/full/iron-losses-sohail-thesis-klar-230408 65/70
Master Thesis
Doc. Title: Revision Page
Effect of harmonics on iron losses 01 65/70
8 REFERENCES
[1] Julus Saitz “Calculation of Iron losses in Electrical Machines”,PhD dissertation at
Helsinki University of Technology. March 1997.
[2] Chandur Sadarangani “Electrical Machines”Department of Electric Power
Engineering, Royal Institute of Technology, Stockholm, August 2000
[3] Anthony J. Moses “Loss Prediction in Electrical steel Laminations and Motor
Core”, Cardiff university, Cardiff school of Engineering, Cardiff/ U.K.
[4] Dan M. lonel “On the variation with flux and frequency of the core loss coefficients
in Electrical Machines”, IEEE transactions on Industry Applications vol. 42 no. 3,
pp658-667, May/june 2006
[5] G. Bertotti, “General properties of power losses in soft ferromagnetic materials”,
IEEE transaction on magnetics, vol.24, no. 1, pp621-630, jan 1988.
[6] E. Della Torre, “Magnetic Hysterisis”, Piscataway, NJ: IEE, 200. 1998.
[7] H. Domeki “Investigation of benchmark model for estimating iron loss in rotating
machine” IEEE transaction on magnetics, Vol 40, no 2 pp794-797, Mar 2004”
[8] Mircea Popescu “A best fit model of power losses in cold rolled moter lamination
steel operating in a wide range of frequency and magnetization”, IEEE trans on
magnetics. Vol.43, no. 4, pp 1753-1756 April 2007.
[9] Lotten Tsakani “Core losses in Motor laminations exposed to high frequency or
nonsinusoidal excitation”, IEEE transaction on Industrial applications. Vol40, no.
5, pp -1325-1332 sep-oct 2004.
[10] M. S. Lancarotte “Predection of magnetic losses under sinusoidal or
nonsinusoidal induction by analysis of magnetization rate”, IEEE transaction on
Energy conversion. Vol 16, pp. 174-179.
[11] Andre G. Torres “A generalized Epstein test method for the computation of core
losses in induction motors” IEEE transaction on industrial electronics, pp 1150-
1155, 2002.
[12] Lotten T. Mthombeni “Lamination core loss measurements in machines operating
with PWM or non-sinusoidal excitation”,IEEE Electric machines and drivesconference. Pp-742-748, 2003.
[13] Aldo Boglietti “About the possibility of defining a standard method for iron loss
measurment in soft magnetic material with inverter supply”, IEEE transaction on
industry applications vol. 33, no. 5, sept. 1997.
[14] A. Boglietti “The annealing influence onto the magnetic and energetic properited
in soft magnetic material agter punching process”, IEEE Electric machines and
drives conference , pp 503- 508, 2003.
[15] T. Nakata “Numerical analysis and experimental study of the error of magnetic
field strength measurements with single sheet testers”, IEEE transaction onmagnetics, Volume 22, pp 400 – 402, Sep 1986.

8/3/2019 Iron Losses Sohail Thesis KLAR 230408
http://slidepdf.com/reader/full/iron-losses-sohail-thesis-klar-230408 66/70
Master Thesis
Doc. Title: Revision Page
Effect of harmonics on iron losses 01 66/70
[16] Liu Shuo “Study of single sheet tester for A.C magnetization characteristics
measurment”, IEEE transaction on Electrical machines and systems, Volume
1, pp 361 – 364, 18-20 Aug. 2001.
[17] Yicheng Chen “An improved formula for lamination core loss calculations in
machines operating with high frequency and high flux density excitation”, IEEE
transaction on industry applications, pp 759-766, 2002.
[18] J. D Lavers “A simple method of estimating the minor loop Hystereses loss in thin
laminatios”, IEEE transactions on magnetics, vol. MAG-14, No. 5, September
1978.
[19] Edoardo Barbisio “Predicting loss in magnetic steels under arbitrary indiction
waveform and with minor Hystereses loops”, IEEE transactions on magnetic,
vol40, no 4, July 2004.
[20] A. Boglietti “Iron loss prediction with PWM supply:an overview of proposed
methods from and engineering applocation point of view”, IEEE transactions on
magnetics , 2007.
[21] M. Amar “A general formula for prediction of iron losses under nonsinusoidal
voltage waveform”, IEEE transactions on magnetic, vol 31, no 5, September 1995.
[22] Marubbini J. “Low voltage high current PM traction motor design using recent core
loss results”, IEEE transaction on industry applications,pp 1560-1566, 2007
[23] A. Broddefalk “Dependence of the power losses of a non-oriented 3% Si-steel on
frequency and guage”, Journal of Magnetism and Materials 304 (2006) e586-e588.
[24] P. C. Sen “Principles of electric machines and power electronics”, Second edition,
Queens university, Kingston, Ontario, Canada.

8/3/2019 Iron Losses Sohail Thesis KLAR 230408
http://slidepdf.com/reader/full/iron-losses-sohail-thesis-klar-230408 67/70
Master Thesis
Doc. Title: Revision Page
Effect of harmonics on iron losses 01 67/70
9 ENCLOSURES
9.1 Appendix – 1
-200 -150 -100 -50 0 50 100 150
-1
-0.5
0
0.5
1
B (T)
H(A/m)
50 Hz 30 Hz
Fig. 1 BH loop with the 5th harmonics at different frequencies
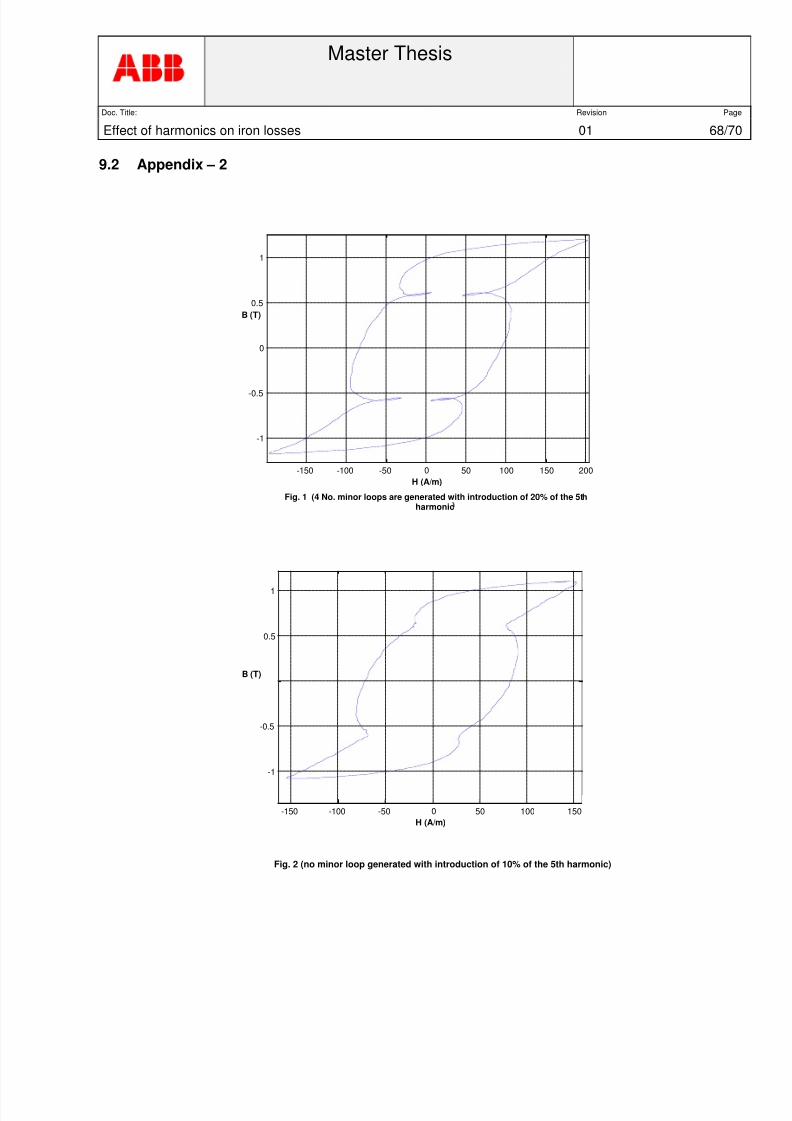
8/3/2019 Iron Losses Sohail Thesis KLAR 230408
http://slidepdf.com/reader/full/iron-losses-sohail-thesis-klar-230408 68/70
Master Thesis
Doc. Title: Revision Page
Effect of harmonics on iron losses 01 68/70
9.2 Appendix – 2
-150 -100 -50 0 50 100 150
-1
-0.5
0.5
1
H (A/m)
B (T)
-150 -100 -50 0 50 100 150 200
-1
-0.5
0
0.5
1
H (A/m)
B (T)
Fig. 1 (4 No. minor loops are generated with introduction of 20% of the 5thharmonic
Fig. 2 (no minor loop generated with introduction of 10% of the 5th harmonic)

8/3/2019 Iron Losses Sohail Thesis KLAR 230408
http://slidepdf.com/reader/full/iron-losses-sohail-thesis-klar-230408 69/70
Master Thesis
Doc. Title: Revision Page
Effect of harmonics on iron losses 01 69/70
9.3 Appendix – 3
-200 -100 0 100 200 300
-1
-0.5
0
0.5
1
H (A/m)
B (T)
-250 -200 -150 -100 -50 0 50 100 150 200 250 -1.5
-1
-0.5
0
0.5
1
1.5
B (T)
H (A/m)
Fig. 1 (4 No. minor loops generated with introduction of 20% of the 5th harmonic)
Fig. 2 6 No. minor loops generated with introduction of 20% of the 7th harmonic
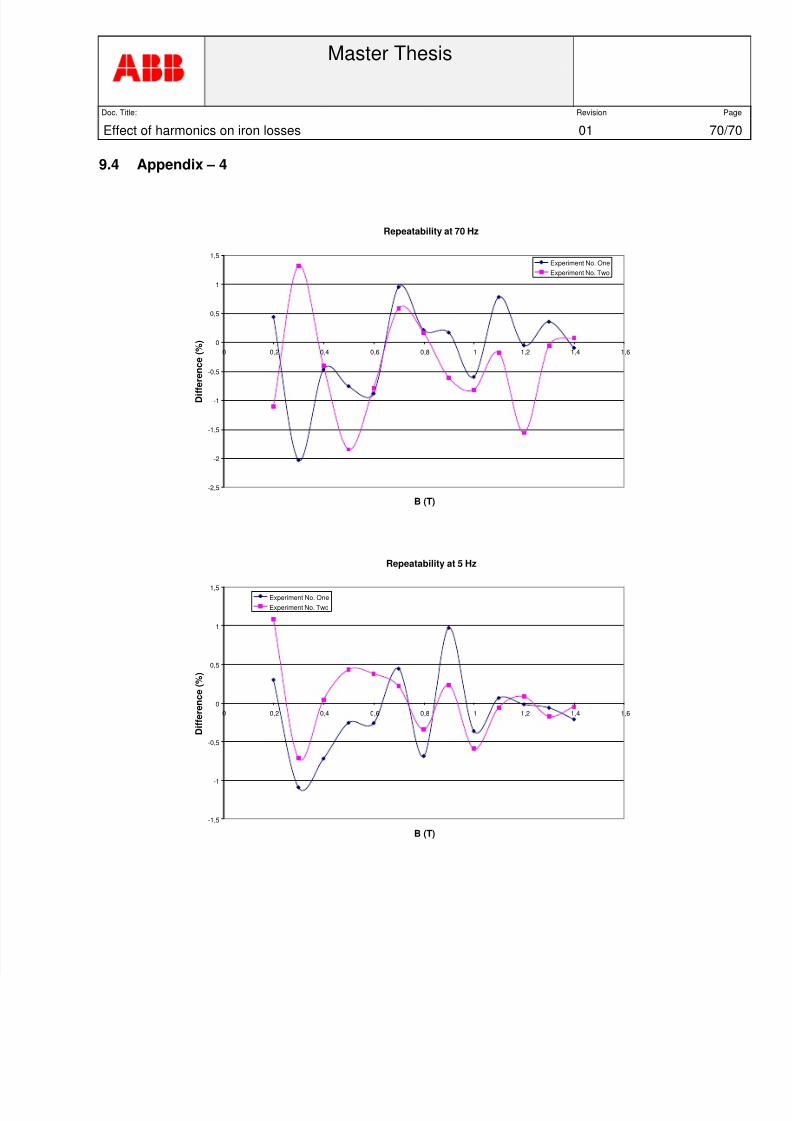
8/3/2019 Iron Losses Sohail Thesis KLAR 230408
http://slidepdf.com/reader/full/iron-losses-sohail-thesis-klar-230408 70/70
Master Thesis
Doc. Title: Revision Page
Effect of harmonics on iron losses 01 70/70
9.4 Appendix – 4
Repeatability at 70 Hz
-2,5
-2
-1,5
-1
-0,5
0
0,5
1
1,5
0 0,2 0,4 0,6 0,8 1 1,2 1,4 1,6
B (T)
D i f f e r e n c e ( % )
Experiment No. One
Experiment No. Two
Repeatability at 5 Hz
-1,5
-1
-0,5
0
0,5
1
1,5
0 0,2 0,4 0,6 0,8 1 1,2 1,4 1,6
B (T)
D i f f e r e n c e ( % )
Experiment No. One
Experiment No. Two