Embed Size (px)
Citation preview
CB.EN.P2MFG15018
IRON –CARBON PHASE DIAGRAM

Definition of structures:
Various phases that appear on the Iron-
Carbon equilibrium phase diagram are as
under:
• Austenite
• Ferrite
• Pearlite
• Cementite
• Martensite
• Ledeburite
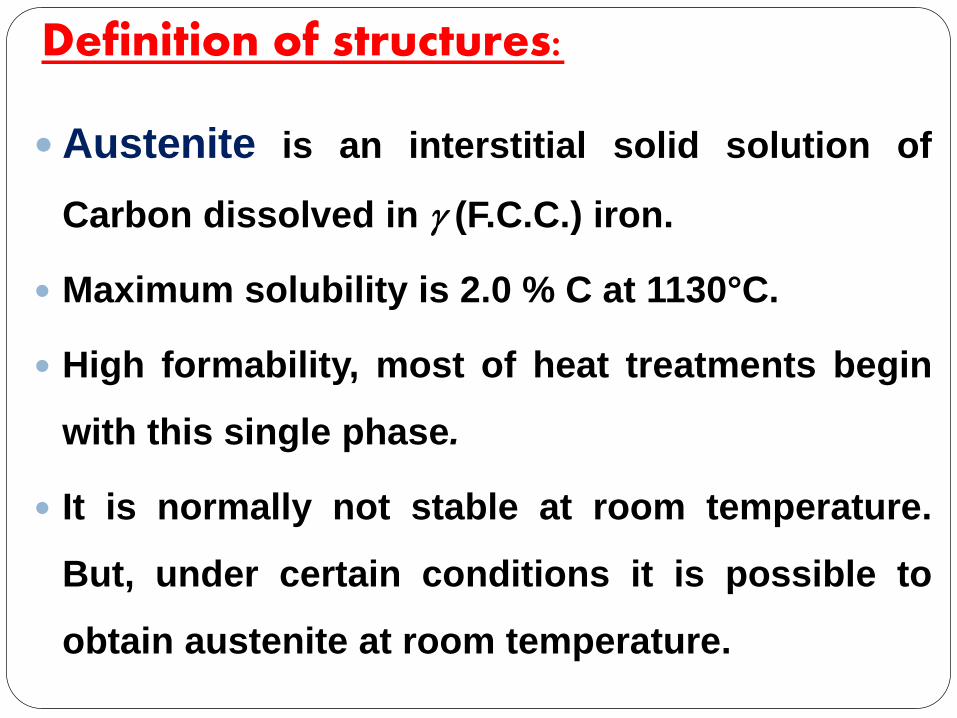
Definition of structures:
Austenite is an interstitial solid solution of
Carbon dissolved in (F.C.C.) iron.
Maximum solubility is 2.0 % C at 1130°C.
High formability, most of heat treatments begin
with this single phase.
It is normally not stable at room temperature.
But, under certain conditions it is possible to
obtain austenite at room temperature.

Austenite
Average properties are:
Tensile strength = 150,000 psi;
Elongation = 10 percent in 2 in.;
Hardness = Rockwell C 40, approx;
and
toughness = high

Definition of structures:
Ferrite is known as α solid solution.
It is an interstitial solid solution of a small
amount of carbon dissolved in α (BCC) iron.
stable form of iron below 912 deg.C.
The maximum solubility is 0.025 % C at 723C
and it dissolves only 0.008 % C at room
temperature.
It is the softest structure that appears on the
diagram.

Ferrite
Average properties are:
Tensile strength = 40,000 psi;
Elongation = 40 % in 2 in;
Hardness > Rockwell
C 0 or >
Rockwell B 90

Definition of structures:
Pearlite is the eutectoid mixture containing
0.80 % C and is formed at 723°C on very slow
cooling.
It is a very fine platelike or lamellar mixture of
ferrite and cementite.
The white ferritic background or matrix
contains thin plates of cementite (dark).

Pearlite
Average properties are:
Tensile strength = 120,000
psi;
Elongation = 20 % in 2
in.;
Hardness = Rockwell
C20, BHN-300
Definition of structures:
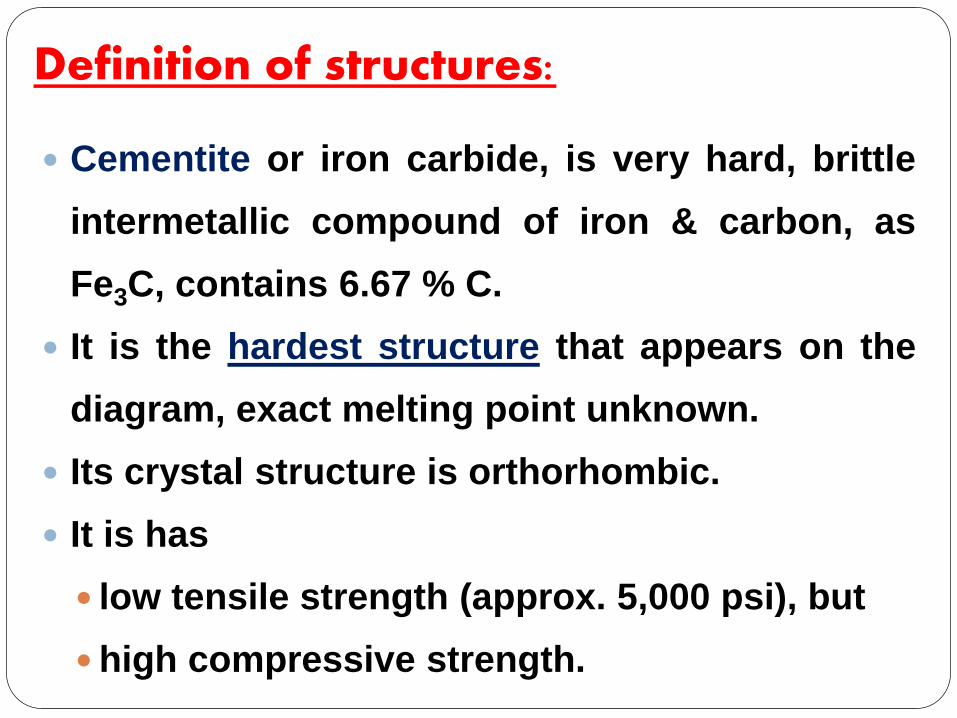
Cementite or iron carbide, is very hard, brittle
intermetallic compound of iron & carbon, as
Fe3C, contains 6.67 % C.
It is the hardest structure that appears on the
diagram, exact melting point unknown.
Its crystal structure is orthorhombic.
It is has
low tensile strength (approx. 5,000 psi), but
high compressive strength.

Definition of structures:
Martensite - a super-saturated solid solution of
carbon in ferrite.
It is formed when steel is cooled so rapidly that
the change from austenite to pearlite is
suppressed.
The interstitial carbon atoms distort the BCC
ferrite into a BC-tetragonal structure (BCT).;
responsible for the hardness of quenched steel

Definition of structures:
Ledeburite is the eutectic mixture of
austenite and cementite.
It contains 4.3 percent C and is formed at
1130°C.

The Iron-Carbon Diagram:
A map of the temperature at which different
phase changes occur on very slow heating
and cooling in relation to Carbon, is called
Iron- Carbon Diagram.
Iron- Carbon diagram shows -
the type of alloys formed under very slow
cooling,
proper heat-treatment temperature and
how the properties of steels and cast irons
can be radically changed by heat-treatment.

Cooling curve for pure iron

Various Features of Fe-C diagram
Max. solubility of C in ferrite=0.022%
Max. solubility of C in %austenite=2%

IRON –CARBON DIAGRAM

Three Phase Reactions
Peritectic, at 1490 deg.C, with low wt% C
alloys (almost no engineering
importance).
Eutectic, at 1130 deg.C, with 4.3wt% C,
alloys called cast irons.
Eutectoid, at 723 deg.C with eutectoid
composition of 0.8wt% C, two-phase
mixture (ferrite & cementite). They are

Eutectic, Eutectoid, & Peritectic:
• Peritectic - liquid and one solid phase transform to a 2nd solid phase
Solid1 + Liquid ↔ Solid2
+ L ß
Eutectic - liquid transforms to two solid phases
L +
• Eutectoid – one solid phase transforms to two other solid phases
Solid1 ↔ Solid2 + Solid3
+ Fe3C

Simplified Iron-Carbon phase
diagram
austenite ↔ pearlite (mixture of ferrite & cementite)
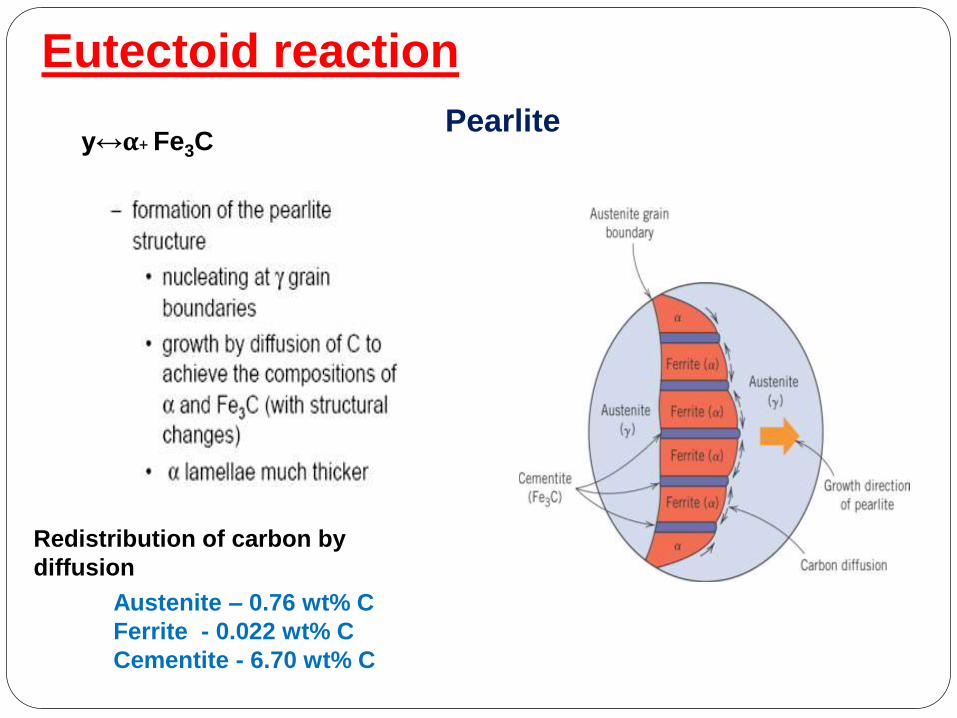
Eutectoid reaction
Redistribution of carbon by
diffusion
Austenite – 0.76 wt% C
Ferrite - 0.022 wt% C
Cementite - 6.70 wt% C
Pearlitey↔α+ Fe3C

The Austenite to ferrite / cementite
transformation in relation to Fe-C
diagram
The Austenite to ferrite / cementite
transformation in relation to Fe-C
diagram
In order to understand the transformation processes,
consider a steel of the eutectoid composition. 0.8%
carbon, being slow cooled along line x-x‘.
At the upper temperatures, only austenite is present,
with the 0.8% carbon being dissolved in solid solution
within the FCC. When the steel cools through 723°C,
several changes occur simultaneously.
The iron wants to change crystal structure from the
FCC austenite to the BCC ferrite, but the ferrite can
only contain 0.02% carbon in solid solution.
The excess carbon is rejected and forms the carbon-
rich intermetallic known as cementite.
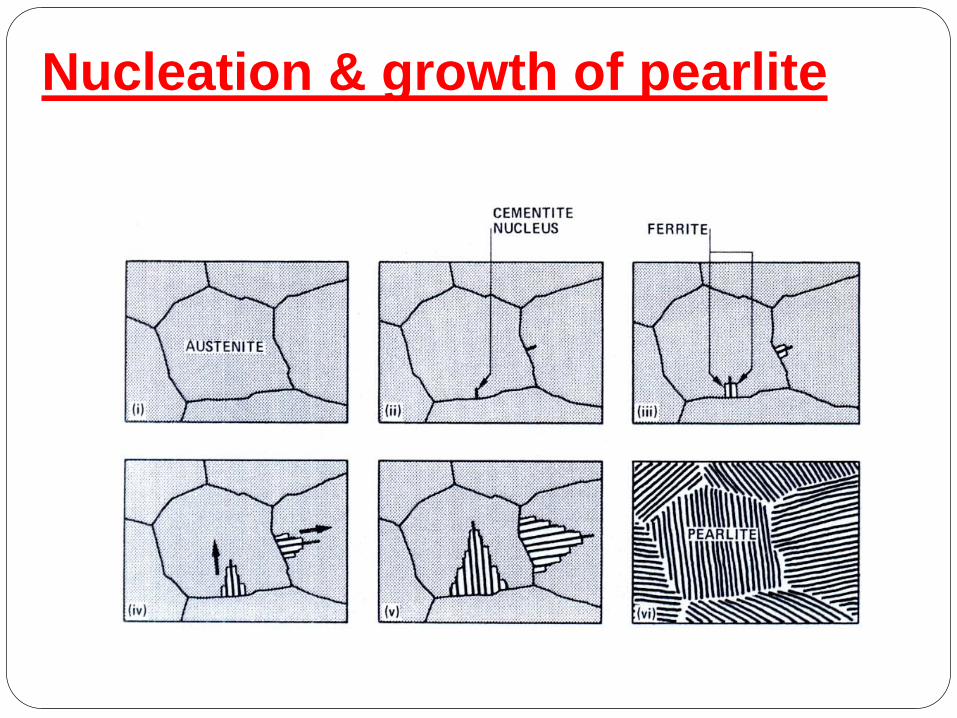
Nucleation & growth of pearlite

Austenite Microstructure for Steel

Schematic picture of the formation and growth of pearlite

Cementite Structure

Martensite Structure:
NEEDLE LIKE
STRUCTURE

Principal phases of steel and their
Characteristics

Cast Iron
-Iron-Carbon alloys of 2.00%C or more are cast
irons.
-Typical composition: 2.0-4.0%C,0.5-3.0% Si,
less than 1.0% Mn and less than 0.2% S.
-Si-substitutes partially for C and promotes
formation of graphite as the carbon rich
component instead Fe3C

SUMMARY
1). Phase diagrams are useful tools to
determine:-the number and types of phases,
the wt% of each phase and the composition
of each phase for a given T and composition
of the system.
2). Binary eutectics and binary eutectoids
allow for a range of microstructures with
different properties

THANK YOU