Embed Size (px)
Citation preview

1
Ireland’s Five-Part Crisis, Five Years On:
Deepening Reform and Institutional
Innovation
Appendices for Report No. 135
October 2013

2
[Type a quote from the document or the summary of an interesting point. You can position the text box anywhere in the document. Use the
Text Box Tools tab to change the formatting of the pull quote text box.]

3
Ireland’s Five-Part Crisis, Five Years On: Deepening Reform and Institutional Innovation
APPENDICES
No. 135 October 2013

4
Table of Contents
Appendix 1: Social Impact of the Crisis 6
Appendix 2: Summary of the Action Plan for Jobs 12
Appendix 3: Delivering Our Green Potential 18
Appendix 4: Activation 22
Appendix 5: Greening the Economy—Wider Spectrum of Ideas 26
Appendix 6: Local Government Reform 30
Bibliography for Appendices 33
List of Tables
Table A1: Components of the Action Plan for Jobs Process 10
Table A5: Greening Economy—A Wider View 23

5

6
Appendix 1: Social Impact of the Crisis
7
Unemployment has increased strongly with the rate1 moving from 4.7 per cent in
quarter three of 2007 to 14.6 per cent in quarter three of 2012, falling slightly to
13.7 per cent in the second quarter of 2013 (CSO, 2013a).
Long-term unemployment (being unemployed continuously for twelve months or
more) is one of the most depressing effects of recessions. This recession has seen
an increase in long-term unemployment (LTU) for both men and women, but
especially for men. Fifty-eight per cent of the unemployed are now LTU, with men
comprising 70 per cent. Although the rate is still much too high, a note of positivity
is that the number of LTU has been declining throughout 2012 and 2013 (from
204,300 in quarter one of 2012, to 175,000 in quarter two of 2103). However, with
the structural changes in the economy, it has been argued that these levels of
unemployment are likely to persist, particularly among the less skilled. NERI
estimates that by 2017, approximately 140,000 people will be cyclically or
structurally unemployed (Collins, 2012).
The percentage of people living in jobless households in Ireland has also risen since
the beginning of the recession, from 15 per cent in 2007 to 22 per cent in 2010. In
addition, a quarter of all children are living in jobless households. This proportion
stands out when compared to other European countries, with the next highest (the
UK) having 13 per cent of its households jobless. Those in jobless households
comprised almost two-thirds of those in consistent poverty in 2010, which is a
worrying issue for policy to address (Watson et al., 2012).
Long-term unemployment and workless households are key challenges for policy
development, although more active labour-market policy may provide some
assistance, as it can provide help for some of these groups to prepare for and enter
the labour force. However, many of those currently distant from the labour force
will need a wide range of supports and services to assist them to enter or return to
it, such as high-quality training, childare, and removal of poverty traps.
National-level statistics hide the fact that there are areas with considerably higher
unemployment rates than the average, and others with considerably lower rates
(Morgenroth, 2012). In quarter three of 2007, there was a difference of two to
three percentage points between the regions with the lowest unemployment rates
(Midlands, Mid-East and South-West regions) and the region with the highest rate
(Border region). That gap has become six to seven percentage points six years later.
1 QNHS, ILO definition.

8
In quarter two of 2013, the highest unemployment rates were in the South-East and
Midlands, while the lowest were in the South-West and Dublin.2
The recession has not only resulted in a substantial rise in unemployment rates in all
regions but also led to divergence in unemployment rates across the regions. This
suggests that there are underlying structural differences across regions. From a
policy perspective, this is important as national policies are unlikely to address these
region and location-specific factors (Morgenroth, 2012).
The impact of job losses has been concentrated on those with the lowest skill set or
those whose skills are linked to a sector of the economy (construction) that is
unlikely to recover to its 2007 peak. Between quarter one of 2007 and quarter one
of 2012, 102,600 elementary-skills jobs and 171,800 skilled trade jobs were lost
(Collins, 2012).
Reflecting the decline in construction-related jobs, men have been more strongly
affected by unemployment than women, with the male unemployment rate at 16
per cent in quarter two of 2013, while that for women was 12 per cent (although
the rate for men is falling, while for women it is rising). There was also a decline in
male self-employment, which fell by 14 per cent between 2006 and 2012 (NESC,
2013). Younger people are strongly affected, with the unemployment rate of those
aged under 25 at 30 per cent in quarter two of 2013. Unemployment is highest for
early school-leavers. In 2011, those under 25 who had completed lower secondary
level had an unemployment rate of 65 per cent, compared to 18 per cent for under
25s with third-level qualifications (CSO, 2012a).
The participation rate of younger people is also falling, due to emigration and
people remaining in education. This reduces their unemployment rate. The
national participation rate fell from 65 per cent in 2007 (quarter three) to 60.5 per
cent in 2013 (quarter two), with the fall particularly large for those aged 15–19,
many of whom have remained in education.3 Net migration is now about 35,000
per year, and in 2011, 43 per cent of emigrants were aged between 15 and 24
(Conefrey, 2013); (CSO, 2012b).
Despite the very high rates of unemployment for those under 25, the actual
numbers affected are somewhat lower than in older age groups, as the labour force
is larger in older age groups. Some 64,700 of those aged under 25 are unemployed,
compared to 85,600 aged 25–34 (QNHS, quarter two of 2013). Altogether, one in
five males aged between 25 and 34 is out of work (Collins, 2012).
For people of all ages, not just those aged 15–24, unemployment rates are much
higher for those without a third-level qualification than for those with one. In 2010
they were as high as 24 per cent for those who had completed lower-secondary
2 The 2007 figures are from CSO (2007); and the Q2 2013 figures are from CSO (2013a).
3 The Q1 2007 figures are from CSO (2007), and the Q2 2013 figures are from CSO (2013a).

9
level, but for those with a third-level qualification the unemployment rates were
below the national average, with 7 to 10 per cent unemployed (NESC, 2011).
However, a feature of this recession compared to previous ones is the higher
educational profile of the unemployed.
Nationals from other countries also experience a higher level of unemployment
compared with Irish nationals, approximately 17 per cent compared to 13 per cent
(quarter two of 2013). And as will be outlined below, those in the South-East,
Midlands and Border regions are more likely to be unemployed.
Households have also experienced a drop in wealth and/or disposable income since
2008. The largest income drops have been experienced by those who are
unemployed, households with children, and students. However, those on the
lowest incomes and most vulnerable to poverty remain those households where no
one is working. The numbers at risk of poverty have increased since 2009. The ‘at
risk of poverty’ rate had been falling until 2009, but saw an increase to 16 per cent
of the population by 2011 (CSO, 2012c). This increase reflects a change in the
income distribution between 2009 and 2011, and a widening gap between those in
the highest and lowest income deciles. As before the economic downturn, children
have a comparatively higher risk of poverty, with older people having less exposure,
although older people living alone (mainly women) and those with ill health or
disabilities have higher poverty levels.
The rate of deprivation has also risen. Deprivation (experiencing two or more types
of enforced deprivation) has more than doubled from 12 per cent in 2007 to 25 per
cent in 2011. The deprivation rate for those at risk of poverty was 43 per cent in
2011, up from 31 per cent in 2007. For those not at risk of poverty, the deprivation
rate was 21 per cent in 2011, an almost three fold increase from 8 per cent in 2007
(CSO, 2013b).
The over-indebtedness of households has also increased due to the economic
downturn. In 2010, nearly one quarter of households were in arrears with at least
one bill or loan, up from 2008 (CSO, 2013b). By June 2013, 13 per cent of
mortgages for principal dwelling houses were in arrears, up from almost zero in
2004 (Central Bank, 2013). Those living in consistent poverty are many times more
likely to be in general arrears than the overall population. Fifty-two per cent of
households in consistent poverty were in arrears with one or more item in 2010,
compared to 22 per cent for all households (CSO, 2013b). There is a strong
correlation between low income and over-indebtedness with lone parents, people
who are unemployed and people who are ill or disabled showing a persistent lack of
resources leading to over-indebtedness. There is also a strong association between
over-indebtedness and low educational level. There has been an increase in well-
educated people finding themselves in arrears particularly where they have a high
level of expenditure in relation to their income, but they still remain less likely than
people with low educational levels to be over-indebted.
Housing need has also increased. By March 2011, 98,318 households were on a
local authority housing waiting list (Housing Agency, 2011), up from 42,946 in 2005,
a 129-per-cent increase. The most common reason for being on the list was ‘unable

10
to meet the cost’ of housing, at 67 per cent. Another 96,803 households were in
receipt of rent supplement in 2011, up from 59,861 in 2006, an increase of 61 per
cent (Department of Social Protection, 2012). Demographic changes will mean that
the need for housing in suitable locations will also increase from 2015 on. At the
same time, the number of unfinished housing developments, or ‘ghost estates’, in
2012 was 1,770. There are implications for home owners living in poorly finished
estates that in some instances have few neighbours; no street lighting, paths, or
green areas; and are located a good distance away from amenities or services
(Kitchin et al., 2010).
Emigration has also risen considerably, with 87,000 persons emigrating in the year
to April 2012. This has been partially offset by continuing high levels of
immigration, of around 50,000 per year since 2010, reducing the net migration
figure to about 35,000 per year. Irish nationals account for over 50 per cent of
emigrants, and in 2011, 88 per cent were in the 15–44 age group (Conefrey, 2013).
While the emigration of young Irish people may provide them with good
opportunities overseas and reduce unemployment payments in Ireland, their skills
and potential are a loss to the economy and, if their departure is out of necessity
rather than choice, can have a detrimental effect on their families and local
communities. Furthermore, sustained emigration of people of working age
increases the age-dependency ratio and weakens the State’s longer-term fiscal
sustainability.
The impacts of the economic crisis and subsequent fiscal adjustments have been
shown to affect some people’s psychological and physical health. For example, the
World Health Organisation has shown that unemployment, debt and other financial
difficulties negatively impact on family relationships and mental health.
Nonetheless, the impact of financial and other stress on individuals and their
families is mediated by their resilience. There have been changes in satisfaction
with life in Ireland since the crisis began, with 92 per cent of Irish people either very
or fairly satisfied with their lives in 2005, but by 2012 this percentage had fallen to
86 per cent. The proportion feeling not very or not at all satisfied with life increased
from 7 per cent in 2005 to 14 per cent in 2012.4
Budgets from 2009 to 2014 have resulted in income reductions across the board,
but overall the distributional impacts are progressive, with reductions of 4 per cent
for the lowest-income group and reductions of 10 per cent for the highest-income
group (Callan et al., 2012). However, Callan et al. (2013) also note that there is a
strong distinction between the budgets for 2009 (October 2008 and April 2009) and
those for later years. The October 2008 Budget imposed high and progressive levies
on income (later replaced by Universal Social Charge, USC), and a progressively
structured public-service pension levy. It also raised welfare payment rates by 3 per
4 Assembled from Eurobarometer survey data,
http://ec.europa.eu/public_opinion/cf/showtable.cfm?keyID=1&nationID=11,1,27,28,17,2,16,18,13,32,6,3,4,2
2,33,7,8,20,21,9,23,34,24,12,19,35,29,26,25,5,14,10,30,15,&startdate=2005.06&enddate=2012.05, accessed on 07/02/13.

11
cent. Since then, budgets have been either regressive or broadly proportional.
When the effects of Budgets 2009 to 2012 are examined by family type, families
with someone in employment have experienced a 9 to 12 percentage-point loss in
their income. In general, family types dependent on welfare experienced smaller
losses of 2 to 7 per cent (bearing in mind that their income is generally smaller),
with the exception of single unemployed persons, who saw their income reduce by
11 per cent over the period.

12
Appendix 2: Summary of the Action Plan for Jobs

13
As part of its response to the employment challenge, the Government launched its
second Action Plan for Jobs 2013 (APJ). It contains 333 actions and engages 16
government departments and 46 agencies.
The main elements of the APJ are:
Disruptive Reforms: These are identified as areas with the potential to have a
significant impact on job creation or where Ireland can profit from a natural
advantage or opportunity that presents itself in the economy (APJ: 9). There are
seven ‘disruptive themes’: ‘Big Data’ and analytics; ICT skills availability;
integrated licensing application system; online businesses; the JobsPlus initiative;
energy efficiency; and national health innovation hub.
Pathway to Work: It provides a short summary of this government initiative, its
basic aims and progress achieved to date in areas such as client profiling,
establishment of Intreo offices and integration of FÁS services into the
Department of Social Protection.
Access to Finance: It provides an overview of developments in relation to
finance for micro, small and medium enterprise.
Competitive Advantage: It discusses the various ways by which Ireland can build
competitive advantage: research and innovation including the prioritisation of
14 research themes and revised legislation to permit Science Foundation Ireland
(SFI) to fund ‘applied research’; cost competiveness, aligning skills with
enterprise needs, infrastructure investment and through the development of
sensible regulation.
Entrepreneurship: It highlights the role of competitive-start funding, non-
financial supports, female entrepreneurship and the attraction of international
entrepreneurs. Key institutional developments are the launch, in 2013, of Local
Enterprise Offices (LEOs) that will provide support to micro-enterprises through
local authorities; and the establishment of a Centre of Excellence for Micro-
enterprise and Small Business within Enterprise Ireland. A national entrepreneur
development programme, New Frontiers, has been established and will be
delivered at local level by the Institutes of Technology.
Indigenous Business: It focuses attention on the role of Irish companies in
supporting export-led job creation. It proposes action to expand this role by
scaling Irish enterprises into global players and forging partnerships in business,

14
research collaboration and new ventures overseas. The key institutional
development is the establishment of a senior management team to allow IDA
and Enterprise Ireland (EI) to work together to attract inward entrepreneurs,
maximise procurement opportunities and strengthen linkages between
multinational corporations (MNCs) and Small and Medium Enterprises (SMEs).
Foreign Direct Investment: IDA launched a five-year strategy, Horizon 2020, in
2010. It is a dual strategy focused on attracting new investment and jobs and
helping to drive company transformation to protect and retain jobs in Ireland.
The target is to attract 640 new investments and create 62,000 jobs (gross). In
the first three years 419 investments have been secured and 36,332 jobs (gross)
have been created. The target of creating 50 per cent of investments outside
Dublin is proving challenging (APJ: 98).
Employment at Community and Local Level: The APJ includes some aspects of
local government reform and also includes additional measures such as the role
of EI in LEOs and the New Frontier’s programme; as well as supports for local
initiatives. The APJ highlights the role of local businesses in providing
employment and local initiatives and campaigns taken directly by communities
and business (e.g. Shop Local Campaigns).
Finally, the report considers specific sectoral opportunities in the following areas:
manufacturing, agriculture, food and marine, green economy, construction and
property, tourism, retail, creative services, aviation services, international financial
services and cloud computing.
Action Plan for Jobs: Process
There is an overarching annual policy statement, the Action Plan for Jobs, and also
supporting plans and statements such as the green economy report, Delivering Our
Green Potential (Department of Jobs, 2012). The success of these plans increasingly
depends on a significant level of engagement across a myriad of sectors, involving
several government departments, agencies and many companies and other
stakeholders. The issue of how government manages such a network and diverse
set of sectors is a critical and long-standing challenge. What has emerged, thus far,
is a process with three key elements: an overarching plan; a monitoring committee
and secretariat; and steering or implementation groups. Table A1 provides a
summary of each.

15
Table A1: Components of the Action Plan for Jobs Process
Action Plan
for Jobs
Annual plans are developed by Department of Jobs, Enterprise and Innovation
and Forfás.
Plans are developed in consultation with government departments and
agencies. There is also a process of consultation with industry. Plans were
published in 2012 and 2013.
APJ 2013 contains 333 actions and engages 16 government departments and 46
agencies.
Monitoring
Committee
The monitoring committee is jointly chaired by the Secretary Generals of
Department of An Taoiseach and Jobs, Enterprise and Innovation. Its members
are drawn from those departments and the Department of Public Expenditure
and Reform.
The function of the monitoring committee is the monitor the implementation of
the APJ. It is supported in this work by a small secretariat that is based in the
Department of An Taoiseach but includes staff drawn from Forfás.
Steering
Groups
A number of steering groups, chaired by Assistant Secretaries, have been
established to support the work on the seven disruptive themes. Six senior
executives from industry are members of the steering groups, with some
serving on more than one group.
The plans are developed by the Department of Enterprise, Jobs and Innovation and
Forfás. There was a public phase of consultation that led to over 600 submissions
for the APJ 2013. However, in reality given its focus, the submissions that tend to
dominate attention are submitted by those closest to the needs of business. There
is also a process of consultation with industry.
The government endorses and commits to implementing the plans. The
management of the process is carried out by a monitoring committee, located
within the Department of the Taoiseach. It is supported by a small secretariat. The
activities of the monitoring committee and its secretariat include:
Breaking Down Plans: The annual plan is re-worked into quarterly actions that
are then circulated by the Secretary General of the Department of the Taoiseach
to each department.
Advance Warning: A warning system is in place to track work during each
quarter. This involves checking at the end of the first month to see if plans are
on track or not; and ‘flash report’ at the end of month two to identify potential
problems. The latter forms the basis for a memo to cabinet.

16
Referral: Plans and problem areas in particular are referred to various bodies
that can help provide fresh impetus. These include various cabinet
subcommittees and via the Cabinet directly to responsible ministers.
Reporting and Review: Progress is classified as either ‘delayed’ or ‘complete’.
Where projects are delayed, sufficient information must be provided to allow
the monitoring committee assess the validity of the reason for delay. The
Secretariat use its expertise—or contacts where areas are outside their own
expertise—to assess plans and their ambition. They will also occasionally follow
up on specific outputs—such as a workshop or trade event—to identify the
impact on sales or jobs.
Case-studies: In a number of areas the Secretariat has provided short case
studies to help communicate the impact the Plans are having at the front line.
Targets: Of 300 actions at least half could be described as outcome-orientated,
though only a very small number of the actions refer to actual job creation
targets.5
The process relies on departments and agencies to provide detailed analysis in
relation to progress, almost on a monthly basis. Progress reports are produced on a
quarterly basis. In particular, if plans are delayed, sufficient information must be
available to allow the Secretariat and the Monitoring Committee to understand and
verify reasons for inaction. Quarterly progress reports are now complied and in
these reports stakeholders report on specific quarterly actions, related to each
action in the Annual Plan. As well as providing a status update they provide a
commentary in relation to the action. In most cases the commentary highlights the
impact of the action or at least the expected impact of a measure taken. Thus, for
example, commentary related to Action 53 (Tax Plan for SMEs) notes that change to
corporation tax and incentives in Budget 2013 are expected to help cash flow
among SMEs and reduce the administrative burden.
5 Given that responsibility for job creation is seen to lie with business then there is some justification for this.

17

18
Appendix 3: Delivering Our Green Potential
19
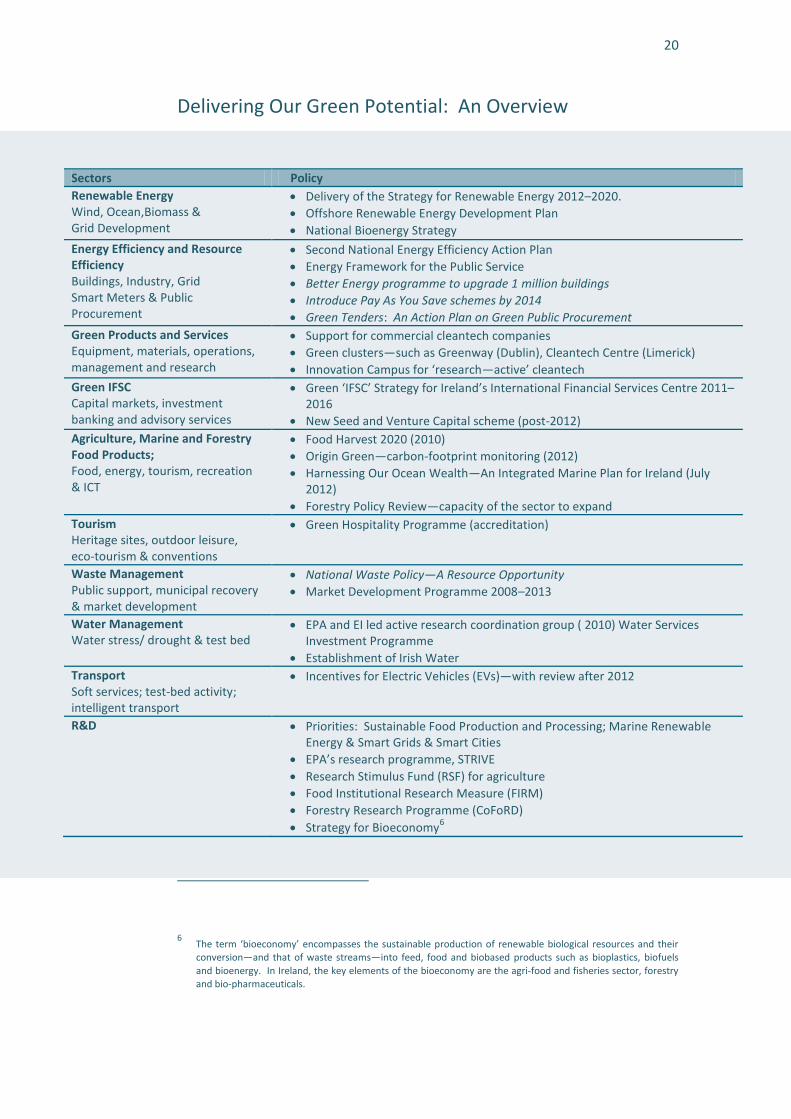
Delivering Our Green Potential is a government policy statement that examines the
potential of the green economy in Ireland.
The statement covers ten discrete sectors including an R&D sector that cuts across
many of the other sectors. For each of these sectors the statement identifies the
work that is taking place. It draws attention to existing policy documents covering
these sectors and new policy work. In addition, the policy statement identifies a
number of enablers or cross-cutting themes. These include technological
convergence—particularly between ICT and biotechnology; training and education;
standards, biodiversity and branding.
Biodiversity is included as one enabler of the green economy. The report states
that there is a clear link between the protection of Ireland’s biodiversity and the
economy (APJ: 42). Sectors such as agriculture, forestry, tourism, marine fisheries
and aquaculture are seen as reliant on effective conservation and management of
natural resources. The statement notes that Ireland’s national ecosystem services
have been valued (Department of Environment, Heritage and Local Government,
2008), in terms of their productive output and human utility, at over €2.6bn per
year. In this context, the report argues that ‘implementation’ of Ireland’s national
Biodiversity Plan (Actions for Biodiversity 2011–2016) will play a key role in
protecting our diversity and ecosystems.
20
Delivering Our Green Potential: An Overview
Sectors Policy
Renewable Energy Wind, Ocean,Biomass & Grid Development
Delivery of the Strategy for Renewable Energy 2012–2020.
Offshore Renewable Energy Development Plan
National Bioenergy Strategy
Energy Efficiency and Resource Efficiency Buildings, Industry, Grid Smart Meters & Public Procurement
Second National Energy Efficiency Action Plan
Energy Framework for the Public Service
Better Energy programme to upgrade 1 million buildings
Introduce Pay As You Save schemes by 2014
Green Tenders: An Action Plan on Green Public Procurement
Green Products and Services Equipment, materials, operations, management and research
Support for commercial cleantech companies
Green clusters—such as Greenway (Dublin), Cleantech Centre (Limerick)
Innovation Campus for ‘research—active’ cleantech
Green IFSC Capital markets, investment banking and advisory services
Green ‘IFSC’ Strategy for Ireland’s International Financial Services Centre 2011–2016
New Seed and Venture Capital scheme (post-2012)
Agriculture, Marine and Forestry Food Products; Food, energy, tourism, recreation & ICT
Food Harvest 2020 (2010)
Origin Green—carbon-footprint monitoring (2012)
Harnessing Our Ocean Wealth—An Integrated Marine Plan for Ireland (July 2012)
Forestry Policy Review—capacity of the sector to expand
Tourism Heritage sites, outdoor leisure, eco-tourism & conventions
Green Hospitality Programme (accreditation)
Waste Management Public support, municipal recovery & market development
National Waste Policy—A Resource Opportunity
Market Development Programme 2008–2013
Water Management Water stress/ drought & test bed
EPA and EI led active research coordination group ( 2010) Water Services Investment Programme
Establishment of Irish Water
Transport Soft services; test-bed activity; intelligent transport
Incentives for Electric Vehicles (EVs)—with review after 2012
R&D Priorities: Sustainable Food Production and Processing; Marine Renewable Energy & Smart Grids & Smart Cities
EPA’s research programme, STRIVE
Research Stimulus Fund (RSF) for agriculture
Food Institutional Research Measure (FIRM)
Forestry Research Programme (CoFoRD)
Strategy for Bioeconomy6
6 The term ‘bioeconomy’ encompasses the sustainable production of renewable biological resources and their
conversion—and that of waste streams—into feed, food and biobased products such as bioplastics, biofuels
and bioenergy. In Ireland, the key elements of the bioeconomy are the agri-food and fisheries sector, forestry and bio-pharmaceuticals.

21

22
Appendix 4: Activation

23
The Five Strands of Pathways to Work
Two versions of Pathways to Work7 have now been published—the first in February
2012, with a follow-up, Pathways to Work 20138 the following year. Each document
is organised around five strands, which are outlined here:
Engagement with people who are unemployed:
A Probability of Exit (PEX) profiling system has been developed to identify those at
risk of not leaving the Live Register within a short time frame. Those at high risk of
long-term unemployment are provided with one-to-one supports, while those at
medium risk participate in group advisory sessions. Pathways to Work 2013 also
looks at Ireland’s high number of jobless households, and commits to developing
proposals to reconnect those in these households to the labour market.
Provision of activation places and opportunities:
Under this strand, job placement, work experience and their training programmes
are outlined. Pathways to Work 2013 also includes a commitment to develop a
Youth Guarantee.
Incentivising the take-up of opportunities:
Changes to social welfare payments to incentivise taking up of employment are
outlined, including sanctions, and the introduction of the Single Working Age
Assistance Payment, rather than the various payments now existing (Jobseeker’s
Benefit and Allowance, One Parent Family Payment, and Disability Allowance).
Pathways to Work 2013 also considers secondary benefits, and the extent to which
they may fail to incentivise jobseekers to take up employment.9
7 Available at http://www.welfare.ie/en/downloads/pathwaystowork.pdf.
8 Available at http://www.welfare.ie/en/downloads/Pathways-to-Work-2013.pdf.
9 There are a small number of cases where the replacement rates are high, and ‘the design of unemployment
benefits implies stronger disincentive effects for low-skill workers and the long-term unemployed’ with ‘secondary benefits further worsen[ing] disincentive effects’. Rent Supplement is an example.

24
Working with employers:
Employers will be incentivised to provide jobs for those on the Live Register,
through schemes such as JobBridge and the recently introduced JobsPlus, and also
through the Local Enterprise Offices (LEOs) (due to be established shortly10). For the
first time, Enterprise Ireland, the IDA and the LEOs will be linked, which will provide
more streamlined links between employers and jobseekers.
Reforming institutions:
This section refers to the establishment of Intreo (the new public employment
service), sourcing additional unemployment-support case managers from the
private and voluntary sector, links between education and training and Intreo, and
monitoring of targets on activation.
Pathways to Work 2013 finishes with an Appendix outlining 50 specific action
points, along with the responsible agency and timeline for acting on each point.
Progress is reported quarterly.
Monitoring Pathways to Work
A cabinet subcommittee on economic recovery and jobs has been established, with
the Taoiseach, Tánaiste, Ministers for Social Protection, Education and Skills, and
Public Expenditure and Reform, and the junior Minister for Training and Skills. It has
met monthly to date in 2013. The Senior Officials Group on Labour Market Issues
supports it. An interdepartmental programme board, chaired by the Department of
Social Protection, has also been set up. It comprises representatives from Forfás (in
relation to the Expert Group on Future Skills Needs), FÁS/Solas, and the
Departments of Jobs, Enterprise and Innovation, Social Protection, Education and
Skills, and Public Expenditure and Reform.
In relation to targets and reporting, the cabinet subcommittee on Pathways to Work
receives monthly reports on progress. Quarterly targets for 2013 have also been set
and these are now published on a quarterly basis. These targets are in relation to
both outcomes (e.g. reducing long-term unemployment by 75,000 by the end of
2015); and outputs (e.g. completing personal profiles of those on the Live Register,
providing one-to-one meetings and group advisory sessions). The 2012 version of
Pathways to Work contained no agreement to publish progress under it. However,
as noted above, Pathways to Work 2013 contains a 50-point action plan, which
outlines the responsible agency and timeline for implementing each action point. It
also commits to publishing progress reports on meeting these targets.
10 For more information, see http://www.djei.ie/press/2013/20130520.htm, accessed 03/09/13.

25

26
Appendix 5: Greening the Economy— Wider Spectrum of Ideas
27
The Green Economy Group (GEG) is an ad hoc group of members of the Irish
Environmental Pillar. In 2012, it produced a detailed report that mapped out the
multiple ways in which the economy might be greener (Green Economy Group,
2012). This appendix summarises the GEG’s ideas on various ways of greening the
economy. It makes a first assessment of the distinction between those greening
items that seem close to, or already in line with, current government policy and a
subset which appears more challenging.
Table A5, Part A, lists areas where there is alignment between current policy and
the broader greening view. The issues listed include the definition of green jobs,
procurement, training, innovation and role of co-operatives. This does not mean
that there are not particular ways in which policy in areas such as innovation or
procurement might be made greener. However, in these areas the arguments
associated with broadening the green economy can be seen to be going with the
policy grain. As such, these elements of the broader greening agenda would seem
to have a greater chance of being more easily and immediately integrated into, and
used to improve, existing policy. Additionally, in relation to sectors the GEG
provides some specific suggestions that may not be fully reflected in current policy.
For example, the development of a labour-intensive high-value-added fishing sub-
sectors; a deposit and return scheme; and development of wool and wood-based
insulation products. It maybe feasible that ideas such as these could be considered
in the formulation of the next Action Plan for Jobs.
Part B of Table A5 lists more challenging aspects of the greening agenda. This does
not mean that all of these issues are necessarily at odds with government policy.
An example of an emerging area with potential, but which needs further work, is
the circular economy. A ‘circular economy’ aims to ‘design out’ waste—products
are designed and optimised for a cycle of disassembly and reuse (Ellen MacArthur
Foundation, 2013). In a circular economy the industrial system is restorative or
regenerative by intention and design. It seeks to replace the ‘end-of-life’ concept
with restoration, shifts towards the use of renewable energy, eliminates the use of
toxic chemicals, which impair reuse, and aims for the elimination of waste through
the superior design of materials, products, systems, and, within this, business
models. Unlike in today’s ‘buy-and-consume’ economy, durable products are
leased, rented or shared wherever possible.

28
Table A5: Greening Economy—A Wider View
Part A: With the Grain of Current Government Policy
Green Jobs Jobs in businesses that produce goods and provide services that benefit
the environment or conserve natural resources.
Procurement Prioritise implementation of government policy on green procurement.
Training Youth unemployment and green jobs and innovation and creativity in
training methodologies.
Innovation Greater focus on sustainability and Green Way as prototype.
Co-operatives Update legislation to give level playing field for all enterprises.
Investment
Programmes
Objective assessment, job-creation potential and sustainability indicators
and knock-on effects on public health, and funding for matching resources
for range of EU resources.
Sustainability Step-up in corporate social responsibility and ‘proper enforcement of
environmental law, (including new Wildlife Crime Officers).
Part B: Needs Further Development and Active Exploration
Circular Economy Development of ‘circular economy’ projects such as closed-loop factory,
zero-waste business clusters or communities.
Just Transitions Projects that explore how sustainable development, economic and social
interests are intertwined in specific local circumstances, for example in
the Greenway Cluster in North Dublin.
Monetary Policy Investigate mechanisms for moving away from debt-based money and for
developing local currencies.
Employment Reduce the working week to alleviate unemployment.
Taxation Ensure that both taxes and expenditure, incentivise sustainability and
employment. Key issues include site value tax, taxation of resource use
and pollution.
Reform of the Euro Reform of the euro and its governance so that it is capable of fulfilling its
role in developing a sustainable economy.
Constitution Include the right to clean and healthy environment in terms of
Constitutional Convention.
Source: Derived from Creating Sustainable Employment by Greening the Economy, (Green Economy Group, 2012).

29
In addition, the discussion of taxation—the thrust of which is the need to transition
to more reliance on taxing the use of resources and pollution—is not something
government is likely dispute. It has been argued that the potential for
environmental tax reform in Ireland, based on established practices across Europe,
could be to raise environmental taxes on environmental ‘bads’, such as pollution
and the inefficient use of resources, to 15–20 per cent of total tax revenues by
2015, from 8 per cent today (in 2010) (European Environment Agency, 2010). The
GEG study includes proposals to introduce water charges, water abstraction
charges, levy on aggregates, tax on pollutants, tax on packaging, further energy
and transport taxes and a land value tax (APJ: 7). Some of the specifics discussed
within that report are now part of Government policy, such as water charges;
others are not but this does not mean that they may not become so in future. It
would seem that the role of environmental tax reform is acknowledged in Ireland,
but, the design and implementation of new taxes is complex. In other areas, such
as monetary policy and employment, the GEG report is arguing for more radical
policy change.

30
Appendix 6: Local Government Reform

31
The Department of the Environment, Community and Local Government has
outlined a new architecture with the express intention of empowering actors and
communities to play more decisive roles at the local, city/county and regional levels
(Department of Environment, Community and Local Government, 2012). The
number of local authorities has reduced from 34 to 31 and there will be three large
Regional Assemblies (replacing the current eight Regional Authorities and two
Regional Assemblies) and these will have a role in drawing up and implementing
Regional Spatial and Economic Strategies (RSES). This is to be done in co-operation
with government departments and state bodies that, thereafter, and similar to the
local authorities themselves, agree to be held accountable to the provisions of the
RSES. City and County Development Plans are to reflect these higher-level RSES
(with Strategic Policy Committees for Economic Development and a Directorate of
Economic Services in each local authority playing the key roles) and, in turn, to
inform lower-level Local and Community Plans. The latter are to be drawn up by
Socio-Economic Committees that Local Development Companies and the local
community sector participate in formulating and to which, afterwards, they too will
be held accountable.
Recent work by the NESC Secretariat for the OECD looked at two regions: Dublin
and the South-East (Sweeney, 2013). In terms of economic development it found
that forums and mechanisms that bring stakeholders (e.g., the state development
agencies, employer-representative bodies, higher-education institutions, local
authorities, local development companies, etc.) in local economic development
together are weak or non-existent. It found that instances of broad collaboration
take place occasionally in each of the regions but they are overly reliant on good
interpersonal relationships between key personnel, the quality of individual
leadership and/or the stimulus of a specific event. It found that there is, in effect,
no authoritative co-ordination of all these players at the regional, city/council or
sub-county levels. Particularly at the county and sub-county levels, there are
numerous boards, partnerships and committees operating that, all too often, lack
decision-making powers and influence, making the majority of them quite weak.
This lack of effective co-ordination is compounded by a weak regional tier that has
little impact on policy-making, a governance level that in other OECD countries
often serves as an integration platform. The research also found that in the case-
study areas, the pressure of reduced resources at the current time is even tempting
some public-service providers to retrench into policy silos and pull out of
partnerships, making collaborative action at the local level more difficult.

32
This suggests that at local and regional level the challenge of co-ordinating and
organising effective search processes that will maximise employment-creation
opportunities should not be underestimated.

33
Bibliography for Appendices

34
Bibliography for Appendices
Callan, T., Keane, C., Savage, M. & Walsh, J.R. (2012), Distributional Impact of Tax, Welfare and Public Sector Pay Policies: 2009–2012, Special Article in Quarterly Economic Commentary, Winter 2011/Spring 2012, Dublin: Economic and Social Research Institute. Callan, T., Keane, C., M., Savage & Walsh, J. (2013), Budget 2013: Distributional Impact, Economic and Social Research Institute. http://www.esri.ie/__uuid/f1394f7f-aae3-49a6-94b1-c44c5edc60ac/Budget2013_Distributional_Impact_7Dec12.pdf, 14/08/13. Central Bank (2013), Residential Mortgage Arrears and Repossessions Statistics, Quarter 1, Dublin: Central Bank. Collins, M. L. (2012), Responding to the Unemployment Crisis: What Role for Active Labour Market Policies?, NERI Working Paper Series, WP 2012/No. 5, Dublin: Nevin Economic Research Institute. Conefrey, T. (2013), 'Migration in Ireland: Recent Trends in Historical Context', Central Bank Quarterly Bulletin, Q1(January): 25–28. CSO (2007), Quarterly National Household Survey, Quarter 3, 2007, Dublin: Central Statistics Office. CSO (2012a), Census 2011: Profile 3 At Work—Employment, Occupations and Industry, Dublin: Central Statistics Office.
CSO (2012b), Population and Migration Estimates: April 2012 (with revisions from April 2007–April 2011), Dublin: Central Statistics Office. CSO (2012c), Survey on Income and Living Conditions (SILC): 2010, Dublin: Central Statistics Office. CSO (2013a), Quarterly National Household Survey, Quarter 2, Dublin: Central Statistics Office. CSO (2013b), Survey on Income and Living Conditions (SILC) 2011 & revised 2010 results, Dublin: Central Statistics Office. Department of Environment, Community and Local Government (2012), Action Plan for Effective Local Government, Department of Environment, Community and Local Government. http://www.environ.ie/en/LocalGovernment/LocalGovernmentReform/PublicationsDocuments/FileDownLoad,31310,en.pdf, 13/09/13. Department of Environment, Heritage and Local Government (2008), The Economic and Social Benefits of Biodiversity, Dublin: Department of Environment, Heritage and Local Government. Department of Jobs, Enterprise and Innovation (2012), Delivering Our Green Potential, Government Policy Statement on the Green Economy, Dublin: Department of Jobs, Enterprise and Innovation.
Department of Social Protection (2012), Statistical Information on Social Wefare Services 2011, Dublin: Department of Social Protection. Ellen MacArthur Foundation (2013), Towards the Circular Economy, Isle of Wight: Ellen MacArthur Foundation. European Environment Agency (2010), 'Further Environmental Tax Reform – Illustrative Potential in Ireland: Staff Position Paper', Presentation to the Comhar "Sustainable Development Council Workshop", October. Green Economy Group (2012), Creating Sustainable Employment by Greening the Economy, Dublin: Green Economy Group http://ien.ie/files/2012/10/Creating-Sustainable-Employment-by-Greening-the-Economy1.pdf. Housing Agency (2011), Housing Needs Assessment 2011. www.environ.ie, 06/07/13. Kitchin, R., Gleeson, J., Keaveney, K. & O'Callaghan, C. (2010), A Haunted Landscape: Housing and Ghost Estates in Post-CelticTiger Ireland, Working Paper Series No. 59, National Institue for Regional and Spatial Analysis, Maynooth: National University of Ireland, Maynooth.

35
Morgenroth, E. (2012), The Regional Dimension of the Unemployment Crisis, Quarterly Economic Commentary, Winter, Dublin: Economic and Social Research Institute. NESC (2011), Supports and Services for Unemployed Jobseekers: Challenges and Opportunities in a Time of Recession, Dublin: National Economic and Social Council.
NESC (2013), The Social Dimensions of the Crisis: The Evidence and its Implications, Dublin: National Economic and Social Council. Sweeney, J. (2013), Local Job Creation, Paris: Organisation for Economic Co-operation and Development.
Watson, D., Maître, B. & Whelan, C.T. (2012), Work and Poverty in Ireland: An Analysis of the CSO Survey on Income and Living Conditions 2004–2010, Dublin: Department of Social Protection.

1