Embed Size (px)
Citation preview

Pacific Region ENSO UPDATE AND SEASONAL
OUTLOOKAug 15 2016
PREPARED BY THE PEAC CENTER
Principal Scientist:Dr. Rashed Chowdhury
Pacific Region Climate Officer: LTJG Joseph Brinkley
Tropical Cyclone Specialist:Mark Lander
Graduate Assistant:Alejandro Ludert

What Is El Niño and La NiñaA general description of their global impacts
2
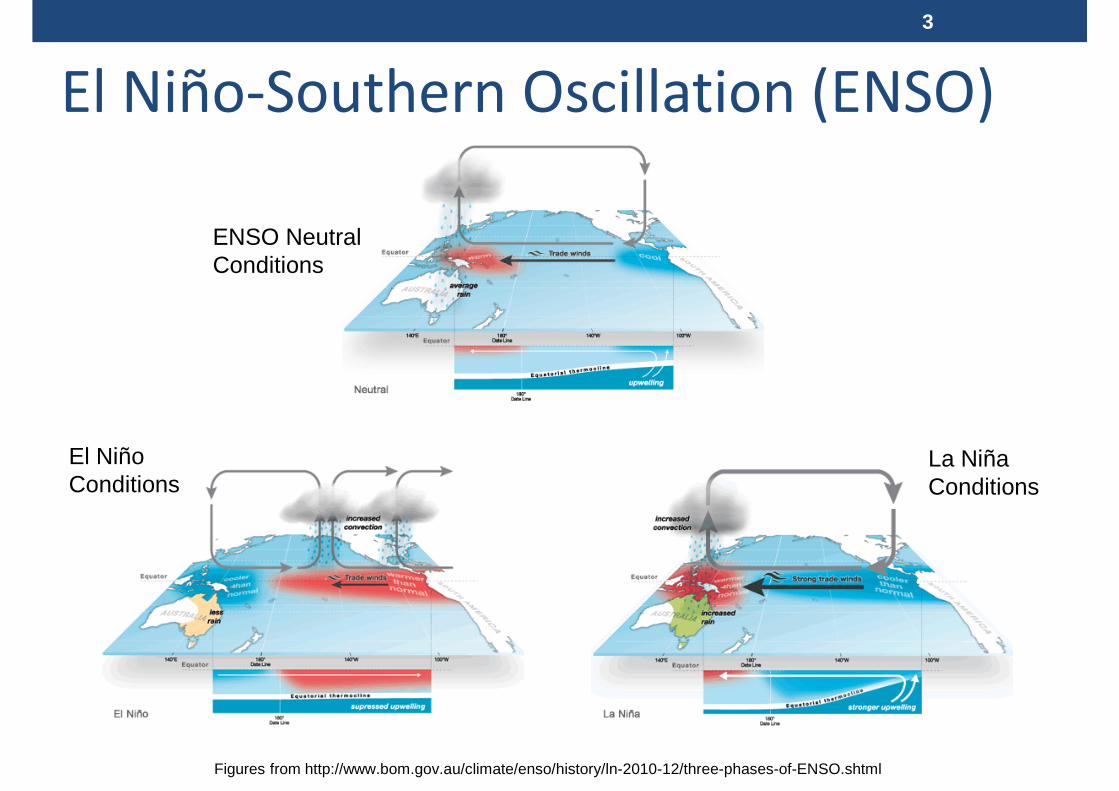
El Niño-Southern Oscillation (ENSO)
Figures from http://www.bom.gov.au/climate/enso/history/ln-2010-12/three-phases-of-ENSO.shtml
3
ENSO Neutral Conditions
El Niño Conditions
La Niña Conditions

El Niño in a nutshellEl Niño Conditions:•Warm sea surface temperatures to the eastand cold to the west•Weakened trade winds, westerly winds overeast Pacific•Rainfall over the Central and East Pacific•Lower than normal sea levels over thewestern Pacific
Figures from http://www.bom.gov.au/climate/enso/history/ln-2010-12/three-phases-of-ENSO.shtml
4
La Niña Conditions:•Cooler than normal sea surfacetemperatures to the east and warmer to thewest•Stronger trade winds•Enhanced rainfall over the Western Pacific•Higher than normal sea levels over theWestern Pacific

El Niño development, peak and decay• Oceanic Niño index averaged for 5 recent El Niño events
• 1963/64, 1972/73, 1982/83, 1997/98, 2009/2010
5

-2.5
-2
-1.5
-1
-0.5
0
0.5
1
1.5
2
2.5
3
Oce
anic
Niñ
o In
dex
(Deg
C)
Season
1972/73/74
1982/83/84
1997/98/99
2015/16
IRI Forecast April 21 2016
Developing Year Decaying Year
El Niño development, peak and decay• Oceanic Niño index averaged for 5 recent El Niño events
• 1963/64, 1972/73, 1982/83, 1997/98, 2009/2010
6

http://www.climate.gov/news-features/department/8443/all
7
El Niño and Rainfall
La Niña and Rainfall

ENSO and Tropical Cyclones
El Niño shifts TC genesisEastward over the Northand South Western Pacific
• Less TC activity• Australia • Philippines
• More TC activity• Tropical Pacific• Hawaii• American Samoa
From the Royal Netherlands Meteorological Institute http://www.knmi.nl/research/global_climate/enso/effects/
8

GENERAL SYNOPSISThis section will give a quick overview of the coming topics

ENSO Alert System Status: La Niña Watch
Current Conditions
• Current ENSO status is Neutral• Sea Surface Temperature slightly cooler than normal over the Eastern Pacific• Atmospheric conditions consistent with Neutral ENSO conditions
Observed Impacts
• Expected El Niño impacts• Severe drought conditions across the globe• Shifted Tropical Cyclone Activity in the Western Pacific• Below average sea levels over the Western Pacific
• Are all returning to neutral conditions or shifting towards La Niña conditions
General ENSO Forecast
• Onset of La Niña is expected during the August to October season• Peak during the December to January season• La Niña is expected to be weak
Synopsis10

Current ConditionsGeneral State of the Ocean and Atmosphere
11

During the last 4 months, equatorial SSTstransitioned from above average to slightly belowacross the Eastern Pacific Ocean
http://www.cpc.noaa.gov/products/analysis_monitoring/lanina/enso_evolution-status-fcsts-web.ppt#356,6,SST Departures (oC) in the Tropical Pacific During the Last 4 Weeks
Average sea surface temperature (SST) anomalies (°C).
Slightly below average sea surface temperatures close to the equator across the eastern tropical Pacific Ocean
12
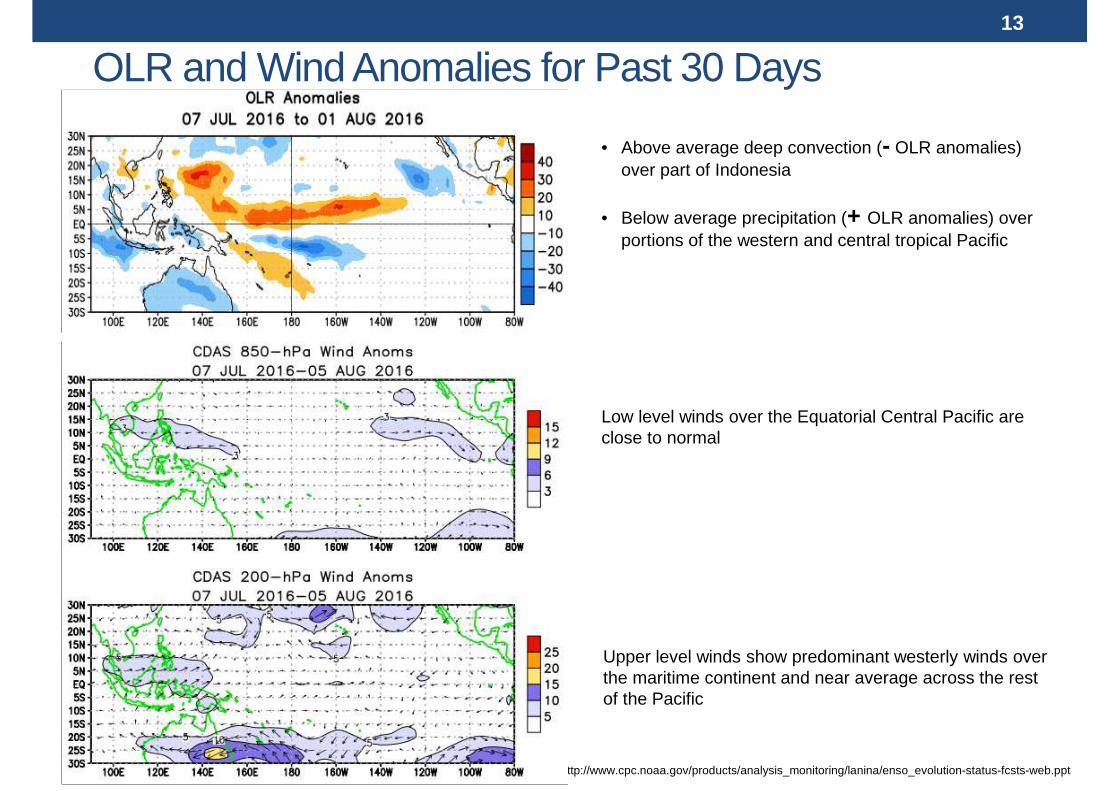
OLR and Wind Anomalies for Past 30 Days
http://www.cpc.noaa.gov/products/analysis_monitoring/lanina/enso_evolution-status-fcsts-web.ppt
• Above average deep convection (- OLR anomalies) over part of Indonesia
• Below average precipitation (+ OLR anomalies) over portions of the western and central tropical Pacific
Low level winds over the Equatorial Central Pacific are close to normal
Upper level winds show predominant westerly winds over the maritime continent and near average across the rest of the Pacific
13

SST DEPARTURES AND UPPER OCEAN (0 - 300m)HEAT CONTENT ANOMOLY
http://www.cpc.noaa.gov/products/analysis_monitoring/lanina/enso_evolution-status-fcsts-web.ppt#356,6,SST
The latest weekly SST departures are:
Niño 4 0.1ºC
Niño 3.4 -0.5ºC
Niño 3 -0.5ºC
Niño 1+2 0.5ºC
14

ENSO Alert System Status: La Niña Watch Synopsis:• Slightly below average sea surface temperatures close to the equator across the eastern tropical Pacific Ocean •Weekly Niño-1+2 and Niño-4 regions were near average, the Niño-3 and Niño-3.4 indices were slightly below average during July • Below-average subsurface temperatures continued • Upper and lower-level winds also were near average across most of the tropical Pacific • Southern Oscillation index and the equatorial Southern Oscillation index were near average during July Convection was suppressed over portions of the western and central tropical Pacific and enhanced over part of Indonesia • the combined ocean and atmosphere system is reflective of ENSO-neutral
Issued by CLIMATE PREDICTION CENTER/NCEP/NWS
and the International Research Institute for Climate and Society Diagnostic Discussion: 11 August 2016
http://www.cpc.ncep.noaa.gov/products/analysis_monitoring/enso_advisory/ensodisc.doc
EL NIÑO/SOUTHERN OSCILLATION (ENSO) DIAGNOSTIC DISCUSSION
15

ImpactsRainfall, Sea Level, Tropical Cyclones and Societal Impacts
16

Summary of the 2015-2016 El Niño impacts (WFP/FAO 13 July 2016)
17
Retrieved from: http://reliefweb.int/sites/reliefweb.int/files/resources/wfp_fao_el_nino_overview_by_fsc_1.pdf

El Niño “like” conditions during 2014
18
-2.5
-2
-1.5
-1
-0.5
0
0.5
1
1.5
2
2.5
3
DJF
JFM
FM
AM
AM
AM
JM
JJJJ
AJA
SA
SO
SO
NO
ND
ND
JD
JFJF
MF
MA
MA
MA
MJ
MJJ
JJA
JAS
AS
OS
ON
ON
DN
DJ
DJF
JFM
FM
AM
AM
AM
JM
JJJJ
AJA
SA
SO
SO
NO
ND
ND
JD
JFJF
MF
MA
MA
MA
MJ
MJJ
JJA
JAS
AS
OS
ON
ON
DN
DJ
Oce
anic
Niñ
o In
dex
(Deg
C)
Season
1972/73/74
1982/83/84
1997/98/99
2015/16

Rainfall impacts: Drought
19
Figures made using the IRI Map Room https://iridl.ldeo.columbia.edu/maproom/
• The impacts of the 2015/2016 El Niño where compounded with those from El Niño “like conditions during the year before
• Extremely dry conditions over two years (two growing seasons) where present in many areas of the globe
• Northern South America
• Africa• South East Asia• Pacific Islands• Australia

20
• Rainfall deficits for• Last 12 months (top)• Last 3 months (bottom)
• Dry conditions have eased over
• The Indian Subcontinent
• The Maritime Continent• The Arabian Peninsula
• Continental South East Asia, while still dry, has seen some modest improvement
Rainfall impacts: Drought in Asia and the Pacific
Figures made using the IRI Map Room https://iridl.ldeo.columbia.edu/maproom/
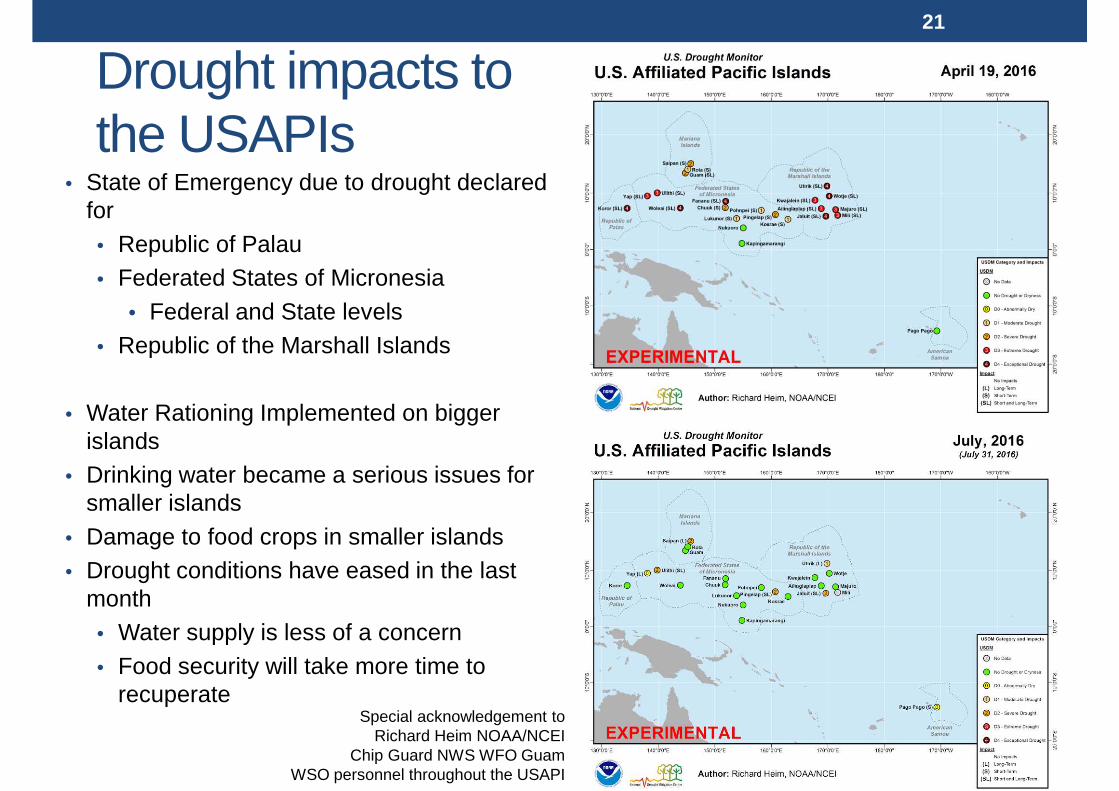
Drought impacts to the USAPIs
• State of Emergency due to drought declared for• Republic of Palau• Federated States of Micronesia
• Federal and State levels• Republic of the Marshall Islands
• Water Rationing Implemented on bigger islands
• Drinking water became a serious issues for smaller islands
• Damage to food crops in smaller islands• Drought conditions have eased in the last
month• Water supply is less of a concern• Food security will take more time to
recuperate
21
Special acknowledgement toRichard Heim NOAA/NCEI
Chip Guard NWS WFO GuamWSO personnel throughout the USAPI

Fort McMurray Fires
• El Nino in the Pacific disrupted weather patterns to bring northern Alberta a dry fall and very little snow throughout the winter
• Similar conditions where observed in 1998
According to Daniel Thompson from Natural Resources Canada in Edmonton to Bloomberg News
22
Source: AON Benfield2016 Global Catastrophe Recap: First Half of 2016
MODIS True Color Image from May 16th 2016

Global crops
• Conditions have improved for many places across the globe
• Europe• South
America• Australia
• Deteriorated over Western China
23
From GEOGLAM Early Warning Crop Monitorhttp://www.geoglam-crop-monitor.org/
Latest information up to April 28th 2016.
Latest information up to July 28th 2016.

Crops in Africa
• Severe drought over the southern portion of the continent has been ameliorated
• Watch conditions over Ethiopia have improved
From GEOGLAM Early Warning Crop Monitorhttp://www.geoglam-crop-monitor.org/
24
Latest information up to July 28th 2016.Latest information up to April 28th 2016.

Rice Crops in South East Asia
• Thailand and Cambodia have seen greatly improved conditions• The Philippines has seen some improvement from drought• Myanmar and Bangladesh may see poor growing conditions
25
From GEOGLAM Early Warning Crop Monitorhttp://www.geoglam-crop-monitor.org/
Latest information up to July 28th 2016.Latest information up to April 28th 2016.

Sea Level Observation
Sea Levels have been • Below average over
Western Pacific Basin since March 2015
• Returned to near average by March 2016
• Quickly transitioned to above average by May 2016
• PEAC Center sea level data monitoring indicates clear trend towards La Niña
26
mm

Coral BleachingSever bleaching events
From Coral Reef Watch http://coralreefwatch.noaa.gov/satellite/baa.php
27

Tropical cyclone activity
• TC activity was very low during the first half of 2016
• The season had a very late start,
• first named storm (Super Typhoon Nepartak) reaching tropical storm intensity on the 3rd
of July• TC activity during the first
half of 2016 was displaced to the west and north of average, in stark contrast to the activity during the first half of 2015
28

How ENSO affects global health
29
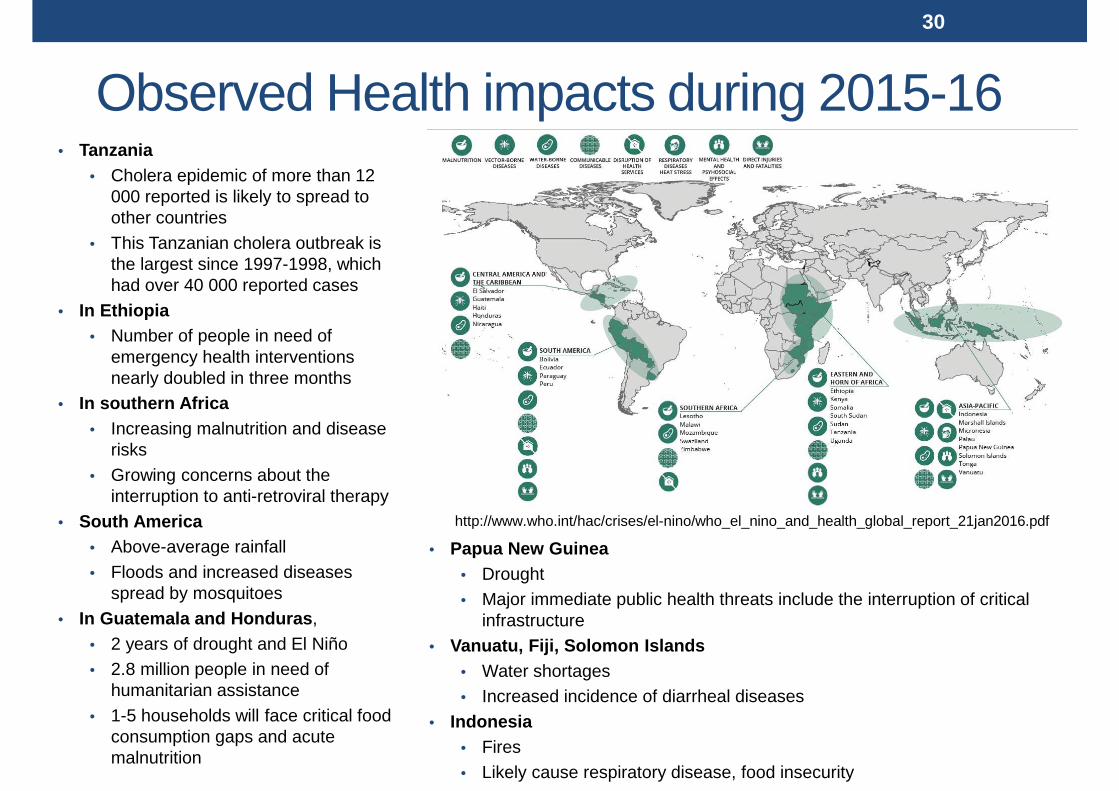
Observed Health impacts during 2015-16• Tanzania
• Cholera epidemic of more than 12 000 reported is likely to spread to other countries
• This Tanzanian cholera outbreak is the largest since 1997-1998, which had over 40 000 reported cases
• In Ethiopia• Number of people in need of
emergency health interventions nearly doubled in three months
• In southern Africa• Increasing malnutrition and disease
risks
• Growing concerns about the interruption to anti-retroviral therapy
• South America • Above-average rainfall
• Floods and increased diseases spread by mosquitoes
• In Guatemala and Honduras ,
• 2 years of drought and El Niño• 2.8 million people in need of
humanitarian assistance
• 1-5 households will face critical food consumption gaps and acute malnutrition
• Papua New Guinea• Drought• Major immediate public health threats include the interruption of critical
infrastructure• Vanuatu, Fiji, Solomon Islands
• Water shortages• Increased incidence of diarrheal diseases
• Indonesia• Fires• Likely cause respiratory disease, food insecurity
30
http://www.who.int/hac/crises/el-nino/who_el_nino_and_health_global_report_21jan2016.pdf

Global Response
• The 2015–16 El Niño has now dissipated, but its devastating impacts will be felt well into 2017
• As a result of droughts caused or exacerbated by El Niño, 60 million people across four continents, require immediate assistance
• This was a well forecast event.
• Both governments and international stakeholders have responded, but not at the scale and speed to preserve livelihoods, hope and dignity.
• This El Niño was a broadly preventable crisis, and as such, is a modern day tragedy.
31

Even with El Niño ending, the challenges remain:
• Effects on food security and nutrition from this El Niño event are time delayed• Harvest and national stocks will supply populations for a period of
time, food insecurity tends to happen later• Levels of humanitarian assistance are expected to peak by late
2016 early 2017Figure and information from the WFP, VAM Food Security Analysis report “ENSO: Humanitarian Implications and Scenarios”
32
ForecastENSO forecasts
Rainfall, Sea level, Tropical Cyclones and Coral Bleaching
33
CPC/IRI ENSO Forecast
http://iri.columbia.edu/our-expertise/climate/forecasts/enso/current/
34
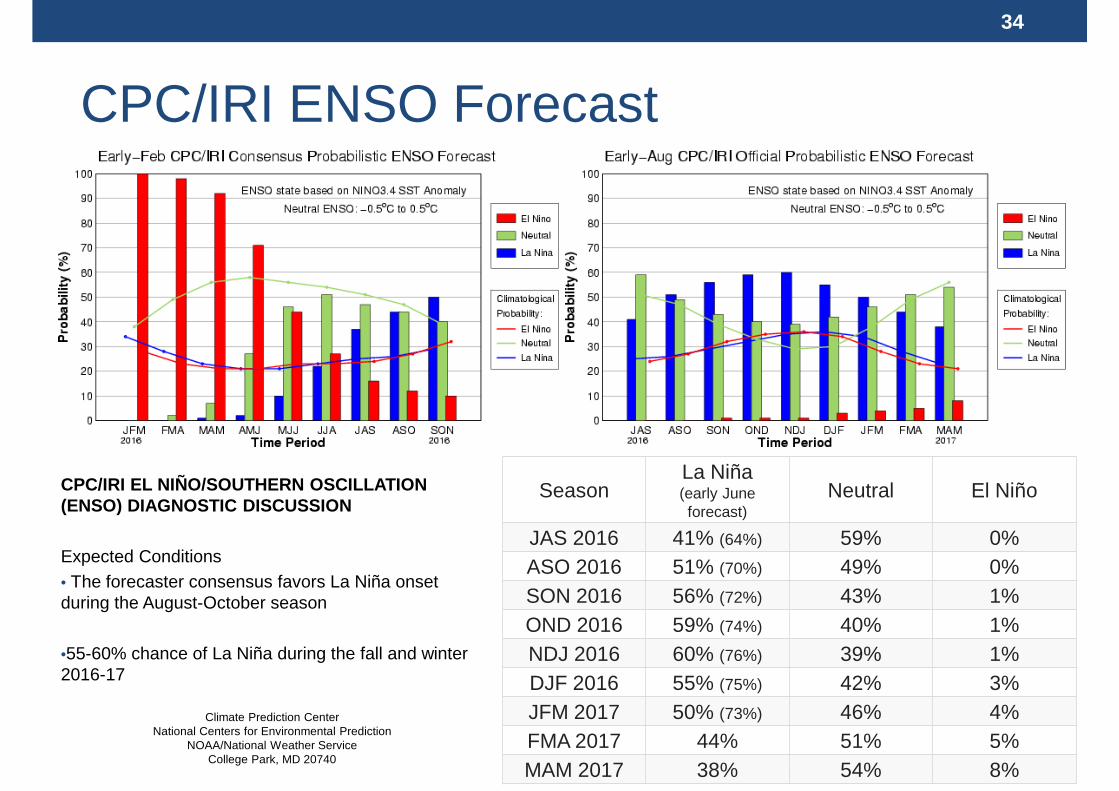
CPC/IRI EL NIÑO/SOUTHERN OSCILLATION (ENSO) DIAGNOSTIC DISCUSSION
Expected Conditions• The forecaster consensus favors La Niña onset during the August-October season
•55-60% chance of La Niña during the fall and winter 2016-17
Climate Prediction CenterNational Centers for Environmental Prediction
NOAA/National Weather ServiceCollege Park, MD 20740
SeasonLa Niña (early June forecast)
Neutral El Niño
JAS 2016 41% (64%) 59% 0%ASO 2016 51% (70%) 49% 0%SON 2016 56% (72%) 43% 1%OND 2016 59% (74%) 40% 1%NDJ 2016 60% (76%) 39% 1%DJF 2016 55% (75%) 42% 3%JFM 2017 50% (73%) 46% 4%FMA 2017 44% 51% 5%MAM 2017 38% 54% 8%

CPC/IRI EL NIÑO/SOUTHERN OSCILLATION (ENSO) DIAGNOSTIC DISCUSSION
Expected Conditions
• Many models favor La Niña by the beginning of the Northern Hemisphere fall, •Continuing into winter
•Statistical models predict a slightly later onset time (i.e., mid- to late fall) than dynamical models, and also predict a slightly weaker event. •The forecaster consensus favors La Niña onset during the August-October season
•Predictions are for a weak event
Climate Prediction CenterNational Centers for Environmental Prediction
NOAA/National Weather ServiceCollege Park, MD 20740
CPC/IRI ENSO Forecast
http://iri.columbia.edu/our-expertise/climate/forecasts/enso/current/?enso_tab=enso-cpc_updatehttp://iri.columbia.edu/our-expertise/climate/forecasts/enso/current/?enso_tab=enso-sst_tablehttp://iri.columbia.edu/ourexpertise/climate/forecasts/enso/current/?enso_tab=enso-iri_updatehttp://iri.columbia.edu/our-expertise/climate/forecasts/enso/current/?enso_tab=enso-sst_table
El Niño
La Niña
35
Average Niño 3.4 SST Anomaly Forecast
JAS OND JFM
Dynamical -0.5 -0.6 -0.6
Statistical -0.3 -0.5 -0.5
All Models -0.4 -0.6 -0.5

Tropical SST Forecasts (May 2016-Oct 2016)
• This particular model ensemble• Produces a reasonable La Niña “horse shoe” spatial pattern• Develops La Niña conditions by August 2016• Ensemble predictions for NINO3.4 index are around -0.6C (weak La
Niña)
36
From: http://www.apcc21.org/ser/outlook.do?lang=en
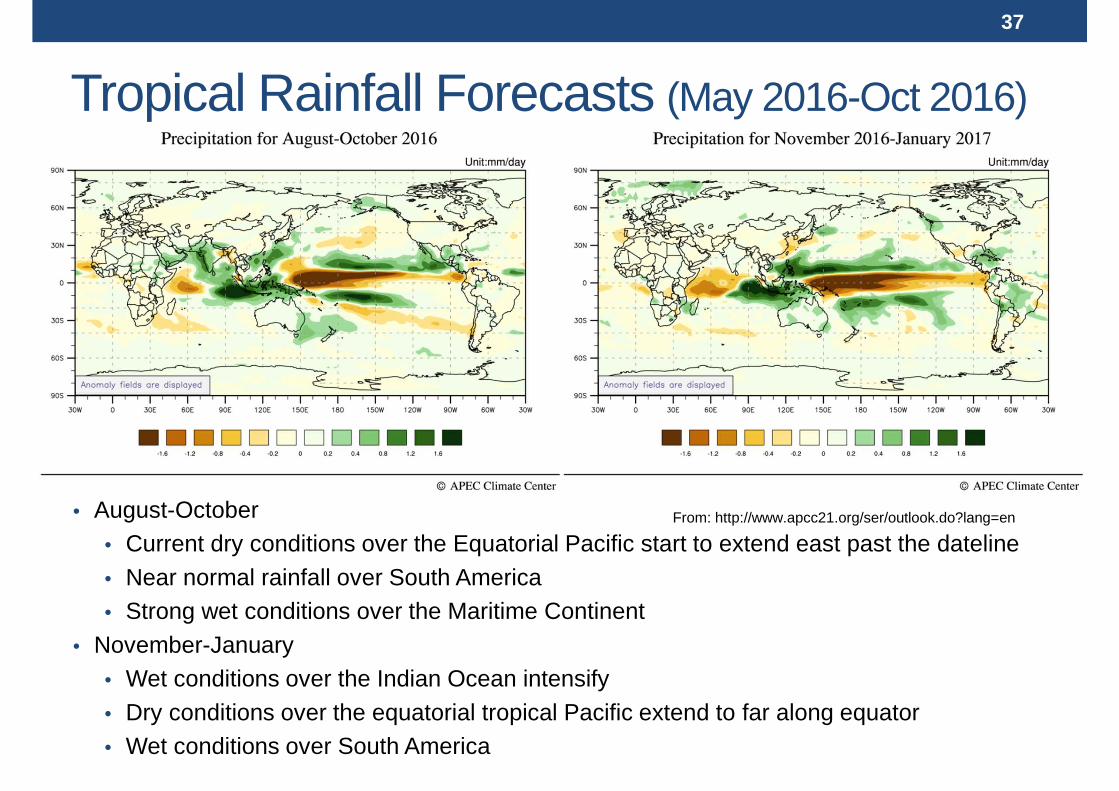
Tropical Rainfall Forecasts (May 2016-Oct 2016)
• August-October• Current dry conditions over the Equatorial Pacific start to extend east past the dateline• Near normal rainfall over South America• Strong wet conditions over the Maritime Continent
• November-January• Wet conditions over the Indian Ocean intensify• Dry conditions over the equatorial tropical Pacific extend to far along equator• Wet conditions over South America
37
From: http://www.apcc21.org/ser/outlook.do?lang=en

Continental Asia
• August-October• Rainfall near normal over
Mainland China, the Korean peninsula and Japan
• Mild wet conditions for Taiwan
• November-January• Dry conditions develop over
Eastern China and the Korean Peninsula
38
From: http://www.apcc21.org/ser/outlook.do?lang=en

Asia Pacific • Western North Pacific
• Dryer than conditions likely to continue over the tropical and give way to wet conditions by the end of the year
• Western Pacific Islands are coming out of severe drought
• India • Above average rainfall over most of
the Indian subcontinent returning to near normal by the end of the year
• Continental South East Asia • Mixed rainfall conditions
• Philippines • Increasing rainfall as the year
progresses• Maritime Continent
• Likely to see wet conditions for the rest of the year
39
From: http://www.apcc21.org/ser/outlook.do?lang=en

Australia - Pacific• Maritime Southeast Asia will see
more rain and relief from severe drought
• South Pacific Islands • Many recovering from severe drought• likely to see some relief• May be short lived
• Australia• Likely above average rainfall for the
next 3 months• Could make for severe floods• 2010-2011 Queensland floods
• TC + Enhanced wet conditions• Produced ~2.4 Billion in damages
40
From: http://www.apcc21.org/ser/outlook.do?lang=en
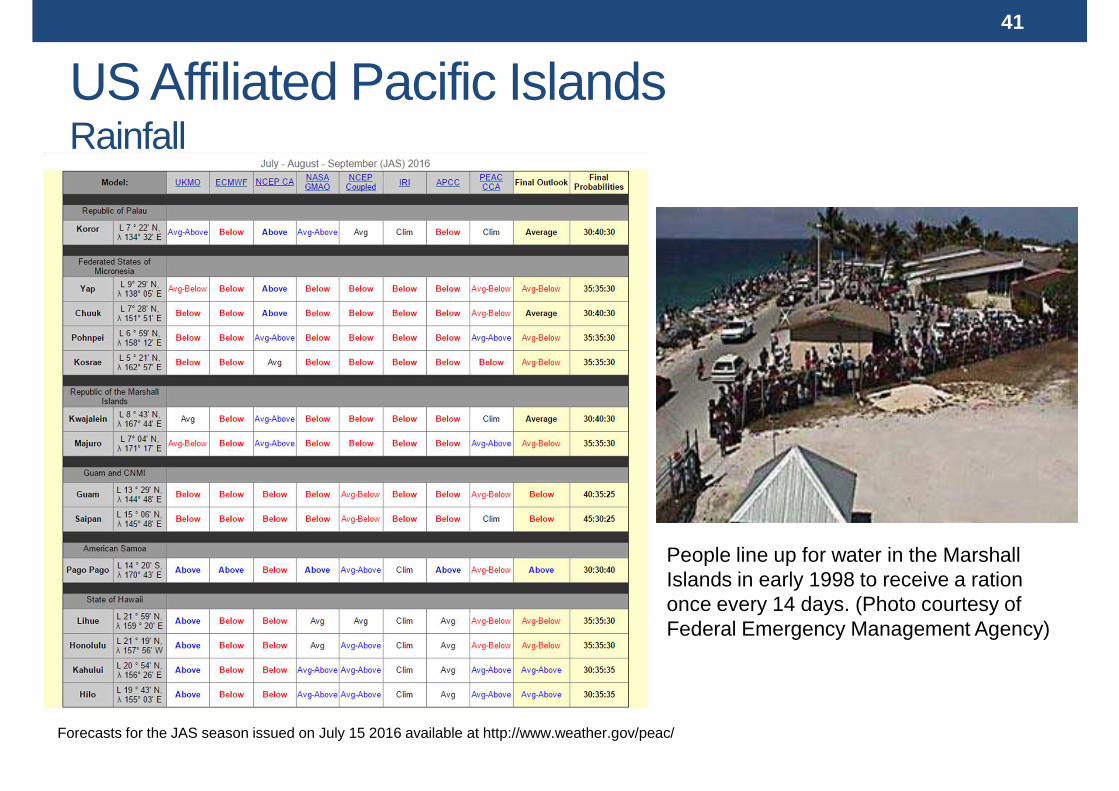
US Affiliated Pacific IslandsRainfall
Forecasts for the JAS season issued on July 15 2016 available at http://www.weather.gov/peac/
41
People line up for water in the Marshall Islands in early 1998 to receive a ration once every 14 days. (Photo courtesy of Federal Emergency Management Agency)

Sea Level Forecasts
• Sea Level across the Western Pacific Basin was well below average since early 2015
• Sharply transitioned to above average in early 2016• Will likely remain above normal until 2017
http://poama.bom.gov.au/experimental/pasap/sla.shtml
42

US Affiliated Pacific IslandsSea level forecast
43
Forecasts for the MAM season issued on March 12 available at http://www.weather.gov/peac/

Tropical Cyclone Forecast• US Affiliated Pacific Islands (PEAC Center
Forecast)• Tropical cyclone activity will be below average
in the western North Pacific basin• Relatively inactive year within the bounds of
Micronesia • October through December, the risk of a
tropical storm or typhoon should increase to near average across western Micronesia and remain low (but not zero!) at locations eastward of Guam.
• Central Pacific Basin (CPHC, May 26th 2016)• (TC season June 1 to November 30 )• Average to Above Average season with 4 to 7
tropical cyclones likely• La Niña tends to suppress TC activity in the
region but decadal variability shifting towards more active mode
• Philippines (PAGASA, July 15th 2016)• July to September 5 to 11 TCs likely• October to December 4 to 9 TCs likely
44
TC activity during El Niño
TC activity during La Niña
Images from JTWC, Courtesy of Robert Falvey.

Tropical Cyclone Forecast• American Samoa TC (PEAC Center)
• November to April• No activity is anticipated near American Samoa in the new season until
November or December of 2016.• Australia (Australian BOM Forecast)
• TC season from Nov 1 to Apr 30, forecasts issued in October• Based on the BOM 2010-2011 forecast
• Australian region likely to get above average TC activity during the 2016-2017 season
45
TC activity during El Niño TC activity during La Niña

Tropical Cyclone Forecast• Western Pacific (City University of Hong Kong, July 2016)
• TCs year round, minimum of activity in February and March• Years post strong El Niño events tend to have below normal TC activity• Downward trend in total number of TCs in the region• Below average formation (18/22) and landfalls (10/16) are expected
• Indian Ocean• From climatology• Enhanced activity in the Bay of Bengal during La Niña
46
TC activity during El Niño TC activity during La Niña

Coral BleachingOutlook
• High probability of Coral Bleaching across Western Pacific• Western Pacific Islands may see bleaching in the coming months• Caribbean Islands are at high risk of bleaching events
From Coral Reef Watch http://coralreefwatch.noaa.gov/satellite/baa.php
47

ENSO Alert System Status: La Niña Watch
Current Conditions
• Current ENSO status is Neutral• Sea Surface Temperature slightly cooler than normal over the Eastern Pacific• Atmospheric conditions consistent with Neutral ENSO conditions
Observed Impacts
• Expected El Niño impacts• Severe drought conditions across the globe• Shifted Tropical Cyclone Activity in the Western Pacific• Below average sea levels over the Western Pacific
• Are all returning to neutral conditions or shifting towards La Niña conditions
General ENSO Forecast
• Onset of La Niña is expected during the August to October season• Peak during the December to January season• La Niña is expected to be weak
Synopsis48

Forecast Summary• Rainfall
• Dry conditions over the tropical Western North Pacific likely to continue to improve• Eastern China and Korean Peninsula
• likely to receive near average rainfall for the next 3 months• Dry conditions from November to January
• India • Above average rainfall over most of the Indian subcontinent returning to near normal by
the end of the year• Continental South East Asia
• Mixed rainfall conditions• Philippines
• Increasing rainfall as the year progresses• Maritime Continent
• Likely to see wet conditions for the rest of the year• South Pacific Islands
• Many recovering from severe drought• likely to see some relief• May be short lived
• Australia• Likely above average rainfall for the next 3 months
49

Forecast Summary• Sea Level
• Likely to remain above normal over the Western Tropical Pacific until the end of the year
• TCs• US Affiliated Pacific Islands
• US Affiliated Pacific Islands likely below normal activity• Western Pacific
• Below average formation and landfalls are expected• Central Pacific Basin
• Average to Above Average season with 4 to 7 tropical cyclones likely• Philippines
• July to September 5 to 11 TCs likely• October to December 4 to 9 TCs likely
• Australia• Likely above average cyclone season, Nov 1 2016 – Apr 30 2017
• Indian Ocean • Above average activity in the Bay of Bengal
50

Global impacts of La NiñaLa Niña years have clearly shown greater average annual losses in comparison to El Niño and Neutral phases. • La Niña USD77 billion• El Niño USD45 billion Much of the increase in losses during a La Niña year surrounds • Increased frequency of
costly landfallingtropical cyclone events in the Atlantic Ocean basin
• Increased flooding events across Asia Pacific
51
Source: Aon Benfield 2015 Annual Climate and Catastrophe report.

La Niña can linger on…• While El Niño conditions rarely persist more than one year
La Niña conditions can persist many years• 1953/1954 El Niño followed by La Niña conditions from AMJ1954
trough AMJ 1956• 1969/1970 El Niño followed by La Niña conditions from JJA1970
trough DJF 1972• 1972/1973 El Niño followed by La Niña conditions from MJJ1973
trough FMA 1976• 1997/1998 El Niño followed by La Niña conditions from JJA1998
trough FMA 2001
• This makes it so that La Niña type impacts can be present for many years.
52

The PEAC CenterThe Pacific ENSO Applications Climate Center
Photo courtesy of Lt. Charlene Felkley