Embed Size (px)
Citation preview
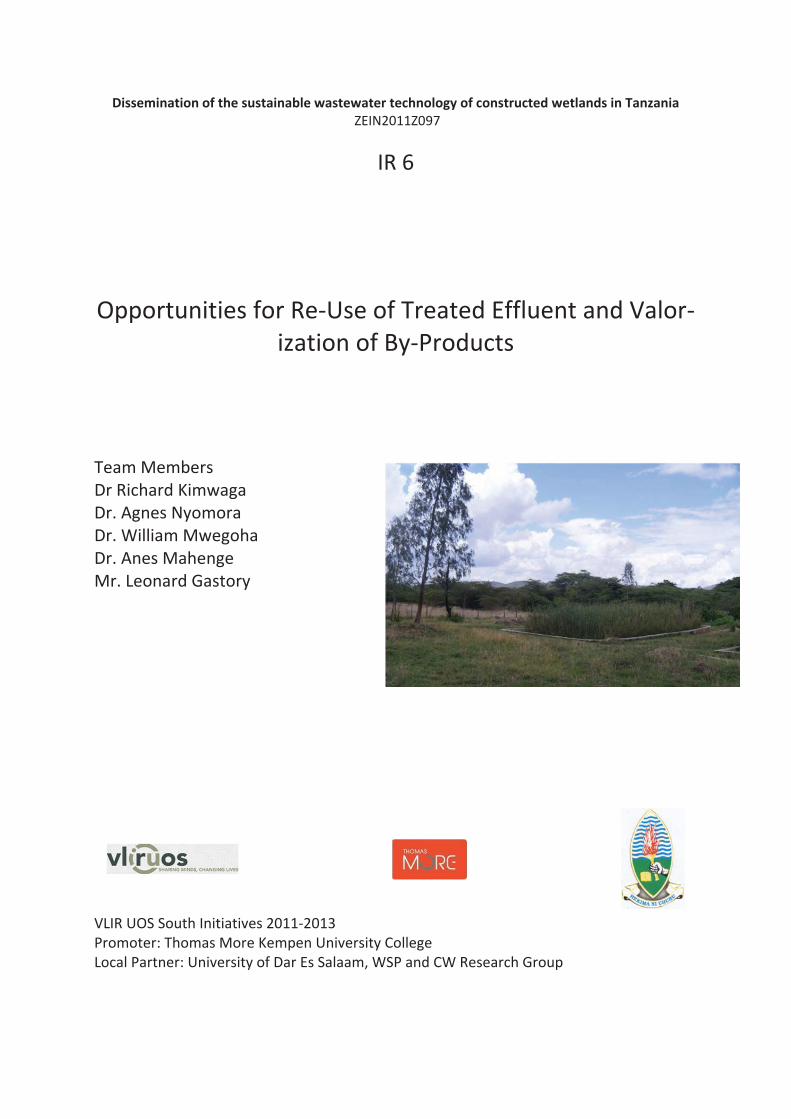
Dissemination of the sustainable wastewater technology of constructed wetlands in TanzaniaZEIN2011Z097
IR 6
Opportunities for Re Use of Treated Effluent and Valorization of By Products
Team MembersDr Richard KimwagaDr. Agnes NyomoraDr. William MwegohaDr. Anes MahengeMr. Leonard Gastory
VLIR UOS South Initiatives 2011 2013Promoter: Thomas More Kempen University CollegeLocal Partner: University of Dar Es Salaam, WSP and CW Research Group

ar
Dissemination of the Sustainable Wastewater
Technology of Constructed Wetland in Tanzania (VLIR Research Project)
Opportunities for re-use of treated effluent and valorization of by-
products
August, 2013 Team Members Dr Richard Kimwaga Dr. Agnes Nyomora Dr. William Mwegoha Dr. Anes Mahenge Mr. Leonard Gastory
Table of Contents
1 Water Resources Management Challenges and Wastewater Reuse in Perceptive 8 1.1 Water Resources Management Challenges --------------------------------------------- 8 1.2 Wastewater Re-use in Perceptive ------------------------------------------------------- 9 1.2.1 Growing water stress ---------------------------------------------------------------------- 9 1.2.2 Nutrients Deficiency in Agricultural Production ------------------------------------- 10 1.2.3 Growing urbanization ------------------------------------------------------------------- 11 1.2.4 Growing urban wastewater generation ----------------------------------------------- 12 1.2.5 Growing agricultural activities in and near urban areas --------------------------- 12 1.2.6 Reasons for Wastewater Reuse -------------------------------------------------------- 12 1.2.7 Public Health and Water Quality Considerations ------------------------------------ 13 2 Wastewater Quantity and Quality Considerations ---------------------------------- 13 2.1 Wastewater Quantity Generated from CW ------------------------------------------- 13 2.2 Quality of Treated Wastewater from CW -------------------------------------------- 15 3 ---------- Guidelines and Regulations (Regulatory) that Influence Wastewater Reuse in Tanzania ------------------------------------------------------------------------------------------ 18 3.1 Introduction ------------------------------------------------------------------------------ 18 3.2 Regulatory Wastewater Reuse Criteria ----------------------------------------------- 19 3.2.1 International Guidelines (WHO Guidelines) ------------------------------------------ 19 3.2.1.1 Guidelines for the safe use of wastewater and excreta in agriculture and aquaculture --------------------------------------------------------------------------------------- 19 3.2.1.2 Guidelines for the safe use of wastewater, excreta and greywater. Volume 1: Policy and regulatory aspects --------------------------------------------------------------- 20 3.2.1.3 Guidelines for the safe use of wastewater, excreta and greywater. Volume 2: Wastewater use in agriculture -------------------------------------------------------------- 20 3.2.1.4 Guidelines for the safe use of wastewater, excreta and greywater. Volume 3: Wastewater and excreta use in aquaculture --------------------------------------------- 20 3.2.1.5 Guidelines for the safe use of wastewater, excreta and greywater. Volume 4: Excreta and greywater use in agriculture ------------------------------------------------- 20 3.3 Standards for Effluents and Receiving Waters in Tanzania ------------------------ 21 4 National Policies ------------------------------------------------------------------------- 23 4.2 Sanitation and Hygiene Policy (2011, Draft One) ----------------------------------- 24 4.3 National Environmental Policy (1997) ------------------------------------------------ 25 5. Human Health and Ecosystem Risk ---------------------------------------------------- 25 5.1 Effects on farm workers or wastewater treatment plant workers --------------- 27 5.2` Effects on Consumers of Vegetable Crops ------------------------------------------- 28 5.3 Ecosystem Risk --------------------------------------------------------------------------- 29

6 Economic Issues -------------------------------------------------------------------------- 30 6.1 Introduction ------------------------------------------------------------------------------ 30 6.2 Cost Benefit Analysis from CW --------------------------------------------------------- 30 6.2.1 Societal Cost Benefit Analysis---------------------------------------------------------- 33 6.3 Financial Analysis of the Selected Sanitation Options------------------------------ 35 6.3.1 Benefit analysis -------------------------------------------------------------------------- 36 6.3.2 Benefits from Urine Diversion Toilet (UDT) ------------------------------------------ 37 7 Technical issues -------------------------------------------------------------------------- 38 7.1 Technical Feasibility of Constructed Wetlands -------------------------------------- 38 7.2 WSP and CW Research Group ---------------------------------------------------------- 39 8.0 Estimation of the yield of products --------------------------------------------------- 42 9 Products from wastewater re-use ----------------------------------------------------- 45 9.1 Irrigation water -------------------------------------------------------------------------- 45 9.2 Nutrients dissolved in WW -------------------------------------------------------------- 45 9.3 Sludge ------------------------------------------------------------------------------------- 46 10. Irrigated crops (produce) --------------------------------------------------------------- 46 11. Harvested plants ------------------------------------------------------------------------- 46 12. Fish farming ------------------------------------------------------------------------------ 48 13. Valorization of By-products ------------------------------------------------------------ 49 References ---------------------------------------------------------------------------------------- 53
Abbreviations and Acronym KADC Kilimanjaro Agricultural Development Centre
AGENDA
ARI Accounting Rate of Interest
ARU Ardhi University
BOD Biological Oxygen Demand
CBA Cost Benefit Analysis
COD Chemical Oxygen Demand
COSTECH Commission for Science and Technology
CW Constructed Wetland
EDC
EDF European Development Fund
ENVICON:
EU European Union
FAO Food and Agriculture Organization
FC Faecal Coliform
FSS Free Water Surface
HSSFCW Horizontal Subsurface Flow Constructed Wetland
IRR Internal Rate of Return
IRUWASA Iringa Urban Water Supply and Sewerage Authority
KU Kenyatta University
MAK Makerere University
MORUWASA Morogoro Urban Water Supply and Sewerage Authority
MPC
MUHAS Muhimbili University of Health and Allied Sciences
MUWSA Moshi Urban Water Supply and Sewerage Authority
NGO Non Governmental Organization
NH3 Ammonia
NH3-N Ammonia Nitrogen
NM-AIST The Nelson Mandela African Institute of Science and Technology
NO3 Nitrate
NPK Nitrogen Phosphorus and Potassium
NPV Net Present Value
O & M Operation and Maintenance
ORS Oral Rehydration Salts
OUT The Open University of Tanzania
PBP Pay Back Period
PUMPSEA Peri - Urban mangrove forests as filters and potential phytoremediators of domestic sewage in East Africa
QMRA Quantitative Microbial Risk Assessment
RSS Ruaha Secondary School
SN FWS Semi Natural Free Water Surface Wetlands
SSF Sub Surface Flow
SSFCW Subsurface Flow Constructed Wetland
TDS Total Dissolved Solids
TIRDOT Tanzania Industrial Research and Development Organization
TL Trigger level
TSS Total Suspended Solids
UCDISM University Capacity Development for Integrated Sanitation Management
UD Urine Diversion
UDDT Urine Diversion Dry Toilet
UDOM University of Dodoma
UDSM University of Dar es Salaam
UMZA University of Zambia
VIP Ventilated Improved Pit Latrine
VLIR Vlaamse Interuniversitaire Road
WHO World Health Organization
WSP Waste Stabilization Ponds
List of Figures/Photos
Figure 2.1: Raising of livestock pastures from CW effluents at Ruaha Secondary School, Iringa
Figure 2.2: Fish Pond in use of CW effluent at Moshi Urban Water Supply and Sewerage Authority
Figure 2.3: CW units for polishing municipal waterwater in Iringa and later serving irrigation agriculture
Figure 7.1: Section of the UDSM Research Group at work
Figure 8.1: Performance of paddy under different WW concentrations
Figure 8.2: Performance of swisschard under different WW dilutions
Figure 11.1 Phragmitis rhizome netting that is useful in consolidating and stabilizing sediments
Figure 11.2 Abaxial and adaxial sides of a Lotus plant that are used in Asia as plates
Figure 11.3: Asian Wild rice (Zizania latifolia) stems harvested for vegetable
Figure 11.4: North American wild rice (Zizania palustris) harvested for grain
Figure 11.5: Wastewater used to irrigate vegetables in Dar es Salaam
List of Tables
Table 2.1: Laboratory results for the various CW units treating domestic and municipal
Table 2.2: Standards for effluents and receiving waters in Tanzania
Table 6.1: Cost comparison of the proposed toilet
Table 6.2: Calculated Present worth values
Table 6.3: Percent distribution of nutrients in adult faeces
Table 6.4: Summary cost
Table 11.1: Aquatic plants that can be used as macrophytes and other uses
List of Plates
Plate 2.1. Raising of livestock pastures from CW effluents at R S School
Plate 2.2: Fish Pond in use of CW effluent at MUWSA
Plate 2.3: CW units for polishing municipal wasterwater in Iringa and later serving
irrigated agriculture
Plate 12.1: Phragmitis rhizome netting useful in consolidating and stabilizing
sediments
Plate 12.2: Plate 12.2: Abaxial and adaxial sides of a Lotus plant that are used in
Asia as plates
Plate 12.3: Asian Wild rice (Zizania latifolia) stems harvested for vegetable
Plate 12.4: North American wild rice (Zizania palustris) harvested for grain
Plate 12.5: Wastewater used to irrigate vegetables in Daressalaam
1 Water Resources Management Challenges and Wastewater Reuse
in Perceptive
1.1 Water Resources Management Challenges
Environmental stresses imposed by population growth, urbanization, industrialization
and climate change have become a prominent theme of international concern,
especially since the 1992 Earth Summit in Rio de Janeiro. One of the most affected of
the natural resources is that of freshwater. Demands upon the world’s supply of
freshwater resources are increasing the threats and risks to both quantity and quality
of this natural resource essential to human life, health, social and economic
activities. These risks to water resources have raised political attention which has
been translated into political commitment, within and between countries, for the
protection of this vital resource. Growing concerns related to climate change
highlight the urgency of the freshwater situation. Climate change impacts are
expected to affect populations directly by more frequent extreme events such as
floods and droughts, rising sea levels, changes in the seasonal distribution and amount
and type of precipitation such as snow and rain.
Some major urban centers already face serious water shortages compounded by water
pollution crises, the latter often originating from water-dependent and water-
impacting agricultural and industrial activities. Questions relating to water resources
management and usage cut across many economic and social sectors, including
agriculture, fisheries, industry, urban development, energy, environment, tourism
and public health.
With increasing economic and demographic demands coupled with climatic change
stresses, the prospect of increased competition and serious disputes within and
between states and sectors over water resources in the not-too-distant future become
more conceivable.
In response to this problem, some wastewater professionals are reusing treated
wastewater and have found it to be a reliable alternative water source
1.2 Wastewater Re-use in Perceptive
1.2.1 Growing water stress
Many parts of the world are experiencing growing water stress and water scarcity.
Projections indicate that the population living in water-stressed and water-scarce
countries will grow from about 1.2 billion (or 18 percent of the world population) in
2007 to 4.0 billion (or 44 percent of the world population) by 2050 (Comprehensive
Assessment of Water Management in Agriculture, 2007). Water stress and scarcity
may even become a concern in regions that are generally thought to have abundant
water supplies, because of the unequal spatial distribution of water resources. For
example, Tanzania is endowed with large fresh water bodies such as Lake Victoria,
Lake Tanganyika and Lake Nyasa, but central Tanzania is semiarid. Agricultural
production in many parts of Tanzania is rain fed. It is well recognized that
intervention in irrigation development boosts crop production 3-4 times than that of
rain fed agriculture.
The trend toward growing water stress is likely to accelerate due to climate change.
The Intergovernmental Panel on Climate Change (IPCC)(2007) predicts that global
warming will alter the hydrological cycles. Drought-affected areas are projected to
increase in extent, with higher frequency and intensity of drought (Meehl et al.,
2007).
Climate change will also affect water quality in water scarce regions, with reduced
river flows losing assimilative capacity, and salinity increasing (Sadoff and Muller,
2009). As a result of these changes, the demand for irrigation water and in particular
for wastewater as an extremely reliable water resource will rise, and it will need to
be increasingly considered as an integral component of local water resources. On one
hand, the vulnerability and adaptation to climate change study has shown increasing
recurrence of draughts which has affected agriculture (URT, 2003). On the other hand
the third pillar of Kilimo Kwanza envisages increased use of irrigation as a way of
promoting agricultural output (URT, 2009). Also the National Population Policy (2006)
acknowledges the failure of current agriculture to meet the food and nutritional
demands of the people due to unreliable rains and lack of irrigation schemes. One of
the policy strategies being proposes is enhancement of irrigation schemes. Although
the policy does not specifically mention the urban agriculture, it is implied. MKUKUTA
II, Goal Number 4 recognizes the challenges of Climate Change. Some relevant
clusters include Improving soil and water conservation measures including irrigation
development, Supporting accelerated development and deployment of new
technologies that ensure adaptation and mitigation actions (UTR, 2010). Using treated
wastewater in agriculture is a potential alternative resource that may improve
production conditions in farming systems and simultaneously save fresh water for
domestic use.
1.2.2 Nutrients Deficiency in Agricultural Production
Agricultural production in Africa is characterized by low productivity caused by a
combination of endogenous and exogenous factors. One of the factors is lack of
adequate agricultural inputs such as nutrients in form of fertilizers and manure
necessary for plant growth. Sub-Saharan Africa has the world’s lowest level of mineral
fertilizer use. Only eight kilograms of nutrients are applied per hectare. This
represents about ten percent of the world average. It is estimated that Sub-Saharan
Africa imports more than 90 percent of its agricultural fertilisers. Decline in soil
fertility is reported as one of the major constraints hampering rural development in
Tanzania (Ley et al., 2000). This has resulted in poverty, widespread of malnutrition
and massive environmental degradation (Shepherd and Saule, 1998; Ley et al.,
2000).While this is a fact; a lot of nutrients contained in wastewater are discharged
into rivers and oceans causing secondary impacts in water bodies and the
environment. Consequently, essential elements, like carbon, nitrogen and phosphorus
and trace elements vital for plant growth are lost in a process that consequently
causes over-fertilization (eutrophication) of water bodies and the oceans. These
nutrients (fertilizer) could be recovered for use in agricultural production. Such form
of waste disposal is not just water and energy consumptive, but also very costly due
to the necessary infrastructure and structural construction required.
Farmers around Moshi Urban Water Service Agency (MUWSA) waste stabilization ponds
grow lowland irrigated paddy 2 times a year in Mid July to November and November to
Mid May. Paddy cultivation in this area is intensive in that it is based on highly
yielding Japanese varieties (No. 54, 56, 64) originating from KADC and heavy use of
inputs (artificial fertilizers and pesticides). All interviewed farmers during a
preliminary survey (Kanyeka and Nyomora,2006) reported of using at least 2 bags
(100 kg) Urea or SA/acre/growing season, one bag 15 days after transplanting and the
rest 25 days after (close to booting stage). This high level of fertilization could easily
be replaced by using wastewater from MUWSA if other risks were abated by intensive
research.
1.2.3 Growing urbanization
An ever larger share of the world population lives in cities. Particularly in developing
countries, urbanization is growing very rapidly. From 2010 to 2030, the population
living in urban areas in developing countries is expected to increase from about 2.6
billion to 4.0 billion in 2030; and in lower-income countries the urban population is
expected to more than double from 254 million to 539 million (UNFPA, 2008).
According to World Bank (2010), urban population of Tanzania is about 11 million and
growing fast at a rate of about 6.2% (Thaxton, 2007). Table 1 shows the level of
urbanisation in Tanzania since 1950 (McGranahan et al., 2009). About 70% of the city's
population live in unplanned, un-serviced, and densely populated areas and, urban
farming and livestock keeping have grown substantially in the city (the number of
households engaged in food production grew from 20% to more than 65% between
1970 and 1990) due to economic reforms leading to increased poverty and decreased
formal employment.
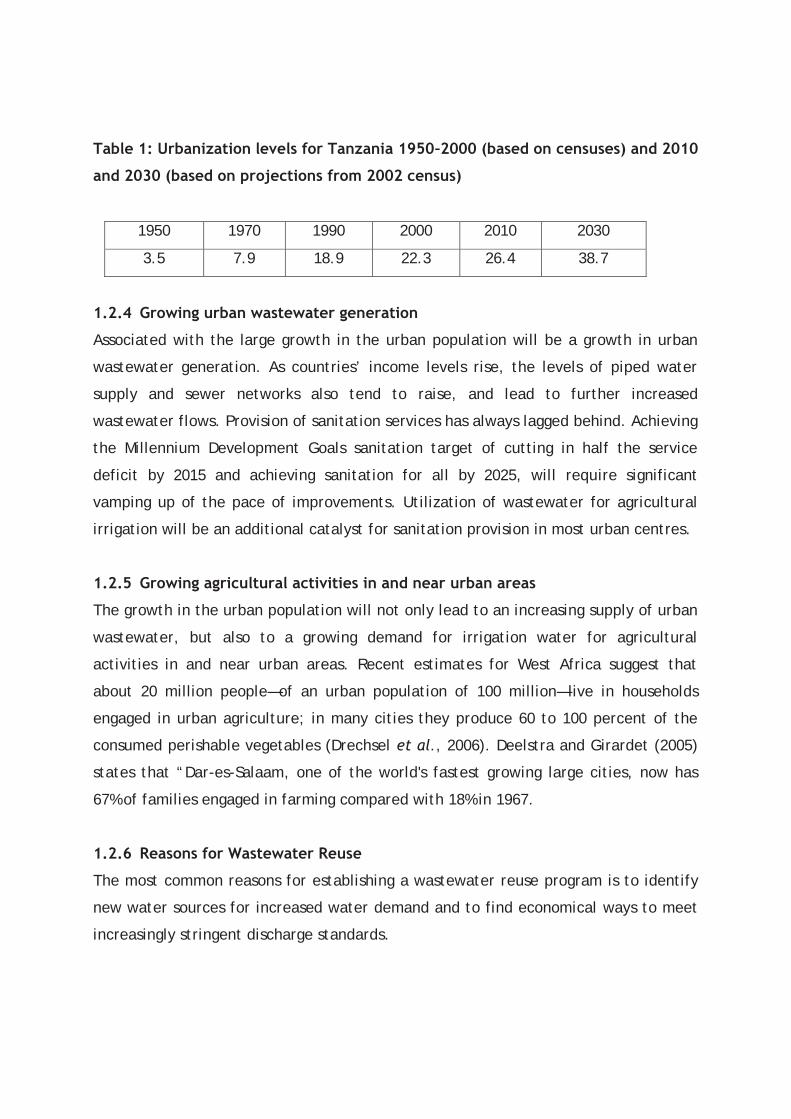
Table 1: Urbanization levels for Tanzania 1950–2000 (based on censuses) and 2010
and 2030 (based on projections from 2002 census)
1950 1970 1990 2000 2010 2030
3.5 7.9 18.9 22.3 26.4 38.7
1.2.4 Growing urban wastewater generation
Associated with the large growth in the urban population will be a growth in urban
wastewater generation. As countries’ income levels rise, the levels of piped water
supply and sewer networks also tend to raise, and lead to further increased
wastewater flows. Provision of sanitation services has always lagged behind. Achieving
the Millennium Development Goals sanitation target of cutting in half the service
deficit by 2015 and achieving sanitation for all by 2025, will require significant
vamping up of the pace of improvements. Utilization of wastewater for agricultural
irrigation will be an additional catalyst for sanitation provision in most urban centres.
1.2.5 Growing agricultural activities in and near urban areas
The growth in the urban population will not only lead to an increasing supply of urban
wastewater, but also to a growing demand for irrigation water for agricultural
activities in and near urban areas. Recent estimates for West Africa suggest that
about 20 million people—of an urban population of 100 million—live in households
engaged in urban agriculture; in many cities they produce 60 to 100 percent of the
consumed perishable vegetables (Drechsel et al., 2006). Deelstra and Girardet (2005)
states that “Dar-es-Salaam, one of the world's fastest growing large cities, now has
67% of families engaged in farming compared with 18% in 1967.
1.2.6 Reasons for Wastewater Reuse
The most common reasons for establishing a wastewater reuse program is to identify
new water sources for increased water demand and to find economical ways to meet
increasingly stringent discharge standards.
1.2.7 Public Health and Water Quality Considerations
Water quality of importance in wastewater re-use is as described below;
Physical water quality considerations - Turbidity, color, etc
Chemical water quality considerations - Chemical constituents including solids,
metals, nitrogen, phosphorus, etc
Biological water quality considerations - Pathogens including bacteria, helminthes,
virus,
Emerging water quality considerations - Pharmaceuticals, hormonal products,
personal care products, other EDC’s
CW technology which has been in the country over the last two decades provides
many opportunities in different dimensions with regard to the reuse of treated the
effluent from CW. This report describes the opportunities for reuse of treated
effluent from CW. The opportunities described in this report are on the dimensions of
Wastewater Quantity and Quality, Guidelines and Regulations (Regulatory) that
Influence Wastewater Reuse in Tanzania, Water related National Policies, Human
Health and Ecosystem Risk, Economic Issues and Technical issues. The following
sections provide glimpse of these opportunities.
2 Wastewater Quantity and Quality Considerations
2.1 Wastewater Quantity Generated from CW
Constructed Wetlands are “eco-friendly” alternatives with potential applications
ranging from secondary treatment of wastewater from various sources, to polishing
tertiary treated wastewater and diffuse pollution. Constructed wetlands can
effectively remove large quantities of pollutants from point sources (municipal,
industrial and agricultural wastewater) and non-point sources (mines, agriculture and
urban runoff), including organic matter, suspended solids, metals and nutrients to
required effluent discharge standards. They utilize multiple physical, chemical and
biological processes to achieve removal or transformation of pollutants in
wastewater.
While CW can be designed to accomplish a variety of wastewater treatment
objectives, they also provide benefits other than water quality improvement most of
them gauged to reuse of treated effluents. Tanzanian experience with subsurface
flow CW reveals that the systems can be designed and operated in a manner that
provide reuse opportunities including irrigation agriculture, horticulture, gardening,
fish farming and land rehabilitation. Only that the extent of the reuse scheme needs
to be in line with the amount of wastewater being generated from the CW after
treatment which actually can be estimated to be 75% – 85% of water consumption of a
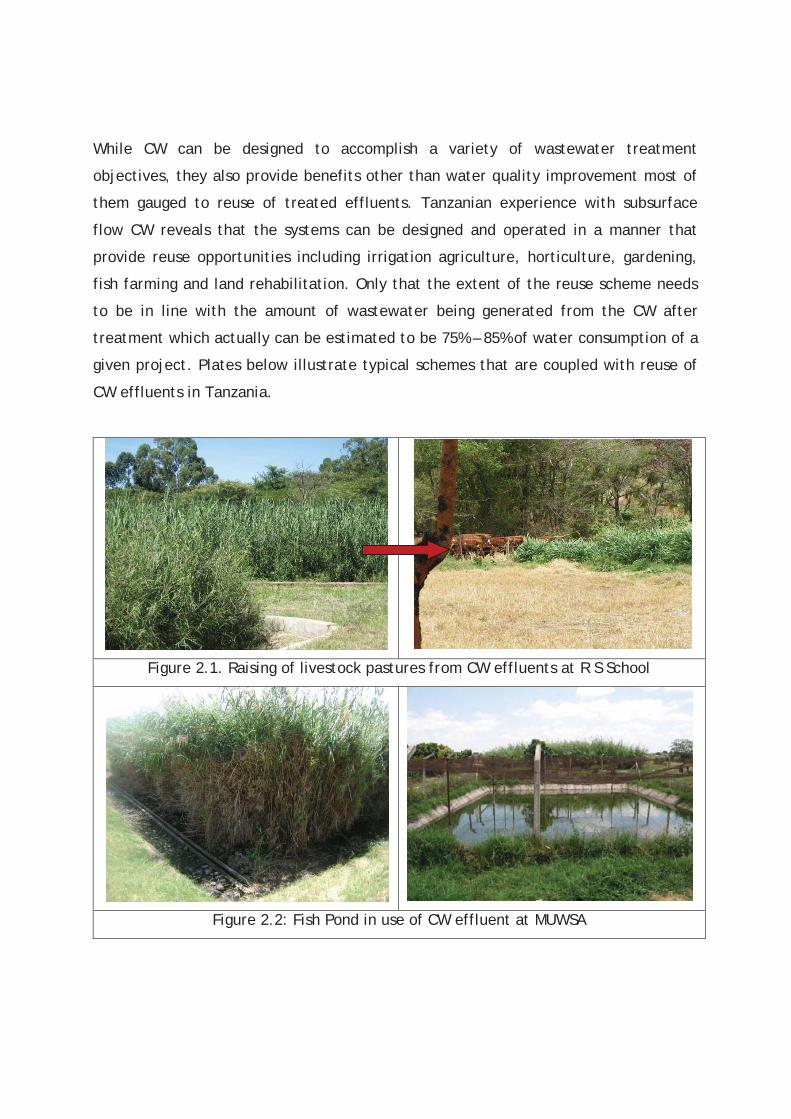
given project. Plates below illustrate typical schemes that are coupled with reuse of
CW effluents in Tanzania.
Figure 2.1. Raising of livestock pastures from CW effluents at R S School
Figure 2.2: Fish Pond in use of CW effluent at MUWSA
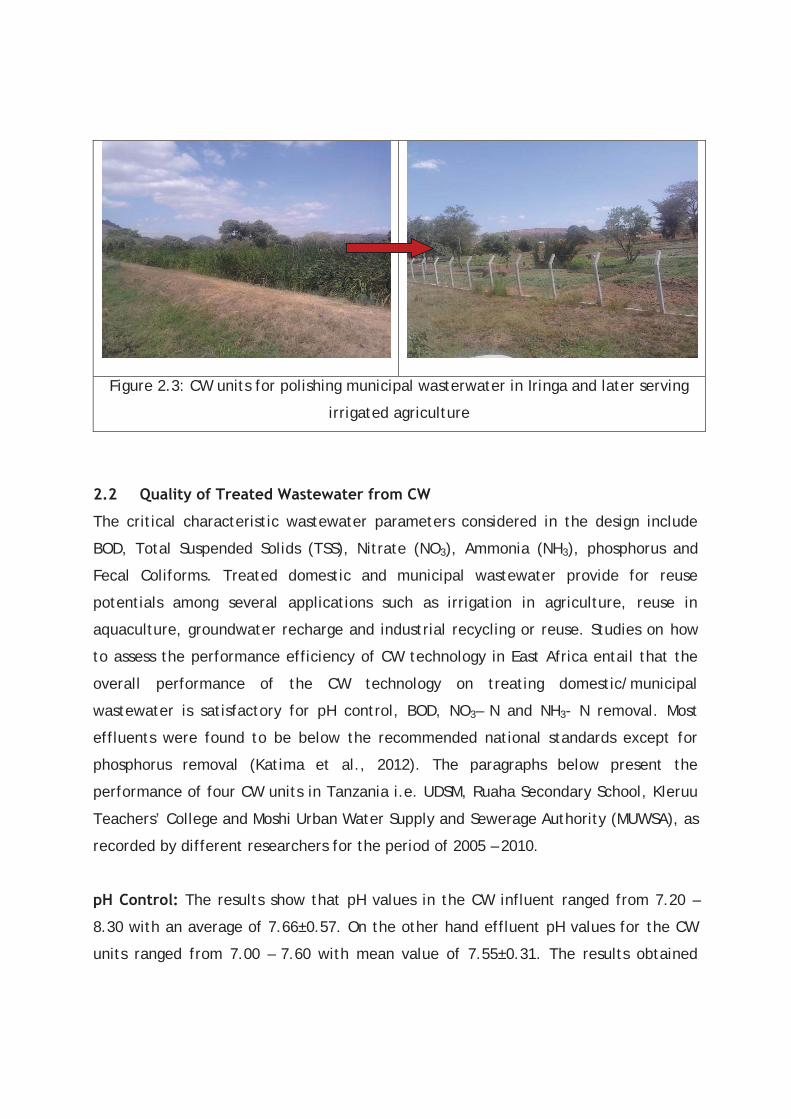
Figure 2.3: CW units for polishing municipal wasterwater in Iringa and later serving
irrigated agriculture
2.2 Quality of Treated Wastewater from CW
The critical characteristic wastewater parameters considered in the design include
BOD, Total Suspended Solids (TSS), Nitrate (NO3), Ammonia (NH3), phosphorus and
Fecal Coliforms. Treated domestic and municipal wastewater provide for reuse
potentials among several applications such as irrigation in agriculture, reuse in
aquaculture, groundwater recharge and industrial recycling or reuse. Studies on how
to assess the performance efficiency of CW technology in East Africa entail that the
overall performance of the CW technology on treating domestic/municipal
wastewater is satisfactory for pH control, BOD, NO3– N and NH3- N removal. Most
effluents were found to be below the recommended national standards except for
phosphorus removal (Katima et al., 2012). The paragraphs below present the
performance of four CW units in Tanzania i.e. UDSM, Ruaha Secondary School, Kleruu
Teachers’ College and Moshi Urban Water Supply and Sewerage Authority (MUWSA), as
recorded by different researchers for the period of 2005 – 2010.
pH Control: The results show that pH values in the CW influent ranged from 7.20 –
8.30 with an average of 7.66±0.57. On the other hand effluent pH values for the CW
units ranged from 7.00 – 7.60 with mean value of 7.55±0.31. The results obtained
reveals that pH values in the influents varied from time to time and from one source
to another possibly due to variations of alkalinity in the raw sewage. Results also show
that pH in the influent is higher than pH in the effluents possibly due to decrease in
alkalinity in the CW cells. Performance wise, the results agree with effluent discharge
standards as recommended by local authorities which require pH to be of a range of
6.5 – 8.5. However, the results revealed that for domestic wastewater pH is not a
critical parameter as both the influent and effluent met the recommended effluent
discharge standards.
BOD Removal: For the assessed CW units, influent BOD concentrations ranged from 51
- 200mg/l with average concentration of 127.75±61.02mg/l. The effluent BOD
concentration ranged from 12 – 41 mg/l. The inter-average BOD concentration is
22.00±12.94 mg/l. This is equivalent to the system efficiency of 82.78% for BOD
removal. Generally, the results entails better performed of the CW units as the BOD
in the effluents met recommended effluent discharge standards by local authorities.
Nitrate Removal: The results showed that characteristic Nitrate Nitrogen in raw
domestic/municipal wastewater range from 26.30 – 35.30 mg/l whereas Nitrate
concentration in CW effluents ranged from 11.30 – 11.44 mg/l. The influent and
effluent averages were 30.80±4.50 mg/l and 11.37±0.07 mg/l respectively. This is
equivalent to the CW efficiency of 63.08% on nitrate removal. The results entails
better performance of the CW units as the effluents met recommended effluent
discharge standards by local authorities.
Ammonia Removal: Influent ammonia concentrations for the assessed CW units
ranged from 24.87– 77.30 mg/l with average concentration of 51.09±26.22 mg/l. The
effluent Ammonia concentration ranged from 10.35 – 33.00mg/l. The inter-average
Ammonia concentration in the CW effluent was 21.68±11.33 mg/l. This is equivalent
to the system efficiency of 57.57% for Ammonia removal. Though the overall
performance efficiency did not meet recommended effluents discharge standards by
local authorities, some individual CW did meet (Table 2.1).
Phosphorus Removal: Laboratory analysis of wastewater samples showed that
Phosphorus concentration in raw domestic/municipal wastewater ranged from 18.10 –
56.50 mg/l whereas Phosphorus concentration in CW effluents ranged from 6.72±1.20
– 39.90mg/l. The influent and effluent averages were 50.50±6.00 mg/l and 29.00±6.00
mg/l respectively. This is equivalent to the CW efficiency of 42.57% on nitrate
removal. These results entail that CW is fairly poor on the removal of Phosphorus to
meet recommended effluent discharge standards as recommended by local authorities
in East Africa. However, this might be contributed by the types of substrates used and
operation hydrodynamics in the individual CW units
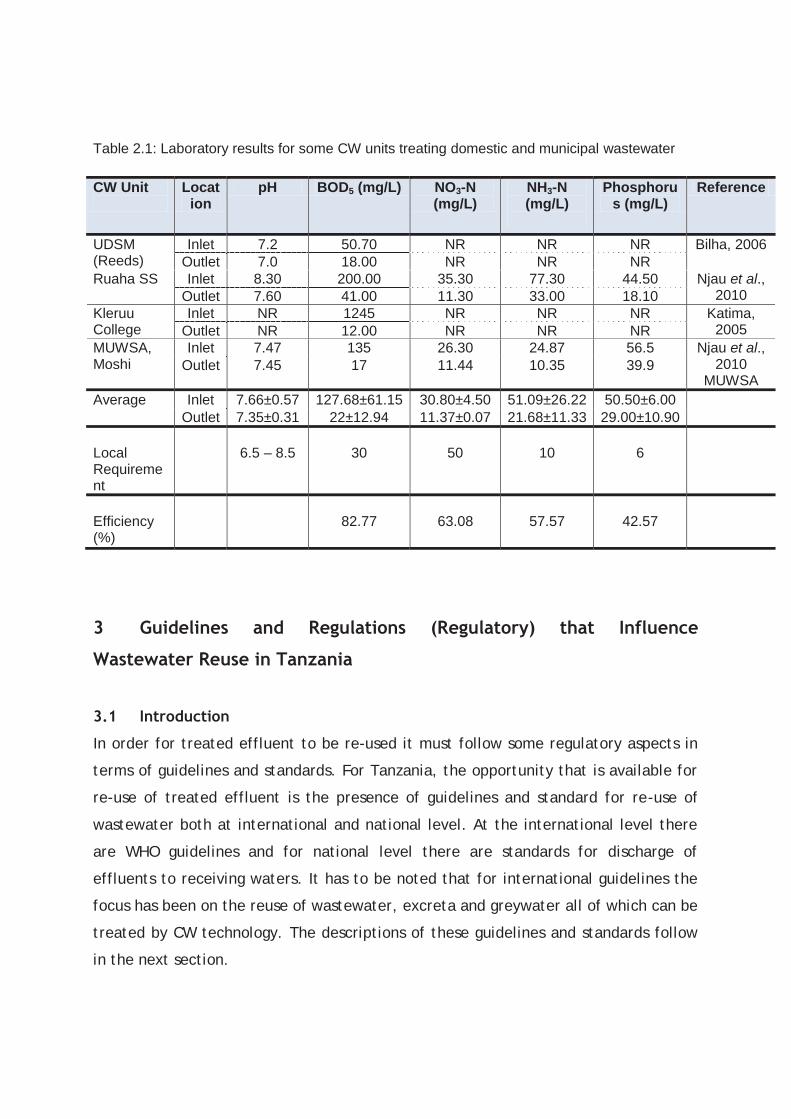
Table 2.1: Laboratory results for some CW units treating domestic and municipal wastewater
3 Guidelines and Regulations (Regulatory) that Influence
Wastewater Reuse in Tanzania
3.1 Introduction
In order for treated effluent to be re-used it must follow some regulatory aspects in
terms of guidelines and standards. For Tanzania, the opportunity that is available for
re-use of treated effluent is the presence of guidelines and standard for re-use of
wastewater both at international and national level. At the international level there
are WHO guidelines and for national level there are standards for discharge of
effluents to receiving waters. It has to be noted that for international guidelines the
focus has been on the reuse of wastewater, excreta and greywater all of which can be
treated by CW technology. The descriptions of these guidelines and standards follow
in the next section.
CW Unit
Location
pH BOD5 (mg/L) NO3-N (mg/L)
NH3-N (mg/L)
Phosphorus (mg/L)
Reference
UDSM (Reeds)
Inlet 7.2 50.70 NR NR NR Bilha, 2006 Outlet 7.0 18.00 NR NR NR
Ruaha SS Inlet 8.30 200.00 35.30 77.30 44.50 Njau et al., 2010 Outlet 7.60 41.00 11.30 33.00 18.10
Kleruu College
Inlet NR 1245 NR NR NR Katima, 2005 Outlet NR 12.00 NR NR NR
MUWSA, Moshi
Inlet 7.47 135 26.30 24.87 56.5 Njau et al., 2010
MUWSA Outlet 7.45 17 11.44 10.35 39.9
Average Inlet 7.66±0.57 127.68±61.15 30.80±4.50 51.09±26.22 50.50±6.00 Outlet 7.35±0.31 22±12.94 11.37±0.07 21.68±11.33 29.00±10.90
Local Requirement
6.5 – 8.5
30
50
10
6
Efficiency (%)
82.77
63.08
57.57
42.57
3.2 Regulatory Wastewater Reuse Criteria
3.2.1 International Guidelines (WHO Guidelines)
3.2.1.1 Guidelines for the safe use of wastewater and excreta in agriculture
and aquaculture
The overall objective of these Guidelines is to encourage the safe use of wastewater
and excreta in agriculture and aquaculture in a manner that protects the health of
the workers involved and of the public at large. In this context “wastewater” refers to
domestic sewage and municipal wastewaters that do not contain substantial
quantities of industrial effluent; “excreta” refers to night soil and to excreta derived
products such as sludge and septage. Health protection considerations will generally
require that some treatment be applied to these wastes to remove pathogenic
organisms. Other health protection measures are also considered, including crop
restriction, waste application techniques and human exposure control.
The Guidelines are addressed primarily to senior professionals in the various sectors
relevant to wastes reuse, and aim to prevent transmission of communicable diseases
while optimizing resource conservation and waste recycling. Emphasis is therefore on
control of microbiological contamination rather than on avoidance of the health
hazards of chemical pollution, which is of only minor importance in the reuse of
domestic wastes and is adequately covered in other publications. Purely agricultural
aspects are considered only in so far as they are relevant to health protection.
Hygiene standards applied to wastes reuse in the past, based solely on potential
pathogen survival, have been stricter than necessary. A meeting of sanitary engineers,
epidemiologists and social scientists, convened by the World Health Organization, the
World Bank and the International Reference Centre for Waste Disposal and held in
Engelberg, Switzerland, in 1985, proposed a more realistic approach to the use of
treated wastewater and excreta, based on the best and most recent epidemiological
evidence. The recommendations of the resulting Engelberg Report have formed the
basis for these Guidelines. The Guidelines are presented in four separate volumes the
descriptions of which follows below.
3.2.1.2 Guidelines for the safe use of wastewater, excreta and greywater.
Volume 1: Policy and regulatory aspects
Volume 1 of the Guidelines presents policy issues and regulatory measures distilled
from the technical detail found in volumes 2, 3 and 4. Those faced with the need to
expedite the development of policies, procedures and regulatory frameworks, at
national and local government levels, will find the essential information in this
volume. It also includes summaries of the other volumes in the series.
3.2.1.3 Guidelines for the safe use of wastewater, excreta and greywater.
Volume 2: Wastewater use in agriculture
Volume 2 of the Guidelines explains requirements to promote safe use concepts and
practices, including health-based targets and minimum procedures. It also covers a
substantive revision of approaches to ensuring the microbial safety of wastewater
used in agriculture. It distinguishes three vulnerable groups: agricultural workers,
members of communities where wastewater-fed agriculture is practiced and
consumers. It introduces health impact assessment of new wastewater.
3.2.1.4 Guidelines for the safe use of wastewater, excreta and greywater.
Volume 3: Wastewater and excreta use in aquaculture
Volume 3 of the Guidelines informs readers on the assessment of microbial hazards
and toxic chemicals and the management of the associated risks when using
wastewater and excreta in aquaculture. It explains requirements to promote safe use
practices, including minimum procedures and specific health-based targets. It puts
trade-offs between potential risks and nutritional benefits in a wider development
context. Special reference is made to food-borne trematodes.
3.2.1.5 Guidelines for the safe use of wastewater, excreta and greywater.
Volume 4: Excreta and greywater use in agriculture
Volume 4 of the Guidelines for the safe use of wastewater, excreta and greywater
provides information on the assessment and management of risks associated with
microbial hazards. It explains requirements to promote the safe use of excreta and
greywater in agriculture, including minimum procedures and specific health-based
targets, and how those requirements are intended to be used. This volume also
describes the approaches used in deriving the guidelines, including health-based
targets, and includes a substantive revision of approaches to ensuring microbial
safety.
3.3 Standards for Effluents and Receiving Waters in Tanzania
Tanzania has no specific wastewater reuse guidelines at the present juncture, though
it is in order to use the international guidelines like WHO and FAO. Despite the fact
that Tanzania has no specific wastewater reuse guidelines, it has developed standards
for effluents and receiving waters in Tanzania which in a way provides an opportunity
for wastewater re-use provided the standards for effluents are adhered to. The
following section describes standards for effluents and receiving waters in Tanzania.
The purpose of the standard is to indicate the quality of effluents permitted to be
discharged into water bodies. The use therefore is meant to promote a consistent
approach towards prevention of water pollution in Tanzania. The standard does not
cover requirements for hazardous effluents such as radioactive materials and hospital
wastes. For the purpose of application of this standard, pollution is defined as the
introduction by man, directly or indirectly, or substances or energy into the
environment resulting in deleterious effects of such a nature as to endanger human
health, harm leaving resources and ecosystems, and impair or interfere with
amenities and other legitimate uses of the environment. Receiving water is defined as
a perennial body of water, stream and watercourse receiving the discharged effluent
and effluent as water or wastewater discharged from a containing space such as
treatment plant, industrial process, lagoon, etc. Hazardous wastes is defined as any
discarded material containing substances known to be toxic, mutagenic, carcinogenic,
or teratogenic to humans or other life forms; ignitable, explosive, or highly reactive
alone or with other materials and water pollution as the impairment of suitability of
water from some considered purpose. The standards for effluents and receiving water
in Tanzania are shown in Table 2.
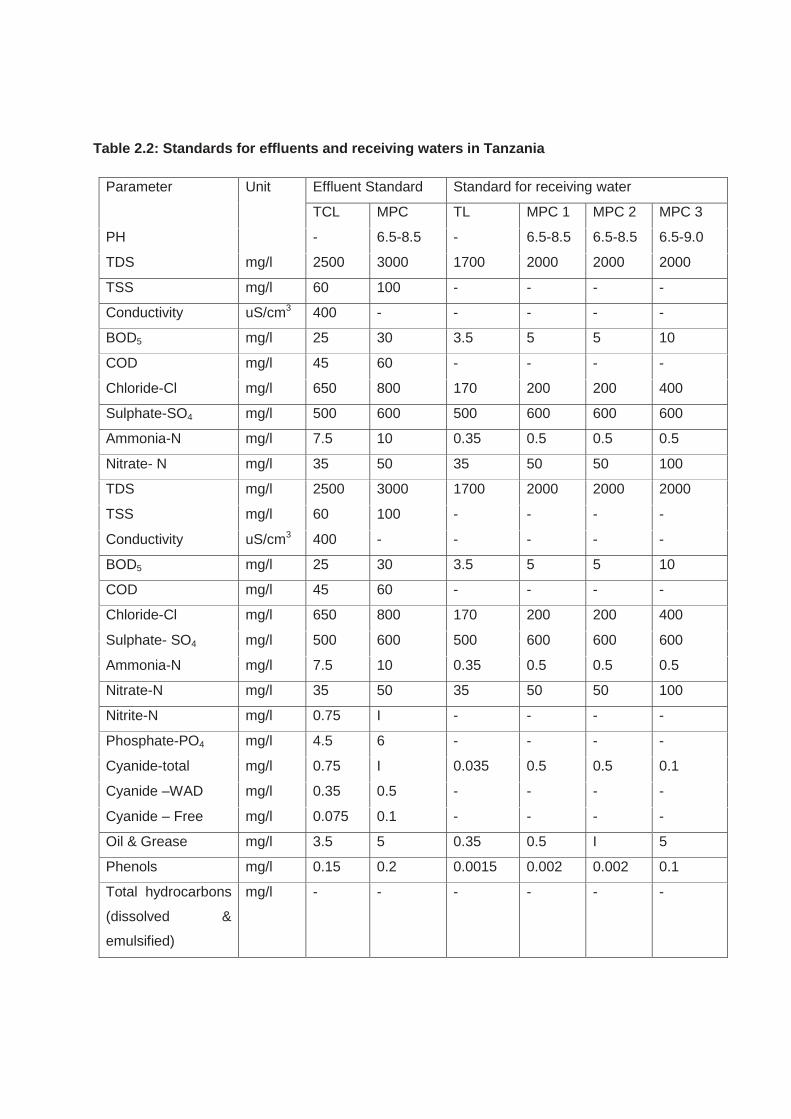
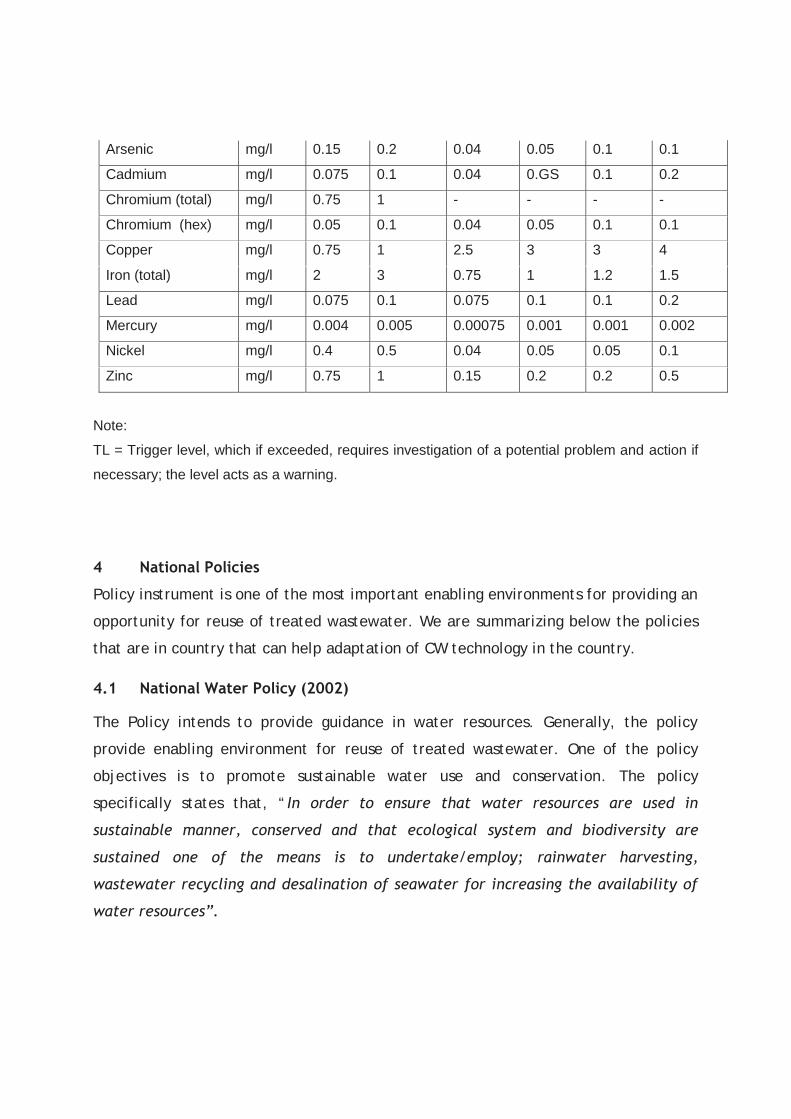
Table 2.2: Standards for effluents and receiving waters in Tanzania
Parameter Unit Effluent Standard Standard for receiving water
TCL MPC TL MPC 1 MPC 2 MPC 3
PH - 6.5-8.5 - 6.5-8.5 6.5-8.5 6.5-9.0
TDS mg/l 2500 3000 1700 2000 2000 2000
TSS mg/l 60 100 - - - -
Conductivity uS/cm3 400 - - - - -
BOD5 mg/l 25 30 3.5 5 5 10
COD mg/l 45 60 - - - -
Chloride-Cl mg/l 650 800 170 200 200 400
Sulphate-SO4 mg/l 500 600 500 600 600 600
Ammonia-N mg/l 7.5 10 0.35 0.5 0.5 0.5
Nitrate- N mg/l 35 50 35 50 50 100
TDS mg/l 2500 3000 1700 2000 2000 2000
TSS mg/l 60 100 - - - -
Conductivity uS/cm3 400 - - - - -
BOD5 mg/l 25 30 3.5 5 5 10
COD mg/l 45 60 - - - -
Chloride-Cl mg/l 650 800 170 200 200 400
Sulphate- SO4 mg/l 500 600 500 600 600 600
Ammonia-N mg/l 7.5 10 0.35 0.5 0.5 0.5
Nitrate-N mg/l 35 50 35 50 50 100
Nitrite-N mg/l 0.75 I - - - -
Phosphate-PO4 mg/l 4.5 6 - - - -
Cyanide-total mg/l 0.75 I 0.035 0.5 0.5 0.1
Cyanide –WAD mg/l 0.35 0.5 - - - -
Cyanide – Free mg/l 0.075 0.1 - - - -
Oil & Grease mg/l 3.5 5 0.35 0.5 I 5
Phenols mg/l 0.15 0.2 0.0015 0.002 0.002 0.1
Total hydrocarbons
(dissolved &
emulsified)
mg/l - - - - - -
Arsenic mg/l 0.15 0.2 0.04 0.05 0.1 0.1
Cadmium mg/l 0.075 0.1 0.04 0.GS 0.1 0.2
Chromium (total) mg/l 0.75 1 - - - -
Chromium (hex) mg/l 0.05 0.1 0.04 0.05 0.1 0.1
Copper mg/l 0.75 1 2.5 3 3 4
Iron (total) mg/l 2 3 0.75 1 1.2 1.5
Lead mg/l 0.075 0.1 0.075 0.1 0.1 0.2
Mercury mg/l 0.004 0.005 0.00075 0.001 0.001 0.002
Nickel mg/l 0.4 0.5 0.04 0.05 0.05 0.1
Zinc mg/l 0.75 1 0.15 0.2 0.2 0.5
Note:
TL = Trigger level, which if exceeded, requires investigation of a potential problem and action if
necessary; the level acts as a warning.
4 National Policies
Policy instrument is one of the most important enabling environments for providing an
opportunity for reuse of treated wastewater. We are summarizing below the policies
that are in country that can help adaptation of CW technology in the country.
4.1 National Water Policy (2002)
The Policy intends to provide guidance in water resources. Generally, the policy
provide enabling environment for reuse of treated wastewater. One of the policy
objectives is to promote sustainable water use and conservation. The policy
specifically states that, “In order to ensure that water resources are used in
sustainable manner, conserved and that ecological system and biodiversity are
sustained one of the means is to undertake/employ; rainwater harvesting,
wastewater recycling and desalination of seawater for increasing the availability of
water resources”.
Another important objective of the Policy is to improve the health and conditions of
people through integrating water supply and sanitation services and hygiene
education. Constructed wetland is a low cost sanitation system which its treated
effluent can be used as water supply for irrigation, industrial activities, etc.
Another objective of the Policy is to have a wastewater treatment system which is
environmentally friendly. The policy state that, “in order to ensure domestic and
industrial wastewater is not haphazardly discharged to contaminate water sources
and the environment one of the means is for Urban Water Supply and Sewerage
entities to co-operate with industries and other institutions in the research and
development of least cost technologies for wastewater treatment and recycling”.
Again, constructed wetlands are low cost sanitation systems whose treated effluent
can be recycled.
Another objective of the Policy is to manage the Water Demand. The policy state
that, “Water demand in urban areas is increasing at a rate, which is not proportional
to the rate of expansion of water supply and sewerage services. This is due to high
rate of urbanisation, increase of industrial activities and significant unaccounted-for-
water that includes leakage, wastage and illegal connections. Water demand
management measures will be undertaken to conserve and use the available water
efficiently and equitably, by instituting”. Treated effluents from constructed
wetlands can be reused to reduce the rate of water demand.
4.2 Sanitation and Hygiene Policy (2011, Draft One)
The Policy intends to provide guidance towards improvement of sanitation and
hygiene of a community. One of the policy objectives is to develop technologies which
are simple and appropriate to sanitation and hygiene. The Policy specifically states
that, “The Government in collaboration with stakeholders will carry out various
studies focusing on appropriate, simple and low cost technology in sanitation and
hygiene; The Government in collaboration with stakeholders will build capacities to
professionals to design technologies suitable to low income households; The
Government in collaboration with stakeholders shall sensitize communities on the
use of appropriate, simple and low cost technology in sanitation and hygiene” .
Constructed wetland is a low cost sanitation system and its treated effluent may be
reused for activities such irrigation, aquaculture which may generate food, income,
etc.
4.3 National Environmental Policy (1997)
The National Environmental Policy (NEP) is the overarching policy that sets broad
goals for environmental protection and committing Tanzania to sustainable
development of its natural resources. The policy provides guidance on sectoral
policies.
Among the policy objectives discussed in the water and sanitation sector is promotion
of technology for efficient and safe water use, particularly for water and wastewatre
treatment and recycling; and preventing, reducing and controlling pollution of the
marine and coastal waters, including from land-based sources of pollution.
Under industrial sector the policy advocates for installation of resource saving and
waste recycling facilities and controlling industrial emissions.
Although the policy do not specifically list the technologies to be used, it can be seen
that under this policy there is provision for CW to be used and its treated effluent to
be recycled.
5. Human Health and Ecosystem Risk
Wastewater reuse presents an opportunity to alter current practice and change the
types and degrees of risk. Relative to the risks associated with current wastewater
management, wastewater reuse could increase or decrease human health and
ecosystem risks via the consumption of or exposure to pathogenic microorganisms,
heavy metals, harmful organic chemicals such as endocrine disrupting compounds and
pharmaceutically-active compounds (Stagnitti et al. 1999). Of these, pathogenic
microorganisms are generally considered to pose the greatest threat to human health
(Toze, 2006). A wide variety of pathogenic microorganisms is found in wastewater,
including bacteria, viruses, protozoans and parasitic worms. The symptoms and
diseases associated with such infections are also diverse including typhoid, dysentery,
gastroenteritis, diarrhea and vomiting. The concentration of pathogens in wastewater
is dependent on the source population and the susceptibility to infection varies from
one population to another.
In recent times, the risks to human health arising from wastewater irrigation of
horticultural crops have been determined using Quantitative Microbial Risk
Assessment (QMRA) (Hamilton et al. 2005c). QMRA is a four-step process comprising
of (i) hazard identification, (ii) exposure assessment, (iii) dose-response modelling
and (iv) risk characterisation (Haas et al. 1999). Modelling efforts have been limited
by the availability of adequate data for defining the dose-response relation. Trials
where subjects are subjected to prescribed doses of pathogens is clearly conditional
upon ethics, and few such experiments have been undertaken. Perhaps not
coincidently, most of such studies were undertaken some time ago. Current QMRA
models therefore have to make use of surrogate species or strains, e.g. rotavirus,
when defining dose-response relations. Thus a poor knowledge of the infectivity
profiles of most pathogens remains and is a key constraint for the development of
rigorous QMRA models for wastewater reuse.
The primary objective of any wastewater reuse project must be to minimize or
eliminate potential health risks. In most developing countries like Tanzania, direct
wastewater reuse projects are normally practiced in urban areas. Indirect use occurs
when treated; partially treated or untreated wastewater is discharged to reservoirs,
rivers and canals that supply irrigation water to agriculture. Indirect use poses the
same health risks as planned wastewater use projects, but may have a greater
potential for health problems because the water user is unaware of the wastewater
being present. According to WHO (1989), health hazards associated with direct and
indirect wastewater use are of two kinds: the rural health and safety problem for
those working on the land or living on or near the land where the water is being used,
and the risk that contaminated products from the wastewater use area may
subsequently infect humans or animals through consumption or handling of the
foodstuff or through secondary human contamination by consuming foodstuffs from
animals that used the area
5.1 Effects on farm workers or wastewater treatment plant workers
There is risk of infection among workers using partially treated wastewater for
irrigation. The first study (Katzenelson et al., 1976) suggested increases in
salmonellosis, shigellosis, 14 typhoid fever and infectious hepatitis in farmers and
their families working on or living near fields sprinkler irrigated with effluent from
oxidation ponds (retention 5-7 days), but the study was methodologically flawed. The
second study (Fattal et al., 1986b) found a twofold excess risk of clinical ’enteric’
disease in young children (0-4 years) living within 600-1000m from sprinkler irrigated
fields, but this was in the summer irrigation months only, with no excess illness found
on an annual basis. The third study (Fattal et al., 1986c and Shuval et al., 1989) found
that episodes of enteric disease were similar in Kibbutzim most exposed to treated
wastewater aerosols (sprinkler irrigation within 300-600m of residential areas) and
those not exposed to wastewater in any form. The wastewater was partially treated
in ponds with 5-10 days retention reaching a quality of 104-105 coliforms/100ml.
No excess of enteric disease was seen in wastewater contact workers or their
families, as well as in the general population living near the fields. This prospective
study is considered to be conclusive, having a superior epidemiological design. In
instances where the sewage water has not received treatment, the level of
pathogenic organisms is likely to be higher whether the use is occurring directly from
raw sewage or from raw sewage that has been blended with other water supplies. In
both instances, pathogenic organisms will reach the agricultural fields. These
pathogenic organisms, as with treated sewage, have the potential to contaminate
both the soil and the crop depending upon how the irrigation water is used. The
critical element is to understand that whether treated, partially treated, or untreated
water is used, pathogenic organisms are present and the use site must be managed in
a manner that minimizes or eliminates the potential for disease transmission.
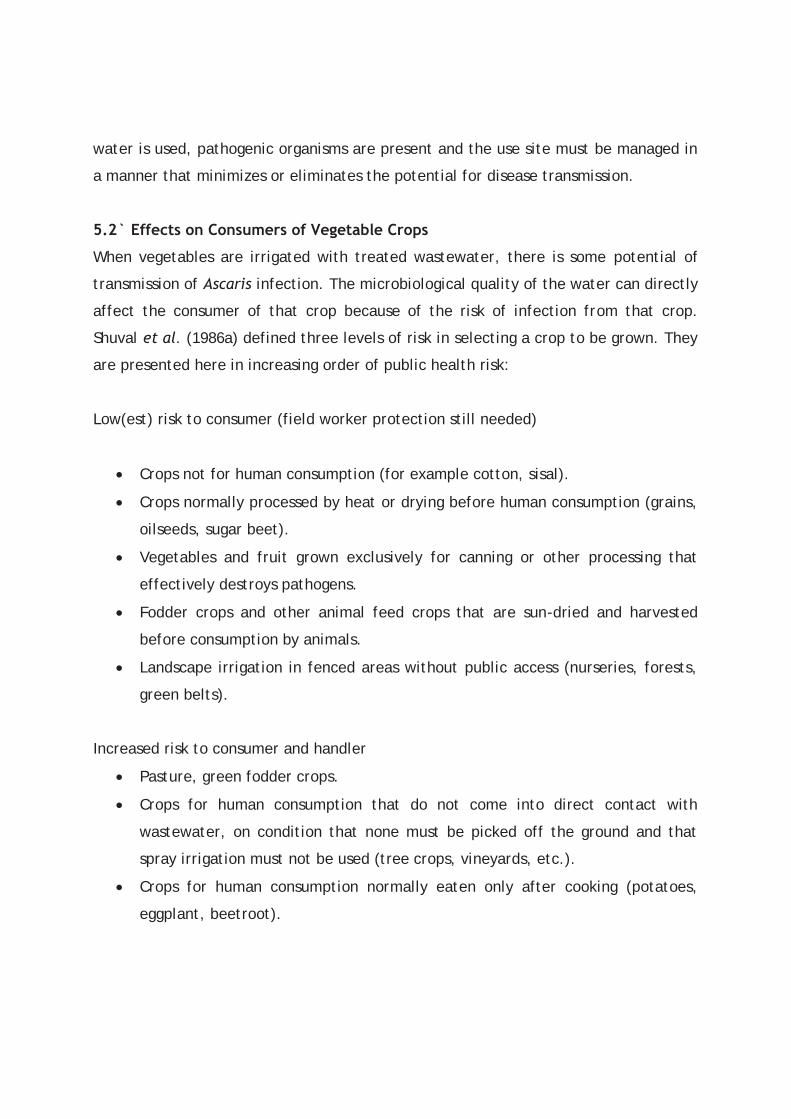
5.2` Effects on Consumers of Vegetable Crops
When vegetables are irrigated with treated wastewater, there is some potential of
transmission of Ascaris infection. The microbiological quality of the water can directly
affect the consumer of that crop because of the risk of infection from that crop.
Shuval et al. (1986a) defined three levels of risk in selecting a crop to be grown. They
are presented here in increasing order of public health risk:
Low(est) risk to consumer (field worker protection still needed)
Crops not for human consumption (for example cotton, sisal).
Crops normally processed by heat or drying before human consumption (grains,
oilseeds, sugar beet).
Vegetables and fruit grown exclusively for canning or other processing that
effectively destroys pathogens.
Fodder crops and other animal feed crops that are sun-dried and harvested
before consumption by animals.
Landscape irrigation in fenced areas without public access (nurseries, forests,
green belts).
Increased risk to consumer and handler
Pasture, green fodder crops.
Crops for human consumption that do not come into direct contact with
wastewater, on condition that none must be picked off the ground and that
spray irrigation must not be used (tree crops, vineyards, etc.).
Crops for human consumption normally eaten only after cooking (potatoes,
eggplant, beetroot).
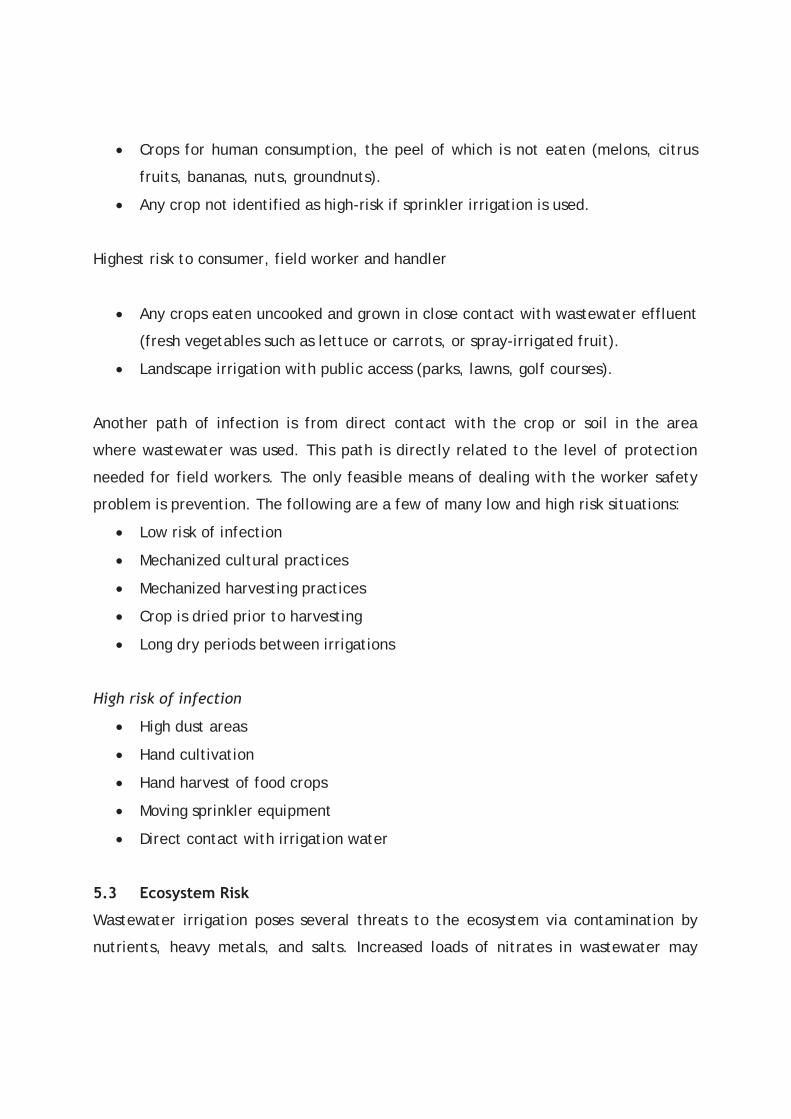
Crops for human consumption, the peel of which is not eaten (melons, citrus
fruits, bananas, nuts, groundnuts).
Any crop not identified as high-risk if sprinkler irrigation is used.
Highest risk to consumer, field worker and handler
Any crops eaten uncooked and grown in close contact with wastewater effluent
(fresh vegetables such as lettuce or carrots, or spray-irrigated fruit).
Landscape irrigation with public access (parks, lawns, golf courses).
Another path of infection is from direct contact with the crop or soil in the area
where wastewater was used. This path is directly related to the level of protection
needed for field workers. The only feasible means of dealing with the worker safety
problem is prevention. The following are a few of many low and high risk situations:
Low risk of infection
Mechanized cultural practices
Mechanized harvesting practices
Crop is dried prior to harvesting
Long dry periods between irrigations
High risk of infection
High dust areas
Hand cultivation
Hand harvest of food crops
Moving sprinkler equipment
Direct contact with irrigation water
5.3 Ecosystem Risk
Wastewater irrigation poses several threats to the ecosystem via contamination by
nutrients, heavy metals, and salts. Increased loads of nitrates in wastewater may
increase the risk of groundwater contamination (Stagnitti et al. 1998). The risks can
be markedly reduced, however, by appropriately matching plant production systems
to effluent characteristics (Snow et al. 1999). High-yielding crops with large amounts
of nitrogen in their biomass would be more effective than tree plantations at reducing
nitrate leaching. However, the most important sustainability constraints are due to
salinity and sodicity. Salinity is a pragmatic constraint for many horticultural reuse
schemes. Sodicity induces changes in the soil’s physical properties, the most notable
effect being the dispersion of soil aggregates. Dispersion, in combination with other
processes, such as swelling and slacking, can affect plants through decreasing the
permeability of water and air through the soil, water-logging, and impeding root
6 Economic Issues
6.1 Introduction
Reuse of treated effluent also provides economic opportunities in terms of products
from re-use. From economic point of view it is important to show the economic
viability of CW technology for its opportunity. One can look the economic opportunity
from two faces, namely Cost Benefit Analysis and Financial Analysis of the Selected
Sanitation Options from use of e.g. nutrients from treated wastewater. The following
sections explain these faces of opportunity starting with CB analysis from an existing
CW system in Tanzania in Ruaha Secondary School and then demonstrate the financial
analysis of the Selected Sanitation Options which are pit latrine and ecological
sanitation (UDDT) by using nutrients that are considered as fertilizers in the waste.
6.2 Cost Benefit Analysis from CW
Economic viability is based on CBA from data collected from CW in Ruaha Secondary
School (RSS). The CBA analysis that was carried out in this study was based on only
one constructed wetlands project in Tanzania, namely at RSS. We base our financial
CBA on the following data and assumptions (Balkema, et al., 2010):

The project life time is set to 10 years, assuming that a constructed wetland
(CW) will in fact last longer than that, the residual value of the CW at the end
of the project life-time is set to half the construction value in year 0.
The average expected inflation rate in Tanzania is set to 8.7%.
The interest on a commercial loan for a period longer than 5 years is 15.7%.
The following cash outflows for the non-financial operations for a constructed
wetland project are distinguished: (1) design costs of the Constructed Wetland
(in year 0); (2) building materials (in year 0); (3) other construction costs such
as wages (in year 0) and (4) Operation and Maintenance costs (in year 1 through
9).
The cash inflows of the non-financial operations of the project consist of all
direct and indirect cash inflows caused by implementing the project, in this
case: the reduction of sanitation costs caused by the constructed wetland. For
instance avoidance of costs of waste dumping; or avoidance of cleaning costs of
the existing system which is replaced by or extended with the newly
constructed wetlands. In most cases these are avoided costs by not having to
empty the septic tank as often as before. For the case study of constructed
wetlands at Ruaha Secondary School in Iringa,
In Tanzania, the following data was collected:
The initial costs of the project are completely covered by grants.
The total construction costs for the CW are relatively low, because the
university (UDSM) does not charge for the design of the wetland, furthermore
the construction is taken care of by students and employees of the school.
Therefore, the only construction costs are the TSh. 3,121,250 (US$ 2,500) for
construction materials.
Operation & Maintenance of the Wetland is TSh. 420,000 (US$ 340) per year for
wage costs and costs of measuring the water quality on various indicators.
The introduction of the CW reduces the cleaning cost of the school's septic tank
that was its dominant sanitation technology until then: instead of emptying the
tank 4 times a month, it now needs to be emptied only once a year. Emptying
the septic tank costs TSh. 25,000 (US$ 20).
In the case of Ruaha Secondary School the constructed wetland is financial feasible
because of the relatively high avoided costs of not having to empty the septic tank as
often as before implementing the wetland. The calculated Net Present Value (NPV) is
2,807,000 TSh. (US$ 2,250), the Internal Rate of Return (IRR) 33% (compare to
nominal interest rate of 16%) and the Pay Back Period (PBP) lies between 4 and 5
years. As a sensitivity analysis, switching values are calculated indicating at what rise
investment or maintenance costs or a drop in benefits (less avoided costs) the NPV
will become zero. In the case of the Ruaha Secondary School investment costs higher
than 7,047,000 TSh. (5,640 US$) (2,3 times the realized investment costs) would make
the project financially unattractive (NPV = 0). Similarly, doubling the operation and
maintenance costs would make the project financially unfeasible (NPV = 0) and 35%
lower avoided costs would make the project financially unfeasible as (NPV = 0). From
these indicators for sensitivity we conclude that the project is a rather safe
investment in financial terms. In addition, the investment costs for the Ruaha
Secondary School constructed wetland project were granted, as such the project was
without a doubt a financial success.
Based on the Ruaha case study we conclude that in cases where relatively high cost
can be avoided by implementing a constructed wetland the investment will be
financial feasible. In Ruaha the avoided cost, on yearly basis, was as high as 38% of
the initial investment In the literature no comparable analyses were found using
similar avoided cost situations, although reference can be found on comparison of
costs for different wastewater treatment systems. For instance, in his economic
analysis (Chapter 7) Okurut (2000) compares the costs for a constructed wetland with
a waste stabilization pond for the treatment of wastewater for 4000 p.e. in Uganda
and concludes that constructed wetlands are economically competitive. Land costs for
the WSP was estimated to be 30% higher as a larger area is required, while the
operating and maintenance costs are similar for both systems (Okurut 2000, p149),
therefore making constructed wetlands the most attractive option.
Mannino et al. (2008) compare the costs of semi natural free water surface wetlands
(SN FWS) to activated sludge wastewater treatment plants, and conclude that the
wetlands were more economical. Despite high development costs, estimated to be
six- to nine-fold higher for the wetlands than for the activated sludge plants (Mannino
(2009) p.125, note: excluding land costs!). The total cost needed to give an annual
wastewater treatment service per i.e. were calculated to be two- to eight-fold lower
over the entire 20 years lifespan, respectively based on a discount rate of 5 and 10%
(Mannino (2008) p.124 and p.127). Mainly due to lower maintenance costs, the higher
development costs where more than offset in 2 to 3 years (Mannino 2008, p.127).
These finding are a bit more promising but in the same range as our results.
6.2.1 Societal Cost Benefit Analysis
All data in the previous section, supporting the implementation of constructed
wetlands, refer to direct and indirect costs for the investor, but as for any water and
sanitation project the main benefits are societal. Since fewer people get sick and
fewer children die of diarrhoeal diseases the benefits for the society are much larger.
This should be taken into account on national and international level. To strengthen
the arguments for the discussions on policy making and setting soft loans and
subsidies we include a societal cost benefit analysis. In the Ruaha School project the
student population at the school is the target population. This is a secondary school
(children aged between 12 and 18), there are no children under five which are most
likely to die of diarrhoeal diseases, and therefore no mortality rate needs to be
calculated for this CBA.
The total population at the Ruaha Secondary School is 750. The table
summarizes the estimated health impacts caused by the construction of a
constructed wetland. The technology is estimated to prevent between 9 and in
28 diarrhoeal incidents (low and high case see Hutton 2004). Assuming an
average of three days off school per case of diarrhoea there are 27 to 84 days
of school attendance gained.
These health benefits need to be transformed into economic benefits with the help of
the following statistics:
Patient expenses avoided due to avoided illness: The avoided costs of
treatment of ill children involve the cost of medicine (ORS). The average cost
of diarrhoea treatment per child in Sub Sahara Africa is TSh. 7,200 (US$5.50)4.
Value of child days gained of those with avoided illness. When a child is ill
(assumed to be 3 days on average) at least one of the parents has to stay at
home to take care of the child; assuming that this parent is usually working,
this would lead to income losses. The average daily wage of one parent is set
to Tsh.4,000 (US$ 3.2) per day.
The societal Accounting Rate of Interest (ARI) can be calculated based on the long-
term interest rate on Tanzanian government bonds, which is approximately 4% ex-
inflation.
For the socio-economic CBA, the actual costs for the design of the constructed
wetland which the university (UDSM) provided for free are also needed. These
costs are estimated to be10% of the wetland construction costs.
The shadow wage rate is approximately zero in Tanzania.
If taking these societal benefits in account in the CBA makes the project even more
attractive to invest in, the NPV calculated is as high as 11,100,000 TSh. (8,880 US$)
and the real IRR is 493% (compare with the real ARI of 4%) and the payback period is
as short as 1 year. Even if the avoided costs of the frequent emptying of the septic
tank before constructing the wetland is set to zero, the NPV calculated remains
positive namely 2,200,000 TSh. (1,760 US$) and the IRR remains high (106%) and the
investment can still be paid back within one year. From this it is safe to conclude that
investments in water and sanitation facilities should be facilitated by governments
and international institutions as the cost of not financing these projects is high not
only in terms of suffering but even in terms of money.
We are not the only ones concluding that not investing in water and sanitation in
developing countries costs money. Hutton and Haller (2004) report that the total
annual economic benefits of water and sanitation interventions in the East African
region are estimated to be 52 US$ (2000) per person when realizing access to
improved water supply and sanitation for all, and 72 US$ (2000) with addition of
minimal water disinfected at point of use (Hutton and Haller (2004), p.34, p.46).
Benefit Cost ratio’s for the East Africa Region are estimated to be 12 when realizing
access to improved water supply and sanitation for all, and 15 for addition of minimal
water disinfected at point of use (Hutton and Haller (2004) p. 85). These Benefit Cost
ratios drop to 2 and 3 when high costs and low benefits are assumed (Hutton and
Haller (2004)). So even for the lowest estimates benefits are twice as high as the
costs. Investments in water and sanitation in developing countries are not only
needed from humanitarian point of view but are also paying back.
6.3 Financial Analysis of the Selected Sanitation Options
This section compares the costs of the two short-listed options, taking into accounts
all components of the system. This is intended to highlight the various cost aspects
that may not be very obvious at the beginning of a project because often people only
consider the cost of the toilets and do not consider what happens to the excreta later
on, nor are the O & M costs of the entire system normally taken into consideration.
Financial costs of the selected sanitation include cost of Labor, Building materials,
empting and disposal as shown in the tale below.
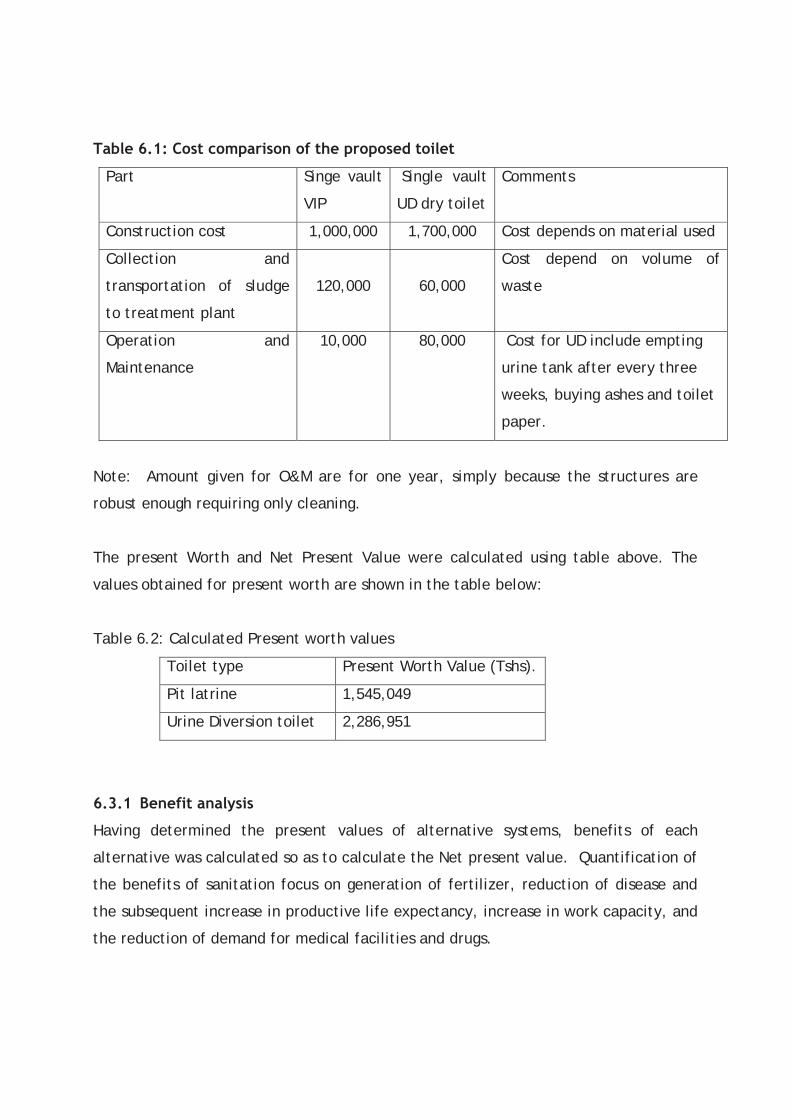
Table 6.1: Cost comparison of the proposed toilet
Part Singe vault
VIP
Single vault
UD dry toilet
Comments
Construction cost 1,000,000 1,700,000 Cost depends on material used
Collection and
transportation of sludge
to treatment plant
120,000
60,000
Cost depend on volume of
waste
Operation and
Maintenance
10,000 80,000 Cost for UD include empting
urine tank after every three
weeks, buying ashes and toilet
paper.
Note: Amount given for O&M are for one year, simply because the structures are
robust enough requiring only cleaning.
The present Worth and Net Present Value were calculated using table above. The
values obtained for present worth are shown in the table below:
Table 6.2: Calculated Present worth values
Toilet type Present Worth Value (Tshs).
Pit latrine 1,545,049
Urine Diversion toilet 2,286,951
6.3.1 Benefit analysis
Having determined the present values of alternative systems, benefits of each
alternative was calculated so as to calculate the Net present value. Quantification of
the benefits of sanitation focus on generation of fertilizer, reduction of disease and
the subsequent increase in productive life expectancy, increase in work capacity, and
the reduction of demand for medical facilities and drugs.
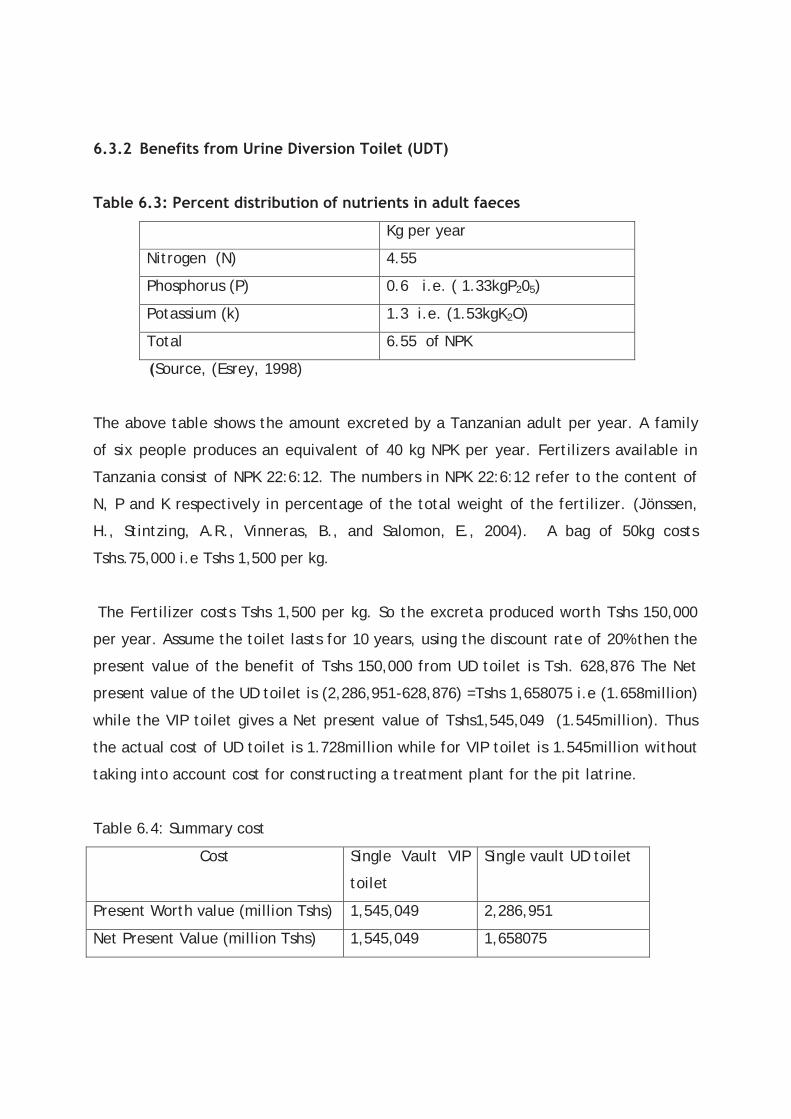
6.3.2 Benefits from Urine Diversion Toilet (UDT)
Table 6.3: Percent distribution of nutrients in adult faeces
Kg per year
Nitrogen (N) 4.55
Phosphorus (P) 0.6 i.e. ( 1.33kgP205)
Potassium (k) 1.3 i.e. (1.53kgK2O)
Total 6.55 of NPK
(Source, (Esrey, 1998)
The above table shows the amount excreted by a Tanzanian adult per year. A family
of six people produces an equivalent of 40 kg NPK per year. Fertilizers available in
Tanzania consist of NPK 22:6:12. The numbers in NPK 22:6:12 refer to the content of
N, P and K respectively in percentage of the total weight of the fertilizer. (Jönssen,
H., Stintzing, A.R., Vinneras, B., and Salomon, E., 2004). A bag of 50kg costs
Tshs.75,000 i.e Tshs 1,500 per kg.
The Fertilizer costs Tshs 1,500 per kg. So the excreta produced worth Tshs 150,000
per year. Assume the toilet lasts for 10 years, using the discount rate of 20% then the
present value of the benefit of Tshs 150,000 from UD toilet is Tsh. 628,876 The Net
present value of the UD toilet is (2,286,951-628,876) =Tshs 1,658075 i.e (1.658million)
while the VIP toilet gives a Net present value of Tshs1,545,049 (1.545million). Thus
the actual cost of UD toilet is 1.728million while for VIP toilet is 1.545million without
taking into account cost for constructing a treatment plant for the pit latrine.
Table 6.4: Summary cost
Cost Single Vault VIP
toilet
Single vault UD toilet
Present Worth value (million Tshs) 1,545,049 2,286,951
Net Present Value (million Tshs) 1,545,049 1,658075
The option with the lowest NPV would be the economic choice to invest in, but also it
is necessary to account for the long-term sustainability advantages during the lifetime
of these options, Thus from table 6 above, costs for UD toilet and VIP is almost the
same, then UDDT is the best option for poor people in peri-urban that’s meet the
criteria’s set which includes protection of ground water which is the dependent
source of water for people.
This last example demonstrate the same principles that can be used with CW to
realize the economic benefits emanating from reuse of treated effluents and hence
its economic opportunity.
7 Technical issues 7.1 Technical Feasibility of Constructed Wetlands
The potential for application of CW technology in the developing world is enormous.
Most of the developing countries have warm tropical and subtropical climates that are
conducive for higher biological activity and productivity, hence better performance of
wetland systems. Tropical and subtropical regions are known to sustain a rich
diversity of biota that may be used in wetlands. Although land may be a limiting
factor in dense urban areas, constructed wetlands are potentially well suited to
smaller communities where municipal land surrounding schools, hospitals, hotels and
rural areas is not in short supply (Kivaisi, 2001).
In addition, successful case studies from users of CWs in Tanzania reveals that CWs
have lower total lifetime costs, lower capital costs than conventional treatment
systems, lower air and water emissions, lower secondary wastes, lower operations and
maintenance costs and ability to tolerate high fluctuations in flow. Besides, the
technology is ideal for decentralized wastewater treatment and from health point of
view, the systems (mainly the subsurface type of CWs) do discourage mosquito
breeding sites and in that way contribute positively in combating malaria.
For the large population of dwellers living in informal densely populated urban and
poor rural areas in low income countries, who experience lack and inadequacy of
sanitation services and particularly exposed to wastewater related nuisances daily,
CW technology promise significant benefits not only in environmental sustainability
but also in terms of public health and economic gains.
7.2 WSP and CW Research Group
This is a team of experts and researchers who introduced CW technology in Tanzania
and the East African Region at large. The group stand to be a very important
institution and therefore opportunity for dissemination of CW in the region. It is based
at the College of Engineering and Technology, University of Dar Es Salaam since 1995.
It is made up of multi-disciplinary scientists and engineers who are experts in various
fields related to wastewater management and sanitation including civil/water
resources engineering, civil/geotechnical engineering, chemical and process
engineering, environmental engineering, botany, zoology, health and marine sciences,
sociology. As time goes on, some members of the group have been moving to other
institutions while scientist and researchers from other institution have been joining
the group. As such, currently, the research has a total of 16 members based at the
University of Dar Es Salaam (UDSM), Ardhi University (ARU), The Nelson Mandela
African Institute of Science and Technology (NM-AIST), The Open University of
Tanzania (OUT), Muhimbili University of Health and Allied Sciences (MUHAS),
University of Dodoma (UDOM) and Tanzania Industrial Research and Development
Organization (TIRDO). The group is continually working on CW and other innovative
technologies. Actually, the group is an authority when it comes to CW technology in
East African Region.
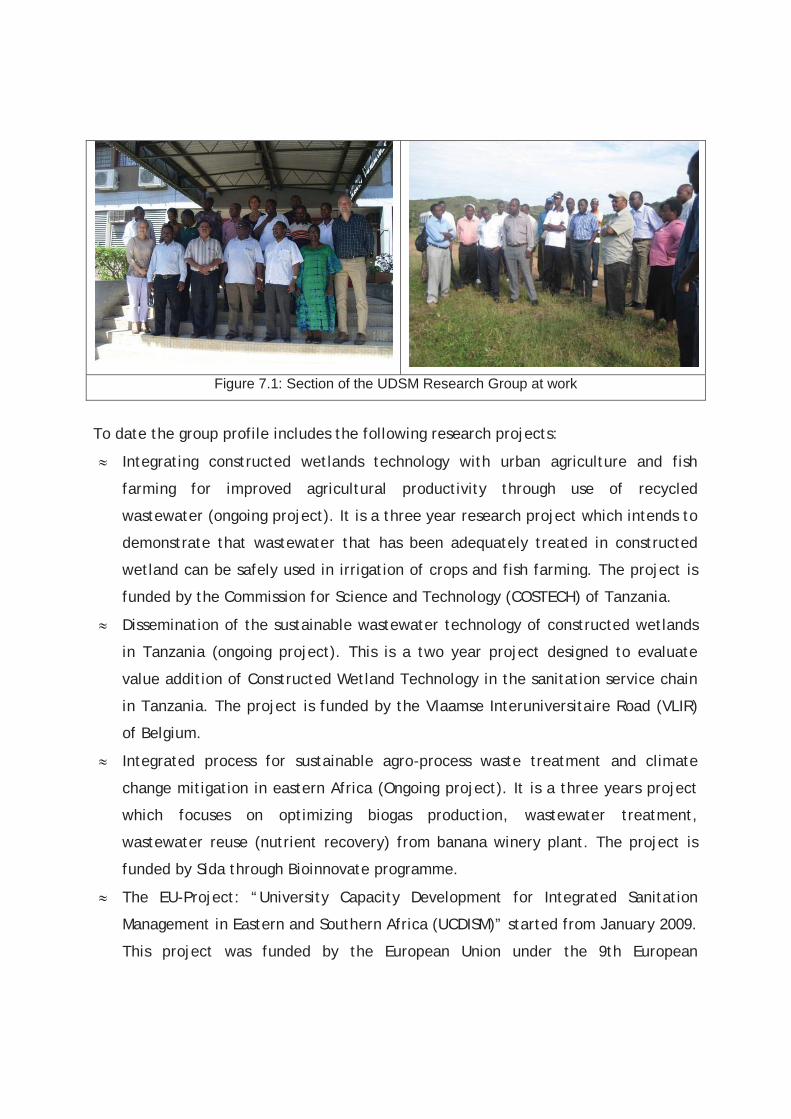
Figure 7.1: Section of the UDSM Research Group at work
To date the group profile includes the following research projects:
Integrating constructed wetlands technology with urban agriculture and fish
farming for improved agricultural productivity through use of recycled
wastewater (ongoing project). It is a three year research project which intends to
demonstrate that wastewater that has been adequately treated in constructed
wetland can be safely used in irrigation of crops and fish farming. The project is
funded by the Commission for Science and Technology (COSTECH) of Tanzania.
Dissemination of the sustainable wastewater technology of constructed wetlands
in Tanzania (ongoing project). This is a two year project designed to evaluate
value addition of Constructed Wetland Technology in the sanitation service chain
in Tanzania. The project is funded by the Vlaamse Interuniversitaire Road (VLIR)
of Belgium.
Integrated process for sustainable agro-process waste treatment and climate
change mitigation in eastern Africa (Ongoing project). It is a three years project
which focuses on optimizing biogas production, wastewater treatment,
wastewater reuse (nutrient recovery) from banana winery plant. The project is
funded by Sida through Bioinnovate programme.
The EU-Project: “University Capacity Development for Integrated Sanitation
Management in Eastern and Southern Africa (UCDISM)” started from January 2009.
This project was funded by the European Union under the 9th European
Development Fund (EDF), ACP-EU Cooperation Programme in Higher Education
(EDULINK) and scheduled from January 2009 to December 2011. Despite the fact
that the project has just ended, the Masters Programme in sanitation is still
running at UDSM, with the enrolment of about 12 students every year. The three-
year project was coordinated by University of Siegen and its implementing
partners included the University of Dar Es Salaam as a hosting institution,
Kenyatta University, Kenya (KU), Makerere University, Uganda (MAK) and
University of Zambia, Zambia (UMZA)
Transfer of CW technology for decentralized wastewater treatment (Bio-Earn
Innovation Fund by SIDA: 2009 – 2010)
Constructed Wetland for decentralized wastewater treatment in Seychelles and at
Shimo la Tewa Prison, Kenya (2009/2010)
Mtoni – Msingini stormwater drainage and sewerage system incorporating waste
stabilization pond and constructed wetland for wastewater treatment (2008 –
2011)
Development of efficient technologies for sustainable treatment of high strength
wastewater in Eastern Africa (Bio Earn programme by SIDA: 2008 – 2010)
Peri - Urban mangrove forests as filters and potential phytoremediators of
domestic sewage in East Africa (EU funded PUMPSEA Project: 2004 – 2009)
Application of CW for polishing Waste Stabilization Ponds effluents (1998 – 2002)
Ecological modelling of Waste Stabilization Pond systems (1995 - 1998)
The group builds capacity of CW technology and has prepared and developed Design
Manual, Operation and Maintenance Manual and Construction Instructional Manual for
the CW for use in Tropical Climatic countries. In addition, the group has developed a
website and a network of consultants and NGOs working together in the
commercialization and dissemination of CW technology in Tanzania and the East
African Region. Currently, the group is working in close collaboration with the
following partners in the network:
WWS Design and Development Company Limited: This is a consulting firm
providing consultancy services in water, wastewater and sanitation issues. The
company is based in Dar Es Salaam and among other things it provides technical
expertise in the design, construction supervision and capacity building regarding
new innovative wastewater and sanitation technologies including Constructed
Wetland Technology.
AGENDA and ENVICON: These are local NGOs based in Dar Es Salaam, Tanzania.
The research group maintain and strengthen close links with them to better
harness their experience, resources and facilities for the success CW technology
dissemination. In the previous and ongoing undertakings, the collaboration with
these organizations has been very successful especially on working with media,
awareness raising, materials dissemination and issues related to documentary and
communication startegies. The results of this collaboration are extremely well
received by target participants.
8.0 Estimation of the yield of products
Food security is closely linked with water security. Between 30 and 40 percent of the
world's food comes from the proportion of the total cultivated land which is irrigated
(16%) Irrigation using WW provide double benefit. In Tanzania a minimal research has
been done on estimating yield of crops fertilized/irrigated using WW. A pot
experiment conducted at MORUWASA by UDSM WSP research team revealed that
yields of Paddy and Swisschard were either increased by dilute WW extracted from
the 1st maturation pond or depressed by concentrated WW (See Figures 1 and 2).
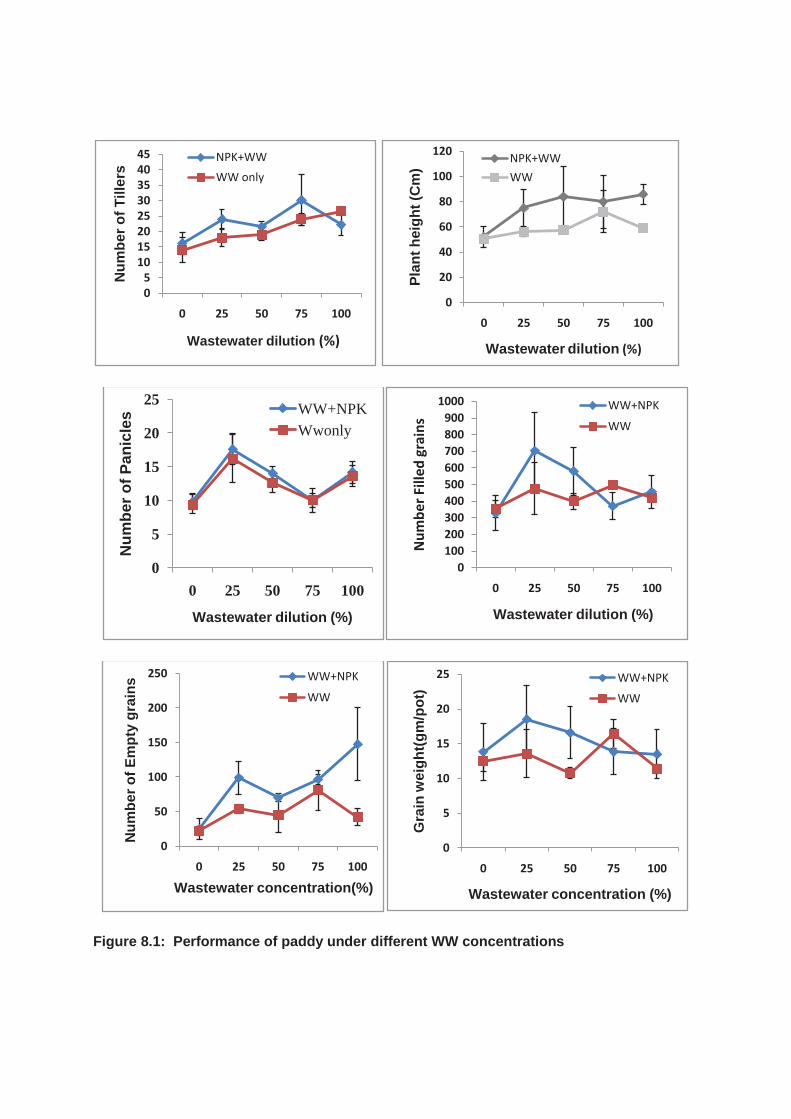
Figure 8.1: Performance of paddy under different WW concentrations
05
1015202530354045
0 25 50 75 100
Num
ber o
f Till
ers
Wastewater dilution (%)
NPK+WWWW only
0
20
40
60
80
100
120
0 25 50 75 100
Plan
t hei
ght (
Cm
)
Wastewater dilution (%)
NPK+WWWW
0
5
10
15
20
25
0 25 50 75 100
Num
ber o
f Pan
icle
s
Wastewater dilution (%)
WW+NPKWwonly
0100200300400500600700800900
1000
0 25 50 75 100
Num
ber F
illed
gra
ins
Wastewater dilution (%)
WW+NPK
WW
0
50
100
150
200
250
0 25 50 75 100
Num
ber o
f Em
pty
grai
ns
Wastewater concentration(%)
WW+NPK
WW
0
5
10
15
20
25
0 25 50 75 100
Gra
in w
eigh
t(gm
/pot
)
Wastewater concentration (%)
WW+NPK
WW
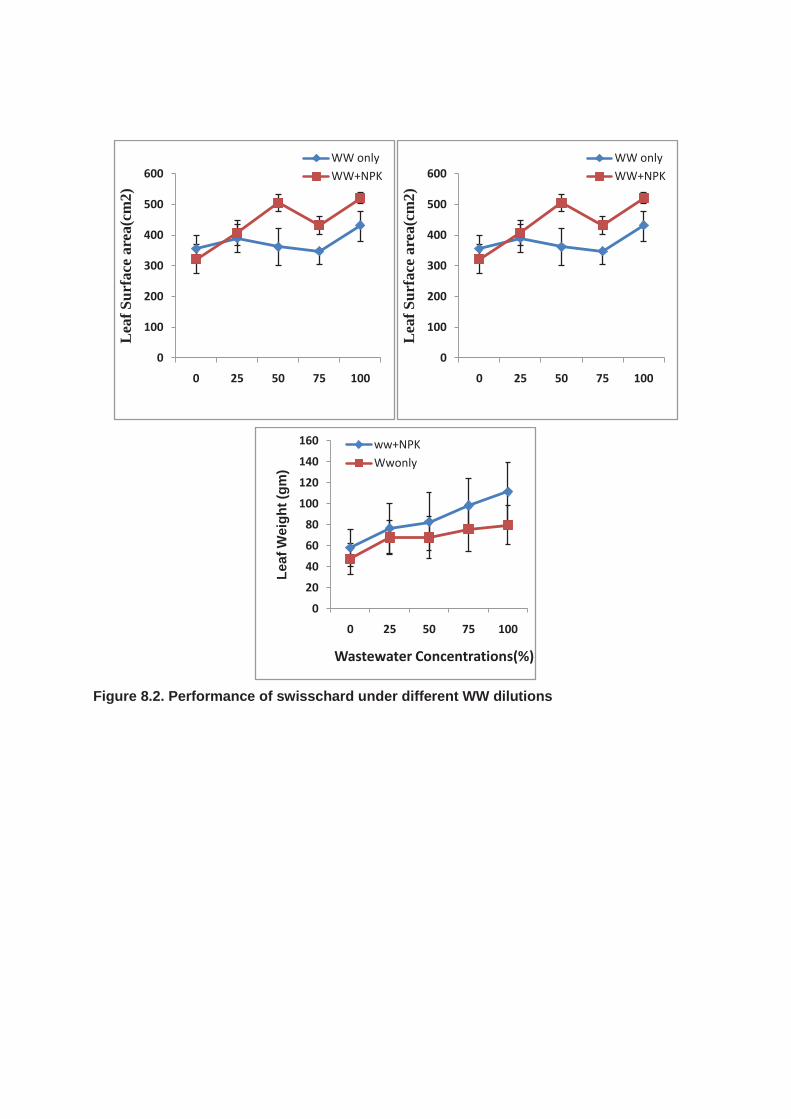
Figure 8.2. Performance of swisschard under different WW dilutions
0
100
200
300
400
500
600
0 25 50 75 100
Leaf
Sur
face
are
a(cm
2)
WW onlyWW+NPK
0
100
200
300
400
500
600
0 25 50 75 100
Leaf
Sur
face
are
a(cm
2)
WW onlyWW+NPK
0
20
40
60
80
100
120
140
160
0 25 50 75 100
Leaf
Wei
ght (
gm)
Wastewater Concentrations(%)
ww+NPKWwonly
9 Products from wastewater re-use
9.1 Irrigation water
The estimated volume of wastewater generated from the population using septic
tanks and sewerage systems in Tanzania are 18.17*106m3/yr and 28.87*106m3/yr
respectively, while the volume of industrial waste water is 683,717m3/day (UNEP,
2009). It is not known how much of this is channeled into the few constructed
wetlands established already but the potential is high.
9.2 Nutrients dissolved in WW
Agricultural production in Africa is characterized by low productivity caused by a
combination of endogenous and exogenous factors. One of the factors is lack of
adequate agricultural inputs such as nutrients in form of fertilizers and manure
necessary for plant growth. Sub-Saharan Africa has the world’s lowest level of mineral
fertilizer use. Only eight kilograms of nutrients are applied per hectare. This
represents about ten percent of the world average. It is estimated that Sub-Saharan
Africa imports more than 90 percent of its agricultural fertilizers. Decline in soil
fertility is reported as one of the major constraints hampering rural development in
Tanzania (Ley et al., 2000). This has resulted in poverty, widespread of malnutrition
and massive environmental degradation (Shepherd and Saule, 1998; Ley et al.,
2000).While this is a fact; a lot of nutrients contained in wastewater are discharged
into rivers and oceans causing secondary impacts in water bodies and the environment
On the other hand Wastewaters contain nutrients such as nitrogen and phosphorous. It
is estimated that each person on average excretes about 4 kg N and 0.4 kg P in urine,
and 0.55 kg N and 0.18 kg P in feaces per year (www.wateralliance.org/issues.html).
These are essential elements for plant growth and if retrieved from WW could be
recycled back for plant growth. On the other hand, if these nutrients are left to flow
into a water body, they may cause eutrophication of water bodies, especially in slow
moving waters in streams, canals and lakes.

9.3 Sludge
Sludge is the general term for the undigested or partially digested slurry or solid that
results from the storage or treatment of blackwater in on-site sanitation systems
namely the stabilization and maturation ponds of the WSP. This is normally scooped
out to prevent silting of the ponds. The sludge is normally spread out to dry in the
sun. When it is dried, it offers another source of organic fertilizer which is still high in
nutrients. Informal observations from MUWSA CW showed great performance of paddy
using sludge as fertilizer while from fields around MORUWASA maize and tomatoes
produced good crop when fertilized with sludge only.
10. Irrigated crops (produce)
There are about 1.0 million ha of irrigable land in Tanzania but currently only 150,000
ha are cultivated under irrigation for lack of capacity to irrigate (water limitation and
infrastructure to deliver it to the fields
(http://www.tanzania.go.tz/agriculture.html). On the other hand, due to climate
change, only irrigation holds the key to stabilizing agricultural production in Tanzania
and elsewhere to improve and assure basic food security, increase farmers’
productivity and incomes. High valued crops such as vegetables produce and cash
crops include off-season maize, sugar cane, tea, coffee and cut flowers needs to be
irrigated in Tanzania. These crops and others including pasture, public gardens and
park plants could profit even more if waste water was used instead of pure water
from taps and shallow wells storm water channels currently used.
11. Harvested plants
Constructed wetlands incorporate water/aquatic plants (macrophytes) as part of their
system. These functions in absorption of nutrients including those of heavy metals and
sequestering them into their various organs leaving the waste water fairly devoid of
nutrients overload. The more actively growing the plants are the higher is the
efficiency of nutrient absorption. They are classified as emergent, suspended/floating
and submerged plants.
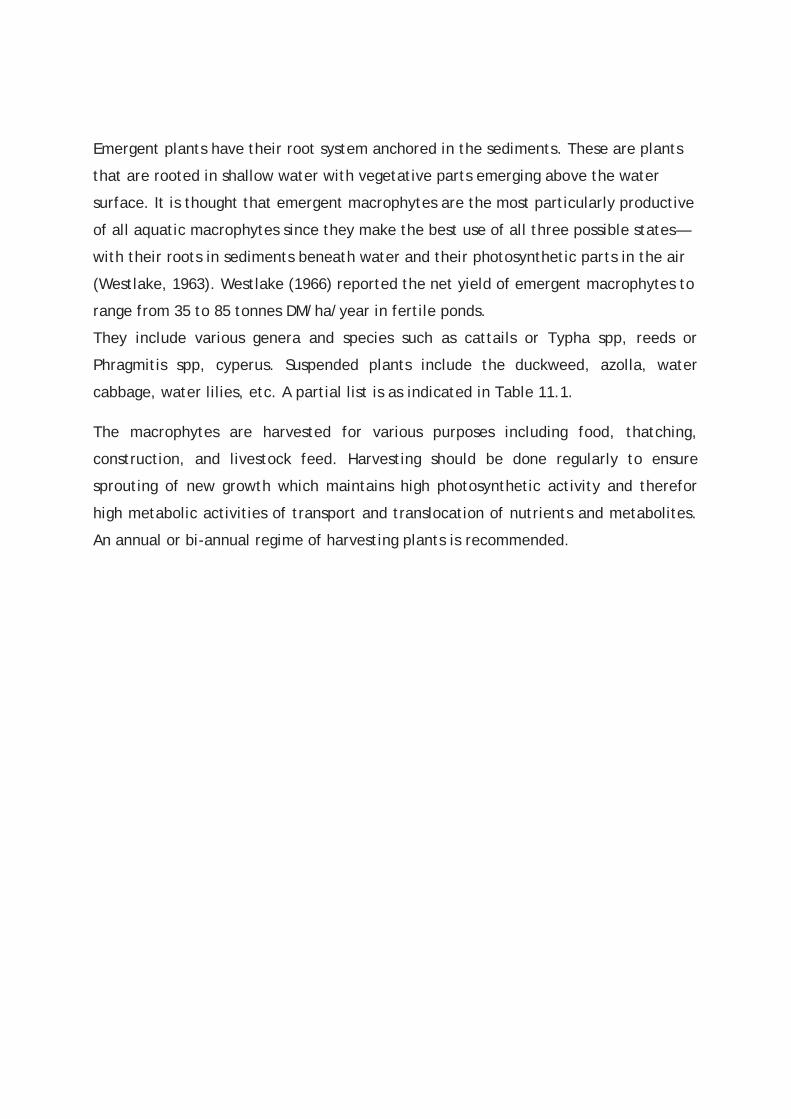
Emergent plants have their root system anchored in the sediments. These are plants
that are rooted in shallow water with vegetative parts emerging above the water
surface. It is thought that emergent macrophytes are the most particularly productive
of all aquatic macrophytes since they make the best use of all three possible states—
with their roots in sediments beneath water and their photosynthetic parts in the air
(Westlake, 1963). Westlake (1966) reported the net yield of emergent macrophytes to
range from 35 to 85 tonnes DM/ha/year in fertile ponds.
They include various genera and species such as cattails or Typha spp, reeds or
Phragmitis spp, cyperus. Suspended plants include the duckweed, azolla, water
cabbage, water lilies, etc. A partial list is as indicated in Table 11.1.
The macrophytes are harvested for various purposes including food, thatching,
construction, and livestock feed. Harvesting should be done regularly to ensure
sprouting of new growth which maintains high photosynthetic activity and therefor
high metabolic activities of transport and translocation of nutrients and metabolites.
An annual or bi-annual regime of harvesting plants is recommended.
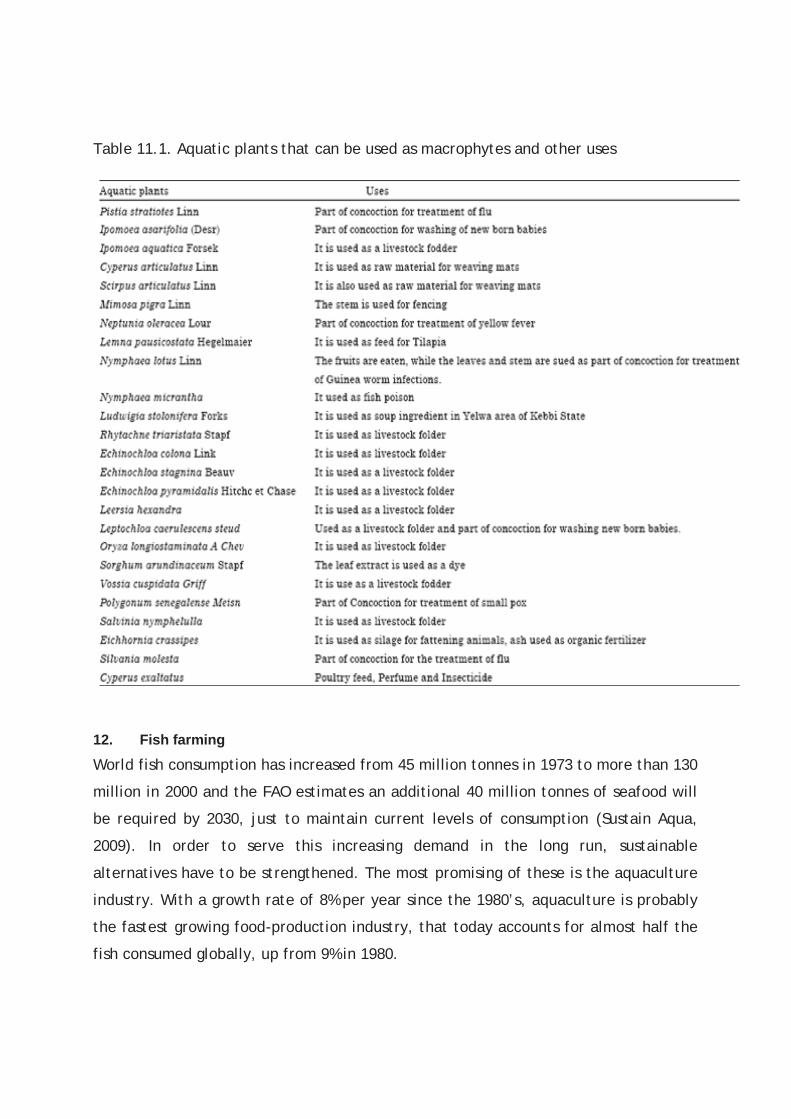
Table 11.1. Aquatic plants that can be used as macrophytes and other uses
12. Fish farming
World fish consumption has increased from 45 million tonnes in 1973 to more than 130
million in 2000 and the FAO estimates an additional 40 million tonnes of seafood will
be required by 2030, just to maintain current levels of consumption (Sustain Aqua,
2009). In order to serve this increasing demand in the long run, sustainable
alternatives have to be strengthened. The most promising of these is the aquaculture
industry. With a growth rate of 8% per year since the 1980’s, aquaculture is probably
the fastest growing food-production industry, that today accounts for almost half the
fish consumed globally, up from 9% in 1980.
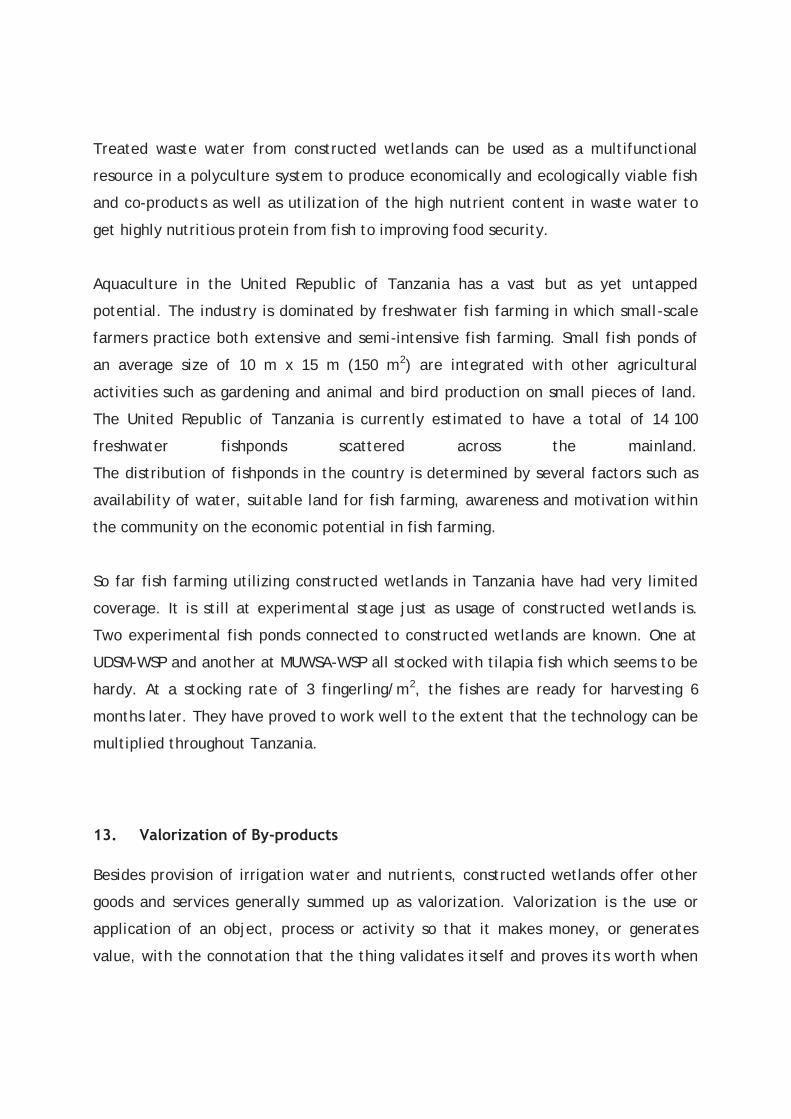
Treated waste water from constructed wetlands can be used as a multifunctional
resource in a polyculture system to produce economically and ecologically viable fish
and co-products as well as utilization of the high nutrient content in waste water to
get highly nutritious protein from fish to improving food security.
Aquaculture in the United Republic of Tanzania has a vast but as yet untapped
potential. The industry is dominated by freshwater fish farming in which small-scale
farmers practice both extensive and semi-intensive fish farming. Small fish ponds of
an average size of 10 m x 15 m (150 m2) are integrated with other agricultural
activities such as gardening and animal and bird production on small pieces of land.
The United Republic of Tanzania is currently estimated to have a total of 14 100
freshwater fishponds scattered across the mainland.
The distribution of fishponds in the country is determined by several factors such as
availability of water, suitable land for fish farming, awareness and motivation within
the community on the economic potential in fish farming.
So far fish farming utilizing constructed wetlands in Tanzania have had very limited
coverage. It is still at experimental stage just as usage of constructed wetlands is.
Two experimental fish ponds connected to constructed wetlands are known. One at
UDSM-WSP and another at MUWSA-WSP all stocked with tilapia fish which seems to be
hardy. At a stocking rate of 3 fingerling/m2, the fishes are ready for harvesting 6
months later. They have proved to work well to the extent that the technology can be
multiplied throughout Tanzania.
13. Valorization of By-products
Besides provision of irrigation water and nutrients, constructed wetlands offer other
goods and services generally summed up as valorization. Valorization is the use or
application of an object, process or activity so that it makes money, or generates
value, with the connotation that the thing validates itself and proves its worth when

it results in earnings, a yield. Thus, something is "valorized" if it has yielded its value
or value addition (Wikipedia).
In wastewater reuse Valorization is the conversion of waste water and biomass to
energy, fuels and other useful materials, with particular focus on environmental
indicators and sustainability goals. It entails re-use of macrophytes that are harvested
at maturity into various crafts and artifacts, as well as use of crops e.g. pasture to
feed humans and livestock. Emerging rooted plant species and free-floating plants
stand out for their biomass, productivity, and plant cover as detailed in Table 11.1.
Biological and esthetic functions- Emergent macrophytes can provide a suitable
habitat for wildlife and offer nesting sites for birds and mammals. Macrophytes can
enhance the esthetic value of the CW especially when flowering species such as
Nymphaea alba, water hyacinth Eichhornia crassipes and Ranunculus
sphaerospermus are present and form one of the most attractive ecotourism thus
changing the scenario from the ‘eye sore’ of blackwater to sightseeing scenery.
Energy production (renewable fuel source) - Some macrophytes can utilized directly
for biomass energy or are incorporated into biogas
Agricultural purposes (Composting purposes and organic soil conditioner,
Production of fertilizer, Soil amendment)
Forage(Aquatic plants growing in nutrient-enriched wastewaters are often high in
crude protein and digestible organic matter and serve as valuable animal feed)
Industrial purposes and product developments (Packing material and Construction
purposes such as building, insulation and thatching material, fibre boards diverse
handicrafts including weaving material, basketry, etc,
Edible, medicinal & aromatic (Several aquatic species are edible e.g. Helosciadium
nodiflorum and Nasturtium officinalis medicinal as well, some species are aromatic
and melliferous such as Mentha aqua.
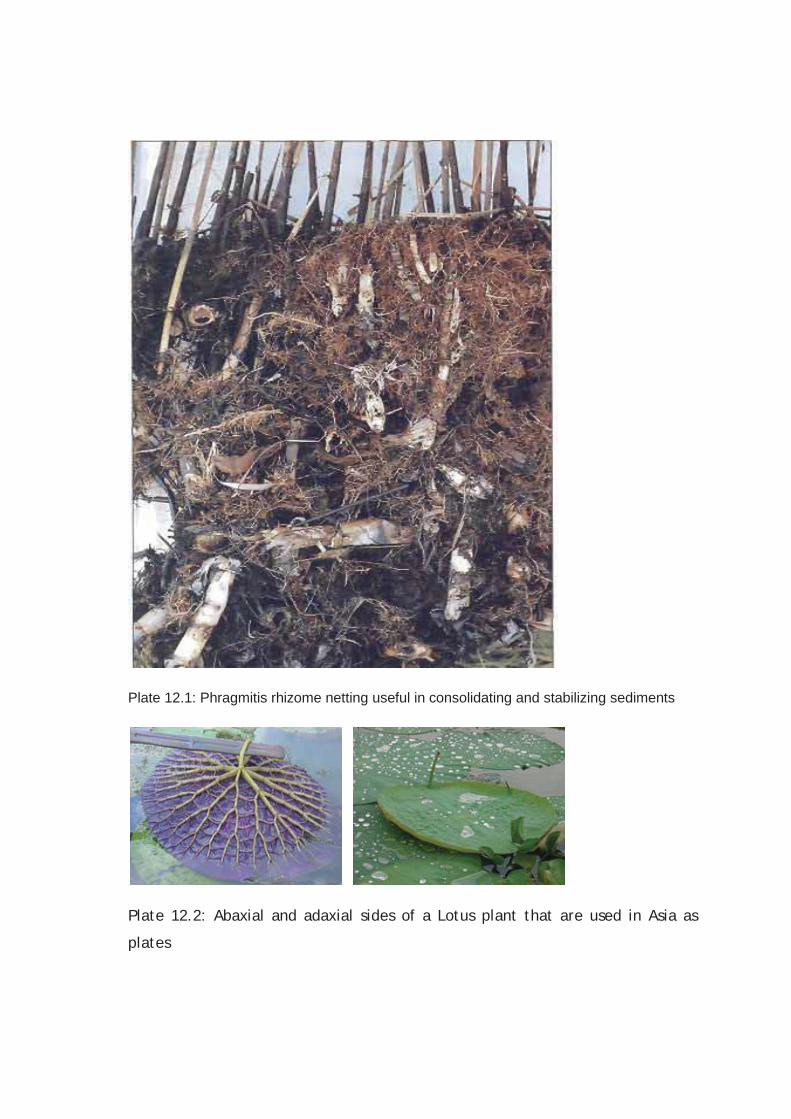
Plate 12.1: Phragmitis rhizome netting useful in consolidating and stabilizing sediments
Plate 12.2: Abaxial and adaxial sides of a Lotus plant that are used in Asia as
plates
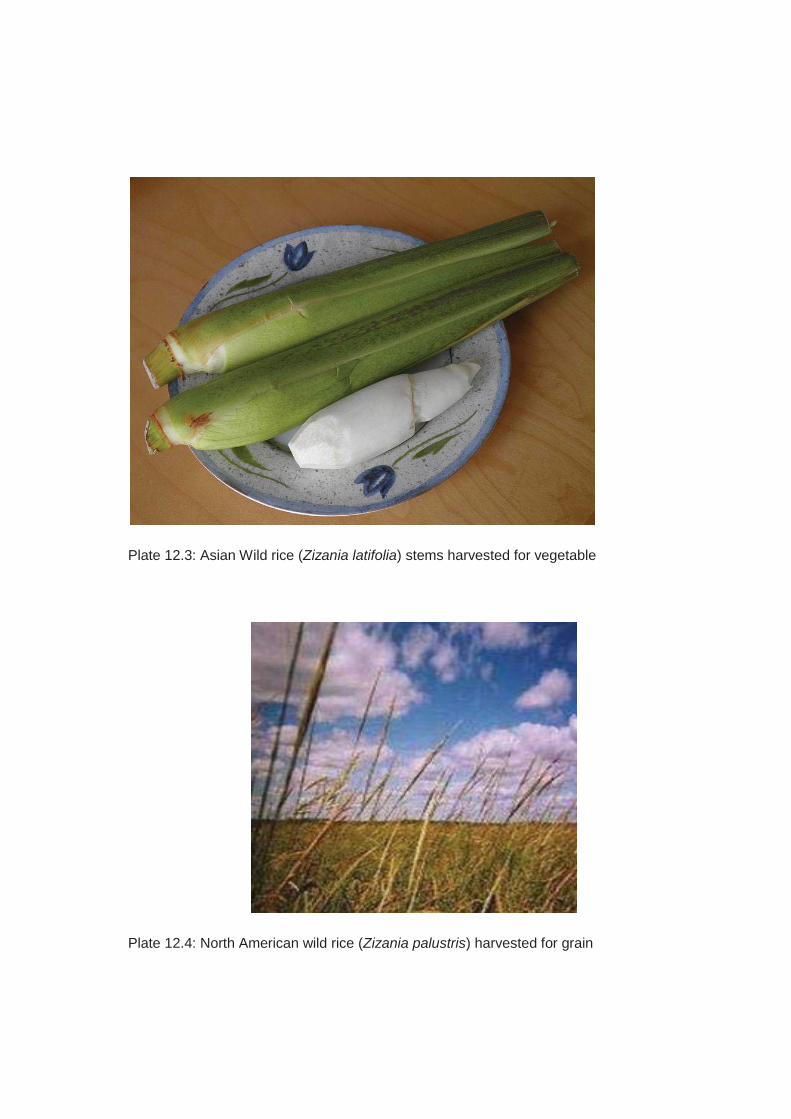
Plate 12.3: Asian Wild rice (Zizania latifolia) stems harvested for vegetable
Plate 12.4: North American wild rice (Zizania palustris) harvested for grain
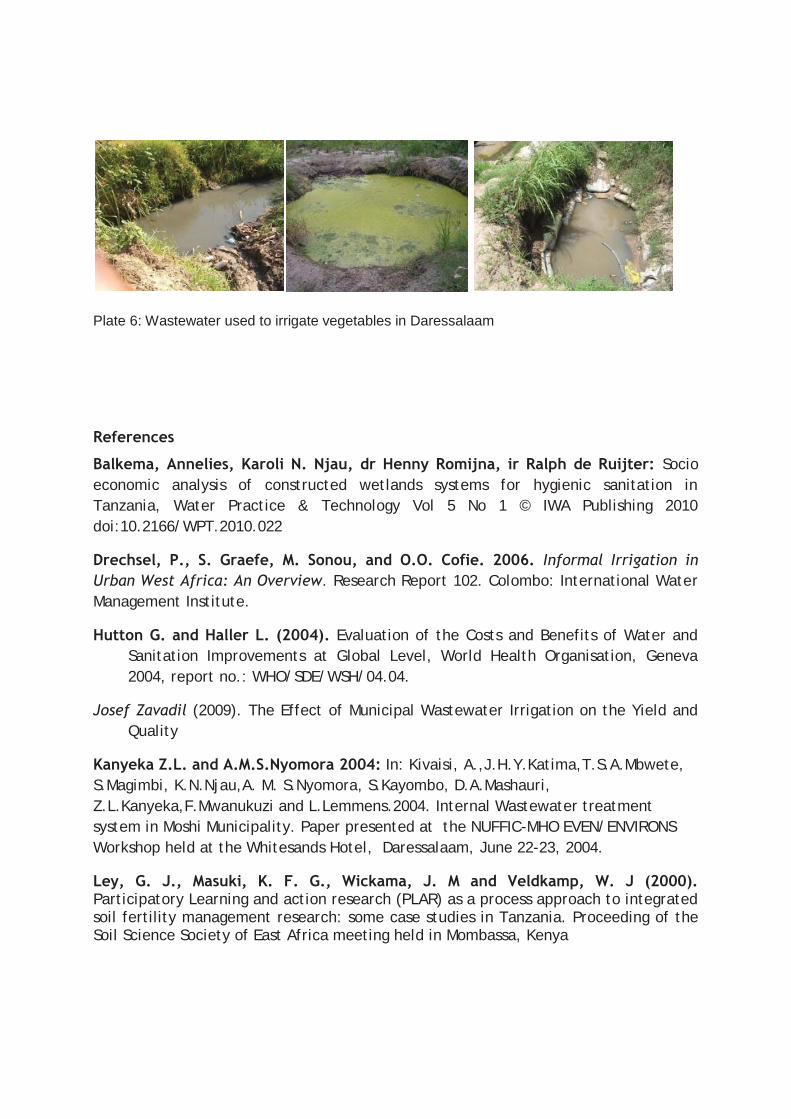
Plate 6: Wastewater used to irrigate vegetables in Daressalaam
References
Balkema, Annelies, Karoli N. Njau, dr Henny Romijna, ir Ralph de Ruijter: Socio economic analysis of constructed wetlands systems for hygienic sanitation in Tanzania, Water Practice & Technology Vol 5 No 1 © IWA Publishing 2010 doi:10.2166/WPT.2010.022
Drechsel, P., S. Graefe, M. Sonou, and O.O. Cofie. 2006. Informal Irrigation in Urban West Africa: An Overview. Research Report 102. Colombo: International Water Management Institute.
Hutton G. and Haller L. (2004). Evaluation of the Costs and Benefits of Water and Sanitation Improvements at Global Level, World Health Organisation, Geneva 2004, report no.: WHO/SDE/WSH/04.04.
Josef Zavadil (2009). The Effect of Municipal Wastewater Irrigation on the Yield and Quality
Kanyeka Z.L. and A.M.S.Nyomora 2004: In: Kivaisi, A.,J.H.Y.Katima,T.S.A.Mbwete, S.Magimbi, K.N.Njau,A. M. S.Nyomora, S.Kayombo, D.A.Mashauri, Z.L.Kanyeka,F.Mwanukuzi and L.Lemmens.2004. Internal Wastewater treatment system in Moshi Municipality. Paper presented at the NUFFIC-MHO EVEN/ENVIRONS Workshop held at the Whitesands Hotel, Daressalaam, June 22-23, 2004.
Ley, G. J., Masuki, K. F. G., Wickama, J. M and Veldkamp, W. J (2000). Participatory Learning and action research (PLAR) as a process approach to integrated soil fertility management research: some case studies in Tanzania. Proceeding of the Soil Science Society of East Africa meeting held in Mombassa, Kenya
Mannimo I., Franco D., Picionni E., Favero L., Mattiuzzo E., Zanetto G. (2008), A Cost Effectiveness Analysis of Seminatural Wetlands and Activated Sludge Wastewater Treatment Systems, Environmnetal Management (2008) 41-118-129.
Okurut Tom Okia (2000). A pilot Study on Municipal Wastewater Treatment Using a Constructed wetland in Uganda, PhD Thesis Wageningen University and the International Institute for Infrastructure, Hydraulic and Environmental Engineering, Published by A.A. Balkema in Rotterdam, the Netherlands, ISBN 9054104244.
Shepherd and Saule (1998). Assessment of the economic and ecological impact of agroforestry and other soil management options on Western Kenyan farms using a dynamic simulation model. Agriculture, Ecosystem and Environment 17: 131-146
Scott, C.A., N.I. Faruqui, and L. Raschid-Sally. 2004. Wastewater use in irrigated agriculture: Management challenges in developing countries. In: Scott, C.A., N.I. Faruqui, and L. Raschid- Sally (eds.) Wastewater Use in Irrigated Agriculture: Confronting the Livelihoods and Environmental Realities. CABI Publishing, UK
UNEP (2009). Recycling – from E-waste to resources. www.unep.org/.../E-
waste_publication_screen_finalv
www.wateralliance.org/issues.html, accessed on 27th December 2010
URT, 2010. Agriculture. Irrigation. http://www.tanzania.go.tz/agriculture.html
URT 2003 Vulnerability Assessment Report, 2003 PMO, 2003, Prime Minister’s Office, Dar es Salaam, Tanzania
URT 2009. Kilimo Kwanza
URT 2010. MKUKUTA II
VLIR UOMailing a[e] info@
Program
Dissemizania
ZEIN201
2011 12
PromoteThomas[e] rob.v
Local PaUniversitWaste StUniversit[e] knjau
OSaddress: [email protected]
mme: South I
ination of t
1Z097
01 2013 1
er:More Univevan.deun@th
rtner:ty of Dar es Stabilization Pty of Dar es Su30@yahoo.
R UOS | PO
nitiatives
the sustaina
11 30
rsity Collegehomasmore.
Salaam, CollPonds and CoSalaam | P.Ocom
box 103 Else
able wastew
e | Kleinhoefsbe
ege of Enginonstructed WO. Box 35131
ene Naamsep
water techn
fstraat 4 | 24
neering and TWetland Res1 | Dar es Sa
poort | 1050
nology of co
440 Geel | Be
Technology (earch and Delaam | Tanza
0 Elsene | Be
onstructed
elgium
CoET)evelopmentania
elgium
wetlands i
Group (WSP
n Tan
P CW)