Embed Size (px)
Citation preview

©
Your success is our success
Emkay
Emkay Research is also available on www.emkayglobal.com, Bloomberg EMKAY<GO>, Reuters and DOWJONES.
ED: HEMANT MARADIA SA: DHANANJAY SINHA
Market leader in equity and retail AUM: Superior contribution from retail investors and
relatively higher SIP contribution to reduce AUM volatility: As on March 2018, HDFC AMC
has maintained its market leadership in Equity AUM (~15.8% share) and retail AUM
(~13.7% share). The company has reported healthy CAGR growth of ~26% in total AUM
from FY13-18, with contribution from across segments. For March’18, retail customers
accounted for ~62.2% of the company’s AUM against industry average of ~51.4%.
Similarly, average SIP size for HDFC AMC stands at Rs3,648 per SIP per month against
industry average of Rs3,300. Healthy traction from individual investors ensures
consistency and lower volatility in AUM growth.
Healthy fees & efficient cost control assures steady profitability: HDFC AMC enjoys
higher share of better yielding equity AUM (~51% of AUM), but yields have fallen from
~70bps in FY16 to ~62bps in FY18, primarily due to various regulatory changes
implemented by SEBI. However, to counter the declining yields, the management has
adopted various cost-control measures as cost yields have also declined from ~45bps in
FY16 to ~29bps during FY18. Spurred by healthy growth in investment fees (~20% CAGR
from FY16-18) and moderation in operating expenses (flat growth from FY16-18), HDFC
AMC has reported ~23% CAGR in PAT over FY16-18.
Best in Class RoE – Dividend payout healthy: HDFC AMC has been generating stable
returns for the past several years with the least capital requirement, which in turn has
resulted in best-in-class RoE. The company has managed to maintain average ~40% RoE
in the past 4 years with healthy dividend payouts. This adds further value for investors.
Diversified distribution network reduces revenue concentration risk: Though being
promoted by the HDFC group, HDFC AMC has managed to maintain a diversified
distribution network (instead of solely depending on HDFC Bank). IFAs (Independent
Financial Advisors) are the primary source of distribution. Also, the company has engaged
national level distributors. HDFC Bank also remains one of the major distributors with a
share of ~10.3% of total AUM as on March 2018. This will ensure consistency in inflows
and reduce concentration risk.
Valuation premium justified; recommend SUBSCIRBE to IPO: HDFC AMC has priced
IPO at ~7.8% of total FY18 AUM (~31.5x P/FY18 earnings) with ~40% FY18 ROE. The
only peer comparison is Reliance Nippon AMC (RNAM), which issued IPO at ~6.3% of
FY18 AUM (~29.6x P/FY18 earnings) with 25% RoE. However, with subsequent
correction in pricing, RNAM is currently trading at ~5.5% of FY18 AUM (~26.1x P/FY18
earnings). Considering its superior return ratios, a favorable AUM mix and relatively stable
management profile, HDFC AMC is expected to command premium over peers. We
recommend SUBSCRIBE to the IPO.
Key Risk: Our thesis on HDFC MF assumes a continued popularity of mutual funds which
in turn would benefit the AMC due to its strong distribution reach, bank led distribution
model and brand image. Any adverse impact on inflows, both for equity as well as debt
funds, may impact overall revenues as well as profitability of the company.
India Equity Research | BFSI
July 24, 2018
IPO Note
HDFC Asset Management Company Ltd Refer to important disclosures at the end of this report
Leader of the pack; SUBSCRIBE Price Band
Rs1,095-1,100
Rating
SUBSCRIBE
Issue Details
Price Band Rs 1,095-1,100
Issue Open 25/07/2018
Issue Closes 27/07/2018
Issue Size (mn shares) 25.5
Issue Size (Rs bn) 27.9-28.0
No. of shares Pre-issue (mn) 212.0
No. of shares Post issue (mn) 212.0
Post issue mkt cap (Rs bn) 232.1-233.2
Issue Structure
QIBs 50%
Non-Institutional Category 15%
Retail 35%
Objects of the Issue
The objects of the Offer are to achieve the
benefits of listing the equity shares on the
stock exchanges and to carry out the sale
of equity shares offered for sale by the
promoters. In addition, the listing of the
company’s equity shares will enhance
visibility and brand name among existing
and potential customers.
Shareholding Pattern (pre-issue)
Source: Company, Emkay Research
This report is solely produced by Emkay Global. The following person(s) are responsible for the production of the recommendation:
Jignesh Shial
+91-22-66242468
Himanshu Taluja
+91-022-66121248
Kushan Parikh, CFA
+91-022-66242431
HDFC
Standard Life
KMP Public
Financial Snapshot
(Rs mn) FY14 FY15 FY16 FY17 FY18
Investment Management Fees 7,150 9,209 12,097 14,285 17,365
Total Revenue 9,031 10,643 14,943 15,879 18,672
Net Profit 3,578 4,155 4,779 5,502 7,216
EPS (Rs) 17.6 20.3 23.6 27.1 35.0
AAAUM (Rs bn) NA NA 1,733 2,177 2,789
ROE (%) 40% 41% 42% 43% 40%
PE (x) 63x 54x 47x 41x 31x
Mkt cap/AUM (x) 20.7% 15.2% 13.7% 9.9% 7.8%
Source: Company, Emkay Research
We seek your feedback and support in the ongoing Asia Money survey.
Click here to make your appreciation count

HDFC Asset Management Company Ltd India Equity Research | IPO Note
Emkay Research is also available on www.emkayglobal.com, Bloomberg EMKAY<GO>, Reuters and DOWJONES.
ED: HEMANT MARADIA SA: DHANANJAY SINHA July 24, 2018 | 2
Investment Arguments
Market leader in equity and retail AUM, growth trend encouraging
HDFC AMC has managed to maintain market leadership in equity and retail AUM, which
generally tends to have relatively longer holding period. As of March 2018, HDFC AMC had the
highest market share of equity AUM (~15.8%) followed by ICICI Prudential AMC based on
quarterly average AUM. Also, on retail AUM market share (ex-HNI AUM), the company enjoys
market leadership with an overall market share of ~13.7%.
Exhibit 1: HDFC AMC maintains highest market share in Equity AUM
Source: Company, Emkay Research, Note: Equity includes balanced and ELSS funds also
Exhibit 2: Market positioning in Debt AUM is also encouraging
Source: Company, Emkay Research, Note: Debt includes Liquid and Gilt funds also
Exhibit 3: Retail AUM market share as of March’18
Source: Company, Emkay Research
Note: based on monthly average AUM, does not include HNI category into Retail investors
HDFC AMC has reported healthy CAGR of ~26% over FY13-18. Growth has remained broad-
based across segments and the company has managed to maintain its overall market leadership
in equity as well as retail AUM consistently.
Exhibit 4: HDFC AMC witnessed steady AUM growth over years
Source: Company, Emkay Research
Exhibit 5: Equity portion in AAAUM has been rising for HDFC AMC
Source: Company, Emkay Research
15.814.8
9.1 9.07.8
0.0
2.0
4.0
6.0
8.0
10.0
12.0
14.0
16.0
18.0
HDFCMutual fund
ICICI Pru RelianceNippon
Aditya BirlaSunlife
SBI Mutalfund
12.7 12.411.7 11.4
8.1
0.0
2.0
4.0
6.0
8.0
10.0
12.0
14.0
Aditya BirlaSunlife
ICICI Pru HDFCMutual fund
RelianceNippon
SBI Mutalfund
13.7 13.7
10.2
8.4 8.2
-
2.0
4.0
6.0
8.0
10.0
12.0
14.0
16.0
HDFC AMC Reliance Nippon ICICI Pru SBI AMC Birla Sunlife
Retail Market Share (%)
938 1,089
1,506 1,656
2,306
2,920
-
500
1,000
1,500
2,000
2,500
3,000
3,500
FY13 FY14 FY15 FY16 FY17 FY18
AUM closing (Rsbn)
39% 37%47%
60% 63%52%
0%
20%
40%
60%
80%
100%
FY16 FY17 FY18
Equity Debt

HDFC Asset Management Company Ltd India Equity Research | IPO Note
Emkay Research is also available on www.emkayglobal.com, Bloomberg EMKAY<GO>, Reuters and DOWJONES.
ED: HEMANT MARADIA SA: DHANANJAY SINHA July 24, 2018 | 3
Rising traction from SIP reduces volatility in AUM growth:
HDFC AMC has witnessed systematic rise in contribution from systematic investment plan (SIP)
to total AUM. SIP has generally been opted by individuals with potentially longer tenure return in
order to avoid market volatility. Thus, rising traction from SIP inflows does assure consistency in
AUM growth with low volatility.
As of March’18, the MAAUM from retail customers accounted for 62.2% compared to 51.4% in
the Indian Mutual Fund industry. Compared to the Indian industry average of Rs3,300 per SIP
p.m., HDFC MF’s average SIP size stands at Rs3,648 p.m. Focus on granularity has led to
inflows in SIP doubling in less than two years.
We believe that investments through SIP have become very popular across the MF industry and
provides quality long-term inflows.
Exhibit 6: Rising trend in SIP inflows and customer base visible
Source: Company, Emkay Research
Exhibit 7: Trend in average SIP per month has remained steady
Source: Company, Emkay Research
Rising traction from B15 cities diversifies AUM inflows
Till recently, investments in capital market-linked investments were exclusively prevalent in larger
cities whereas investors from smaller towns & cities used to prefer traditional modes of savings
(bank term deposits, gold, post office savings etc). However, more recently, the scenario seems
to have changed mainly due to rising awareness about equity markets among domestic investors
as well as simplification and transparency in the processes adopted by the Indian capital market
entities.
AMCs have bifurcated cities in two categories. Top 15 cities in India are termed as T15 cities
whereas 15 cities below this level are known as B15 cities. With the gradual increase in
awareness about MF and capital markets, the overall contribution from smaller cities & towns
has also witnessed meaningful increase in contribution.
Exhibit 8: Monthly Average AUM (MAAUM) from B15 Cities
Source: Company, Emkay Research
Exhibit 9: Monthly Average AUM (MAAUM) from T15 Cities
Source: Company, Emkay Research
The biggest advantage of such rise is diversity in AUM inflows as well as relatively low volatility
in troubled market times. Though contribution from T15 cities still remains 5x of B15, the gap
is expected to narrow over a period of time.
3.1 4.3 4.7 5.0 4.9 5.5
6.8
10.0 11.5
1.2 1.4 1.6 1.8 1.8 1.9 2.1 2.6 3.2
-
2.0
4.0
6.0
8.0
10.0
12.0
14.0
Ma
r-14
Se
p-1
4
Ma
r-15
Se
p-1
5
Ma
r-16
Se
p-1
6
Ma
r-17
Se
p-1
7
Ma
r-18
Monthly Inflows in SIP (Rsbn) No of SIP customers (mn)
2,500 3,021 2,926 2,865 2,747 2,965 3,224
3,826 3,648
-
1,000
2,000
3,000
4,000
5,000
Ma
r-14
Se
p-1
4
Ma
r-15
Se
p-1
5
Ma
r-16
Se
p-1
6
Mar-
17
Se
p-1
7
Ma
r-18
SIP per month (Rs)
172
247 272
385
540
-
100
200
300
400
500
600
Jan-14 Jan-15 Jan-16 Jan-17 Jan-18
MAAUM B15 (Rsbn)
963
1,401 1,505
2,011
2,450
-
500
1,000
1,500
2,000
2,500
3,000
Jan-14 Jan-15 Jan-16 Jan-17 Jan-18
MAAUM T15 (Rsbn)
HDFC Asset Management Company Ltd India Equity Research | IPO Note
Emkay Research is also available on www.emkayglobal.com, Bloomberg EMKAY<GO>, Reuters and DOWJONES.
ED: HEMANT MARADIA SA: DHANANJAY SINHA July 24, 2018 | 4
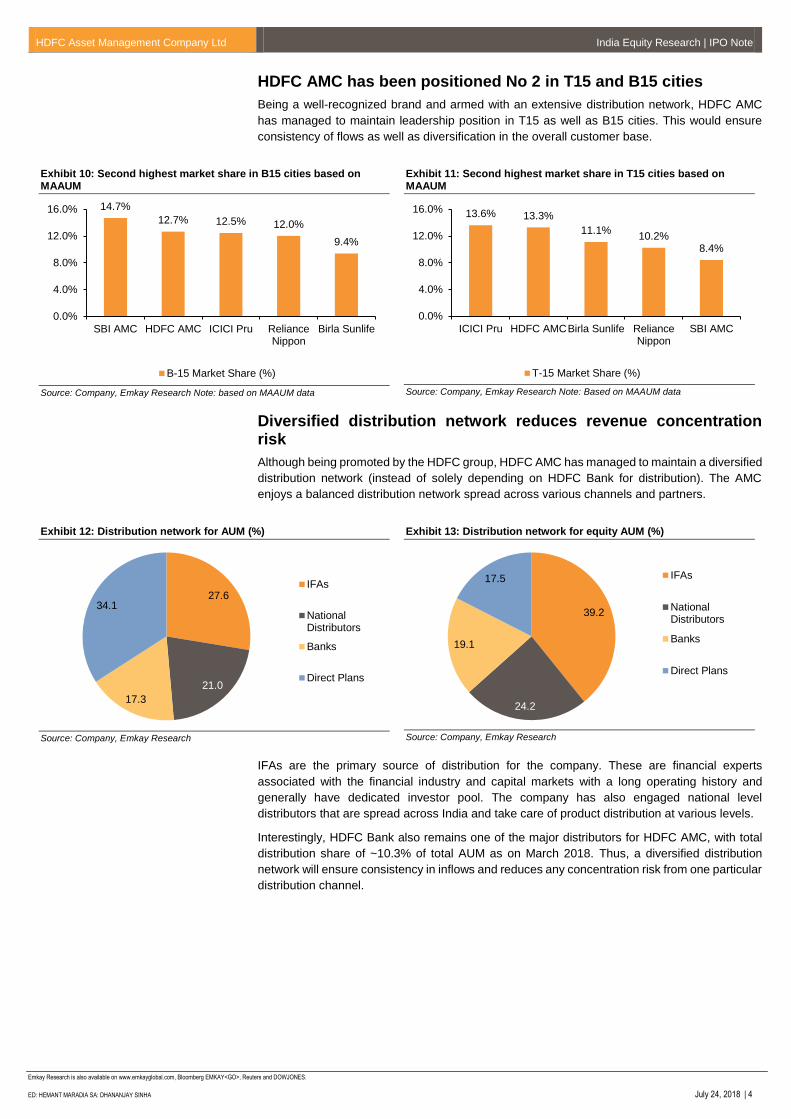
HDFC AMC has been positioned No 2 in T15 and B15 cities
Being a well-recognized brand and armed with an extensive distribution network, HDFC AMC
has managed to maintain leadership position in T15 as well as B15 cities. This would ensure
consistency of flows as well as diversification in the overall customer base.
Exhibit 10: Second highest market share in B15 cities based on MAAUM
Source: Company, Emkay Research Note: based on MAAUM data
Exhibit 11: Second highest market share in T15 cities based on MAAUM
Source: Company, Emkay Research Note: Based on MAAUM data
Diversified distribution network reduces revenue concentration risk
Although being promoted by the HDFC group, HDFC AMC has managed to maintain a diversified
distribution network (instead of solely depending on HDFC Bank for distribution). The AMC
enjoys a balanced distribution network spread across various channels and partners.
Exhibit 12: Distribution network for AUM (%)
Source: Company, Emkay Research
Exhibit 13: Distribution network for equity AUM (%)
Source: Company, Emkay Research
IFAs are the primary source of distribution for the company. These are financial experts
associated with the financial industry and capital markets with a long operating history and
generally have dedicated investor pool. The company has also engaged national level
distributors that are spread across India and take care of product distribution at various levels.
Interestingly, HDFC Bank also remains one of the major distributors for HDFC AMC, with total
distribution share of ~10.3% of total AUM as on March 2018. Thus, a diversified distribution
network will ensure consistency in inflows and reduces any concentration risk from one particular
distribution channel.
14.7%
12.7% 12.5% 12.0%
9.4%
0.0%
4.0%
8.0%
12.0%
16.0%
SBI AMC HDFC AMC ICICI Pru RelianceNippon
Birla Sunlife
B-15 Market Share (%)
13.6% 13.3%
11.1%10.2%
8.4%
0.0%
4.0%
8.0%
12.0%
16.0%
ICICI Pru HDFC AMCBirla Sunlife RelianceNippon
SBI AMC
T-15 Market Share (%)
27.6
21.0
17.3
34.1
IFAs
NationalDistributors
Banks
Direct Plans
39.2
24.2
19.1
17.5 IFAs
NationalDistributors
Banks
Direct Plans

HDFC Asset Management Company Ltd India Equity Research | IPO Note
Emkay Research is also available on www.emkayglobal.com, Bloomberg EMKAY<GO>, Reuters and DOWJONES.
ED: HEMANT MARADIA SA: DHANANJAY SINHA July 24, 2018 | 5
Healthy fees & efficient cost control assure steady profitability
HDFC AMC enjoys a higher share of superior yielding equity AUM (~51% of AUM) v/s industry
average of 42%, which is driving enhanced fees and healthy trend in revenues. Investment
management fees during FY16-18 has witnessed 20% CAGR.
However, the yields have fallen from 70bps in FY16 to 62bps in FY18, primarily due to various
regulatory changes implemented by SEBI and other authorities, besides rising competition
among the AMCs. However, to counter the declining yields, the management has adopted
various cost-control measures in order to bring in best-in-class operational efficiencies. The cost
yields have improved from ~45bps in FY16 to ~29bps during FY18.
Exhibit 14: Yield on fees declining in spite of fee income CAGR of ~20% over FY16-18
Source: Company, Emkay Research
Exhibit 15: Management opted for various cost control measures which resulted in overall decline in cost yields
Source: Company, Emkay Research
Spurred by healthy growth in investment fees (~20% CAGR from FY16-18) and moderation in
operating expenses (flat growth from FY16-18), HDFC AMC has reported ~23% CAGR in PAT
from FY16-18.
Best in Class RoE – Dividend payout healthy
Since the AMC business entails a service-oriented model, with fees being the primary source of
revenue, it requires the least capital for expansion. Hence, the AMC business in general offers
superior RoE compared to most financial service businesses.
HDFC AMC has been generating stable returns for the past several years with the least capital
requirement, which in turn has resulted in best-in-class RoE. The company has managed to
maintain average ~40% RoE in the past 4 years. Additionally, the company has managed to
maintain a healthy dividend payout in the past few years, which adds further value for the
investors.
Exhibit 16: Historical RoE trend has remained ~40%
Source: Company, Emkay Research
Exhibit 17: Dividend payout ratio also remains encouraging
Source: Company, Emkay Research
12.1 14.3 17.4
0.70%
0.66%
0.62%
0.55%
0.60%
0.65%
0.70%
0.75%
-
5.0
10.0
15.0
20.0
FY16 FY17 FY18
Invt. Mgt Fees (Rs bn) Invt. Mgt fees/AAAUM (%)
7.9 7.9 8.0
0.45%
0.36%
0.29%
0.20%
0.25%
0.30%
0.35%
0.40%
0.45%
0.50%
0.0
3.0
6.0
9.0
12.0
FY16 FY17 FY18
Total Expenses (Rsbn) Total Expenses/AAAUM(%)
41%
42%43%
40%
37%
39%
41%
43%
45%
FY15 FY16 FY17 FY18
ROAE (%)
35.3 39.5
42.1 42.1 46.7
-
10.0
20.0
30.0
40.0
50.0
FY14 FY15 FY16 FY17 FY18
Dividend Payout Ratio (%)

HDFC Asset Management Company Ltd India Equity Research | IPO Note
Emkay Research is also available on www.emkayglobal.com, Bloomberg EMKAY<GO>, Reuters and DOWJONES.
ED: HEMANT MARADIA SA: DHANANJAY SINHA July 24, 2018 | 6
Valuation and Recommendation
In India, valuation of most of the deals in the AMC space in the past has been reported based
on the size of AUM and a specified value ascribed to the AUM based on equity and debt mix.
Equity AUM being a superior yielding business commands a higher premium compared to debt
AUM.
HDFC AMC has priced its IPO at ~7.8% of total FY18 AUM (~31.5x P/FY18 earnings) with
~40% FY18 ROE. The only peer comparison is Reliance Nippon AMC (RNAM), which
issued IPO at ~6.3% of FY18 AUM (~29.6x P/FY18 earnings) with 25% RoE. Following a
correction in its stock price, RNAM is now trading at ~5.5% of FY18 AUM (~26.1x P/FY18
earnings).
Superior premium for HDFC AMC is justified considering following:
Better AUM mix – HDFC AMC has overall equity composition at 51% of AUM compared to
38% for RNAM. Equity AUM commands higher yields compared to debt/ETFs.
Superior return ratios – HDFC AMC has reported RoE of ~40% for FY18 against 25% RoE
reported by RNAM.
Consistency in management – HDFC AMC has managed to retain its core investment team
for more than 10 years. (refer management profile)
Brand HDFC – being promoted by the HDFC group (along with Standard Life), the company
does command a brand premium. HDFC Bank commands ~100bps premium over other
private sector peers whereas HDFC Life commands ~200bps premium over life insurance
peers. The same may hold true for HDFC AMC as well.
Considering superior return ratios, supported by a favorable AUM mix and relatively
stable management profile, HDFC AMC is expected to command a premium over RNAM.
Hence, the valuation premium commanded by HDFC AMC IPO is justified. We allocate
SUBSCRIBE rating to the IPO.
Key risks
Moderation in inflows can impact revenues and earnings
Our thesis on HDFC AMC assumes continued popularity of MF, which in turn would benefit
the AMC due to its strong distribution reach, bank-led distribution model and strong brand
image. The period post demonetization has been unique in the way MF flows have
sustained, leading to increasing assumptions of: a) a maturing equity culture in India and
b) a substitution effect wherein bank FDs have been replaced by MF. However, the recent
trend seems to be little adverse whereby AMCs are witnessing slowdown in inflows in both,
equity and debt funds, which if sustained may impact overall revenues as well as
profitability of the company.
SEBI restrictions over Total Expense Ratio (TER) could impact profitability
Recently, SEBI issued a circular on restricting AMCs to charge the additional TER of up to
30bps for inflows from beyond Top 30 cities instead of beyond Top 15 cities allowed earlier.
Also, SEBI issued a circular on restricting the AMCs to charging additional expenses of up
to 0.05%, in the daily average net assets of the schemes. Hence, such changes to the
existing TER regulations could impacts revenues, profitability and business growth
prospects.
Scheme under performance can adversely impact inflows
The performance of the schemes is critical to retaining existing customers as well as
attracting new customers. The investment decisions made in the schemes may lead them
to underperform their relevant benchmarks, or similar products from competitors

HDFC Asset Management Company Ltd India Equity Research | IPO Note
Emkay Research is also available on www.emkayglobal.com, Bloomberg EMKAY<GO>, Reuters and DOWJONES.
ED: HEMANT MARADIA SA: DHANANJAY SINHA July 24, 2018 | 7
Competitive Analysis: Top five AMCs
Exhibit 18: HDFC AMC maintains market leadership in AUM
Source: Company, Emkay Research, AMFI, Data based on Quarterly avg. AUM
Exhibit 19: HDFC AMC maintain highest investment yields
Source: Company, Emkay Research, AMFI
Exhibit 20: Cost yield for the company is at the mean average
Source: Company, Emkay Research, AMFI
Exhibit 21: PAT margins remains best-in-class compared to peers
Source: Company, Emkay Research, AMFI
Exhibit 22: Peer RoE comparison
Source: Company, Emkay Research
3.1 3.1
2.5 2.4 2.3
0.0
0.5
1.0
1.5
2.0
2.5
3.0
3.5
ICICIPrudential
HDFCMutual Fund
Aditya BirlaSun life
RelianceNippon
SBI MutualFund
QAAUM as of June-18 (Rstn)
0.60 0.59
0.47 0.45 0.44
-
0.10
0.20
0.30
0.40
0.50
0.60
0.70
HDFC RelianceNippon
ICICI Birla Sunlife SBI
Invt. Mgt Fees/MAAUM(%) (FY17)
0.25 0.28
0.33 0.34 0.40
-
0.10
0.20
0.30
0.40
0.50
ICICI SBI HDFC Birla Sunlife RelianceNippon
Total costs/MAAUM (%) (FY17)
0.23
0.19 0.19
0.14 0.11
-
0.05
0.10
0.15
0.20
0.25
HDFC ICICI RelianceNippon
SBI Birla Sunlife
PAT/MAAUM(%) (FY17)
70.1
42.8
31.9
24.3 21.9
-
10.0
20.0
30.0
40.0
50.0
60.0
70.0
80.0
ICICI HDFC SBI Birla Sunlife Reliance Nippon

HDFC Asset Management Company Ltd India Equity Research | IPO Note
Emkay Research is also available on www.emkayglobal.com, Bloomberg EMKAY<GO>, Reuters and DOWJONES.
ED: HEMANT MARADIA SA: DHANANJAY SINHA July 24, 2018 | 8
MF industry in India: Poised for strong growth
The equity investment culture through MF has been deepening and we believe that the MF
industry is in a sweet spot to exploit the same. The strengthening of SIP flows, especially post
demonetization looks set to sustain given the continued incremental commitments in the form of
new folios. The recent market correction does not appear to have shaken the belief of retail
investors in SIP driven equity investments. However, June’18 witnessed outflows in long-term
debt funds and higher inflows into short-term liquid money market instruments to manage MTM
losses (because of rising G-sec yields) while equity inflows remained strong. We believe that the
Indian MF industry will continue to clock strong growth, especially for the deeply entrenched
players with an extensive distribution reach. Observing the past trends, we make some secular
growth assumptions:
The industry AUM grew at a CAGR of 24% during FY65-2005 (UTI was set up in 1965), at
a CAGR of 33% during FY05-FY10 and at 18% CAGR during FY10-FY18. The growth trend
has again picked up in the last 2-3 years, thereby increasing the share of equities in the
overall AUM mix. We believe that the rising trend can lift the share of equities in the overall
asset mix, taking it closer to or above 40% over 5-year growth period of FY17-FY22E. As
of Q4FY18, the share of equities in the industry AUM mix was 33%, debt at 55% and others
(including balanced funds) at ~12%.
Indian MF AUM stood at Rs23.4tn as of Q1FY19 and the trend suggests a likely CAGR of
22-24% during FY17-FY22E. This can take the MF AUM beyond Rs50tn over the next four
years. A continued preference for financial assets over physical assets should support
growth in MF AUM. We expect this to manifest in the form higher retail investments through
SIPs and tax-saving ELSS schemes. AMC AUM should also find a new growth avenue in
ETFs, which have been expanding fast and the managed assets, which include AIFs,
retirement funds (EPFO, NPS etc) and offshore funds. Finally, the expansion in B15 cities
should also aid this growth.
Exhibit 23: MF industry historical growth trends…
Source: Company, Emkay Research
Exhibit 24: Quarterly average AUM mix as of Q4FY18
Source: Company, Emkay Research
0
4,000
8,000
12,000
16,000
20,000
24,000
28,000
FY
65
FY
87
FY
93
FY
2003
FY
2004
FY
2005
FY
2006
FY
2007
FY
2008
FY
2009
FY
2010
FY
2011
FY
2012
FY
2013
FY
2014
FY
2015
FY
2016
FY
2017
FY
2018
Q1F
Y19
Rs b
n
QAAUM (Rsbn)
35
20
33
8 3
Debt Liquid/Money Market Equity Balanced Others
Mix of equity funds can rise to
40% by FY22E
QAAUM as of Q1FY19 was
Rs23.4tn vs 23tn in Q4FY18

HDFC Asset Management Company Ltd India Equity Research | IPO Note
Emkay Research is also available on www.emkayglobal.com, Bloomberg EMKAY<GO>, Reuters and DOWJONES.
ED: HEMANT MARADIA SA: DHANANJAY SINHA July 24, 2018 | 9
We expect the equity MFs to grow at a rate faster than Debt MF. The retail investor participation
is expected to be strong in equity AUM growth as incremental flows are backed by rising SIPs.
Exhibit 25: Equity AUM growth higher than Debt MF
Source: Company, Emkay Research, AMFI
Exhibit 26: Debt AUM growth at 17% CAGR during FY11-18
Source: Company, Emkay Research, AMFI
Exhibit 27: Sharp rise in yearly net flows in MFs
Source: Company, Emkay Research, AMFI
Exhibit 28: Investor participation in different schemes (June-18)
Source: Company, Emkay Research, AMFI
Exhibit 29: Holding period of equity assets higher than non-equity assets
Source: Company, Emkay Research
-20
0
20
40
60
80
100
-
2,000
4,000
6,000
8,000
10,000
12,000
FY
2011
FY
2012
FY
2013
FY
2014
FY
2015
FY
2016
FY
2017
FY
2018
Equity(Rsbn) Equity growth yoy(%)
-10
0
10
20
30
40
-
3,000
6,000
9,000
12,000
15,000
FY
2011
FY
2012
FY
2013
FY
2014
FY
2015
FY
2016
FY
2017
FY
2018
Debt (Rsbn) Debt growth yoy(%)
-0.5 -0.2
0.80.5
1.01.3
3.4
2.7
1.3
-1.0
-0.5
0.0
0.5
1.0
1.5
2.0
2.5
3.0
3.5
4.0
FY
11
FY
12
FY
13
FY
14
FY
15
FY
16
FY
17
FY
18
18-J
un
Rs.t
r
2 7
37 13
37
42 84
55
12
1 0 8
-
20
40
60
80
100
Retail HNI Corporates
%
Debt-liquid Debt-Others Equity ETF
10.1 10.5 11.3
18.7 19
30.4
24.3
11.39.7
13.917
23.8
0
5
10
15
20
25
30
35
0-1 Months 1-3 Months 3-6 Months 6-12 Months 12-24 Months >24Months
Equity Non-Equity
Equity assets have a longer
average holding period as
compared to non-equity assets

HDFC Asset Management Company Ltd India Equity Research | IPO Note
Emkay Research is also available on www.emkayglobal.com, Bloomberg EMKAY<GO>, Reuters and DOWJONES.
ED: HEMANT MARADIA SA: DHANANJAY SINHA July 24, 2018| 10
Rising commitment to MF investments through SIPs
Apart from the good stock market performance that has obviously attracted investors, continuous
investor education via industry body AMFI, by individual MFs, as well as SEBI etc has contributed
immensely to create significant awareness among the retail investors about MF and SIPs as a
convenient and disciplined approach to investing in equities on a periodic (monthly) basis. Under
guidance from SEBI, industry umbrella body AMFI began the ‘Mutual Funds Sahi Hai’ (Hindi for
‘Mutual Funds Are Good’, also translates as ‘Mutual Funds Are The Right Choice’) campaign.
Over the past two years, the campaign has penetrated multiple media platforms through its
incisive advertising explaining the various benefits of investments in MF.
Exhibit 30: The now popular ‘Mutual Funds Sahi Hai’ campaign videos educate on various aspects of MF investing
What is a Mutual Fund? What is a SIP? What is an ELSS?
Source: AMFI, Emkay Research
The following comparative data suggests that the campaign has had a beneficial impact on MF
flows, particularly from the B15 locations, which has received a special focus.
Exhibit 31: Mutual Funds Snapshot
Particulars Mar-17 Mar-18 (% yoy)
AUM (Rs tn) 17.6 21.4 21.7
Retail AUM (Rs tn) 8.6 11.7 36.3
B 15 cities retail AUM (Rs tn) 2.1 2.1 0.7
Folios (mn) 55.4 71.3 28.8
SIP accounts (mn) 13.5 22.9 69.6
SIP monthly contribution (Rs bn) 43.4 71.2 64.2
AAUM of equity oriented schemes (Rs tn) 5.3 7.5 42.0
Source: Company, Emkay Research, Note: * SIP accounts (mn) as of June-18
An Investor Survey conducted by SEBI in 2015 had revealed that ~60% MF investors used SIPs
for investments. Recent data shows that monthly SIP inflows have more than doubled from
Rs31bn in Apr’16 to Rs71.2bn in June’18. AMFI data shows that the MF industry added an
average 983K SIP accounts each month during FY2018-19, with an average SIP size of
~Rs3,300. This data confirms the popularity of SIPs as an investment instrument.
Exhibit 32: SIP monthly inflows more than doubled since April-16
Source: Company, Emkay Research
31 43
64
76
- 10 20 30 40 50 60 70 80
Ap
r-16
May-1
6
Jun
-16
Jul-1
6
Au
g-1
6
Se
p-1
6
Oct-
16
Nov-1
6
Dec-1
6
Jan
-17
Feb-1
7
Mar-
17
Ap
r-17
May-1
7
Jun
-17
Jul-1
7
Au
g-1
7
Se
p-1
7
Oct-
17
Nov-1
7
Dec-1
7
Jan
-18
Feb-1
8
Mar-
18
Ap
r-18
May-1
8
Jun
-18
SIP Monthly inflows (Rs bn)

HDFC Asset Management Company Ltd India Equity Research | IPO Note
Emkay Research is also available on www.emkayglobal.com, Bloomberg EMKAY<GO>, Reuters and DOWJONES.
ED: HEMANT MARADIA SA: DHANANJAY SINHA July 24, 2018| 11
Leading AMCs gaining market share
As of June’18, there were 42 AMCs in India. However, the top 5 AMCs dominated with ~57%
market share in the total AUM of Rs23.4tn as of June’18. The next 5 AMCs held ~24% market
share. We believe that top 5 AMCs, with their vast distribution reach, focus on B-15 locations.
Going forward, rising penetration and popularity of their own digital channels should allow them
to continue to dominate the incremental market share.
Exhibit 33: Quarterly Avg. AUM for AMCs operating in India
Quarterly Avg. AUM in (Rs tn) Jun-18 %
Top 5 AMCs
ICICI Prudential 3.1 13.3
HDFC Mutual Fund 3.1 13.1
Aditya Birla Sun life 2.5 10.7
Reliance Nippon 2.4 10.3
SBI Mutual Fund 2.3 10.0
Top 5 AMCs 13.4 57.2
Next 5 AMCs
UTI 1.5 6.5
Kotak Mahindra 1.3 5.5
Franklin Templeton 1.0 4.5
DSP Blackrock Investment Managers 0.9 3.8
Axis Mutual Fund 0.8 3.4
Next 5 AMCs 5.5 23.7
Rest of the market 4.5 19.1
Total 23.4 100.0
Source: Company, Emkay Research

HDFC Asset Management Company Ltd India Equity Research | IPO Note
Emkay Research is also available on www.emkayglobal.com, Bloomberg EMKAY<GO>, Reuters and DOWJONES.
ED: HEMANT MARADIA SA: DHANANJAY SINHA July 24, 2018| 12
Company Background
HDFC AMC is a joint venture between Housing Development Finance Corporation Limited
(“HDFC”) and Standard Life Investments Limited (“SLI”). The company has been in operation for
over 17 years. It manages a total AUM of Rs2,920bn as of March-18. It is the second largest
AMC in India in terms of AUM. It offers a large suite of savings and investment products across
asset classes offering income to wealth creation opportunities to investors. Currently, it provides
133 schemes that were classified into 27 equity-oriented schemes, 98 debt schemes, 3 liquid
schemes, and 5 other schemes.
It also offers portfolio management and segregated account services, including discretionary,
non-discretionary and advisory services, to high net worth individuals (“HNIs”), family offices,
domestic corporates, trusts, provident funds and domestic and global institutions. It manages
AUM of Rs64.7 billion as of March‘18.
Exhibit 34: Management background
Management Team
Milind Barve
Managing Director and an Executive
Director
He is the Managing Director and an Executive Director since 2000. He had been associated with HDFC in the
capacity of general manager – treasury where he headed the treasury operations at HDFC for 14 years and was
responsible for managing HDFC’s treasury portfolio and for raising funds from financial institutions and capital
markets. He was also the head of marketing for retail deposit products and responsible for investment advisory
relationships for Commonwealth Equity Fund Mutual Fund and Invesco India Growth Fund. He holds a bachelor’s
degree in Commerce from University of Poona and is also a fellow of the Institute of Chartered Accountants of
India.
Prashant Jain
Chief Investment Officer
He is the Chief Investment Officer and has been associated with the firm for over 14 years since 2003. Prior to
joining HDFC MF, he was associated with Zurich Asset Management Company (India) Private Limited and SBI
Mutual Funds Management Private Limited. He holds a bachelor’s degree in Technology from the Indian Institute
of Technology, Kanpur and holds a post graduate diploma in Management from Indian Institute of Management,
Bangalore. He is also a designated CFA from the Chartered Financial Analyst Institute, USA.
Piyush Surana
CFO
He is the Chief Financial Officer of the company since 2013. Prior to joining HDFC MF, he was associated with
Daiwa Asset Management (India) Private Limited, Shinsei Corporate Advisory Services Private Limited and Alliance
Capital Asset Management (India) Private Limited. He holds a bachelor’s degree in Commerce and a bachelor’s
degree in law from the University of Jodhpur. He is also a member of the Institute of Chartered Accountants of India
and certified financial planner from Financial Planning Standards Board India.
Kiran M. Kaushik
Head-Sales and Distribution
He has been associated with the company for over 17 years since 2001 and was appointed as the Head of Sales
and Distribution from 2007. Prior to joining HDFC MF, he was associated with Union Bank of India. He holds a
bachelor’s degree in commerce from University of Bangalore.
Source: Company, Emkay Research
Movement in share capital – An important highlight
At the start of FY18, the company’s outstanding shareholding was 25.2mn. The company
issued ~1.15mn new shares at FV of Rs10. On 5th Feb’18, the company announced bonus
shares in the ratio of 3 equity shares for every 1 equity share at FV Rs10. On 13th Feb ’18,
the company split the share at FV of Rs5.
Exhibit 35: Movement of Equity Shares
Particulars (mn) FY16 FY17 FY18
Shares outstanding at the start of year (FV Rs10) 25.2 25.2 25.2
New shares issued (FV Rs10) 0.7 0.0 1.2
Bonus shares issued (FV Rs10) (3:1 @ FV Rs10) - - 79.0
Share buyback (FV Rs10) -0.8 - -
Stock Split (FV Rs5) - - 105.3
Share Outstanding Closing (FV Rs5 for FY18, FV Rs10 for FY14-FY17) 25.2 25.2 210.6
Source: Company, Emkay Research

HDFC Asset Management Company Ltd India Equity Research | IPO Note
Emkay Research is also available on www.emkayglobal.com, Bloomberg EMKAY<GO>, Reuters and DOWJONES.
ED: HEMANT MARADIA SA: DHANANJAY SINHA July 24, 2018| 13
Issue Details
Objects of the issue
The objects of the IPO are to achieve the benefits of listing the equity shares on the stock
exchanges and to carry out the sale of equity shares offered for sale by the promoters. In
addition, the listing of the company’s equity shares will enhance visibility and brand name among
existing and potential customers.
Exhibit 36: Issue Details
Issue Details
Price Band (Rs) 1095 - 1100
Issue Opens July 25, 2018
Issue Closes July 27, 2018
Issue Size (in mn Shares) 25.5
Issue Size (in Rs bn) 27.9 - 28
Shares o/s pre-issue (mn) 212.0
Shares o/s post-issue (mn) 212.0
Post issue market cap (in Rs bn) 232.1 - 233.2
Source: Company, Emkay Research
Exhibit 37: Offer details
Offer details Size (mn shares) Size (Rs m)
Offer for sale 25.46 28,003.3
HDFC Ltd 8.59 9,452.3
Standard life investments Ltd 16.86 18,551.0
Reservations for 3.28 3,608.0
HDFC AMC employees 0.32
HDFC Employee 0.56
HDFC Shareholder 2.40
Net offer 22.18 24,395
Source: Company, Emkay Research
Exhibit 38: Promoters shareholding pattern pre and post issue
Name of the Selling Shareholder
Number of Equity
Shares held (Pre-
Offer) (mn)
Percentage
holding of the pre-
Offer capital* (%)
Number of
Offered Equity
Shares (mn)
Number of
Equity Shares
held (Post-Offer)
(mn)
Percentage
holding of the
post-Offer capital*
(%)
HDFC Ltd 121 57.0% 8.6 112 52.9%
Standard life investments Ltd 81 38.0% 17 64 30.0%
Source: Company, Emkay Research
Exhibit 39: Top 10 Shareholders
Shareholders Pre-Issue Post-Issue
in mn shares Shareholding (%) in mn shares Shareholding (%)
HDFC 120.77 57.0% 112.18 52.9%
Standard Life Investments 80.52 38.0% 63.65 30.0%
KKR India 1.26 0.6% 1.26 0.6%
Milind Barve 1.04 0.5% 1.04 0.5%
Prashant Jain 0.89 0.4% 0.89 0.4%
Shobhit Mehrotra 0.36 0.2% 0.36 0.2%
Chirag Setalvad 0.32 0.2% 0.32 0.2%
Yezdi Khariwala 0.30 0.1% 0.30 0.1%
Anil Bamboli 0.28 0.1% 0.28 0.1%
Shyamali Basu 0.26 0.1% 0.26 0.1%
Total 206.0 97.2% 180.5 85.2%
Source: Company, Emkay Research

HDFC Asset Management Company Ltd India Equity Research | IPO Note
Emkay Research is also available on www.emkayglobal.com, Bloomberg EMKAY<GO>, Reuters and DOWJONES.
ED: HEMANT MARADIA SA: DHANANJAY SINHA July 24, 2018| 14
Key Financials
Income Statement
Y/E Mar (Rs mn) FY14 FY15 FY16 FY17 FY18
Total Revenue from Operations 8,585 10,224 14,425 14,800 17,598
-Investment Management Fees 7,150 9,209 12,097 14,285 17,365
-Portfolio Management services 1,435 1,016 2,328 516 233
Other income 446 418 518 1,079 1,075
Total Revenue 9,031 10,643 14,943 15,879 18,672
Operating Expenses 3,807 4,417 7,861 7,881 8,047
-Employee costs 1,116 1,275 1,432 1,576 1,749
-Depreciation and amortization 84 101 111 120 114
-Other expense 2,607 3,040 6,318 6,186 6,183
Profit before tax 5,225 6,226 7,083 7,998 10,625
Tax 1,647 2,071 2,304 2,496 3,409
Tax rate (%) 32% 33% 33% 31% 32%
Profit after tax 3,578 4,155 4,779 5,502 7,216
Balance Sheet
Y/E Mar (Rs mn) FY14 FY15 FY16 FY17 FY18
Equity 252 252 252 252 1,053
Reserves & Surplus 8,760 10,946 11,261 13,978 20,547
Net worth 9,013 11,199 11,512 14,229 21,600
Provisions 150 150 150 9 9
Trade Payables 1,477 951 1,720 961 1,157
Other current liabilities 574 818 845 797 982
Total Liabilities 11,213 13,118 14,227 15,996 23,706
Cash 10 26 10 13 21
Investments 7,366 6,505 9,858 12,367 19,506
Fixed assets 280 339 323 336 388
Other assets 3,557 6,248 4,037 3,281 3,792
Total assets 11,213 13,118 14,227 15,996 23,706
AAAUM
Y/E Mar (Rs bn) FY14 FY15 FY16 FY17 FY18
Equity NA NA 682 806 1,323
Debt NA NA 1,042 1,361 1,453
Other NA NA 9 10 13
Total AAAUM NA NA 1,733 2,177 2,789
End of period AUM
Y/E Mar (Rs bn) FY14 FY15 FY16 FY17 FY18
Mutual funds 1,089 1,506 1,656 2,306 2,920
PMS and segregated account services 39 24 46 59 65
Total 1,128 1,529 1,702 2,365 2,985
Key Ratios (%)
Y/E Mar (%) FY14 FY15 FY16 FY17 FY18
Invest. Management fees/AAAUM NA NA 0.70% 0.66% 0.62%
Total Revenue/ AAAUM NA NA 0.86% 0.73% 0.67%
Employee Expense/AAAUM NA NA 0.08% 0.07% 0.06%
Operating Expenses/AAAUM NA NA 0.45% 0.36% 0.29%
PBT/AAAUM NA NA 0.41% 0.37% 0.38%
PAT/AAAUM NA NA 0.28% 0.25% 0.26%
ROE 39.7% 41.1% 42.1% 42.8% 40.3%

HDFC Asset Management Company Ltd India Equity Research | IPO Note
Emkay Research is also available on www.emkayglobal.com, Bloomberg EMKAY<GO>, Reuters and DOWJONES.
ED: HEMANT MARADIA SA: DHANANJAY SINHA July 24, 2018| 15
Per Share Data (Rs) FY14 FY15 FY16 FY17 FY18
EPS 17.6 20.3 23.6 27.1 35.0
BVPS 44.3 54.7 56.8 70.0 104.6
DPS 25.0 32.5 40.0 46.0 16
Valuations (x) FY14 FY15 FY16 FY17 FY18
PE (at Rs 1,100) 62.5 54.2 46.7 40.7 31.5
P/BV (at Rs 1,100) 24.8 20.1 19.4 15.7 10.5
Mkt cap/AUM 20.7% 15.2% 13.7% 9.9% 7.8%
Dividend yield (%) 2.3% 3.0% 3.6% 4.2% 1.5%
Growth (%) FY14 FY15 FY16 FY17 FY18
Investment Management fees NA 29% 31% 18% 22%
Total Revenue NA 18% 40% 6% 18%
Operating Expenses NA 16% 78% 0% 2%
PAT NA 16% 15% 15% 31%
AAAUM NA NA NA 26% 28%

HDFC Asset Management Company Ltd India Equity Research | IPO Note
Emkay Research is also available on www.emkayglobal.com, Bloomberg EMKAY<GO>, Reuters and DOWJONES.
ED: HEMANT MARADIA SA: DHANANJAY SINHA July 24, 2018| 16
Emkay Rating Distribution
BUY Expected total return (%) (Stock price appreciation and dividend yield) of over 25% within the next 12-18 months.
ACCUMULATE Expected total return (%) (Stock price appreciation and dividend yield) of over 10% within the next 12-18 months.
HOLD Expected total return (%) (Stock price appreciation and dividend yield) of upto 10% within the next 12-18 months.
REDUCE Expected total return (%) (Stock price depreciation) of upto (-) 10% within the next 12-18 months.
SELL The stock is believed to underperform the broad market indices or its related universe within the next 12-18 months.
Emkay Global Financial Services Ltd.
CIN - L67120MH1995PLC084899
7th Floor, The Ruby, Senapati Bapat Marg, Dadar - West, Mumbai - 400028. India
Tel: +91 22 66121212 Fax: +91 22 66121299 Web: www.emkayglobal.com
DISCLAIMERS AND DISCLOSURES: Emkay Global Financial Services Limited (CIN-L67120MH1995PLC084899) and its affiliates are a full-service, brokerage, investment banking, investment
management and financing group. Emkay Global Financial Services Limited (EGFSL) along with its affiliates are participants in virtually all securities trading markets in India. EGFSL was established in 1995
and is one of India's leading brokerage and distribution house.EGFSL is a corporate trading member of Bombay Stock Exchange Limited (BSE), National Stock Exchange of India Limited(NSE), MCX Stock
Exchange Limited (MCX-SX).EGFSL along with its subsidiaries offers the most comprehensive avenues for investments and is engaged in the businesses including stock broking (Institutional and retail),
merchant banking, commodity broking, depository participant, portfolio management, insurance broking and services rendered in connection with distribution of primary market issues and financial products
like mutual funds, fixed deposits. Details of associates are available on our website i.e. www.emkayglobal.com
EGFSL is registered as Research Analyst with SEBI bearing registration Number INH000000354 as per SEBI (Research Analysts) Regulations, 2014. EGFSL hereby declares that it has not defaulted with
any stock exchange nor its activities were suspended by any stock exchange with whom it is registered in last five years, except that NSE had disabled EGFSL from trading on October 05, October 08 and
October 09, 2012 for a manifest error resulting into a bonafide erroneous trade on October 05, 2012. However, SEBI and Stock Exchanges have conducted the routine inspection and based on their
observations have issued advice letters or levied minor penalty on EGFSL for certain operational deviations in ordinary/routine course of business. EGFSL has not been debarred from doing business by
any Stock Exchange / SEBI or any other authorities; nor has its certificate of registration been cancelled by SEBI at any point of time.
EGFSL offers research services to clients as well as prospects. The analyst for this report certifies that all of the views expressed in this report accurately reflect his or her personal views about the subject
company or companies and its or their securities, and no part of his or her compensation was, is or will be, directly or indirectly related to specific recommendations or views expressed in this report.
Other disclosures by Emkay Global Financial Services Limited (Research Entity) and its Research Analyst under SEBI (Research Analyst) Regulations, 2014 with reference to the subject
company(s) covered in this report-:
EGFSL or its associates may have financial interest in the subject company.
Research Analyst or his/her relative’s financial interest in the subject company. (NO)
EGFSL or its associates and Research Analyst or his/her relative’s does not have any material conflict of interest in the subject company. The research Analyst or research entity (EGFSL) have not been
engaged in market making activity for the subject company.
EGFSL or its associates may have actual/beneficial ownership of 1% or more securities of the subject company at the end of the month immediately preceding the date of publication of Research Report.
Research Analyst or his/her relatives have actual/beneficial ownership of 1% or more securities of the subject company at the end of the month immediately preceding the date of publication of Research
Report: (NO)
EGFSL or its associates may have received any compensation including for investment banking or merchant banking or brokerage services from the subject company in the past 12 months. EGFSL or its
associates may have received compensation for products or services other than investment banking or merchant banking or brokerage services from the subject company in the past 12 months. EGFSL or
its associates may have received any compensation or other benefits from the Subject Company or third party in connection with the research report. Subject Company may have been client of EGFSL or
its associates during twelve months preceding the date of distribution of the research report and EGFSL may have co-managed public offering of securities for the subject company in the past twelve months.
The research Analyst has served as officer, director or employee of the subject company: (NO)
The Research Analyst has received any compensation from the subject company in the past twelve months: (NO)
The Research Analyst has managed or co‐managed public offering of securities for the subject company in the past twelve months: (NO)
The Research Analyst has received any compensation for investment banking or merchant banking or brokerage services from the subject company in the past twelve months: (NO)
The Research Analyst has received any compensation for products or services other than investment banking or merchant banking or brokerage services from the subject company in the past twelve months:
(NO)
The Research Analyst has received any compensation or other benefits from the subject company or third party in connection with the research report: (NO)
EGFSL and/or its affiliates may seek investment banking or other business from the company or companies that are the subject of this material. Our salespeople, traders, and other professionals may provide
oral or written market commentary or trading strategies to our clients that reflect opinions that are contrary to the opinions expressed herein, and our proprietary trading and investing businesses may make
investment decisions that may be inconsistent with the recommendations expressed herein. In reviewing these materials, you should be aware that any or all of the foregoing, among other things, may give
rise to real or potential conflicts of interest including but not limited to those stated herein. Additionally, other important information regarding our relationships with the company or companies that are the
subject of this material is provided herein. This report is not directed to, or intended for distribution to or use by, any person or entity who is a citizen or resident of or located in any locality, state, country or
other jurisdiction where such distribution, publication, availability or use would be contrary to law or regulation or which would subject EGFSL or its group companies to any registration or licensing requirement
within such jurisdiction. Specifically, this document does not constitute an offer to or solicitation to any U.S. person for the purchase or sale of any financial instrument or as an official confirmation of any
transaction to any U.S. person. Unless otherwise stated, this message should not be construed as official confirmation of any transaction. No part of this document may be distributed in Canada or used by
private customers in United Kingdom. All material presented in this report, unless specifically indicated otherwise, is under copyright to Emkay. None of the material, nor its content, nor any copy of it, may
be altered in any way, transmitted to, copied or distributed to any other party, without the prior express written permission of EGFSL . All trademarks, service marks and logos used in this report are trademarks
or registered trademarks of EGFSL or its Group Companies. The information contained herein is not intended for publication or distribution or circulation in any manner whatsoever and any unauthorized
reading, dissemination, distribution or copying of this communication is prohibited unless otherwise expressly authorized. Please ensure that you have read “Risk Disclosure Document for Capital Market
and Derivatives Segments” as prescribed by Securities and Exchange Board of India before investing in Indian Securities Market. In so far as this report includes current or historic information, it is believed
to be reliable, although its accuracy and completeness cannot be guaranteed.
www.emkayglobal.com

HDFC Asset Management Company Ltd India Equity Research | IPO Note
Emkay Research is also available on www.emkayglobal.com, Bloomberg EMKAY<GO>, Reuters and DOWJONES.
ED: HEMANT MARADIA SA: DHANANJAY SINHA July 24, 2018| 17
Jignesh Shial, CA [email protected] +91-22-66242468