Embed Size (px)
Citation preview

CDP Climate Change 2017 Information Request
Incitec Pivot
Module: Introduction
Page: Introduction
CC0.1
Introduction Please give a general description and introduction to your organization. Incitec Pivot Limited (IPL) is a global diversified industrial chemicals company that supplies explosives, industrial chemicals, fertilisers and related services to the mining, infrastructure & construction, chemicals and agriculture industries. IPL has extensive operations throughout Australia, the United States, Canada, Mexico, Turkey and Indonesia, including over 30 manufacturing plants, scores of distribution centres and well-established channels to market. The Company employs over 4,500 staff worldwide, including almost 2,000 staff in Australia and over 2,200 staff in North America. IPL manufactures a range of fertiliser inputs and products including ammonium phosphates, ammonia, urea, sulphuric acid and superphosphates at five manufacturing sites across eastern Australia and is the only manufacturer of ammonium phosphates and urea in Australia. Through the Incitec Pivot Fertilisers brand (IPF) IPL is Australia's largest supplier of fertilisers, dispatching approximately two million tonnes each year for use in the grain, cotton, pasture, dairy, sugar and horticulture industries. It operates through a comprehensive network of distributors who supply the product to Australian farmers. IPL has a long-term commitment to investment in soil nutrition research and its Nutrient Advantage laboratory is industry accredited. As a leading provider of nutrition advice to farmers and customers, IPL promotes the sustainable use and safe handling of its fertiliser products to customers and farmers. Through the Dyno Nobel brand, IPL is the second largest supplier of explosives in Australia and is a market leader in North America. Dyno Nobel branded products include a complete range of commercial explosives including ammonium nitrate, bulk explosives, packaged emulsions and dynamite as well as a range of initiating systems. Services provided include expert technical consulting to customers such as mining companies and their suppliers, quarries and companies supporting the construction industry. In addition, IPL manufactures various industrial chemical products used in water treatment, process manufacturing and other industrial applications. IPL recognises that building a sustainable future requires not only the production of infrastructure, food, clothing, shelter and energy that people need every day, but also the balancing of economic performance with environmental and social responsibilities. Those responsibilities include being a good corporate citizen and operating ethically. They include ensuring good governance in our day-to-day business activities and behaving with honesty and integrity in our interactions with communities, employees, customers, and the environment. IPL’s approach to sustainability includes the areas of: workplace health and safety, environmental impacts and resource efficiency, community impact and engagement, effective workforce management and labour practices, product stewardship and promoting the sustainable use of our products and services.

CC0.2
Reporting Year Please state the start and end date of the year for which you are reporting data. The current reporting year is the latest/most recent 12-month period for which data is reported. Enter the dates of this year first. We request data for more than one reporting period for some emission accounting questions. Please provide data for the three years prior to the current reporting year if you have not provided this information before, or if this is the first time you have answered a CDP information request. (This does not apply if you have been offered and selected the option of answering the shorter questionnaire). If you are going to provide additional years of data, please give the dates of those reporting periods here. Work backwards from the most recent reporting year. Please enter dates in following format: day(DD)/month(MM)/year(YYYY) (i.e. 31/01/2001).
Enter Periods that will be disclosed
Thu 01 Oct 2015 - Fri 30 Sep 2016
CC0.3
Country list configuration Please select the countries for which you will be supplying data. If you are responding to the Electric Utilities module, this selection will be carried forward to assist you in completing your response.
Select country
CC0.4
Currency selection Please select the currency in which you would like to submit your response. All financial information contained in the response should be in this currency. AUD ($)

CC0.6
Modules As part of the request for information on behalf of investors, companies in the electric utility sector, companies in the automobile and auto component manufacturing sector, companies in the oil and gas sector, companies in the information and communications technology sector (ICT) and companies in the food, beverage and tobacco sector (FBT) should complete supplementary questions in addition to the core questionnaire. If you are in these sector groupings, the corresponding sector modules will not appear among the options of question CC0.6 but will automatically appear in the ORS navigation bar when you save this page. If you want to query your classification, please email [email protected]. If you have not been presented with a sector module that you consider would be appropriate for your company to answer, please select the module below in CC0.6.
Further Information
Module: Management
Page: CC1. Governance
CC1.1
Where is the highest level of direct responsibility for climate change within your organization? Board or individual/sub-set of the Board or other committee appointed by the Board
CC1.1a
Please identify the position of the individual or name of the committee with this responsibility The Incitec Pivot Board of Directors is responsible for charting the direction, policies, strategies and financial objectives of the Company. The Company's sustainability strategy, encompassing its climate change strategy, was endorsed by the Board. Day to day management and implementation of strategy and policy initiatives is formally delegated to the Managing Director & CEO. The Corporate Sustainability Manager is the individual that specifically managed information on climate change during the reporting period. This position reports to the Group Vice President, Investor Relations & Corporate Development. The Group Vice President, Investor Relations and Corporate Development reports to the Chief Financial Officer.
CC1.2
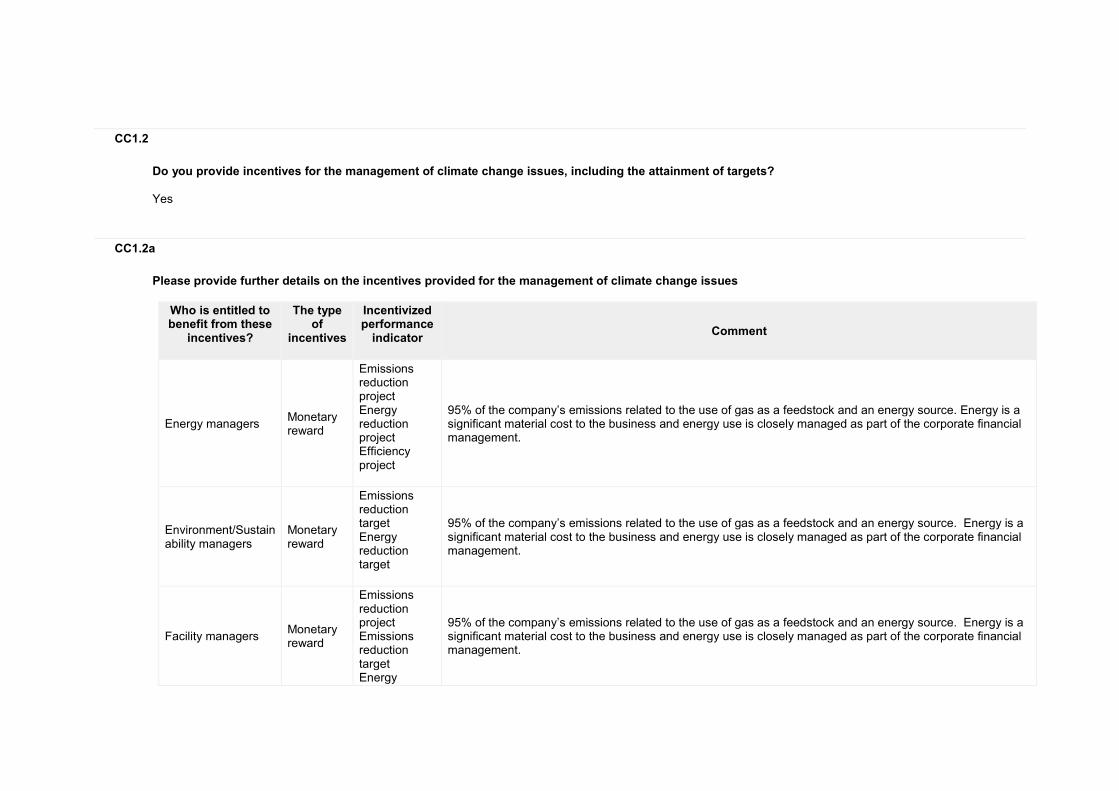
Do you provide incentives for the management of climate change issues, including the attainment of targets? Yes
CC1.2a
Please provide further details on the incentives provided for the management of climate change issues
Who is entitled to benefit from these
incentives?
The type of
incentives
Incentivized performance
indicator
Comment
Energy managers Monetary reward
Emissions reduction project Energy reduction project Efficiency project
95% of the company’s emissions related to the use of gas as a feedstock and an energy source. Energy is a significant material cost to the business and energy use is closely managed as part of the corporate financial management.
Environment/Sustainability managers
Monetary reward
Emissions reduction target Energy reduction target
95% of the company’s emissions related to the use of gas as a feedstock and an energy source. Energy is a significant material cost to the business and energy use is closely managed as part of the corporate financial management.
Facility managers Monetary reward
Emissions reduction project Emissions reduction target Energy
95% of the company’s emissions related to the use of gas as a feedstock and an energy source. Energy is a significant material cost to the business and energy use is closely managed as part of the corporate financial management.

Who is entitled to benefit from these
incentives?
The type of
incentives
Incentivized performance
indicator
Comment
reduction project Efficiency project Efficiency target
Corporate executive team
Monetary reward
Efficiency project Efficiency target
Executive remuneration for members of the Executive Team includes non-financial performance measures relating to Business Excellence, productivity and efficiency: specifically, the measurement of performance goals against a Project Scorecard for the delivery of the new Louisiana Ammonia Project, which includes the KPI ‘plant efficiency’ (see page 33 of the Director's Report: Remuneration Report in the IPL 2016 Annual Report at http://www.incitecpivot.com.au/~/media/Files/IPL/Sustainability/2016%20Sustainability%20Report/IPL_2016_Annual%20Report.pdf). The targeted efficiency (32 MMBTu of gas per metric tonne of ammonia) supports IPL’s 2015-2017 global greenhouse gas emissions target, which is a reduction of 2% tCO2e per tonne of ammonia produced.
Chief Executive Officer (CEO)
Monetary reward
Efficiency project Efficiency target
Executive remuneration for the CEO and Managing Director includes non-financial performance measures (Strategic Initiatives Conditions under the LTI) relating to Business Excellence, productivity and efficiency: specifically, the measurement of performance goals against a Project Scorecard for the delivery of the new Louisiana Ammonia Project, which includes the KPI ‘plant efficiency’ (see page 33 as labelled in the IPL 2016 Annual Report at http://www.incitecpivot.com.au/~/media/Files/IPL/Sustainability/2016%20Sustainability%20Report/IPL_2016_Annual%20Report.pdf. The targeted efficiency (32 MMBTu of gas per metric tonne of ammonia) supports IPL’s 2015-2017 global greenhouse gas emissions target, which is a reduction of 2% tCO2e per tonne of ammonia produced.
Further Information
See references to executive remuneration in the IPL 2016 Annual Report
Attachments
https://www.cdp.net/sites/2017/14/8914/Climate Change 2017/Shared Documents/Attachments/ClimateChange2017/CC1.Governance/IPL_2016_Annual Report.pdf

Page: CC2. Strategy
CC2.1
Please select the option that best describes your risk management procedures with regard to climate change risks and opportunities Integrated into multi-disciplinary company wide risk management processes
CC2.1a
Please provide further details on your risk management procedures with regard to climate change risks and opportunities
Frequency
of monitoring
To whom are results
reported?
Geographical
areas considered
How far into the future are risks
considered?
Comment
Annually Board or individual/sub-set of the Board or committee appointed by the Board
Global operations
1 to 3 years
Potential sustainability risks to be managed and opportunities to be leveraged, including carbon regulation, have been considered at a high level by Corporate and Business Units in creating and acting on business strategies.
CC2.1b
Please describe how your risk and opportunity identification processes are applied at both company and asset level The highest governing body, the Board of Directors, is responsible for charting the direction, policies, strategies and financial objectives of the Company. The Board operates in accordance with the principles set out in its Board Charter (available at www.incitecpivot.com.au/Corporate_Governance). Day-to-day management of Company affairs and the implementation of the corporate strategy and policy initiatives are formally delegated to the Managing Director & CEO, and his direct reports form the Executive Team. During the year ending September 30, 2016, responsibility for sustainability strategy and governance resided with the Executive Team, advised by the Corporate

Sustainability Manager under the Group Vice President, Investor Relations & Corporate Development. The Group Vice President, Investor Relations and Corporate Development reports to the Chief Financial Officer, thereby providing alignment with the financial performance for the Company and overall risk management. Incitec Pivot manages risk within a comprehensive risk management process which is consistent with the Australian/New Zealand Standard for Risk Management (AS/NZS ISO 31000:2009). A key element of this risk management process is the Board’s assessment of risk, which is based on the level of risk we are able to sustain in achieving the corporate objective of delivering value to shareholders. Each business unit, manufacturing plant, operating site and functional unit is required to maintain a register of risks and opportunities pertaining to their particular strategy and assets. The format and content of these registers is governed by the Group's Risk Management Framework and accompanying procedures and templates. The registers are monitored and updated on a regular basis with reporting to the Board Audit and Risk Management Committee occurring at least annually.
CC2.1c
How do you prioritize the risks and opportunities identified? Priority is given to those issues determined to have the most immediate impacts on our business. Our climate-change related priorities are: 1. Gas supply risk: Natural gas is one of the major inputs required for the production of ammonia and therefore is a critical feedstock (chemical source of hydrogen) for IPL's nitrogen manufacturing operations. Changing market conditions relating to the use and supply of natural gas are influenced globally by climate change policy. 2. Industry structure and competition risks: The balance between supply and demand of the products that IPL manufactures and sells can greatly influence prices and plant utilisation. The structural shift in the North American power sector, which has seen a movement away from coal-fired energy production and towards natural gas, has placed increased pressure on existing customers (therefore giving rise to increased cost pressure on inputs to their supply) and has also resulted in reduced demand for their outputs. 3. Extreme weather risk: Any prolonged adverse weather conditions could impact the future profitability and prospects of Incitec Pivot. 4. Compliance, regulatory and legal risk: Changes in federal or state government legislation, regulations or policies in any of the countries in which we operate may adversely impact Incitec Pivot’s business. Incitec Pivot’s business is subject to environmental laws and regulations that require specific operating licences and impose various requirements and standards. Each of these risks and the treatment strategies employed by IPL are discussed under 'Principal Risks' in the 2016 IPL Annual Report.
CC2.1d
Please explain why you do not have a process in place for assessing and managing risks and opportunities from climate change, and whether you plan to introduce such a process in future
Main reason for not having a process
Do you plan to introduce a process?
Comment
CC2.2
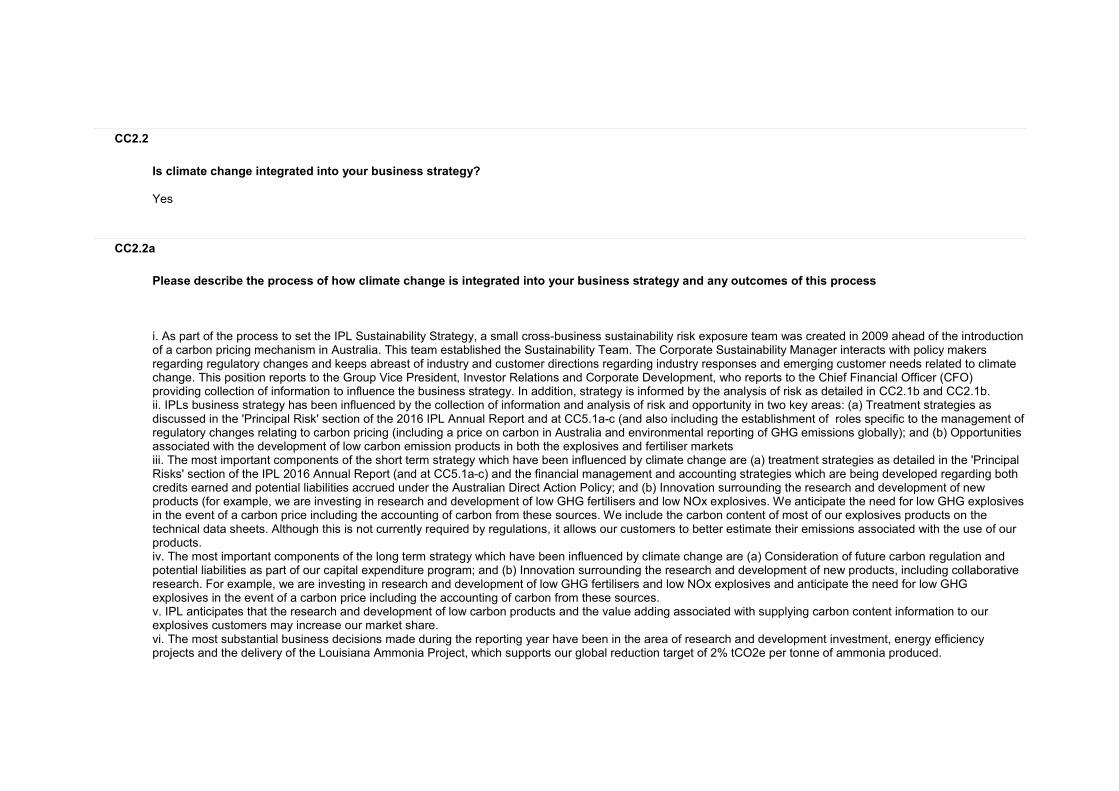
Is climate change integrated into your business strategy? Yes
CC2.2a
Please describe the process of how climate change is integrated into your business strategy and any outcomes of this process i. As part of the process to set the IPL Sustainability Strategy, a small cross-business sustainability risk exposure team was created in 2009 ahead of the introduction of a carbon pricing mechanism in Australia. This team established the Sustainability Team. The Corporate Sustainability Manager interacts with policy makers regarding regulatory changes and keeps abreast of industry and customer directions regarding industry responses and emerging customer needs related to climate change. This position reports to the Group Vice President, Investor Relations and Corporate Development, who reports to the Chief Financial Officer (CFO) providing collection of information to influence the business strategy. In addition, strategy is informed by the analysis of risk as detailed in CC2.1b and CC2.1b. ii. IPLs business strategy has been influenced by the collection of information and analysis of risk and opportunity in two key areas: (a) Treatment strategies as discussed in the 'Principal Risk' section of the 2016 IPL Annual Report and at CC5.1a-c (and also including the establishment of roles specific to the management of regulatory changes relating to carbon pricing (including a price on carbon in Australia and environmental reporting of GHG emissions globally); and (b) Opportunities associated with the development of low carbon emission products in both the explosives and fertiliser markets iii. The most important components of the short term strategy which have been influenced by climate change are (a) treatment strategies as detailed in the 'Principal Risks' section of the IPL 2016 Annual Report (and at CC5.1a-c) and the financial management and accounting strategies which are being developed regarding both credits earned and potential liabilities accrued under the Australian Direct Action Policy; and (b) Innovation surrounding the research and development of new products (for example, we are investing in research and development of low GHG fertilisers and low NOx explosives. We anticipate the need for low GHG explosives in the event of a carbon price including the accounting of carbon from these sources. We include the carbon content of most of our explosives products on the technical data sheets. Although this is not currently required by regulations, it allows our customers to better estimate their emissions associated with the use of our products. iv. The most important components of the long term strategy which have been influenced by climate change are (a) Consideration of future carbon regulation and potential liabilities as part of our capital expenditure program; and (b) Innovation surrounding the research and development of new products, including collaborative research. For example, we are investing in research and development of low GHG fertilisers and low NOx explosives and anticipate the need for low GHG explosives in the event of a carbon price including the accounting of carbon from these sources. v. IPL anticipates that the research and development of low carbon products and the value adding associated with supplying carbon content information to our explosives customers may increase our market share. vi. The most substantial business decisions made during the reporting year have been in the area of research and development investment, energy efficiency projects and the delivery of the Louisiana Ammonia Project, which supports our global reduction target of 2% tCO2e per tonne of ammonia produced.

CC2.2b
Please explain why climate change is not integrated into your business strategy
CC2.2c
Does your company use an internal price on carbon? Yes
CC2.2d
Please provide details and examples of how your company uses an internal price on carbon In Australia, where the Direct Action Policy and Emissions Reduction Fund (ERF) create tradable Australian Carbon Credit Units (ACCUs), IPL accounts for a carbon price set at the value of the most recent ERF auction price.
CC2.3
Do you engage in activities that could either directly or indirectly influence public policy on climate change through any of the following? (tick all that apply) Direct engagement with policy makers Trade associations Funding research organizations

CC2.3a
On what issues have you been engaging directly with policy makers?
Focus of legislation
Corporate Position
Details of engagement
Proposed legislative solution
Mandatory carbon reporting
Support with minor exceptions
Respond to Government discussion papers and participate in workshops
1. Simplification and alignment of related energy and greenhouse gas reporting legislation and regulation, and removal of red tape and excess administration
Cap and trade Support with major exceptions
Respond to Government discussion papers and participate in workshops
2. Simplification of related energy efficiency project reporting legislation and regulation, and removal of red tape and excess administration
Energy efficiency Support with major exceptions
Respond to Government discussion papers and participate in workshops
3. Simplification and alignment of related energy and greenhouse gas reporting legislation and regulation, and removal of red tape and excess administration
Clean energy generation
Support Respond to Government discussion papers and participate in workshops
4. Discussion and investigation into potential grant funding for inclusion of clean energy and emission reducing technologies in operations
Climate finance Support Respond to Government discussion papers and participate in workshops
5. Discussion and investigation into potential financing of the inclusion of clean energy and emission reducing technologies in operations
CC2.3b
Are you on the Board of any trade associations or provide funding beyond membership? No
CC2.3c
Please enter the details of those trade associations that are likely to take a position on climate change legislation

Trade association
Is your position on climate change consistent with theirs?
Please explain the trade association's position
How have you, or are you attempting to, influence the position?
CC2.3d
Do you publicly disclose a list of all the research organizations that you fund? Yes
CC2.3e
Please provide details of the other engagement activities that you undertake
CC2.3f
What processes do you have in place to ensure that all of your direct and indirect activities that influence policy are consistent with your overall climate change strategy? Our highest governing body is the Board of Directors. The Board is responsible for charting the direction, policies, strategies and financial objectives of the Company. Our sustainability strategy, encompassing our strategy on climate change, was endorsed by the Board. Day-to-day management of Company affairs and the implementation of the corporate strategy and policy initiatives are formally delegated to the Managing Director and CEO. Responsibility for sustainability strategy and governance resides with the Executive Team, advised by the Corporate Sustainability Team. During the reporting period, the Corporate Sustainability Team was led by the Vice President, Sustainability who reported to the Chief Financial Officer, thereby providing alignment with the financial performance and financial processes for the Company.
CC2.3g
Please explain why you do not engage with policy makers

Further Information
See the list of research organizations funded in 2016 at http://www.incitecpivot.com.au/sustainability/ipl-online-sustainability-report/products-and-services/research-and-development
Page: CC3. Targets and Initiatives
CC3.1
Did you have an emissions reduction or renewable energy consumption or production target that was active (ongoing or reached completion) in the reporting year?
Intensity target
CC3.1a Please provide details of your absolute target
ID
Scope
% of emissions in
scope
% reduction from base year
Base year
Base year emissions covered by
target (metric tonnes CO2e)
Target year
Is this a science-
based target?
Comment
CC3.1b
Please provide details of your intensity target

ID
Scope
% of emissions in
scope
% reduction from base
year
Metric
Base year
Normalized base year emissions covered by
target
Target year
Is this a science-based target?
Comment
Int1 Scope 1
71% 2% Metric tonnes CO2e per metric tonne of product
2015 2.14 2017 No, and we do not anticipate setting one in the next 2 years
2% reduction in CO2e per tonne of ammonia globally
Int2 Scope 1
29% 3% Metric tonnes CO2e per metric tonne of product
2015 0.44138 2017 No, and we do not anticipate setting one in the next 2 years
3% reduction in CO2e per tonne of nitric acid globally
CC3.1c
Please also indicate what change in absolute emissions this intensity target reflects
ID
Direction of change
anticipated in absolute
Scope 1+2 emissions at
target completion?
% change anticipated in
absolute Scope 1+2 emissions
Direction of change anticipated in
absolute Scope 3 emissions at target
completion?
% change anticipated in
absolute Scope 3
emissions
Comment
Int1 Increase 10 No change 0
Although IPL's intensity (emissions per tonne of production) will decrease in line with targets, our absolute Scope 1 emissions are expected to increase slightly due to increased production. There is no specific target for Scope 3 emissions.
Int2 Increase 10 No change 0
Although IPL's intensity (emissions per tonne of production) will decrease in line with targets, our absolute Scope 1 emissions are expected to increase slightly due to increased production. There is no specific target for Scope 3 emissions.

CC3.1d
Please provide details of your renewable energy consumption and/or production target
ID
Energy types
covered by target
Base year
Base year energy for energy type covered
(MWh)
% renewable
energy in base year
Target year
% renewable
energy in target year
Comment
CC3.1e
For all of your targets, please provide details on the progress made in the reporting year
ID
% complete
(time)
% complete (emissions or
renewable energy)
Comment
Int1 50% 0%
This target is associated with the construction and commissioning of a new high efficiency ammonia plant at Waggaman, Louisiana, which was completed at the close of the 2016 IPL financial year, which is the current reporting period. For this reason, the work towards achieving the target can be considered to be progressing as planned. The actual effects of the reduction in energy use per tonne will be seen in the data from the 2017 financial year, (which is the 2018 CDP Report).
Int2 50% 0%
This target is associated with the installation and commissioning of NOx abatement technology (which also abates some greenhouse gases) at our Louisiana, Missouri nitric acid plant, which was completed at the beginning of 2017 IPL financial year, which is the 2018 CDP reporting period. For this reason, the work towards achieving the target can be considered to be progressing as planned. The actual effects of the reduction in energy use per tonne will be seen in the data from the 2017 financial year, (which is the 2018 CDP Report).

CC3.1f
Please explain (i) why you do not have a target; and (ii) forecast how your emissions will change over the next five years
CC3.2
Do you classify any of your existing goods and/or services as low carbon products or do they enable a third party to avoid GHG emissions?
Yes
CC3.2a
Please provide details of your products and/or services that you classify as low carbon products or that enable a third party to avoid GHG emissions
Level of
aggregation
Description of product/Group of
products
Are you
reporting low carbon product/s or avoided emissions?
Taxonomy, project or methodology used to classify product/s as low carbon or to
calculate avoided emissions
% revenue from low carbon
product/s in the
reporting year
% R&D in
low carbon
product/s in the
reporting year
Comment
Group of products
Green Urea NV products contain urea treated with the urease inhibitor, N-(n-butyl) thiophosphoric triamide (NBPT), which delays hydrolysis of urea into unstable forms that may be lost to the atmosphere, thereby reducing emissions related to fertiliser usage.
Avoided emissions
Other: See ‘Reducing nitrous oxide emissions from applied nitrogen with nitrification inhibitors through identification of key drivers of performance.’ At http://www.piccc.org.au/research/project/269
2% Less than or equal to 10%
Losses of nitrous oxides to the atmosphere are estimated to be reduced by a conservative 50%, but are difficult to quantify due to being affected by precipitation and application techniques. Agronomy services and education are provided to customers to increase
Level of
aggregation
Description of product/Group of
products
Are you
reporting low carbon product/s or avoided emissions?
Taxonomy, project or methodology used to classify product/s as low carbon or to
calculate avoided emissions
% revenue from low carbon
product/s in the
reporting year
% R&D in
low carbon
product/s in the
reporting year
Comment
knowledge and maximise emissions reductions.
Group of products
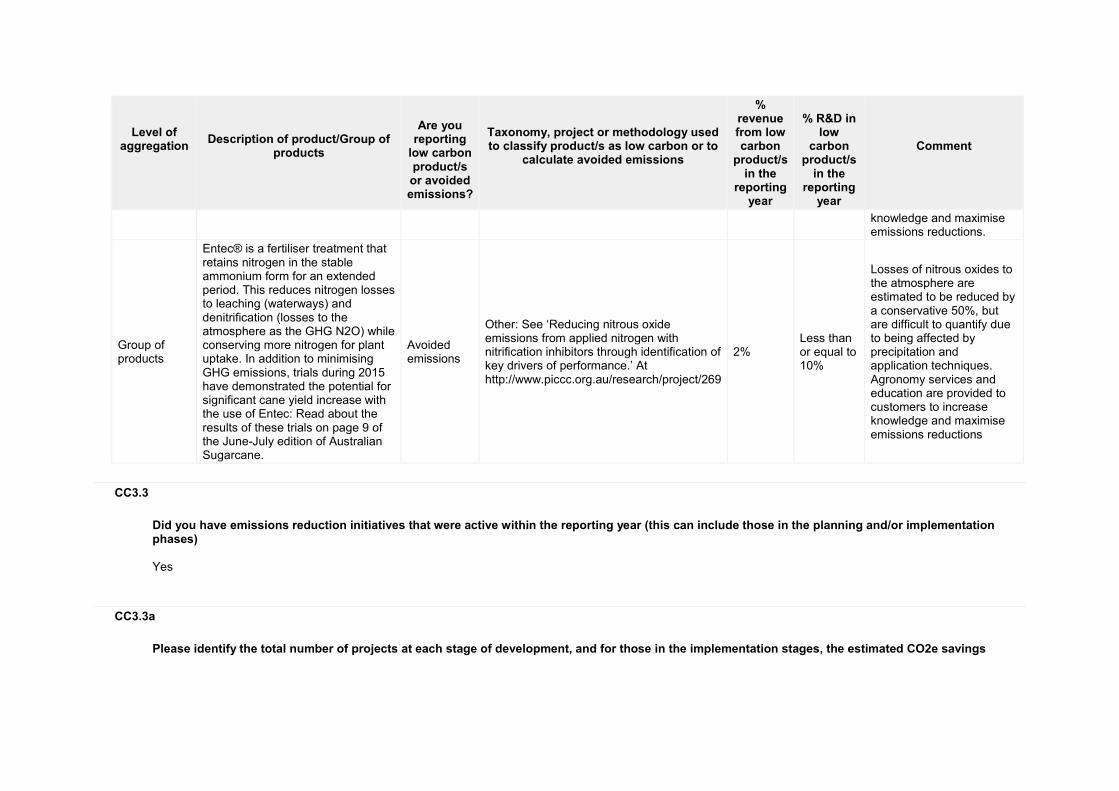
Entec® is a fertiliser treatment that retains nitrogen in the stable ammonium form for an extended period. This reduces nitrogen losses to leaching (waterways) and denitrification (losses to the atmosphere as the GHG N2O) while conserving more nitrogen for plant uptake. In addition to minimising GHG emissions, trials during 2015 have demonstrated the potential for significant cane yield increase with the use of Entec: Read about the results of these trials on page 9 of the June-July edition of Australian Sugarcane.
Avoided emissions
Other: See ‘Reducing nitrous oxide emissions from applied nitrogen with nitrification inhibitors through identification of key drivers of performance.’ At http://www.piccc.org.au/research/project/269
2% Less than or equal to 10%
Losses of nitrous oxides to the atmosphere are estimated to be reduced by a conservative 50%, but are difficult to quantify due to being affected by precipitation and application techniques. Agronomy services and education are provided to customers to increase knowledge and maximise emissions reductions
CC3.3
Did you have emissions reduction initiatives that were active within the reporting year (this can include those in the planning and/or implementation phases) Yes
CC3.3a
Please identify the total number of projects at each stage of development, and for those in the implementation stages, the estimated CO2e savings

Stage of development
Number of projects
Total estimated annual CO2e savings in metric tonnes CO2e (only for rows marked *)
Under investigation 5
To be implemented* 1 10215
Implementation commenced* 3 2300
Implemented* 4 95400
Not to be implemented 4
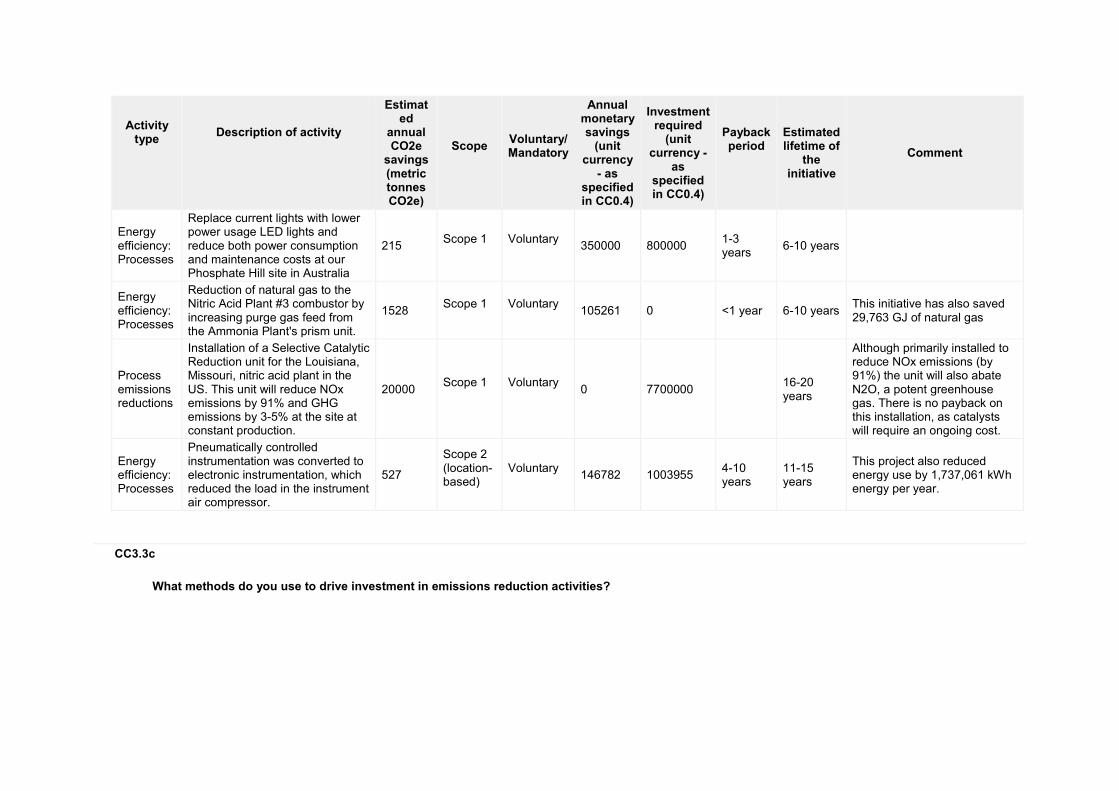
CC3.3b
For those initiatives implemented in the reporting year, please provide details in the table below
Activity type
Description of activity
Estimated
annual CO2e
savings (metric tonnes CO2e)
Scope
Voluntary/ Mandatory
Annual monetary savings
(unit currency
- as specified in CC0.4)
Investment required
(unit currency -
as specified in CC0.4)
Payback period
Estimated lifetime of
the initiative
Comment
Energy efficiency: Processes
Waggaman, Louisiana Ammonia Plant. During 2016, construction of IPL’s 800,000 metric tonne per annum ammonia plant was completed. The new plant uses the industry’s leading technology and is among the most energy efficient plants of its kind in the world, employing gas purifier technology and recapturing steam for reuse. (The plant is also fitted with SCR technology to reduce
73345 Scope 1
Voluntary
0 850000000 4-10 years
>30 years
The completion of the new, energy efficient Louisiana plant underpins IPL's global target of a 2% decrease in tCO2e per tonne of ammonia produced by 2017 against a 2015 baseline. Because this plant will increase production, we anticipate a 10% increase in absolute emissions. The estimated annual CO2e saving of 73,345 has been estimated by calculating 2% of GHG

Activity type
Description of activity
Estimated
annual CO2e
savings (metric tonnes CO2e)
Scope
Voluntary/ Mandatory
Annual monetary savings
(unit currency
- as specified in CC0.4)
Investment required
(unit currency -
as specified in CC0.4)
Payback period
Estimated lifetime of
the initiative
Comment
emissions of NOx by up to 98 percent.)
emissions from expected production of ammonia globally (assuming maximum production rate at the Louisiana Ammonia Plant in 2017).
Energy efficiency: Processes
At our Moranbah, Australia site, a project to preheat deaerator feedwater with process heat (which is currently lost to the atmosphere) will reduce the consumption of steam at the deaerator while maintaining its operating pressure.
10000 Scope 1
Voluntary
850000 1100000 1-3 years
11-15 years
This project is expected to proceed with the opportunity to earn Australian Carbon Credit Units.
Energy efficiency: Processes
This project at our Mt Isa, Australia site will involve the Installation of variable speed drives on cooling tower fan motors so that the fan speed can be adjusted using an automatic temperature feedback loop.
2305
Scope 2 (location-based)
Mandatory
400000 435000 <1 year 11-15 years
As a result of this project, airflow across the cooling towers will be controlled to produce cooling water at the optimum temperature required by the manufacturing process. Since the existing cooling tower fans were sized for the maximum load and are run continuously at full speed, the water is unnecessarily overcooled for a large portion of the year. Controlling the cooling tower fan motor speed will reduce the load on the motor and therefore reduce the electrical power used by the motor.
Activity type
Description of activity
Estimated
annual CO2e
savings (metric tonnes CO2e)
Scope
Voluntary/ Mandatory
Annual monetary savings
(unit currency
- as specified in CC0.4)
Investment required
(unit currency -
as specified in CC0.4)
Payback period
Estimated lifetime of
the initiative
Comment
Energy efficiency: Processes
Replace current lights with lower power usage LED lights and reduce both power consumption and maintenance costs at our Phosphate Hill site in Australia
215 Scope 1
Voluntary
350000 800000 1-3 years
6-10 years
Energy efficiency: Processes
Reduction of natural gas to the Nitric Acid Plant #3 combustor by increasing purge gas feed from the Ammonia Plant's prism unit.
1528 Scope 1
Voluntary
105261 0 <1 year 6-10 years This initiative has also saved 29,763 GJ of natural gas
Process emissions reductions
Installation of a Selective Catalytic Reduction unit for the Louisiana, Missouri, nitric acid plant in the US. This unit will reduce NOx emissions by 91% and GHG emissions by 3-5% at the site at constant production.
20000 Scope 1
Voluntary
0 7700000 16-20 years
Although primarily installed to reduce NOx emissions (by 91%) the unit will also abate N2O, a potent greenhouse gas. There is no payback on this installation, as catalysts will require an ongoing cost.
Energy efficiency: Processes
Pneumatically controlled instrumentation was converted to electronic instrumentation, which reduced the load in the instrument air compressor.
527
Scope 2 (location-based)
Voluntary
146782 1003955 4-10 years
11-15 years
This project also reduced energy use by 1,737,061 kWh energy per year.
CC3.3c
What methods do you use to drive investment in emissions reduction activities?

Method
Comment
Dedicated budget for low carbon product R&D
Our fertiliser and explosives manufacturing businesses have a dedicated R&D budget for product development which includes research and development of slow release (low nitrous oxide emitting) fertiliser products and low NOx explosives products.
Internal incentives/recognition programs
Consistent improvement in energy efficiency is a key part of BEx (Business Excellence) process review across our manufacturing business. Bonuses are linked to the goals of energy managers.
Partnering with governments on technology development
IPL undertakes a range of research projects with Universities in several regions of Australia focused on the development of low emissions products.
Other The use of best available energy efficiency technologies in plant upgrades and the design and construction of new manufacturing facilities. This reduces both our energy use, which is a major cost to our business, and the greenhouse gases associated with this energy use.
CC3.3d
If you do not have any emissions reduction initiatives, please explain why not
Further Information
Page: CC4. Communication
CC4.1

Have you published information about your organization’s response to climate change and GHG emissions performance for this reporting year in places other than in your CDP response? If so, please attach the publication(s)
Publication
Status
Page/Section reference
Attach the document
Comment
In mainstream reports (including an integrated report) but have not used the CDSB Framework
Complete
Sustainability Report Section, page ix
https://www.cdp.net/sites/2017/14/8914/Climate Change 2017/Shared Documents/Attachments/CC4.1/IPL_2016_Annual Report.pdf
See the 'Sustainability Report' section under 'Energy Greenhouse Gases and Water' (page ix) and 'Sustainable Development' (page xi)
In voluntary communications
Complete
The 'Environment' section of the online IPL 2016 Sustainability Report
https://www.cdp.net/sites/2017/14/8914/Climate Change 2017/Shared Documents/Attachments/CC4.1/04_Environment_2016.pdf
A Pdf of the 'Environment' section of the online 2016 IPL Sustainability Report is attached. This can be viewed online at http://www.incitecpivot.com.au/sustainability/ipl-online-sustainability-report/environment/energy-and-greenhouse-gases
In voluntary communications
Complete
The 'Targets' page of the online 2016 IPL Sustainability Report
https://www.cdp.net/sites/2017/14/8914/Climate Change 2017/Shared Documents/Attachments/CC4.1/Targets Page.pdf
A Pdf of the 'Targets' page of the online 2016 IPL Sustainability Report is attached. This can be viewed online at http://www.incitecpivot.com.au/sustainability/ipl-online-sustainability-report/sustainability-report-2016/our-targets
Further Information
Module: Risks and Opportunities
Page: CC5. Climate Change Risks

CC5.1
Have you identified any inherent climate change risks that have the potential to generate a substantive change in your business operations, revenue or expenditure? Tick all that apply Risks driven by changes in regulation Risks driven by changes in physical climate parameters Risks driven by changes in other climate-related developments
CC5.1a
Please describe your inherent risks that are driven by changes in regulation
Risk driver
Description
Potential impact
Timeframe
Direct/ Indirect
Likelihood
Magnitude of impact
Estimated financial
implications
Management
method
Cost of
management
Emission reporting obligations
Carbon reporting continues to impact IPL resources to enable compliance in Australia
Increased operational cost
1 to 3 years
Direct Virtually certain
Low
The potential financial risks of non-compliance are Government penalties. The NGER Act allows for administrative, civil and/or criminal responses in relation to contraventions of the Act. Part 5 of the NGER Act sets out penalty provisions. These include fines of up to $340,000 (2,000
IPL has a Sustainability Strategy which includes its approach to carbon risk. The financial risk of carbon costs is actively managed by the Sustainability Team under the supervision of the CFO to ensure that risk is managed at the Executive level. The key methods being used to
Costs associated with compliance actions are estimated to be approximately $400,000 per annum.

Risk driver
Description
Potential impact
Timeframe
Direct/ Indirect
Likelihood
Magnitude of impact
Estimated financial
implications
Management
method
Cost of
management
penalty units) for failure to apply for registration, and daily fines of up to $17,000 (100 penalty units) for each day of non-compliance.
mitigate the risk are education of key staff involved in the reporting and the introduction of internal controls over data accuracy. Since 2012, external reviews of our National Greenhouse Reporting in Australia formed part of our internal audit processes to assist in managing the potential risk of incorrect reporting.
Uncertainty surrounding new regulation
As a nitrogen-based manufacturer, IPL’s operations are carbon intensive and therefore carbon regulation inclusive of a carbon price will impact IPL as a trade exposed Company and also impact our customers. In addition, there is risk associated
Increased operational cost
1 to 3 years
Direct Virtually certain
Low Cannot be reliably estimated at this time
IPL has a Sustainability Strategy which includes its approach to carbon risk. The financial risk of carbon costs is actively managed by the Sustainability Team, under the supervision of the CFO to ensure that risk is managed at the Executive level. The Sustainability Team manages all
Costs associated with compliance actions are estimated to be approximately $400,000 per annum.

Risk driver
Description
Potential impact
Timeframe
Direct/ Indirect
Likelihood
Magnitude of impact
Estimated financial
implications
Management
method
Cost of
management
with uncertainty regarding future changes to legislation due to changes in Government.
obligations in relation to Australian carbon regulation including, including advocacy and cost forecasting and works with operations to increase energy efficiency and implement actions to reduce financial impacts. Since 2012, assurance of our National Greenhouse Reporting in Australia has formed part of our internal audit processes, designed to strengthen our data processes, including data accuracy.
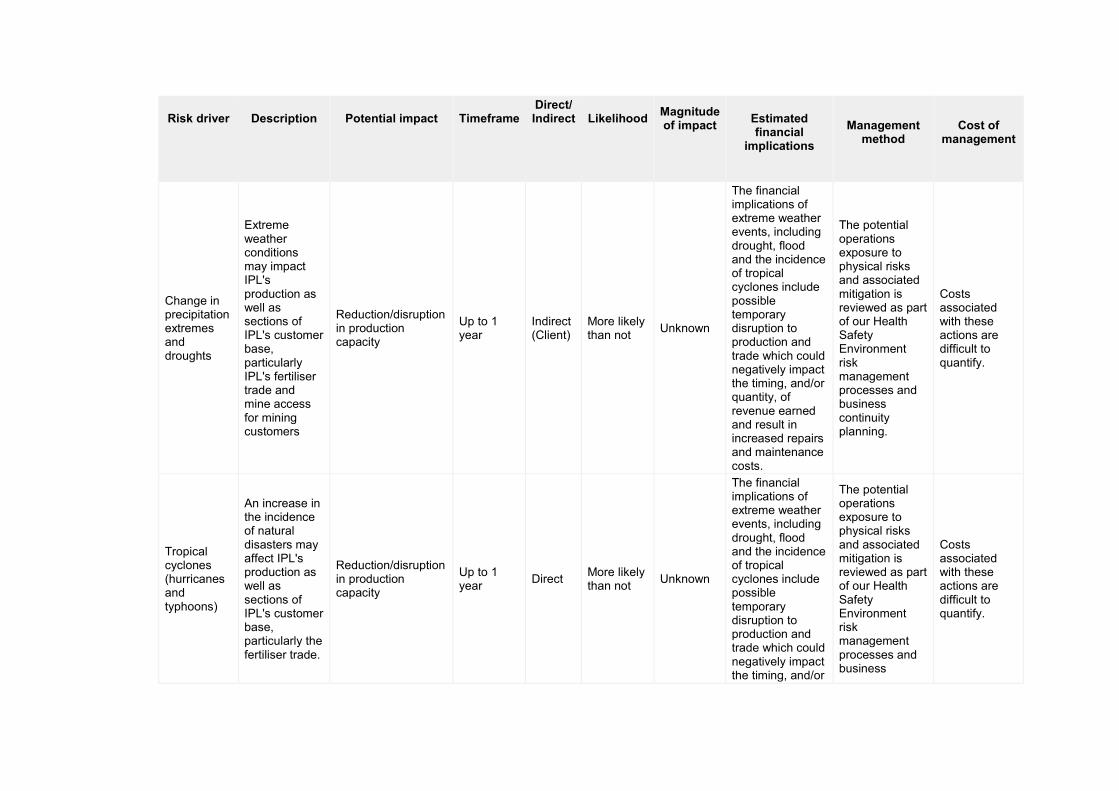
CC5.1b
Please describe your inherent risks that are driven by changes in physical climate parameters
Risk driver
Description
Potential impact
Timeframe
Direct/ Indirect
Likelihood
Magnitude of impact
Estimated financial
implications
Management
method
Cost of
management
Change in precipitation extremes and droughts
Extreme weather conditions may impact IPL's production as well as sections of IPL's customer base, particularly IPL's fertiliser trade and mine access for mining customers
Reduction/disruption in production capacity
Up to 1 year
Indirect (Client)
More likely than not
Unknown
The financial implications of extreme weather events, including drought, flood and the incidence of tropical cyclones include possible temporary disruption to production and trade which could negatively impact the timing, and/or quantity, of revenue earned and result in increased repairs and maintenance costs.
The potential operations exposure to physical risks and associated mitigation is reviewed as part of our Health Safety Environment risk management processes and business continuity planning.
Costs associated with these actions are difficult to quantify.
Tropical cyclones (hurricanes and typhoons)
An increase in the incidence of natural disasters may affect IPL's production as well as sections of IPL's customer base, particularly the fertiliser trade.
Reduction/disruption in production capacity
Up to 1 year
Direct More likely than not
Unknown
The financial implications of extreme weather events, including drought, flood and the incidence of tropical cyclones include possible temporary disruption to production and trade which could negatively impact the timing, and/or
The potential operations exposure to physical risks and associated mitigation is reviewed as part of our Health Safety Environment risk management processes and business
Costs associated with these actions are difficult to quantify.

Risk driver
Description
Potential impact
Timeframe
Direct/ Indirect
Likelihood
Magnitude of impact
Estimated financial
implications
Management
method
Cost of
management
quantity, of revenue earned and result in increased repairs and maintenance costs.
continuity planning.
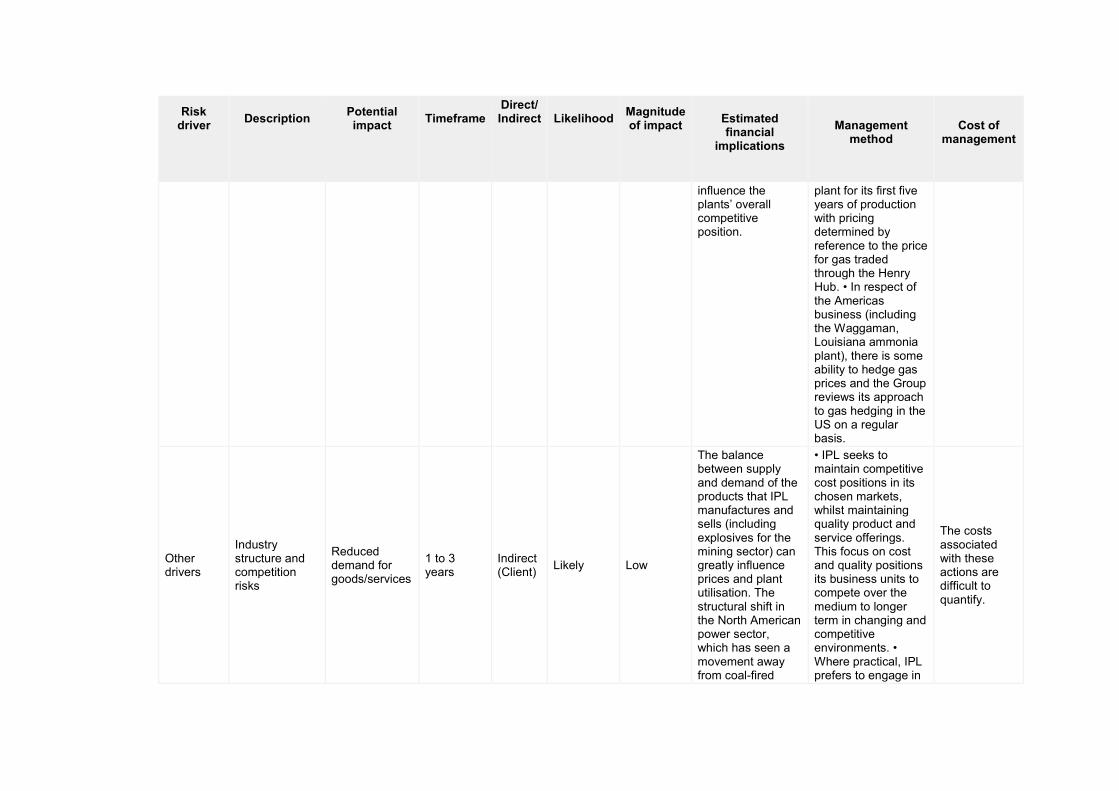
CC5.1c
Please describe your inherent risks that are driven by changes in other climate-related developments
Risk driver
Description
Potential impact
Timeframe
Direct/ Indirect
Likelihood
Magnitude of impact
Estimated financial
implications
Management
method
Cost of
management
Reputation
Business reputation risk if Sustainability and Climate Change actions are not addressed and communicated
Reduced stock price (market valuation)
1 to 3 years
Direct Unlikely Unknown
Potential financial implications of the risk to business reputation in the event of ignoring sustainability and climate change issues include a possible reduction in investor interest and low morale of employees.
This has been actively mitigated by the formalising of a Sustainability Strategy and a position on Climate Change together with increased communications and employee education.
The costs associated with these actions are difficult to quantify.
Other drivers
Natural gas supply and price risk
Increased operational cost
1 to 3 years
Direct More likely than not
Medium-high
Natural gas is one of the major inputs required for the production of ammonia and
• The Group has medium term gas contracts in place for its Australian manufacturing sites,
The costs associated with these actions are

Risk driver
Description
Potential impact
Timeframe
Direct/ Indirect
Likelihood
Magnitude of impact
Estimated financial
implications
Management
method
Cost of
management
therefore is a critical feedstock for IPL’s nitrogen manufacturing operations. Availability and quality of natural gas are both key factors when sourcing supply. Potential disruption of supply also poses a risk. The Group has various natural gas contracts and supply arrangements for its plants. In respect of the Australian fertiliser operations there is a risk that a reliable, committed source of natural gas at economically viable prices may not be available following the expiry of current contractual arrangements. The cost of natural gas impacts the variable cost of production of ammonia and can
with the exception of Gibson Island in respect of which contracted gas supply is in place through to September 2018. The contracts have various tenures and pricing mechanisms. As part of normal operations, IPL explores new gas supply arrangements where appropriate. • The US natural gas market is a liquid market, with offtake facilitated by an extensive pipeline infrastructure and pricing commonly referenced to a quoted market price. The Americas business has short term gas supply arrangements in place for its gas needs with market referenced pricing mechanisms. • Gas supply has been substantially contracted for the Waggaman, Louisiana ammonia
difficult to quantify.
Risk driver
Description
Potential impact
Timeframe
Direct/ Indirect
Likelihood
Magnitude of impact
Estimated financial
implications
Management
method
Cost of
management
influence the plants’ overall competitive position.
plant for its first five years of production with pricing determined by reference to the price for gas traded through the Henry Hub. • In respect of the Americas business (including the Waggaman, Louisiana ammonia plant), there is some ability to hedge gas prices and the Group reviews its approach to gas hedging in the US on a regular basis.
Other drivers
Industry structure and competition risks
Reduced demand for goods/services
1 to 3 years
Indirect (Client)
Likely Low
The balance between supply and demand of the products that IPL manufactures and sells (including explosives for the mining sector) can greatly influence prices and plant utilisation. The structural shift in the North American power sector, which has seen a movement away from coal-fired
• IPL seeks to maintain competitive cost positions in its chosen markets, whilst maintaining quality product and service offerings. This focus on cost and quality positions its business units to compete over the medium to longer term in changing and competitive environments. • Where practical, IPL prefers to engage in
The costs associated with these actions are difficult to quantify.

Risk driver
Description
Potential impact
Timeframe
Direct/ Indirect
Likelihood
Magnitude of impact
Estimated financial
implications
Management
method
Cost of
management
energy production and towards natural gas, has placed increased pressure on existing customers (therefore giving rise to increased cost pressure on inputs to their supply) and has also resulted in reduced demand for their outputs.
long term customer and supply contractual relationships. • Pricing and risk management processes exist in all businesses.
CC5.1d
Please explain why you do not consider your company to be exposed to inherent risks driven by changes in regulation that have the potential to generate a substantive change in your business operations, revenue or expenditure
CC5.1e
Please explain why you do not consider your company to be exposed to inherent risks driven by changes in physical climate parameters that have the potential to generate a substantive change in your business operations, revenue or expenditure
CC5.1f
Please explain why you do not consider your company to be exposed to inherent risks driven by changes in other climate-related developments that have the potential to generate a substantive change in your business operations, revenue or expenditure
Further Information
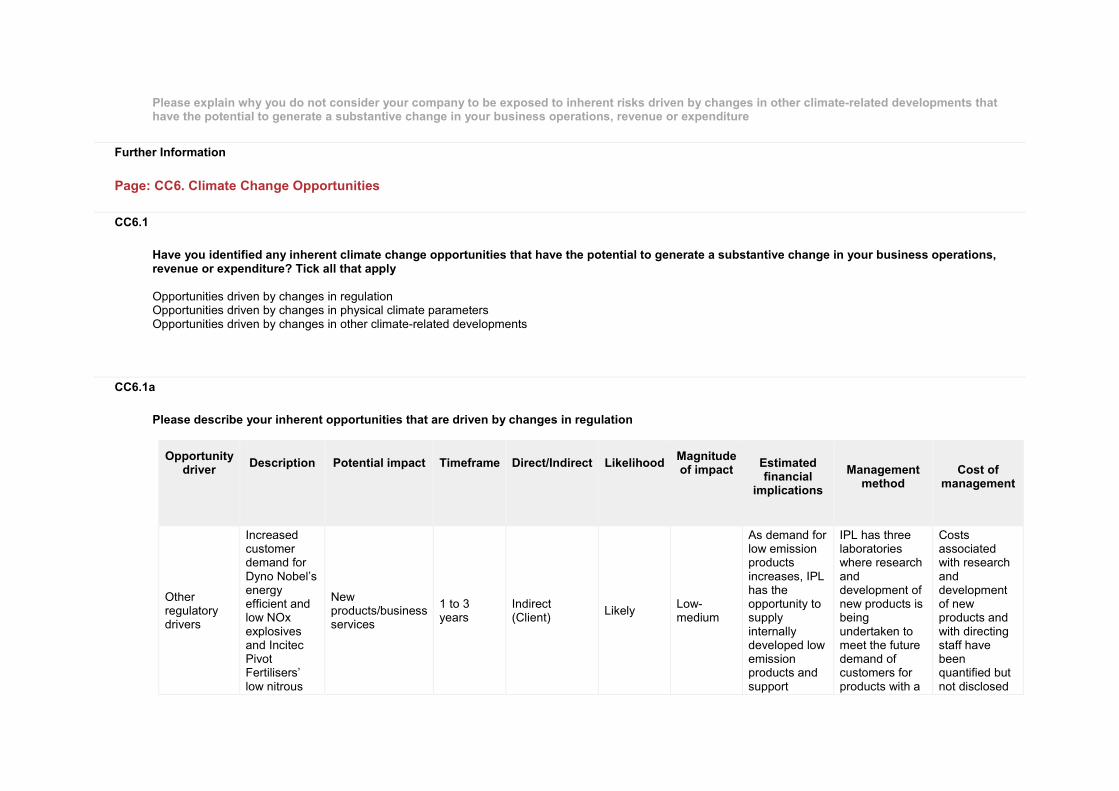
Page: CC6. Climate Change Opportunities
CC6.1
Have you identified any inherent climate change opportunities that have the potential to generate a substantive change in your business operations, revenue or expenditure? Tick all that apply Opportunities driven by changes in regulation Opportunities driven by changes in physical climate parameters Opportunities driven by changes in other climate-related developments
CC6.1a
Please describe your inherent opportunities that are driven by changes in regulation
Opportunity driver
Description
Potential impact
Timeframe
Direct/Indirect
Likelihood
Magnitude of impact
Estimated financial
implications
Management
method
Cost of
management
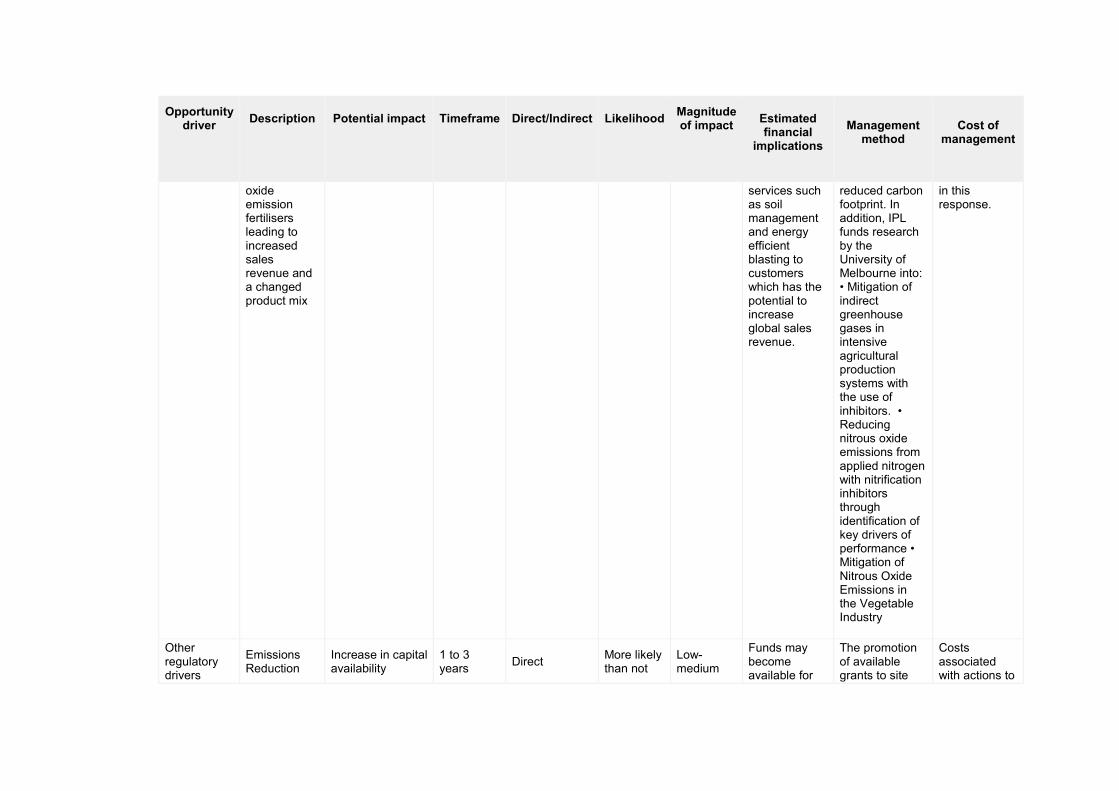
Other regulatory drivers
Increased customer demand for Dyno Nobel’s energy efficient and low NOx explosives and Incitec Pivot Fertilisers’ low nitrous
New products/business services
1 to 3 years
Indirect (Client)
Likely Low-medium
As demand for low emission products increases, IPL has the opportunity to supply internally developed low emission products and support
IPL has three laboratories where research and development of new products is being undertaken to meet the future demand of customers for products with a
Costs associated with research and development of new products and with directing staff have been quantified but not disclosed
Opportunity driver
Description
Potential impact
Timeframe
Direct/Indirect
Likelihood
Magnitude of impact
Estimated financial
implications
Management
method
Cost of
management
oxide emission fertilisers leading to increased sales revenue and a changed product mix
services such as soil management and energy efficient blasting to customers which has the potential to increase global sales revenue.
reduced carbon footprint. In addition, IPL funds research by the University of Melbourne into: • Mitigation of indirect greenhouse gases in intensive agricultural production systems with the use of inhibitors. • Reducing nitrous oxide emissions from applied nitrogen with nitrification inhibitors through identification of key drivers of performance • Mitigation of Nitrous Oxide Emissions in the Vegetable Industry
in this response.
Other regulatory drivers
Emissions Reduction
Increase in capital availability
1 to 3 years
Direct More likely than not
Low-medium
Funds may become available for
The promotion of available grants to site
Costs associated with actions to

Opportunity driver
Description
Potential impact
Timeframe
Direct/Indirect
Likelihood
Magnitude of impact
Estimated financial
implications
Management
method
Cost of
management
Fund (Australia)
energy efficiency projects which reduce the long term energy costs and carbon emissions associated with the manufacture of our products
managers and energy managers within IPL is being coordinated by the Corporate Sustainability Manager, and two applications to earn Australian Carbon Credit Units (ACCUs) from energy efficiency projects have been registered with the federal Government. These are currently awaiting assessment. Capital approvals management has also been educated in the available opportunities.
access grant opportunities have not been quantified
CC6.1b

Please describe your inherent opportunities that are driven by changes in physical climate parameters
Opportunity driver
Description
Potential impact
Timeframe
Direct/ Indirect
Likelihood
Magnitude of impact
Estimated financial
implications
Management
method
Cost of management
Change in precipitation pattern
Changes in weather patterns, particularly concerning rain will impact the timing of fertiliser application of IPL fertiliser products and therefore the timing of sales
Other: Changes in customer activity
Unknown Indirect (Client)
Unknown Unknown This has not been quantified.
IPL’s agronomy team maintains a close relationship with the Department of Agriculture, Fisheries and Forestry and related agencies, who are undertaking research into potential impacts on agriculture from climate change to ensure they are up to date with scientific findings which may have implications for customers and their product needs.
Costs associated with research and development of new products and with directing staff have been quantified but not disclosed in this response.
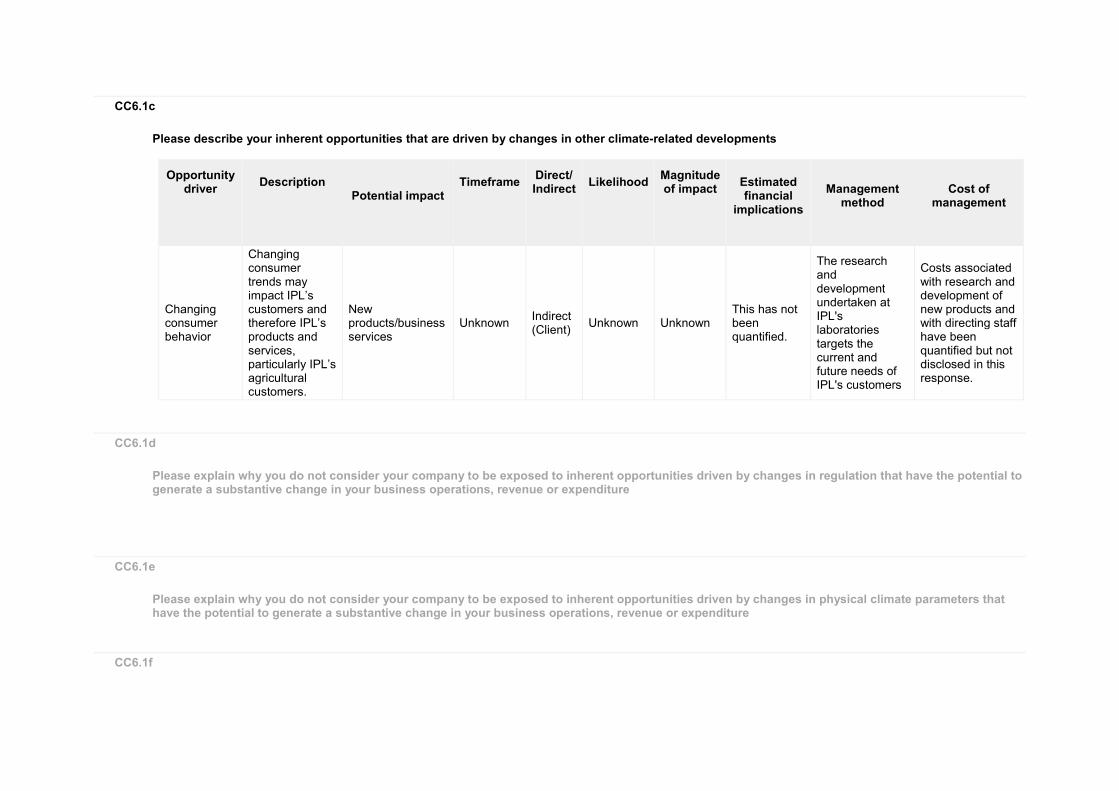
CC6.1c
Please describe your inherent opportunities that are driven by changes in other climate-related developments
Opportunity driver
Description
Potential impact
Timeframe
Direct/ Indirect
Likelihood
Magnitude of impact
Estimated financial
implications
Management
method
Cost of
management
Changing consumer behavior
Changing consumer trends may impact IPL’s customers and therefore IPL’s products and services, particularly IPL’s agricultural customers.
New products/business services
Unknown Indirect (Client)
Unknown Unknown This has not been quantified.
The research and development undertaken at IPL's laboratories targets the current and future needs of IPL's customers
Costs associated with research and development of new products and with directing staff have been quantified but not disclosed in this response.
CC6.1d
Please explain why you do not consider your company to be exposed to inherent opportunities driven by changes in regulation that have the potential to generate a substantive change in your business operations, revenue or expenditure
CC6.1e
Please explain why you do not consider your company to be exposed to inherent opportunities driven by changes in physical climate parameters that have the potential to generate a substantive change in your business operations, revenue or expenditure
CC6.1f

Please explain why you do not consider your company to be exposed to inherent opportunities driven by changes in other climate-related developments that have the potential to generate a substantive change in your business operations, revenue or expenditure
Further Information
Module: GHG Emissions Accounting, Energy and Fuel Use, and Trading
Page: CC7. Emissions Methodology
CC7.1
Please provide your base year and base year emissions (Scopes 1 and 2)
Scope
Base year
Base year emissions (metric tonnes CO2e)
Scope 1 Wed 01 Oct 2014 - Fri 30 Oct 2015
2349535
Scope 2 (location-based) Wed 01 Oct 2014 - Fri 30 Oct 2015
355916
Scope 2 (market-based) Wed 01 Oct 2014 - Wed 30 Sep 2015
355916
CC7.2
Please give the name of the standard, protocol or methodology you have used to collect activity data and calculate Scope 1 and Scope 2 emissions
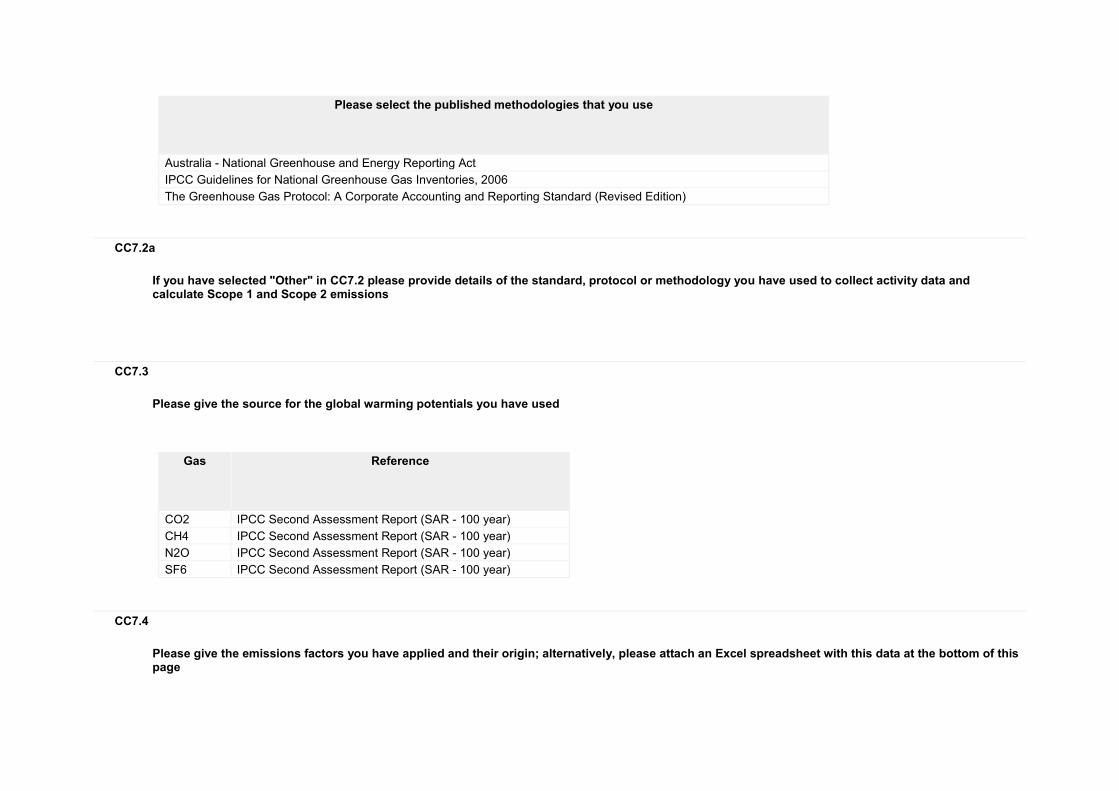
Please select the published methodologies that you use
Australia - National Greenhouse and Energy Reporting Act
IPCC Guidelines for National Greenhouse Gas Inventories, 2006
The Greenhouse Gas Protocol: A Corporate Accounting and Reporting Standard (Revised Edition)
CC7.2a
If you have selected "Other" in CC7.2 please provide details of the standard, protocol or methodology you have used to collect activity data and calculate Scope 1 and Scope 2 emissions
CC7.3
Please give the source for the global warming potentials you have used
Gas
Reference
CO2 IPCC Second Assessment Report (SAR - 100 year)
CH4 IPCC Second Assessment Report (SAR - 100 year)
N2O IPCC Second Assessment Report (SAR - 100 year)
SF6 IPCC Second Assessment Report (SAR - 100 year)
CC7.4
Please give the emissions factors you have applied and their origin; alternatively, please attach an Excel spreadsheet with this data at the bottom of this page
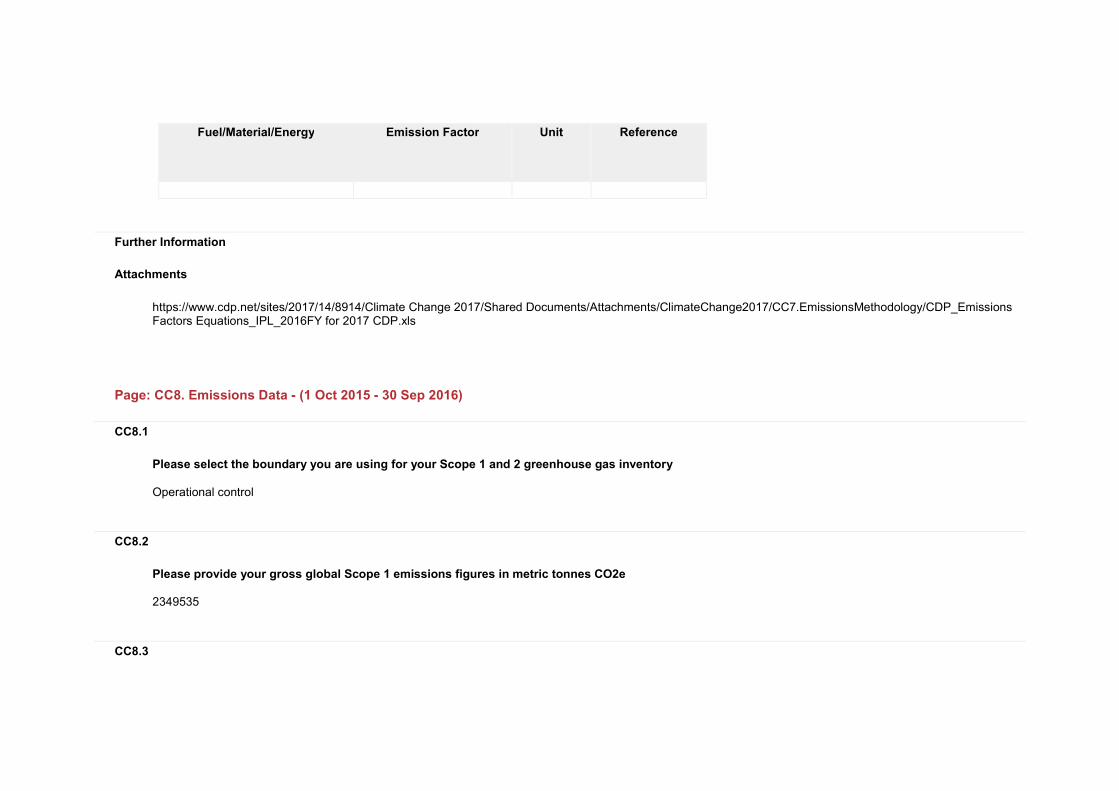
Fuel/Material/Energy
Emission Factor
Unit
Reference
Further Information
Attachments
https://www.cdp.net/sites/2017/14/8914/Climate Change 2017/Shared Documents/Attachments/ClimateChange2017/CC7.EmissionsMethodology/CDP_Emissions Factors Equations_IPL_2016FY for 2017 CDP.xls
Page: CC8. Emissions Data - (1 Oct 2015 - 30 Sep 2016)
CC8.1
Please select the boundary you are using for your Scope 1 and 2 greenhouse gas inventory Operational control
CC8.2
Please provide your gross global Scope 1 emissions figures in metric tonnes CO2e 2349535
CC8.3

Please describe your approach to reporting Scope 2 emissions
Scope 2, location-based
Scope 2, market-based
Comment
We are reporting a Scope 2, location-based figure
We have operations where we are able to access electricity supplier emissions factors or residual emissions factors, but are unable to report a Scope 2, market-based figure
CC8.3a
Please provide your gross global Scope 2 emissions figures in metric tonnes CO2e
Scope 2, location-based
Scope 2, market-based (if applicable)
Comment
355916
CC8.4
Are there any sources (e.g. facilities, specific GHGs, activities, geographies, etc.) of Scope 1 and Scope 2 emissions that are within your selected reporting boundary which are not included in your disclosure? Yes
CC8.4a
Please provide details of the sources of Scope 1 and Scope 2 emissions that are within your selected reporting boundary which are not included in your disclosure

Source
Relevance of
Scope 1 emissions from
this source
Relevance of
location-based Scope 2 emissions
from this source
Relevance of market-based
Scope 2 emissions from this source (if
applicable)
Explain why the source is excluded
Emissions from offsite transport of product in North America
Emissions are not evaluated
No emissions from this source
No emissions from this source
Data is presently unavailable. Very low materiality (estimated to be less than 1% of total emissions.
Emissions from electricity used in small remote offices and despatch sites in North America
No emissions from this source
Emissions are not evaluated
Emissions are not evaluated
Data is presently unavailable. Very low materiality (estimated to be less than 1% of total emissions.
CC8.5
Please estimate the level of uncertainty of the total gross global Scope 1 and 2 emissions figures that you have supplied and specify the sources of uncertainty in your data gathering, handling and calculations
Scope
Uncertainty
range
Main sources of
uncertainty
Please expand on the uncertainty in your data
Scope 1 Less than or equal to 2%
Metering/ Measurement Constraints Data Management
1. Uncertainty associated with systematic biases occurring in the estimation process, e.g. accuracy of measurement equipment 2. Statistical uncertainty associated with human error which may have occurred in data management. This risk has been reduced by independent verification/assurance on our Australian data set
Scope 2 (location-based)
Less than or equal to 2%
Metering/ Measurement Constraints Data Management
1. Uncertainty associated with systematic biases occurring in the estimation process, e.g. accuracy of measurement equipment 2. Statistical uncertainty associated with human error which may have occurred in data management. This risk has been reduced by independent verification/assurance on our Australian data set
Scope 2 (market-based)
Less than or equal to 2%
Metering/ Measurement Constraints Data Management
1. Uncertainty associated with systematic biases occurring in the estimation process, e.g. accuracy of measurement equipment 2. Statistical uncertainty associated with human error which may have occurred in data management. This risk has been reduced by independent verification/assurance on our Australian data set

CC8.6
Please indicate the verification/assurance status that applies to your reported Scope 1 emissions Third party verification or assurance process in place
CC8.6a
Please provide further details of the verification/assurance undertaken for your Scope 1 emissions, and attach the relevant statements
Verification
or assurance
cycle in place
Status in the
current reporting year
Type of verification
or assurance
Attach the statement
Page/section
reference
Relevant standard
Proportion of reported
Scope 1 emissions verified (%)
Annual process
Underway but not complete for reporting year – previous statement of process attached
Limited assurance
https://www.cdp.net/sites/2017/14/8914/Climate Change 2017/Shared Documents/Attachments/CC8.6a/IPL 2016 NGER - Limited Assurance Opinion (20 10 16).pdf
1-2 ASAE3000 54
CC8.6b
Please provide further details of the regulatory regime to which you are complying that specifies the use of Continuous Emission Monitoring Systems (CEMS)
Regulation
% of emissions covered by the system
Compliance period
Evidence of submission

CC8.7
Please indicate the verification/assurance status that applies to at least one of your reported Scope 2 emissions figures
Third party verification or assurance process in place
CC8.7a
Please provide further details of the verification/assurance undertaken for your location-based and/or market-based Scope 2 emissions, and attach the relevant statements
Location-based or market-based figure?
Verification
or assurance
cycle in place
Status in the
current reporting year
Type of verification
or assurance
Attach the statement
Page/Section reference
Relevant standard
Proportion
of reported Scope 2
emissions verified
(%)
Location-based
Annual process
Underway but not complete for reporting year – previous statement of process attached
Limited assurance
https://www.cdp.net/sites/2017/14/8914/Climate Change 2017/Shared Documents/Attachments/CC8.7a/IPL 2016 NGER - Limited Assurance Opinion (20 10 16).pdf
1-2 ASAE3000 60
CC8.8
Please identify if any data points have been verified as part of the third party verification work undertaken, other than the verification of emissions figures reported in CC8.6, CC8.7 and CC14.2
Additional data points verified
Comment
Other: Australian Energy Use
70% of IPL's energy use (100% of our Australian energy use) is verified as part of the Limited Assurance Opinion provided by Deloitte on an annual basis for our National Greenhouse and Energy Report (NGER). Since this is completed on a June 30 year end, and the CDP reporting year is the Company financial year (Sept 30 year end), this assurance is currently partially completed for the data in this report. The assurance statement attached at CC8.6 and CC8.7 includes this energy assurance.
CC8.9
Are carbon dioxide emissions from biologically sequestered carbon relevant to your organization? No
CC8.9a
Please provide the emissions from biologically sequestered carbon relevant to your organization in metric tonnes CO2
Further Information
Page: CC9. Scope 1 Emissions Breakdown - (1 Oct 2015 - 30 Sep 2016)
CC9.1
Do you have Scope 1 emissions sources in more than one country? Yes

CC9.1a
Please break down your total gross global Scope 1 emissions by country/region
Country/Region
Scope 1 metric tonnes CO2e
Australia 1513920
United States of America 925223
Rest of world 13393
CC9.2
Please indicate which other Scope 1 emissions breakdowns you are able to provide (tick all that apply) By business division
CC9.2a
Please break down your total gross global Scope 1 emissions by business division
Business division
Scope 1 emissions (metric tonnes CO2e)
Incitec Pivot Fertilisers 999997
Dyno Nobel Americas 938133
Dyno Nobel Asia Pacific 513924
Nitromak Europe 483

CC9.2b
Please break down your total gross global Scope 1 emissions by facility
Facility Scope 1 emissions (metric tonnes CO2e)
Latitude Longitude
CC9.2c
Please break down your total gross global Scope 1 emissions by GHG type
GHG type Scope 1 emissions (metric tonnes CO2e)
CC9.2d
Please break down your total gross global Scope 1 emissions by activity
Activity
Scope 1 emissions (metric tonnes CO2e)
Further Information
Page: CC10. Scope 2 Emissions Breakdown - (1 Oct 2015 - 30 Sep 2016)
CC10.1
Do you have Scope 2 emissions sources in more than one country? Yes

CC10.1a
Please break down your total gross global Scope 2 emissions and energy consumption by country/region
Country/Region
Scope 2, location-based (metric
tonnes CO2e)
Scope 2, market-based (metric tonnes CO2e)
Purchased and consumed
electricity, heat, steam or cooling
(MWh)
Purchased and consumed low carbon electricity, heat, steam or
cooling accounted in market-based approach (MWh)
Australia 178962 211577
United States of America
126916 327261
Rest of world 1849 8841
CC10.2
Please indicate which other Scope 2 emissions breakdowns you are able to provide (tick all that apply) By business division
CC10.2a
Please break down your total gross global Scope 2 emissions by business division
Business division
Scope 2, location-based (metric tonnes CO2e)
Scope 2, market-based (metric tonnes CO2e)
Incitec Pivot Fertilisers 175958
Dyno Nobel Americas 128236
Dyno Nobel Asia Pacific 3003

Business division
Scope 2, location-based (metric tonnes CO2e)
Scope 2, market-based (metric tonnes CO2e)
Nitromak Europe 529
CC10.2b
Please break down your total gross global Scope 2 emissions by facility
Facility
Scope 2, location-based (metric tonnes CO2e)
Scope 2, market-based (metric tonnes CO2e)
CC10.2c
Please break down your total gross global Scope 2 emissions by activity
Activity Scope 2, location-based (metric tonnes CO2e)
Scope 2, market-based (metric tonnes CO2e)
Further Information
Page: CC11. Energy
CC11.1
What percentage of your total operational spend in the reporting year was on energy? More than 5% but less than or equal to 10%

CC11.2
Please state how much heat, steam, and cooling in MWh your organization has purchased and consumed during the reporting year
Energy type
MWh
Heat 0
Steam 0
Cooling 0
CC11.3
Please state how much fuel in MWh your organization has consumed (for energy purposes) during the reporting year 11655886
CC11.3a
Please complete the table by breaking down the total "Fuel" figure entered above by fuel type
Fuels
MWh
Natural gas 11573130
Distillate fuel oil No 2 76892
Motor gasoline 3750
Propane 99

Fuels
MWh
Distillate fuel oil No 1 53
CC11.4
Please provide details of the electricity, heat, steam or cooling amounts that were accounted at a low carbon emission factor in the market-based Scope 2 figure reported in CC8.3a
Basis for applying a low carbon emission factor
MWh consumed associated with
low carbon electricity, heat, steam or cooling
Emissions factor (in units of metric
tonnes CO2e per MWh)
Comment
Off-grid energy consumption from an on-site installation or through a direct line to an off-site generator owned by another company
64482 0
Electricity was generated (at our Mt Isa acid plant in Australia) using the waste heat energy which is released during the exothermic chemical process of making acid. There are no emissions associated with this generation, as the waste heat is used to create steam, and the steam turns an onsite turbine to create electricity.
CC11.5
Please report how much electricity you produce in MWh, and how much electricity you consume in MWh

Total
electricity consumed
(MWh)
Consumed electricity
that is purchased
(MWh)
Total
electricity produced
(MWh)
Total
renewable electricity produced
(MWh)
Consumed renewable
electricity that is produced by
company (MWh)
Comment
870039 547683 322356 0 0
The 64,4821 MWh of electricity which was generated from waste heat at our Mt Isa Australia site (and reported at CC11.4) has been included in the Total Electricity Produced. Although there are no GHG emissions associated with the egneration of this electricity, the heat is not strictly a 'renewable' source.
Further Information
Page: CC12. Emissions Performance
CC12.1
How do your gross global emissions (Scope 1 and 2 combined) for the reporting year compare to the previous year? Increased
CC12.1a
Please identify the reasons for any change in your gross global emissions (Scope 1 and 2 combined) and for each of them specify how your emissions compare to the previous year
Reason Emissions value
(percentage) Direction of
change Please explain and include calculation
Emissions reduction activities
0.2 Decrease Two Cheyenne energy efficiency projects completed/reported last year + Cheyenne #2 + Mt Isa cooling fans + St Helens Instrumentation: (-2289-625-647-527)/2705451*100 = -0.2%
Divestment
Acquisitions

Reason Emissions value
(percentage) Direction of
change Please explain and include calculation
Mergers
Change in output 3.7 Increase Increased production in explosives in North America + increased production in fertilisers in Australia - decreased production in Europe = (74839+28304-1932)/2705451*100) = 3.7%
Change in methodology 1.5 Decrease Emissions factors for Scope 2 (purchased electricity) in north America were updated
Change in boundary
Change in physical operating conditions
Unidentified
Other
CC12.1b
Is your emissions performance calculations in CC12.1 and CC12.1a based on a location-based Scope 2 emissions figure or a market-based Scope 2 emissions figure? Location-based
CC12.2
Please describe your gross global combined Scope 1 and 2 emissions for the reporting year in metric tonnes CO2e per unit currency total revenue
Intensity figure =
Metric numerator (Gross global combined
Scope 1 and 2 emissions)
Metric denominator: Unit
total revenue
Scope 2
figure used
% change from previous
year
Direction of change from previous year
Reason for change
0.000814141 metric tonnes CO2e 3390400000 Location-based
9.6 Increase There has been a 2% increase in emissions, but a 7% decrease in revenue

CC12.3
Please provide any additional intensity (normalized) metrics that are appropriate to your business operations
Intensity figure =
Metric numerator (Gross global combined
Scope 1 and 2 emissions)
Metric denominator
Metric
denominator: Unit total
Scope 2 figure used
% change from
previous year
Direction of change from
previous year
Reason for change
602.15 metric tonnes CO2e
full time equivalent (FTE) employee
4584 Location-based
5 Increase
There has been a 2% increase in emissions, but a 5% decrease in employee numbers due to a global restructure.
21331.24 metric tonnes CO2e
Other: AUD$ Million Net Profit
129.4 Location-based
215 Increase There has been a 2% increase in emissions, but a 68% decrease in profit.
Further Information
Page: CC13. Emissions Trading
CC13.1
Do you participate in any emissions trading schemes? No, but we anticipate doing so in the next 2 years

CC13.1a
Please complete the following table for each of the emission trading schemes in which you participate
Scheme name
Period for which data is supplied
Allowances allocated
Allowances purchased
Verified emissions in metric tonnes CO2e
Details of ownership
CC13.1b
What is your strategy for complying with the schemes in which you participate or anticipate participating? Day-to-day management of Company affairs and the implementation of the corporate strategy and policy initiatives are formally delegated to the Managing Director & CEO. The Managing Director & CEO and his direct reports form the Executive Team. Responsibility for sustainability strategy and governance, inclusive of compliance with the Australian Direct Action Policy, resides with the Executive Team, advised by the Corporate Sustainability Team. The Corporate Sustainability Manager reports to the Group Vice President, Investor Relations & Corporate Development. The Group Vice President, Investor Relations and Corporate Development reports to the Chief Financial Officer, thereby providing alignment with the financial performance for the Company and overall risk management. The Corporate Sustainability Manager coordinates carbon reporting, assurance and the applications process for registration of projects to earn Australian Carbon Credit Units (ACCUs), and advises the Corporate Finance and Treasury functions, who are specifically responsible for the carbon cost management strategy and carbon permit surrender respectively.
CC13.2
Has your organization originated any project-based carbon credits or purchased any within the reporting period? No
CC13.2a
Please provide details on the project-based carbon credits originated or purchased by your organization in the reporting period
Credit origination
or credit purchase
Project type
Project identification
Verified to which standard
Number of credits (metric
tonnes CO2e)
Number of credits (metric tonnes
CO2e): Risk adjusted volume
Credits canceled
Purpose, e.g. compliance
Further Information
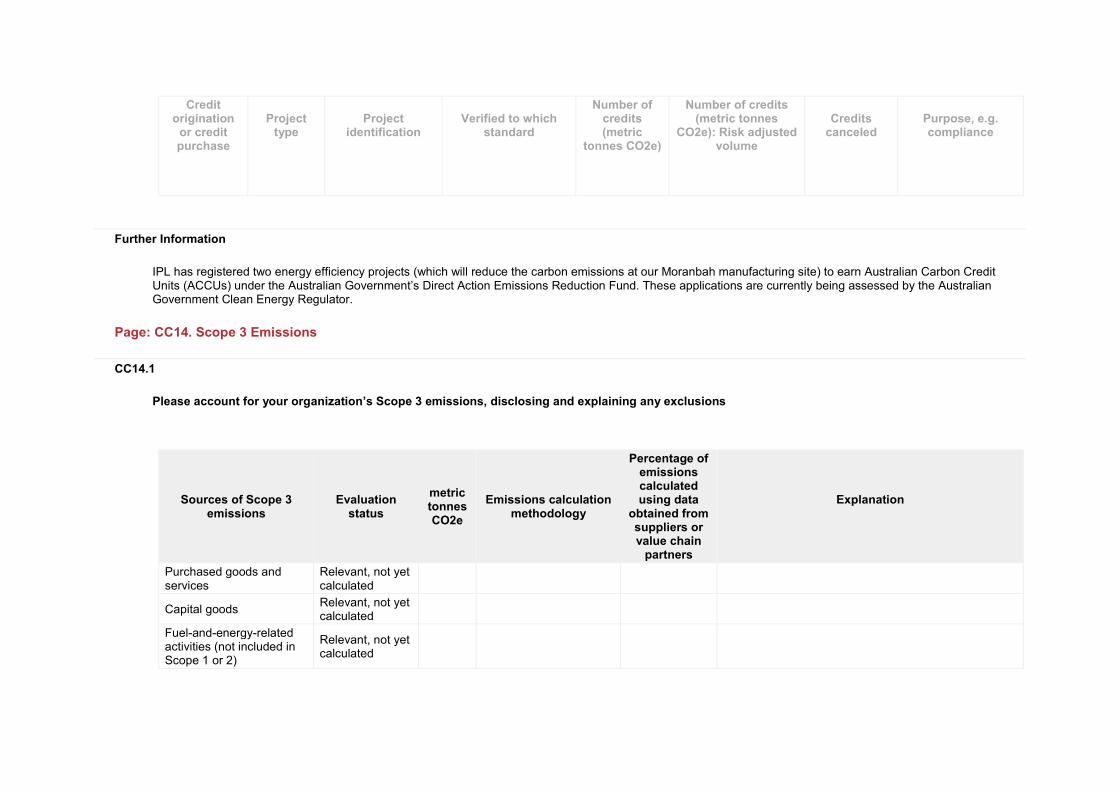
IPL has registered two energy efficiency projects (which will reduce the carbon emissions at our Moranbah manufacturing site) to earn Australian Carbon Credit Units (ACCUs) under the Australian Government’s Direct Action Emissions Reduction Fund. These applications are currently being assessed by the Australian Government Clean Energy Regulator.
Page: CC14. Scope 3 Emissions
CC14.1
Please account for your organization’s Scope 3 emissions, disclosing and explaining any exclusions
Sources of Scope 3 emissions
Evaluation status
metric tonnes CO2e
Emissions calculation methodology
Percentage of emissions calculated using data
obtained from suppliers or value chain
partners
Explanation
Purchased goods and services
Relevant, not yet calculated
Capital goods Relevant, not yet calculated
Fuel-and-energy-related activities (not included in Scope 1 or 2)
Relevant, not yet calculated

Sources of Scope 3 emissions
Evaluation status
metric tonnes CO2e
Emissions calculation methodology
Percentage of emissions calculated using data
obtained from suppliers or value chain
partners
Explanation
Upstream transportation and distribution
Relevant, calculated
74423 Standard approach and verification – EN16258:2012
100.00%
As part of our engagement with our global shipping suppliers, we were able to quantify the Scope 3 greenhouse gas emissions associated with our global shipping during 2016.
Waste generated in operations
Relevant, not yet calculated
Business travel Relevant, not yet calculated
Employee commuting Relevant, not yet calculated
Upstream leased assets Not relevant, explanation provided
IPL has no upstream leased assets.
Downstream transportation and distribution
Relevant, not yet calculated
Processing of sold products
Not relevant, explanation provided
There is no further processing of IPL's products.
Use of sold products Relevant, not yet calculated
End of life treatment of sold products
Relevant, not yet calculated
Downstream leased assets
Not evaluated
Franchises Not relevant, explanation provided
IPL has no franchises.
Investments Not evaluated
Other (upstream) Not evaluated
Other (downstream) Not evaluated

CC14.2
Please indicate the verification/assurance status that applies to your reported Scope 3 emissions No third party verification or assurance
CC14.2a
Please provide further details of the verification/assurance undertaken, and attach the relevant statements
Verification or
assurance cycle in place
Status in the
current reporting year
Type of
verification or assurance
Attach the statement
Page/Section reference
Relevant standard
Proportion of
reported Scope 3 emissions verified (%)
CC14.3
Are you able to compare your Scope 3 emissions for the reporting year with those for the previous year for any sources? No, this is our first year of estimation
CC14.3a
Please identify the reasons for any change in your Scope 3 emissions and for each of them specify how your emissions compare to the previous year

Sources of Scope 3
emissions
Reason for change
Emissions value
(percentage)
Direction of change
Comment
CC14.4
Do you engage with any of the elements of your value chain on GHG emissions and climate change strategies? (Tick all that apply) Yes, our suppliers
CC14.4a
Please give details of methods of engagement, your strategy for prioritizing engagements and measures of success
CC14.4b
To give a sense of scale of this engagement, please give the number of suppliers with whom you are engaging and the proportion of your total spend that they represent
Type of
engagement
Number of
suppliers
% of total spend (direct
and indirect)
Impact of engagement
Active engagement
134 5%
IPL now uses the RightShip GHG ratings which enable customers to include the growing importance of carbon emissions in their vessel selection process. IPL’s shipping contracts total approximately 84 million dollars annually and involve over 130 suppliers. By selecting the most efficient vessels we are reducing carbon emissions while rewarding ship owners that invest in more efficient ships. During 2016 we measured the success of this initiative by ensuring that ships we chartered had a RightShip GHG Rating between "A" and "E". Vessels with an "F" rating were

Type of
engagement
Number of
suppliers
% of total spend (direct
and indirect)
Impact of engagement
only considered if no better alternative was available and vessels with a "G" rating were fully excluded. 98% of vessels chartered were within the "A" to "E" range. Rightship also provided IPL with a calculation of the Scope 3 emissions associated with our global shipping, which was calculated using a standard approach verified to align with EN16258:2012. Although present data collection systems do not allow us to calculate the amount of emissions avoided by our use of more efficient vessels in 2016, we are working with our suppliers to be able to calculate this in 2017.
CC14.4c
Please explain why you do not engage with any elements of your value chain on GHG emissions and climate change strategies, and any plans you have to develop an engagement strategy in the future
Further Information
Attachments
https://www.cdp.net/sites/2017/14/8914/Climate Change 2017/Shared Documents/Attachments/ClimateChange2017/CC14.Scope3Emissions/RIGHTSHIP_IPL Scope 3_Results Presentation.pdf
Module: Sign Off
Page: CC15. Sign Off
CC15.1

Please provide the following information for the person that has signed off (approved) your CDP climate change response
Name
Job title
Corresponding job category
Karen Durand
Corporate Sustainability
Manager Environment/Sustainability manager
CDP