Embed Size (px)
Citation preview
IPB Insurance CLG
Trading as IPB Insurance
Solvency and Financial Condition Report (SFCR)
For the Financial Year Ended 31 December 2016

2
Contents Introduction / Summary ............................................................................................................................... 4
A: Business and Performance ....................................................................................................................... 5
A.1 Business .............................................................................................................................................. 5
A.2 Underwriting Performance ................................................................................................................. 6
A.3 Investment Performance .................................................................................................................... 9
A.4 Performance of other Activities........................................................................................................ 10
A.5 Any other Information ...................................................................................................................... 10
B: System of Governance ............................................................................................................................ 11
B.1 General Information on the System of Governance ......................................................................... 12
B.2 “Fit and Proper “requirements ......................................................................................................... 15
B.3 Risk Management System including the Own Risk and Solvency Assessment ................................. 19
B.4 Internal Control System .................................................................................................................... 22
B.5 Internal Audit Function ..................................................................................................................... 24
B.6 Actuarial Function ............................................................................................................................. 25
B.7 Outsourcing ....................................................................................................................................... 26
B.8 Assessment of Governance............................................................................................................... 26
C: Risk Profile .............................................................................................................................................. 27
C.1 Underwriting Risk.............................................................................................................................. 27
C.2 Market Risk ....................................................................................................................................... 28
C.3 Credit Risk ......................................................................................................................................... 31
C.4 Liquidity Risk ..................................................................................................................................... 32
C.5 Operational Risk ................................................................................................................................ 33
C.6 Other Material Risks ......................................................................................................................... 34
C.7 Risk Sensitivity Analysis ..................................................................................................................... 35
C.8 Dependencies between risk modules ............................................................................................... 36
C.9 Any other information ...................................................................................................................... 37
D: Valuation for Solvency Purposes ............................................................................................................ 37
D.1 Assets ................................................................................................................................................ 37
D.2 Technical Provisions ......................................................................................................................... 45
D.3 Other Liabilities ................................................................................................................................. 50
D.4 Alternative Methods for Valuation ................................................................................................... 53
3
E: Capital Management ............................................................................................................................... 54
E.1 Own Funds ........................................................................................................................................ 54
E.2 Solvency Capital Requirement and Minimum Capital Requirement ................................................ 57
E.3 Any use of the duration-based equity risk sub-module in the calculation of the Solvency Capital
Requirement ........................................................................................................................................... 58
E.4 Internal model information............................................................................................................... 59
E.5 Non-compliance with the Minimum Capital Requirement and significant non-compliance with the
Solvency Capital Requirement ................................................................................................................ 59
E.6 Any other information ...................................................................................................................... 59
Annex .......................................................................................................................................................... 60
Annual Quantitative Reporting Templates (QRTs) ................................................................................. 60

4
Introduction / Summary Solvency II, the new EU insurance legislation, aiming to provide a harmonised EU-wide regulatory regime
for Insurance companies and enhance consumer protection, came into force with effect from 1 January
2016. The Solvency II Directive introduced a risk-based capital requirement the Solvency Capital
Requirement (SCR), which reflects the risk profile of the insurer as well as the Minimum Capital
Requirement (MCR) as determined by the legislation. The regime placed new reporting and public
disclosure obligations on insurers, some of which, are required to be published on the insurer’s public
website or otherwise made publicly available. This document is the first version of the Solvency and
Financial Condition Report (“SFCR”) that is required to be published by IPB Insurance CLG (“the company).
This SFCR covers the business and performance of the company, its system of governance, risk profile,
valuation for solvency purposes and capital management. The ultimate responsibility for all of these
matters lies with the company’s Board of Directors, with support from various governance and control
functions that have been put in place to monitor and manage the operations of the business. This SFCR
went through both an internal and external review and approval process, including Board approval as per
the EIOPA Guideline 37 and was subject to controls to ensure that the information contained herein is
reliable, complete and consistent with information and other reports submitted to the Central Bank.
The company is a mutual non-life Insurance company established in 1926 and regulated by the Central
Bank of Ireland. The principal activity of the company continues to be the provision of comprehensive
insurance and risk management services. The majority of business written relates to Members who
include Local Authorities, Education and Training Boards and the Health Service Executive (HSE).
The company delivered a solid performance for the year resulting in a profit before tax of €18.2 million.
This growth was driven by a combination of a modest rate increase and new business from Members and
a more substantial rate increase and modest growth from non-Members. Financial performance in the
non-life insurance market has been challenging over the past five years. The continued deterioration in
the claims environment has led to a continuing trend of higher premium as the market adjusts to stem
losses and return to growth, resulting in market-wide increases to premium charged. The reduced level
of the discount rate applicable to catastrophic injury claims as well as high claims frequencies and
increasing Court award levels are just some of the factors affecting premium inflation. In addition to these,
the impact of the Injuries Board’s launch of the revised book of Quantum in 2016 and the anticipated
imminent introduction of Periodic Payments Orders (PPOs) can be expected to drive further claims
inflation.
In January 2016 an interim management structure was implemented, led by the company’s Finance
Director, Enda Devine. Following resignation of the company’s previous Chief Executive Officer (CEO), a
new CEO, Michael Garvey, was appointed in September 2016. The management team is now in place to
deliver on the company’s strategic and operational plan to meet customers’ needs over the coming years.

5
The Risk Profile of the company is stable and is currently dominated by Underwriting and Market Risk.
The company has complied with the Solvency II directive on an on-going basis throughout the year and
the capital available to the company is of a very high quality, consisting wholly of retained earnings. The
assets that comprise the available capital are invested in a very balanced investment portfolio with limited
risk accepted within the parameters of the Board approved Risk Appetite Statement. As at 31 December
2016, the company’s eligible own funds to cover the SCR and MCR stood at €808.2 million, which
represented a solvency ratio of almost 4 times the SCR.
A: Business and Performance
A.1 Business
The company is a mutual non-life insurance company established in Ireland in 1926 and limited by
guarantee. The company is a single entity and does not form part of a group. It is governed by the
“Constitution of Irish Public Bodies Mutual Insurances Ltd” and the Local Authorities (Mutual Assurance)
Acts of 1926, 1928 and 1935. The principal activity of the company continues to be the provision of
comprehensive insurance and risk management services to its Members and customers, both in the public
and private sector, with most of its underwriting risk concentrated in the Republic of Ireland. Membership
consists predominantly of Local Authorities, Education and Training Board (“ETBs”) and the Health Service
Executive (“HSE”). The company is 100% Irish owned and is a Standard & Poor's A- stable rated insurer
with excellent financial strength. It is not leveraged and it maintains large capital buffers accumulated
from retained earnings. The company’s current organisational structure is set out on page 11.
The company’s registered office and operating address is: 1 Grand Canal Square, Grand Canal Harbour,
Dublin 2 D02 P820.
The Central Bank of Ireland (“Central Bank”) is responsible for the financial supervision of the company.
The Central Bank’s address is: Central Bank of Ireland, New Wapping Street, North Wall Quay, Dublin 1.
The company’s external auditor is: Deloitte Chartered Accountants and Statutory Audit Firm, Deloitte and
Touche House, Earlsfort Terrace, Dublin 2.
The company’s financial year end is 31 December each year and it reports its results in EUR (Euro).
There has been no significant business or external events during the year.

6
A.2 Underwriting Performance
As a mutual insurer our core business is to underwrite the risk exposure experienced by our Members.
We must ensure that we deliver on this fundamental objective to ensure that the long-term sustainability
of the business is achieved. The company’s underwriting result for 2016 was below target, delivering a
€3.9 million loss for the year (2015: €6 million loss). This underwriting performance is a direct result of
the continuing upward trend in claim frequency, claim severity and claim management costs.
Reflecting weak underwriting performance in recent years, the company introduced a moderate rate
increase of 5.6% for Members in 2016. The reported net combined operating ratio of 104% means that
further adjustments to premiums are needed in the short-to-medium term to reflect recent claims
experience. An average rate increase of 15% was applied across the membership base in 2017.
As the stakeholders of the business it is important that Members are protected by having a mutual insurer
that delivers a positive underwriting result on a consistent basis. The prudent pricing of Member and non-
Member risks will strengthen the overall underwriting performance of the mutual, which is critical to its
long-term sustainability. Gross written premiums (GWP) for the year were in line with growth forecasts
at €124.9 million, up 10% or €11.8 million on the previous year (2015: €113.1 million). The largest
contributor to this GWP growth was general liability insurance, generating a total of €87.8 million during
the year (2015: €78.7 million). New business was another factor driving premium income growth, which
was achieved by a steady development of markets closely aligned to our existing Member and public
services sectors.
Claim frequency has risen over the prior year with the principal uplifts within the Liability business lines.
In general, Public Liability continues to represent the majority of IPB claims at 62% of notified claims in
2016 and 67% of the value of those settled. Employers Liability claims represent 4% of claims notified and
14% of the value of those settled in the same period. The company’s full year total net claims incurred
increased marginally by 2.4% year-on-year, coming in at €88.8 million (2015: €86.8 million), however,
excluding a once-off claims portfolio transfer in 2015, net claims incurred in 2016 has increased by over
15% driven by increased claim frequency coupled with an upward shift in claims severity.
Commission income was slightly down on the prior year, delivering a result of €6.6 million (2015: €6.8
million). Commission income is earned on reinsurance contracts entered with a panel of global reinsurers.
The following tables shows an analysis of the underwriting result by product and by location, compared
to the prior year, as per the year-end financial statements:

7
Analysis of underwriting result by product
Third party
liability
Fire and other
damage to
property Motor Other Total
2016 €’000 €’000 €’000 €’000 €’000
Gross written premiums 87,848 25,115 7,738 4,171 124,872
Premium ceded to reinsurers (5,518) (14,766) (574) (308) (21,166)
Change in the gross provision for unearned premiums (5,887) 1,942 (365) 481 (3,829)
Change in the reinsurance provision for unearned premiums - - - - -
Net earned premiums 76,443 12,291 6,799 4,344 99,877
Gross claims paid (59,821) (8,924) (8,345) (1,230) (78,320)
Claims recovered from reinsurers 5,843 5,298 3,276 - 14,417
Gross change in contract liabilities (14,476) 3,367 (2,758) (399) (14,266)
Change in contract liabilities recovered from reinsurers (5,475) (1,223) (3,960) - (10,658)
Net claims incurred (73,929) (1,482) (11,787) (1,629) (88,827)
Technical underwriting result - net 2,514 10,809 (4,988) 2,715 11,050
Commission income 654 5,858 38 26 6,576
Operating expenses (14,095) (4,030) (1,242) (669) (20,036)
Underwriting expenses (905) (507) (51) (75) (1,538)
Underwriting result (11,832) 12,130 (6,243) 1,997 (3,948)
Net investment return 16,263 4,650 1,433 772 23,118
Other costs (704) (201) (62) (33) (1,000)
Profit before taxation 3,727 16,579 (4,872) 2,736 18,170
Net insurance liabilities 429,848 7,529 23,324 4,489 465,190
Analysis of underwriting result by product
Third party
liability
Fire and other
damage to
property Motor Other Total
2015 €’000 €’000 €’000 €’000 €’000
Gross written premiums 78,685 24,067 6,935 3,449 113,136
Premium ceded to reinsurers (3,254) (13,654) (477) (242) (17,627)
Change in the gross provision for unearned premiums (970) 301 (167) (26) (862)
Change in the reinsurance provision for unearned premiums- - - - -
Net earned premiums 74,461 10,714 6,291 3,181 94,647
Gross claims paid (57,620) (5,412) (6,527) (1,050) (70,609)
Claims recovered from reinsurers (636) 1,536 - - 900
Gross change in contract liabilities 3,462 (5,132) 3,796 (176) 1,950
Change in contract liabilities recovered from reinsurers (23,821) 4,506 304 - (19,011)
Net claims incurred (78,615) (4,502) (2,427) (1,226) (86,770)
Technical underwriting result - net (4,154) 6,212 3,864 1,955 7,877
Commission income 544 6,241 30 30 6,845
Operating expenses (13,609) (4,163) (1,199) (597) (19,568)
Underwriting expenses (745) (336) (27) (31) (1,139)
Underwriting result (17,964) 7,954 2,668 1,357 (5,985)
Net investment return 46,202 14,131 4,072 2,025 66,430
Other costs (696) (213) (61) (30) (1,000)
Profit before taxation 27,542 21,872 6,679 3,352 59,445
Net insurance liabilities 404,010 11,616 16,241 4,570 436,437

8
Appendix 1 and Appendix 2 provide further detail on the underwriting performance as per the year end
S.05 Premium, claims and expenses Templates and the S.19.01.21 Non-Life Insurance Claims Template.
Analysis of underwriting result by location
Republic of
Ireland
Northern
Ireland Total
Republic of
Ireland
Northern
Ireland Total
€’000 €’000 €’000 €’000 €’000 €’000
Gross written premiums 122,741 2,131 124,872 110,114 3,022 113,136
Premium ceded to reinsurers (20,962) (204) (21,166) (17,243) (384) (17,627)
Change in the gross provision for unearned premiums (4,198) 369 (3,829) (339) (523) (862)
Change in the reinsurance provision for unearned - - - (3) 3 -
Net earned premiums 97,581 2,296 99,877 92,529 2,118 94,647
Gross claims paid (77,912) (408) (78,320) (70,399) (210) (70,609)
Claims recovered from reinsurers 14,347 70 14,417 895 5 900
Gross change in contract liabilities (11,460) (2,806) (14,266) 3,234 (1,284) 1,950
Change in contract liabilities recovered from reinsurers (12,583) 1,925 (10,658) (19,011) - (19,011)
Net claims incurred (87,608) (1,219) (88,827) (85,281) (1,489) (86,770)
Technical underwriting result - net 9,973 1,077 11,050 7,248 629 7,877
Commission income 6,537 39 6,576 6,744 101 6,845
Operating expenses (19,694) (342) (20,036) (19,045) (523) (19,568)
Underwriting expenses (1,529) (9) (1,538) (1,129) (10) (1,139)
Underwriting Result (4,713) 765 (3,948) (6,182) 197 (5,985)
20152016

9
A.3 Investment Performance
2016 can be categorised as a year of extreme volatility in both equity and bond markets. Initially markets
were impacted by the prospect of a slowdown in the Chinese market, followed in June by the market
turbulence post the UK referendum on exiting the European Union (Brexit), and finally the outcome of
the elections in the United States. Bond yields hit historically low levels as a result of the ECB’s
Quantitative Easing programme, however, this appears to be coming to an end and yields have hit an
inflection point and have now started to rise. The investment return was ahead of target by 28%,
delivering a €23.1 million profit for the year (2015: €66.4 million).
The following table shows an analysis of the investment return, compared to the prior year, as per the
financial statements.
The company has no gains / losses recognised directly in equity, nor does it engage in any securitisation.
Company assets are invested in highly rated investments in accordance with the “prudent person
principle”. Investment decisions are made in the best interests of policyholders and other beneficiaries.
Consequently, the fundamental objective is that all valid claims and expenses are paid as they fall due. In
Analysis of net investment return Net Net
realised unrealised FX Total
Investment gains/ gains/ gains/ Investment investment
income (losses) (losses) (losses) expenses return
2016 €’000 €’000 €’000 €’000 €’000 €’000
Investment properties 4,343 - 558 - - 4,901
At fair value through profit or loss
- Debt securities 14,594 (356) 3,444 813 - 18,495
- Equity securities 5,146 15,859 (19,334) (4,790) - (3,119)
Loans and receivables
- Loans to local authorities 134 - - - - 134
- Deposits with credit institutions 585 - - - - 585
Cash and cash equivalents (220) - - (274) - (494)
Derivatives - - - 3,777 - 3,777
FX gain/(loss) on insurance business - - - (267) - (267)
Investment expenses - - - - (894) (894)
Total net investment return 24,582 15,503 (15,332) (741) (894) 23,118
Analysis of net investment return Net Net
realised unrealised FX Total
Investment gains/ gains/ gains/ Investment investment
income (losses) (losses) (losses) expenses return
2015 €’000 €’000 €’000 €’000 €’000 €’000
Investment properties 1,787 - 3,086 - - 4,873
At fair value through profit or loss
- Debt securities 16,285 606 (4,498) (1,325) - 11,068
- Equity securities 4,213 34,181 10,677 4,758 - 53,829
Loans and receivables
- Loans to local authorities 162 - - - - 162
- Deposits with credit institutions 1,677 - - - - 1,677
Cash and cash equivalents (87) - - (166) - (253)
Derivatives - - - (3,393) - (3,393)
FX gain/(loss) on insurance business - - - (6) - (6)
Investment expenses - - - - (1,527) (1,527)
Total net investment return 24,037 34,787 9,265 (132) (1,527) 66,430

10
practice assets are allocated into two notional portfolios which have different objectives – The Matched
Portfolio and The Risk Portfolio. These objectives are discussed in more detail later in this Report.
A.4 Performance of other Activities
Operating expenses remained consistent year-on-year, with a marginal increase for the current year. Total
operating expenses amounted to €20 million for the year (2015: €19.6 million). The largest component of
operating expenses related to staff costs.
A.5 Any other Information
During 2016, the company paid a dividend to its Members of €15 million (2015: €15 million), underlining
the company’s commitment to its Members. The dividend is payable to current Members in proportion
to the gross premium income derived from them in the most recent financial year.

11
B: System of Governance
IPB Insurance CLG – Organisational Structure
* Risk, Compliance and Actuarial have direct reporting to CEO, Board, Audit & Risk Committee & Client & Member Relations has a direct reporting line to the CEO
** Internal & External Audit have direct reporting to the Board and Audit Committee – also have a relationship with Risk, Compliance and Finance

12
B.1 General Information on the System of Governance
Role of the Board of Directors
The key role of the Board of Directors involves leadership and oversight of the Chief Executive Officer’s
effective implementation of the business’s strategy. The Chairman, George Jones, is responsible for
leading the Board of Directors and ensuring the full participation of each director. Constructive challenge
by the Board of Directors to management is critical in providing assurance to the company’s stakeholders
that the business and its management team achieve appropriate governance standards while meeting the
goals and objectives of the business.
Board of Directors Composition
The composition of the Board of Directors is consistent with regulatory requirements and responsive to
the evolution of the company’s business activities. The Board of Directors, following Central Bank
consultation on its optimum composition, comprises of four group non-executive Directors (GNED)
(namely George Jones, Michael McGreal, Michael Fitzgerald and Sean O’Grady), three Independent Non-
Executive Directors (INED) (namely Garry Cullen, Dermot Gorman and John Smyth) and two Executive
Directors, namely the Chief Executive Officer (CEO), Michael Garvey and the Finance Director, Enda
Devine. Michael Garvey was engaged in his role as Chief Executive Officer in September 2016. There is a
clear division of responsibilities between the Chairman and the CEO and the Board of Directors has the
13
strength and balance to ensure that all aspects of the business are addressed. The skills of the INEDs assist
with the development of the business while the GNEDs ensure maintenance of the experience and
continuity of the company’s strong legacy. The Executive Directors have a significant amount of technical,
financial and insurance experience and they are tasked with delivering on the strategic objectives of the
company and in doing so, oversee the day to day operations of the company. Each member of the Board
participates in a comprehensive training and development programme to ensure continuous skills
enhancement.
Board Committees
The company has in place a comprehensive set of terms of reference, policies and procedures supporting
all aspects of its governance and control framework and is appropriate to its nature, size and complexity,
the Board of Directors delegates authority to the following Board Committees to complete separate
programmes of work on its behalf whilst ensuring regular reporting with a clear terms of reference:
A Risk Committee, the role of which is to establish, document and devolve throughout the company a comprehensive risk management framework. The Risk Committee assists the Board with its oversight of risk and risk management. It meets at least four times per year and follows a structured approach that covers all key risk types within the business, including emerging and strategic risks. The Risk Committee is advised by subject matter experts on risk management, underwriting, claims, investments and compliance.
An Audit Committee, the main role of which includes responsibility for maintaining oversight of the company’s financial reporting, internal controls, audit processes and processes for monitoring legal and regulatory compliance. The Audit Committee also reviews the escalation process for employees in accordance with the Whistleblowing Policy outlined in the company’s Ethics Policy. The Audit Committee Chairman has outlined his role and the Audit Committee’s objectives over the coming year as “continuing to oversee assurance in an enhanced control environment by encouraging challenging and constructive interrogation of submissions, assessing external environmental issues and their potential impact on IPB and corresponding control implementation, ensuring the ongoing effectiveness of audit functions and the integrity of financial reporting to Members and other stakeholders, and providing the Board with confirmation of apt advancements in this area. The Committee members have actively engaged in discharging their responsibilities during the year and our priorities in maintaining this momentum include overseeing a targeted approach to addressing the legal and claims environment challenges and ensuring IPB’s continual commitment to organisational governance.”
An Investment Committee with responsibility for ensuring discharge by the Board of Directors’ of its oversight responsibilities in respect of the conduct of the company’s investment management operations within approved investment policy and risk parameters. The Investment Committee also monitors the compliance of the company’s investment activities with legislative provisions and regulatory requirements.
A Remuneration and Nomination Committee with responsibility for recommending succession planning for the Board and Management for Board approval. This includes overseeing the fitness and probity process associated with the appointment or removal of Board members and any head of control function by conducting an annual review of their compliance with requisite standards. The Remuneration and Nomination Committee is also responsible for Board recommendation of the company’s Remuneration Policy, non-executive Director fee structures, and the remuneration of Executive Directors and individuals remunerated per criteria specified in its Terms of Reference.
14
A Corporate Social Engagement (CSE) Steering Committee with responsibility for keeping under review and making appropriate recommendations to the Board of Directors with regards to the company’s Management of Corporate Social Engagement.
Independent Control Functions
The company has also established the four key independent control functions required under the
Corporate Governance Requirements for Insurance Undertakings 2015 and in accordance with Articles
44, 46, 47 and 48 of the Solvency II Directive – Risk Management, Compliance, Actuarial and Internal Audit.
These functions are responsible for providing oversight of and challenge to the business and for providing
assurance to the Board of Directors in relation to the company’s control framework. Each of the
independent functions have direct reporting lines to the Board of Directors, as well as the relevant Board
of Directors Committees. These functions are discussed in more detail later on in this report.
Remuneration, Employee Benefits and Practices
The Remuneration Policy is underpinned by a philosophy of encouraging the company’s long-term
performance and value creation for stakeholders ensuring correspondence with best practice and
regulatory requirements and consistency with and promotion of sound and effective risk management on
an individual basis and with respect to the business as a whole having regard to its mutual status.
The key principles informing the company’s Remuneration Policy support the company’s approach to
ensuring that base pay is internally equitable by targeting base pay at levels compatible with the Irish
Insurance and Financial Services sectors and they are set out below as including to:
- reflect its commitment to compliance with legal and regulatory requirements, including but not limited
to the Corporate Governance Requirements for Insurance Undertakings 2015, the Central Bank’s
Guidelines on Variable Remuneration Arrangements for Sales Staff issued in 2014, the EIOPA Guidelines
on the System of Governance and the Solvency II Delegated Regulation (EU) 2015/35;
- create an integrated Remuneration and Benefits Framework consistent with the remuneration
philosophy and deliver apt remuneration packages. These are based on annual reviews and approvals by
the Remuneration Committee and the Board of base pay benchmark setting, total compensation packages
to bonus pools, bonus payments and benefits packages and ad hoc increases and payments arising per
risk appetite and effected by apt governance fora per the company’s Merit and Retention Increase
Protocol approval process. Internal equity and market competitiveness are ensured through periodic
participation in external market reviews and benchmarking exercises with support from suitably qualified
and independent external advisors appointed by the Remuneration Committee and Board;
- support the company in attracting, developing and retaining motivated and appropriately skilled
employees in a competitive market through the delivery of appropriate remuneration packages;
- support employees in creating sustainable results in the interests of stakeholders and clearly link the
interests of key stakeholders and employees through an apt Remuneration and Benefits Framework;

15
- support the annual work cycles of the Committee and the Board, ensuring periodic reviews to inform
engagement by appointed independent advisors in providing independent and objective advice;
The company provides employees, including Executive Directors, with a range of benefits including
income protection and death in service benefits. Employees are also provided with health insurance
contributions and contributions payable into Personal Retirement Savings Accounts (defined contribution
plans) based on percentage of salary, to which they can voluntarily contribute to suit their circumstances
whilst early retirement schemes are not available. A comprehensive Learning and Development
framework, supported by educational assistance and comprising internal and external training and
leadership development, is available to employees. Share options or shares do not form part of the
available employee benefits however the company operates an annual bonus plan for employees payable
in addition to contractual remuneration. The focus of the company’s approach to variable remuneration,
which is secondary in terms of quantum and certainty of availability relative to fixed remuneration, is on
ensuring sound and effective risk management and avoidance of potential perception or encouragement
of excessive risk taking. This is achieved through framing eligibility to participate on satisfactory company
and individual performance, inclusion of financial and non-financial measures and with submission of the
company Performance Objectives against which overall financial performance is measured and evaluated
to the Remuneration Committee and the Board for annual review and approval.
The company, through the Remuneration and Nomination Committee of the Board of Directors,
continually reviews the Remuneration and Benefits Framework in place to ensure that it is appropriate in
the context of all regulatory and compliance requirements including the Corporate Governance
Requirements for Insurance Undertakings 2015, the Central Bank of Ireland’s Guidelines on Variable
Remuneration Arrangements for Sales Staff issued in 2014, the EIOPA Guidelines on the System of
Governance and the Solvency II Delegated Regulation (EU) 2015/35 (including Solvency II Article 275
requirements) and other relevant considerations.
Material Transactions with Members during the reporting period
The company issued a number of loans to local authorities for the purpose of developing local community
initiatives (including local authority premises, roads and amenities). The company ceased providing these
loans with effect from 2009, therefore there were no loan advances made to local authorities during the
year. Loan capital repayments and interest payments made by the local authorities during the year
amounted to €2.5 million (2015: €2.7 million). Loan balances outstanding at year end amounted to €23.5
million (2015: 25.9 million). During the year, the company also paid a Members’ dividend of €15 million
(2015: €15 million) and a social dividend of €1 million (2015: €1 million).
B.2 “Fit and Proper “requirements
The company has always been committed to ensuring its employees are of the highest calibre. The
company’s Fitness & Probity & Minimum Competency Code Policy illustrates its commitment to
adherence to legal and regulatory requirements in engaging personnel and reinforces the philosophy of
ensuring that all employees perform their duties with integrity and a strong sense of ethical responsibility.

16
Its provisions apply to any employee, non-employees such as Director, candidates or third party service
providers (collectively referred to as Employees) of the company who performs duties which are
considered, by the Central Bank to involve either a Controlled Function (hereafter a ‘CF’) or a Pre-approval
Controlled Function (hereafter a ‘PCF’). Its provisions apply from the beginning of the recruitment process
and due regard to them must be considered as mandatory during any recruitment of persons performing
duties involving a CF or PCF, and the application of the Fitness & Probity Standards (hereafter “the
Standards”) remain applicable and must be maintained throughout their employment with the company.
Standards
In order to meet the Fitness & Probity (hereafter ‘F&P’) regulatory requirements, the company does not
allow a person to perform duties involving a CF or a PCF, unless satisfied, on reasonable grounds, that
he/she meets the Central Bank Standards. As an employer, the company is responsible for ensuring that
each of its personnel meets the F&P Standards, on entry to the financial services industry and throughout
their career.
The company is satisfied of its ability to judge whether an individual has the competence, experience and
ability to understand the technical requirements of the business, the inherent risks and the management
processes required to conduct the operations of the company effectively. Whereas common standards of
probity apply regardless of the size or activity of the company, the competence requirements will vary to
reflect the nature of the post and the size and activity of the company and the applicable approach
ensures that the company undertakes necessary due diligence to ensure satisfaction of the Standards. In
meeting the Standards a person performing duties involving a PCF or a CF role in the company must be:
• Competent and capable;
• Honest and ethical and act with integrity; and
• Financially sound.
The company undertakes a number of procedures to ensure the above requirements are met and to
ensure compliance with the Minimum Competency Code and the company’s F&P Policy. Such procedures
include the following:
Heads of Department
Heads of business functions within the company have overall responsibility for ensuring that their
respective departments are aware of and adhere to this Policy and to provide relevant information to the
Human Resources Department and the Compliance Department as requested in relation to compliance
with the Policy.
Compliance Department
The Compliance Department ensure that the Policy is circulated to all employees and that education and
training in relation to the Policy is provided as required. Compliance also provides oversight with respect
to the Strandum Compliance Module. In addition, the Compliance Department will review compliance

17
with the Policy as part of the overall compliance monitoring programme and ensure adherence to
regulatory requirements.
Human Resources Department
The Human Resources Department are responsible for the implementation and maintenance of the
company’s Recruitment and Selection Policy which sets out the process for the recruitment of internal
and external candidates to the company. The Recruitment & Selection Policy sets out the due diligence to
be performed when recruiting for PCF and CF roles by management and HR.
In addition, the Human Resources Department is responsible for the maintenance of the internal registers
related to F&P. The F&P Register must record all PCF and CF roles, both present and past. These registers
are now maintained on a HR Compliance Module.
The Human Resources Department must ensure that the contract of employment for all new hires and
appointees (whether PCF or otherwise) provides that the offer is subject to the necessary pre-
employment fitness and probity screening.
Company Secretarial
The Company Secretarial Department is responsible, in conjunction with the Directors themselves, for
ensuring INEDs and GNEDs are in compliance with this Policy and the relevant regulatory requirements.
Remuneration Committee
In accordance with the Terms of Reference of the Remuneration Committee, the proposed arrangements
particular to all employees categorised as PCF, CF1, must be presented to the Remuneration Committee
for approval and to the Board for noting before they commence employment with the company. The
Remuneration Committee must be provided with the following documents so as to assist in informing the
decision making process:
• Company Recruitment Requisition Form setting out the category for Remuneration Committee
Approval
• CV listing qualifications
• Role Profile with relevant PCF, CF1 designations
• Proposed Remuneration terms and benefits in relation to the role and candidate
• IQ declaration (if PCF role), and
• Any other documentation as may be required.
Due Diligence
The company is required to undertake due diligence to ensure that the F&P standards are met. The
Recruitment & Selection Policy sets out the due diligence to be performed when recruiting all staff
members including PCF and CF role holders.

18
The company conducts due diligence via:
examination of the candidates CV
interview process
reference checking
evidencing professional qualifications and professional body registration
evidencing MCC compliance including compliance with CPD requirements
F&P declaration
role profile and ability to discharge concurrent responsibilities
financial soundness
previous disqualifications, restrictions or administrative sanctions
In the event that any material items are identified during the due diligence process this will be duly
addressed and appropriately actioned. The company may engage with an external provider to assist with
conducting due diligence.
Offers of employment are subject to full compliance being met by the candidate through F&P standards and guidelines, reference, professional memberships and qualification, court judgements checking. This checking process is conducted by an external provider on behalf of the company. This service provides
an independent, objective check in relation to candidates.
Outsourced Functions
Pre-approved Control Functions (PCF)
The company requires that all persons performing duties involving a PCF role on an outsourced basis are
compliant with the F&P Standards.
Where performance of such duties is outsourced to an ‘unregulated entity’, the company requires the
identity notification of the individual who will perform them on an outsourced basis as it obtains the
Central Bank’s approval prior to the appointment of any such individual.
Control Functions
Where performance of duties involving a CF function is outsourced to an ‘unregulated entity’, the
company requires the unregulated entity to be able to identify the individuals who perform such duties,
and assess whether they are compliant with the F&P Standards and obtain agreement to abide by them.
The company requires an outsourced unregulated entity performing a CF role on its behalf to furnish the
company with confirmation of all F&P requirements (including sample documentation as to how the
compliance is adhered to for each person) and to provide written confirmation that the individuals
performing the CF have agreed to abide by the F&P Standards.
Ongoing Nature of Fitness and Probity requirements
F&P requirements are relevant and must be adhered to for the duration of an individual’s employment
with the company. On an annual basis, the company requires all relevant employees to complete a F&P
declaration and confirmation so that any material changes to the employees F&P status can be

19
communicated to the company. All F&P declarations and confirmations are submitted to HR for retaining
on the employees file.
B.3 Risk Management System including the Own Risk and Solvency Assessment
Risk Management Structure
Risk management is central to safeguarding the promise that the company makes to its policyholders and
Members and in the interests of all stakeholders, risk management seeks to:
Protect the company’s operations by promoting a sound culture of risk awareness as well as disciplined and informed risk taking
Protect the company’s strong capital base by monitoring that risks taken are not beyond the company’s risk appetite
Support decision making processes by providing consistent, reliable and timely risk information
The Board of Directors is responsible for ensuring that risk is effectively managed by those involved in
running the company on a day-to-day basis. The Board of Directors establishes prudent and effective
controls to manage risk via the risk framework and sets the company’s appetite for risk via the Risk
Appetite Statement.
The Risk Committee assists the Board of Directors with its oversight of risk and risk management. It meets
at least four times per year and follows a structured approach that covers all key risk types within the
business, including emerging and strategic risks. The Risk Committee is advised by subject matter experts
on risk management, underwriting, claims, investments and compliance.
Risk management is core to all business activities and staff are guided by documented policies and
procedures, underpinned by an active and embedded risk management function, intranet, fora and
training.
The Risk Framework
The risk framework describes the company’s system to identify, measure, monitor and manage risk in the
business. It ensures that risk management is aligned with the company’s strategic objectives and it is
guided by seven key principles. Implementation of the risk framework relies on a system of integrated risk
management tools that promote a culture of risk management throughout the company.
The Board of Directors articulates risk appetite in order to ensure the solvency of the company at all times.
Risk appetite is ultimately expressed in terms of detailed operating limits that guide the day-to-day
activities of those entrusted to run the business. This enables the company to pursue its strategic
objectives while limiting risk in a transparent and structured manner. All risks are monitored regularly and
certain risk types are monitored daily. Procedures are in place to reduce risk levels should operating limits
be threatened and a system of intermediate warning points is used to ensure that remedial action can be
taken long before a breach is threatened as shown below:

20
Within Risk Appetite Status
The Company is normally expected to operate within Risk Appetite.
Risk Appetite Proximity Warning
A Risk Appetite Proximity Warning indicates that a Risk Appetite Alert is threatened and corrective action
is required.
In the event of a Risk Appetite Proximity Warning the head of risk and the relevant business area shall
take appropriate immediate steps to return the company to risk appetite. The head of risk shall inform
the CEO without undue delay and in any case within 2 business days of detection. The head of risk and
CEO shall decide on the need for further escalation. In any case, the Proximity Warning shall be noted at
the next Risk Committee meeting and reporting to the Risk Committee shall continue until risk appetite is
restored.
Risk Appetite Alert
A Risk Appetite Alert indicates that a Risk Appetite Limit breach is threatened and swift and decisive
corrective action is required.
In the event of a Risk Appetite Alert the head of risk and the relevant business area shall take the
appropriate immediate steps to return the company to risk appetite. The head of risk shall consider
engaging the company’s Incident and Error Management Policy. The head of risk must inform the Risk
Committee and any other relevant internal stakeholder without undue delay and in any case within 3
business days of detection. If Risk Appetite has not been restored the Risk Committee must meet within
5 business days of being informed of an Alert and the Risk Committee will be furnished with a report giving
full details of the Alert together with a recommended plan to restore Risk Appetite. The Risk Committee
shall decide on further escalation to the Board. In any case, the Risk Appetite Alert is noted at the next
Board meeting. Reporting continues until risk appetite is restored, at a reporting frequency and level of
detail to be determined by the Risk Committee.
Risk Appetite Limit Breach
A Risk Appetite Limit breach is serious and requires prompt action at Board level.

21
In the event of a Risk Appetite Limit breach the head of risk must engage the company’s Incident and Error
Management Policy informing the Board without undue delay and in any case within 2 business days of
detection. The Board shall be briefed and furnished with a recommended plan to return to Risk Appetite.
The Board must agree actions within 3 business days of being informed of a breach. The details of the
breach and the planned actions to remedy the breach must be communicated to the Central Bank of
Ireland by the Board promptly in writing and no later than 5 business days of the Board becoming aware
of the breach. Reporting is carried out until the breach is closed, at a reporting frequency and level of
detail to be determined by the Board.
The Risk Committee and the Board of Directors are regularly and at least annually informed by a
comprehensive Risk Report and subject experts from relevant areas of the company. The Risk Report
covers all risk types and includes detailed risk metrics and other data on key risk exposures. It also captures
detailed information at the individual risk level. A dynamic Operational Risk Register is the key tool in the
management of operational risk. The risk management function engages with staff at all levels to ensure
a detailed understanding of the various operational risks to which the company is exposed. The
management of risk is further facilitated by a robust incident management policy promoting the prompt
reporting and root cause analysis of incidents and errors.
Risk and other company policies define the formal risk management and risk control requirements of the
company. The effectiveness of policies and key controls is regularly reviewed and tested.
Own Risk and Solvency Assessment (ORSA)
The company uses the Solvency II Standard Formula to quantify risks in the business. The appropriateness
of the Standard Formula is assessed as part of the Own Risk and Solvency Assessment (ORSA) process.
The ORSA is the entirety of the processes employed to identify, assess, monitor, manage, and report the
material risks that the company faces, or may face. It expresses overall solvency needs in quantitative
terms where possible, complemented by a qualitative description of the material risks.
The ORSA determines the overall capital necessary to achieve the strategic objectives of the company
under a range of scenarios, including ensuring that solvency needs are met at all times. It also considers
deviations from the assumptions underlying the SCR calculation.
The scope of the ORSA extends to all material risks and capital needs that the company faces, or may face,
and extends beyond regulatory capital requirements. The scope of the ORSA includes an assessment of:
Overall solvency needs given the risk profile, risk appetite and strategic objectives
Continuous compliance with capital requirements
The significance with which the risk profile deviates from the Capital Model
The ORSA shall be conducted in a manner that is proportional to the nature, scale and complexity of the
risks to which the company is exposed. The ORSA is conducted throughout the year on an annual cycle
and relates to a 12 month period.

22
The ORSA serves as a tool to enhance the company’s understanding of the interrelationships between its
risk profile and capital needs. The ORSA considers all reasonably foreseeable and relevant material risks,
is forward-looking and congruent with the company’s business and strategic planning.
The ORSA process encompasses governance, policy and key business processes and consequently, it relies
on frequent input from a large group of people which is facilitated by the head of risk being well embedded
in the business. Formal documentation of processes and outcomes is detailed throughout the business,
spanning various critical business processes including strategic objective setting, business planning, risk
appetite calibration, risk management and capital management. The ORSA is subject to regular
independent review, with annual review by the head of actuarial function. The conclusions drawn from
the reviews are reported to the Risk Committee and the Audit Committee. To this end, an opinion on the
ORSA is completed separately and provided to the Risk Committee and the Board of Directors for
discussion. The ORSA is owned and subject to approval by the Board of Directors on an annual basis.
B.4 Internal Control System
Description of Internal Control System
The Board of Directors is responsible for the company’s internal controls system and its effectiveness. The
system is designed to manage rather than eliminate the risk of failure to achieve business objectives, and
can provide only reasonable and not absolute assurance against material misstatement and/or loss. In
accordance with the Central Bank of Ireland Corporate Governance Requirements for Insurance
Undertakings 2015, the Board of Directors confirms that there is an on-going and regularly reviewed
process for identifying, evaluating and managing any significant risks faced by the company. The key risk
management and internal control layers that provide strong assurance to the Board of Directors include:
Board Committees (as previously mentioned).
An internal audit function and internal control framework which includes senior management whose main role is to identify, keep under review and manage significant internal control risks facing the company.
Underpinning all aspects of the business is a robust risk management function that oversees a risk management framework which includes the operation of approved risk management policies in the areas of underwriting, reinsurance, claims reserving and investments.
A robust compliance function that oversees compliance and a regulatory governance framework providing assurance that the company operates in a transparent, controlled and compliant manner.
A legal function that identifies legal risks, providing legal advice across all business units and promotes the value of in-house legal services.
A comprehensive system of functional level controls that are overseen by the various heads of functions including, inter alia, financial controls incorporating budgeting, periodic financial reporting and variance analysis.
Operational controls such as Physical Access Controls, IT Controls, Policies and Procedures, Four Eye Reviews, Segregation of Duties and Authorisation Limits.
All of the above layers are reinforced by skilled and experienced management and employees who
operate within an organisation structure of clearly defined lines of responsibility and authority.

23
The various layers of governance and control functions help to ensure that risks applicable to the company
are identified and appropriately managed and internal controls are in place and are operating effectively.
Supporting these layers of oversight are a number of internal controls that are pervasive across the
organisation.
Description of how the compliance function is implemented
Position within IPB Insurance
The compliance function is led by the head of compliance. The head of compliance is responsible for the
compliance function and reports to the Finance Director with additional reporting lines directly to the CEO
and Board of Directors. The role of the head of compliance includes both the management of regulatory
matters and the oversight of the implementation of relevant legislation by Management as required
within the business. This is with the co-operation and strong participation of Management within that
process particularly with respect to the day to day operational requirements which are the responsibility
of Management.
The head of compliance is an invitee to the Board of Directors, Audit Committee and the Risk Committee
and the Remuneration and Nomination Committee, as required. The head of compliance retains direct
access to the Board of Directors should the need arise.
Rights & Powers
The compliance team is given independence and sufficient authority and resources to enable it to carry
out its tasks in an effective manner. The compliance team has a right on its own initiative, subject to the
authority of the Finance Director or the CEO or the Chairman of the Audit Committee or the Board as
appropriate in the circumstances, to obtain access to all information necessary to carry out its activities,
and all employees have a corresponding duty in consultation with their manager or respective leadership
team representative to co-operate in supplying this information.
Roles & Responsibilities
The role of the compliance function is to provide sufficient assurances to the Board of Directors to enable
it and its members to discharge its statutory duties to ensure compliance with relevant obligations. The
compliance function reports monthly to the Board of Directors via the Monthly Compliance Report. The
compliance function is responsible for the following as set out in its Departmental Compliance Manual:
Compliance Management, Oversight and Reporting
Code of Corporate Governance / Annual Compliance Statement
Regulatory Review / Monitoring
Compliance Risk Management
Operations Compliance
Legislative Obligation Register / Compliance Framework
Regulatory Examinations
Customer Complaints
Whistle-blowing Policy
Fraud Reporting and Investigation as detailed within the company’s Fraud Policy.

24
B.5 Internal Audit Function
Description of how the internal audit function is implemented
Position within IPB Insurance
The role of the internal audit function is to provide independent, objective assurance in relation to the
effectiveness of the company’s internal control system. At present, the internal audit Function is
outsourced to KPMG with an Engagement Letter and contract governing the related relationship.
The company’s internal audit function’s primary reporting responsibility is to the Chair of the Audit
Committee. The internal audit function also reports directly to the CEO and/or Audit Committee on
findings in respect of the above or other material considerations which may come to light. In addition, it
may address such issues with the appropriate level of senior management and will have direct access to
the Chairman of the Board of Directors. It also engages with the head of compliance as relationship
manager for this outsourced function with a view to ensuring that the function operates effectively within
the company and is supported by Management.
Roles & Responsibilities
The primary role of the internal audit function is to ensure that the internal audit process is performed
for the company in an efficient and effective manner. The internal audit functions are carried out using a
risk-based approach, and addresses:
Compliance – adherence to legislation, as well as to the company’s established policies, standards, and procedures
Operational - the quality of formal policies, standards, and procedures, and the quality of management, efficiency of operations, the design and maintenance or the adequacy of procedures and internal controls
Integrity – systems integrity and soundness, including design and implementation, fraud, monitoring of employee activities, and the reliability and integrity of financial matters
Safeguard of Assets – reasonable assurance regarding prevention, timely detection of unauthorised acquisition, use or disposition of the company’s assets.
Description of how its independence and objectivity is maintained
As a role involving performance of a control function, the internal audit function operates independently
of the business units of the company. The internal audit function will be given independence and sufficient
authority and resources to enable it to carry out its tasks in an effective manner.
Should the internal audit function conclude that its independence and/or authority has been
compromised, these concerns should be brought to the attention of the CEO and/or the Board of
Directors.
The Audit Committee carries out an assessment of the independence of the internal audit function on an
annual basis.

25
B.6 Actuarial Function
Description of how the actuarial function is implemented
Position within IPB Insurance
The actuarial function is led by the head of actuarial function (HoAF). The HoAF is responsible for the
effective delivery of the actuarial function and reports to the Finance Director with additional reporting
lines directly to the CEO and Board of Directors. The HoAF role includes provision of regulatory related
material (required actuarial reports and supporting analysis) and other day-to-day tasks around pricing
and general reserve management.
The HoAF is an invitee to the Board of Directors, Audit Committee and the Risk Committee, as required.
The HoAF retains direct access to the Board of Directors should the need arise.
Rights & Powers
The actuarial team operates with independence in the assessment of the reserves and has access to all
information required in the performance of this function.
Roles & Responsibilities
The main role of the actuarial function is to provide required regulatory assessments for the company,
including an opinion on the technical provisions of the company, with formal sign-off to the Central Bank
of Ireland in the form of the actuarial opinion on Technical Provisions accompanied by the actuarial report
on Technical Provisions. Other statutory opinions provided annually include the actuarial opinion on the
ORSA, the actuarial opinion on underwriting and the actuarial opinion on reinsurance.
The actuarial function provide quantitative information required for the ORSA, including assessments of
the SCR under forward looking scenarios and stress testing. Other input includes contributing to the
identification and assessment of risks to which the company is exposed.
In addition, the actuarial function conducts many day-to-day tasks for the company, including providing
independent pricing valuations, involvement in reinsurance renewals and calculation of the technical
provisions on a quarterly basis.
Potential conflicts of interest between the responsibilities specified under Solvency II regulation, and
other day-to-day activities have been addressed by:
Personal performance of HoAF is not based on measures that conflict with the independence of opinions
The HoAF does not have reporting lines in to Underwriting or Reinsurance
The HoAF has day to day reporting lines to the Finance Director, CEO and overall to the Board of Directors with the prerogative to raise issues directly with the Board of Directors if required
The HoAF does not have direct responsibility for premium rates or reinsurance purchase
All pricing / reinsurance decisions are subject to approval by committees and its Board of Directors.

26
B.7 Outsourcing
Under Article 51(1) of S.I. No. 485 of 2015, organisations are required to remain fully responsible for
discharging their legal and regulatory obligations when outsourcing functions to third parties.
In order to ensure that this obligation is adhered to, the company has documented an Outsourcing Policy
which sets out the process to be followed when appointing third party outsource service providers, the
required contents of Service Level Agreements with the providers and guidance as to how adherence to
service standards documented in Service Level Agreements should be monitored, including the
performance of audits of service providers as is required by the nature of the outsourced service. The
Outsourcing Policy is regularly reviewed, updated and approved by the Board of Directors.
As stated above, the internal audit function is outsourced to KPMG, Ireland. The company has the
following additional key outsourced services:
Supplier Name Description of Service Provided
Lansdowne Risk Solutions Ltd, Ireland Risk Survey Provider
Nigel Dawkins, Ireland Risk Survey Provider
Acacia, Ireland Café/Building Maintenance
Expert Payroll, Ireland Payroll
Another 9, Ireland Cloud Backup Services
B.8 Assessment of Governance The company completes an annual corporate governance code review assessing its compliance with the
Corporate Governance Requirements for Insurance Undertakings 2015 providing the company with an
opportunity to assess itself and evidence its compliance with these requirements annually. Where there
are changes to the business strategy that may result in changes to internal processes and products,
processes exist such as the New Product Approval Process to ensure the effective inclusion of all areas of
the business to assess both the impact and risk of such changes to the business model. There is also
ongoing assessment of internal controls that support the company’s effective decision making and
governance through the company internal audit programme, the compliance monitoring and review
programme and the risk review programme. These individual review programmes provide their outputs
to the Board of Directors and its Committees as part of the regular reporting issued by each function. The
Board of Directors of the company are responsible for the oversight and effective implementation of best
practices as well as regulatory requirements for corporate governance within the company. The regular
internal review carried out on the company’s system of governance is in accordance with Regulation 44(3)
and 44(9) of SI.485.

27
The company has no further information to disclose relevant to its systems of governance.
C: Risk Profile
Risk Management Objectives and Risk Profiles
The risk management function is led by the head of risk and is responsible for the design and
implementation of the risk management system. It oversees the identification, measurement,
management, reporting and monitoring of all risk types. The company’s risk profile is stable and is
currently dominated by underwriting risk and market risk. Other key risks which the company faces
includes credit, liquidity, operational, strategic and reputational risks. The risk management function
reports to the Finance Director with additional reporting lines directly to the CEO and Board of Directors.
The key internal risk metric is the Solvency II SCR (“Solvency Capital Requirement”) which quantifies the
key risks to the business. The SCR is calibrated to a level which is broadly consistent with a 1 in 200 year
event over a 12 month time horizon. The SCR facilitates the quantification of risk at the individual risk
level and allows for diversification between risk types.
C.1 Underwriting Risk
Underwriting risk is the key risk type to which the company is exposed and arises from uncertainty in the
occurrence, amounts and timing of non-life insurance obligations. The key risk associated with any
insurance contract is the possibility that an insured event occurs and that the timing and amount of actual
claim payments differ from expectations. The principal lines of business covered by the company include
public liability, employers’ liability, motor and property. The company manages underwriting risk through
its underwriting strategy, claims handling and reinsurance arrangements. Insurance obligations can take
many years to settle and the company sets aside reserves to cover all past liabilities. There is a risk that
the cost of these liabilities may be higher than anticipated, in some cases significantly so.
Risk Exposure
Underwriting risk is restricted to lines and territories where the company has an underwriting
competency. Where regulations permit, policy limits are set at a level to mitigate the impact of extreme
loss experience to a manageable proportion of capital.
The key underwriting risk metric is the Net Loss Ratio. This assesses claim performance versus premium
earned. It is recognised that the insurance cycle, exceptional individual losses, catastrophes, the inherent
volatility of insurance losses and other dynamics will cause underwriting performance to fluctuate over
time. Whilst the company will tolerate a degree of short term volatility, a more stringent standard is set
in the longer term. As at the 31 December 2016, the company’s net loss ratio stood at 88.9%.
Risk Concentration
As a niche mutual insurer the company is susceptible to claim aggregation due to policyholders being
concentrated by type, risk exposures and other factors. Most underwriting risk is concentrated in the
Republic of Ireland. Recent expansion into Northern Ireland will serve to diversify the portfolio
geographically to a limited extent. Business is also concentrated by line of business, being predominantly
Public Liability, though there are material volumes of Employers Liability, Property and Commercial

28
Motor. Smaller volumes of Personal Motor, Professional Indemnity and other lines offer further diversity.
The other significant insurance risk concentration relates to the fact that the company primarily insures
public sector organisations. While keeping the insurance needs of Members at the top of the agenda, the
company endeavours to apply core underwriting competencies to further diversify the insurance portfolio
into complementary lines and policyholders. In any case, concentrations are actively managed and are
significantly mitigated by an appropriate reinsurance programme.
Risk Mitigation
The Underwriting Policy which is approved by the Board of Directors, establishes the underwriting
strategy and principles and it defines underwriting limits, risk selection, authorities, escalation procedures
and actuarial review requirements. It is implemented by means of underwriting guidelines. As with all
company policies, the Underwriting Policy, together with, the underwriting approval limits set out in the
company’s Authorisation Levels and Signatories, are reviewed on an annual basis to ensure their
continued effectiveness. The company has developed its underwriting strategy to diversify the type of
insurance risks written, and within each of the types of risk, to achieve a sufficiently large population of
risks to reduce the variability of the expected outcome. The underwriting strategy includes the
employment of appropriately qualified underwriting personnel, the targeting of certain types of business,
constant review of pricing policy using up-to-date statistical analysis and claims experience and the
surveying of risks carried out by experienced personnel.
The Reinsurance Policy which is approved by the Board of Directors establishes the reinsurance strategy
and principles. The extensive reinsurance programme, delivered by a well-diversified panel of high quality
Reinsurers, reduces the variability of the underwriting result. For its motor, employers’ liability and public
liability business, the company has in place excess of loss reinsurance treaties. For its property business,
the company operates proportional and catastrophe reinsurance treaties. Again, the Reinsurance Policy,
together with, the relevant approval limits set out in the company’s Authorisation Levels and Signatories,
are reviewed on an annual basis to ensure their continued effectives.
A primary objective of the company is to ensure that sufficient reserves are available to cover liabilities.
The company uses an in-house actuarial team supported by external reviews to assist with the estimation
of liabilities to ensure that the company’s reserves are adequate and there is oversight of the reserving
process through internal management and Board committees. The company holds a margin for
uncertainty in addition to best estimate reserves to reduce the likelihood of inadequate reserves
materialising.
C.2 Market Risk
Market risk arises from financial instrument market price volatility. It reflects the structural mismatch
between assets and liabilities, particularly with respect to duration. It includes interest rate risk, equity
risk, property risk, spread risk, currency risk and asset concentrations.
Prudent Person Principle
Company assets are invested in highly rated investments in accordance with the “prudent person
principle”. Investment decisions are made in the best interests of policyholders and other beneficiaries.

29
Consequently, the fundamental objective is that all valid claims and expenses are paid as they fall due. In
practice, assets are allocated into two notional portfolios which have different objectives – The Matched
Portfolio and The Risk Portfolio.
The Matched Portfolio
The primary investment objective of the matched portfolio is to ensure that the company meets
policyholder obligations as they fall due. This implies high quality, secure and liquid investments with
characteristics that approximately match those of the liabilities. The secondary investment objective of
the Matched Portfolio is to maximise investment returns over the long term in order to contribute to long
term profitability, subject to a pre-defined and limited risk appetite as per the Risk Appetite Statement.
The performance of the Matched Portfolio will be assessed on a total return basis against a benchmark
portfolio which approximates to a risk free portfolio with a duration profile equal to that of the liabilities.
The Risk Portfolio
The risk portfolio is composed of all investments that are surplus to the Matched Portfolio. The primary
investment objective of the risk portfolio is to contribute to long term profitability through investment
returns. The secondary investment objectives of the risk portfolio are capital preservation, diversification
of the overall portfolio and facilitation of the long term strategic objectives of the company, subject to a
pre-defined and limited risk appetite. The performance of the risk portfolio is assessed on a total return
basis against a combination of published benchmark indices which together approximate to the profile of
the Risk Portfolio in terms of asset classes, territories, duration and other characteristics.
Risk Exposure
The level of surplus assets currently in the business results in a risk profile that has a significant weighting
towards market risk. The principal market risk relates to equity holdings. The company invests only in
assets and instruments whose risks can be properly identified, monitored, managed and taken into
account in the assessment of solvency. The company follows a high quality, low risk investment strategy
aligned to the prudent person principle. The focus is on high quality bonds and cash, with limited holdings
in equities and property.
Interest Rate Risk
Interest rate risk relates to the sensitivity of the values of assets and liabilities to changes in the term
structure of interest rates. The company faces a significant interest rate risk due to the nature of its
investments and liabilities. Interest rate risk arises primarily from the company’s investments in fixed
interest debt securities and from insurance liabilities.
As at 31 December 2016, the company had the following assets that are exposed to interest rate risk as
per the IFRS Financial statements:

30
Equity Risk
Equity risk relates to the volatility of equity market prices. This volatility may be caused by factors specific
to the individual financial instrument, factors specific to the issuer or factors affecting all similar financial
instruments traded in the market. Equity risk excludes changes due to currency movements, which is
considered as a separate risk type. The company is subject to equity risk due to changes in the market
values of its holdings of quoted shares, unquoted shares and managed funds.
Property Risk
Property risk relates to the volatility of real estate market prices. The company is subject to property risk
due to changes in the market values of its investment properties.
Spread Risk
Spread risk mainly relates to changes in the market value of bonds due to changes in the credit standing
of the issuer. The company limits the credit quality of bonds in which it may invest.
The following table provides information as per the IFRS Financial statements regarding the market risk
exposure of the company by classifying debt securities by credit ratings as at 31 December 2016:
Currency Risk
Currency risk relates to the sensitivity of the value of assets and liabilities to changes in currency exchange
rates. The company’s liabilities are mostly denominated in euro. The company holds investment assets in
foreign currencies, which gives rise to exposure to exchange rate fluctuations. The company is only
exposed to high-quality currencies including sterling (GBP) and Norwegian Krone (NOK).
The company has considered the impact of Brexit on its business. The company does not believe Brexit
will have a significant impact on its business given that its insurance activities are predominantly located
in the Republic of Ireland. The longer term political and economic effects of Brexit are likely to remain
Financial assets subject to interest rate risk
2016
€’000
Debt securities
- Irish Government fixed interest bonds 139,607
- Other government fixed interest bonds - eurozone 368,659
- Other government fixed interest bonds - non-eurozone 97,922
- Corporate bonds 77,126
Loans and receivables
- Loans to local authorities -
Total 683,314
Market risk exposure by credit rating Not
AAA AA A BBB BB B rated Total
2015 to 2016 €’000 €’000 €’000 €’000 €’000 €’000 €’000 €’000
Financial assets at fair value through profit or loss
Debt securities
2016 246,194 241,223 191,332 - - 24,582 31,662 734,993

31
unclear for some time however the company will continue to carefully monitor the situation as it
develops.
As at 31 December 2016, the carrying amount of the company’s foreign currency denominated assets as
per the IFRS Financial statements was as follows:
Asset Concentration
Asset concentrations arise where there is a lack of diversification, e.g. by issuer.
Risk Concentration
Assets are diversified to avoid accumulations of risk in the portfolio as a whole. In particular, the company
is not exposed to an excessive reliance on any one asset, asset class, counterparty, group of
counterparties, territory or other investment characteristic. This is achieved by concentration limits and
tolerance thresholds defined in the Risk Appetite Statement.
Risk Mitigation
Market risk is managed through the application of the company’s Investment Policy and Risk Appetite
Statement, each of which have been approved by the Board and reviewed on an annual basis. The
Investment Policy outlines how market risks are managed. Investments are limited to assets whose risks
can be properly identified, monitored and managed. The company employs appropriately qualified and
experienced personnel to manage the investment portfolio. The Risk Appetite Statement defines the
extent of permissible market risk exposures in terms of specific operational limits. It imposes limits on
quantity, currency, territory, diversification, issuer credit quality, issue credit quality, duration and other
characteristics. The company also enters into forward currency contracts to mitigate against currency risk.
Consideration is given to the additional risk that a derivative presents, therefore, derivative counterparties
are subject to minimum credit rating requirements and are required to be approved credit institutions.
The continued effectiveness of these risk mitigation techniques is regularly monitored through a series of
stress testing and scenario analysis, together with, internal audit reviews.
C.3 Credit Risk
Credit risk arises from an unexpected default or deterioration in the credit standing of counterparties and
debtors, including reinsurance and premium receivables.
Carrying amount of the company's foreign currency denominated assets
Foreign
currency
Foreign
currency
gross derivatives Net
2016 €’000 €’000 €’000
Sterling 63,124 59,539 3,585
Norwegian krone 28,017 20,275 7,742
Danish krone 20,219 19,510 709
Swedish krona 1,028 836 192
Swiss francs 6,449 6,065 384
US dollars 12,843 8,011 4,832
Total 131,680 114,236 17,444

32
Risk Exposure
The company is exposed to credit risk from its operating activities, principally customer and reinsurer
receivables, but also from cash deposits and loans to local authorities. A portion of member business is
retro-rated which allows Members to pay premium as losses are reported or paid, depending on the
contract, rather than paying all premium up front.
Risk Concentration
Credit concentration risk is managed via the company’s Risk Appetite Statement. The Risk Appetite
Statement requires diversification by reinsurance counterparty. In particular, no reinsurance counterparty
may exceed 15% of the total reinsurance asset. This limit is increased to 25% for reinsurance
counterparties with the very highest credit ratings, typically equivalent to S&P AA- or better. Limits are
also set out in the Risk Appetite Statement for cash balances with credit institutions. The limits tend to be
based on the credit quality of the approved credit institution.
Risk Mitigation
The Risk Appetite Statement sets out the operating limits for each reinsurance counterparty, cash
counterparty and other credit exposures. The Risk Appetite Statement is regularly assessed for
appropriateness and is approved by the Board of Directors annually. It is also planned to phase out retro
premiums in the future, thereby, reducing the risk in this regard.
The following table shows the carrying value of assets that are neither past due nor impaired, the ageing
of assets that are past due but not impaired, and assets that have been impaired as per the company’s
IFRS Financial statements.
C.4 Liquidity Risk
Liquidity risk is the risk that the company does not have sufficient liquid financial resources, such as cash,
to meet its financial obligations when they fall due. Liquidity risk also arises where assets can only be
liquidated at a material cost.
Risk Exposure
The company is exposed to daily calls on its cash resources, mainly for claims and other expense payments.
Neither past
due nor
impaired
Past due less
than 30 days
Past due 31
to 60 days
Past due 61
to 90 days
Past due more
than 90 days Carrying amount
2016 €’000 €’000 €’000 €’000 €’000 €’000
Debt securities 734,993 - - - - 734,993
Other investments 232,468 - - - - 232,468
Reinsurance assets (outstanding claims and receivables) 47,982 149 - 1 (15) 48,117
Loans and receivables 23,379 73 - - - 23,452
Insurance receivables 4,445 793 3,569 191 1,692 10,690
1,043,267 1,015 3,569 192 1,677 1,049,720

33
Risk Mitigation
The Investment Policy is reviewed annually for continued effectiveness and sets out the assessment and
determination of what constitutes liquidity risk for the company. Compliance with the policy is monitored
and exposures and breaches are reported to the Risk Committee. Guidelines are set for asset allocations,
portfolio limit structures and maturity profile of assets in order that sufficient funding is available to meet
insurance contract obligations. Asset liquidity is such that it is sufficient to meet cash demands under
extreme conditions. Localisation of assets is such that it ensures their availability. The Investment Policy
specifies a Contingency Funding Plan should a liquidity shortfall arise. The company has mitigated much
of its liquidity risk through asset and liability matching. The company does not forecast expected profit in
future premium (EPIFP) to cover a loss making scenario, liquidity risk in this regard is therefore not an
issue.
The following table shows the maturity analysis of financial assets and financial liabilities based on the
remaining undiscounted contractual obligations as per the company’s IFRS Financial statements.
C.5 Operational Risk
Operational risk arises from inadequate or failed internal processes, from personnel and systems, or from
external events. Operational risk includes legal and regulatory compliance risk but excludes strategic and
reputational risk. In particular, the company’s operational risk includes outsourcing risks, including
bankruptcy of the service providers, disruption of services and failure to achieve standards.
Maturity analysis (contracted Carrying Within 1 Within 1 After 5 No maturity
undiscounted cash flow basis) value year to 5 years years date Total
2016 €’000 €’000 €’000 €’000 €’000 €’000
Financial assets
Derivative financial instruments 757 757 - - - 757
Financial assets at fair value through profit or loss
Debt securities 734,993 53,768 323,646 253,592 16,029 647,035
Equity securities 232,468 - - - 232,468 232,468
Loans and receivables
Loans to local authorities 23,452 2,485 9,456 12,164 - 24,105
Deposits with credit institutions - - - - - -
Insurance assets 32,018 8,229 18,570 5,219 - 32,018
Reinsurance assets
Claims outstanding 46,313 12,903 26,107 7,303 - 46,313
Insurance receivables 12,494 12,494 - - - 12,494
Other receivables 139 139 - - - 139
Cash and cash equivalents 125,980 125,962 - - - 125,962
Total 1,208,614 216,737 377,779 278,278 248,497 1,121,291
Financial liabilities
Insurance contract liabilities
Claims outstanding 488,965 136,226 275,630 77,109 - 488,965
Derivative financial instruments 1,619 1,619 - - - 1,619
Insurance payables 3,115 3,115 - - - 3,115
Trade and other payables 9,669 9,669 - - - 9,669
Total 503,368 150,629 275,630 77,109 - 503,368

34
Risk Exposure
The company regularly reviews all major operational risks. The Risk Committee reviews the risk
assessment to ensure that all operational risks are identified and evaluated. Each operational risk is
assessed by considering the potential impact and the likelihood of the event occurring. The effectiveness
of internal controls on controlling operational risk is also measured.
Compliance monitoring is carried out on an ongoing basis, according to an annual compliance plan which
is approved by the Audit Committee.
Internal audit is carried out on a continuous basis, in accordance with a rolling internal audit plan approved
by the Audit Committee. The internal audit findings are updated on a monthly basis and circulated to the
Board of Directors.
Risk Mitigation
The company has a Business Continuity Plan for the restoration of functions should critical business
processes be disrupted. This Business Continuity Plan is reviewed semi-annually by internal management
for its continued effectiveness. As required, any changes to the plan are reviewed and approved by the
Risk Committee.
The company outsources certain functions to service providers. Outsourced arrangements are governed
by service level agreements. Service providers are required to adhere to company policy. Service providers
are subject to detailed reporting requirements.
Over the last 12 months the company has been working to develop its maturity in the field of Information
Security and implemented numerous administrative and technical procedures and controls to improve
the company’s security stance.
C.6 Other Material Risks
Other risks to which the company is exposed include strategic risk, reputational risk.
Strategic Risk
Strategic risk arises from adverse business strategies, failure to implement business strategies and
unanticipated changes in the business environment.
The company takes its strategic direction from the Board of Directors which monitors progress against the
business plan which is reviewed annually and is subject to Board approval. The company monitors changes
in the business environment and considers their impact on the business. The company also considers the
implications that changes in the operating model might have for the quality and efficiency of the service
that is provided to Members and other policyholders. Other strategic considerations relate to the efficient
use of capital and the company’s ability to raise capital in the medium-to-long-term.
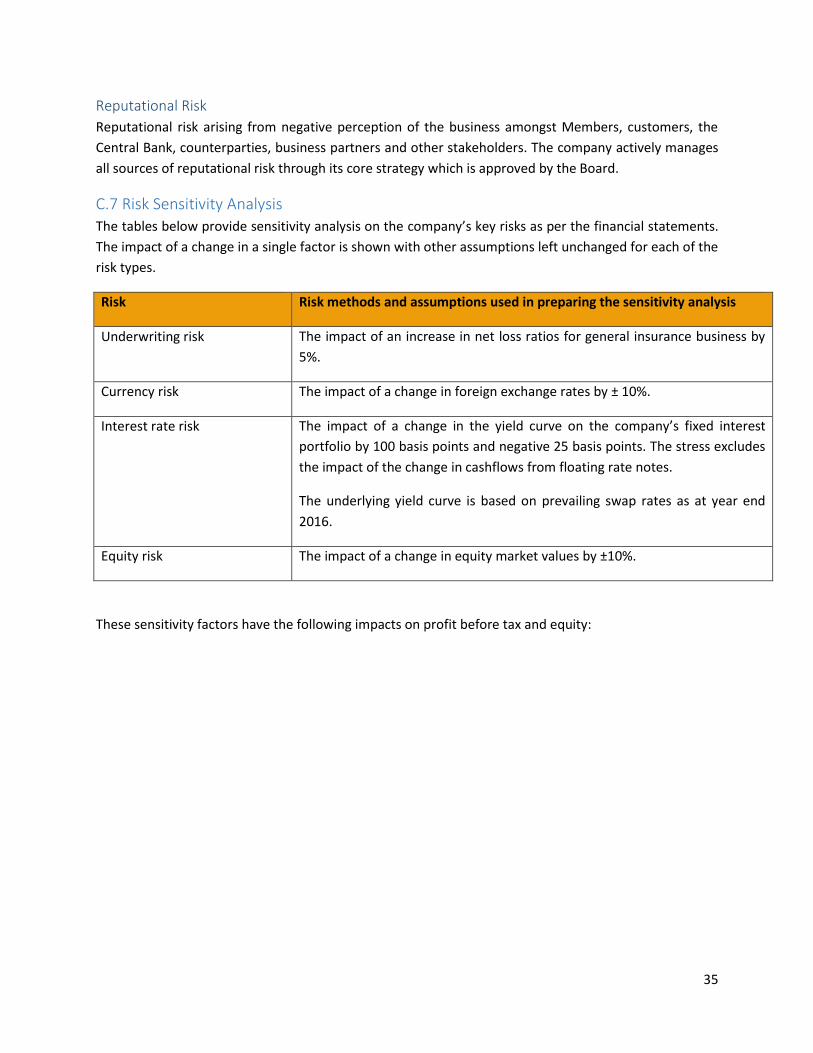
35
Reputational Risk
Reputational risk arising from negative perception of the business amongst Members, customers, the
Central Bank, counterparties, business partners and other stakeholders. The company actively manages
all sources of reputational risk through its core strategy which is approved by the Board.
C.7 Risk Sensitivity Analysis
The tables below provide sensitivity analysis on the company’s key risks as per the financial statements.
The impact of a change in a single factor is shown with other assumptions left unchanged for each of the
risk types.
Risk Risk methods and assumptions used in preparing the sensitivity analysis
Underwriting risk The impact of an increase in net loss ratios for general insurance business by
5%.
Currency risk The impact of a change in foreign exchange rates by ± 10%.
Interest rate risk The impact of a change in the yield curve on the company’s fixed interest
portfolio by 100 basis points and negative 25 basis points. The stress excludes
the impact of the change in cashflows from floating rate notes.
The underlying yield curve is based on prevailing swap rates as at year end
2016.
Equity risk The impact of a change in equity market values by ±10%.
These sensitivity factors have the following impacts on profit before tax and equity:
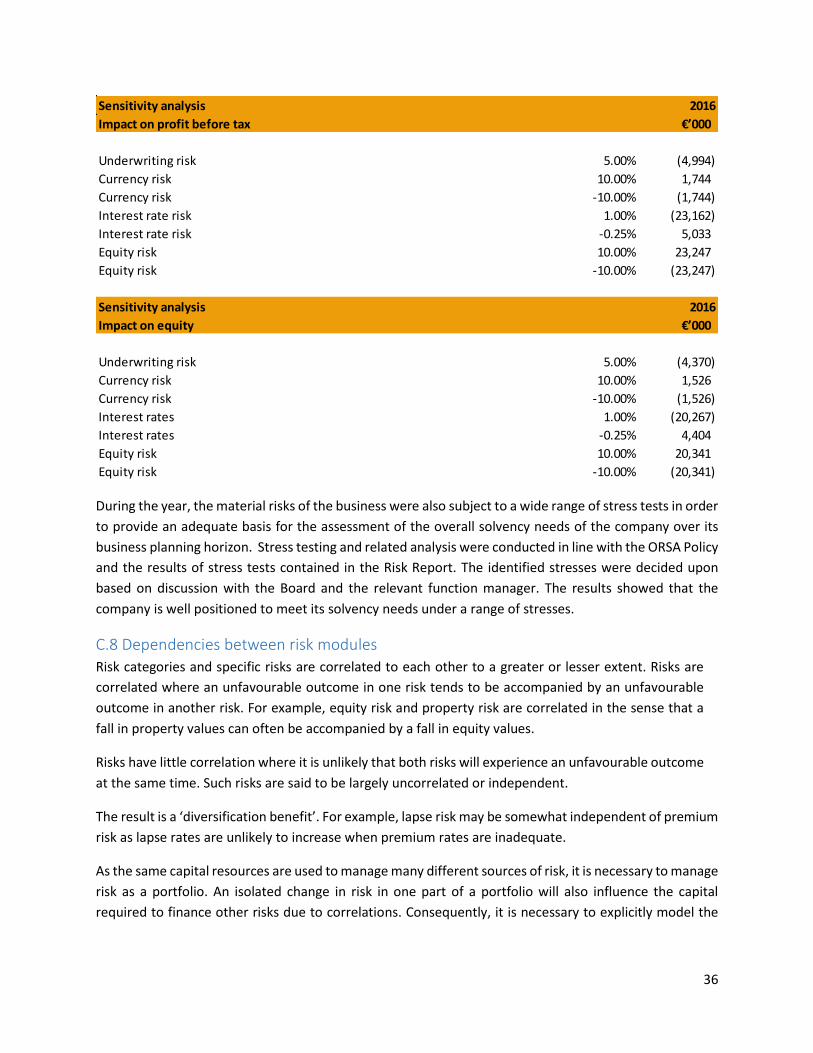
36
During the year, the material risks of the business were also subject to a wide range of stress tests in order
to provide an adequate basis for the assessment of the overall solvency needs of the company over its
business planning horizon. Stress testing and related analysis were conducted in line with the ORSA Policy
and the results of stress tests contained in the Risk Report. The identified stresses were decided upon
based on discussion with the Board and the relevant function manager. The results showed that the
company is well positioned to meet its solvency needs under a range of stresses.
C.8 Dependencies between risk modules
Risk categories and specific risks are correlated to each other to a greater or lesser extent. Risks are
correlated where an unfavourable outcome in one risk tends to be accompanied by an unfavourable
outcome in another risk. For example, equity risk and property risk are correlated in the sense that a
fall in property values can often be accompanied by a fall in equity values.
Risks have little correlation where it is unlikely that both risks will experience an unfavourable outcome
at the same time. Such risks are said to be largely uncorrelated or independent.
The result is a ‘diversification benefit’. For example, lapse risk may be somewhat independent of premium
risk as lapse rates are unlikely to increase when premium rates are inadequate.
As the same capital resources are used to manage many different sources of risk, it is necessary to manage
risk as a portfolio. An isolated change in risk in one part of a portfolio will also influence the capital
required to finance other risks due to correlations. Consequently, it is necessary to explicitly model the
Sensitivity analysis 2016
Impact on profit before tax €’000
Underwriting risk 5.00% (4,994)
Currency risk 10.00% 1,744
Currency risk -10.00% (1,744)
Interest rate risk 1.00% (23,162)
Interest rate risk -0.25% 5,033
Equity risk 10.00% 23,247
Equity risk -10.00% (23,247)
Sensitivity analysis 2016
Impact on equity €’000
Underwriting risk 5.00% (4,370)
Currency risk 10.00% 1,526
Currency risk -10.00% (1,526)
Interest rates 1.00% (20,267)
Interest rates -0.25% 4,404
Equity risk 10.00% 20,341
Equity risk -10.00% (20,341)

37
correlations between risks. The quantification of correlations is highly uncertain and the capital model
relies on the ‘dependency structure’ defined in the Solvency II Standard Formula Technical Specification.
The company’s Risk Report includes quantification of the diversification benefits assumed in the capital
model and the appropriateness of this is tested on an annual basis as part of the ORSA process.
C.9 Any other information
The company does not use any special purpose vehicles (SPV) to transfer any of its risks.
D: Valuation for Solvency Purposes
D.1 Assets
The following table analyses the valuation of the company’s assets as at 31 December 2016 for both
Solvency II purposes and financial statements purposes:
Ref Asset Category Solvency II
€’000
Financial
statements
€’000
Difference
€’000
1 Intangible Asset 0 566 (566)
2 Deferred Tax Asset 0 142 (142)
3 Property, plant and
equipment (PPE)
0 816 (816)
4 Investment Properties 92,739 92,575 164
5 Listed Equities 195,251 181,220 14,031
6 Unlisted Equities 3,265 3,263 2
7 Government Bonds 621,689 617,173 4,516
8 Corporate Bonds 93,809 117,820 (24,011)
9 Collateralised Securities 3,068 0 3,068
10 Collective Investment
Undertakings
55,808 47,985 7,823
11 Derivatives 113,372 757 112,615
12 Deposits 81,918 0 81,918
13 Loans to local authorities 23,452 23,452 0

38
14 Reinsurance Recoverable 36,826 46,313 (9,487)
15 Insurance Receivables 10,689 42,708 (32,019)
16 Reinsurance Receivables 1,804 1,804 0
17 Trade Receivables 7,074 7,365 (291)
18 Cash & Cash Equivalents 44,061 125,980 (81,919)
19 Other 0 7,540 (7,540)
Total Assets 1,384,825 1,317,479 67,346
Description of the basis, methods and assumptions used for valuation:
Ref Asset
Category
Solvency II Financial statements
1 Intangible
Asset
The company’s intangible assets
comprise of IT software which does not
meet the criteria under Solvency II
valuation rules, i.e. it cannot be sold
separately and there is not a quoted
market price in an active market for the
same or similar intangible assets.
Therefore, the company’s intangible
assets are valued at zero under Solvency
II.
In the IFRS financial
statements the intangible
assets are valued at cost less
accumulated amortisation
and accumulated
impairment losses.
2 Deferred Tax
Asset
For the company, the difference between
the deferred tax asset in the IFRS
financial statements and the deferred tax
liability created under Solvency II
pertains to the deferred tax on the
changes in valuation in moving from IFRS
to Solvency II. That is, it is largely driven
by the reduction in the (net) technical
provisions under Solvency II. This would
result in an instantaneous profit, which
would incur corporation tax at 12.5%.
Deferred tax assets and
liabilities are measured at
the tax rates that are
expected to apply to the
period when the asset is
realised or the liability is
settled, based on the tax
rates and tax laws that have
been enacted or
substantively enacted by the
end of the reporting period.
3 Property,
plant and
Under Solvency II, the valuation of PPE is
based on the core principle in the
In the IFRS financial
statements, the company
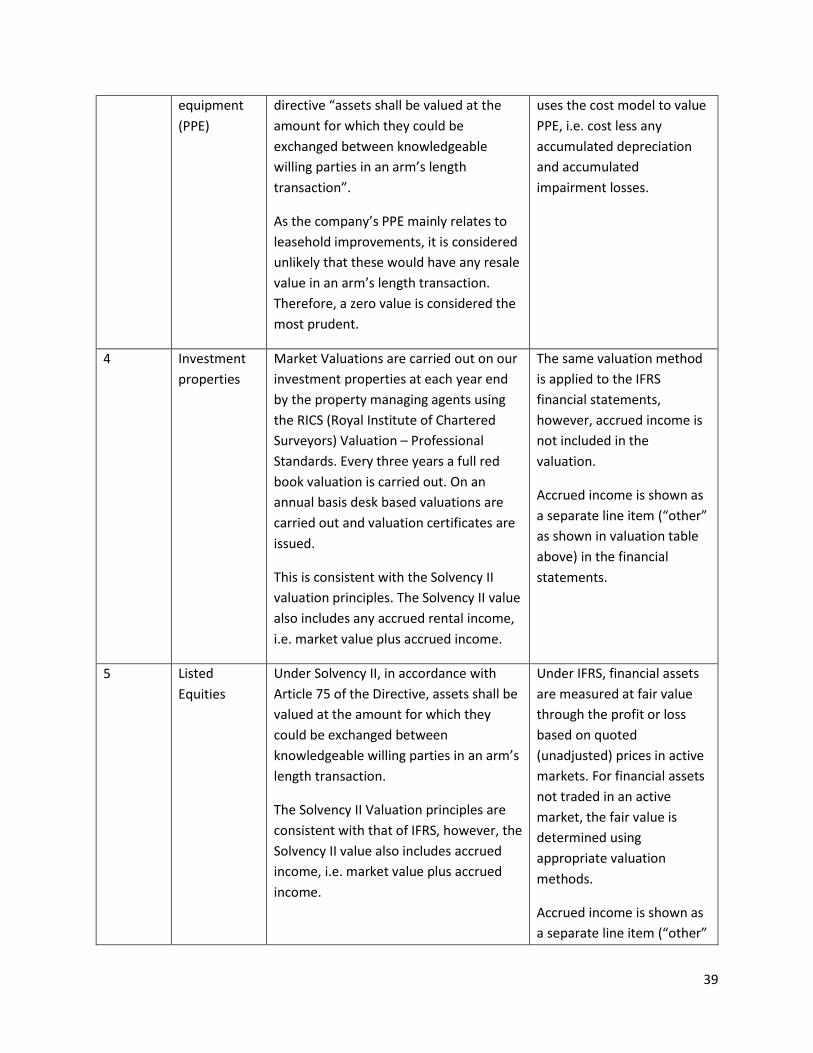
39
equipment
(PPE)
directive “assets shall be valued at the
amount for which they could be
exchanged between knowledgeable
willing parties in an arm’s length
transaction”.
As the company’s PPE mainly relates to
leasehold improvements, it is considered
unlikely that these would have any resale
value in an arm’s length transaction.
Therefore, a zero value is considered the
most prudent.
uses the cost model to value
PPE, i.e. cost less any
accumulated depreciation
and accumulated
impairment losses.
4 Investment
properties
Market Valuations are carried out on our
investment properties at each year end
by the property managing agents using
the RICS (Royal Institute of Chartered
Surveyors) Valuation – Professional
Standards. Every three years a full red
book valuation is carried out. On an
annual basis desk based valuations are
carried out and valuation certificates are
issued.
This is consistent with the Solvency II
valuation principles. The Solvency II value
also includes any accrued rental income,
i.e. market value plus accrued income.
The same valuation method
is applied to the IFRS
financial statements,
however, accrued income is
not included in the
valuation.
Accrued income is shown as
a separate line item (“other”
as shown in valuation table
above) in the financial
statements.
5 Listed
Equities
Under Solvency II, in accordance with
Article 75 of the Directive, assets shall be
valued at the amount for which they
could be exchanged between
knowledgeable willing parties in an arm’s
length transaction.
The Solvency II Valuation principles are
consistent with that of IFRS, however, the
Solvency II value also includes accrued
income, i.e. market value plus accrued
income.
Under IFRS, financial assets
are measured at fair value
through the profit or loss
based on quoted
(unadjusted) prices in active
markets. For financial assets
not traded in an active
market, the fair value is
determined using
appropriate valuation
methods.
Accrued income is shown as
a separate line item (“other”

40
Note: Preference shares are included as
equities under Solvency II. Exchange
traded funds (ETFs) and collateralised
securities are excluded.
as shown in valuation table
above) in the financial
statements.
Dividend withholding tax
recoverable is shown as
trade receivable under IFRS.
6 Unlisted
Equities
Under Solvency II, in accordance with
Article 75 of the Directive, assets shall be
valued at the amount for which they
could be exchanged between
knowledgeable willing parties in an arm’s
length transaction.
The Solvency II Valuation principles are
consistent with that of IFRS, however, the
Solvency II value also includes accrued
income, i.e. market value plus accrued
income.
Under IFRS, financial assets
are measured at fair value
through the profit or loss
based on quoted
(unadjusted) prices in active
markets. For financial assets
not traded in an active
market, the fair value is
determined using
appropriate valuation
methods.
Accrued income is shown as
a separate line item (“other”
as shown in valuation table
above) in the financial
statements.
7 Government
Bonds
Under Solvency II, in accordance with
Article 75 of the Directive, assets shall be
valued at the amount for which they
could be exchanged between
knowledgeable willing parties in an arm’s
length transaction.
The Solvency II Valuation principles are
consistent with that of IFRS, however, the
Solvency II value also includes accrued
income, i.e. market value plus accrued
income.
Under IFRS, financial assets
are measured at fair value
through the profit or loss
based on quoted
(unadjusted) prices in active
markets. For financial assets
not traded in an active
market, the fair value is
determined using
appropriate valuation
methods.
Accrued income is shown as
a separate line item (“other”
as shown in valuation table

41
above) in the financial
statements.
8 Corporate
Bonds
Under Solvency II, in accordance with
Article 75 of the Directive, assets shall be
valued at the amount for which they
could be exchanged between
knowledgeable willing parties in an arm’s
length transaction.
The Solvency II Valuation principles are
consistent with that of IFRS, however, the
Solvency II value also includes accrued
income, i.e. market value plus accrued
income.
Under IFRS, financial assets
are measured at fair value
through the profit or loss
based on quoted
(unadjusted) prices in active
markets. For financial assets
not traded in an active
market, the fair value is
determined using
appropriate valuation
methods.
Accrued income is shown as
a separate line item (“other”
as shown in valuation table
above) in the financial
statements.
Note: Preference shares are
classified as corporate bonds
under IFRS.
9 Collateralised
Securities
Under Solvency II, in accordance with
Article 75 of the Directive, assets shall be
valued at the amount for which they
could be exchanged between
knowledgeable willing parties in an arm’s
length transaction.
The Solvency II Valuation principles are
consistent with that of IFRS, however, the
Solvency II value also includes accrued
income, i.e. market value plus accrued
income.
Under IFRS, financial assets
are measured at fair value
through the profit or loss
based on quoted
(unadjusted) prices in active
markets. For financial assets
not traded in an active
market, the fair value is
determined using
appropriate valuation
methods.
Accrued income is shown as
a separate line item (“other”
as shown in valuation table
above) in the financial
statements.

42
Note: Collateralised
securities are classified as
equity securities in the IFRS
financial statements.
10 Collective
Investment
Undertakings
Under Solvency II, in accordance with
Article 75 of the Directive, assets shall be
valued at the amount for which they
could be exchanged between
knowledgeable willing parties in an arm’s
length transaction.
The Solvency II Valuation principles are
consistent with that of IFRS, however, the
Solvency II value also includes accrued
income, i.e. market value plus accrued
income.
Exchange traded funds (ETFs) are
included in this category under Solvency
II.
Under IFRS, financial assets
are measured at fair value
through the profit or loss
based on quoted
(unadjusted) prices in active
markets. For financial assets
not traded in an active
market, the fair value is
determined using
appropriate valuation
methods.
Accrued income is shown as
a separate line item (“other”
as shown in valuation table
above) in the financial
statements.
Note: ETFs are classified as
equity securities in the IFRS
financial statements.
11 Derivatives Under Solvency II, derivative financial
instruments are measured at the gross
fair value as at the reporting date. The
company’s derivative financial
instruments relate to forward currency
contracts. All forward sales are shown as
assets and all forward purchases are
shown as liabilities.
Under IFRS, derivatives are
initially measured at fair
value on the date the
contract is entered into, and
subsequently re-measured
at fair value at the reporting
date. Each derivative is
carried as a financial asset
when the fair value is
positive and as a financial
liability when the fair value is
negative.
12 Deposits Under Solvency II, this relates to deposits
other than cash and cash equivalents that
cannot be used to make payments until
Under IFRS, deposits
classified as “loans and
receivables” relate to
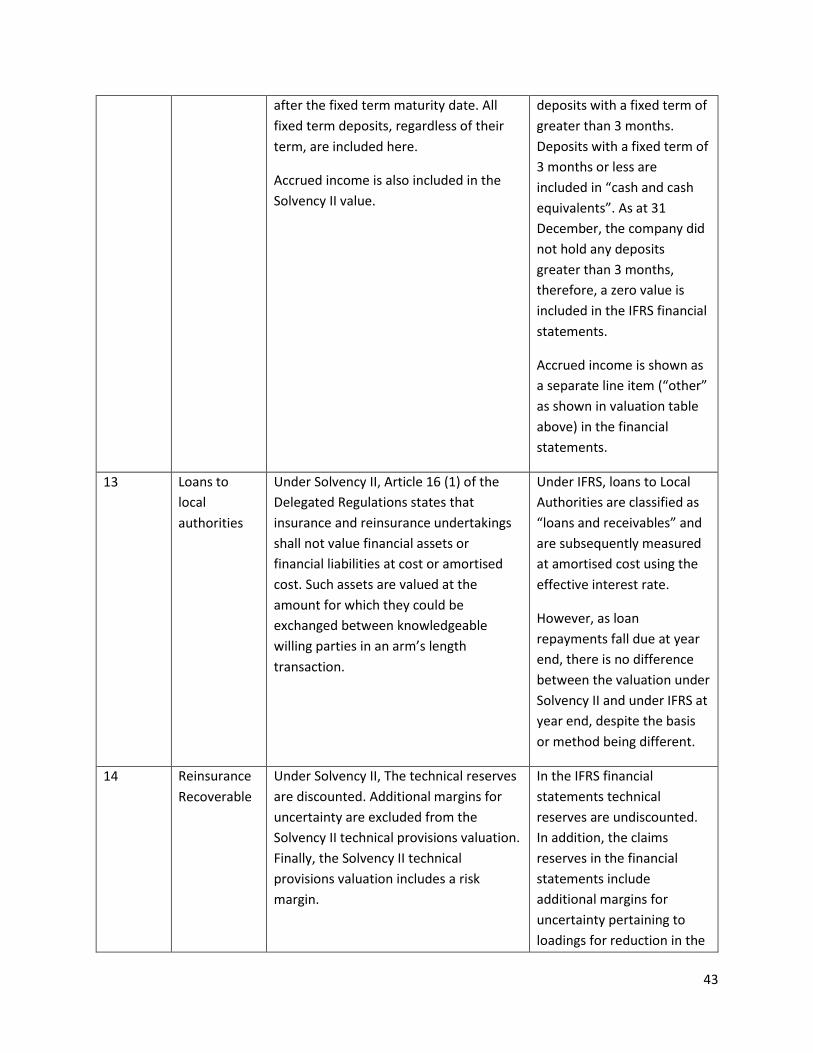
43
after the fixed term maturity date. All
fixed term deposits, regardless of their
term, are included here.
Accrued income is also included in the
Solvency II value.
deposits with a fixed term of
greater than 3 months.
Deposits with a fixed term of
3 months or less are
included in “cash and cash
equivalents”. As at 31
December, the company did
not hold any deposits
greater than 3 months,
therefore, a zero value is
included in the IFRS financial
statements.
Accrued income is shown as
a separate line item (“other”
as shown in valuation table
above) in the financial
statements.
13 Loans to
local
authorities
Under Solvency II, Article 16 (1) of the
Delegated Regulations states that
insurance and reinsurance undertakings
shall not value financial assets or
financial liabilities at cost or amortised
cost. Such assets are valued at the
amount for which they could be
exchanged between knowledgeable
willing parties in an arm’s length
transaction.
Under IFRS, loans to Local
Authorities are classified as
“loans and receivables” and
are subsequently measured
at amortised cost using the
effective interest rate.
However, as loan
repayments fall due at year
end, there is no difference
between the valuation under
Solvency II and under IFRS at
year end, despite the basis
or method being different.
14 Reinsurance
Recoverable
Under Solvency II, The technical reserves
are discounted. Additional margins for
uncertainty are excluded from the
Solvency II technical provisions valuation.
Finally, the Solvency II technical
provisions valuation includes a risk
margin.
In the IFRS financial
statements technical
reserves are undiscounted.
In addition, the claims
reserves in the financial
statements include
additional margins for
uncertainty pertaining to
loadings for reduction in the

44
discount rate and the
introduction of Periodic
Payment Orders (PPOs) as
well as a loading
representing a general
provision for changes in the
claims environment.
15 Insurance
Receivables
Insurance receivables relates to
insurance debtors only measured at their
carrying value as at the reporting date.
Under Solvency II rules ‘provision for
recoverable retro premium’ is reclassified
out of assets to be recognised as a cash
inflow offsetting the Best Estimate
Technical Provision in liabilities. The
valuation of these cash inflows has
changed to a discounted basis consistent
with the cash outflows and in line with
Solvency II valuation principles.
In the IFRS financial
statements a provision for
premium adjustments for
retrospectively rated policies
is recognised when provision
is made for related losses.
The valuation basis for
insurance debtors, on the
other hand, is consistent
with the Solvency II
valuation principles and
therefore, no valuation
difference arises.
16 Reinsurance
Receivables
Insurance receivables relates to
reinsurance debtors, measured at their
carrying value as at the reporting date.
In the IFRS financial
statements, the valuation
basis is consistent with the
Solvency II valuation
principles and therefore, no
valuation difference arises.
17 Trade
Receivables
Trade receivables are measured at their
carrying value as at the reporting date.
Dividend withholding tax recoverable is
included in the valuation of assets under
Solvency II.
Dividend withholding tax
recoverable is included as a
trade receivable under
Solvency II – this is the only
valuation difference arising.
18 Cash & Cash
Equivalents
Under Solvency II, cash and cash
equivalents relates to cash at bank only
(i.e. current accounts and call accounts).
In the IFRS financial
statements, cash and cash
equivalents include cash at
bank (i.e. current and call
accounts), together with,

45
Accrued income is also included in the
Solvency II valuation.
deposits with a fixed term of
3 months or less.
Accrued income is shown as
a separate line item in the
IFRS financial statements.
Leasing Arrangements
The company’s only leasing arrangements relate to its office premises at 1 Grand Canal Square and some
office equipment used on a day-to-day operating basis which are leased and are valued at zero in the
Solvency II balance sheet.
Related Undertakings
The company does not have any holdings in related undertakings or participations.
Criteria used to assess whether markets are active
The company assesses whether or not a market is active through reference to Bloomberg and consultation
with external stock brokers. If markets are deemed inactive, the quoted price for similar assets in an active
market is applied where possible. In other cases, stock brokers provide the company with a price based
on market conditions. In instances where companies have gone into liquidation and their shares have
been delisted from a stock exchange, the company’s Director of Investments took a decision based on
market knowledge and experience to write down the value of the shares to a flat level, pending the results
of the liquidation process. Other than in this regard, no other estimation uncertainty exists in respect of
the valuation of the company’s investment assets.
D.2 Technical Provisions The company’s business is written on both claims made and losses occurring bases. Where “policy year”
is referred to this is taken to be the notification year for claims made business and the accident year for
losses occurring business. The following tables summarises the value of technical provisions on both gross
and net bases.

46
Value of Technical Provisions
Table 1: Gross Technical Provisions
Gross technical provisions have been valued using standard actuarial methods as described in detail
below.
Table 2: Net Technical Provisions
Methods used to calculate technical provisions
The company uses a combination of actuarial methods to value technical provisions. The basis of the
technical provisions are undiscounted gross reserves. For policy years where no further development is
expected, typically the reserves are set equal to the case estimates present in that year. For other policy
years where further development is expected, but there is sufficient incurred experience to be credible,
chain-ladder methods are used to model the full future path of incurred claims.
IPB Gross Technical Provisions -
Claims
Provision
Premium
Provision Risk Margin
Total Technical
Provisions
Medical Expenses 271 52 24 347
Income Protection 1,086 207 96 1,388
Motor Vehicle Liability 15,362 1,546 1,129 18,038
Other Motor 3,840 387 282 4,509
Marine Aviation and Transport 127 28 11 167
Fire / Property 13,278 2,332 608 16,218
General Liability 338,358 13,070 23,671 375,099
Legal Expenses 1,744 289 151 2,184
Total 374,066 17,911 25,974 417,951
IPB Net Technical Provisions - €'000s
Claims
Provision
Premium
Provision Risk Margin
Total Technical
Provisions
Medical Expenses 271 56 24 352
Income Protection 1,086 225 96 1,406
Motor Vehicle Liability 13,797 1,644 1,129 16,571
Other Motor 3,449 411 282 4,143
Marine Aviation and Transport 127 29 11 167
Fire / Property 4,228 4,088 608 8,924
General Liability 310,095 13,577 23,671 347,343
Legal Expenses 1,744 325 151 2,220
Total 334,797 20,355 25,974 381,125

47
For recent policy years there may not be enough incurred data to fully rely on. In this case development
methods are weighted in with other methods which place initial estimates of ultimate claims on either
loss ratios, or as a cost per unit exposure. Expected amounts are calculated by considering the statistic for
prior years, trended forward allowing for rate movements and claims inflation. Another method
considered for recent years is the average cost per claim method – where claim numbers are multiplied
by expected average ultimate costs.
The company uses premium and population, where appropriate, as an exposure measures. Typical
measures of exposure such as turnover are not deemed to be a good measure of risk in its core business.
Estimates based on paid claims are also calculated, but usually do not form the basis of reserve selections
as there is a long delay between claim notification and payment for much of the company’s business which
is dominated by liability lines.
For most classes, net of reinsurance claims are calculated by considering the average percentage
recovered from reinsurance. The company’s reinsurance retentions have been stable over time, recovery
amounts are a small portion of gross liabilities and previous years provide a good benchmark for the rate
of future reinsurance recoveries. The exception to this is Property which has a more extensive reinsurance
programme, for which the same methods as described for calculating gross claims are also considered in
valuing the net position.
Gross and net claims are discounted by considering the expected payment profile of claims over time, and
discounting using risk free yield curves provided by EIOPA.
The risk margin is calculated using a modified Solvency Capital Requirement as specified by EIOPA. This is
projected to develop over time in line with best estimate net technical provisions.
The following items defined in the Solvency II legislation are not relevant to the company in regard to
technical provisions:
The company does not apply the matching adjustment.
The company does not use the volatility adjustment.
The company does not use transitional methods on the risk-free interest rate term structure.
The company does not apply any transitional deductions.
Considerations by Line of Business
Medical Expenses and Income Protection
The company writes Personal Accident business that involves both medical expenses and income
protection coverage. Claims cannot be split between those two elements, and so these are modelled in
aggregate and then split 80/20 between income protection and medical expenses – an assumption based
on historical payment data – three year rolling average.
Motor Vehicle Liability and Other Motor
The company does not separately identify liability and damage claims within the motor business written,
and so again a high level assumption is required to split the business into Solvency II lines of business. 80%

48
of motor is assumed to be liability business, and 20% other claims – an assumption based on twelve month
rolling data. Legacy business has been removed so that patterns reflect current exposure.
Marine Aviation and Transport
The company writes only a very small amount of marine business.
Fire / Property
The company’s property account contains a mix of exposures but predominantly covering council
buildings and council owned social housing. Due to the higher volume of reinsurance recoveries in this
class, methods used to calculate gross reserves are similarly applied in the calculation of net reserves.
General Liability
This is by far the company’s largest class, and contains a number of different exposures within it. The
predominant line is Public Liability, and the valuation of this has been further split by coverage type and
type of insured. Employers Liability has been split by coverage type and legacy business removed. The
company also writes a small amount of Professional Indemnity, included in this class. Additional provisions
have been incorporated following the recent move in discount rate from 3% to 1% for cost of care, and
1.5% loss of earnings exposure, and for the pending introduction of PPOs.
Legal Expenses
The company writes some Criminal Defence policies which are mainly valued using loss ratio methods as
limited experience exists.
Other Items
Claims handling expenses have been estimated as a percentage of future reserves by considering the
historic ratio of claims handling expenses to claims payments.
A portion of the company’s business is retro rated policies – with minimum and deposit premiums paid
up front, followed by further premiums payable if claim payments exceed a set threshold. The future value
of this asset has been approximated by modelling expected claim amounts for each relevant policy, and
the resulting retro premiums that would be triggered calculated.
Provisions relating to unearned premiums have been calculated by considering expected loss ratios by
line of business, and applying those to unearned premiums.
Description of the level of uncertainty
The classes of business written by the company give rise to a significant degree of uncertainty concerning
the ultimate cost of claims. Uncertainty arises for the following reasons in respect of the majority of
policies written by the company:
Whether an event has occurred that would give rise to a policyholder suffering an insured loss.
The extent of policy coverage and limits applicable.
The amount of insured loss suffered by the policyholder.
The timing of a settlement to the policyholder.
The costs associated with handling claims.
49
Estimates have to be made both for the expected cost of claims reported at the reporting date and for
the expected ultimate cost of claims incurred but not yet reported (IBNR) at the reporting date. It can take
a significant period of time before the ultimate claims cost can be determined with certainty.
The company uses estimation techniques, based on statistical analysis of past experience and future
estimates, to calculate a range of estimated cost of claims outstanding at the reporting date, which is
subjected to sensitivity analysis. These techniques take into account the characteristics of the company’s
business.
Particular sources of uncertainty for the company currently arise from the pending introduction of PPOs
and the impact that this will have on claim settlement values in Ireland. Any further reductions in the
discount rate could also increase costs, as well as general changes in the courts environment. Due to the
nature of its business the company is exposed to aggregations of claims as the business is concentrated
by policyholder type, risk exposures, geographical location and other factors.
Valuation basis, method and assumption differences used for IFRS financial statements
For all lines of business the best estimate undiscounted IFRS reserves form the basis of the Solvency II
technical provisions. These are then discounted as per Solvency II valuation guidelines.
The main difference to the IFRS financial statements is the inclusion of margins for uncertainty within the
IFRS financial statements. An 18% margin is applied to all components of the claims reserve. Furthermore,
the retro-rated premium asset is reduced by 18%, recognising the uncertainty in that asset also.
Under Solvency II regulation a risk margin is held in addition to the best estimate liabilities. The €26.1
million risk margin is calculated using the cost of capital approach specified in the regulation.
The financial statements also include a provision of €0.8 million (plus margins) in respect of the MIBI levy
for the year within the insurance reserves. Under Solvency II MIBI provisions are excluded from the
technical provisions, and instead included within “Other Liabilities”.
The retro-rated premium asset is included as a credit within the best estimate technical provisions under
Solvency II, where it is a separate insurance asset in the IFRS financial statements. The retro-rated
premium asset estimate included in the Solvency II Technical Provisions is a best estimate actuarial figure,
where the asset in the IFRS financial statements is reduced by a margin for uncertainty of 18%, and based
on a more approximate model.
The following table provides a reconciliation between the technical provisions as per the IFRS financial
statements and the technical provisions for Solvency II purposes as at 31 December 2016.
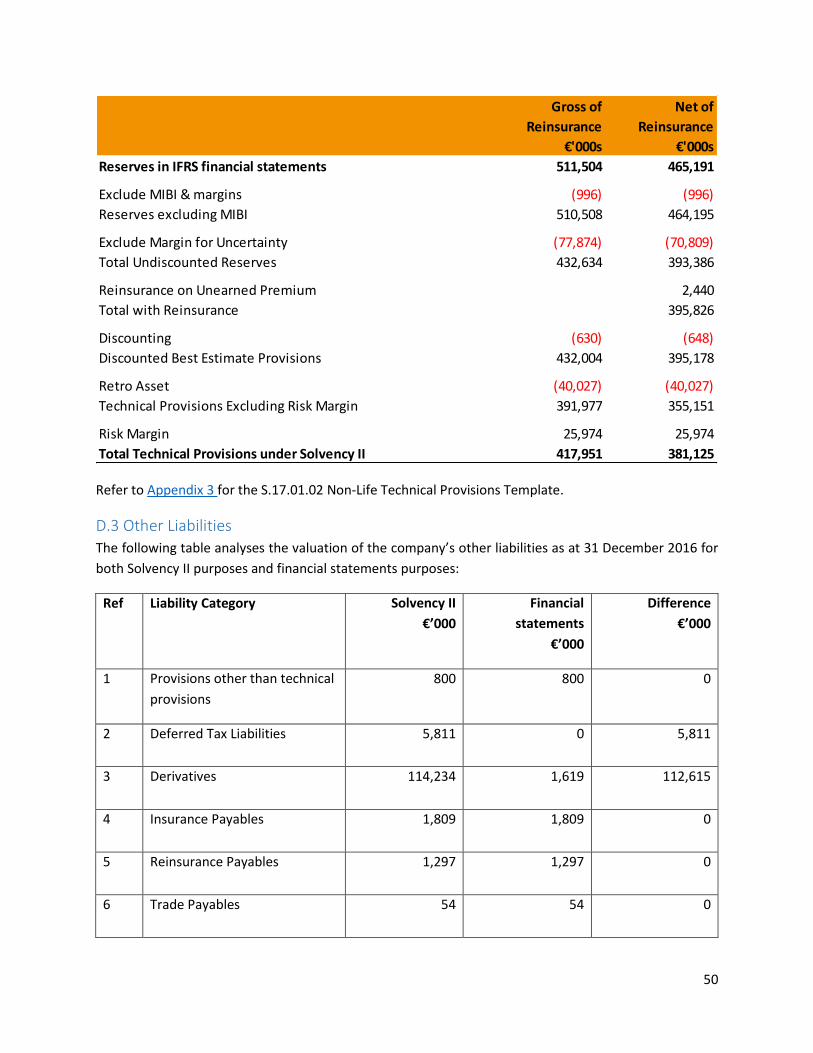
50
Refer to Appendix 3 for the S.17.01.02 Non-Life Technical Provisions Template.
D.3 Other Liabilities The following table analyses the valuation of the company’s other liabilities as at 31 December 2016 for
both Solvency II purposes and financial statements purposes:
Ref Liability Category Solvency II
€’000
Financial
statements
€’000
Difference
€’000
1 Provisions other than technical
provisions
800 800 0
2 Deferred Tax Liabilities 5,811 0 5,811
3 Derivatives 114,234 1,619 112,615
4 Insurance Payables 1,809 1,809 0
5 Reinsurance Payables 1,297 1,297 0
6 Trade Payables 54 54 0
Gross of
Reinsurance
Net of
Reinsurance
€'000s €'000s
Reserves in IFRS financial statements 511,504 465,191
Exclude MIBI & margins (996) (996)
Reserves excluding MIBI 510,508 464,195
Exclude Margin for Uncertainty (77,874) (70,809)
Total Undiscounted Reserves 432,634 393,386
Reinsurance on Unearned Premium 2,440
Total with Reinsurance 395,826
Discounting (630) (648)
Discounted Best Estimate Provisions 432,004 395,178
Retro Asset (40,027) (40,027)
Technical Provisions Excluding Risk Margin 391,977 355,151
Risk Margin 25,974 25,974
Total Technical Provisions under Solvency II 417,951 381,125
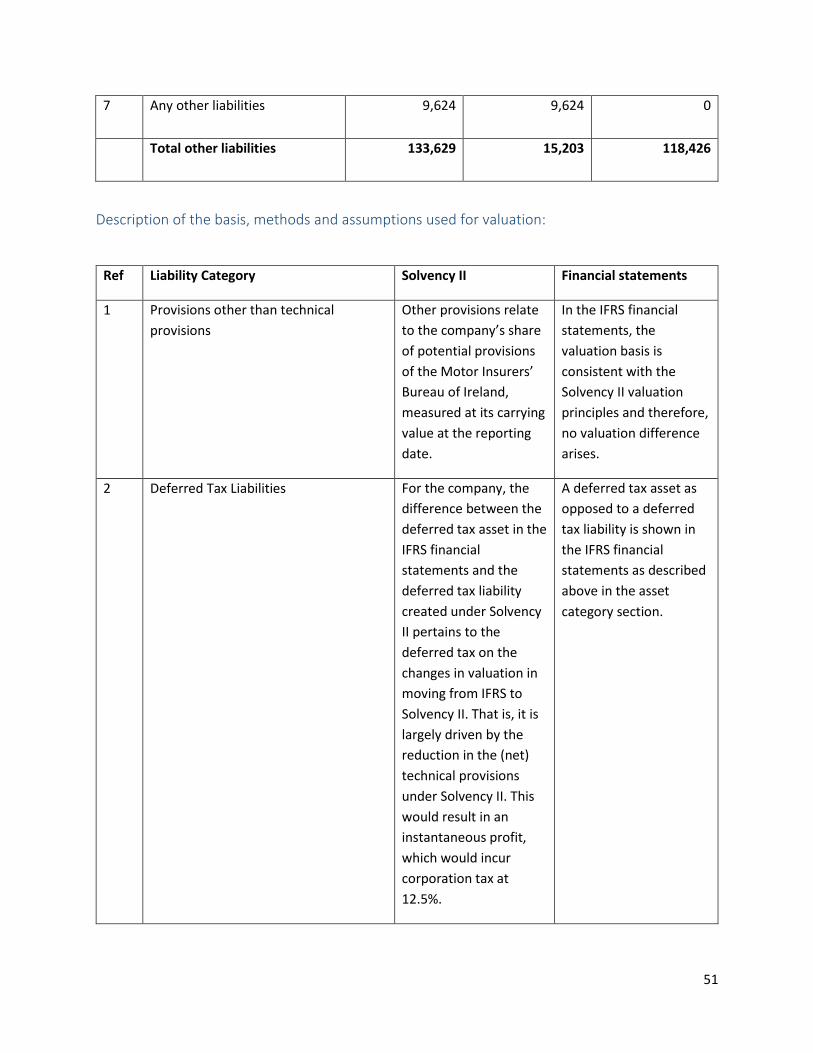
51
7 Any other liabilities 9,624 9,624 0
Total other liabilities 133,629 15,203 118,426
Description of the basis, methods and assumptions used for valuation:
Ref Liability Category Solvency II Financial statements
1 Provisions other than technical
provisions
Other provisions relate
to the company’s share
of potential provisions
of the Motor Insurers’
Bureau of Ireland,
measured at its carrying
value at the reporting
date.
In the IFRS financial
statements, the
valuation basis is
consistent with the
Solvency II valuation
principles and therefore,
no valuation difference
arises.
2 Deferred Tax Liabilities For the company, the
difference between the
deferred tax asset in the
IFRS financial
statements and the
deferred tax liability
created under Solvency
II pertains to the
deferred tax on the
changes in valuation in
moving from IFRS to
Solvency II. That is, it is
largely driven by the
reduction in the (net)
technical provisions
under Solvency II. This
would result in an
instantaneous profit,
which would incur
corporation tax at
12.5%.
A deferred tax asset as
opposed to a deferred
tax liability is shown in
the IFRS financial
statements as described
above in the asset
category section.

52
3 Derivatives Under Solvency II,
derivative financial
instruments are
measured at the gross
fair value as at the
reporting date. The
company’s derivative
financial instruments
mainly relate to forward
currency contracts. All
forward sales are shown
as assets and all
forward purchases are
shown as liabilities.
Under IFRS, derivatives
are initially measured at
fair value on the date
the contract is entered
into, and subsequently
re-measured at fair
value at the reporting
date. Each derivative is
carried as a financial
asset when the fair value
is positive and as a
financial liability when
the fair value is negative.
4 Insurance Payables Insurance payables
relates to insurance
creditors, measured at
their carrying value as
at the reporting date.
In the IFRS financial
statements, the
valuation basis is
consistent with the
Solvency II valuation
principles and therefore,
no valuation difference
arises.
5 Reinsurance Payables Insurance payables
relates to reinsurance
creditors, measured at
their carrying value as
at the reporting date.
In the IFRS financial
statements, the
valuation basis is
consistent with the
Solvency II valuation
principles and therefore,
no valuation difference
arises.
6 Trade Payables Trade payables are
measured at their
carrying value as at the
reporting date.
In the IFRS financial
statements, the
valuation basis is
consistent with the
Solvency II valuation
principles and therefore,
no valuation difference
arises.

53
7 Any other liabilities Other liabilities are
measured at their
carrying value as at the
reporting date. The
largest component
relates to Social
Dividend payable
amounting to €5m.
In the IFRS financial
statements, the
valuation basis is
consistent with the
Solvency II valuation
principles and therefore,
no valuation difference
arises.
Refer to Appendix 4 for the S.02.01.02 Solvency II Balance Sheet Template.
Leasing Arrangements
The company does not have any material liabilities arising from leasing arrangements.
Material Contingent Liabilities
The company does not have any other material contingent liabilities and provisions other than technical
provisions.
Employee Benefits
The company had the following employee benefit obligations as at 31 December 2016:
€’000
Salaries Payable 1,336
Trade Union Subscriptions Payable 2
Pension Payable 95
Social Committee Fund 9
Holiday Pay Accrual 284
Total short-term employee benefit obligations 1,726
The company does not have any defined benefit plans and contributes only to defined contribution
pension schemes.
D.4 Alternative Methods for Valuation
The company uses alternative valuation methods in accordance with Article 10 (5) when valuing a small
portion of its investment assets. These alternative valuation methods include the following:

54
Quoted prices for identical or similar assets or liabilities in markets that are not active – This method is applied to assets which have a quoted price but the asset is illiquid and does not trade often. The company can support the rationale for this valuation approach as the quoted prices applied are for assets with similar characteristics, for example, same instrument type, same credit rating and same ultimate guarantor.
Market- corroborated inputs, which may not be directly observable, but are based on or supported by observable market data – This method is applied to assets such as our investment properties and real estate funds. Market valuations are carried out each year on our investment properties by the property managing agents using the RICS (Royal Institute of Chartered Surveyors) Valuation – Professional Standards. Every three years a full red book valuation is carried out on each property. On an annual basis desk-based valuations are carried out and valuation certificates are issued. The company can justify this valuation approach as it is independent and supported by observable market data. With regards to our real estate funds, the fund managers carry out a desk-based valuation on a monthly basis. Again, the company can justify this valuation approach as it is independent and supported by observable market data.
Unobservable inputs reflecting the assumptions that market participants would use when pricing the asset or liability, including assumptions about risk – This method is applied in cases where securities are in liquidation or carried at amortised cost.
The company assesses the adequacy of the use of the above methods on an annual basis through
discussions with our investment custodian and external audit review.
E: Capital Management
E.1 Own Funds
The company has a simple capital structure made up of retained earnings only. As at 31 December 2016,
the company’s eligible amount of own funds to cover the SCR and MCR stood at €808.2 million and was
comprised entirely of Tier 1 Basic Own Funds. The company manages its capital requirements according
to the Capital Management Policy and by assessing its required solvency margins on a regular basis. The
Board of Directors reviews the capital structure of the company on an on-going basis to determine the
appropriate level of capital required to pursue the business strategy.
The company uses the Solvency II Standard Formula to quantify risk in the business and its
appropriateness is regularly assessed. The Standard Formula is also used to quantify the capital impact of
key events and key management actions. It is also used to analyse the change in risk profile from one
quarter to the next. The company assesses the significance with which the risk profile deviates from the
key assumptions and parameters underlying the SCR. Conceptually, the company estimates Economic
Capital from:
Regulatory Capital
An allowance for deviations from Regulatory Capital
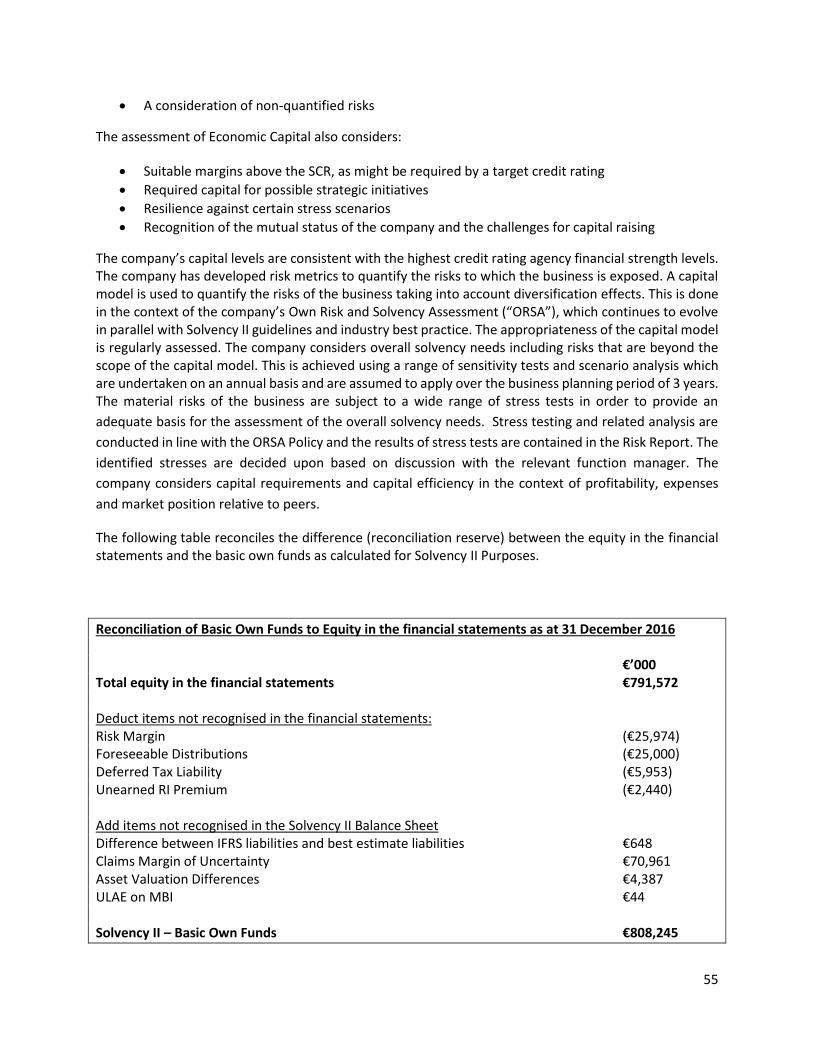
55
A consideration of non-quantified risks
The assessment of Economic Capital also considers:
Suitable margins above the SCR, as might be required by a target credit rating
Required capital for possible strategic initiatives
Resilience against certain stress scenarios
Recognition of the mutual status of the company and the challenges for capital raising
The company’s capital levels are consistent with the highest credit rating agency financial strength levels. The company has developed risk metrics to quantify the risks to which the business is exposed. A capital model is used to quantify the risks of the business taking into account diversification effects. This is done in the context of the company’s Own Risk and Solvency Assessment (“ORSA”), which continues to evolve in parallel with Solvency II guidelines and industry best practice. The appropriateness of the capital model is regularly assessed. The company considers overall solvency needs including risks that are beyond the scope of the capital model. This is achieved using a range of sensitivity tests and scenario analysis which are undertaken on an annual basis and are assumed to apply over the business planning period of 3 years. The material risks of the business are subject to a wide range of stress tests in order to provide an
adequate basis for the assessment of the overall solvency needs. Stress testing and related analysis are
conducted in line with the ORSA Policy and the results of stress tests are contained in the Risk Report. The
identified stresses are decided upon based on discussion with the relevant function manager. The
company considers capital requirements and capital efficiency in the context of profitability, expenses
and market position relative to peers.
The following table reconciles the difference (reconciliation reserve) between the equity in the financial statements and the basic own funds as calculated for Solvency II Purposes.
Reconciliation of Basic Own Funds to Equity in the financial statements as at 31 December 2016 €’000 Total equity in the financial statements €791,572 Deduct items not recognised in the financial statements: Risk Margin (€25,974) Foreseeable Distributions (€25,000) Deferred Tax Liability (€5,953) Unearned RI Premium (€2,440) Add items not recognised in the Solvency II Balance Sheet Difference between IFRS liabilities and best estimate liabilities €648 Claims Margin of Uncertainty €70,961 Asset Valuation Differences €4,387 ULAE on MBI €44 Solvency II – Basic Own Funds €808,245

56
None of the company’s own funds are subject to transitional arrangements. The company has no ancillary own funds or subordinate debt. No deductions are applied to own funds and there are no material restrictions affecting their availability and transferability The following table provides explanations of the key elements of the reconciliation reserve shown above.
Key element of the reconciliation reserve Explanation
Risk Margin The risk margin is designed to ensure that the value of technical provisions is sufficient for another insurer to take over and meet the insurance obligations. It is calculated using a modified Solvency Capital Requirement as specified by EIOPA.
Foreseeable Distributions The foreseeable distribution relates to a Member dividend of €25 million due to be paid during 2017.
Deferred Tax Liability For the company, the difference between the
deferred tax asset in the IFRS financial statements
and the deferred tax liability created under
Solvency II pertains to the deferred tax on the
changes in valuation in moving from IFRS to
Solvency II. That is, it is largely driven by the
reduction in the (net) technical provisions under
Solvency II. This would result in an instantaneous
profit, which would incur corporation tax at
12.5%.
Unearned RI Premium Solvency II requires reinsurance to be recognised
consistently with the boundary of the underlying
insurance contract whereas IFRS recognises
reinsurance from inception of the contract.
Differences between IFRS liabilities and best estimate liabilities
In the IFRS financial statements technical reserves are undiscounted, as compared with discounted Solvency II technical provisions.
Claims Margin of Uncertainty Margins of uncertainty are included in the IFRS financial statements. An 18% margin is applied to all components of the claims reserves. Further the retro asset is reduced by 18%, recognising the associated uncertainty. These margins of uncertainty are excluded from Solvency II technical provisions.
Asset Valuation Differences Valuation differences relate to Property, Plant and Equipment (PPE) and Intangible Asset, both of which are valued at cost less accumulated depreciation in the IFRS financial statements. The

57
company’s PPE relates to leasehold improvements and its intangible asset relates to IT software. As neither can be sold separately, both are valued at zero under Solvency II valuation principles.
ULAE on MBI On an IFRS basis an allowance for ULAE is added to the MIBI provision. This is not included in Solvency II which values MIBI at a best estimate only.
E.2 Solvency Capital Requirement and Minimum Capital Requirement
As at 31 December 2016, the company had a solvency ratio of almost 4 times the SCR. The company’s SCR
and MCR were €207.2 million and €51.8 million respectively.
The table below shows the components of the SCR (using the Standard Formula) as at 31 December 2016.
31 December 2016 €’000
Market Risk analysed by the following sub-risk modules: 136,551
Concentration Risk 16,978
Interest-Rate Risk 23,180
Currency Risk 4,201
Equity Risk 87,709
Property Risk 23,185
Spread Risk 32,891
Market Diversification Benefit (51,593)
Non-Life Risk analysed by the following sub-risk modules: 126,832
Premium and Reserve Risk 124,929
Lapse Risk 0,000
Catastrophe Risk 6,904
Non-Life Diversification Benefit (5,001)
Default Risk analysed by the following sub-risk modules: 17,001
Type 1 9,187

58
Type 2 8,988
Default Diversification Benefit (1,174)
Health Risk analysed by the following sub-risk modules: 1,019
Premium and Reserve Risk 0,756
Lapse Risk 0.0
Catastrophe Risk 0,520
Health Diversification Benefit (0,257)
Basic Solvency Requirements (“BSCR”) pre Diversification 281,403
Overall Diversification Benefit (64,431)
BSCR 216,972
Operational Risk 11,759
Loss Absorbing Capacity of Deferred Tax (21,517)
SCR 207,215
MCR 51,804
The company uses EIOPA’s Solvency II Standard Formula. It does not use company-specific parameters in
its computation, however, it uses one simplification in relation to the allocation of risk mitigation from
the non-life and health modules across our reinsurer panel in the default type 1 calculation.
The company applies the loss absorption mechanism in the Standard Formula calculation in relation to
future deferred taxes. During the year, the company went through an internal governance process to
estimate the impact of future deferred tax benefits with reference to its own future capital funding. A
decision was taken to reduce the benefit of the loss absorbing capacity of deferred tax in the SCR
calculation to circa 75%.
As stated above, the Minimum Capital Requirement for the company at 31 December 2016 was €51.8
million which represents the minimum calculated as per the Standard Formula.
E.3 Any use of the duration-based equity risk sub-module in the calculation of the Solvency
Capital Requirement
The company has not opted to use the duration-based equity risk sub-module of the Solvency II
regulations.

59
E.4 Internal model information
The company applies the standard formula model and does not use an internal model to calculate the
Solvency Capital Requirement.
E.5 Non-compliance with the Minimum Capital Requirement and significant non-
compliance with the Solvency Capital Requirement There was no breach of the Solvency Capital Requirement (and hence the Minimum Capital Requirement)
over the reporting period.
E.6 Any other information
Refer to the appendices for the templates as at 31 December 2016, relevant to this section. These include:
Appendix 5 S.023.01.01 Own Funds Template
Appendix 6 S.25.01.21 Solvency Capital Requirement – Standard Formula Only Template
Appendix 7 S.28.01.01 Minimum Capital Requirement – Only Life or Only Non-Life Template

60
Annex
Annual Quantitative Reporting Templates (QRTs)
Appendix 1A: S.05.01.02 Premiums, claims and expenses by line of business
Line of Business for: non-life insurance and reinsurance obligations (direct business and accepted proportional reinsurance) Line of business for : accepted non-proportional reinsurance""
Medical
expense
insurance
(1)
Income
protection
insurance (2)
Workers'
compensation
insurance (3)
Motor vehicle
liability
insurance (4)
Other motor
insurance (5)
Marine, aviation
and transport
insurance (6)
Fire and other
damage to
property
insurance (7)
General
liability
insurance (8)
Credit and
suretyship
insurance (9)
Legal
expenses
insurance
(10)
Assistance
(11)
Miscellaneous
financial loss
(12)
Health (13)Casualty
(15)
Marine,
aviation,
transport
(16)
Property
(14)Total
C0010 C0020 C0030 C0040 C0050 C0060 C0070 C0080 C0090 C0100 C0110 C0120 C0130 C0140 C0150 C0160 C0200
Premiums written
Gross Direct business R0110 403,564 1,614,256 - 6,190,686 1,547,672 336,063 25,114,954 87,847,382 128 1,817,590 - - - - - - 124,872,294
Gross Proportional reinsurance accepted R0120 - - - - - - - - - - - - - - - - -
Gross Non-proportional reinsurance accepted R0130 - - - - - - - - - - - - - - - - -
Reinsurers' share R0140 35,856 143,424 - 458,912 114,728 - 14,766,446 5,518,008 - 128,332 - - - - - - 21,165,707
Net R0200 367,708 1,470,831 - 5,731,774 1,432,944 336,063 10,348,508 82,329,374 128 1,689,258 - - - - - - 103,706,588
Premiums earned
Gross Direct business R0210 397,593 1,590,372 - 5,898,565 1,474,641 372,126 27,057,230 81,960,103 128 2,292,100 - - - - - - 121,042,859
Gross Proportional reinsurance accepted R0220 - - - - - - - - - - - - - - - - -
Gross Non-proportional reinsurance accepted R0230 - - - - - - - - - - - - - - - - -
Reinsurers' share R0240 35,856 143,424 - 458,912 114,728 - 14,766,446 5,518,008 - 128,332 - - - - - - 21,165,707
Net R0300 361,737 1,446,948 - 5,439,652 1,359,913 372,126 12,290,784 76,442,095 128 2,163,768 - - - - - - 99,877,152
Claims incurred
Gross Direct business R0310 140,763 563,051 - 7,612,298 1,903,074 124,020- 5,143,651 42,507,543 - - - - - - - - 57,746,360
Gross Proportional reinsurance accepted R0320 - - - - - - - - - - - - - - - - -
Gross Non-proportional reinsurance accepted R0330 - - - - - - - - - - - - - - - - -
Reinsurers' share R0340 - - - 468,440- 117,110- - 3,771,949 210,010 - - - - - - - - 3,396,409
Net R0400 140,763 563,051 - 8,080,738 2,020,184 124,020- 1,371,702 42,297,533 - - - - - - - - 54,349,951
Changes in other technical provisions
Gross Direct business R0410 - - - - - - - - - - - - - - - - -
Gross Proportional reinsurance accepted R0420 - - - - - - - - - - - - - - - - -
Gross Non-proportional reinsurance accepted R0430 - - - - - - - - - - - - - - - - -
Reinsurers' share R0440 - - - - - - - - - - - - - - - - -
Net R0500 - - - - - - - - - - - - - - - - -
Expenses incurred R0550 95,054 380,215 - 2,343,241 585,810 39,691 4,552,685 46,071,533 20 1,252,977 - - - - - - 55,321,226
Other expenses R1200 - - - - - - - - - - - - - - - - 269,518
Total expenses R1300 95,054 380,215 - 2,343,241 585,810 39,691 4,552,685 46,071,533 20 1,252,977 - - - - - - 55,590,744

61
Appendix 1B: S.05.02.01 Premiums, claims and expenses by country
Home Country Top 5 countries (by amount of gross premiums written - non-life obligations) Total Top 5 and home country
C0010 C0020 C0030 C0040 C0050 C0060 C0070
Name of the country R0010 GB 0 0 0 0
C0080 C0090 C0100 C110 C0120 C0130 C0140
Premiums written
Gross Direct business R0110 122,741,383 2,130,912 0 0 0 0 124,872,294
Gross Proportional reinsurance accepted R0120 0 0 0 0 0 0 0
Gross Non-proportional reinsurance accepted R0130 0 0 0 0 0 0 0
Reinsurers' share R0140 20,961,393 204,314 0 0 0 0 21,165,707
Net R0200 101,779,990 1,926,598 0 0 0 0 103,706,588
Premiums earned
Gross Direct business R0210 118,772,110 2,270,749 0 0 0 0 121,042,859
Gross Proportional reinsurance accepted R0220 0 0 0 0 0 0 0
Gross Non-proportional reinsurance accepted R0230 0 0 0 0 0 0 0
Reinsurers' share R0240 20,971,766 193,941 0 0 0 0 21,165,707
Net R0300 97,800,344 2,076,808 0 0 0 0 99,877,152
Claims incurred
Gross Direct business R0310 54,815,221 2,931,139 0 0 0 0 57,746,360
Gross Proportional reinsurance accepted R0320 0 0 0 0 0 0 0
Gross Non-proportional reinsurance accepted R0330 0 0 0 0 0 0 0
Reinsurers' share R0340 1,468,428 1,927,981 0 0 0 0 3,396,409
Net R0400 53,346,793 1,003,158 0 0 0 0 54,349,951
Changes in other technical provisions
Gross Direct business R0410 0 0 0 0 0 0 0
Gross Proportional reinsurance accepted R0420 0 0 0 0 0 0 0
Gross Non-proportional reinsurance accepted R0430 0 0 0 0 0 0 0
Reinsurers' share R0440 0 0 0 0 0 0 0
Net R0500 0 0 0 0 0 0 0
Expenses incurred R0550 54,510,416 810,810 0 0 0 0 55,321,226
Other expenses R1200 0 0 0 0 0 0 269,518
Total expenses R1300 54,510,416 810,810 0 0 0 0 55,590,744

62
Appendix 2: S.19.01.21 Non-Life Insurance Claims
Gross Claims Paid
Line of business Z0010 Total
Currency Z0030 TOTAL
Accident year / underwriting year Z0020 1 - Accident Year
Currency conversion Z0040 0.0
Gross Claims Paid (non-cumulative)
(absolute amount)
Development year
Year 0 1 2 3 4 5 6 7 8 9 10 & +In Current
year
Sum of years
(cumulative)
C0010 C0020 C0030 C0040 C0050 C0060 C0070 C0080 C0090 C0100 C0110 C0170 C0180
Prior R010011,505,743
R010011,505,743 11,505,743
N-9 R0160 6,245,681 9,681,424 6,199,596 6,675,433 8,176,584 6,433,377 6,305,704 8,630,627 510,017 4,999,465 R0160 4,999,465 63,857,907
N-8 R0170 6,419,066 9,217,016 6,196,809 6,260,531 10,155,194 7,177,279 3,024,321 5,320,562 1,535,938 R0170 1,535,938 55,306,716
N-7 R0180 9,624,392 11,461,877 12,204,700 13,777,952 11,434,524 5,370,977 4,391,421 3,241,482 R0180 3,241,482 71,507,324
N-6 R0190 8,456,217 15,324,039 8,090,616 8,296,723 5,828,537 4,452,475 4,133,726 R0190 4,133,726 54,582,334
N-5 R0200 4,794,912 8,466,689 8,637,943 9,300,012 7,700,281 6,894,528 R0200 6,894,528 45,794,366
N-4 R0210 3,837,599 8,079,412 8,849,094 10,171,587 7,410,753 R0210 7,410,753 38,348,445
N-3 R0220 4,904,290 10,364,223 10,228,773 8,752,118 R0220 8,752,118 34,249,403
N-2 R0230 4,950,070 10,251,849 10,028,593 R0230 10,028,593 25,230,512
N-1 R0240 6,097,594 13,313,277 R0240 13,313,277 19,410,871
N R0250 6,762,572 R0250 6,762,572 6,762,572
Total R026078,578,195 426,556,192

63
Appendix 2: S.19.01.21 Non-Life Insurance Claims Continued
Gross Undiscounted Best Estimate Claims Provisions
Development year
Year 0 1 2 3 4 5 6 7 8 9 10 & +Year end (discounted
data)
C0200 C0210 C0220 C0230 C0240 C0250 C0260 C0270 C0280 C0290 C0300 C0360
Prior R0100 30,156,002 R0100 30,121,634
N-9 R0160 0 0 0 0 0 0 0 0 0 9,898,364 R0160 9,879,572
N-8 R0170 0 0 0 0 0 0 0 0 8,291,224 R0170 8,281,928
N-7 R0180 0 0 0 0 0 0 0 11,699,943 R0180 11,688,782
N-6 R0190 0 0 0 0 0 0 10,874,562 R0190 10,866,062
N-5 R0200 0 0 0 0 0 23,994,205 R0200 23,965,766
N-4 R0210 0 0 0 0 24,609,186 R0210 24,579,615
N-3 R0220 0 0 0 33,432,882 R0220 33,386,032
N-2 R0230 0 0 53,802,556 R0230 53,727,735
N-1 R0240 0 76,413,054 R0240 76,319,051
N R0250 91,348,519 R0250 91,250,168
Total R0260 374,066,346

64
Appendix 3: S.17.01.02 Non-Life Technical Provisions
Direct business and accepted proportional reinsurance Direct business and accepted proportional reinsurance Accepted non-proportional reinsurance
Medical
expense
insurance
Income
protection
insurance
Workers'
compensatio
n insurance
Motor
vehicle
liability
insurance
Other motor
insurance
Marine,
aviation and
transport
insurance
Fire and
other
damage to
property
insurance
General
liability
insurance
Credit and
suretyship
insurance
Legal
expenses
insurance
Assistance
Miscellaneou
s financial
loss
Non-
proportional
health
reinsurance
Non-
proportional
casualty
reinsurance
Non-
proportional
marine,
aviation and
transport
reinsurance
Non-
proportional
property
reinsurance
Total Non-
Life
obligation
C0020 C0030 C0040 C0050 C0060 C0070 C0080 C0090 C0100 C0110 C0120 C0130 C0140 C0150 C0160 C0170
Technical provisions calculated as a whole R0010 0 0 0 0 0 0 0 0 0 0 0 0 0 0 0 0 0
Direct business R0020 0 0 0 0 0 0 0 0 0 0 0 0 0 0 0 0 0
Accepted proportional reinsurance business R0030 0 0 0 0 0 0 0 0 0 0 0 0 0 0 0 0 0
Accepted non-proportional reinsurance R0040 0 0 0 0 0 0 0 0 0 0 0 0 0 0 0 0 0
Total recoverable from reinsurance/SPV after the adjustment for expected
losses due to counterparty defaultR0050 0 0 0 0 0 0 0 0 0 0 0 0 0 0 0 0 0
Technical provisions calculated as a sum of BE and RM
Best estimate
Premium Provisions
Gross - Total R0060 51,749 206,998 0 1,546,360 386,590 28,331 2,331,942 13,069,535 0 289,346 0 0 0 0 0 0 17,910,850
Gross - Direct business R0070 51,749 206,998 0 1,546,360 386,590 28,331 2,331,942 13,069,535 0 289,346 0 0 0 0 0 0 17,910,850
Gross - Accepted proportional reinsurance business R0080 0 0 0 0 0 0 0 0 0 0 0 0 0 0 0 0 0
Gross - Accepted non-proportional reinsurance business R0090 0 0 0 0 0 0 0 0 0 0 0 0 0 0 0 0 0
Total recoverable from reinsurance/SPV and Finite Re before the adjustment for
expected losses due to counterparty defaultR0100 -4,423 -17,691 0 -97,690 -24,422 -537 -1,756,004 -507,445 0 -35,483 0 0 0 0 0 0 -2,443,695
Recoverables from reinsurance (except SPV and Finite Reinsurance) before
adjustment for expected lossesR0110 -4,423 -17,691 0 -97,690 -24,422 -537 -1,756,004 -507,445 0 -35,483 0 0 0 0 0 0 -2,443,695
Recoverables from SPV before adjustment for expected losses R0120 0 0 0 0 0 0 0 0 0 0 0 0 0 0 0 0 0
Recoverables from Finite Reinsurance before adjustment for expected losses R0130 0 0 0 0 0 0 0 0 0 0 0 0 0 0 0 0 0
Total recoverable from reinsurance/SPV and Finite Re after the adjustment for
expected losses due to counterparty defaultR0140 -4,423 -17,691 0 -97,690 -24,422 -537 -1,756,004 -507,445 0 -35,483 0 0 0 0 0 0 -2,443,695
Net Best Estimate of Premium Provisions R0150 56,172 224,689 0 1,644,049 411,012 28,868 4,087,946 13,576,980 0 324,829 0 0 0 0 0 0 20,354,545
Claims provisions
Gross - Total R0160 271,407 1,085,630 0 15,361,888 3,840,472 127,041 13,277,893 338,358,460 0 1,743,558 0 0 0 0 0 0 374,066,348
Gross - Direct business R0170 271,407 1,085,630 0 15,361,888 3,840,472 127,041 13,277,893 338,358,460 0 1,743,558 0 0 0 0 0 0 374,066,348
Gross - Accepted proportional reinsurance business R0180 0 0 0 0 0 0 0 0 0 0 0 0 0 0 0 0 0
Gross - accepted non-proportional reinsurance business R0190 0 0 0 0 0 0 0 0 0 0 0 0 0 0 0 0 0
Total recoverable from reinsurance/SPV and Finite Re before the adjustment for
expected losses due to counterparty defaultR0200 0 0 0 1,564,658 391,164 0 9,050,010 28,263,647 0 0 0 0 0 0 0 0 39,269,480
Recoverables from reinsurance (except SPV and Finite Reinsurance) before
adjustment for expected lossesR0210 0 0 0 1,564,658 391,164 0 9,050,010 28,263,647 0 0 0 0 0 0 0 0 39,269,480
Recoverables from SPV before adjustment for expected losses R0220 0 0 0 0 0 0 0 0 0 0 0 0 0 0 0 0 0
Recoverables from Finite Reinsurance before adjustment for expected losses R0230 0 0 0 0 0 0 0 0 0 0 0 0 0 0 0 0 0
Total recoverable from reinsurance/SPV and Finite Re after the adjustment for
expected losses due to counterparty defaultR0240 0 0 0 1,564,658 391,164 0 9,050,010 28,263,647 0 0 0 0 0 0 0 0 39,269,480
Net Best Estimate of Claims Provisions R0250 271,407 1,085,630 0 13,797,230 3,449,307 127,041 4,227,883 310,094,813 0 1,743,558 0 0 0 0 0 0 334,796,868
Total Best estimate - Gross R0260 323,157 1,292,627 0 16,908,247 4,227,062 155,371 15,609,835 351,427,995 0 2,032,903 0 0 0 0 0 0 391,977,198
Total Best estimate - Net R0270 327,580 1,310,319 0 15,441,279 3,860,320 155,908 8,315,829 323,671,793 0 2,068,387 0 0 0 0 0 0 355,151,413
Risk margin R0280 23,957 95,829 0 1,129,285 282,321 11,402 608,171 23,671,460 0 151,270 0 0 0 0 0 0 25,973,695
Amount of the transitional on Technical Provisions
TP as a whole R0290 0 0 0 0 0 0 0 0 0 0 0 0 0 0 0 0 0
Best Estimate R0300 0 0 0 0 0 0 0 0 0 0 0 0 0 0 0 0 0
Risk Margin R0310 0 0 0 0 0 0 0 0 0 0 0 0 0 0 0 0 0
Technical provisions
Technical provisions - total R0320 347,114 1,388,456 0 18,037,532 4,509,383 166,773 16,218,006 375,099,455 0 2,184,173 0 0 0 0 0 0 417,950,893
Recoverable from reinsurance contract/SPV and Finite Re after the adjustment for
expected losses due to counterparty default - totalR0330 -4,423 -17,691 0 1,466,968 366,742 -537 7,294,006 27,756,202 0 -35,483 0 0 0 0 0 0 36,825,785
Technical provisions minus recoverables from reinsurance/SPV and Finite Re- total R0340 351,537 1,406,148 0 16,570,563 4,142,641 167,310 8,924,000 347,343,253 0 2,219,656 0 0 0 0 0 0 381,125,109

65
Appendix 4: S.02.01.02 Balance Sheet
Solvency II
value
Assets C0010
Goodwill R0010 0
Deferred acquisition costs R0020 0
Intangible assets R0030 0
Deferred tax assets R0040 0
Pension benefit surplus R0050 0
Property, plant & equipment held for own use R0060 0
Investments (other than assets held for index-linked and unit-linked contracts) R0070 1,260,917,850
Property (other than for own use) R0080 92,738,609
Holdings in related undertakings, including participations R0090 0
Equities R0100 198,515,484
Equities - listed R0110 195,250,649
Equities - unlisted R0120 3,264,835
Bonds R0130 718,565,934
Government Bonds R0140 621,688,692
Corporate Bonds R0150 93,809,112
Structured notes R0160 0
Collateralised securities R0170 3,068,130
Collective Investments Undertakings R0180 55,808,059
Derivatives R0190 113,372,310
Deposits other than cash equivalents R0200 81,917,453
Other investments R0210 0
Assets held for index-linked and unit-linked contracts R0220 0
Loans and mortgages R0230 23,452,366
Loans on policies R0240 0
Loans and mortgages to individuals R0250 0
Other loans and mortgages R0260 23,452,366
Reinsurance recoverables from: R0270 36,825,785
Non-life and health similar to non-life R0280 36,825,785
Non-life excluding health R0290 36,847,899
Health similar to non-life R0300 -22,114
Life and health similar to life, excluding health and index-linked and unit-linked R0310 0
Health similar to life R0320 0
Life excluding health and index-linked and unit-linked R0330 0
Life index-linked and unit-linked R0340 0
Deposits to cedants R0350 0
Insurance and intermediaries receivables R0360 10,689,445
Reinsurance receivables R0370 1,804,275
Receivables (trade, not insurance) R0380 7,074,164
Own shares (held directly) R0390 0
Amounts due in respect of own fund items or initial fund called up but not yet paid in R0400 0
Cash and cash equivalents R0410 44,061,312
Any other assets, not elsewhere shown R0420 0
Total assets R0500 1,384,825,196

66
Appendix 4: S.02.01.02 Balance Sheet Continued
Solvency II
value
Liabilities C0010
Technical provisions – non-life R0510 417,950,893
Technical provisions – non-life (excluding health) R0520 416,216,121
Technical provisions calculated as a whole R0530 0
Best Estimate R0540 390,361,414
Risk margin R0550 25,854,708
Technical provisions - health (similar to non-life) R0560 1,734,772
Technical provisions calculated as a whole R0570 0
Best Estimate R0580 1,615,784
Risk margin R0590 118,988
Technical provisions - life (excluding index-linked and unit-linked) R0600 0
Technical provisions - health (similar to life) R0610 0
Technical provisions calculated as a whole R0620 0
Best Estimate R0630 0
Risk margin R0640 0
Technical provisions – life (excluding health and index-linked and unit-linked) R0650 0
Technical provisions calculated as a whole R0660 0
Best Estimate R0670 0
Risk margin R0680 0
Technical provisions – index-linked and unit-linked R0690 0
Technical provisions calculated as a whole R0700 0
Best Estimate R0710 0
Risk margin R0720 0
Other technical provisions R0730 0
Contingent liabilities R0740 0
Provisions other than technical provisions R0750 800,000
Pension benefit obligations R0760 0
Deposits from reinsurers R0770 0
Deferred tax liabilities R0780 5,810,777
Derivatives R0790 114,234,248
Debts owed to credit institutions R0800 0
Financial liabilities other than debts owed to credit institutions R0810 0
Insurance & intermediaries payables R0820 1,809,246
Reinsurance payables R0830 1,296,842
Payables (trade, not insurance) R0840 53,988
Subordinated liabilities R0850 0
Subordinated liabilities not in Basic Own Funds R0860 0
Subordinated liabilities in Basic Own Funds R0870 0
Any other liabilities, not elsewhere shown R0880 9,624,448
Total liabilities R0900 551,580,442
Excess of assets over liabilities R1000 833,244,754

67
Appendix 5: S.23.01.01 Own Funds
Total Tier 1 - unrestricted Tier 1 - restricted Tier 2 Tier 3
C0010 C0020 C0030 C0040 C0050
Basic own funds before deduction for participations in other financial sector as
foreseen in article 68 of Delegated Regulation 2015/35 808,244,754 808,244,754 0 0 0
Ordinary share capital (gross of own shares) R0010 0 0 0 0 0
Share premium account related to ordinary share capital R0030 0 0 0 0 0
Initial funds, members' contributions or the equivalent basic own - fund item for
mutual and mutual-type undertakings R0040
0 0 0 0 0
Subordinated mutual member accounts R0050 0 0 0 0 0
Surplus funds R0070 0 0 0 0 0
Preference shares R0090 0 0 0 0 0
Share premium account related to preference shares R0110 0 0 0 0 0
Reconciliation reserve R0130 808,244,754 808,244,754 0 0 0
Subordinated liabilities R0140 0 0 0 0 0
An amount equal to the value of net deferred tax assets R0160 0 0 0 0 0
Other items approved by supervisory authority as basic own funds not specified
above R0180
0 0 0 0 0
Own funds from the financial statements that should not be represented by the
reconciliation reserve and do not meet the criteria to be classified as Solvency II
own funds 0 0 0 0 0
Own funds from the financial statements that should not be represented by the
reconciliation reserve and do not meet the criteria to be classified as Solvency II
own funds
R0220
0 0 0 0 0
Deductions 0 0 0 0 0
Deductions for participations in financial and credit institutions R0230 0 0 0 0 0
Total basic own funds after deductions R0290 808,244,754 808,244,754 0 0 0
Ancillary own funds 0 0 0 0 0
Unpaid and uncalled ordinary share capital callable on demand R0300 0 0 0 0 0
Unpaid and uncalled initial funds, members' contributions or the equivalent basic
own fund item for mutual and mutual - type undertakings, callable on demandR0310
0 0 0 0 0
Unpaid and uncalled preference shares callable on demand R0320 0 0 0 0 0
A legally binding commitment to subscribe and pay for subordinated liabilities on
demand R0330
0 0 0 0 0
Letters of credit and guarantees under Article 96(2) of the Directive 2009/138/EC R0340 0 0 0 0 0
Letters of credit and guarantees other than under Article 96(2) of the Directive
2009/138/ECR0350
0 0 0 0 0
Supplementary members calls under first subparagraph of Article 96(3) of the
Directive 2009/138/ECR0360
0 0 0 0 0
Supplementary members calls - other than under first subparagraph of Article
96(3) of the Directive 2009/138/ECR0370
0 0 0 0 0
Other ancillary own funds R0390 0 0 0 0 0
Total Tier 1 - unrestricted Tier 1 - restricted Tier 2 Tier 3
C0010 C0020 C0030 C0040 C0050
Total ancillary own funds R0400 0 0 0 0 0
Available and eligible own funds 3,232,979,016 3,232,979,016 0 0 0
Total available own funds to meet the SCR R0500 808,244,754 808,244,754 0 0 0
Total available own funds to meet the MCR R0510 808,244,754 808,244,754 0 0 0
Total eligible own funds to meet the SCR R0540 808,244,754 808,244,754 0 0 0
Total eligible own funds to meet the MCR R0550 808,244,754 808,244,754 0 0 0
SCR R0580 207,215,228 0 0 0 0
MCR R0600 51,803,807 0 0 0 0
Ratio of Eligible own funds to SCR R0620 4 4 4 4 4
Ratio of Eligible own funds to MCR R0640 16 16 16 16 16
Total
C0060
Reconciliation reserve 858,244,753.9
Excess of assets over liabilities R0700 833,244,754
Own shares (held directly and indirectly) R0710 0
Foreseeable dividends, distributions and charges R0720 25,000,000
Other basic own fund items R0730 0
Adjustment for restricted own fund items in respect of matching adjustment
portfolios and ring fenced fundsR0740
0
Reconciliation reserve R0760 808,244,754
Expected profits 0
Expected profits included in future premiums (EPIFP) - Life business R0770 0
Expected profits included in future premiums (EPIFP) - Non- life business R0780 0
Total Expected profits included in future premiums (EPIFP) R0790 0

68
Appendix 6: S.25.01.01 Solvency Capital Requirement – for undertakings on Standard Formula
Article 112 Z0010 2 - Regular reporting
Net solvency capital
requirement
Gross solvency
capital requirement
Allocation from
adjustments due to
RFF and Matching
adjustments
portfolios
C0030 C0040 C0050
Market risk R0010 136,550,748 136,550,748 0
Counterparty default risk R0020 17,000,528 17,000,528 0
Life underwriting risk R0030 0 0 0
Health underwriting risk R0040 1,019,075 1,019,075 0
Non-life underwriting risk R0050 126,831,540 126,831,540 0
Diversification R0060 -64,429,464 -64,429,464 0
Intangible asset risk R0070 0 0 0
Basic Solvency Capital Requirement R0100 216,972,428 216,972,428 0
ND
Calculation of Solvency Capital Requirement C0100
Adjustment due to RFF/MAP nSCR aggregation R0120 0
Operational risk R0130 11,759,316
Loss-absorbing capacity of technical provisions R0140 0
Loss-absorbing capacity of deferred taxes R0150 -21,516,515
Capital requirement for business operated in accordance with Art. 4 of Directive
2003/41/EC R0160 0
Solvency Capital Requirement excluding capital add-on R0200 207,215,228
Capital add-on already set R0210 0
Solvency capital requirement for undertakings under consolidated methodR0220 207,215,228
Other information on SCR 0
Capital requirement for duration-based equity risk sub-module R0400 0
Total amount of Notional Solvency Capital Requirements for remaining part R0410 0
Total amount of Notional Solvency Capital Requirements for ring fenced fundsR0420 0
Total amount of Notional Solvency Capital Requirements for matching
adjustment portfolios R0430 0
Diversification effects due to RFF nSCR aggregation for article 304 R0440 0
Method used to calculate the adjustment due to RFF/MAP nSCR aggregation R0450 4 - No adjustment
Net future discretionary benefits R0460 0

69
Appendix 7: S.28.01.01 Minimum Capital Requirement – Only life of only non-life insurance or
reinsurance activity
Linear formula component for non-life insurance and reinsurance obligations
C0010
MCRNL Result R0010 48,667,168.6
Net (of
reinsurance/SPV)
best estimate and
TP calculated as a
whole
Net (of
reinsurance)
written premiums
in the last 12
months
C0020 C0030
Medical expense insurance and proportional reinsurance R0020 327,580 367,708
Income protection insurance and proportional reinsurance R0030 1,310,319 1,470,831
Workers' compensation insurance and proportional reinsurance R0040 0 0
Motor vehicle liability insurance and proportional reinsurance R0050 15,441,279 5,731,774
Other motor insurance and proportional reinsurance R0060 3,860,320 1,432,944
Marine, aviation and transport insurance and proportional reinsurance R0070 155,908 336,063
Fire and other damage to property insurance and proportional reinsuranceR0080 8,315,828 10,348,508
General liability insurance and proportional reinsurance R0090 323,671,970 82,329,374
Credit and suretyship insurance and proportional reinsurance R0100 0 128
Legal expenses insurance and proportional reinsurance R0110 2,068,387 1,689,258
Assistance and proportional reinsurance R0120 0 0
Miscellaneous financial loss insurance and proportional reinsurance R0130 0 0
Non-proportional health reinsurance R0140 0 0
Non-proportional casualty reinsurance R0150 0 0
Non-proportional marine, aviation and transport reinsurance R0160 0 0
Non-proportional property reinsurance R0170 0 0
Linear formula component for life insurance and reinsurance obligations
C0040
MCRL Result R0200 0
Net (of
reinsurance/SPV)
best estimate and
TP calculated as a
whole
Net (of
reinsurance/SPV)
total capital at risk
C0050 C0060
Obligations with profit participation - guaranteed benefits R0210 0 0.0
Obligations with profit participation - future discretionary benefits R0220 0 0.0
Index-linked and unit-linked insurance obligations R0230 0 0.0
Other life (re)insurance and health (re)insurance obligations R0240 0 0.0
Total capital at risk for all life (re)insurance obligations R0250 0.0 0
Overall MCR calculation
C0070
Linear MCR R0300 48,667,169
SCR R0310 207,215,228
MCR cap R0320 93,246,853
MCR floor R0330 51,803,807
Combined MCR R0340 51,803,807
Absolute floor of the MCR R0350 2,500,000
C0070
Minimum Capital Requirement R0400 51,803,807