Embed Size (px)
Citation preview

IP USE IN A DEVELOPING COUNTRY: EVIDENCE FROM CHILE
Bronwyn Hall (UC Berkeley)Maria Jose Abud Sittler (INAPI, Chile)Carsten Fink (WIPO)Christian Helmers (University of Santa Clara)
EPIP Bordeaux ‐ 5 September 2017

Some questions…• Are developing countries able to make effective use of an IP system?• Or does such a system mainly benefit multinationals and other foreigners who produce or market in the country?
• More nuanced:• At what level of development does an IP system benefit a country?• What are the differences in the use of different types of formal IP? (patents, design rights, trademarks)
September 2017 EPIP 2

Some questions (2)• Pharmaceuticals often an argument for strengthening of Intellectual Property (IP) system in developing countries
• Does stronger patent protection promote:• The decision by foreign multinationals to sell drugs in developing countries? Yes, according to Cockburn, Lanjouw, Schankerman
• Technology transfer to developing countries? Maybe not in the least developed countries
• Foreign direct investment? Probably• The development of a domestic, innovative pharmaceutical industry? Not clear yet
September 2017 EPIP 3

Chile • 1988/90 – end of military dictatorship, transition to democracy
• 1991 – reformed IP system, real GDP per capita US $7,692• 2006 – election of Bachelet, socialist party• 2010 – joined OECD, real GDP per capita US $18,051• 2016 – real GDP per capita US $23,478 (between Russia and Turkey, both of which were much higher in 1991)
Question: Did the reformed IP system have anything to do with this growth?
September 2017 EPIP 4

September 2017 EPIP 5

Report of a major WIPO study• Comprehensive data construction:
• All Chilean patents, trademarks, and design rights between 1991 and 2010
• ENIA manufacturing census 1995‐2005• Innovacion surveys 1997‐1998, 2000‐2001, 2003‐2010• Complete list of drugs registered at the ISP (Institute of Public Health) 1934‐2012, with owners and producers, active ingredients, etc.
• Matching:• IP matched to ENIA and Innovacion• Patents and trademarks matched to registered drugs
September 2017 EPIP 6
IP use overview – all filings
September 2017 EPIP 7
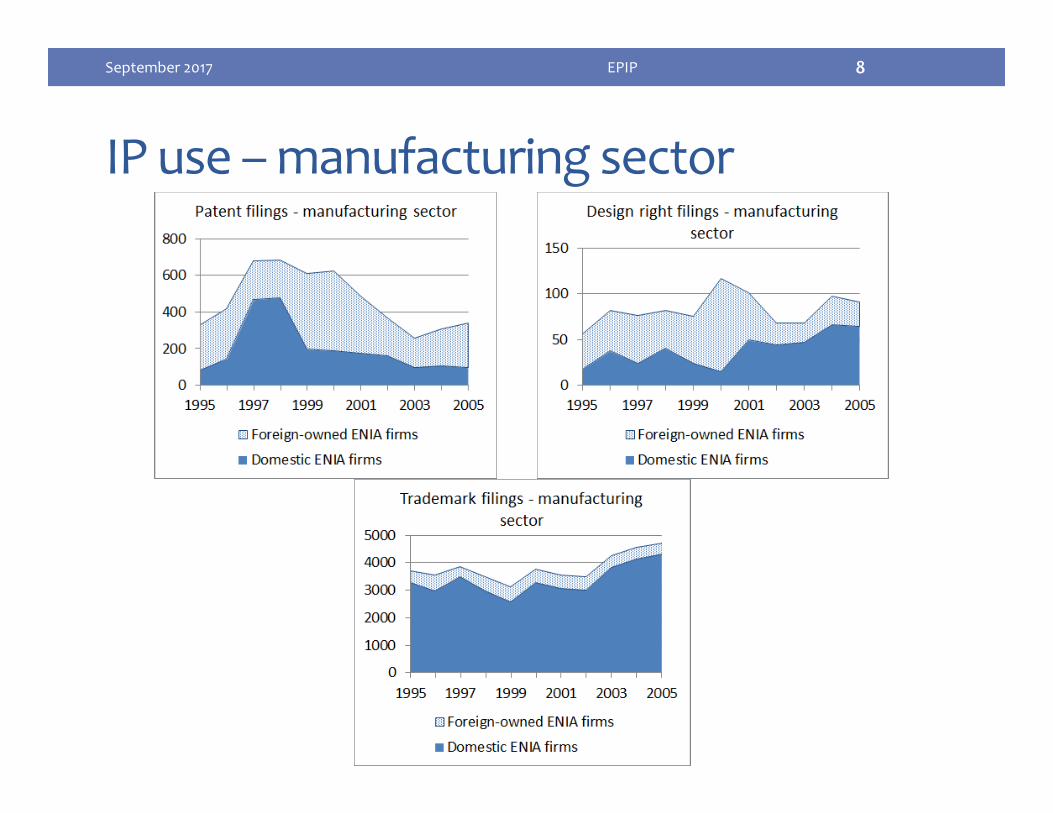
IP use –manufacturing sector
September 2017 EPIP 8

Our investigations• Using only ENIA and IP data (50,000 obs on 7800 firms, 1995‐2005)• Determinants: Use and number of patents, trademarks and design rights as a function of firm size, capital intensity, ownership, exporting, location (Santiago), market share, industry concentration, and industry dummies• Size, exporting, market share, and Santiago location generally positive for all types
• Foreign ownership positive for patents, negative for trademarks• Public firms do not trademark much.
• Performance: Diff‐in‐diff estimation for employment, sales, TFP after first time IP use.• Estimated with and without separate trends for treated and controls• “treated” firms grow faster before and after first time IP use, but TFP is unaffected. (see graph)
September 2017 EPIP 9

D‐i‐D estimates
September 2017 EPIP 10

Our investigations (2)• Using ENIA, IP, and Innovation surveys (5,000 obs on 2,000 firms, 1997‐2005)
• Focus on trademarks and product innovation, include R&D information
• Modified CDM model with equations for:• Doing R&D (0/1)• R&D intensity • Product innovator (0/1)• New to market product innovator (0/1)• Trademark use (0/1)• Productivity
September 2017 EPIP 11

CDM model variation
September 2017 EPIP 12
The R&D‐innovation‐IP‐performance model
Does R&D?R&D
intensity
Innovationproduct or process
IP protection?
Performance (TFP)
ExporterForeign
CollaboratesInfo sources
SizeIndustryYear
Industry level:financial constraints
trademark use
collaboratesfinancial constraints
info sources
capitalemployment

R&D equation• R&D varies positively with size, exporting, collaboration, market share, and university/PRO sources of innovation information, • in much the same way and with similar coefficients as in developed economies (e. g., UK and France)
• Only difference is foreign‐ownership, negatively associated with probability of doing R&D and its level.
• Note: industry and year dummies included in all regressions.
September 2017 EPIP 13

Innovation and trademark use• Both new‐to‐firm and new‐to‐market product innovation vary positively with R&D, size, collaboration, and information sources. • Financial constraints as a barrier to innovation not related to product innovation in Chile
• Trademark use depends strongly on new‐to‐market product innovation, and also on imitative product innovation• Mean use is 28.5%, increases are 10‐13% higher for mkt innovation• Depends on fitted (predicted) R&D intensity, but not on observed.• Insignificantly related to design and packaging innovation
September 2017 EPIP 14

TFP and innovation/trademarks
September 2017 EPIP 15
Dependent variable: Log sales per employee
Trademark user 0.024(0.023)
0.016(0.023)
‐0.021(0.036)
Product innovator ‐0.021(0.018)
Predicted product innovator 0.202***(0.050)
0.190***(0.056)
Trademark user * predicted productinnovator
0.033(0.069)
Log capital per employee 0.135***(0.009)
0.134***(0.009)
0.134***(0.009)
Log materials per employee 0.598***(0.015)
0.593***(0.015)
0.593***(0.015)
Log employees 0.054***(0.010)
0.035***(0.010)
0.035***(0.010)
Year and industry dummies included; robust standard errors clustered on firm.

Conclusions• Differences from developed countries
• Most patents from outside the country• Foreign‐owned firms less likely to do R&D• IP does not have any productivity impact (yet) – compare to Hall and Sena (2017) for the UK
• Similarities to developed countries• Heavy trademark use by domestic firms and individuals• Relationship of R&D to firm characteristics very similar• Relationship of innovation to firm characteristics also similar
• Next: What about pharmacuetical IP?
September 2017 EPIP 16

Policy debate on pharma IP• India’s Glivec decision, 1 April 2013 – imatinib mesylate (anti‐cancer drug) rejected by Supreme Court for obviousness• Crucial issue: are new forms (beta crystalline form) of known substances patentable?
• Original discovery of imatinib goes back to 1993, before product patents were available in India
• Proposals to restrict secondary patents:• Brazil’s Projeto de Lei n° 5.402/2013 (includes provision similar to paragraph 3d of India’s Patent Act).
• South Africa’s proposed National Policy on IP: “[Legislation] should exclude diagnostic, therapeutic and surgical methods from patentability, including new uses of known products, as is the case under the TRIPS agreement.”
• TPP’s draft Article QQ.E.1: critical issue ‐ patentability of new uses or methods of using a known product and “enhanced efficacy of a known product” threshold.
September 2017 EPIP 17

Our study• Exploratory, based on a complete set of data for a single country, Chile.
• Ingredients:• Complete patent application database, including applicant info, legal status, etc., 1991‐2010
• Complete trademark application database with the same, 1991‐2010
• Complete list of drugs registered at the ISP (Institute of Public Health) 1934‐2012, with owners and producers, active ingredients, etc.
• Many challenges in matching these data….
September 2017 EPIP 18

Our Research Questions• What is the share of patents held by foreign pharma companies associated with drugs commercialized on the domestic market?• This measures the “working” of patents
• Do foreign pharma firms use strategic patenting behavior to keep domestic generic producers off the market?• This measures impact on (broadly defined) “innovation”• More specifically:
• How is entry into the manufacture of drugs for specific therapeutic categories affected by the presence of foreign pharma patents?
• Do secondary patents delay entry by Chilean firms into drug production?
September 2017 EPIP 19

Patenting strategies• Multiple functions of patents: ensure freedom to operate, bargaining etc
• Are patents also used to block/delay entry of generics and avoid loss of (broad) exclusivity?
• Primary vs secondary patents• Extend patent life• Increase patent breadth• Facilitate follow‐on inventions (“evergreening”)
September 2017 EPIP 20

Patenting strategies: length• Patent cluster to extend lifetime
• Incremental innovation or fencing strategy?
September 2017 EPIP 21
Primary patent
Secondary patent
Secondary patent
Secondary patent
TimeLoss of exclusivity

Patenting strategies: breadth• Patent cluster to extend breadth:
• Incremental innovation or fencing strategy?
September 2017 EPIP 22
Active ingredient
Salt
Crystalline form
Dosage
Formulation
Process

Patenting strategies: anecdotal evidence"We were recently successful in asserting the crystalline form patent in [name of country], where we obtained an injunction against several generic companies based on these patents by 'trapping' the generics: they either infringe our crystalline form patent, or they infringe our amorphous form process patent when they convert the crystalline form to the amorphous form.”Anonymous pharmaceutical company quoted in EU Commission (2009)
“The entire point of the patenting strategy adopted by many originators is to remove legal certainty. The strategy is to file as many patents as possible on all areas of the drug and create a 'minefield' for the generic to navigate. All generics know that very few patents in that larger group will be valid and infringed by the product they propose to make, but it is impossible to be certain prior to launch that your product will not infringe and you will not be the subject of an interim injunction.”Anonymous generic producer quoted in EU Commission (2009)
September 2017 EPIP 23

Patenting strategies: empirical evidence
• EU Commission (2009): • primary to secondary patent ratio 1:7
• pending patents 1:13 • granted patents 1:5
• Disproportionately more secondary patents after product launch
• Kapczynski et al. (2012):• Of new drugs with FDA in 1991‐2005: 56% formulation, 24% salts, crystalline forms etc., 63% methods of use (secondary patents)
• Secondary patents filed after FDA approval and extend exclusivity lifetime by 4‐5 years
• More secondary patents the higher is the branded drug’s sales
September 2017 EPIP 24

Chilean setting ‐ ISP• Midlevel developing/emerging economy with relatively good institutions
• Drugs must be registered with the Public Health Institute (ISP)• Submit samples, formulae, clinical trial evidence• Takes 6‐18 mos, fees are ~$2300• Many registrations are for new formulations of existing drugs• Generics can rely on proprietary evidence after 5 years of exclusivity following ISP application• now changing to require proof of bioequivalence
• Patent protection not required for registration
September 2017 EPIP 25

September 2017 EPIP 26
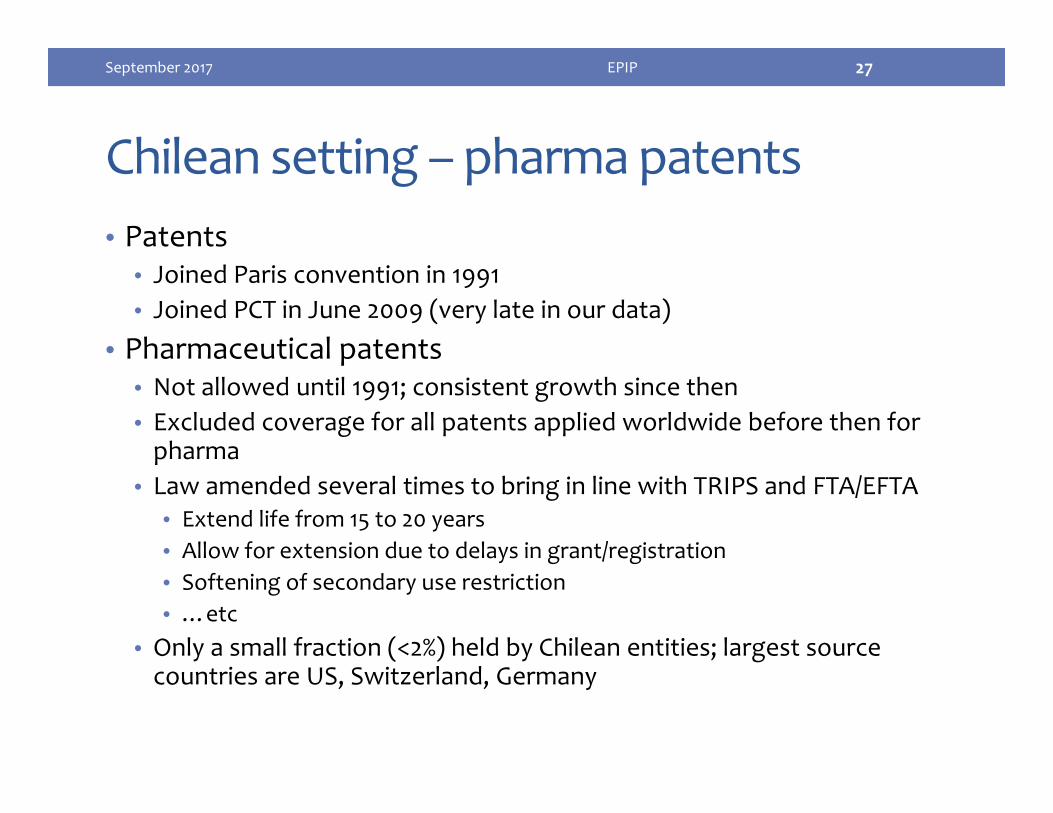
Chilean setting – pharma patents• Patents
• Joined Paris convention in 1991• Joined PCT in June 2009 (very late in our data)
• Pharmaceutical patents• Not allowed until 1991; consistent growth since then• Excluded coverage for all patents applied worldwide before then for pharma
• Law amended several times to bring in line with TRIPS and FTA/EFTA• Extend life from 15 to 20 years• Allow for extension due to delays in grant/registration• Softening of secondary use restriction• …etc
• Only a small fraction (<2%) held by Chilean entities; largest source countries are US, Switzerland, Germany
September 2017 EPIP 27

September 2017 EPIP 28
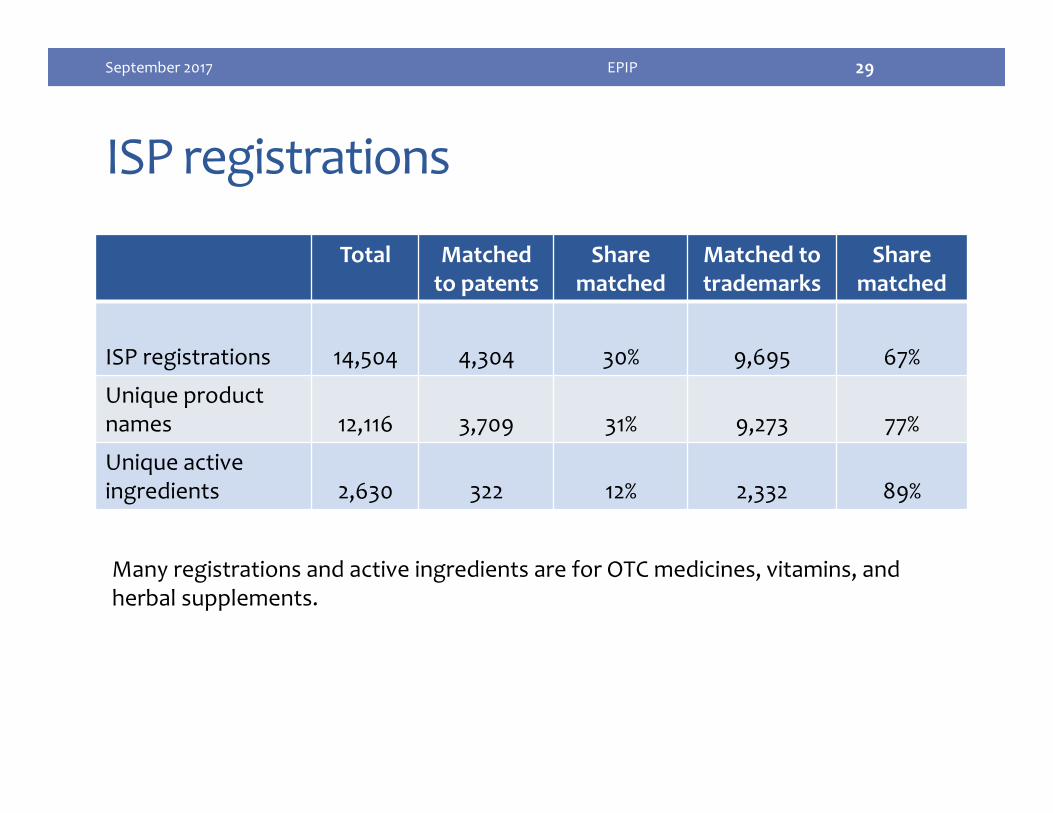
ISP registrations
September 2017 EPIP 29
Total Matched to patents
Share matched
Matched to trademarks
Share matched
ISP registrations 14,504 4,304 30% 9,695 67%
Unique product names 12,116 3,709 31% 9,273 77%
Unique active ingredients 2,630 322 12% 2,332 89%
Many registrations and active ingredients are for OTC medicines, vitamins, and herbal supplements.

Primary vs secondary patents113 (22%) of 504 matched patents are primary patents.Primary pats more likely to have been granted.
September 2017 EPIP 30

Does ISP registration lag patent app?
September 2017 EPIP 31
86% of primary patents applied for before ISP registration.56% of secondary patents applied for before ISP registration.
Median lags:Primary ‐ 6 yearsSecondary ‐ 2 years
Delayed entry?

Top therapeutic classes protected by patents• Anti‐ulcer, anti‐depressants, etc. are older drugs (pre‐1991) and have few primary patents if any.
• Anti‐virals (including HIV) and anti‐neoplastics (anti‐cancer) are newer.
September 2017 EPIP 32
Share
Therapeutic groupPrimary patents
Secondary patents
Primary patents
anti‐viral agents 20 41 32.8%anti‐neoplastics 14 23 37.8%anti‐depressants 2 33 5.7%anti‐psychotics 1 31 3.1%anti‐diabetic agents 8 24 25.0%analgesics 8 23 25.8%nonsteroidal anti‐inflammatory agents 7 20 25.9%immunologic agents 9 13 40.9%antibiotics/anti‐neoplastics 5 17 22.7%gastrointestinal agents (anti‐ulcer) 2 19 9.5%anti‐fungals 3 16 15.8%broncho‐dilators 1 18 5.3%anti‐asthmatic combinations 3 15 16.7%anti‐histamines 2 15 11.8%agents for pulmonary hypertension 1 15 6.3%bone resorption inhibitors 0 16 0.0%quinolones 3 12 20.0%cholesterol absorption inhibitors 3 11 21.4%hormones 1 11 8.3%narcotic analgesics 2 10 16.7%anti‐infectives 2 10 16.7%remaining classes 63 421 13.0%Total 160 814
Number of patents per therapeutic classNumber

Role of Chilean firms• Mostly domestic manufacturing, quality control, importing, packaging, and distribution
• Two drugs have a Chilean firm as the source, but no patents: • meropenem trihydrate (generic antibiotic) • warfarin sodium (generic anti‐coagulant)
• Two drugs have secondary patents owned by Chilean firms, no primary patents:• Larmax‐D, an anti‐histamine compound• Faronkal, a nasal decongestant compound used for sleep apnea
• Exploratory regressions:• Share of Chilean firms mfg each AI on primary patent dummy, number of ISP regs for that AI, number of patents for that AI
• Share of Chilean firms mfg in each therapeutic class on number of patents, share primary patents, number of drugs in class, trend
September 2017 EPIP 33

September 2017 EPIP 34
Doubling the number of ISP registrations increases the share mfg by Chile by 0.17That is, Chileans manufacture common drugs with lots of different formulationsIf an AI has a primary patent, lowers the Chilean mfg share by 0.42And not newer drugs that are patent protected.The total number of patents associated with that AI is not related to the Chilean manufactuing share.There is little trend.
Method of estimation
D (any primary patent) ‐0.15 (0.04) *** ‐0.42 (0.10) ***Log (number of ISP regs) 0.05 (0.01) *** 0.17 (0.03) ***Log (number of patents) ‐0.01 (0.03) ‐0.03 (0.06)Year dummiesStandard errorR‐squared
381 observationsCoefficients and standard errors robust to heteroskedasticity are shown.*** denotes significance at the 0.001 level.The year dummies are for the year of the first associated patent application.
Predicting the share of Chilean manufacturing companies for each active ingredient
insignificant no
0.166 0.1090.304 0.635
TobitOLS
September 2017 EPIP 35
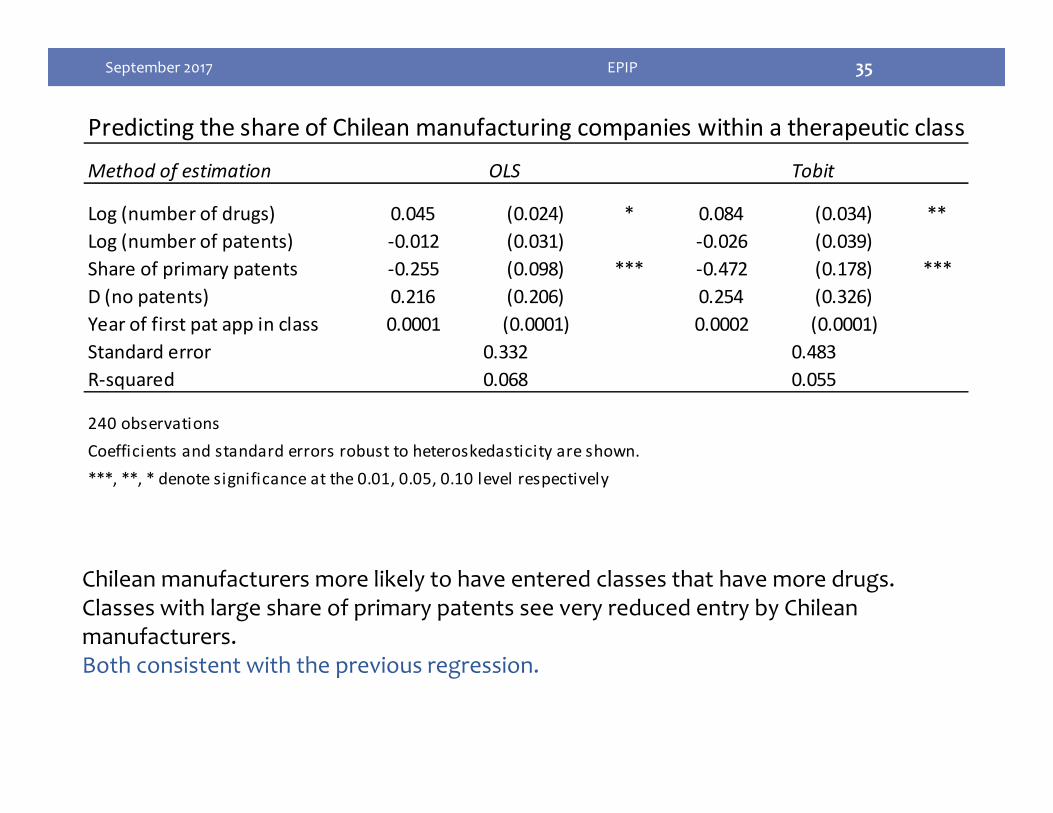
Chilean manufacturers more likely to have entered classes that have more drugs.Classes with large share of primary patents see very reduced entry by Chilean manufacturers.Both consistent with the previous regression.
Method of estimation
Log (number of drugs) 0.045 (0.024) * 0.084 (0.034) **Log (number of patents) ‐0.012 (0.031) ‐0.026 (0.039) Share of primary patents ‐0.255 (0.098) *** ‐0.472 (0.178) ***D (no patents) 0.216 (0.206) 0.254 (0.326)Year of first pat app in class 0.0001 (0.0001) 0.0002 (0.0001)Standard errorR‐squared
240 observationsCoefficients and standard errors robust to heteroskedasticity are shown.***, **, * denote significance at the 0.01, 0.05, 0.10 level respectively
0.068 0.055
Predicting the share of Chilean manufacturing companies within a therapeutic class
OLS Tobit
0.332 0.483
Conclusion• Almost all pharma patents in Chile held by foreign firms.• Almost no products by domestic companies protected bypatents.
• Negative relationship across therapeutic classes between share of drugs patented by foreign companies and number of drugs manufactured by domestic companies.
• Weak evidence for strategic patenting behavior in pharmaceuticals in the form of extending patent life.
September 2017 EPIP 36

Sources• Fink, C., B. H. Hall, and C. Helmers (2017). What explains intellectual
property use in Chile and does it make a difference? Draft working paper.
• Abud Sittler, M. J., B. H. Hall, and C. Helmers (2015). An Empirical Analysis of Primary and Secondary Pharmaceutical Patents in Chile. PLOS ONE. doi:10.1371/journal.pone.0124257. Also NBER Working Paper No. 20995.
• Abud, M. J., C. Fink, B. H. Hall, and C. Helmers (2013). The use of intellectual property in Chile. INAPI-WIPO Report, Economic Research Working Paper No. 11 (July).
• Hall, B. H. (2014). Does Patent Protection Help or Hinder Technology Transfer? In S. Ahn, B. H. Hall, and K. Lee (eds.), Intellectual Property for Economic Development: Issues and Policy Implications, Edward Elgar.
September 2017 EPIP 37

BACKUP SLIDESPharma data construction
September 2017 EPIP 38

Data Construction• Objective: link products with patents & trademarks• Chilean patent office (INAPI): Universe of patents and trademarks filed with INAPI between 1991 and 2010 by domestic and foreign entities.
• National public health institute (ISP): All drugs registered in Chile. The information includes active ingredients of all registered products, the owner of the drug, whether the drug is produced domestically or abroad, etc. (but not patent numbers)
• Merck Index (MI) and US FDA Orange Book (OB): MI provides first filing of patent protecting active ingredients. OB provides US patents of active ingredients.
September 2017 EPIP 39

Data challenges• Active ingredients, patents, trademarks use different classification systems
• A single patent can protect multiple active ingredients (and vice versa)
• A product can be associated with several patents and trademarks
• Active ingredients appear in multiple products• Spelling of the owner name varies considerably within and across the various data sources
September 2017 EPIP 40

Data construction• We have an active ingredient‐product match from ISP (non‐unique in some cases)
• Matching CL patents to active ingredients:• 2005‐2010: we have a match done by patent examiners specializing in pharma
• Pre‐2005: translate AI description to English; search in Merck Index of first filings and the US Orangebook for US patents associated with the AI; find CL equivalent patents;
• Also do our own search in CL granted patents • All matches validated by Chilean experts in pharma patents; they also labelled patents as secondary vs primary.
• Matching CL trademarks to products• Search by product (drug name) and owner in the trademark database – in contrast to patents, about half of drug‐associated trademarks are owned by Chilean firms
September 2017 EPIP 41

ISP registrations – various firm functions
September 2017 EPIP 42