Embed Size (px)
Citation preview

Iowa State Board of Education
Executive Summary
November 16, 2011
Agenda Item: Iowa’s Community College Adult Literacy Annual Report—Fiscal Year 2010 (July 1, 2009 – June 30, 2010)
Iowa Goal: Individuals will pursue postsecondary education in order
to drive economic success. Equity Impact Statement: Iowa's adult basic education program is available to
Iowa's adult target population(s) that lacks basic literacy skills, English proficiency, or who have not attained a secondary school credential.
Presenters: Colleen Hunt, Chief
Bureau of Adult, Career, and Community College Education
Amy Vybiral, Federal Data Consultant Bureau of Adult, Career, and Community College Education
Attachments: 1 Recommendation: It is recommended that the State Board hear and discuss
this information. Background: The purpose of this presentation is to inform the State
Board about Iowa’s adult basic education for fiscal year 2010.
Framework for Board Policy
Development and Decision Making
Issue
Identification Board
Identifies Priorities
Board Analysis
Study
Board Follow- Through
Board Action

Executive SummaryAdult Literacy Report 2010

EXECUTIVE SUMMARY
The Iowa Department of Education collects adult literacy enrollment and demo-graphic information from all 15 community colleges throughout the fiscal year. This report summarizes several aspects of community college enrollment and demographic information. Some of the highlights of this report are:
• Reported enrollment of total students served increased an average of 2.3 percent per year from 2006 to 2010, with an increase of 4.1 percent from 2009 to 2010 (Appendix H). • Total enrollment fell at six of the 15 community colleges (Appendix H). • Hours of instruction rose 3.2 percent from 2006 to 2010 and 15.8 percent from 2009 to 2010 (Appendix I). • Hours of instruction fell for six of the 15 community colleges from 2006 and 2010 (Appendix I). • Enrollment for persisters retained 12 or more hours remained steady from 2006 to 2010 at .29 percent and increased from 2009 to 2010 by 6.7 percent (Appendix J). • Hours of instruction for persisters retained 12 or more hours of instruction increased 2.4 percent from 2006 to 2010 and 12.8 percent from 2009 to 2010 (Appendix K). • Grade level completions fell 1.6 percent from 2006 to 2010 (Appendix L). • The GED pass rate remained steady at 98.9 percent in 2010 (Appendix N). • Iowa’s percentage of the federal allocation decreased from .690 percent of the federal allocation in 2009 to .589 percent of the federal allocation in 2010 (Appendix O). • The average age of an Iowa adult literacy student is 28 years, over 75 percent of participants were between the ages of 19 and 59 in 2010 (Appendix A). • Fifty-one percent (51%) of participants are female, 49 percent are male (Appendix B). • Twenty-six percent (26%) of participants self-identify as “Hispanic or Latino” in contrast to Iowa’s five percent of the population identified as “Hispanic or Latino” according to the U.S. Census Bureau, 2010 (Appendix C) • Participants self-identified as “White” represent 82.3 percent of the adult literacy population, followed by 18.25 percent “Black or African American” (Appendix D). • The average grade level equivalent of an adult literacy student is 5.6 years (Appendix E). • In 2010, 57 percent of participants reported “unemployed” at time of program entry (Appendix G).
Iowa Department of Education
November 16, 2011Department of EducationDivision of Community Colleges515.339.4520

A REPORT TO THE LEGISLATURE ADDITIONAL DATA 2011
COMMUNITY COLLEGES BUREAU OF ADULT, CAREER, AND COMMUNITY COLLEGE EDUCATION
www.educateiowa.gov/ccpublications/
The Annual Adult Literacy Report 2010
http://educateiowa.gov/adultliteracy

IOWA’S COMMUNITY COLLEGE ADULT LITERACYANNUAL REPORT
Fiscal Year 2010
July 1, 2009 – June 30, 2010
Iowa Department of Education

State of IowaDepartment of EducationGrimes State Office BuildingDes Moines IA 50319-0146
State Board of Education Rosie Hussey, President, Clear LakeCharles C. Edwards, Jr., Vice President, Des MoinesSister Jude Fitzpatrick, West Des MoinesEric Goranson, Des MoinesMichael L. Knedler, Council BluffsValorie J. Kruse, Sioux CityAna Lopez, PellaMax Phillips, WoodwardLaMetta Wynn, ClintonBrandon Bolte, Student Member, Ankeny
AdministrationJason E. Glass, Director and Executive Officer
of the State Board of EducationGail M. Sullivan, Chief of Staff
Bureau of Adult, Career, and Community College Education
Roger Utman, Ph.D., Administrator
Bureau of Adult, Career, and Community College Education
Colleen Hunt, Bureau ChiefAmy Vybiral, ConsultantPhyllis Hinton, Consultant
Helping Communities Meet the Learning Needs of all Their Children and Adults
It is the policy of the Iowa Department of Education not to discriminate on the basis of race, creed, color, sex, sexual orientation, gender identity, national origin, gender, disability, religion, age, political party affiliation, or actual or potential parental, family or marital status in its programs, activities, or employment practices as required by the Iowa Code sections 216.9 and 256.10(2), Titles VI and VII of the Civil Rights Act of 1964 (42 U.S.C. § 2000d and 2000e), the Equal Pay Act of 1973 (29 U.S.C. § 206, et seq.), Title IX (Educational Amendments, 20 U.S.C. §§ 1681 – 1688) Section 504 (Rehabilitation Act of 1973, 29 U.S.C. § 794), and the Americans with Disabilities Act (42 U.S.C. § 12101, et seq.).
If you have questions or grievances related to compliance with this policy by the Iowa Department of Education, please contact the legal counsel for the Iowa Department of Education, Grimes State Office Building, 400 E 14th St, Des Moines IA 50319-0146, telephone number 515-281-5295, or the Director of the Office for Civil Rights, U.S. Department of Education, 111 N. Canal Street, Suite 1053, Chicago, IL 60606-7204.

4
Acknowledgement
Many people contributed to The Annual Adult Literacy Report: 2010. The project was super-vised by Roger Utman and Colleen Hunt. The report was written and data compiled by Amy Vybiral. Additional narrative was provided by Phyllis Hinton and Helene Grossman. Formatting and editing was completed by Ardis Summers, Debra Taylor, and Stephanie Weeks. Technical assistance and data feedback were provided by Vladimir Bassis, Kent Farver, Tom Schenk Jr., and Geoff Jones. The authors’ sincerely thank everyone who assisted with this report.
Table of Contents
SECTIONS
I. Mission Statement ...........................................................................................................6II. Program Information ........................................................................................................6III. Student Information ..........................................................................................................7IV. Program Statistics...........................................................................................................14V. State Leadership Information..........................................................................................21VI. Funding ...........................................................................................................................22VII. Future Directions ............................................................................................................23
APPENDICES
Appendix A: Age ..................................................................................................................26Appendix B: Gender ............................................................................................................26Appendix C: Ethnicity ..........................................................................................................27Appendix D: Race ................................................................................................................27Appendix E: Grade Level Equivalent ...................................................................................28Appendix F: Native Language .............................................................................................28Appendix G: Labor Force Status .........................................................................................29Appendix H: Federally-Reported Students Served ..............................................................30Appendix I: Hours of Instruction for All Students ................................................................31Appendix J: Persisters: Pre-assessed and Retained 12 Hours .........................................32Appendix K: Persisters: Hours of Instruction .......................................................................33Appendix L: Completions by Grade Level Equivalent ........................................................34Appendix M: GED’s Passed .................................................................................................35Appendix N: GED Pass Rate ...............................................................................................35Appendix O: Iowa Percentage Federal Allocations ..............................................................36Appendix P: GEDi ...............................................................................................................37Appendix Q: Comprehensive Adult Student Assessment System (CASAS) National Reporting System (NRS) Educational Functioning Levels to CASAS Scale . Scores and Grade Levels ...............................................................................38Appendix R: Tracking of Students and Programs Adult Literacy Program Enrollment by Zip Code Area: 2010 .......................................................................................39

6
I. Mission Statement
The mission of Iowa’s Adult Literacy Statewide Program is to provide accessible, quality instruction that develops life, work, and literacy skills.
II. Program Information
Iowa’s adult literacy programs provide academic services to adults without a high school diploma through Iowa’s 15 community colleges. The focus is to help participants achieve the following:
1. High school diploma, the General Education Development (GED) or equivalent. 2. Basic and workplace skills essential to employers. 3. Academic proficiency to transition to post-secondary education and training. 4. English literacy and civics education.
The Workforce Investment Act (WIA) of 1998, 105th Congress, [Public Law 105-220], Title II, the Adult Education and Family Literacy Act (AEFLA) requires states to develop an adult education and family literacy educational delivery services plan. The purpose of Title II, AEFLA, of WIA (1998), is to create a partnership among the federal government, states, and localities to provide, on a voluntary basis, a state plan for adult education and literacy services to include a description of how the eligible agency will develop program strategies for populations that include, at a minimum:
1. low-income students. 2. Individuals with disabilities. 3. Single parents and displaced homemakers. 4. Individuals with multiple barriers to educational enhancement, including individuals with limited English proficiency; SEC.224 (a)(10).
The overall goal of the Act is “to increase the employability, retention, and earnings of participants and increase occupational skill attainment by participants and, as a result, improve the quality of the workforce, reduce welfare dependency, and enhance the productivity and competitiveness of the Nation.”
According to the U.S. Census Bureau American Community Survey, 16.8 percent of Iowa’s population between the ages of 18-24 (40,142) are without a high school diploma and 8.3 percent (264,461) of Iowa’s population have between a 9th and 12th grade education without a high school diploma. Source: U.S. Census Bureau | American FactFinder, 2010.
http://factfinder2.census.gov/faces/tableservices/jsf/pages/productview.xhtml?pid=ACS_10_1YR_S1501&prodType=table).
Iowa Adult Program Demographics:
The average Iowa adult literacy student in the past decade is 28 years of age and proportionately distributed between males and females. The average grade level equivalent of all students at time of entry is between five and six years of age. The average grade level equivalent of all students entering high school completion programs is between six and eight years of age.
Adult Literacy Report 2010
7
27.75
27.8
27.85
27.9
27.95
28
28.05
28.1
28.15
28.2
28.25
2006 2007 2008 2009 2010
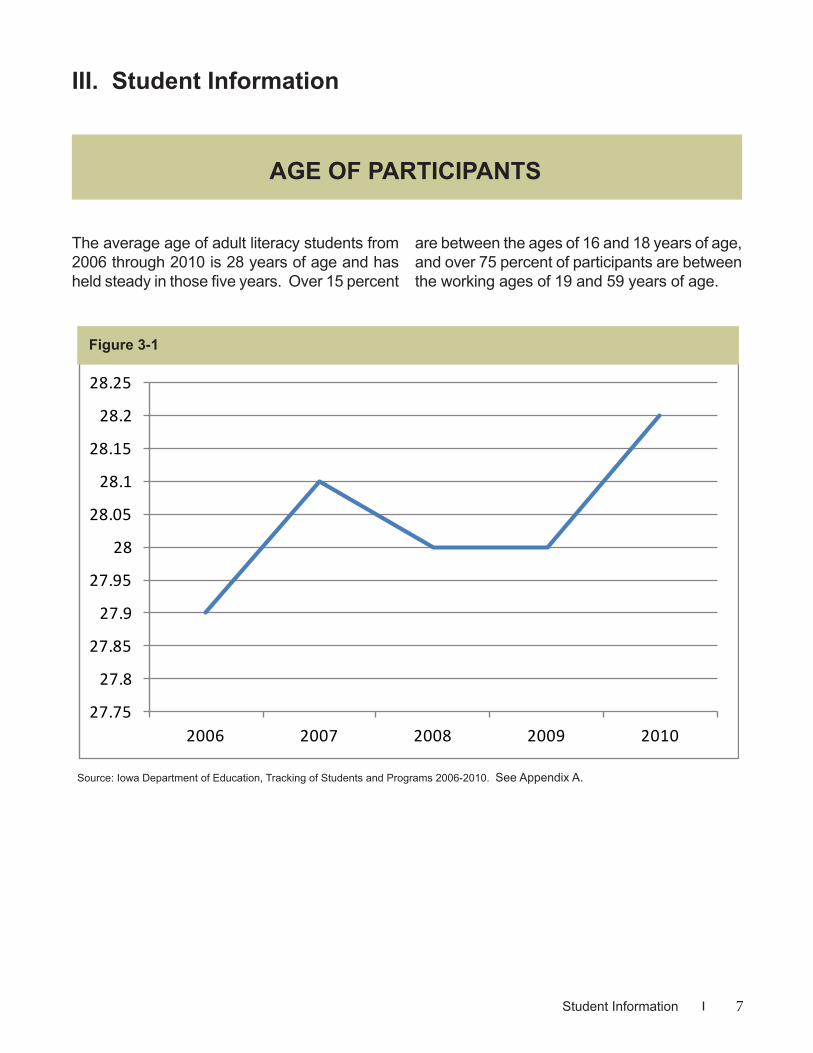
The average age of adult literacy students from 2006 through 2010 is 28 years of age and has held steady in those five years. Over 15 percent
III. Student Information
Source: Iowa Department of Education, Tracking of Students and Programs 2006-2010. See Appendix A.
AGE OF PARTICIPANTS
Figure 3-1
are between the ages of 16 and 18 years of age, and over 75 percent of participants are between the working ages of 19 and 59 years of age.
Student Information

8
0
2,000
4,000
6,000
8,000
10,000
12,000
2006 2007 2008 2009 2010
Male
Female
Adult literacy programs are proportionately attended by males and females; however, in several locations with correctional facilities, the proportion of males to females is slightly higher (e.g., Southeastern Community College) with
Source: Iowa Department of Education, Tracking of Students and Programs 2006-2010. See Appendix B.
GENDER
the exception of Des Moines Area Community College which serves Mitchellville Correctional Facility, housing only the female adult literacy corrections participants.
Figure 3-2
Adult Literacy Report 2010
9
0
2000
4000
6000
8000
10000
12000
14000
16000
2006 2007 2008 2009 2010
Hispanic or Latino
Not Hispanic or Latino
Not Coded
Not Specified
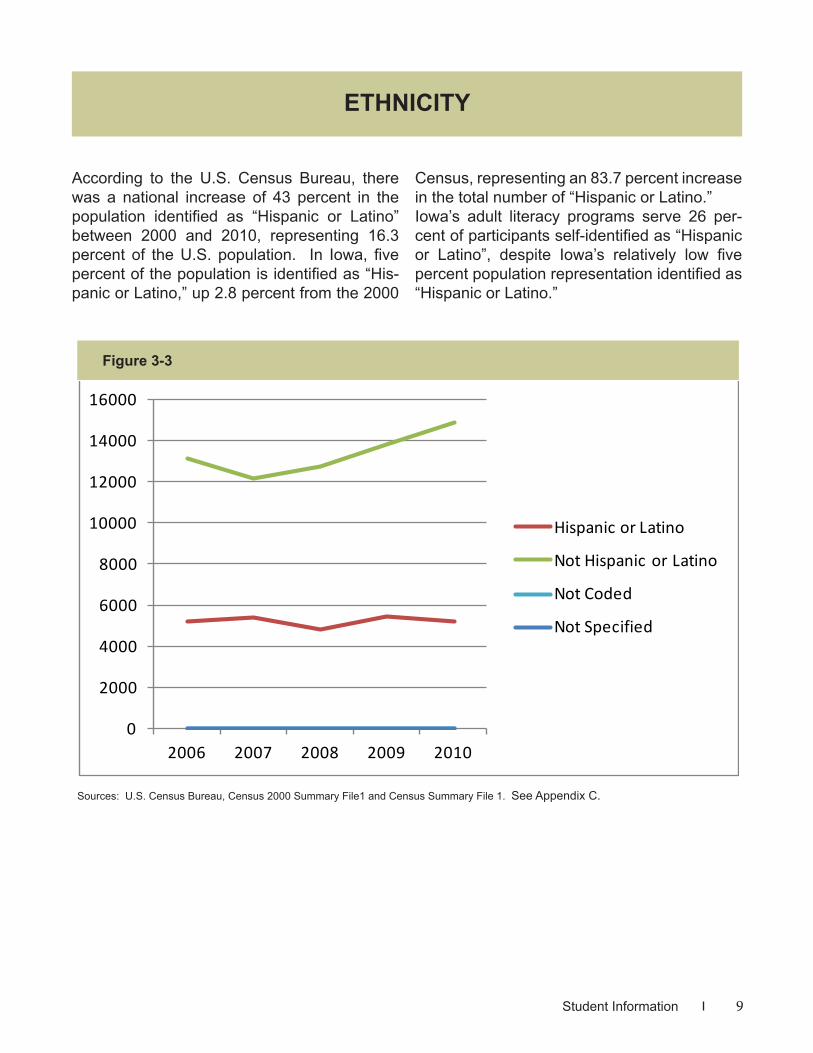
According to the U.S. Census Bureau, there was a national increase of 43 percent in the population identified as “Hispanic or Latino” between 2000 and 2010, representing 16.3 percent of the U.S. population. In Iowa, five percent of the population is identified as “His-panic or Latino,” up 2.8 percent from the 2000
Sources: U.S. Census Bureau, Census 2000 Summary File1 and Census Summary File 1. See Appendix C.
ETHNICITY
Census, representing an 83.7 percent increase in the total number of “Hispanic or Latino.” Iowa’s adult literacy programs serve 26 per-cent of participants self-identified as “Hispanic or Latino”, despite Iowa’s relatively low five percent population representation identified as “Hispanic or Latino.”
Figure 3-3
Student Information

10
0
2000
4000
6000
8000
10000
12000
14000
16000
18000
2006 2007 2008 2009 2010
Alaska Native
American Indian
Asian
Black or African American
Filipino
Other
Pacific Islander
White
Participants self-identified as “White” repre-sent 82.3 percent of the adult literacy popula-tion served, followed by 18.25 percent “Black”
Source: Iowa Department of Education, Tracking of Students and Programs 2006-2010. See Appendix D.
RACE
and 5.99 percent “Asian.” The largest increase between 2006 and 2010 was in the “Black or African American” category of 11.75 percent.
Figure 3-4
Adult Literacy Report 2010

11
0.0
1.0
2.0
3.0
4.0
5.0
6.0
2006 2007 2008 2009 2010
Iowa participant grade level equivalents for 2010, at the time of entry after initial assess-ment are as follows:
1. Basic Skills participants – 5.9 years 2. English-as-a-Second-Language participants – 2.6 years 3. English-as-a-Second-Language/ Civics emphasis participants – 2.8 years
Source: Iowa Department of Education, Tracking of Students and Programs 2006-2010. See Appendix E and Appendix Q.
GRADE LEVEL EQUIVALENT
4. GED participants – 8.2 years, and 5. High School Diploma (equivalency) participants – 6.3 years The average grade level equivalent aggregate of all enrollees, regardless of instructional pro-gram in 2010 was 5.6 years.
Figure 3-5
Student Information

12
0
2000
4000
6000
8000
10000
12000
14000
16000
2006 2007 2008 2009 2010
English
Other
To ensure optimal return on the federal invest-ment, Adult Education and Family Literacy Act (AEFLA) establishes a state performance ac-countability system including continuous im-
Source: Iowa Department of Education, Tracking of Students and Programs 2006-2010. See Appendix F.
NATIVE LANGUAGE
provement in teaching English language ac-quisition and other literacy skills. Iowa serves an average of 6,400 (approximately 34%) non-native English speaking adults annually.
Figure 3-6
Adult Literacy Report 2010

13
0
2000
4000
6000
8000
10000
12000
2006 2007 2008 2009 2010
Employed
Unemployed
Unemployed and Not Seeking Work
Retired
Between 2006 and 2009, 49 percent of par-ticipants reported being “unemployed” at the time of program entry. In 2010, 57 percent of participants reported “unemployed” at time of program entry. Between 2006 and 2010, the number of participants entering the program as
Source: Iowa Department of Education, Tracking of Students and Programs 2006-2010. See Appendix G.
LABOR FORCE STATUS
“employed” has decreased an average of 3.32 percent annually, while the number of partici-pants entering the program reporting “unem-ployed” at the time of entry has increased an average of 7.48 percent annually.
Figure 3-7
Student Information

14
0
5,000
10,000
15,000
20,000
25,000
2006 2007 2008 2009 2010
Federally-eligible instructional programs included in community college expenditure categories in-clude: 1. Basic Skills 2. English-as-a-Second-Language 3. English-as-a-Second-Language/Civics 4. Citizenship 5. High School Diploma (Adult and/or Alternative) 6. General Education Development (GED)
The total number represents all participants enroll-ing in an adult literacy program at a community col-lege in one of the above categories. From 2006 to 2010, there has been a 2.3 percent increase in the total number of adult literacy students served in the expenditure eligible categories. The largest
IV. Program Statistics
Source: Iowa Department of Education, Tracking of Students and Programs 2006-2010. See Appendix H and Appendix R.
FEDERALLY-REPORTED STUDENTS SERVED
increases were 13.1 percent at Des Moines Area Community College, followed by 9.7 percent at Iowa Lakes Community College. (See Appendix H.)
Additional eligible instructional programs with re-stricted use of funding and restricted federal report-ing parameters include: 1. Spanish GED 2. Career and Technical Education 3. Workforce Readiness 4. Adults with Disabilities 5. Health and Safety 6. Home Economics 7. Parent Education 8. Older Adults 9. Other Adult Education
Figure 4-1
Adult Literacy Report 2010

15
0
100,000
200,000
300,000
400,000
500,000
600,000
700,000
800,000
900,000
2006 2007 2008 2009 2010
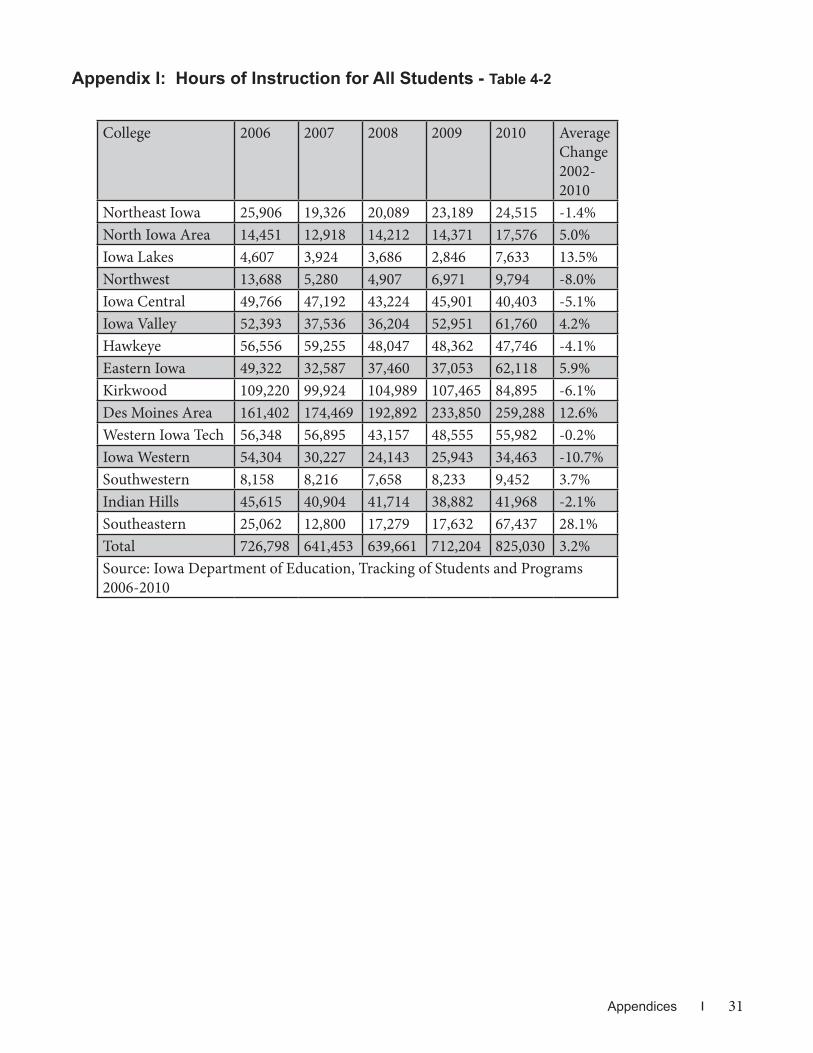
The hours of instruction for all federally-reported enrollees between 2006 and 2010 ranged from 36.4 hours in 2008 to 40.9 in 2010. This repre-sents the aggregated, actual hours of instruc-
Source: Iowa Department of Education, Tracking of Students and Programs 2006-2010. See Appendix I.
HOURS OF INSTRUCTION FOR ALL STUDENTS
tion for students whether the student com-pleted one hour of instruction, a grade level equivalent, or a GED.
Figure 4-2
Program Statistics

16
0
2,000
4,000
6,000
8,000
10,000
12,000
2006 2007 2008 2009 2010
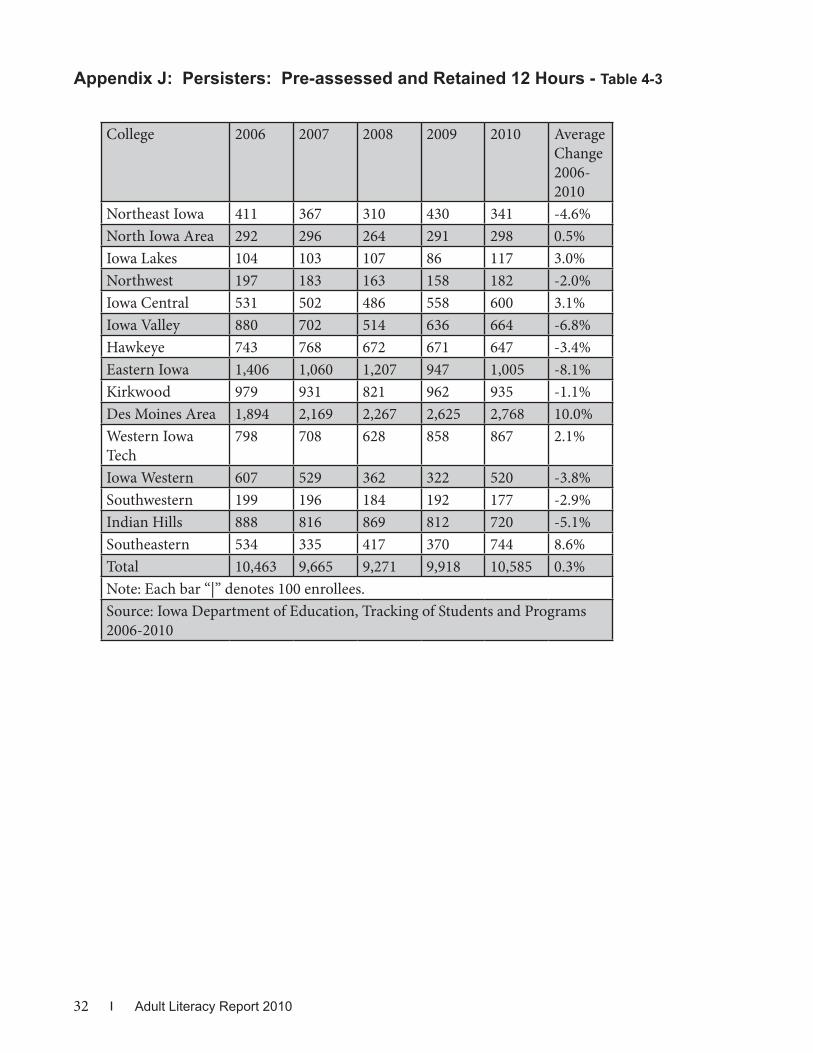
In 2010, 10,585 participants persisted beyond 12 hours of instruction after pre-assessment. Between 2006 and 2010, Iowa programs in-creased an average of only .3 percent; how-ever, two colleges showed large increases
Source: Iowa Department of Education, Tracking of Students and Programs 2006-2010. See Appendix J.
PERSISTERS: PRE-ASSESSED AND RETAINED 12 HOURS
(Des Moines Area Community College an av-erage annual of 10 percent over five years and Southeastern Community College an average an-nual increase of 8.6 percent over five years) while other colleges showed significant annual declines.
Figure 4-3
Adult Literacy Report 2010

17
PERSISTERS: HOURS OF INSTRUCTION
0
100,000
200,000
300,000
400,000
500,000
600,000
700,000
800,000
2006 2007 2008 2009 2010
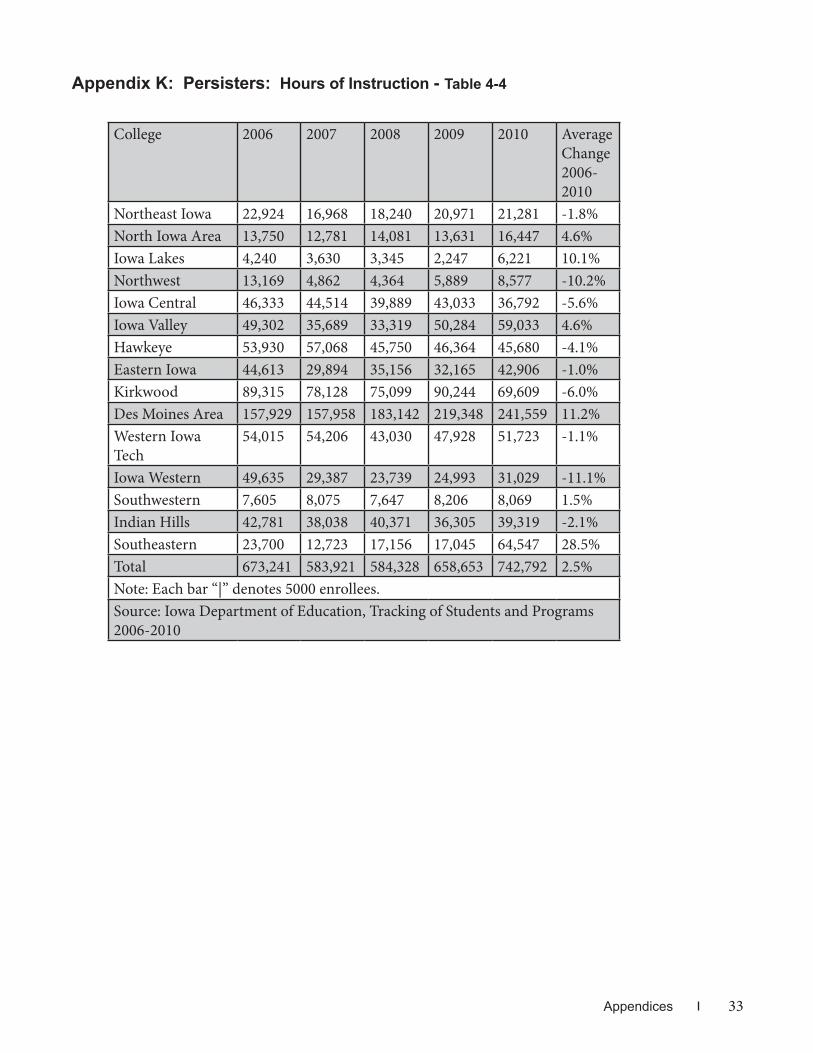
The hours of instruction for participants who were assessed and placed in a grade level and per-sisted beyond 12 hours of instruction ranged from 60.4 hours of instruction in 2007, to 70.1 hours of instruction in 2010. Office of Vocation and Adult Education (OVAE) requires adherance to the Com-prehensive Adult Student Assessment System (CASAS’) Assessment Policy Guidelines and the CASAS Assessment Technical Manual. CASAS’ Assessment Policy Guidelines allow limited excep-tions for post assessment before 40 hours of in-struction. The OVAE mandated that Iowa’s Adult Education State Plan Extension, (2009) specifically require adherance to 40 hours of instruction be-tween pre-and post-assessment. Iowa has revised
Source: Iowa Department of Education, Tracking of Students and Programs 2006-2010. See Appendix K.
the monitoring process for sub-grantees and, as a result, fewer participants are post-assessed under the revised guidelines, decreasing the percentage of grade level equivalent increases in 2010.
Iowa had increased technical assistance to sub-grantees to focus on persistence and retention, maintaining a full data set in order to analyze sub-sets of students more likely to persist, and ultimately target and identify areas of effective and efficient use of funds to increase opportunities for post-assessment, and, thereby, increase opportunities for sudents to make grade level gains and for Iowa to federally report grade level gains.
Figure 4-4
Program Statistics

18
0
1,000
2,000
3,000
4,000
5,000
6,000
2006 2007 2008 2009 2010
COMPLETION OF GRADE LEVEL EQUIVALENT
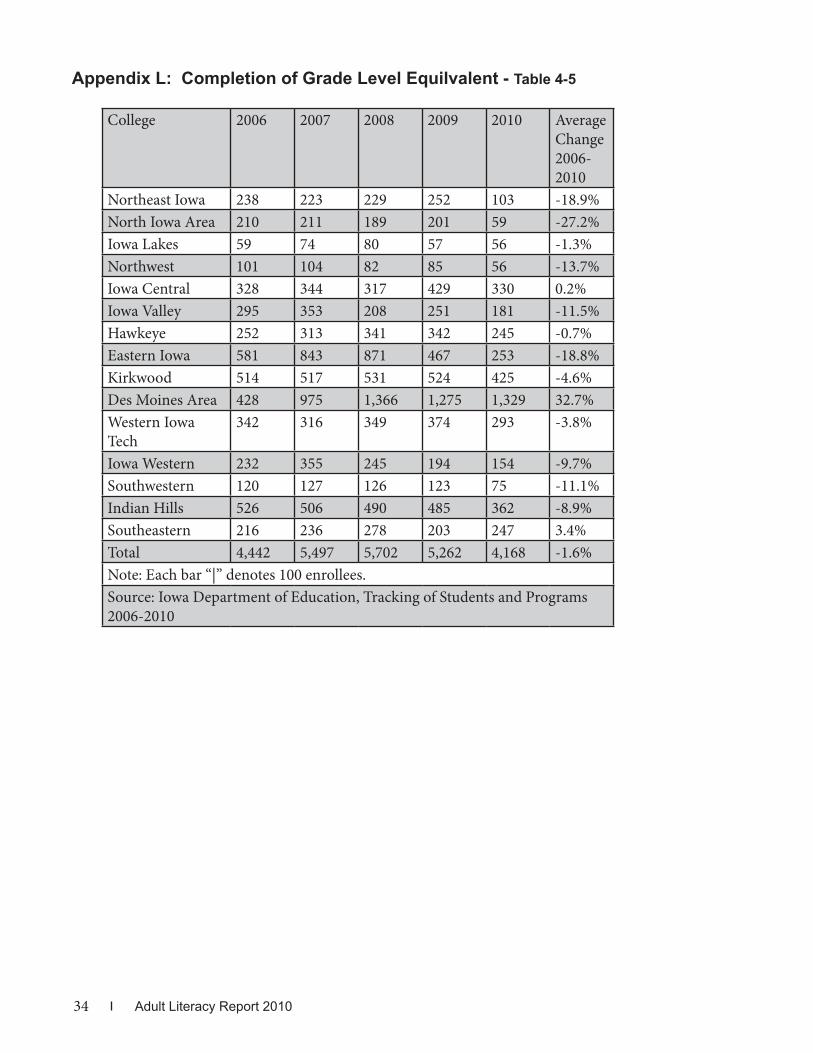
Iowa’s adult literacy program uses the federally-ap-proved Comprehensive Adult Student Assessment Sys-tem (CASAS) to assess all incoming students for grade level placement. The CASAS test inventory aligns placement with participants’ goals of learning English as a second language, acquiring basic skills, or earning a GED or diploma. By 2014, the CASAS assessment inventory will be aligned with the Common Core www.corestandards.org. Upon entry and assessment, students are placed into grade levels equivalent to grades 1 to 12 in up to four subject areas; reading, math, writing, and listening. Af-ter 70-100 hours of instructional intervention (a mini-mum of 40 hours), students are assessed for grade level completion. One of the mandates of Adult Education Family Literacy Act (AEFLA) is the requirement of sub-grantees that class schedules will be flexible enough to allow adult participants opportunities to attend around family and vocational responsibilities. Although some local pro-grams have structured learning academies with atten-dance requirements, locally-mandated, adult education
programs do not have compulsory attendance. I o w a participant grade level equivalent averages for 2010, at the time of entry after initial assessment are as fol-lows: 1. Basic Skills Participants – 5.86 years of age 2. English-as-a-Second-Language Participants – 2.55 years of age 3. English-as-a-Second-Language/Civics Emphasis Participants – 2.79 years of age 4. GED Participants – 8.21 years of age 5. High School Diploma (equivalency) Participants – 6.25 years of age In 2010, 4,168, or 39 percent of all participants per-sisting beyond 12 hours of instruction who also took a post -assessment completed or advanced at least one grade level in the fiscal year. Between 2006 and 2010, 25,071 participants, out of a total 49,902, or 50 percent of all participants persisting beyond 12 hours of instruc-tion and receiving a post-assessment completed or ad-vanced at least one grade level within the fiscal year of participation.
Source: Iowa Department of Education, Tracking of Students and Programs 2006-2010. See Appendix L.
Figure 4-5
Adult Literacy Report 2010

19
0%
10%
20%
30%
40%
50%
60%
70%
80%
90%
100%
2006 2007 2008 2009 2010
The General Educational Development (GED) is a criterion-referenced battery of five subject matter assessments given to students who did not complete high school. The subject matter tests are English language arts, writing, math, social studies, and science. In 2010, 4,667
Source: Iowa Department of Education, Tracking of Students and Programs 2006-2010. See Appendix M.
GEDs PASSED
students successfully completed five subject matter GED tests and passed the GED. The number of GED passers has increased an av-erage of 5.4 percent per year for the past five years. A total of 20,973 students have passed the GED since 2006.
Figure 4-6
Program Statistics

20
98%
99%
99%
99%
99%
99%
100%
100%
100%
2006 2007 2008 2009 2010
Iowa’s GED pass rate has exceeded 98 per-cent for the past five years, the highest in the nation and in Canada. Iowa adult literacy co-ordinators are encouraged to have students score beyond the recommended GED official practice test scaled score of 410 before mov-
Source: Iowa Department of Education, Tracking of Students and Programs 2006-2010. See Appendix N.
GED PASS RATE
Figure 4-7
ing students into official GED subject matter testing. Iowa’s mission is to graduate GED students, prepared for post-secondary educa-tion and the workforce, without the need for de-velopmental education or additional basic skills education.
Adult Literacy Report 2010
21
V. State Leadership Information
1. Iowa implemented state leadership activities for improving the quality of instruction are listed below: a. ABE Institute-July 16-17, 2009 b. Learning Disabilities Training-November 6, 2009, and March 12, 2010 c. Center for Adult English Language Acquisition (CAELA) Regional Trainings- September 25, 2009, October 2, 2009, October 23, 2009, April 9, 2010, April 16, 2010, and April 23, 2010. d. GED Connection Awareness and Implementation Workshop-October 16, 2009 e. Content Standards Alignment Workshop-October 9, 2009 f. Study Circle Presentation-February 16, 2010 g. Worldwide Interactive Network (WIN) and ACT Training-March 2, 2010, and June 1, 2010 h. Transitions Workshop-June 22, 2010
2. Technical Assistance a. Field training on federal reporting requirements (National Reporting System, [NRS]), b. Instructor certification training Comprehensive Adult Student Assessment System (CASAS). i. Assess for instructional intervention and educational placement. ii. Proctor certification September 10, 2009, September 17, 2009, October 1, 2009, and March 23, 2010.
3. Technology Assistance eTesting Pilot Testing (transition from paper to computer-based assessment)
4. Monitoring and Evaluation of Quality and Improvement. a. Three on-site visits; 12 desktop visits.
State Leadership Information

22
0
0.00
1
0.00
2
0.00
3
0.00
4
0.00
5
0.00
6
0.00
7
0.00
8
0.00
9
0.01
1997
1998
1999
2000
2001
2002
2003
2004
2005
2006
2007
2008
2009
2010
2011
*20
12
Perc
ent o
f Fed
eral
Fun
ds
Gen
eral
ly, t
he s
ervi
ce i
s pr
ovid
ed t
o pa
rtici
-pa
nts
on a
low
or
no c
ost
basi
s.
Sou
rces
of
fund
ing
incl
ude:
1.
Con
gres
sion
ally
-dire
cted
app
ropr
ia-
tions
on
an in
divi
dual
sub
-gra
ntee
le
vel .
2.
Indi
vidu
al g
rant
s at
the
sub-
gran
tee
le
vel.
VI.
Fund
ing
IOW
A PE
RC
ENTA
GE
OF
FED
ERA
L A
LLO
CAT
ION
S
3.
W
orkf
orce
Inve
stm
ent A
ct (W
IA) i
n
ce
ntiv
e gr
ants
ear
ned
for
exce
eded
leve
ls o
f per
form
ance
via
A
dult
Edu
catio
n an
d Fa
mily
Lite
racy
A
ct (A
EFL
A).
4.
Sta
te g
ener
al a
id.
5.
Stu
dent
fees
.
Sou
rce:
http
://w
ww
2.ed
.gov
/pro
gram
s/ad
ulte
dbas
ic/fu
ndin
g.ht
ml
See
App
endi
x O
.
Figu
re 6
-1
Adult Literacy Report 2010

23
VII. Future Directions
Iowa has experienced annual cuts in the federal allocation eight of the past nine fiscal years, totaling a nearly 19 percent cut in funding. Federal student enrollment reported declined an average of 6.5 percent per year, between 2002-2007, but has risen an average of 4.7 percent per year between 2007 and 2010. As funding decreases and student-reported enrollment increases, it is clear that Iowa needs to prioritize to maximize efficient use of funding to maximize program dollars used for instruction, revise inefficient processes, standardize local data used in grant application processes (already collected by the Department of Education), and increase professional development that is immediately useful and relevant to coordinators and instructors.
Technology
• Comprehensive Adult Student Assessment System (CASAS) eTesting Online and Enterprise Data System Iowa will be 85 to 95 percent paper-free by June 30, 2014. • In 2009, two Iowa local programs began transitioning from paper-based assessment to computer-based assessment. • In 2010, four programs transitioned to computer-based assessment. • In 2011, two programs are piloting web-based assessment, reducing the need for additional information technology staff at the community college level. • By June 2012, each of Iowa’s 15 community colleges will be at some phase of the web-based assessment, data collection, and data base management system. • The web-based system was developed by the assessment developers, CASAS, over the past five years, and released for pilot in fiscal year 2011. The system is federally- approved by the Office of Vocational and Adult Education, Division of Adult Education and Literacy (OVAE:DAEL), and is in compliance with the Federal Education Rights and Privacy Act (FERPA, 1974). In addition to FERPA compliance, local programs are required to sign assurances and compliance statements with the annual local plan extension.
Improvements immediately evident include the following: • Immediate student assessment scores, grade equivalent, and class placement. • Student record on file within and between community colleges and at state level at the moment the student completes the first assessment (as opposed to the end of the fiscal year). • Immediate communication between instructors, coordinators, and state level staff. • Immediate access to data, outcomes, and data-driven decision-making opportunities. • http://ecasas.org
Future Directions
24
0
50
100
150
200
250
300
350
Enrolled Actively Engaged
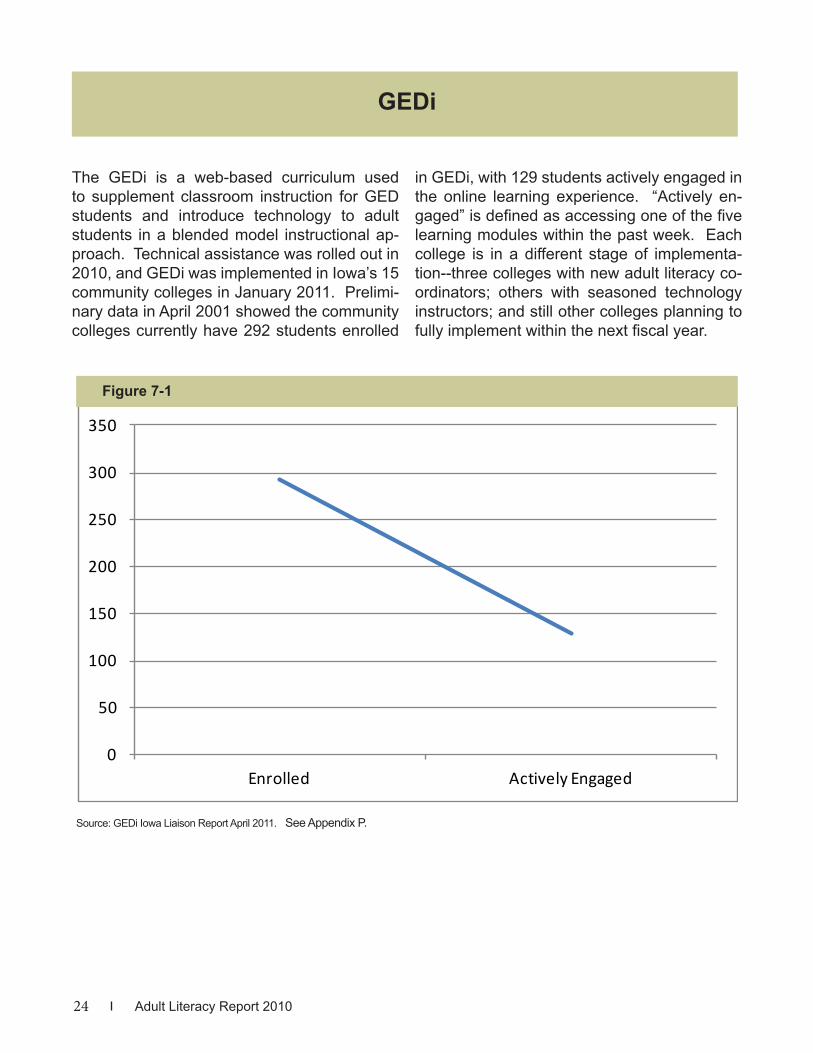
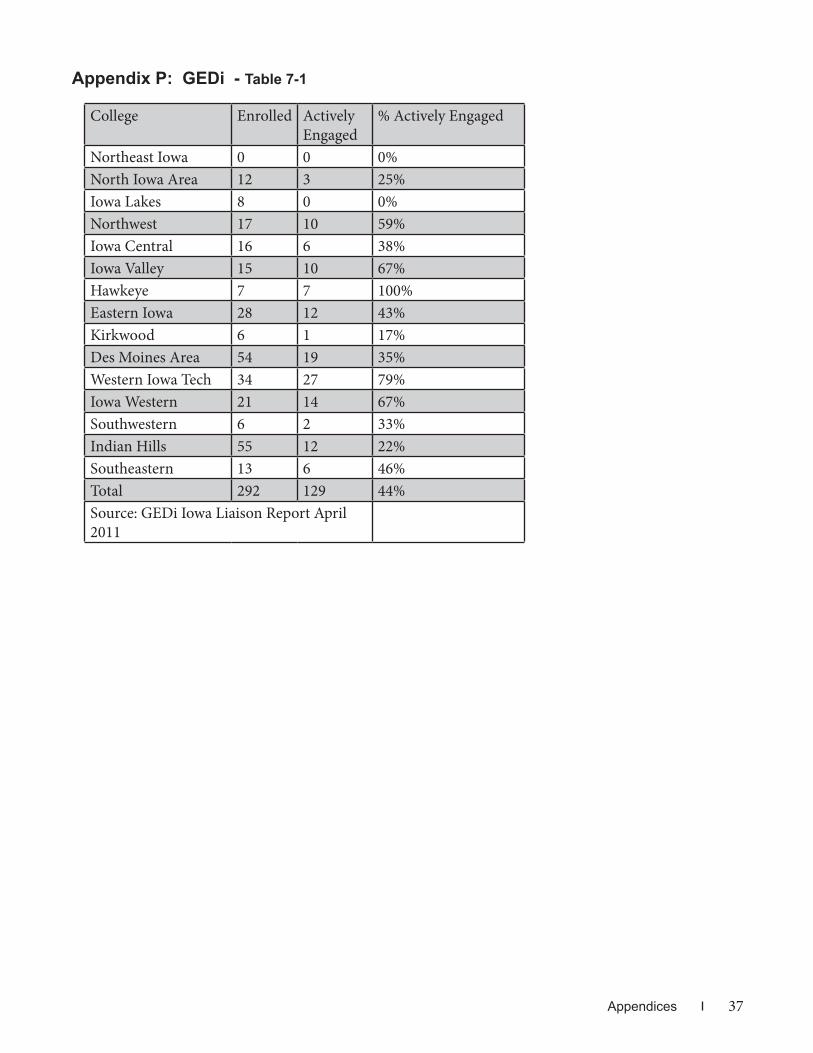
The GEDi is a web-based curriculum used to supplement classroom instruction for GED students and introduce technology to adult students in a blended model instructional ap-proach. Technical assistance was rolled out in 2010, and GEDi was implemented in Iowa’s 15 community colleges in January 2011. Prelimi-nary data in April 2001 showed the community colleges currently have 292 students enrolled
Source: GEDi Iowa Liaison Report April 2011. See Appendix P.
GEDi
in GEDi, with 129 students actively engaged in the online learning experience. “Actively en-gaged” is defined as accessing one of the five learning modules within the past week. Each college is in a different stage of implementa-tion--three colleges with new adult literacy co-ordinators; others with seasoned technology instructors; and still other colleges planning to fully implement within the next fiscal year.
Figure 7-1
Adult Literacy Report 2010
25
APPENDICES
Appendices

26
Appendix A: Age - Table 3-1
Appendix B: Gender - Table 3-2
Iowa 2006 2007 2008 2009 2010
Average Age 27.9 28.1 28 28 28.2
Source: Iowa Department of Education, Tracking of Students and Programs 2006-2010
College 2006 2007 2008 2009 2010
Male Female Male Female Male Female Male Female Male Female
Northeast Iowa 406 457 369 381 310 378 416 476 381 436
North Iowa Area 150 236 215 289 220 240 219 231 209 230
Iowa Lakes 77 125 93 95 159 130 140 154 153 168
Northwest 173 137 158 140 142 111 179 135 223 178
Iowa Central 465 169 368 403 399 381 484 442 560 485
Iowa Valley 722 648 589 491 477 467 553 538 564 484
Hawkeye 534 613 495 585 500 506 492 497 462 488
Eastern Iowa 1,225 1,505 1,173 1,392 1,216 1,264 1,408 1,392 1,394 1,504
Kirkwood 1,014 1,369 1,010 1,179 887 1,089 993 1,117 953 1,026
Des Moines Area 1,353 1,601 1,473 1,930 1,825 2,003 2,075 2,352 2,268 2,575
Western Iowa Tech 499 648 530 660 566 695 655 696 661 696
Iowa Western 619 694 533 573 556 638 609 688 619 672
Southwestern 179 203 164 200 169 194 189 237 192 221
Indian Hills 665 673 626 597 525 588 598 589 612 597
Southeastern 446 463 392 435 516 420 404 388 717 414
Total 8,527 9,541 8,188 9,350 8,467 9,104 9,414 9,932 9,968 10,174
Source: Iowa Department of Education, Tracking of Students and Programs 2006-2010
Adult Literacy Report 2010

27
Iowa 2006 2007 2008 2009 2010
Average Change
2006-2010
Hispanic or Latino 5196 5390 4811 5498 5237 0.20%
Not Hispanic or Latino 13170 12137 12749 13843 14895 3.12%
Not Specified 0 4 0 0 0
Not Coded 7 10 13 11 13 16.74%
Total 18,373 17,541 17,573 19,352 20,145 2.33%
Source: Iowa Department of Education, Tracking of Students and Programs 2006-2010
Appendix C: Ethnicity - Table 3-3
Appendix D: Race - Table 3-4
Iowa 2006 2007 2008 2009 2010
Average Change
2006-2010
Alaska Native 3 8 7 3 9 31.61%
American Indian 387 295 344 344 375 -0.78%
Asian 1184 1047 1054 1201 1237 1.10%
Black or African American 2209 2177 2488 2945 3445 11.75%
Filipino 39 34 39 39 40 0.63%
Other 0 0 0 0 0
Pacific Islander 53 82 80 61 68 6.43%
White 15001 14379 14084 15217 15541 0.89%
Total 18,876 18,022 18,096 19,810 20,715 2.35%
Source: TOPSpro 2006-2010
Appendices

28
Grade Level Equivalent 2006 2007 2008 2009 2010
Basic Skills 5.8 5.9 6.0 6.2 5.9
English-as-a Second-Language 2.3 2.3 2.6 2.7 2.6
English-as-a Second-Language/Civics 2.7 2.6 2.6 2.7 2.8
General Education Development (GED) 7.8 8.1 8.1 8.2 8.2
High School Diploma (Equivalent) 6.9 6.2 5.4 5.6 6.3
Average Equivalent Grades (in Years) 5.3 5.3 5.6 5.7 5.6
Source: Iowa Department of Education, Tracking of Students and Programs 2006-2010
Native Language 2006 2007 2008 2009 2010
Average Change
2006-2010
English 11944 11005 11665 12649 13682 3.45%
Other 6429 6536 5908 6704 6464 0.14%
Total 18,373 17,541 17,573 19,353 20,146 2.33%
Source: Iowa Department of Education, Tracking of Students and Programs 2006-2010
Appendix E: Grade Level Equivalent - Table 3-5
Appendix F: Native Language - Table 3-6
Adult Literacy Report 2010

29
Iowa 2006 2007 2008 2009 2010
Average Change
2002-2011
Employed 7434 7773 7266 7473 6496 -3.32%
Unemployed 8434 7824 8292 9434 11255 7.48%
Unemployed and Not Seeking Work 1852 1631 1734 1933 2086 3.02%
Retired 88 83 66 71 56 -10.68%
Total 17,808 17,311 17,358 18,911 19,893 2.81%
Source: Iowa Department of Education, Tracking of Students and Programs 2006-2010
Appendix G: Labor Force Status - Table 3-7
Appendices

30
Col
lege
2006
2007
2008
2009
2010
Aver
age
Cha
nge
2006
-201
0N
orth
east
Iow
a86
3|||
750
|||68
8||
892
|||81
7|||
-1.4
%N
orth
Iow
a A
rea
386
|50
4||
460
|45
0|
467
|4.
9%Io
wa
Lake
s20
218
829
0|
294
|29
3|
9.7%
Nor
thw
est
310
|29
8|
253
|31
4|
401
|6.
6%Io
wa
Cen
tral
934
|||77
1|||
780
|||92
6|||
1,04
5|||
|2.
8%Io
wa
Valle
y1,
370
|||||
1,08
0|||
|94
4|||
1,09
2|||
|1,
048
||||
-6.5
%H
awke
ye1,
147
||||
1,08
0|||
|1,
006
||||
989
|||95
0|||
-4.6
%Ea
ster
n Io
wa
2,73
0|||
||||||
|2,
565
||||||
||||
2,48
0|||
||||||
2,80
0|||
||||||
||2,
898
||||||
|||||
1.5%
Kirk
woo
d2,
385
||||||
|||2,
192
||||||
||1,
976
||||||
|2,
110
||||||
||1,
979
||||||
|-4
.6%
Des
Moi
nes
Are
a2,
955
||||||
|||||
3,40
3|||
||||||
||||
3,82
9|||
||||||
||||||
4,42
7|||
||||||
||||||
||4,
843
||||||
||||||
||||||
|13
.1%
Wes
tern
Iow
a Te
ch1,
147
||||
1,19
0|||
|1,
261
|||||
1,35
1|||
||1,
357
|||||
4.3%
Iow
a W
este
rn1,
314
|||||
1,10
6|||
|1,
194
||||
1,30
0|||
||1,
293
|||||
-0.4
%So
uthw
este
rn38
3|
364
|36
3|
428
|41
3|
1.9%
Indi
an H
ills
1,33
8|||
||1,
223
||||
1,11
3|||
|1,
187
||||
1,20
9|||
|-2
.5%
Sout
heas
tern
909
|||82
7|||
936
|||79
2|||
1,13
2|||
|5.
6%To
tal
18,3
7317
,541
17,5
7319
,352
20,1
452.
3%N
ote:
Eac
h ba
r “|”
den
otes
250
enr
olle
es.
Sour
ce: I
owa
Dep
artm
ent o
f Edu
catio
n, T
rack
ing
of S
tude
nts a
nd P
rogr
ams,
2006
-201
0
App
endi
x H
: Fe
dera
lly R
epor
ted
Stud
ents
Ser
ved
- Tab
le 4
-1
Adult Literacy Report 2010
31
College 2006 2007 2008 2009 2010 Average Change 2002-2010
Northeast Iowa 25,906 19,326 20,089 23,189 24,515 -1.4%North Iowa Area 14,451 12,918 14,212 14,371 17,576 5.0%Iowa Lakes 4,607 3,924 3,686 2,846 7,633 13.5%Northwest 13,688 5,280 4,907 6,971 9,794 -8.0%Iowa Central 49,766 47,192 43,224 45,901 40,403 -5.1%Iowa Valley 52,393 37,536 36,204 52,951 61,760 4.2%Hawkeye 56,556 59,255 48,047 48,362 47,746 -4.1%Eastern Iowa 49,322 32,587 37,460 37,053 62,118 5.9%Kirkwood 109,220 99,924 104,989 107,465 84,895 -6.1%Des Moines Area 161,402 174,469 192,892 233,850 259,288 12.6%Western Iowa Tech 56,348 56,895 43,157 48,555 55,982 -0.2%Iowa Western 54,304 30,227 24,143 25,943 34,463 -10.7%Southwestern 8,158 8,216 7,658 8,233 9,452 3.7%Indian Hills 45,615 40,904 41,714 38,882 41,968 -2.1%Southeastern 25,062 12,800 17,279 17,632 67,437 28.1%Total 726,798 641,453 639,661 712,204 825,030 3.2%Source: Iowa Department of Education, Tracking of Students and Programs 2006-2010
Appendix I: Hours of Instruction for All Students - Table 4-2
Appendices
32
Appendix J: Persisters: Pre-assessed and Retained 12 Hours - Table 4-3
College 2006 2007 2008 2009 2010 Average Change 2006-2010
Northeast Iowa 411 367 310 430 341 -4.6%North Iowa Area 292 296 264 291 298 0.5%Iowa Lakes 104 103 107 86 117 3.0%Northwest 197 183 163 158 182 -2.0%Iowa Central 531 502 486 558 600 3.1%Iowa Valley 880 702 514 636 664 -6.8%Hawkeye 743 768 672 671 647 -3.4%Eastern Iowa 1,406 1,060 1,207 947 1,005 -8.1%Kirkwood 979 931 821 962 935 -1.1%Des Moines Area 1,894 2,169 2,267 2,625 2,768 10.0%Western Iowa Tech
798 708 628 858 867 2.1%
Iowa Western 607 529 362 322 520 -3.8%Southwestern 199 196 184 192 177 -2.9%Indian Hills 888 816 869 812 720 -5.1%Southeastern 534 335 417 370 744 8.6%Total 10,463 9,665 9,271 9,918 10,585 0.3%Note: Each bar “|” denotes 100 enrollees.Source: Iowa Department of Education, Tracking of Students and Programs 2006-2010
Adult Literacy Report 2010
33
Appendix K: Persisters: Hours of Instruction - Table 4-4
College 2006 2007 2008 2009 2010 Average Change 2006-2010
Northeast Iowa 22,924 16,968 18,240 20,971 21,281 -1.8%North Iowa Area 13,750 12,781 14,081 13,631 16,447 4.6%Iowa Lakes 4,240 3,630 3,345 2,247 6,221 10.1%Northwest 13,169 4,862 4,364 5,889 8,577 -10.2%Iowa Central 46,333 44,514 39,889 43,033 36,792 -5.6%Iowa Valley 49,302 35,689 33,319 50,284 59,033 4.6%Hawkeye 53,930 57,068 45,750 46,364 45,680 -4.1%Eastern Iowa 44,613 29,894 35,156 32,165 42,906 -1.0%Kirkwood 89,315 78,128 75,099 90,244 69,609 -6.0%Des Moines Area 157,929 157,958 183,142 219,348 241,559 11.2%Western Iowa Tech
54,015 54,206 43,030 47,928 51,723 -1.1%
Iowa Western 49,635 29,387 23,739 24,993 31,029 -11.1%Southwestern 7,605 8,075 7,647 8,206 8,069 1.5%Indian Hills 42,781 38,038 40,371 36,305 39,319 -2.1%Southeastern 23,700 12,723 17,156 17,045 64,547 28.5%Total 673,241 583,921 584,328 658,653 742,792 2.5%Note: Each bar “|” denotes 5000 enrollees.Source: Iowa Department of Education, Tracking of Students and Programs 2006-2010
Appendices
34
Appendix L: Completion of Grade Level Equilvalent - Table 4-5
College 2006 2007 2008 2009 2010 Average Change 2006-2010
Northeast Iowa 238 223 229 252 103 -18.9%North Iowa Area 210 211 189 201 59 -27.2%Iowa Lakes 59 74 80 57 56 -1.3%Northwest 101 104 82 85 56 -13.7%Iowa Central 328 344 317 429 330 0.2%Iowa Valley 295 353 208 251 181 -11.5%Hawkeye 252 313 341 342 245 -0.7%Eastern Iowa 581 843 871 467 253 -18.8%Kirkwood 514 517 531 524 425 -4.6%Des Moines Area 428 975 1,366 1,275 1,329 32.7%Western Iowa Tech
342 316 349 374 293 -3.8%
Iowa Western 232 355 245 194 154 -9.7%Southwestern 120 127 126 123 75 -11.1%Indian Hills 526 506 490 485 362 -8.9%Southeastern 216 236 278 203 247 3.4%Total 4,442 5,497 5,702 5,262 4,168 -1.6%Note: Each bar “|” denotes 100 enrollees.Source: Iowa Department of Education, Tracking of Students and Programs 2006-2010
Adult Literacy Report 2010

35
App
endi
x M
: G
ED’s
Pas
sed
- Tab
le 4
-6
Col
lege
2006
2007
2008
2009
2010
Nor
thea
st
Iow
a99
%10
0%99
%10
0%10
0%
Nor
th Io
wa
Are
a99
%99
%10
0%10
0%99
%
Iow
a La
kes
96%
100%
100%
99%
98%
Nor
thw
est
100%
100%
100%
100%
100%
Iow
a C
entr
al10
0%99
%99
%98
%98
%Io
wa
Valle
y96
%10
0%10
0%99
%99
%H
awke
ye97
%10
0%10
0%10
0%99
%Ea
ster
n Io
wa
100%
100%
99%
97%
98%
Kirk
woo
d99
%99
%10
0%99
%10
0%D
es M
oine
s A
rea
100%
99%
99%
99%
99%
Wes
tern
Iow
a Te
ch95
%99
%10
0%10
0%10
0%
Iow
a W
este
rn98
%10
0%10
0%99
%99
%So
uthw
este
rn87
%10
0%10
0%10
0%98
%In
dian
Hill
s10
0%99
%10
0%10
0%99
%So
uthe
aste
rn97
%10
0%10
0%99
%10
0%To
tal
100%
99%
100%
99%
99%
Sour
ce: N
RSpr
o.co
m
App
endi
x N
: G
ED P
ass
Rat
e - T
able
4-7
Col
lege
2006
2007
2008
2009
2010
Nor
thea
st
Iow
a99
%10
0%99
%10
0%10
0%
Nor
th Io
wa
Are
a99
%99
%10
0%10
0%99
%
Iow
a La
kes
96%
100%
100%
99%
98%
Nor
thw
est
100%
100%
100%
100%
100%
Iow
a C
entr
al10
0%99
%99
%98
%98
%Io
wa
Valle
y96
%10
0%10
0%99
%99
%H
awke
ye97
%10
0%10
0%10
0%99
%Ea
ster
n Io
wa
100%
100%
99%
97%
98%
Kirk
woo
d99
%99
%10
0%99
%10
0%D
es M
oine
s A
rea
100%
99%
99%
99%
99%
Wes
tern
Iow
a Te
ch95
%99
%10
0%10
0%10
0%
Iow
a W
este
rn98
%10
0%10
0%99
%99
%So
uthw
este
rn87
%10
0%10
0%10
0%98
%In
dian
Hill
s10
0%99
%10
0%10
0%99
%So
uthe
aste
rn97
%10
0%10
0%99
%10
0%To
tal
100%
99%
100%
99%
99%
Sour
ce: N
RSpr
o.co
m
Appendices

36
App
endi
x O
: Io
wa
Perc
enta
ge o
f Fed
eral
Allo
catio
ns -
Tabl
e 6-
1
Sta
te
Fis
cal
Year
Fede
ral F
isca
l Ye
arFe
dera
l Allo
cati
onA
BE P
rogr
amEL
Civ
ics
Iow
a %
of F
ed-
eral
Allo
cati
onIo
wa
Allo
cati
onA
BE P
rogr
amEL
Civ
ics
% In
crea
se/D
ecre
ase
1997
1996
$24
7,44
0,00
0 $
247,
440,
000
0.93
6% $
2,31
5,50
9 $
2,31
5,50
9 $
-
1998
1997
$34
0,33
9,00
0 $
340,
339,
000
0.92
2% $
3,13
6,43
7 $
3,13
6,43
7 $
- 26
.17%
1999
1998
$34
5,33
9,00
0 $
345,
339,
000
0.92
1% $
3,18
0,62
1 $
3,18
0,62
1 $
- 1.
39%
2000
1999
$36
5,00
0,00
0 $
365,
000,
000
0.87
4% $
3,19
1,22
1 $
3,19
1,22
1 $
- 0.
33%
2001
2000
$44
1,91
6,00
0 $
441,
916,
000
0.82
0% $
3,62
2,24
5 $
3,62
2,24
5 $
- 11
.90%
2002
2001
$47
0,00
0,00
0 $
470,
000,
000
0.90
7% $
4,17
6,68
6 $
3,99
0,56
4 $
186,
122
13.2
7%
2003
2002
$57
5,00
0,00
0 $
504,
896,
830
$70
,103
,170
0.
793%
$4,
479,
547
$4,
279,
336
$20
0,21
1 6.
76%
2004
2003
$57
1,26
2,50
0 $
501,
597,
260
$69
,665
,240
0.
750%
$4,
207,
542
$3,
967,
525
$24
0,01
7 -6
.46%
2005
2004
$57
4,37
2,09
2 $
505,
237,
407
$69
,134
,685
0.
762%
$4,
302,
165
$4,
029,
210
$27
2,95
5 2.
20%
2006
2005
$56
9,67
1,87
2 $
501,
089,
952
$68
,581
,920
0.
766%
$4,
286,
916
$3,
999,
189
$28
7,72
7 -0
.36%
2007
2006
$56
3,97
5,28
0 $
496,
079,
100
$67
,896
,180
0.
767%
$4,
248,
232
$3,
960,
713
$28
7,51
9 -0
.91%
2008
2007
$56
3,97
5,28
0 $
496,
079,
100
$67
,896
,180
0.
766%
$4,
240,
789
$3,
960,
711
$28
0,07
8 -0
.18%
2009
2008
$55
4,12
2,35
7 $
487,
412,
500
$66
,709
,857
0.
763%
$4,
154,
183
$3,
894,
299
$25
9,88
4 -2
.08%
2010
2009
$55
4,12
2,17
7 $
485,
226,
177
$67
,896
,000
0.
690%
$3,
757,
064
$3,
504,
870
$25
2,19
4 -1
0.57
%
2011
*20
10*
$62
8,22
1,00
0 $
553,
221,
000
$75
,000
,000
0.
589%
$3,
639,
113
$3,
364,
157
$27
4,95
6 -3
.24%
2012
2011
$59
6,12
0,37
0 $
521,
270,
370
$74
,850
,000
0.
620%
$3,
632,
757
$3,
355,
410
$27
7,34
7 -0
.17%
Sour
ce:h
ttp://
ww
w2.
ed.g
ov/p
rogr
ams/
adul
tedb
asic
/fund
ing.
htm
l
Adult Literacy Report 2010
37
Appendix P: GEDi - Table 7-1
College Enrolled Actively Engaged
% Actively Engaged
Northeast Iowa 0 0 0%North Iowa Area 12 3 25%Iowa Lakes 8 0 0%Northwest 17 10 59%Iowa Central 16 6 38%Iowa Valley 15 10 67%Hawkeye 7 7 100%Eastern Iowa 28 12 43%Kirkwood 6 1 17%Des Moines Area 54 19 35%Western Iowa Tech 34 27 79%Iowa Western 21 14 67%Southwestern 6 2 33%Indian Hills 55 12 22%Southeastern 13 6 46%Total 292 129 44%Source: GEDi Iowa Liaison Report April 2011
Appendices

38
Appendix Q: Comprehensive Adult Student Assessment (CASAS) National Reporting System (NRS) Educational Functioning Levels
1‐800‐255‐1036 • www.casas.org
NRS Educational Functioning Levels to CASAS Scale Scores and Grade Levels
NRS Educational Functioning Levels CASAS Score Ranges*
Grade Level EFL ABE ESL
1
Beginning ESL Literacy
Basic Skills Deficient
180 and below 1
2
Low Beginning ESL 181‐190 1
3 Beginning ABE Literacy High Beginning ESL 191‐200 1
4 Beginning Basic Education Low Intermediate ESL 201‐205 206‐210
2 3
5 Low Intermediate Basic Education
High Intermediate ESL 211‐215 216‐220
4 5
6 High Intermediate Basic Education Advanced ESL
221‐225 226‐230 231‐235
6 7 8
7 Low Adult Secondary Education Not Basic
Skills Deficient
236‐240 241‐245
9 10
8 High Adult Secondary Education
246‐250 251 and above
11 12
* Reading, Numeracy Adapted from Attachments A and B of the Employment and Training Administration, USDOL: TEGL 17‐05 Change 1 ― Common Measures Policy for the ETA Performance Accountability System and Related Performance , issued Aug 13, 2007.
Adult Literacy Report 2010
39
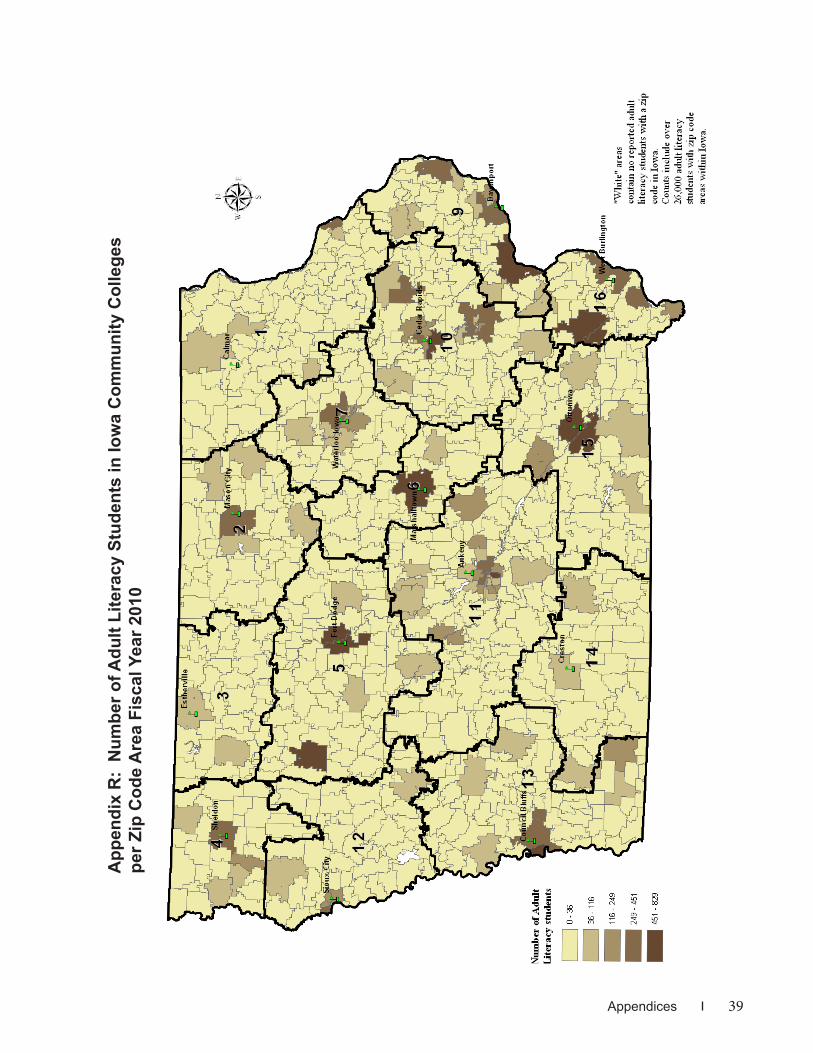
App
endi
x R
: N
umbe
r of A
dult
Lite
racy
Stu
dent
s in
Iow
a C
omm
unity
Col
lege
s pe
r Zip
Cod
e A
rea
Fisc
al Y
ear 2
010
Appendices

40
COMMUNITY COLLEGES
www.educateiowa.gov/ccpublications/
BUREAU OF ADULT, CAREER, AND COMMUNITY COLLEGE EDUCATION
http://educateiowa.gov/adultliteracy