Embed Size (px)
Citation preview

IOWA DEPARTMENT
OF TRANSPORTATION
Norman Miller, PLS Survey Manager
Iowa DOT Design Survey Office (contributing author)
Gary Brown, PLS, CP IaRCS Project Manager
GB Consulting (contributing author)
Michael Dennis, RLS, PE Owner and Geodesist
Geodetic Analysis, LLC (lead author)
Iowa Regional
Coordinate System Handbook and User Guide
Version 2.10
September 16, 2014
www.iowadot.gov/rtn/IaRCS.aspx

Iowa Regional Coordinate System - ii
Abstract
This document provides the history, development, best practice methods, and technical details of a new coordinate system for the State of Iowa. The Iowa Regional Coordinate System (IaRCS) is based on a set of 14 “low distortion” map projection zones with parameters that have been defined such that linear distortion is negligible within the counties that define the zone. Distances computed between points in the grid coordinate system will nearly equal the actual horizontal distance between the same points on the ground (within a tolerance of ±25 parts per million, or ±0.13 foot per mile). The IaRCS has been de-signed such that it can be readily used with a wide variety of software platforms for surveying, engineer-ing, GIS, and cartographic mapping applications. It is important to realize that rectangular grid coordi-nates for all of the IaRCS zones may be calculated with formulas through computer programs that would have seemed too complicated in the past, but now may be considered routine. These same computer programs also make it a relatively simple procedure to perform transformations, that is, to change the coordinates of points from one coordinate system to another. While having 14 coordinate system zones for the state of Iowa may seem cumbersome, actual user application through highly precise GNSS and terrestrial measurement devices provide for a level of mapping accuracy that is beneficial to all mapping professionals.
Revision History
v1.00 (first draft) – June 16, 2014
v2.00 (second draft) – August 18, 2014
v2.10 – September 16, 2014

Iowa Regional Coordinate System - iii
Acknowledgements I would like to acknowledge and thank the members of the GB Consulting and Geodetic Analysis consult-ing teams that assisted in development of the IaRCS: Gary Brown, PLS, CP, GB Consulting Michael Dennis, RLS, PE, Geodetic Analysis, LLC Richard Nava, Geodetic Analysis, LLC Rudy Stricklan, RLS, GISP, Geodetic Analysis, LLC Without their involvement, and the support of dedicated Iowa DOT staff, this project would not have been possible. Special thanks to the following individuals for allowing use of the Oregon Coordinate Reference System (OCRS) Handbook and User Guide as a template for creation of this document:
Ron Singh, PLS, Oregon Department of Transportation, Geometronics Unit Mark Armstrong, PLS, National Geodetic Survey, Oregon Advisor
Norm Miller, PLS IaDOT Survey Manager, Design Survey Office Living Document This IaRCS Handbook and User Guide is intended to be a “living document” and will be updated as new information becomes available. The IaRCS was created with state funds and volunteer effort for the benefit of surveying, engineering, GIS, and mapping professionals in the State of Iowa. Iowa is now one of several states that have created new coordinate systems based on “low distortion” map projections.
Contact Information for Revision to Document
If there are topics that should be added, covered in more depth, clarified, modified or revised to incor-porate specific workflows, please contact: Norman Miller, PLS, Survey Manager Iowa DOT Design Survey Office

Iowa Regional Coordinate System - iv
Document Development and Review History
The following people contributed edits, material and/or review comments for this document.
Lead Author Michael Dennis, RLS, PE Geodetic Analysis, LLC
Contributing Authors Norm Miller, PLS IaDOT Design Survey Office Gary Brown, PLS, CP GB Consulting Rudy Stricklan, RLS, GISP Geodetic Analysis, LLC Richard Nava Geodetic Analysis, LLC v1.00 review Norm Miller, PLS IaDOT Design Survey Office Gary Brown, PLS, CP GB Consulting v2.00 review Norm Miller, PLS IaDOT Design Survey Office Gary Brown, PLS, CP GB Consulting Rudy Stricklan, RLS, GISP Geodetic Analysis, LLC v2.10 review Norm Miller, PLS IaDOT Design Survey Office Gary Brown, PLS, CP GB Consulting Rudy Stricklan, RLS, GISP Geodetic Analysis, LLC

Iowa Regional Coordinate System - v
Table of Contents Chapter 1. History of Coordinate Systems at the Iowa DOT ................................................................1
1.1. HISTORY AND DEVELOPMENT OF THE IOWA REGIONAL COORDINATE SYSTEM (IARCS) ................................................... 1 1.2. APPROACH FOR IARCS DESIGN AND IMPLEMENTATION ............................................................................................ 2 1.3. WHY THE IOWA STATE PLANE COORDINATE SYSTEM IS DEFICIENT FOR CERTAIN MODERN DAY USES ................................ 3
1.4.1. Iowa State Plane Coordinate System Definitions .................................................................................... 4 1.5. LOW DISTORTION MAP PROJECTIONS GENERAL ISSUES ............................................................................................ 5
1.5.1. Low Distortion Map Projection Systems .................................................................................................. 5 1.5.2. Projection Grid Coordinates .................................................................................................................... 6
Chapter 2. Projected Coordinate Systems ..........................................................................................7
2.1. TYPES OF CONFORMAL MAP PROJECTIONS USED FOR THE IARCS ............................................................................... 7 2.1.1. Lambert Conformal Conic Projection ....................................................................................................... 7 2.1.2. Transverse Mercator Projection .............................................................................................................. 7
2.2. MANAGING MAP PROJECTION DISTORTION ........................................................................................................... 8 2.2.1. Distortion is Unavoidable ........................................................................................................................ 8 2.2.2. Two General Types of Map Projection Distortion ................................................................................... 8 2.2.3. Six Steps for Designing a Low Distortion Projection (LDP) ..................................................................... 12 2.3.4. IaRCS Map Projection Parameter Units ................................................................................................. 14
Chapter 3. IaRCS Map Projection Zone Definitions and Coordinates .................................................. 15
3.1. MAP OF IOWA REGIONAL COORDINATE SYSTEM ZONES .......................................................................................... 15 3.2. PROJECTION PARAMETERS FOR IOWA REGIONAL COORDINATE SYSTEM ..................................................................... 16 3.3. IARCS PROJECTED COORDINATES AT CENTROID OF EACH ZONE ............................................................................... 17 3.4. IARCS PERFORMANCE STATISTICS ...................................................................................................................... 18
Chapter 4. Using the IaRCS in Software and Performing Checks ........................................................ 19
4.1. ADDING IARCS COORDINATE SYSTEM DEFINITIONS TO SOFTWARE ........................................................................... 19 4.2. LOW DISTORTION PROJECTS IN GIS .................................................................................................................... 21
4.2.1. Managing GIS Data ................................................................................................................................ 21 4.3. CHECKING DISTORTION USING DISTANCES (GRID VS. GROUND) ............................................................................... 22
Chapter 5. Legislative Adoption and Registration with the NGS ........................................................ 24
5.1. IARCS ADMINISTRATIVE CODE ADOPTION ........................................................................................................... 24 5.2. NGS POLICY ON REGISTRATION OF THE IARCS ..................................................................................................... 24
References ....................................................................................................................................... 26
Appendix A. IaRCS individual zone distortion maps ........................................................................ A-i
Appendix B. IaRCS coordinates on NAD 83(2011) epoch 2010.00 NGS control ................................. B-i
Appendix C. IaRCS distortion values on NAD 83(2011) epoch 2010.00 NGS control .......................... C-i

Iowa Regional Coordinate System Handbook and User Guide
Iowa Department of Transportation P a g e | 1
Chapter 1. History of Coordinate Systems at the Iowa DOT
1.1. History and Development of the Iowa Regional Coordinate System (IaRCS) In a paper presented before the Surveying and Mapping Division of the American Society of Civil Engi-neers in 1935 it was reported that during 1932 and 1933, at the request of an engineer employed by the North Carolina Highway Commission, the Coast and Geodetic Survey cooperated with the State of North Carolina to develop a system of plane coordinates. This led to development of state plane coordinate systems for the 48 states and was completed in 1934. The paper reported that Iowa was one of several states making extensive use of the state plane coordinate system. In September 1936 the Federal Board of Surveys and Maps made a recommendation that its member organizations adopt the system of plane coordinates devised for each state by the Coast and Geodetic Survey. It was also recommended that the appropriate state plane coordinates system be shown on all maps and charts which may have value for engineering purposes, but which because of their nature or extent require a geographic base. It has taken many years for the Iowa Department of Transportation to adopt the recommendation that it use coordinate systems projected from a true geographic base to produce engineering plans and maps. Until the mid-1980s most plans and maps were produced from alignments using arbitrary direc-tion and drafted using stations and offsets from alignments. There was no real geographic basis to this system. In the mid-1980s when electronic data collection devices and computerized mapping were introduced it was realized that utilizing coordinate systems made mapping easier than using alignments with all their curves and angles. While it made mapping easier there was no geographic basis. Each project had its own coordinate system that had an arbitrary origin and an estimated relationship to north. In 1993 the definition for Iowa State Plane North Zone and South Zone was enacted into Chapter 355 of the Iowa Code. This coincided with an effort by the Design Office of the Iowa Department of Transpor-tation to utilize the state plane coordinate system as a basis for survey control for many of its major pro-jects. Design engineers and surveyors were concerned that differences in length would be too noticea-ble when compared with computed inverses between state plane coordinate pairs and distances meas-ured using modern survey equipment. The differences in length, it was realized, could exceed 100 parts per million. This was considered unacceptable. One solution to this problem, although geodetically faulty, is to modify the state plane coordinate sys-tem for each project. This system is also known as “Local Datum Plane Coordinates” (LDPC) where a cen-tral project point is held fixed to its actual state plane coordinate value, and all other project coordinates are scaled about it by a factor that will closely agree with survey measurements. While this gives each project a true geographic basis at one central point it also creates the potential for causing confusion. One concern is that scaled project coordinates can be mistaken for true state plane coordinates. In ad-dition, the scaled system is no longer truly geographic, which caused problems when combining with other datasets. For example, geographic imagery overlaid will only be approximate, and adjacent pro-ject maps will overlap with some variance in orientation. This document describes a geodetically sound method of developing a system of low distortion map pro-jections. The system is based on true conformal projections designed to cover specific portions of urban and rural areas of the state. This system, the Iowa Regional Coordinate System (IaRCS), will serve both the Department of Transportation and measurement professionals statewide.

Handbook and User Guide Iowa Regional Coordinate System
2 | P a g e Iowa Department of Transportation
1.2. Approach for IaRCS Design and Implementation The following elements were used in the design and implementation of the IaRCS: 1. A maximum statewide distortion limit of 1:40,000 = ±25 parts per million (ppm) = ±0.13 foot/mile
2. Bases on two common and easy-to-implement conformal map projections: The Transverse Mer-cator and Lambert Conformal Conic (single parallel).
3. For Lambert Conformal Conic zones, the latitude of grid origin is the same as the standard parallel.
4. Linear units is the U.S. survey foot, also referred to herein as “US foot” and “sft.”
5. Zones will cover as large an area as possible and still meet the distortion criteria, so as to minimize the total number of zones.
6. The defined extent of each zone conforms to county boundaries.
7. All zones have positive northing and easting coordinates within the zone area.
8. Each zone has unique coordinates that differ from those in other zones by a significant amount so as not to be confused with one another.
9. The false easting of each zone defined as the zone number × 1,000,000 + 10,500,000 (e.g., Zone 6 has false easting = 6 × 1,000,000 + 10,500,000 = 16,500,000 sft). Intent is that easting coordinates help identify the zone.
10. The northings and eastings for each zone are designed to be markedly different than Iowa State Plane coordinates (both NAD 27 and NAD 83) and UTM.
11. Referenced to the National Spatial Reference System (NSRS), currently defined geometrically as NAD 83 (based on the GRS-80 ellipsoid). The projection parameters are not affected by a specific realization of NAD 83, since all of these realizations reference the GRS 80 ellipsoid.
12. Projections created are referenced to NAD 83 “generically” with specific realization of NAD 83 (such as HARN, CORS96, NSRS2007, 2011) stated in the metadata associated with the observed project datasets.
13. Stakeholders were involved in development and review of the IaRCS (internal IaDOT staff, local and state surveying associations, etc.).
14. Implementation of the IaRCS includes publishing all defining parameters and making them readily available to the public.
15. Involve software vendors so that the IaRCS can be included in their software.
16. Interact with NGS in the future to discuss the possibility of the IaRCS and other state legislated zones being included on NGS datasheet output files, including OPUS output results
17. The vertical datum will be the current NAVD 88. The geoid model used is part of the metadata belonging to a full coordinate system definition; however the vertical datum and geoid are inde-pendent of the IaRCS projection zone parameters.
18. There is no requirement for a site “calibration” or “localization” for determining IaRCS coordi-nates.

Iowa Regional Coordinate System Handbook and User Guide
Iowa Department of Transportation P a g e | 3
1.3. Why the Iowa State Plane Coordinate System is Deficient for Certain Modern Day Uses As noted previously, the State Plane Coordinate system was first studied in 1933 by the U.S. Department of Commerce, Coast and Geodetic Survey and eventually adopted for Io-wa law (legal status), most recently in 1993. Iowa State Plane is based on the two-parallel Lambert Conformal Con-ic Projection with two zones, North and South (zone num-bers 1401 and 1402, respectively). By using two zones, the north-south width of each zone could be kept within 115 miles (less than the typical state plane zone width of 158 miles, as shown in Figure 1.3.1). By defining a scale of ex-actly 1 on the standard parallels, the maximum distortion (at the topographic surface) was limited to approximately one part in 8,300 (120 parts per million). The State Plane system presents the following issues for the surveying, engineering, and GIS communities:
• Does not represent ground distances except near the standard parallels
• Does not minimize distortion over large areas and at varying elevations
• Does not reduce convergence angles
Currently State Plane coordinates are available for all horizontal control points published by the National Geodetic Survey (NGS) on NGS Datasheets, and are also generated for all point coordinates determined by the NGS Online Positioning User Service (OPUS). The Iowa State Plane Coordinate System still main-tains some limited advantages for general surveying and mapping (GIS) at a statewide level, such as de-picting physical, cultural, and human geography over large areas of the state. It also works well for map-ping long linear facility lines such as highways, electrical transmission, and pipelines, which crisscross the state. The State Plane Coordinate System provides for a common reference (map projection) for con-versions (transformations) between other coordinate systems including the zones of the IaRCS. Figure 1.3.2 depicts total linear distortion (at the topographic surface of the Earth) for both the North and South Iowa State Plane zones.
Figure 1.3.1. Iowa State Plane Two parallel Lambert Conformal Conic Pro-

Handbook and User Guide Iowa Regional Coordinate System
4 | P a g e Iowa Department of Transportation
Figure 1.3.2. Linear distortion at the topographic surface for both zones of the Iowa State Plane Coordi-nate System of 1983.
1.4.1. Iowa State Plane Coordinate System Definitions IOWA NORTH ZONE (designation 1401) Iowa State Plane North - NAD 1983 Lambert Conformal Conic Two Standard Parallel Projection (Secant) Central Meridian: 93° 30’ W Latitude of Origin: 41° 30’ N Standard Parallel (South): 42° 04’ N Standard Parallel (North): 43° 16’ N False Northing: 1,000,000 m (3,280,833.333 US survey feet) False Easting: 1,500,000 m (4,921,250.000 US survey feet) Max linear distortion: 1:8,200 (-122 ppm) Note: This is distortion with respect to the topographic
surface. Maximum distortion with respect to the ellipsoid is 1:18,300 (-54.6 ppm) and occurs along the central parallel.
North Zone County Coverage: Allamakee, Benton, Black Hawk, Boone, Bremer, Buchanan, Buena Vista, Butler, Calhoun, Carroll, Cerro Gordo, Cherokee, Chickasaw, Clay, Clayton, Crawford, Delaware, Dickinson, Dubuque, Emmet, Fayette, Floyd, Franklin, Greene, Grundy, Hamilton, Hancock, Hardin, Howard, Humboldt, Ida, Jackson, Jones,

Iowa Regional Coordinate System Handbook and User Guide
Iowa Department of Transportation P a g e | 5
Kossuth, Linn, Lyon, Marshall, Mitchell, Monona, O'Brien, Osceola, Palo Alto, Plymouth, Pocahontas, Sac, Sioux, Story, Tama, Webster, Winnebago, Winneshiek, Woodbury, Worth, and Wright. IOWA SOUTH ZONE (designation 1402) Iowa State Plane South - NAD 1983 Lambert Conformal Conic Two Standard Parallel Projection (Secant) Central Meridian: -93° 30’ (W) Latitude of Origin: 40° 00’ Standard Parallel (South): 40° 37’ Standard Parallel (North): 41° 47’ False Northing: 0 m (0 US survey feet) False Easting: 500,000 m (1,640,416.667 US survey feet) Max linear distortion: 1:8,900 (-112 ppm) Note: This is distortion with respect to the topographic
surface. Maximum distortion with respect to the ellipsoid is 1:19,400 (-51.6 ppm) and occurs along the central parallel.
South zone County Coverage: Adair, Adams, Appanoose, Audubon, Cass, Cedar, Clarke, Clinton, Dallas, Davis, Decatur, Des Moines, Fremont, Guthrie, Harrison, Henry, Iowa, Jasper, Jefferson, Johnson, Keokuk, Lee, Louisa, Lucas, Madi-son, Mahaska, Marion, Mills, Monroe, Montgomery, Muscatine, Page, Polk, Pottawattamie, Poweshiek, Ringgold, Scott, Shelby, Taylor, Union, Van Buren, Wapello, Warren, Washington, and Wayne.
1.5. Low Distortion Map Projections General Issues
1.5.1. Low Distortion Map Projection Systems Low distortion map projections (like those within the IaRCS coordinate system) are based on true conformal projections designed to cover specific portions of urban and rural areas of the state. For conformal projections (e.g., Transverse Mercator, Lambert Conformal Conic, Stereo-graphic, Oblique Mercator, regular Mercator, etc.), linear distortion is the same in every direc-tion from a point. That is, the scale at any particular point is the same in any direction and fig-ures on the surface of the Earth tend to retain their original form on the map. The term “low dis-tortion” refers to minimizing the linear horizontal distortion from two affects: 1) representing a curved surface on a plane and 2) departure of the elevated topography from the projection sur-face due to variation in topographic height of the area covered. See Section 2.2 for more infor-mation on map projection distortion.
The advantages of a low distortion projection are:
• Grid coordinate distances closely match the same distance measured on the ground. • Allow for larger areas to be covered with less distortion. • Reduced convergence angle (if the central meridian is centered within the zone). • Quantitative distortion levels can be determined from location and topographic height. • Clean zone parameter definitions compatible with common surveying, engineering, and
GIS software. • Easy to transform between other coordinate systems. • Maintains a relationship to the National Spatial Reference System (NSRS) by allowing di-
rect use of published NSRS control coordinates (i.e., latitude, longitude, and ellipsoid height).
• Can cover entire cities and counties making them useful for regional mapping and GIS.

Handbook and User Guide Iowa Regional Coordinate System
6 | P a g e Iowa Department of Transportation
1.5.2. Projection Grid Coordinates Because calculations relating latitude and longitude to positions of points on a given map can become quite involved, rectangular grids have been developed for the use of surveyors, engi-neers, and GIS mapping professionals. In this way, each point may be designated merely by its distance from two perpendicular axes on the “plane” map. The Y axis normally coincides with a chosen central meridian, y increasing north. The X axis is perpendicular to the Y axis at a latitude of origin on the central meridian, with x increasing east. Commonly, x and y coordinates are called "eastings" and "northings," respectively, and to avoid negative coordinates may have "false eastings" and "false northings" added to relate to the projection grid origin.

Iowa Regional Coordinate System Handbook and User Guide
Iowa Department of Transportation P a g e | 7
Chapter 2. Projected Coordinate Systems 2.1. Types of Conformal Map Projections Used for the IaRCS
2.1.1. Lambert Conformal Conic Projection As the name implies, this Lambert projection is con-formal (preserves angles with a unique scale at each point). This projection superimposes a cone over the sphere of the Earth, with either one reference parallel tangent (or above the globe in the typical case of a low distortion projection) or with two standard parallels secant (a straight line that intersects with the globe in two places). Specifying a “central meridian” orients the cone with respect to the ellipsoid. Scale error (dis-tortion with respect to the ellipsoid) is constant along the parallel(s). Typically, it is best used for covering areas long in the east–west direction, or, for low dis-tortion applications, where topographic height changes more-or-less uniformly in the north-south direction. The Lambert Conformal Conic projection for the IaRCS is designed using a single parallel. The cone of the pro-jection is typically scaled up from the ellipsoid to “best fit” an area and range of topographic height on the Earth’s surface (see Figure 2.2.3).
2.1.2. Transverse Mercator Projection The Transverse Mercator is a conformal projection with a developable surface that can be visualized as a cylinder. The cylinder is superimposed over the refer-ence ellipsoid in a “transverse” orientation, i.e., with the cylinder axis in the equatorial plane. The curved surface of the cylinder coincides with a “central merid-ian” along which the scale is constant. This projection is used for many State Plane zones and the familiar UTM (Universal Transverse Mercator) map projection series, and it is probably one of the most commonly used projections for large-scale mapping. This projec-tion works particularly well for areas long in the north–south direction, and for low distortion applications where topographic height changes more-or-less uni-formly in the east-west direction.
Figure 2.1.1. Diagram for Lambert Conformal Conical projection with one standard parallel.
Figure 2.1.2. Diagram for Transverse Mercator projection.

Handbook and User Guide Iowa Regional Coordinate System
8 | P a g e Iowa Department of Transportation
2.2. Managing Map Projection Distortion
2.2.1. Distortion is Unavoidable Johann Carl Friedrich Gauss's (1777–1855) Theorema Egregium (Remarkable Theorem) mathematically proved that a curved surface (such as the Earth’s ellipsoid model) cannot be represented on a plane without distortion. Since any method of representing a sphere's surface on a plane is a map projection, all map projections produce distortion and every distinct map projection distorts in a distinct way. For low distortion projections, deciding on the type of map projection that best minimizes distortion for an area of the earth may not be an obvious or clear-cut task.
2.2.2. Two General Types of Map Projection Distortion
1. Linear distortion - The difference in horizontal distance between a pair of grid (map) coordinates when compared to the true (ground) horizontal distance is shown by δ in tables 2.2.2.1 and 2.2.2.2 (and schematically in figures 2.2.2.1 and 2.2.2.2). This may be expressed as a ratio of distortion length to ground length: E.g., feet of distortion per mile; parts per million (= mm per km). Note: 1 foot / mile = 189 ppm = 189 mm / km. Linear distortion can be positive or negative: Negative distortion means the grid (map) length is shorter than the “true” horizontal (ground) length. Positive distortion means the grid (map) length is longer than the “true” horizontal (ground) length. (continued on next page)

Iowa Regional Coordinate System Handbook and User Guide
Iowa Department of Transportation P a g e | 9
Grid length less thanellipsoidal length
(distortion < 0)
Grid length greaterthan ellipsoidal length
(distortion > 0)
Ellipsoidsurface
Projectionsurface(secant)
Maximum projection zone width for balanced positive
and negative distortion
Table 2.2.2.1. Maximum linear distortion for various projection zone widths.
Maximum zone width for
secant projections (km and miles)
Maximum linear horizontal distortion, δ
Parts per million (mm/km) Feet per mile
Ratio (absolute value)
25 km (16 miles) ±1 ppm ±0.005 ft/mile 1 : 1,000,000
57 km (35 miles) ±5 ppm ±0.026 ft/mile 1 : 200,000
81 km (50 miles) ±10 ppm ±0.05 ft/mile 1 : 100,000
114 km (71 miles) ±20 ppm ±0.1 ft/mile 1 : 50,000
180 km (112 miles) ±50 ppm ±0.3 ft/mile 1 : 20,000
255 km (158 miles) e.g., SPCS* ±100 ppm ±0.5 ft/mile 1 : 10,000
510 km (317 miles) e.g., UTM† ±400 ppm ±2.1 ft/mile 1 : 2,500
*State Plane Coordinate System; zone width shown is valid between ~0° and 45° latitude †Universal Transverse Mercator; zone width shown is valid between ~30° and 60° latitude
Figure 2.2.2.1. Linear distortion due to earth curvature.

Handbook and User Guide Iowa Regional Coordinate System
10 | P a g e Iowa Department of Transportation
Grid distance less than"ground" distance(distortion < 0)
Horizontal distance betweenpoints on the ground
(at average height)
Ground surfacein project area
Localprojectionsurface
Ellipsoidsurface
Grid distancegreater than
"ground" distance(distortion > 0)
Typical published "secant" projection
surface (e.g., State Plane, UTM)
Distortion < 0for almost all cases
Table 2.2.2.2. Linear distortion at various heights with respect to projection surface.
Height below (–) and above (+)
projection surface
Maximum linear horizontal distortion, δ
Parts per million (mm/km)
Feet per mile Ratio (absolute value)
±30 m (±100 ft) ±4.8 ppm ±0.025 ft/mile ~1 : 209,000
±120 m (±400 ft) ±19 ppm ±0.10 ft/mile ~1 : 52,000
±300 m (±1000 ft) ±48 ppm ±0.25 ft/mile ~1 : 21,000
+600 m (+2000 ft)* –96 ppm –0.50 ft/mile ~1 : 10,500
+1000 m (+3300 ft)** –158 ppm –0.83 ft/mile ~1 : 6,300
+4400 m (+14,400 ft)† –688 ppm –3.6 ft/mile ~1 : 1,500
*Approximate mean topographic height of North America (US, Canada, and Central America) ** Approximate mean topographic height of western coterminous US (west of 100°W longitude) † Approximate maximum topographic height in coterminous US
Rule of Thumb: A 30 m (100-ft) change in height causes a 4.8 ppm change in distortion
Figure 2.2.2.2. Linear distortion due to ground height above ellipsoid.

Iowa Regional Coordinate System Handbook and User Guide
Iowa Department of Transportation P a g e | 11
Creating an LDP and minimizing distortion by the methods described in this document only makes sense for conformal projections. For conformal projections (e.g., Transverse Mercator, Lambert Conformal Conic, Stereographic, Oblique Mercator, regular Mercator, etc.), linear distortion is the same in every direction from a point. For all non-conformal projections (such as equal area projections), linear distor-tion generally varies with direction, so there is no single unique linear distortion (or “scale”) at any point. 2. Angular distortion - For conformal projections, this equals the convergence (mapping) angle (γ). The convergence angle is the difference between grid (map) north and true (geodetic) north. Convergence angle is zero on the projection central meridian, positive east of the central meridian, and negative west of the central meridian, as shown in table 2.2.2.3 below. The magnitude of the convergence angle increases with distance from the central meridian, and its rate of change increases with increasing latitude. Table 2.2.2.3 shows “convergence angles” at a distance of one mile (1.6 km) east (positive) and west (negative) of projection central meridian (for both Transverse Mercator and Lambert Conformal Conic projections).
Table 2.2.2.3. Convergence angle 1 mile from central meridian at various latitudes.
Latitude Convergence angle 1 mile from CM Latitude Convergence angle
1 mile from CM 0° 0° 00’ 00” 50° ±0° 01’ 02”
10° ±0° 00’ 09” 60° ±0° 01’ 30” 20° ±0° 00’ 19” 70° ±0° 02’ 23” 30° ±0° 00’ 30” 80° ±0° 04’ 54” 40° ±0° 00’ 44” 89° ±0° 49’ 32”
Usually convergence is not as much of a concern as linear distortion, and it can only be minimized by staying close to the projection central meridian (or limiting surveying and mapping activities to equato-rial regions of the Earth). Note that the convergence angle is zero for the regular Mercator projection, but this projection is not suitable for large-scale mapping in non-equatorial regions. In topographically rugged areas (such as much of the western US), distortion due to variation in ground height is greater than that due to curvature. The total linear distortion of grid (map) coordinates is a combination of distortion due to Earth curvature and distortion due to ground height above the ellipsoid.

Handbook and User Guide Iowa Regional Coordinate System
12 | P a g e Iowa Department of Transportation
Extent oflow-distortion
coverage
Representativeellipsoid heightfor project area
±Height limitsfor lowdistortion
Localprojectionsurface
Local projection axis(central meridian forTransverse Mercator)
Ellipsoidsurface
Groundsurface
Local grid coordinate system designed for specific project location, showing extent of low-distortion coverage
Figure 2.2.3. Diagram shows the effect of scaling the projection to a representative height above the ellipsoid.
2.2.3. Six Steps for Designing a Low Distortion Projection (LDP) 1. Define project area and choose representative ellipsoid height (not elevation)
• The average height of an area may not be appropriate (e.g., for projects near a mountain).
○ Usually no need to estimate height to an accuracy of better than about ±20 ft, especially since the scale based on the height will be refined during the design process.
• Note that as the size of the area in-creases, the effect of Earth curvature on distortion increases, and it must be considered in addition to the ef-fect of topographic height.
○ E.g., for areas wider than about 35 miles perpendicular to the projection axis (i.e., ~18 miles either side of projection axis), distortion due to curvature alone exceeds 5 parts per million (ppm). The “projection axis” is defined in step #2.
2. Choose projection type and place projection axis near centroid of project area
• Select a well-known and widely used conformal projection, such as the Transverse Mercator (TM) or one-parallel Lambert Conformal Conic (LCC).
○ The “projection axis” is the line along which projection scale is constant (with respect to the ellipsoid). It is the central meridian for the TM projection, the standard (central) parallel for the one-parallel LCC projection, the (implicitly defined) central parallel for the two-parallel LCC projection, and the skew axis for the OM projection.
○ Place the central meridian of the projection near the east-west “middle” of the project area to minimize convergence angles (i.e., the difference between geodetic and grid north).
• IMPORTANT: In some cases it may be advantageous to offset the projection axis from the pro-ject centroid, for example if topographic height increases gradually and more-or-less uniformly with distance from the projection axis. Such techniques can dramatically improve LDP perfor-mance.
3. Scale projection axis to representative ground height
• Compute map projection axis scale factor “at ground”: GR
hk 0
0 1+=
○ For TM projection, 0k is the central meridian scale factor.
○ For one-parallel LCC projection, 0k is the standard (central) parallel scale factor.

Iowa Regional Coordinate System Handbook and User Guide
Iowa Department of Transportation P a g e | 13
• RG is the geometric mean radius of curvature, ϕ22
2
sin11
eeaRG −
−= , where
ϕ = geodetic latitude of point, and for the GRS-80 ellipsoid: a = semi-major axis = 6,378,137 m (exact) = 20,925,604.474 US survey feet e2 = first eccentricity squared = 2f – f 2 f = geometric flattening = 1 / 298.257222101
○ Alternatively, can initially approximate RG since 0k will likely be refined in Step #4:
Table 2.2.3. Geometric mean radius of curvature at various latitudes for the GRS-80 ellipsoid (rounded to nearest 1000 meters and feet).
Latitude RG (meters) RG (feet) Latitude RG (meters) RG (feet) 0° 6,357,000 20,855,000 50° 6,382,000 20,938,000
10° 6,358,000 20,860,000 60° 6,389,000 20,961,000 20° 6,362,000 20,872,000 70° 6,395,000 20,980,000 30° 6,367,000 20,890,000 80° 6,398,000 20,992,000 40° 6,374,000 20,913,000 90° 6,400,000 20,996,000
4. Check distortion at points distributed throughout project area
• Best approach is to compute distortion over entire area and generate distortion raster with con-tours. This allows analysis of performance “everywhere” and ensures optimal low-distortion coverage.
• Distortion computed at a point (at ellipsoid height h) as 1−
+
=hR
Rk
G
Gδ
○ Where k = projection grid point scale factor (i.e. distortion with respect to ellipsoid at a specific point). Note that computation of k is rather involved, and is often done by commer-cially available software.
○ Multiply δ by 1,000,000 to get distortion in parts per million (ppm).
5. Keep the definition SIMPLE and CLEAN!
• Define the scale factor to no more than SIX decimal places, e.g., 1.000206 (exact).
○ Note: A change of one unit in the sixth decimal place equals distortion caused by a 21-foot change in height.
• Defining central meridian and latitude of grid origin to nearest whole arc-minute is usually ade-quate (e.g., central meridian = 111°48’00” W).
• Define grid origin using whole values with as few digits as possible (e.g., false easting = 50,000 for a system with maximum easting coordinate value < 100,000). Note that the grid origin defi-nition has no impact whatsoever on the map projection distortion.
○ It is strongly recommended that the coordinate values everywhere in the design area be dis-tinct from other coordinate system values for that area (such as State Plane or UTM) in or-der to reduce the risk of confusing the LDP with other systems.

Handbook and User Guide Iowa Regional Coordinate System
14 | P a g e Iowa Department of Transportation
○ Note: In some applications, there may be an advantage to using other criteria for defining the grid origin. For example, it may be desirable for northing and easting coordinates to never equal one another within the design area. In other cases it may be useful to make the coordinates distinct from State Plane by using larger rather than smaller coordinates, espe-cially if the LDP covers a very large area.
6. Explicitly define linear unit and geometric reference system (i.e., geodetic datum)
• E.g., Linear unit = US survey foot; Geometric reference system = North American Datum of 1983.
○ The US survey foot is longer than the international foot by 2 ppm. Because coordinate sys-tems typically use large values, it is critical that the type of foot used be identified (the val-ues differ by 1 foot per 500,000 feet).
• Note: The reference system realization (i.e., “datum tag”) should not be included in the coordi-nate system definition (just as it is not included in State Plane definitions). However, the datum tag is an essential component for defining the spatial data used within the coordinate system. For NAD 83, the NGS convention is to give the datum tag in parentheses after the datum name, usually as the year in which the datum was “realized” as part of a network adjustment. Com-mon datum tags for horizontal control are listed below:
○ “2011” for the current NAD 83 (2011) epoch 2010.00 realization, which is referenced to the North America tectonic plate.
○ “2007” for the (superseded) NSRS2007 (National Spatial Reference System of 2007) realiza-tion. Functionally equivalent to the superseded “CORS” datum tag and referenced to an epoch date of 2002.00 for most of the coterminous US.
○ “199x” for the various supersede HARN (or HPGN) realizations, where x is the last digit of the year of the adjustment (usually done for a particular state. The Iowa HARN is 1996 (HARN is “High Accuracy Reference Network” and HPGN is “High Precision Geodetic Net-work”).
The objective of LDP design is to cover the largest area with the least distortion possible. These goals are at odds with one another, since distortion increases as the size of the projected area increases. Thus LDP design is an optimization problem that does not typically yield a single unique “best” solution. Be-cause of this, it is important that LDPs be designed collaboratively to allow input of all stakeholders af-fected by the design. This allows stakeholders to work together and resolve conflicting objectives and select optimal designs before a system is finalized. An added benefit to this approach is that the partici-pants gain “ownership” over the design which leads to greater satisfaction in the final product. This is all important because once a design is implemented it can be very difficult to change, especially since the design can be incorporated into project plans, software, and even state statute.
2.3.4. IaRCS Map Projection Parameter Units All of the IaRCS map projection parameters are provided in U.S. survey feet. Careful attention is needed when entering these map projection coordinate systems into the coordinate system management sec-tion of your GPS (GNSS) surveying, engineering, or GIS vendor software. When converting the provided data (false northing, false easting, etc.) to meters (or other desired units), be sure to carry out the values to full sufficient significant figures and check that the units are accepted by the software in the units you provide. Each software vendor (in the future) may elect to provide updated versions of their coordinate system management software with the IaRCS zones already installed.

Iowa Regional Coordinate System Handbook and User Guide
Iowa Department of Transportation P a g e | 15
Chapter 3. IaRCS Map Projection Zone Definitions and Coordinates
3.1. Map of Iowa Regional Coordinate System Zones
Figure 3.1. Index map of IaRCS zones, showing distortion within each zone.

Handbook and User Guide Iowa Regional Coordinate System
16 | P a g e Iowa Department of Transportation
3.2. Projection Parameters for Iowa Regional Coordinate System • All zones are referenced to the North American Datum of 1983 • “LCC” = Lambert Conformal Conic projection; “TM” = Transverse Mercator projection • For LCC projection, origin latitude is standard parallel (projection axis) • Linear unit is the US survey foot (sft), where 1 sft = 1200 / 3937 meter (exact)
Table 3.2. IaRCS projection parameters for each zone.
Zone num Zone name
Pro-jection
type
Origin latitude Central meridian Projection axis scale
False northing
(sft)
False easting
(sft) (deg-min) (decimal deg) (deg-min) (decimal deg)
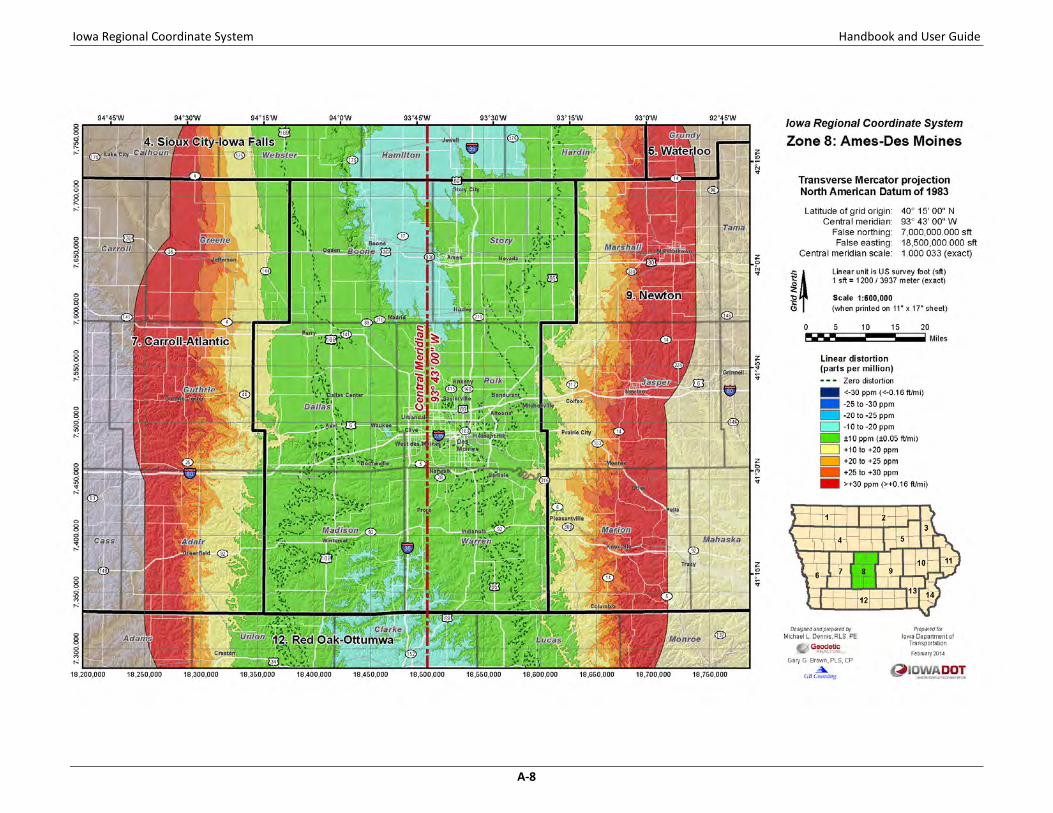
1 Spencer LCC 43°12'N 43.200000 095°15'W -95.250000 1.000 052 9,600,000 11,500,000 2 Mason City LCC 43°10'N 43.166667 092°45'W -92.750000 1.000 043 9,800,000 12,500,000 3 Elkader TM 40°15'N 40.250000 091°12'W -91.200000 1.000 035 8,300,000 13,500,000 4 Iowa LCC 42°32'N 42.533333 094°50'W -94.833333 1.000 045 8,600,000 14,500,000 5 Waterloo LCC 42°39'N 42.650000 092°15'W -92.250000 1.000 032 8,900,000 15,500,000 6 Council Bluffs TM 40°15'N 40.250000 095°44'W -95.733333 1.000 039 6,600,000 16,500,000 7 Carroll-Atlantic TM 40°15'N 40.250000 094°38'W -94.633333 1.000 045 6,800,000 17,500,000 8 Ames-Des Moines TM 40°15'N 40.250000 093°43'W -93.716667 1.000 033 7,000,000 18,500,000 9 Newton TM 40°15'N 40.250000 092°49'W -92.816667 1.000 027 7,200,000 19,500,000
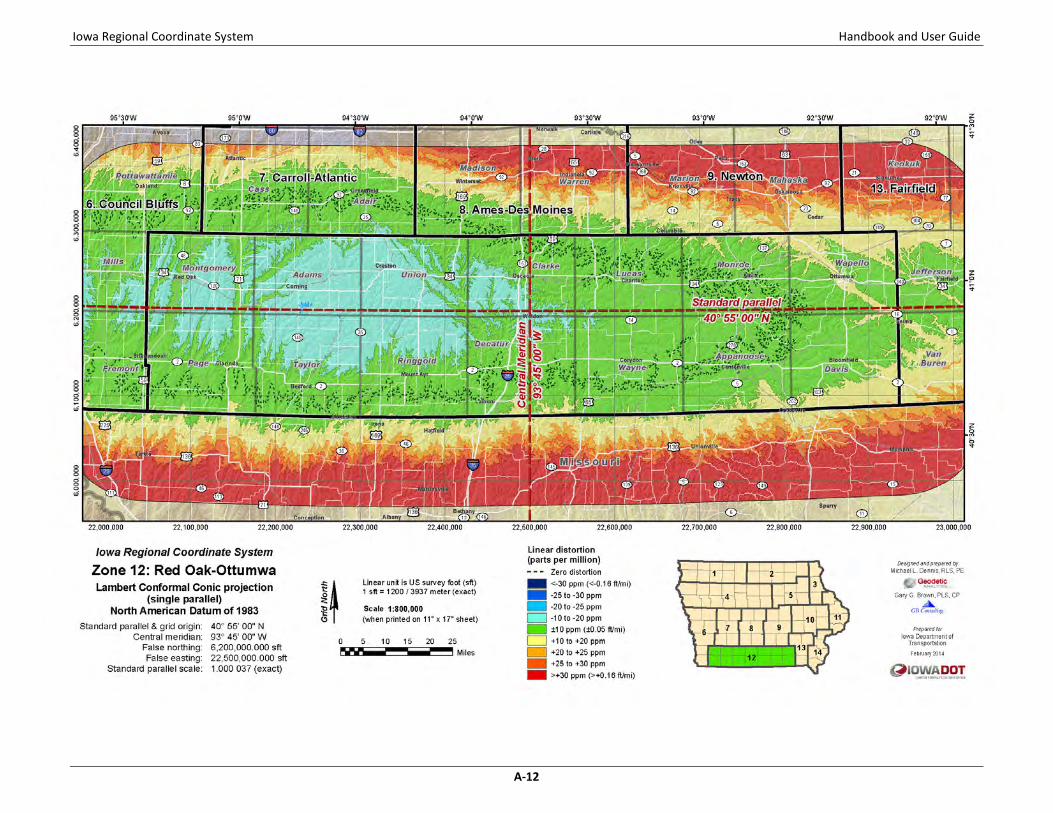
10 Cedar Rapids LCC 41°50'N 41.833333 091°40'W -91.666667 1.000 020 8,000,000 20,500,000 11 Dubuque-Davenport TM 40°15'N 40.250000 090°32'W -90.533333 1.000 027 7,600,000 21,500,000 12 Red Oak- Ottumwa LCC 40°55'N 40.916667 093°45'W -93.750000 1.000 037 6,200,000 22,500,000 13 Fairfield TM 40°15'N 40.250000 091°55'W -91.916667 1.000 020 6,400,000 23,500,000
14 Burlington TM 40°15'N 40.250000 091°15'W -91.250000 1.000 018 6,200,000 24,500,000

Iowa Regional Coordinate System Handbook and User Guide
Iowa Department of Transportation P a g e | 17
3.3. IaRCS Projected Coordinates at Centroid of Each Zone Table 3.3 gives IaRCS projected coordinates for each zone. The northing and easting values are given to the nearest 0.0001 US survey foot (sft) to facilitate checking of projected coordinate computations. A list of IaRCS projected coordinates for NAD 83(2011) epoch 2010.00 NGS control stations in Iowa is given in Appendix B. A corresponding list giving distortion values for these NGS control stations is given in Appendix C. Both these lists can be used as checks on coordinate and distortion computations. Table 3.3 Projected coordinates (in US survey feet) of centroid for each zone of the IaRCS.
Zone num Zone name Latitude
(deg-min-sec) Longitude
(deg-min-sec) Latitude
(decimal degrees) Longitude
(decimal degrees) Northing
(sft) Easting
(sft)
1 Spencer 43°12'24.11513''N 95°14'41.63871''W 43.206698647222 -95.244899641667 9,602,441.7567 11,501,359.9478
2 Mason City 43°13'00.82041''N 92°50'49.95565''W 43.216894558333 -92.847209902778 9,818,323.3443 12,474,084.7219
3 Elkader 42°52'56.79489''N 91°21'38.68240''W 42.882443025000 -91.360745111111 9,259,298.5162 13,456,913.6913
4 Sioux City-Iowa Falls 42°33'50.96262''N 94°45'02.43989''W 42.564156283333 -94.750677747222 8,611,244.7249 14,522,268.8622
5 Waterloo 42°37'44.94131''N 92°17'02.35383''W 42.629150363889 -92.283987175000 8,892,402.8672 15,490,852.8889
6 Council Bluffs 41°33'29.10132''N 95°36'26.13048''W 41.558083700000 -95.607258466667 7,076,635.3081 16,534,507.0448
7 Carroll-Atlantic 41°41'08.74973''N 94°39'59.84405''W 41.685763813889 -94.666623347222 7,323,142.0446 17,490,906.3318
8 Ames-Des Moines 41°41'13.66480''N 93°45'50.24425''W 41.687129111111 -93.763956736111 7,523,635.0768 18,487,082.4340
9 Newton 41°42'34.26941''N 92°48'26.79864''W 41.709519280556 -92.807444066667 7,731,787.5821 19,502,518.3197
10 Cedar Rapids 41°54'44.04572''N 91°36'53.95693''W 41.912234922222 -91.614988036111 8,028,756.9352 20,514,066.8414
11 Dubuque-Davenport 42°03'58.00264''N 90°38'58.36948''W 42.066111844444 -90.649547077778 8,261,756.7920 21,468,442.6981
12 Red Oak-Ottumwa 40°52'13.01700''N 93°47'20.76210''W 40.870282500000 -93.789100583333 6,183,102.0615 22,489,185.3927
13 Fairfield 41°08'07.30631''N 91°56'59.28336''W 41.135362863889 -91.949800933333 6,722,572.3521 23,490,872.3865
14 Burlington 41°02'07.16105''N 91°19'19.74889''W 41.035322513889 -91.322152469444 6,486,127.3642 24,480,093.7773

Handbook and User Guide Iowa Regional Coordinate System
18 | P a g e Iowa Department of Transportation
3.4. IaRCS Performance Statistics The IaRCS design objective of keeping distortion within ±25 ppm everywhere in the state was achieved. The overall performance statistics are shown in Figure 3.1 and are given below. Percent area of state with distortion within: ±10 ppm = ±0.05 ft/mile = 1:100,000 73.628% ±20 ppm = ±0.11 ft/mile = 1:50,000 99.605%
±25 ppm = ±0.13 ft/mile = 1:40,000 99.999%
Only 0.001% of the area of the state has distortion that exceeds a magnitude of 25 ppm. The linear dis-tortion statistics for each IaRCS zone and the entire state are given in Table 3.4. Note that 6 of the 14 zones have distortion entirely within ±20 ppm, and that nowhere in the state does IaRCS distortion ex-ceed a magnitude of 26 ppm (0.14 ft/mile).
Table 3.4. IaRCS linear distortion statistics (ppm).
Zone num Zone name Minimum Maximum Mean Standard
deviation 1 Spencer -18.8 17.8 -3.6 ±7.0 2 Mason City -19.8 20.4 -4.0 ±5.3 3 Elkader -19.9 18.6 -3.6 ±6.6 4 Sioux City-Iowa Falls -21.8 22.7 -2.9 ±7.8 5 Waterloo -21.3 21.7 -4.7 ±7.6 6 Council Bluffs -25.9 25.9 -5.7 ±9.1 7 Carroll-Atlantic -22.5 23.4 -4.2 ±8.0 8 Ames-Des Moines -19.2 18.9 -3.0 ±6.2 9 Newton -19.6 19.3 -3.8 ±7.7
10 Cedar Rapids -19.9 22.4 -5.8 ±8.1 11 Dubuque-Davenport -22.4 23.5 -0.8 ±6.3 12 Red Oak-Ottumwa -21.7 22.1 -3.3 ±8.6 13 Fairfield -14.4 14.1 -5.7 ±5.0 14 Burlington -16.7 17.6 -4.0 ±5.6
Entire state -25.9 25.9 -3.9 ±7.5

Iowa Regional Coordinate System Handbook and User Guide
Iowa Department of Transportation P a g e | 19
Chapter 4. Using the IaRCS in Software and Performing Checks 4.1. Adding IaRCS Coordinate System Definitions to Software To use IaRCS coordinates for surveying, engineering, and GIS applications, the IaRCS must be defined in the software packages used to perform the work. IaRCS zone parameters (as given in Table 3.2) are en-tered into the appropriate “coordinate system management/definition” module of the software. This chapter is designed to get you started, but it is recommended that you consult the “help” documenta-tion and tutorials of the particular vendor software you plan to work with. Also, for future reference please go to the IaRCS web page (www.iowadot.gov/rtn/IaRCS.aspx) for updates and downloads. Because of the number and variability of commercial software packages, and the frequency of software updates, this Handbook and User Guide does not give specific instructions for defining the IaRCS in ven-dor software. However, Esri projection (*.prj) files are available from the IaRCS website at www.iowadot.gov/gis/Projections/zipped_files/LDP/LowDistortionProjections_PRJ.zip. Note that the *.prj files are specifically referenced to the NAD 83(2011) epoch 2010.00 realization. Any particular “realization” of NAD 83 results in an associated set of coordinates on the stations that provide access to the datum, without changing how the datum is related to the Earth. The projection parame-ters and reference ellipsoid (GRS-80) are identical for all realizations of NAD 83. In principle, lines of lati-tude and longitude are the same, but the coordinates differ due to the how they are determined, as well as to motion (such as plate tectonics). The NAD 83 realization is therefore associated with the data. If the data are referenced to NAD 83(2011) epoch 2010.00, that will result in coordinates at a point that differ from other realizations. The realization is a critical part of the metadata, but it has no effect on the map projection parameters. That is, the relationship between latitude and longitude and the IaRCS (or State Plane) northings and eastings is the same for all NAD 83 realizations. Consider as an example how different realizations will result in different coordinates at a specific NGS survey control station in Iowa, HUBBARD WEST BASE (PID NK0704). This control station has provided surveyors access to the NAD 83 datum since its inception in 1986 (and to the NAD 27 datum for several decades prior). The NAD 83 geographic (geodetic) coordinates for this station have been updated three times relative to different NAD 83 datum realizations. From Appendix B, the geographic coordinates of HUBBARD WEST BASE referenced to NAD 83(2011) epoch 2010.00 are 42°11'17.95886''N, 93°21'58.33308''W. These geographic coordinates yield IaRCS Zone 8 coordinates (in US survey feet) of 7,706,471.80 N, 18,594,984.49 E. Because of changes in the way the position of this station was deter-mined (including different observation types, amount of data, computation methods, and adjustment constraints, as well as tectonic motion), the geographic coordinates were different for earlier realiza-tions of NAD 83. From the NGS Datasheet, the coordinates of HUBBARD WEST BASE referenced to the original NAD 83(1986) realization were 42°11'17.96422''N, 93°21'58.33233''W, which give IaRCS coordi-nates of 7,706,472.34 N, 18,594,984.55 E. The difference in coordinates between these two realizations of NAD 83 is 0.54 ft N, 0.06 ft E. It can be seen by this example that including datum realization infor-mation in database metadata and coordinate system definition files is a critical part of maintaining accu-rate coordinates for geospatial data. Table 4.1 gives the changes in coordinates for NGS control station HUBBARD WEST BASE corresponding to all four NAD 83 realizations in Iowa. Note that the coordinate changes are specific to this station; changes at other locations will in general be different.

Handbook and User Guide Iowa Regional Coordinate System
20 | P a g e Iowa Department of Transportation
Table 4.1. Change in NAD 83 coordinates for NGS station HUBBARD WEST BASE (PID NK0704) for each realization (“datum tag”) in Iowa from original (1986) through current (2011).
NAD 83 datum
tag
NAD 83 geodetic coordinates associated with each datum tag (i.e., realization)
IaRCS Zone 8 coordinates projected from geodetic coordinates
Horizontal change in
coordinates Latitude Longitude Northing (sft) Easting (sft)
1986 42°11'17. 96422'N 93°21'58.33233''W 7,706,472.340 18,594,984.549
0.569 ft
1996 42°11'17.95867''N 93°21'58.33355''W 7,706,471.778 18,594,984.459
0.036 ft
2007 42°11'17.95889''N 93°21'58.33393''W 7,706,471.800 18,594,984.431
0.064 ft
2011 42°11'17.95886''N 93°21'58.33308''W 7,706,471.798 18,594,984.495 Coordinate transformations between the various realizations of NAD 83 have been developed by NGS (such as NADCON). However, these transformations are not appropriate for all applications, and the documentation for each should be reviewed to ensure suitability. Typically these transformations are not of sufficient accuracy for surveying and engineering applications. In such cases more rigorous methods are necessary and can be done with respect to the desired NAD 83 reference coordinates, such as reprocessing data, recomputing coordinates, or performing custom local transformations. Over time, most commercial software manufacturers will add the IaRCS to their standard coordinate system libraries. When that occurs, there will be no need to manually enter the zone parameters. But in some cases it still may be necessary to change the NAD 83 realization in commercial software coordi-nate system definitions (such as *.prj files) if a dataset is referenced to the wrong realization. This can occur, for example, if a dataset is referenced to “NAD 83” (without any modifier), which is often inter-preted by software as original NAD 83(1986). Another example is an existing project referenced to an earlier realization, such as NAD 83(2007), rather than the current 2011 realization. Although changing the NAD 83 realization can be done, such changes should only be made after it has been verified that the change is necessary, appropriate, and correct. Iowa Department of Transportation uses Bentley Microstation CADD software with similar projection functionality to modern GIS software. IaRCS zones are defined in a geographic configuration file (*.dty) that allows any drawing in an IaRCS geographic coordinate system to be overlaid and coincide with an-other drawing from another geographic coordinate system, such as State Plane or UTM. The configura-tion file that allows this (and the instructions for placing it in the startup configuration) is linked to the IaRCS website at www.iowadot.gov/design/caddtools/IowaRCS.zip. The latitude and longitude centroid coordinates for each zone in Table 3.3 can be used as a check to en-sure commercial software is giving the correct IaRCS projected coordinates. A list of IaRCS coordinates for NGS NAD 83(2011) epoch 2010.00 control stations in Appendix B can also be used as a check. Distor-tion values can be checked for these NGS station using the values in Appendix C. Note regarding the relationship between NAD 83 and WGS 84: For the purposes of entering the IaRCS projection parameters into particular vendor software, the datum should be defined as NAD 83 (which uses the GRS-80 reference ellipsoid for all realizations). Some commercial software implementations assume there is no transformation between WGS 84 and NAD 83 (i.e., all transformation parameters are

Iowa Regional Coordinate System Handbook and User Guide
Iowa Department of Transportation P a g e | 21
zero). Other implementations use a non-zero transformation, and in some cases both types are availa-ble in a single software package. The type of transformation used will depend on specific circumstances, although often the zero transformation is the appropriate choice (even though it is not technically cor-rect). Check with software support to ensure the appropriate transformation is being used for your ap-plication. Note regarding the vertical component of a coordinate system definition: A complete 3-D coordinate system definition must include a vertical “height” component. Yet the IaRCS pertains exclusively to hor-izontal coordinates. So although the vertical component is essential for most applications, it is not part of the IaRCS and must be defined separately. Typically the vertical part consists of ellipsoid heights rela-tive to NAD 83 (when using GNSS) and/or orthometric heights (“elevations”) relative to the North Amer-ican Vertical Datum of 1988 (NAVD 88). These two types of heights are related (at least in part) by a hy-brid geoid model, such as GEOID12A, as well as some sort of vertical adjustment or transformation to match local vertical control for a project. The approach used for the vertical component usually varies from project to project and requires professional judgment to ensure it is defined correctly. Providing such instructions is beyond the scope of this Handbook and User Guide.
4.2. Low Distortion Projects in GIS Modern GIS software incorporates on-the-fly projections. This allows users to simultaneously display data from differing coordinate systems in a common coordinate system on the computer screen. Low distortion projection systems can thus be easily and seamlessly incorporated for display of GIS data-bases. An advantage to LDPs is the fact that the historical data need not be modified. Past data can still reside in its original coordinate system and merely be re-projected in real time into the new coordinate system for use with new LDP data. Thus, as future LDPs are developed, multiple round-off error will not propagate with each time a new projection is applied. This will allow cities and counties to adopt the new LDPs while still using their original data without modification. New data can be acquired in the best LDP for the area and still be used with the historical data or other data collected by other agencies in different coordinate systems with minimal effort by the user. Many cities and counties in Iowa use GIS data to manage their resources. Because the IaRCS zones are defined by county boundaries, the IaRCS will usually provide excellent coverage for the entire service area of an agency. GIS calculations of route distances, cut/fill volumes, etc. will be more accurate with use of LDPs because of the minimized distortion. Existing coordinate systems may be adequate for large, statewide analyses where data resolution is low (e.g. large grids cell sizes > 30m). The development of LDPs allows for new high resolution data (e.g. small grid cell sizes 0.1m to 2m) and digital terrain models (DTM) from LIDAR and other new technologies to be analyzed with minimal distortion in GIS environments when studies are performed on a localized county or city areas. Existing coordinate systems would provide a substan-tial amount of distortion when analyzing these DTMs. Hence, LDPs will allow for the development of more accurate GIS databases and help bridge the gap between GIS and surveying for mapping.
4.2.1. Managing GIS Data Geographic Information System managers administer data. Data includes spatial and attribute infor-mation that is provided from many sources. The spatial data locates features across the landscape while the attributes provide characteristics of the features. GIS managers use the same reference frameworks as surveyors to define positions in space. Nearly all GIS operations require accurate locations of geographic features. Accurate locations allow GIS users to integrate and/or combine information from various sources. Critical to the accurate locations of features is a record of the coordinate system and associated projection parameters. GIS managers

Handbook and User Guide Iowa Regional Coordinate System
22 | P a g e Iowa Department of Transportation
often incorporate surveyed data into geographic databases. Conversion of coordinate information into a different map projection system from which it was collected is usually necessary. Critical to this pro-cess is a well-defined set of existing and desired map projection parameters. The newly defined IaRCS low distortion projections provide another reference system in which data will be collected. By having detailed descriptions of properties of the map projection, GIS software can re-project and transform the geographic locations of dataset elements into any appropriate coordinate sys-tem. This allows the integration of multiple GIS layers, a fundamental GIS capability. A GIS or mapping project based on one of the new low distortion coordinate systems has significant ad-vantages. The design of the coordinate system allows field based measurements (data collection) to be directly utilized in the GIS without translation, saving time and reducing error. The size, position and ori-entation of features in the system can match ground conditions, increasing confidence and reducing the need for repetitive observation.
4.3. Checking Distortion Using Distances (Grid vs. Ground) Each IaRCS zone was developed so that grid and ground distances match very closely (within about ±25 ppm everywhere). If you are working near the fringe of a zone, or at elevations significantly (more than about a hundred feet) above or below the elevation limits of the zone’s low distortion area, then you may want to check the ppm result between control points in your project. To do this, pick the two far-thest points in your project that you can measure directly between with an EDM (total station). Meas-ure the horizontal ground distance between the points and record the ground distance measurement. Then inverse the IaRCS grid distance between the same two points. Subtract the grid distance from the ground distance, divide this difference by the ground distance, and multiply it by 1 million to get distor-tion in parts per million. For example:
1. Horizontal ground distance (from EDM) = 1239.998 sft 2. Inversed IaRCS grid distance (computed) = 1239.987 sft 3. Inversed minus measured distance = -0.011 ft 4. (-0.011 / 1239.998) × 1,000,000 = -8.9 parts per million (ppm)
This type of test can also be performed using GPS (GNSS) data. A simple but reasonably accurate way to do this is to use a delta XYZ GPS (GNSS) vector to estimate the horizontal ground distance between points. Neglecting curvature, this can be computed as:
H = 2222 hZYX ∆−∆+∆+∆ Where: ΔX, ΔY, ΔZ are the GPS vector components (as ECEF Cartesian coordinate deltas)
Δh = change in ellipsoid height between vector end points Accounting for curvature increases this horizontal ground distance, but for distances of less than 20 miles (about 30 km), the increase is less than 1 ppm (i.e., less than 3 cm). The curvature correction factor can be approximated as: HRHRC ÷÷= − ))2(sin2( 1 where R is the earth radius. A value of 20,920,000 feet works well for Iowa. The (straight) horizontal distance is multiplied by the correction factor to get the curved horizontal ground distance. Note that there is no need to account for refraction, because the GPS vector is computed, not observed.
Iowa Regional Coordinate System Handbook and User Guide
Iowa Department of Transportation P a g e | 23
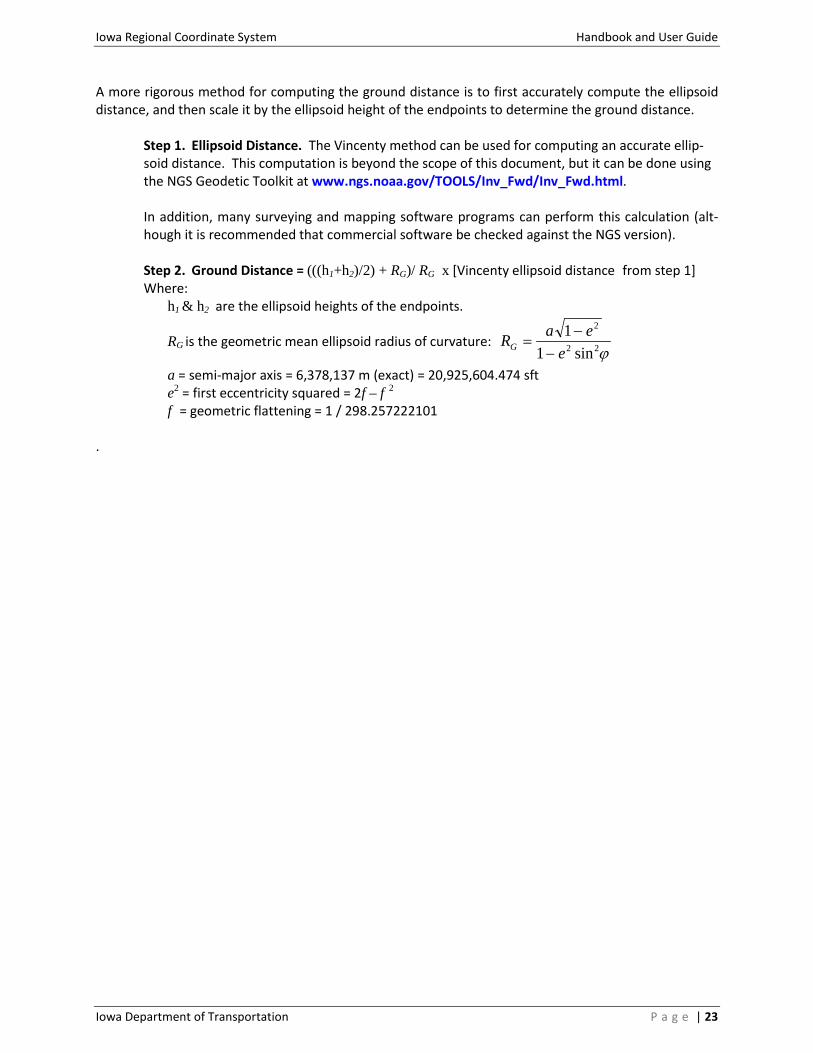
A more rigorous method for computing the ground distance is to first accurately compute the ellipsoid distance, and then scale it by the ellipsoid height of the endpoints to determine the ground distance.
Step 1. Ellipsoid Distance. The Vincenty method can be used for computing an accurate ellip-soid distance. This computation is beyond the scope of this document, but it can be done using the NGS Geodetic Toolkit at www.ngs.noaa.gov/TOOLS/Inv_Fwd/Inv_Fwd.html.
In addition, many surveying and mapping software programs can perform this calculation (alt-
hough it is recommended that commercial software be checked against the NGS version). Step 2. Ground Distance = (((h1+h2)/2) + RG)/ RG x [Vincenty ellipsoid distance from step 1] Where: h1 & h2 are the ellipsoid heights of the endpoints.
RG is the geometric mean ellipsoid radius of curvature: ϕ22
2
sin11
eeaRG −
−=
a = semi-major axis = 6,378,137 m (exact) = 20,925,604.474 sft e2 = first eccentricity squared = 2f – f 2
f = geometric flattening = 1 / 298.257222101 .

Handbook and User Guide Iowa Regional Coordinate System
24 | P a g e Iowa Department of Transportation
Chapter 5. Legislative Adoption and Registration with the NGS 5.1. IaRCS Administrative Code Adoption As the IaRCS is currently being used and is generally accepted by a wide audience of Iowa professional surveyors, engineers, GIS, cartographic, and academic professionals around the state, effort will be made to include definition of the IaRCS in Chapter 193(C) of the Iowa Administrative Code. This effort will be made in cooperation with the Society of Land Surveyors of Iowa (SLSI) and the Iowa Engineering and Land Surveying Examining Board. Inclusion will encourage fundamental viable acceptance by engi-neering, surveying, and mapping professionals within the state as well as other Federal agencies such as the BLM, NGS, FEMA, etc.
5.2. NGS Policy on Registration of the IaRCS The Iowa Department of Transportation, SLSI, and other concerned organizations will be urged to pro-mote adoption of the IaRCS by the National Geodetic Survey (NGS), guided by their policy on changes to plane coordinate systems. The existing NGS policy on plane coordinate systems is given below. NGS “POLICY ON CHANGES TO PLANE COORDINATE SYSTEMS”, April 11, 2001 (www.ngs.noaa.gov/INFO/Policy/SPCS4.html)
The National Geodetic Survey (NGS) recognizes there may be States that want to implement changes to their existing North American Datum of 1983 (NAD 83) State Plane Coordinate System (SPCS) parame-ters or to create and employ supplemental plane coordinate projections. These changes could include: changing the number of zones, changing existing zone boundaries, and/or changing the geometric pa-rameters (e.g., false northing/easting, origin, central meridian, etc.), and/or creating additional coordi-nate systems. NGS also recognizes that State and local surveying, mapping, and Geographic Information System (GIS) agencies may develop grid systems to support a variety of agency or local activities that may be in conflict with the policy detailed below. This policy details only those elements which must be met for NGS to publish these coordinate systems as part of the National Spatial Reference System (NSRS).
While NGS does not encourage States to change the current definition of the existing SPCS, NGS does recommend any proposed changes be thoroughly discussed in detail with NGS technical staff, including the NGS State Geodetic Advisor, if such an office exists in the State, prior to submitting a request to the Director, NGS. NGS will adopt changes to SPCS or add supplemental projections into NSRS only under the following conditions:
1. All requests for changes must be submitted in writing to the Director, NGS, and must be co-signed by those State agencies and organizations most involved in the use, collection, and distri-bution of spatial data including, but not limited to, the State Department of Transportation, State Office of GIS, and state land surveyor professional organizations. Hereafter these groups are referred to as the "State." Required agencies and organizations will be determined by NGS on a state-by-state basis. A similar request must also be submitted to the U.S. Geological Survey (USGS) to ensure integrity of NSRS with USGS national mapping products and services.
2. All new SPC zones or supplemental projections shall use the two basic map projections, the Lambert Conformal Conic or the Mercator (transverse or oblique), defined at the surface of the ellipsoid of the current Datum (Geodetic Reference System 1980 - GRS 80).

Iowa Regional Coordinate System Handbook and User Guide
Iowa Department of Transportation P a g e | 25
3. All changes must be adopted by State Law (or State Regulation when such Regulation is regulat-ed by public notices and hearings and no opposition exist). Such Law must include a complete description of the revised SPCS zones and geometric parameters. A specified conversion factor between meters and feet (U.S. Survey or International) is strongly recommended to be included in the legislation. NGS will publish coordinates only in those legislated units.
4. Zones will continue to be defined by International, State and county boundaries, and by the counties contained therein. (See Federal Register Notice "Policy on Publication of Plane Coordi-nates," Vol. 42, Nol. 57, pages 15943-15944, published March 24, 1977.)
5. SPCS changes will ensure that the resulting coordinate differences are sufficiently large (by at least 10,000 meters) to ensure that no confusion will exist with the current NAD 83 coordinate values.
6. A naming convention shall be developed that ensures a distinct labeling between the existing and revised new coordinate zones.
7. Should NGS estimate significant expenses resulting from changes to the existing SPCS, NGS may require State reimbursement. These costs would be for coordinate conversion, data base extrac-tion and publication software required to support computation, publication and distribution of new coordinate values as part of NSRS.
8. To facilitate public awareness, the State shall develop an education program that includes an ar-ticle detailing the rationale for the development of the changes, the process of review and ex-amination of the issues, the final design criteria, and a workshop or seminar to be presented at a State-wide surveying and mapping conference. The article shall be submitted for publication in one or more surveying and mapping periodicals (e.g., American Congress on Surveying and Mapping Bulletin, Professional Surveyor, or P.O.B. magazines). In addition, this article will be made available on the web sites of the sponsoring agencies defined as the "State." Any requests for technical support from NGS requiring travel expenses for NGS personnel shall be reimbursed by the State.

Handbook and User Guide Iowa Regional Coordinate System
26 | P a g e Iowa Department of Transportation
References Armstrong, M.L., Singh, R., and Dennis, M.L., 2010. Oregon Coordinate Reference System Handbook and User
Guide, version 2.0, Oregon Department of Transportation, Geometronics Unit, Salem, Oregon, USA, 89 pp., ftp.odot.state.or.us/ORGN/Documents/ocrs_handbook_user_guide.pdf.
Hager, J.W., Behensky, J.F., and Drew, B.W., 1989. The Universal Grids: Universal Transverse Mercator (UTM) and Universal Polar Stereographic (UPS), DMA Technical Manual 8358.2, Defense Mapping Agency, Fairfax, Virginia, USA, 49 pp., “TM8358_2.pdf” in earth-info.nga.mil/GandG/publications/tm8358.2/TM8358_2.pdf.
Hager, J.W., Fry, L.L., Jacks, S.S. and Hill, D.R., 1990. Datums, Ellipsoids, Grids, and Grid Systems, DMA Technical Manual 8358.1, Edition 1, Defense Mapping Agency, Fairfax, Virginia, USA, 150 pp., earth-info.nga.mil/GandG/publications/tm8358.1/toc.html.
Henning, W. (lead author), 2011. National Geodetic Survey User Guidelines for Single Base Real Time GNSS Posi-tioning, version 2.1, National Geodetic Survey, Silver Spring, MD, USA, 151 pp., www.ngs.noaa.gov/PUBS_LIB/NGSRealTimeUserGuidelines.v2.1.pdf. [appendices D and E discus “calibra-tions/localizations” and low distortion projections, respectively. Note that these appendices do not appear on versions of this document after v2.1]
Iliffe, J.C. and Lott, R., 2008. Datums and Map Projections: For Remote Sensing, GIS and Surveying, 2nd edition, Whittles Publishing, United Kingdom, 192 pp.
Snyder, J.P., 1987. Map Projections ─ A Working Manual, U.S. Geological Survey Professional Paper 1395, U.S. Government Printing Office, Washington, D.C., USA, 383 pp, pubs.er.usgs.gov/djvu/PP/PP_1395.pdf.
Stem, J.E., 1990. State Plane Coordinate System of 1983, NOAA Manual NOS NGS 5, U.S. Department of Com-merce, National Oceanic and Atmospheric Administration, National Geodetic Survey, Rockville, Maryland, USA, 119 pp., www.ngs.noaa.gov/PUBS_LIB/ManualNOSNGS5.pdf.
Van Sickle, J., 2004. Basic GIS Coordinates, CRC Press LLC, Boca Raton, Florida, USA, 173 pp.
Vincenty, T., 1975. Direct and inverse solutions of geodesics on the ellipsoid with application of nested equations, Survey Review, Vol. 23, No. 176, pp. 88-93, www.ngs.noaa.gov/PUBS_LIB/inverse.pdf.

Iowa Regional Coordinate System Handbook and User Guide
A-i
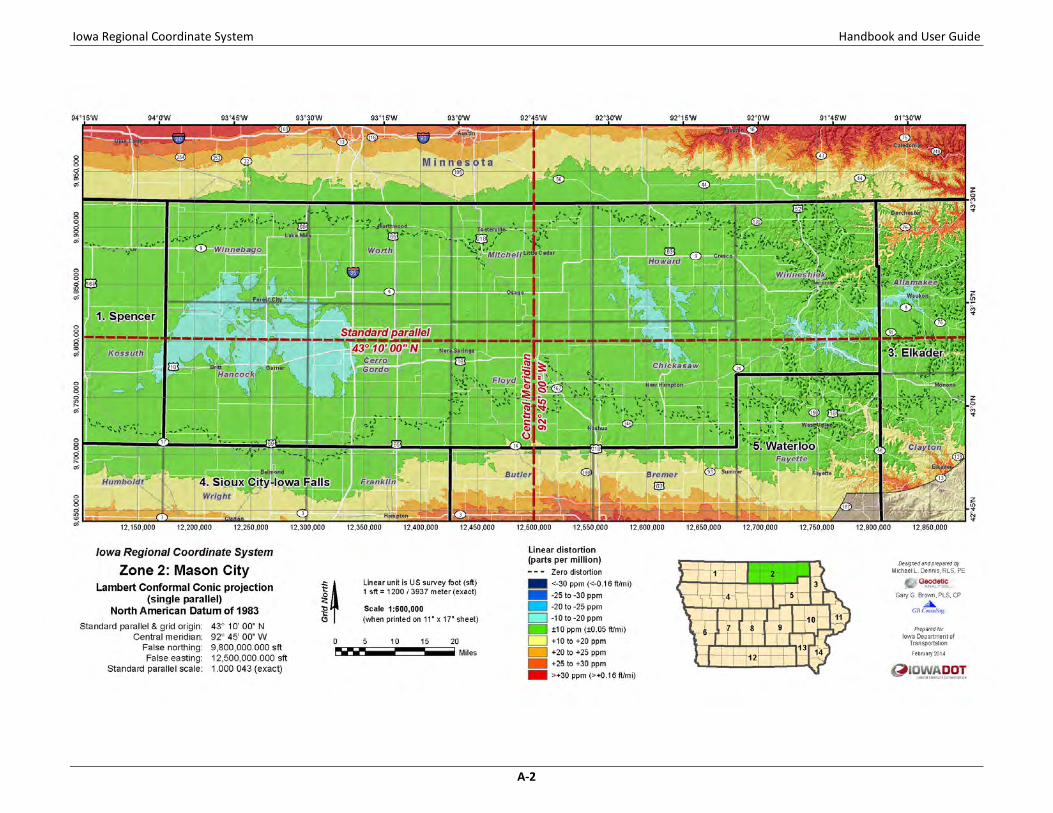
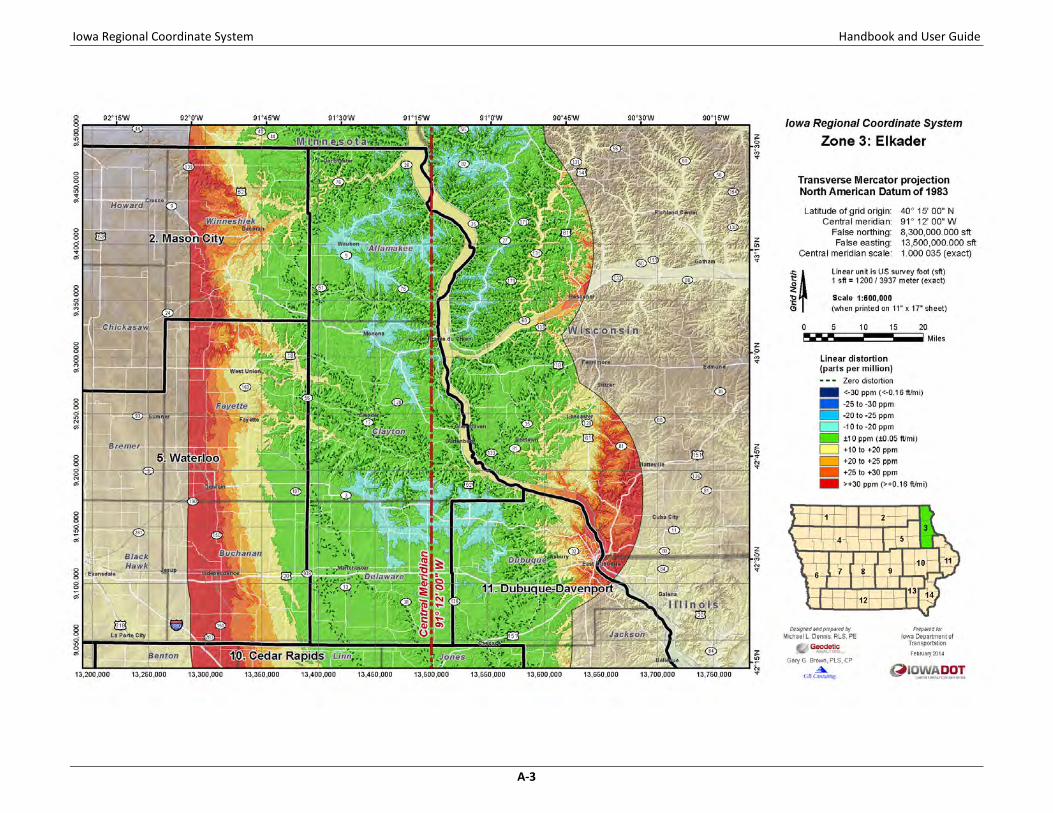
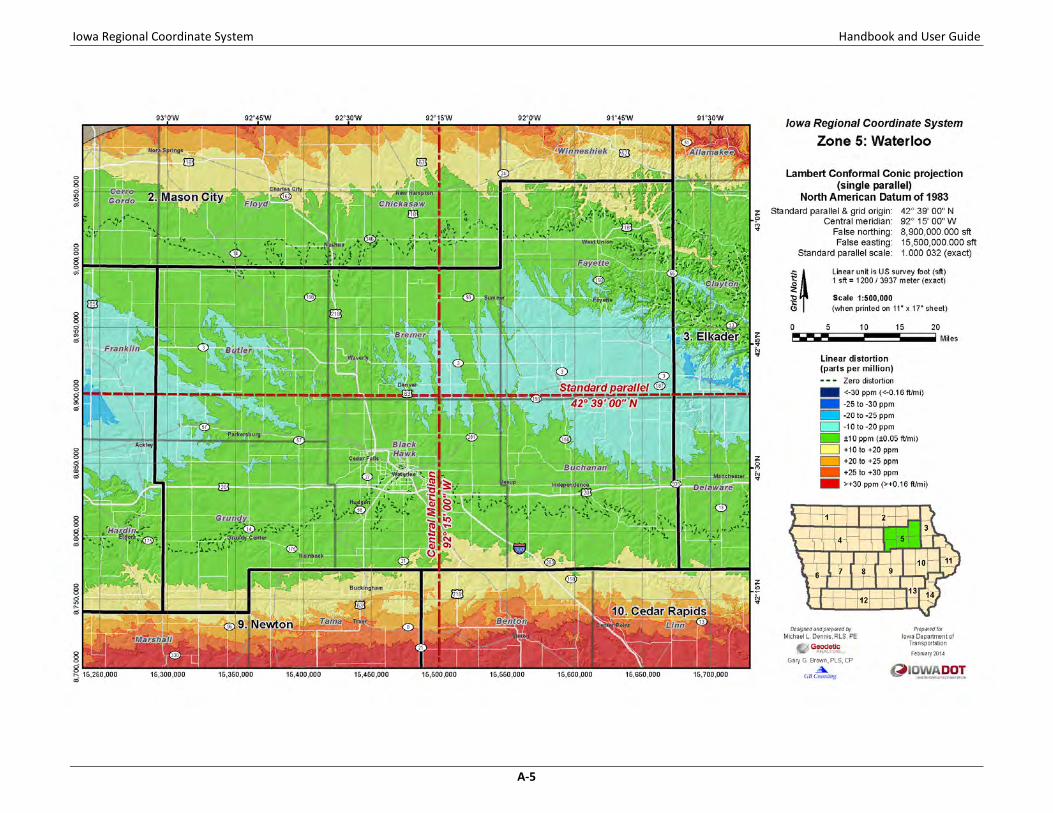
Appendix A. IaRCS individual zone distortion maps
Zones are numbered 1-14,
and are listed on pages A-1 through A-14

Iowa Regional Coordinate System Handbook and User Guide
A-1
Iowa Regional Coordinate System Handbook and User Guide
A-2
Iowa Regional Coordinate System Handbook and User Guide
A-3

Iowa Regional Coordinate System Handbook and User Guide
A-4
Iowa Regional Coordinate System Handbook and User Guide
A-5

Iowa Regional Coordinate System Handbook and User Guide
A-6

Iowa Regional Coordinate System Handbook and User Guide
A-7
Iowa Regional Coordinate System Handbook and User Guide
A-8

Iowa Regional Coordinate System Handbook and User Guide
A-9

Iowa Regional Coordinate System Handbook and User Guide
A-10

Iowa Regional Coordinate System Handbook and User Guide
A-11
Iowa Regional Coordinate System Handbook and User Guide
A-12

Iowa Regional Coordinate System Handbook and User Guide
A-13

Iowa Regional Coordinate System Handbook and User Guide
A-14

Iowa Regional Coordinate System Handbook and User Guide
B-i
Appendix B. IaRCS coordinates on NAD 83(2011) epoch 2010.00 NGS control

Iowa Regional Coordinate System Handbook and User Guide
B-1
IaRCS coordinates for NGS NAD 83(2011) epoch 2010.00 control Tables B-1 and B-2 give IaRCS coordinates for 312 NGS-published NAD 83(2011) epoch 2010.00 control stations in Iowa, sorted by designation (or CORS ID) within each zone. Table B-1 lists 35 NGS Continually Operating Reference Station (CORS) Antenna Reference Points (ARPs), and Table B-2 lists 277 NGS pas-sive control stations (i.e., monuments that can be occupied with survey equipment, such as brass disks). The northing and easting values are given to the nearest 0.0001 US survey foot (sft) to facilitate checking of projected coordinate computations. The stations given here were obtained from the NGS Inte-grated Data Base (NGSIDB) on August 11, 2014 and represent the status of NGS published NAD 83(2011) epoch 2010.00 control in Iowa on that date. IaRCS coordinates were computed directly from the NGS published latitude and longitude values, and the ellipsoid heights (published in meters) were converted to US survey feet. The stations were not occupied or recovered to create these tables, and so some stations may presently be obstructed, removed, damaged, destroyed, or otherwise unavailable or unsuitable for use. Table B-1. IaRCS coordinates for NGS NAD 83(2011) epoch 2010.00 CORS in Iowa.
Zone number and name NGS PID CORS ID (and station designation) Latitude Longitude Ellipsoid
ht (sft) Northing
(sft) Easting
(sft)
1. Spencer DP1310 IAAS (IOWA DOT ASHTON CORS ARP) 43°18'20.16923''N 95°46'44.57524''W 1412.678 9,638,938.5122 11,359,164.4935
1. Spencer DP2488 IASW (IADT SWEA CITY CORS ARP) 43°23'00.12333''N 94°17'47.25784''W 1108.669 9,668,284.3093 11,753,510.4306
2. Mason City DO2871 IADE (IOWA DOT DECORAH CORS ARP) 43°16'15.80601''N 91°49'53.48333''W 1041.770 9,839,392.5007 12,744,636.2323
2. Mason City DP1957 IAHT (IADT HANLONTOWN CORS ARP) 43°17'02.35597''N 93°22'06.64350''W 1133.439 9,843,372.5719 12,335,292.3623
3. Elkader DP1235 IAEL (IOWA DOT ELKADER CORS ARP) 42°52'40.45052''N 91°21'41.48774''W 984.296 9,257,644.1304 13,456,701.6428
3. Elkader DL3589 IANA (NEW ALBIN CORS ARP) 43°29'49.45244''N 91°17'26.49752''W 568.463 9,483,303.0854 13,475,933.0492
4. Sioux City-Iowa Falls DP1229 IACL (IOWA DOT CLARION CORS ARP) 42°43'51.59391''N 93°45'04.85678''W 1096.012 8,673,898.7371 14,790,721.3526
4. Sioux City-Iowa Falls DP1245 IAPS (IADT POCHAHONTAS CORS ARP) 42°44'16.91863''N 94°40'45.28490''W 1159.499 8,674,644.6357 14,541,398.6469
4. Sioux City-Iowa Falls DP1247 IASX (IADT SIOUX CITY CORS ARP) 42°33'00.13910''N 96°20'54.47505''W 1079.748 8,609,737.8629 14,091,726.6190
5. Waterloo DP1223 IAAL (IOWA DOT ALLISON CORS ARP) 42°44'49.37888''N 92°47'14.20394''W 958.354 8,935,830.1085 15,355,673.8529
6. Council Bluffs DP1227 IACB (COUNCIL BLUFFS CORS ARP) 41°13'26.38362''N 95°51'11.59336''W 911.760 6,954,894.9804 16,467,018.1555
6. Council Bluffs DP1233 IADN (IOWA DOT DENISON CORS ARP) 41°59'50.56299''N 95°22'32.52887''W 1152.140 7,236,897.9079 16,597,218.9069
6. Council Bluffs AH5054 OMH1 (OMAHA 1 CORS ARP) 41°46'41.76551''N 95°54'40.67031''W 1308.268 7,156,896.9070 16,451,456.4413
6. Council Bluffs AH5056 OMH2 (OMAHA 2 CORS ARP) 41°46'42.57678''N 95°54'41.34064''W 1306.211 7,156,979.1337 16,451,405.8205
6. Council Bluffs DI8412 OMH5 (OMAHA 5 CORS ARP) 41°46'41.76531''N 95°54'40.67014''W 1308.767 7,156,896.8867 16,451,456.4541

Iowa Regional Coordinate System Handbook and User Guide
B-2
Zone number and name NGS PID CORS ID (and station designation) Latitude Longitude Ellipsoid
ht (sft) Northing
(sft) Easting
(sft)
6. Council Bluffs DI8414 OMH6 (OMAHA 6 CORS ARP) 41°46'42.57631''N 95°54'41.34080''W 1306.917 7,156,979.0861 16,451,405.8083
7. Carroll-Atlantic DP1225 IAAT (IOWA DOT ATLANTIC CORS ARP) 41°24'19.52348''N 94°59'16.80591''W 1127.662 7,221,183.2314 17,402,697.5455
8. Ames-Des Moines DM2686 IAAM (IADT AMES CORS ARP) 42°00'34.52729''N 93°33'35.03154''W 874.493 7,641,180.6403 18,542,653.1922
8. Ames-Des Moines DP1239 IAMD (IADT MARTENSDALE CORS ARP) 41°22'16.79994''N 93°44'38.84682''W 764.306 7,408,558.3181 18,492,463.2709
8. Ames-Des Moines AI2153 SLAI (SLATER CORS ARP) 41°54'02.07288''N 93°41'55.90356''W 953.095 7,601,414.5327 18,504,847.3154
9. Newton DP1243 IAOK (IADT OSKALOOSA CORS ARP) 41°17'35.36919''N 92°41'04.79068''W 684.694 7,580,096.7447 19,536,276.2000
9. Newton DP1249 IATA (IOWA DOT TAMA CORS ARP) 41°58'01.64688''N 92°33'05.03261''W 814.887 7,825,773.5478 19,572,144.2997
10. Cedar Rapids DP1318 IAMN (IOWA DOT MARION CORS ARP) 42°01'49.08336''N 91°32'55.55595''W 754.451 8,071,800.2439 20,532,033.4405
10. Cedar Rapids AF9523 NLIB (NORTH LIBERTY CORS ARP) 41°46'17.70040''N 91°34'29.59182''W 682.827 7,977,511.2391 20,525,037.1410
11. Dubuque-Davenport DP1314 IADA (IADT DAVENPORT CORS ARP) 41°36'36.18278''N 90°37'49.54785''W 661.705 8,095,555.9536 21,473,446.0006
11. Dubuque-Davenport DP1241 IAMQ (IADT MAQUOKETA CORS ARP) 42°04'25.20090''N 90°38'42.15312''W 618.906 8,264,508.4365 21,469,669.4831
11. Dubuque-Davenport AF9642 RIS1 (ROCK ISLAND 1 CORS ARP) 42°00'44.18171''N 90°13'32.20280''W 712.971 8,242,265.3143 21,583,630.9279
11. Dubuque-Davenport AF9644 RIS2 (ROCK ISLAND 2 CORS ARP) 42°00'44.28366''N 90°13'30.08134''W 712.669 8,242,276.2108 21,583,791.0463
11. Dubuque-Davenport DI8416 RIS5 (ROCK ISLAND 5 CORS ARP) 42°00'44.18164''N 90°13'32.20241''W 713.460 8,242,265.3073 21,583,630.9574
11. Dubuque-Davenport DI8418 RIS6 (ROCK ISLAND 6 CORS ARP) 42°00'44.28368''N 90°13'30.08075''W 713.233 8,242,276.2130 21,583,791.0908
12. Red Oak-Ottumwa DP1312 IACE (IADT CENTERVILLE CORS ARP) 40°42'07.27176''N 92°52'12.62543''W 940.891 6,123,019.9334 22,743,958.6148
12. Red Oak-Ottumwa DP1231 IACN (IOWA DOT CLARINDA CORS ARP) 40°44'33.94334''N 95°01'20.26096''W 926.310 6,139,201.2365 22,147,439.9384
12. Red Oak-Ottumwa DP1237 IALN (IADT LEON CORS ARP) 40°43'44.48410''N 93°45'42.85995''W 1045.159 6,131,631.9616 22,496,700.1095
13. Fairfield DP1251 IAWN (IADT WASHINGTON CORS ARP) 41°18'34.12005''N 91°40'44.74803''W 677.430 6,786,102.3329 23,565,270.9189
14. Burlington DP1316 IADO (IADT DONNELLSON CORS ARP) 40°38'48.98303''N 91°33'57.38924''W 618.995 6,344,770.9431 24,412,324.2231

Iowa Regional Coordinate System Handbook and User Guide
B-3
Table B-2. IaRCS coordinates for NGS NAD 83(2011) epoch 2010.00 passive control in Iowa.
Zone number and name NGS PID Station designation Latitude Longitude Ellipsoid
ht (sft) Northing
(sft) Easting
(sft)
1. Spencer DH3926 15 WL 43°30'01.34011''N 94°29'32.28774''W 1146.418 9,710,401.6902 11,701,058.9774
1. Spencer DH3928 31 DWB 43°30'02.76910''N 94°43'32.05318''W 1216.474 9,710,072.2895 11,639,160.1638
1. Spencer AJ8322 963073 3 7089 43°09'24.21959''N 95°12'09.72542''W 1241.946 9,584,230.4907 11,512,621.8543
1. Spencer OP0140 A 19 43°06'09.49177''N 94°38'22.46680''W 1129.033 9,565,105.0309 11,663,037.7462
1. Spencer OP1149 ALGOPORT 43°04'43.81368''N 94°16'25.81776''W 1116.008 9,557,356.4996 11,760,819.1636
1. Spencer OP0566 B 17 43°29'56.39118''N 95°41'42.40870''W 1560.952 9,709,304.5753 11,381,883.1405
1. Spencer OP0792 BEACON 43°10'02.07601''N 95°11'50.99946''W 1240.204 9,588,064.3446 11,514,007.5392
1. Spencer AI5700 BIGELOW 43°29'29.67104''N 95°41'55.88410''W 1563.960 9,706,604.2655 11,380,875.3407
1. Spencer NM0034 D 154 42°59'09.58979''N 96°29'07.64620''W 1091.353 9,524,435.3913 11,169,405.0720
1. Spencer OP0490 D 18 43°09'08.96506''N 95°13'49.15519''W 1242.484 9,582,682.9964 11,505,251.8394
1. Spencer NL0717 DALE 2 42°58'55.28013''N 94°13'38.92787''W 1026.514 9,522,218.0706 11,773,636.0680
1. Spencer OQ0592 GARFIELD 43°19'13.69590''N 96°10'35.47487''W 1322.776 9,645,278.0338 11,253,418.7398
1. Spencer CO3187 GROTEWOLD AZ MK 43°28'31.41674''N 96°24'36.34396''W 1419.184 9,702,520.3323 11,192,042.1981
1. Spencer OP0124 K 1 43°13'35.22725''N 94°13'16.86601''W 1057.882 9,611,326.8536 11,774,181.0310
1. Spencer OP0806 LAKE PARK 43°26'36.32781''N 95°22'06.59834''W 1440.260 9,688,754.7001 11,468,525.7352
1. Spencer OP0152 M 19 43°18'38.10357''N 94°47'33.28320''W 1178.518 9,640,642.0522 11,621,758.2158
1. Spencer OP1162 MILPORT 43°20'04.68373''N 95°09'09.71235''W 1342.783 9,649,091.0449 11,525,890.1953
1. Spencer AE2141 ORC A 42°59'21.41063''N 96°03'43.74176''W 1316.310 9,524,246.6255 11,282,684.4955
1. Spencer AJ8293 ORC B 42°58'56.49785''N 96°03'32.54829''W 1302.081 9,521,716.2853 11,283,492.0750
1. Spencer AJ8292 ORC C 42°59'36.84976''N 96°03'48.91209''W 1324.243 9,525,813.4854 11,282,315.4027
1. Spencer AJ8320 SPW A 2001 43°10'04.37230''N 95°12'31.76870''W 1243.980 9,588,295.1572 11,510,985.8638
1. Spencer OQ1239 STALIN 43°30'00.14519''N 96°01'42.49927''W 1366.890 9,710,331.2862 11,293,427.5225
1. Spencer OQ1237 STALIN RM 3 43°30'00.13377''N 96°01'04.51153''W 1344.686 9,710,304.2631 11,296,227.5126

Iowa Regional Coordinate System Handbook and User Guide
B-4
Zone number and name NGS PID Station designation Latitude Longitude Ellipsoid
ht (sft) Northing
(sft) Easting
(sft)
1. Spencer OP0559 U 16 43°19'27.50927''N 95°46'58.89817''W 1364.922 9,645,763.5829 11,358,148.8086
1. Spencer OP0782 WHYNOT 43°15'56.19534''N 95°01'58.98582''W 1369.987 9,623,990.3757 11,557,790.8928
1. Spencer OP0485 Y 17 43°10'00.10254''N 95°23'18.37663''W 1285.457 9,587,890.6809 11,463,063.1217
2. Mason City OO0687 41 1 43°07'33.22896''N 93°30'06.64422''W 1171.300 9,786,040.3612 12,299,269.6674
2. Mason City OO1164 AIR 43°09'01.20328''N 93°20'10.35289''W 1101.602 9,794,594.3128 12,343,553.3879
2. Mason City OO0967 AIRPORT 43°04'02.30143''N 92°36'38.58477''W 1018.961 9,763,813.9624 12,537,221.9895
2. Mason City OO1148 BEANS 43°04'00.49179''N 93°11'40.16252''W 1121.563 9,763,915.0053 12,381,213.2853
2. Mason City AB2419 BRUA RESET 43°28'08.55682''N 93°28'06.76142''W 1256.851 9,911,039.0971 12,309,233.3315
2. Mason City OO0226 C 37 43°03'51.13831''N 92°13'28.24890''W 1053.325 9,763,093.3391 12,640,438.2268
2. Mason City ON0867 CANOE 43°23'04.50792''N 91°44'17.99343''W 1084.069 9,881,058.2624 12,768,956.7940
2. Mason City DL5322 CCY A 43°04'41.15268''N 92°37'02.32957''W 1012.564 9,767,744.7582 12,535,453.0906
2. Mason City OO1315 CHARLPORT 43°04'21.35598''N 92°36'34.46716''W 1014.155 9,765,743.7296 12,537,524.4205
2. Mason City OO1209 CLOVER 43°13'38.05246''N 93°50'59.62251''W 1209.207 9,824,003.2048 12,206,835.8048
2. Mason City AE2134 DEH A 43°16'25.16222''N 91°43'56.19993''W 1059.735 9,840,645.3320 12,771,057.4839
2. Mason City ON0899 HESPER 43°29'11.04750''N 91°45'17.61359''W 1235.024 9,918,117.5032 12,764,113.1652
2. Mason City OO1179 JOICE RESET 43°21'34.26150''N 93°24'30.73388''W 1247.399 9,870,984.5022 12,324,850.5074
2. Mason City OO1635 LOUISE 43°30'00.59649''N 92°29'57.20175''W 1180.673 9,921,665.2943 12,566,545.6796
2. Mason City OO0292 M 36 43°04'28.99125''N 92°40'51.42860''W 911.835 9,766,492.9423 12,518,450.1937
2. Mason City OO0945 MAPLE 43°18'56.87200''N 92°26'08.32335''W 1255.522 9,854,516.5453 12,583,668.5966
2. Mason City OO0274 N 40 43°20'04.83000''N 92°52'41.22725''W 1094.666 9,861,266.6198 12,465,910.4039
2. Mason City NK0179 T 39 42°58'48.74442''N 92°32'21.95084''W 879.290 9,732,106.6323 12,556,352.7041
2. Mason City DF4650 TT 10 WM 43°29'58.44287''N 93°39'35.99384''W 1167.396 9,922,659.4746 12,258,526.9889
2. Mason City OO0257 V 39 43°01'16.93048''N 92°35'28.41169''W 911.274 9,747,079.6325 12,542,462.9449
3. Elkader NJ0606 997 42°34'45.84174''N 91°32'48.92159''W 897.232 9,148,998.1827 13,406,556.6020

Iowa Regional Coordinate System Handbook and User Guide
B-5
Zone number and name NGS PID Station designation Latitude Longitude Ellipsoid
ht (sft) Northing
(sft) Easting
(sft)
3. Elkader ON0828 EGAN 43°09'12.22060''N 91°16'17.44969''W 1057.321 9,358,024.8540 13,480,915.4535
3. Elkader NJ0754 ET 2 JS 42°22'26.88426''N 91°08'43.43266''W 924.440 9,074,001.0773 13,514,755.1604
3. Elkader NJ0700 GUTTEN 42°45'24.86908''N 91°07'45.27124''W 850.802 9,213,510.6290 13,519,004.4593
3. Elkader ON0786 MINNOWA 43°30'00.52514''N 91°27'54.01362''W 1050.549 9,484,523.0919 13,429,680.8216
4. Sioux City-Iowa Falls NK0300 42 105 42°19'55.66105''N 93°18'35.33261''W 1014.129 8,530,371.9238 14,911,960.6023
4. Sioux City-Iowa Falls NK0284 42 140 42°29'06.37127''N 93°15'45.48268''W 1029.634 8,586,347.9599 14,923,683.6487
4. Sioux City-Iowa Falls NK0285 42 141 42°28'14.50826''N 93°15'45.11350''W 1036.140 8,581,098.8211 14,923,808.6132
4. Sioux City-Iowa Falls NM0820 A 146 42°46'56.59477''N 96°35'33.84741''W 1054.745 8,695,676.0113 14,027,671.2681
4. Sioux City-Iowa Falls NK0186 A 29 42°44'22.94202''N 93°18'03.04720''W 1117.084 8,678,938.9982 14,911,699.5294
4. Sioux City-Iowa Falls NM1659 AITKEN 42°24'53.20417''N 96°07'32.44822''W 1319.840 8,559,452.5095 14,151,002.4918
4. Sioux City-Iowa Falls NL0062 B 28 42°41'26.24341''N 94°01'48.21925''W 1041.753 8,658,350.7157 14,715,975.6041
4. Sioux City-Iowa Falls NL0066 D 3 42°13'29.73770''N 94°02'52.48497''W 1045.762 8,488,585.5198 14,712,748.8326
4. Sioux City-Iowa Falls NL0581 DIVIDE 42°50'32.39450''N 95°19'44.18634''W 1449.515 8,713,010.8726 14,367,068.3204
4. Sioux City-Iowa Falls NL0584 EARLY 42°25'19.87286''N 95°07'06.56646''W 1317.947 8,559,621.1044 14,422,999.6627
4. Sioux City-Iowa Falls DI3115 EBS A 42°26'29.82509''N 93°52'26.01143''W 1014.509 8,568,039.3355 14,758,990.3538
4. Sioux City-Iowa Falls DI3116 EBS B 42°26'20.53260''N 93°52'10.94507''W 1019.060 8,567,111.4570 14,760,130.7215
4. Sioux City-Iowa Falls DI3117 EBS C 42°25'55.52606''N 93°51'49.18307''W 1028.955 8,564,598.6165 14,761,791.4603
4. Sioux City-Iowa Falls NL0804 ET 1 HK 42°15'09.40621''N 94°22'44.60851''W 1031.287 8,498,019.4040 14,622,997.7649
4. Sioux City-Iowa Falls NK0735 ET 7 JA 42°16'02.69586''N 93°45'25.44542''W 1024.407 8,504,934.3804 14,791,330.2398
4. Sioux City-Iowa Falls NL0374 F 14 42°28'23.03111''N 95°43'40.10908''W 1116.162 8,579,307.7103 14,258,666.9041
4. Sioux City-Iowa Falls NL0119 F 32 42°28'19.60412''N 94°03'01.16130''W 1022.819 8,578,663.1695 14,711,263.7572
4. Sioux City-Iowa Falls AE2135 FOD A 42°33'09.88062''N 94°11'14.86704''W 1042.554 8,607,737.8450 14,674,038.7972
4. Sioux City-Iowa Falls AE2149 GPS 048 42°41'28.41533''N 96°19'51.60841''W 1356.595 8,661,104.8449 14,097,341.0223
4. Sioux City-Iowa Falls NK0673 HILL ET 42°52'37.33196''N 93°07'26.08330''W 1013.814 8,729,892.8401 14,958,217.0016

Iowa Regional Coordinate System Handbook and User Guide
B-6
Zone number and name NGS PID Station designation Latitude Longitude Ellipsoid
ht (sft) Northing
(sft) Easting
(sft)
4. Sioux City-Iowa Falls NM1615 HOMAN RESET 42°54'36.71920''N 96°01'27.73466''W 1335.693 8,739,601.7068 14,180,896.5332
4. Sioux City-Iowa Falls DL5969 HPT A 42°43'32.39644''N 93°13'31.02504''W 1068.981 8,674,198.5764 14,932,093.7402
4. Sioux City-Iowa Falls DL5971 HPT B 42°43'49.81302''N 93°13'30.96078''W 1081.422 8,675,961.6717 14,932,065.0822
4. Sioux City-Iowa Falls DL5970 HPT C 42°43'04.53480''N 93°13'31.66944''W 1059.286 8,671,377.3557 14,932,099.1575
4. Sioux City-Iowa Falls NL0235 K 22 RESET 42°51'05.75091''N 94°58'33.15936''W 1288.009 8,716,031.5886 14,461,772.2900
4. Sioux City-Iowa Falls NK0459 L 28 42°43'40.77582''N 93°44'53.60534''W 1069.834 8,672,814.2974 14,791,575.1014
4. Sioux City-Iowa Falls NL0869 POCAHONTAS 3 42°44'07.91862''N 94°37'10.33277''W 1133.115 8,673,768.2567 14,557,442.8940
4. Sioux City-Iowa Falls NK0427 R 31 42°29'00.05609''N 93°37'03.16962''W 1133.538 8,584,134.9226 14,827,965.3715
4. Sioux City-Iowa Falls NM1700 SIOUX CITY ARP 2 42°24'14.60456''N 96°23'00.48191''W 1007.495 8,556,712.7808 14,081,322.8702
4. Sioux City-Iowa Falls AI1965 SLB A 42°36'13.67394''N 95°14'37.61142''W 1383.235 8,625,949.6596 14,389,488.6087
4. Sioux City-Iowa Falls NM0113 SLOAN 42°12'52.42674''N 96°12'54.40838''W 981.602 8,486,874.0636 14,125,663.5446
4. Sioux City-Iowa Falls NL0936 STORMPORT 42°36'06.09868''N 95°14'27.24833''W 1379.646 8,625,179.0003 14,390,259.9760
4. Sioux City-Iowa Falls NL0937 STORMPORT AZ MK 42°35'52.81878''N 95°14'08.62031''W 1373.137 8,623,827.8869 14,391,646.8293
4. Sioux City-Iowa Falls DG6506 SUX A 42°24'27.46769''N 96°23'37.52724''W 1001.136 8,558,065.7970 14,078,567.8217
4. Sioux City-Iowa Falls DG6507 SUX B 42°23'42.11408''N 96°22'37.78217''W 1005.733 8,553,392.9794 14,082,965.8240
4. Sioux City-Iowa Falls NL0870 TJEBBEN 42°30'09.71242''N 94°36'27.65867''W 1145.736 8,588,915.5433 14,560,853.7344
4. Sioux City-Iowa Falls NM1911 U 181 42°19'43.85536''N 96°18'02.44361''W 995.195 8,528,908.9279 14,103,206.4551
4. Sioux City-Iowa Falls NM1912 Y 181 42°22'39.85332''N 96°20'17.14902''W 1004.837 8,546,901.0604 14,093,405.3588
5. Waterloo NK0164 B 30 42°43'47.79285''N 92°32'07.17554''W 833.000 8,929,265.8618 15,423,332.9584
5. Waterloo NK0663 BEST 42°48'54.93534''N 92°46'17.56108''W 950.303 8,960,664.0902 15,360,053.6890
5. Waterloo NJ0599 C 12 42°56'07.47970''N 91°50'59.32202''W 1079.493 9,004,279.2504 15,607,175.7380
5. Waterloo NK0514 DETTMER 42°48'56.09825''N 92°22'36.70359''W 957.925 8,960,375.8192 15,465,959.0131
5. Waterloo NJ1003 G 75 RESET 42°20'33.18488''N 91°49'15.46542''W 839.647 8,788,242.1369 15,615,998.0633
5. Waterloo NK0584 HUDSON 42°25'46.22191''N 92°27'56.61686''W 853.309 8,819,713.0981 15,441,754.9608

Iowa Regional Coordinate System Handbook and User Guide
B-7
Zone number and name NGS PID Station designation Latitude Longitude Ellipsoid
ht (sft) Northing
(sft) Easting
(sft)
5. Waterloo AE2138 IIB A 42°27'11.28040''N 91°57'11.41553''W 863.647 8,828,390.5157 15,580,111.8469
5. Waterloo NK0036 L 11 42°26'34.99137''N 92°25'14.38582''W 768.479 8,824,622.5895 15,453,931.9780
5. Waterloo DL3989 OLZ A 42°40'31.58163''N 91°58'09.79770''W 955.329 8,909,397.0038 15,575,466.1011
5. Waterloo DL3988 OLZ B 42°40'40.71952''N 91°58'25.65739''W 959.627 8,910,318.2280 15,574,278.3023
5. Waterloo DL3990 OLZ C 42°40'56.01316''N 91°58'46.88238''W 971.852 8,911,861.4421 15,572,687.8325
5. Waterloo NK0006 S 11 42°36'31.43522''N 92°05'47.56311''W 898.499 8,884,996.7534 15,541,313.3876
5. Waterloo NK0652 SALEM 42°30'48.92023''N 92°45'47.64122''W 989.250 8,850,703.2736 15,361,616.5029
5. Waterloo NJ1008 T 74 RESET 42°38'29.69121''N 91°54'29.56383''W 903.482 8,897,117.3734 15,591,968.2338
5. Waterloo NJ0626 X 74 42°32'28.14278''N 91°54'34.79039''W 903.669 8,860,513.0772 15,591,724.8862
5. Waterloo NJ0596 Z 11 42°49'04.77081''N 91°53'20.83775''W 964.578 8,961,434.9365 15,596,830.7175
6. Council Bluffs MJ0984 43 58 41°33'03.52653''N 95°59'06.30261''W 910.681 7,074,121.8139 16,431,087.5546
6. Council Bluffs AI8383 743816 3 41°12'11.37191''N 95°13'55.68780''W 1084.017 6,947,677.2591 16,637,927.3455
6. Council Bluffs AI8381 744006 1 41°14'44.53018''N 95°28'49.54774''W 1097.225 6,962,883.1450 16,569,552.6748
6. Council Bluffs AI8382 744224 3 41°11'21.59274''N 95°37'54.96241''W 1107.481 6,942,257.7032 16,527,910.4579
6. Council Bluffs AI8380 753913 3 41°17'20.49358''N 95°17'20.33490''W 1153.620 6,978,880.5450 16,622,123.4442
6. Council Bluffs AI8379 764033 3 41°19'57.03449''N 95°27'38.63256''W 1085.552 6,994,530.3828 16,574,870.8368
6. Council Bluffs AI8375 764204 1 41°25'03.70941''N 95°40'10.64658''W 999.191 7,025,460.4228 16,517,475.0908
6. Council Bluffs AI8378 764235 3 41°19'57.92520''N 95°38'45.29759''W 1181.910 6,994,515.0055 16,524,009.2878
6. Council Bluffs AI8374 764306 1 41°24'47.20054''N 95°49'31.46697''W 916.317 7,023,796.4013 16,474,742.8097
6. Council Bluffs AI8377 773936 3 41°25'07.17812''N 95°17'20.85777''W 1203.420 7,026,117.5596 16,621,841.5552
6. Council Bluffs AI8376 774035 2 41°25'07.65202''N 95°24'11.74775''W 1223.610 7,026,025.5845 16,590,534.8659
6. Council Bluffs MJ0283 83 99 RESET 2 41°44'41.20898''N 95°12'32.67146''W 1319.367 7,145,079.1138 16,643,077.3674
6. Council Bluffs MJ0639 A 140 41°28'25.76047''N 95°52'53.99522''W 912.551 7,045,940.4465 16,459,348.4236
6. Council Bluffs MJ1160 ASPIN 41°56'30.64649''N 95°09'01.76601''W 1408.629 7,216,996.6060 16,658,578.7029

Iowa Regional Coordinate System Handbook and User Guide
B-8
Zone number and name NGS PID Station designation Latitude Longitude Ellipsoid
ht (sft) Northing
(sft) Easting
(sft)
6. Council Bluffs AH9100 BLENCOE RESET 41°55'24.17156''N 96°05'21.89848''W 945.015 7,209,929.5437 16,403,089.8363
6. Council Bluffs LF1169 C 133 40°44'37.45693''N 95°48'35.31707''W 832.580 6,779,893.6549 16,478,807.4172
6. Council Bluffs MJ0513 C 147 41°27'36.70391''N 95°20'13.58682''W 1037.193 7,041,188.7281 16,608,611.7148
6. Council Bluffs MJ1403 COUNPORT 41°15'30.43575''N 95°45'38.48670''W 1156.448 6,967,429.5296 16,492,477.7180
6. Council Bluffs MJ1411 COUNPORT AZ MK 41°15'47.38390''N 95°45'56.27288''W 1139.689 6,969,145.4318 16,491,119.8712
6. Council Bluffs MJ1382 E 180 41°24'05.44242''N 95°53'38.81346''W 893.748 7,019,597.1821 16,455,887.5997
6. Council Bluffs LF1531 EE 158 RESET 40°55'36.18607''N 95°33'23.75361''W 891.179 6,846,603.2208 16,548,840.7224
6. Council Bluffs LF1445 G 182 40°35'33.98821''N 95°39'40.95293''W 811.645 6,724,890.1504 16,519,985.2126
6. Council Bluffs MJ1199 HANCOCK 41°23'07.71512''N 95°20'49.27959''W 1159.971 7,013,949.4343 16,606,015.4039
6. Council Bluffs AE2137 HNR A 41°35'04.93879''N 95°20'30.15668''W 1113.748 7,086,554.0411 16,607,144.4462
6. Council Bluffs NL0444 J 159 42°00'24.60964''N 95°50'57.75893''W 1264.860 7,240,162.8053 16,468,459.0772
6. Council Bluffs MJ1402 J 180 41°08'56.89992''N 95°48'44.50262''W 887.324 6,927,606.2202 16,478,233.8793
6. Council Bluffs NL0901 MAPPORT 42°10'46.99521''N 95°47'34.94325''W 1023.269 7,303,152.0629 16,483,815.7336
6. Council Bluffs AE9294 OMA 1 41°46'40.93335''N 95°54'41.72468''W 1285.522 7,156,812.8363 16,451,376.3771
6. Council Bluffs AE9293 OMA 2 41°46'43.56508''N 95°54'38.52216''W 1283.275 7,157,078.7338 16,451,619.5823
6. Council Bluffs AE2142 SDA A 40°45'16.47341''N 95°24'17.56996''W 872.154 6,784,003.4749 16,591,003.0675
6. Council Bluffs LF1495 SHENPORT 40°45'14.13759''N 95°24'59.52460''W 851.393 6,783,755.2016 16,587,774.9713
6. Council Bluffs LF1496 SHENPORT AZ MK 40°45'04.69655''N 95°24'41.72124''W 864.562 6,782,804.6774 16,589,148.6850
6. Council Bluffs MJ0955 T 150 41°37'51.51632''N 95°31'34.52126''W 1089.798 7,103,240.4150 16,556,613.9515
6. Council Bluffs LF0985 V 134 40°36'03.78407''N 95°44'06.84728''W 812.620 6,727,897.4806 16,499,471.8046
7. Carroll-Atlantic DL6007 CIN A 42°02'49.84834''N 94°47'14.96223''W 1104.069 7,454,885.6347 17,458,126.4171
7. Carroll-Atlantic DL6008 CIN B 42°03'10.25797''N 94°47'43.18829''W 1110.054 7,456,955.6633 17,456,000.5873
7. Carroll-Atlantic DL6009 CIN C 42°02'24.96416''N 94°46'58.41910''W 1099.742 7,452,364.3641 17,459,370.2430
7. Carroll-Atlantic MJ0181 P 163 41°29'47.96394''N 94°39'36.29416''W 1339.144 7,254,230.1450 17,492,671.9227

Iowa Regional Coordinate System Handbook and User Guide
B-9
Zone number and name NGS PID Station designation Latitude Longitude Ellipsoid
ht (sft) Northing
(sft) Easting
(sft)
7. Carroll-Atlantic MJ1121 TURK 41°19'53.01921''N 94°59'13.29124''W 1216.438 7,194,206.7194 17,402,855.3356
7. Carroll-Atlantic MJ1465 W 100 RESET 41°40'27.79661''N 94°50'42.42306''W 1303.820 7,319,065.9235 17,442,137.7591
7. Carroll-Atlantic NL0186 W 89 42°03'19.86471''N 94°47'01.27346''W 1107.383 7,457,922.3931 17,459,164.6173
7. Carroll-Atlantic MJ0136 X 103 41°16'56.95998''N 94°27'46.16706''W 1267.819 7,176,234.3245 17,546,866.8351
7. Carroll-Atlantic NL0140 X 93 42°04'46.95111''N 94°53'56.08372''W 1154.676 7,466,814.3842 17,427,897.3795
7. Carroll-Atlantic NL0192 Y 89 42°03'55.25628''N 94°52'19.40928''W 1163.738 7,461,559.7239 17,435,173.4328
8. Ames-Des Moines AE2154 20 ADP 41°23'18.58562''N 93°47'10.01418''W 911.245 7,414,818.5959 18,480,942.2915
8. Ames-Des Moines MJ0089 A 162 41°29'22.49250''N 94°06'39.76435''W 996.314 7,451,891.7076 18,391,944.0132
8. Ames-Des Moines AJ8301 AMW D 41°59'37.60879''N 93°37'05.65419''W 824.073 7,635,395.1104 18,526,758.5217
8. Ames-Des Moines AJ8302 AMW E 41°59'13.14215''N 93°37'26.76799''W 843.798 7,632,916.5990 18,525,166.7840
8. Ames-Des Moines AJ8303 AMW F 41°59'55.26242''N 93°37'31.13374''W 824.864 7,637,180.0395 18,524,832.5199
8. Ames-Des Moines DI3066 BNW A 42°03'10.32014''N 93°51'04.39467''W 1045.490 7,656,941.1536 18,463,454.6528
8. Ames-Des Moines DI3067 BNW B 42°02'32.33000''N 93°50'32.17803''W 1041.802 7,653,091.7147 18,465,879.6038
8. Ames-Des Moines NK0751 BOONEPORT AZ MK 42°02'49.32724''N 93°50'43.56839''W 1044.329 7,654,813.6225 18,465,022.7010
8. Ames-Des Moines AB5750 DSM ARP 41°32'09.04470''N 93°39'32.25129''W 828.191 7,468,509.1167 18,515,800.1518
8. Ames-Des Moines AJ6051 DSM C 41°32'31.03055''N 93°40'13.73564''W 809.847 7,470,732.6498 18,512,643.9052
8. Ames-Des Moines AJ6052 DSM D 41°31'56.74683''N 93°39'51.49852''W 817.213 7,467,263.3826 18,514,337.0743
8. Ames-Des Moines MH0688 ET 9 JA 41°59'39.87934''N 93°45'25.34031''W 965.221 7,635,612.1654 18,489,024.6952
8. Ames-Des Moines AE2151 GPS 15 41°34'06.49552''N 93°30'12.40316''W 788.401 7,480,464.3968 18,558,349.5956
8. Ames-Des Moines AE2150 GPS 9 41°31'09.30621''N 93°46'41.06873''W 836.829 7,462,463.0367 18,483,182.5087
8. Ames-Des Moines NK0704 HUBBARD WEST BASE 42°11'17.95886''N 93°21'58.33308''W 1051.130 7,706,471.7976 18,594,984.4947
8. Ames-Des Moines AE1868 IADOT BASE STATION 42°01'20.05440''N 93°37'20.02686''W 863.922 7,645,764.3868 18,525,661.7262
8. Ames-Des Moines AE2139 IKV A 41°41'29.93728''N 93°34'00.67413''W 785.356 7,525,314.2731 18,540,919.3891
8. Ames-Des Moines DG6295 IKV B 41°40'57.97043''N 93°34'00.26039''W 781.508 7,522,078.5261 18,540,956.4114

Iowa Regional Coordinate System Handbook and User Guide
B-10
Zone number and name NGS PID Station designation Latitude Longitude Ellipsoid
ht (sft) Northing
(sft) Easting
(sft)
8. Ames-Des Moines DG6296 IKV C 41°41'51.69365''N 93°34'00.24960''W 798.565 7,527,516.5915 18,540,947.7655
8. Ames-Des Moines DF6532 IOWA DOT RCE OFFICE 41°39'26.19307''N 93°35'52.25757''W 839.050 7,512,775.2604 18,532,470.6708
8. Ames-Des Moines MJ1441 PERRYPORT 41°49'40.57682''N 94°09'33.55209''W 913.131 7,575,254.4458 18,379,350.4585
8. Ames-Des Moines AE2153 STORY 11 41°51'47.92524''N 93°37'11.80899''W 917.980 7,587,849.4986 18,526,347.3701
8. Ames-Des Moines AE2152 STORY 5 41°58'31.84243''N 93°20'51.89025''W 912.423 7,628,938.2905 18,600,321.3184
8. Ames-Des Moines MH0406 U 33 41°58'39.48642''N 93°30'42.62559''W 856.343 7,629,562.6559 18,555,697.1122
8. Ames-Des Moines NL0104 U 88 42°02'15.50886''N 94°05'12.13108''W 954.358 7,651,581.2405 18,399,472.7815
8. Ames-Des Moines MJ0074 X 3 41°46'37.16494''N 94°02'54.25403''W 930.041 7,556,552.1741 18,409,510.1347
9. Newton MH0207 A 5 41°34'01.05315''N 93°09'34.68517''W 818.030 7,680,024.9786 19,406,142.5791
9. Newton NK0611 BROOK 42°10'00.41828''N 92°41'20.72751''W 936.550 7,898,448.7548 19,534,587.8023
9. Newton MH0163 D 88 41°50'54.83231''N 92°46'58.85515''W 925.838 7,782,458.5424 19,509,168.9968
9. Newton MH0650 DYER 41°24'39.03504''N 93°16'17.27450''W 826.294 7,623,278.9223 19,375,239.6092
9. Newton AE2136 GGI A 41°42'35.52408''N 92°44'03.24680''W 896.740 7,731,925.2224 19,522,508.5787
9. Newton MH0783 KNOXPORT 41°17'52.99963''N 93°06'45.97485''W 821.153 7,581,992.4157 19,418,632.3981
9. Newton MH0784 KNOXPORT AZ MK 41°18'14.34440''N 93°06'58.77991''W 818.335 7,584,156.2098 19,417,662.4235
9. Newton MH0109 L 87 41°27'46.90688''N 92°38'49.22097''W 758.568 7,642,013.1085 19,546,504.0708
9. Newton MH0578 LARSON 41°42'09.62127''N 92°37'11.72868''W 882.485 7,729,353.8478 19,553,728.0182
9. Newton DK3690 OOA A 2007 41°13'18.84814''N 92°29'16.53151''W 727.751 7,554,276.2582 19,590,441.0920
9. Newton MH0795 OSKAPORT 41°13'26.25901''N 92°29'30.06489''W 728.306 7,555,022.4617 19,589,404.0610
9. Newton MH0796 OSKAPORT AZ MK 41°13'36.86442''N 92°29'44.30735''W 729.641 7,556,091.8455 19,588,311.7160
9. Newton AJ8304 OXV A 41°17'42.23322''N 93°06'36.28153''W 822.636 7,580,900.1674 19,419,368.6230
9. Newton MH0124 T 5 41°12'55.84164''N 92°39'16.68709''W 582.440 7,551,818.2183 19,544,581.2990
9. Newton AE2147 TT 10 FHJ 42°00'27.85152''N 92°57'34.95203''W 858.433 7,840,494.3980 19,461,121.9827
9. Newton NK0107 Y 10 42°11'29.24695''N 92°43'41.28660''W 852.649 7,907,427.6338 19,523,992.9694

Iowa Regional Coordinate System Handbook and User Guide
B-11
Zone number and name NGS PID Station designation Latitude Longitude Ellipsoid
ht (sft) Northing
(sft) Easting
(sft)
10. Cedar Rapids MG0566 57 27 41°52'59.87116''N 91°38'48.29225''W 704.418 8,018,208.1491 20,505,424.3165
10. Cedar Rapids AE2145 95 03 41°51'07.34269''N 90°59'54.93790''W 721.373 8,007,524.5331 20,682,017.1284
10. Cedar Rapids AB5732 CID ARP 2 41°53'05.60187''N 91°42'32.27653''W 750.635 8,018,790.4519 20,488,481.3624
10. Cedar Rapids DM6119 CID C 41°53'11.82688''N 91°42'49.82823''W 755.914 8,019,421.2752 20,487,154.0472
10. Cedar Rapids AJ8568 CID GP 1 41°53'00.03262''N 91°44'00.13338''W 760.799 8,018,230.9164 20,481,835.1793
10. Cedar Rapids AJ8598 CID GP 2 41°52'58.76392''N 91°41'53.98694''W 745.412 8,018,097.0280 20,491,377.4426
10. Cedar Rapids NJ0755 ET 4 JS 42°15'14.48012''N 91°13'35.21997''W 836.767 8,153,615.4816 20,619,187.4784
10. Cedar Rapids AE2155 GPS CONTROL POINT 96 102 41°30'40.23844''N 91°53'12.95977''W 641.741 7,882,683.2965 20,439,669.1118
10. Cedar Rapids MH0487 HARTWICK 41°49'50.45505''N 92°17'18.64311''W 831.002 7,999,647.2242 20,330,521.0347
10. Cedar Rapids AE9184 NLIB A 41°45'49.79225''N 91°34'43.23410''W 713.457 7,974,685.1901 20,524,006.2721
10. Cedar Rapids MG0916 NORTH LIBERTY 41°46'19.24958''N 91°34'28.67582''W 674.812 7,977,668.1273 20,525,106.3842
10. Cedar Rapids NK0557 PRATT 42°12'38.34995''N 92°12'42.60032''W 876.055 8,137,973.0231 20,352,297.6098
10. Cedar Rapids AE9186 X 183 41°45'25.31506''N 91°36'25.00767''W 676.790 7,972,200.8883 20,516,295.0320
11. Dubuque-Davenport NJ0271 52 JDF 42°24'20.03547''N 90°35'41.00665''W 981.143 8,385,451.0515 21,483,418.7307
11. Dubuque-Davenport NJ0367 A 178 42°35'09.83207''N 90°54'18.60395''W 1016.448 8,451,448.6262 21,399,858.0925
11. Dubuque-Davenport AE9312 A 185 42°01'22.32407''N 90°13'40.79841''W 694.050 8,246,124.1041 21,582,968.2460
11. Dubuque-Davenport NJ0104 C 175 42°07'00.05692''N 90°13'12.13315''W 518.775 8,280,320.5997 21,585,006.6541
11. Dubuque-Davenport AJ8298 CWI A 41°49'38.72354''N 90°19'52.01407''W 581.380 8,174,817.4482 21,555,116.6592
11. Dubuque-Davenport AJ8299 CWI B 41°50'01.57667''N 90°20'02.74576''W 592.794 8,177,128.8721 21,554,298.7852
11. Dubuque-Davenport AJ8300 CWI C 41°50'21.47832''N 90°19'26.16935''W 596.498 8,179,150.0170 21,557,062.8445
11. Dubuque-Davenport DF9357 DBQ A 42°23'49.43922''N 90°42'40.06578''W 924.076 8,382,397.8749 21,451,971.8665
11. Dubuque-Davenport DF9358 DBQ B 42°24'00.43415''N 90°41'57.41636''W 962.485 8,383,504.4808 21,455,174.2935
11. Dubuque-Davenport NJ0939 DUBUQUE 42°31'38.67891''N 90°43'47.61186''W 878.663 8,429,913.3586 21,447,013.4814
11. Dubuque-Davenport NJ0258 DUBUQUE APT ARP 42°24'10.24788''N 90°42'32.32734''W 950.336 8,384,503.2460 21,452,556.8848

Iowa Regional Coordinate System Handbook and User Guide
B-12
Zone number and name NGS PID Station designation Latitude Longitude Ellipsoid
ht (sft) Northing
(sft) Easting
(sft)
11. Dubuque-Davenport AB5747 DVN A 1975 41°37'01.21365''N 90°35'38.92464''W 644.146 8,098,080.5409 21,483,370.8023
11. Dubuque-Davenport NJ0232 E 79 42°03'03.88819''N 90°32'03.50578''W 777.580 8,256,257.3679 21,499,735.4992
11. Dubuque-Davenport MG0328 G 70 41°38'44.62278''N 90°34'51.08682''W 672.377 8,108,545.5417 21,487,010.2616
11. Dubuque-Davenport NJ0893 HANTEN 42°23'46.08165''N 90°39'56.54371''W 1070.024 8,382,035.5756 21,464,241.4217
11. Dubuque-Davenport NJ0119 Q 175 42°11'48.34150''N 90°22'40.68449''W 493.815 8,309,386.5050 21,542,102.1489
11. Dubuque-Davenport AE9310 RISL A 42°00'42.87571''N 90°13'28.52294''W 688.962 8,242,134.1096 21,583,909.2087
11. Dubuque-Davenport AE9311 RISL B 42°00'41.99975''N 90°13'49.96187''W 683.798 8,242,039.6562 21,582,291.0225
11. Dubuque-Davenport NJ0153 X 175 42°18'18.24428''N 90°27'23.09433''W 628.955 8,348,828.5889 21,520,808.2823
12. Red Oak-Ottumwa AB5782 AP 1963 STA B 41°06'32.03477''N 92°27'14.39383''W 735.254 6,272,688.0767 22,857,152.6224
12. Red Oak-Ottumwa MH0780 CHARIPORT AZ MK 41°01'12.50909''N 93°21'50.60071''W 940.854 6,237,937.1065 22,606,504.8801
12. Red Oak-Ottumwa MJ1425 CRESTPORT 41°01'09.89436''N 94°21'46.58932''W 1193.046 6,238,030.1071 22,330,852.1183
12. Red Oak-Ottumwa MJ1426 CRESTPORT AZ MK 41°00'52.65093''N 94°21'40.39883''W 1191.691 6,236,281.5813 22,331,314.4536
12. Red Oak-Ottumwa AE2133 CSQ A 41°01'43.91084''N 94°22'03.36175''W 1196.579 6,241,481.9572 22,329,590.7418
12. Red Oak-Ottumwa MH0054 D 6 41°05'23.11039''N 92°21'45.31057''W 694.923 6,266,099.1983 22,882,452.5720
12. Red Oak-Ottumwa MH0055 E 6 41°06'12.14688''N 92°18'54.14191''W 643.949 6,271,273.1464 22,895,476.7064
12. Red Oak-Ottumwa LE0588 ET 2 MES 40°37'19.56759''N 93°44'51.66327''W 983.331 6,092,675.4631 22,500,642.8961
12. Red Oak-Ottumwa LE0532 FAIRALL 40°46'05.13317''N 93°29'13.95798''W 1006.153 6,145,975.8740 22,572,795.1766
12. Red Oak-Ottumwa MH0272 H 110 41°02'14.04864''N 93°45'55.72237''W 1036.737 6,243,931.1219 22,495,729.6708
12. Red Oak-Ottumwa DL2463 I75 A 41°03'19.57015''N 93°41'17.11149''W 1005.733 6,250,568.4141 22,517,076.5476
12. Red Oak-Ottumwa DL2464 I75 B 41°03'01.87774''N 93°41'25.54283''W 1007.170 6,248,777.2619 22,516,431.8021
12. Red Oak-Ottumwa DL2465 I75 C 41°02'44.64091''N 93°41'19.01388''W 1009.030 6,247,033.0167 22,516,933.2772
12. Red Oak-Ottumwa LF0049 K 105 40°39'12.97540''N 94°20'41.97741''W 1042.085 6,104,714.5589 22,334,898.3911
12. Red Oak-Ottumwa MH0561 LOVILIA 41°08'14.50196''N 92°54'24.87029''W 832.006 6,281,532.7744 22,732,244.4360
12. Red Oak-Ottumwa LE0593 OSCEOLA 40°59'58.50662''N 93°46'10.73190''W 1047.242 6,230,212.8219 22,494,576.3221

Iowa Regional Coordinate System Handbook and User Guide
B-13
Zone number and name NGS PID Station designation Latitude Longitude Ellipsoid
ht (sft) Northing
(sft) Easting
(sft)
12. Red Oak-Ottumwa LE0502 PARKER 40°58'18.35168''N 92°30'49.36503''W 744.392 6,222,487.8050 22,841,403.8024
12. Red Oak-Ottumwa LF1299 PRESCOTT 2 40°58'44.57939''N 94°37'20.98510''W 1198.065 6,223,931.3432 22,259,080.5921
12. Red Oak-Ottumwa LF0026 R 104 RESET 40°54'50.46776''N 94°20'14.54737''W 1139.525 6,199,580.2829 22,337,649.7132
12. Red Oak-Ottumwa MH0280 R 110 41°00'23.27409''N 93°34'42.95187''W 844.460 6,232,765.3278 22,547,309.9234
12. Red Oak-Ottumwa MJ1447 REDPORT 41°00'37.94930''N 95°15'35.49482''W 941.937 6,237,800.4102 22,083,299.2423
12. Red Oak-Ottumwa LF1488 S 106 RESET 40°44'42.42070''N 94°47'23.77564''W 1133.771 6,139,208.2135 22,211,834.2140
12. Red Oak-Ottumwa LF0231 S 8 40°36'37.37483''N 95°13'13.46415''W 872.426 6,091,836.5127 22,091,736.1316
12. Red Oak-Ottumwa LF1489 SCHEPORT 40°43'21.96242''N 95°01'34.79898''W 883.669 6,131,933.2885 22,146,214.6861
12. Red Oak-Ottumwa MJ0521 U 148 41°08'46.35705''N 95°17'20.47409''W 1181.628 6,287,366.5658 22,076,121.6842
12. Red Oak-Ottumwa MH0053 WAPELLO 41°06'23.14446''N 92°26'41.86367''W 734.726 6,271,825.3702 22,859,656.0486
12. Red Oak-Ottumwa LE0188 X 7 40°37'46.22566''N 92°55'06.25734''W 926.596 6,096,470.6194 22,730,836.6383
13. Fairfield DK3513 AWG A 2007 41°16'43.43812''N 91°40'26.17734''W 642.689 6,774,903.5292 23,566,719.5133
13. Fairfield DK3514 AWG B 2007 41°16'13.03085''N 91°40'33.63242''W 639.867 6,771,824.2691 23,566,158.8182
13. Fairfield MG0476 B 8 41°19'34.28699''N 91°33'39.59402''W 645.422 6,792,303.0791 23,597,692.8087
13. Fairfield LE0437 COPELAND 40°55'18.05727''N 92°07'51.64979''W 671.291 6,644,786.9768 23,440,761.8139
13. Fairfield MG0416 D 8 41°21'14.80923''N 91°29'04.50801''W 575.704 6,802,572.8726 23,618,630.7705
13. Fairfield AE2156 GPS CONTROL PT 96 150 41°13'19.01730''N 91°56'39.19923''W 532.348 6,754,121.1242 23,492,419.2228
13. Fairfield LD0592 T 124 40°59'49.50548''N 91°48'40.46871''W 649.530 6,672,205.0881 23,529,102.7992
13. Fairfield MG0914 WASHPORT AZ MK 41°16'26.59887''N 91°40'12.51668''W 644.195 6,773,202.0795 23,567,767.3926
13. Fairfield MG0472 X 6 41°17'35.48418''N 91°43'30.61684''W 597.601 6,780,136.1812 23,552,625.2671
14. Burlington AE2146 39 RWM 40°54'21.33634''N 91°04'34.60297''W 599.185 6,439,020.9396 24,548,021.9189
14. Burlington AE2148 ARDON AZ MK RESET 41°26'37.28228''N 91°10'26.06727''W 633.962 6,634,925.4496 24,520,862.9541
14. Burlington AJ8295 EOK A 2000 40°27'47.51270''N 91°26'04.65947''W 557.673 6,277,724.9777 24,448,624.4248
14. Burlington AJ8296 EOK B 2000 40°27'29.34040''N 91°25'54.28927''W 559.103 6,275,884.2674 24,449,422.2155

Iowa Regional Coordinate System Handbook and User Guide
B-14
Zone number and name NGS PID Station designation Latitude Longitude Ellipsoid
ht (sft) Northing
(sft) Easting
(sft)
14. Burlington AJ8297 EOK C 40°27'41.64464''N 91°25'24.00163''W 557.479 6,277,124.7556 24,451,765.9524
14. Burlington MG0794 HASCHAR 41°16'19.80877''N 91°09'01.12346''W 589.533 6,572,433.6286 24,527,404.2001
14. Burlington LD0867 JACKSON 40°52'20.17802''N 91°35'51.85822''W 608.188 6,426,902.0538 24,403,825.6685
14. Burlington LD0882 KEOPORT AZ MK 40°27'22.38075''N 91°25'40.72022''W 552.893 6,275,177.8107 24,450,469.7093
14. Burlington DF6531 LEE CO GPS CONTROL PT 2001 013 40°43'34.22349''N 91°36'11.31037''W 605.448 6,373,677.8979 24,402,116.8736
14. Burlington LD0800 MADISON 40°38'53.65283''N 91°17'12.95765''W 600.639 6,345,088.2323 24,489,751.1510
14. Burlington AE2140 MPZ A 40°56'41.10628''N 91°30'39.12964''W 617.820 6,453,226.7161 24,427,929.8889
14. Burlington MG0791 MUSCATINE 41°25'25.60277''N 91°04'18.06294''W 616.616 6,627,711.4010 24,548,905.4332
14. Burlington AJ8263 MUT A 2001 41°21'39.34386''N 91°09'10.27275''W 436.515 6,604,774.7657 24,526,669.3462
14. Burlington AJ8264 MUT B 2001 41°22'10.60326''N 91°08'07.43353''W 433.595 6,607,944.5824 24,531,457.1302
14. Burlington AJ8265 MUT C 41°22'06.88342''N 91°09'05.29859''W 428.775 6,607,562.6497 24,527,045.4958
14. Burlington LD0612 R 122=56 34 40°43'17.43849''N 91°33'49.84701''W 591.314 6,371,937.8029 24,413,002.6342
14. Burlington LD0616 T 122 RESET 40°45'18.51968''N 91°33'49.44352''W 601.649 6,384,191.7863 24,413,077.4927
14. Burlington LD0531 ZZ 125 40°46'49.39212''N 91°07'02.40624''W 580.655 6,393,261.0347 24,536,741.9136

Iowa Regional Coordinate System Handbook and User Guide
C-i
Appendix C. IaRCS distortion values on NAD 83(2011) epoch 2010.00 NGS control

Iowa Regional Coordinate System Handbook and User Guide
C-1
IaRCS distortion values for NAD 83(2011) epoch 2010.00 NGS control Tables C-1 and C-2 give IaRCS distortion values for 312 NGS-published NAD 83(2011) epoch 2010.00 control stations in Iowa, sorted by designation (or CORS ID) within each zone. Table C-1 lists 35 NGS Continually Operating Reference Station (CORS) Antenna Reference Points (ARPs), and Table C-2 lists 277 NGS passive control stations (i.e., monuments that can be occupied with survey equipment, such as brass disks). The values given are linear distortion, grid point scale factor, height scale factor, combined scale factor, and convergence angle. Linear distortion is given in parts per million (ppm), feet per mile, and as a dimensionless ra-tio. These values can be used as checks for distortion computations. The stations given here were obtained from the NGS Integrated Data Base (NGSIDB) on August 11, 2014 and represent the status of NGS published NAD 83(2011) epoch 2010.00 control in Iowa on that date. IaRCS distortion values were computed directly from the NGS published latitude, longitude, and the ellipsoid heights (as given in tables B-1 and B-2). The stations were not occupied or recovered to create these tables, and so some stations may presently be obstructed, removed, damaged, destroyed, or otherwise unavailable or unsuitable for use. Table C-1. IaRCS distortion values for NGS NAD 83(2011) epoch 2010.00 CORS in Iowa.
Zone number and name NGS PID CORS ID (and station designation)
Linear distortion at ground surface Grid point scale factor
Height scale factor
Combined scale factor
Convergence angle (ppm) (ft/mile) (ratio)
1. Spencer DP1310 IAAS (IOWA DOT ASHTON CORS ARP) -13.829 -0.07302 1 : 72,313 1.000053694 0.999932481 0.999986171 –0°21'43.77''
1. Spencer DP2488 IASW (IADT SWEA CITY CORS ARP) 4.116 0.02173 1 : 242,932 1.000057108 0.999947011 1.000004116 +0°39'09.87''
2. Mason City DO2871 IADE (IOWA DOT DECORAH CORS ARP) -5.140 -0.02714 1 : 194,564 1.000044655 0.999950208 0.999994860 +0°37'42.06''
2. Mason City DP1957 IAHT (IADT HANLONTOWN CORS ARP) -9.086 -0.04797 1 : 110,065 1.000045090 0.999945827 0.999990914 –0°25'23.30''
3. Elkader DP1235 IAEL (IOWA DOT ELKADER CORS ARP) -9.908 -0.05231 1 : 100,932 1.000037142 0.999952952 0.999990092 –0°06'35.67''
3. Elkader DL3589 IANA (NEW ALBIN CORS ARP) 8.491 0.04483 1 : 117,779 1.000035662 0.999972830 1.000008491 –0°03'44.73''
4. Sioux City-Iowa Falls DP1229 IACL (IOWA DOT CLARION CORS ARP) -1.455 -0.00768 1 : 687,363 1.000050936 0.999947612 0.999998545 +0°43'53.19''
4. Sioux City-Iowa Falls DP1245 IAPS (IADT POCHAHONTAS CORS ARP) -4.059 -0.02143 1 : 246,357 1.000051366 0.999944578 0.999995941 +0°06'15.00''
4. Sioux City-Iowa Falls DP1247 IASX (IADT SIOUX CITY CORS ARP) -6.572 -0.03470 1 : 152,165 1.000045042 0.999948388 0.999993428 –1°01'27.33''
5. Waterloo DP1223 IAAL (IOWA DOT ALLISON CORS ARP) -12.380 -0.06537 1 : 80,777 1.000033430 0.999954192 0.999987620 –0°21'50.46''
6. Council Bluffs DP1227 IACB (COUNCIL BLUFFS CORS ARP) -3.348 -0.01768 1 : 298,717 1.000040243 0.999956411 0.999996652 –0°04'44.42''
6. Council Bluffs DP1233 IADN (IOWA DOT DENISON CORS ARP) -5.279 -0.02787 1 : 189,444 1.000049800 0.999944925 0.999994721 +0°14'21.45''
6. Council Bluffs AH5054 OMH1 (OMAHA 1 CORS ARP) -20.850 -0.11009 1 : 47,962 1.000041693 0.999937460 0.999979150 –0°07'06.85''
6. Council Bluffs AH5056 OMH2 (OMAHA 2 CORS ARP) -20.746 -0.10954 1 : 48,202 1.000041698 0.999937558 0.999979254 –0°07'07.30''

Iowa Regional Coordinate System Handbook and User Guide
C-2
Zone number and name NGS PID CORS ID (and station designation)
Linear distortion at ground surface Grid point scale factor
Height scale factor
Combined scale factor
Convergence angle (ppm) (ft/mile) (ratio)
6. Council Bluffs DI8412 OMH5 (OMAHA 5 CORS ARP) -20.874 -0.11021 1 : 47,907 1.000041693 0.999937436 0.999979126 –0°07'06.85''
6. Council Bluffs DI8414 OMH6 (OMAHA 6 CORS ARP) -20.780 -0.10972 1 : 48,124 1.000041698 0.999937525 0.999979220 –0°07'07.30''
7. Carroll-Atlantic DP1225 IAAT (IOWA DOT ATLANTIC CORS ARP) 1.907 0.01007 1 : 524,249 1.000055820 0.999946091 1.000001907 –0°14'04.46''
8. Ames-Des Moines DM2686 IAAM (IADT AMES CORS ARP) -6.726 -0.03552 1 : 148,669 1.000035079 0.999958196 0.999993274 +0°06'18.11''
8. Ames-Des Moines DP1239 IAMD (IADT MARTENSDALE CORS ARP) -3.476 -0.01835 1 : 287,721 1.000033065 0.999963461 0.999996524 –0°01'05.33''
8. Ames-Des Moines AI2153 SLAI (SLATER CORS ARP) -12.536 -0.06619 1 : 79,769 1.000033027 0.999954438 0.999987464 +0°00'42.81''
9. Newton DP1243 IAOK (IADT OSKALOOSA CORS ARP) -4.231 -0.02234 1 : 236,369 1.000028504 0.999967266 0.999995769 +0°05'13.60''
9. Newton DP1249 IATA (IOWA DOT TAMA CORS ARP) -6.009 -0.03173 1 : 166,428 1.000032947 0.999961045 0.999993991 +0°10'38.59''
10. Cedar Rapids DP1318 IAMN (IOWA DOT MARION CORS ARP) -10.173 -0.05371 1 : 98,299 1.000025893 0.999963935 0.999989827 +0°04'43.09''
10. Cedar Rapids AF9523 NLIB (NORTH LIBERTY CORS ARP) -12.065 -0.06370 1 : 82,885 1.000020578 0.999967357 0.999987935 +0°03'40.37''
11. Dubuque-Davenport DP1314 IADA (IADT DAVENPORT CORS ARP) -3.829 -0.02021 1 : 261,192 1.000027806 0.999968367 0.999996171 –0°03'52.12''
11. Dubuque-Davenport DP1241 IAMQ (IADT MAQUOKETA CORS ARP) -1.536 -0.00811 1 : 651,209 1.000028051 0.999970414 0.999998464 –0°04'29.48''
11. Dubuque-Davenport AF9642 RIS1 (ROCK ISLAND 1 CORS ARP) 0.908 0.00479 1 : 1,101,358 1.000034992 0.999965917 1.000000908 +0°12'21.44''
11. Dubuque-Davenport AF9644 RIS2 (ROCK ISLAND 2 CORS ARP) 0.953 0.00503 1 : 1,049,286 1.000035022 0.999965932 1.000000953 +0°12'22.86''
11. Dubuque-Davenport DI8416 RIS5 (ROCK ISLAND 5 CORS ARP) 0.885 0.00467 1 : 1,130,445 1.000034992 0.999965894 1.000000885 +0°12'21.44''
11. Dubuque-Davenport DI8418 RIS6 (ROCK ISLAND 6 CORS ARP) 0.926 0.00489 1 : 1,079,841 1.000035022 0.999965905 1.000000926 +0°12'22.86''
12. Red Oak-Ottumwa DP1312 IACE (IADT CENTERVILLE CORS ARP) -1.003 -0.00530 1 : 996,718 1.000043983 0.999955016 0.999998997 +0°34'34.51''
12. Red Oak-Ottumwa DP1231 IACN (IOWA DOT CLARINDA CORS ARP) -2.704 -0.01428 1 : 369,783 1.000041585 0.999955713 0.999997296 –0°49'59.89''
12. Red Oak-Ottumwa DP1237 IALN (IADT LEON CORS ARP) -7.634 -0.04031 1 : 130,995 1.000042337 0.999950031 0.999992366 –0°00'28.07''
13. Fairfield DP1251 IAWN (IADT WASHINGTON CORS ARP) -7.518 -0.03970 1 : 133,008 1.000024869 0.999967614 0.999992482 +0°09'24.58''
14. Burlington DP1316 IADO (IADT DONNELLSON CORS ARP) -2.809 -0.01483 1 : 355,944 1.000026786 0.999970405 0.999997191 –0°12'20.90''

Iowa Regional Coordinate System Handbook and User Guide
C-3
Table C-2. IaRCS distortion values for NGS NAD 83(2011) epoch 2010.00 passive control in Iowa.
Zone number and name NGS PID Station designation
Linear distortion at ground surface Grid point scale factor
Height scale factor
Combined scale factor
Convergence angle (ppm) (ft/mile) (ratio)
1. Spencer DH3926 15 WL 10.921 0.05766 1 : 91,570 1.000065717 0.999945208 1.000010921 +0°31'07.25''
1. Spencer DH3928 31 DWB 7.609 0.04017 1 : 131,431 1.000065753 0.999941860 1.000007609 +0°21'32.39''
1. Spencer AJ8322 963073 3 7089 -7.079 -0.03738 1 : 141,260 1.000052284 0.999940640 0.999992921 +0°01'56.56''
1. Spencer OP0140 A 19 -0.529 -0.00279 1 : 1,890,661 1.000053438 0.999946036 0.999999471 +0°25'04.31''
1. Spencer OP1149 ALGOPORT 0.882 0.00466 1 : 1,133,700 1.000054227 0.999946658 1.000000882 +0°40'05.62''
1. Spencer OP0566 B 17 -9.017 -0.04761 1 : 110,902 1.000065591 0.999925397 0.999990983 –0°18'16.92''
1. Spencer OP0792 BEACON -7.117 -0.03758 1 : 140,506 1.000052163 0.999940723 0.999992883 +0°02'09.38''
1. Spencer AI5700 BIGELOW -9.828 -0.05189 1 : 101,753 1.000064924 0.999925253 0.999990172 –0°18'26.15''
1. Spencer NM0034 D 154 6.776 0.03578 1 : 147,586 1.000058943 0.999947836 1.000006776 –0°50'44.62''
1. Spencer OP0490 D 18 -7.047 -0.03721 1 : 141,913 1.000052342 0.999940614 0.999992953 +0°00'48.50''
1. Spencer NL0717 DALE 2 10.135 0.05351 1 : 98,668 1.000059203 0.999950935 1.000010135 +0°41'59.87''
1. Spencer OQ0592 GARFIELD -9.021 -0.04763 1 : 110,849 1.000054204 0.999936778 0.999990979 –0°38'03.29''
1. Spencer CO3187 GROTEWOLD AZ MK -4.304 -0.02273 1 : 232,332 1.000063528 0.999932172 0.999995696 –0°47'38.90''
1. Spencer OP0124 K 1 1.541 0.00814 1 : 648,960 1.000052106 0.999949437 1.000001541 +0°42'14.97''
1. Spencer OP0806 LAKE PARK -7.834 -0.04137 1 : 127,642 1.000061006 0.999931164 0.999992166 –0°04'52.03''
1. Spencer OP0152 M 19 -2.474 -0.01306 1 : 404,271 1.000053857 0.999943672 0.999997526 +0°18'47.26''
1. Spencer OP1162 MILPORT -9.428 -0.04978 1 : 106,062 1.000054753 0.999935822 0.999990572 +0°03'59.79''
1. Spencer AE2141 ORC A -4.188 -0.02211 1 : 238,786 1.000058731 0.999937085 0.999995812 –0°33'21.44''
1. Spencer AJ8293 ORC B -3.059 -0.01615 1 : 326,934 1.000059180 0.999937765 0.999996941 –0°33'13.78''
1. Spencer AJ8292 ORC C -4.838 -0.02554 1 : 206,695 1.000058460 0.999936705 0.999995162 –0°33'24.98''
1. Spencer AJ8320 SPW A 2001 -7.304 -0.03856 1 : 136,913 1.000052157 0.999940543 0.999992696 +0°01'41.47''
1. Spencer OQ1239 STALIN 0.353 0.00186 1 : 2,833,595 1.000065686 0.999934671 1.000000353 –0°31'58.44''
1. Spencer OQ1237 STALIN RM 3 1.414 0.00747 1 : 707,279 1.000065686 0.999935732 1.000001414 –0°31'32.44''

Iowa Regional Coordinate System Handbook and User Guide
C-4
Zone number and name NGS PID Station designation
Linear distortion at ground surface Grid point scale factor
Height scale factor
Combined scale factor
Convergence angle (ppm) (ft/mile) (ratio)
1. Spencer OP0559 U 16 -10.893 -0.05751 1 : 91,803 1.000054347 0.999934764 0.999989107 –0°21'53.58''
1. Spencer OP0782 WHYNOT -12.829 -0.06774 1 : 77,950 1.000052654 0.999934521 0.999987171 +0°08'54.64''
1. Spencer OP0485 Y 17 -9.275 -0.04897 1 : 107,822 1.000052168 0.999938560 0.999990725 –0°05'41.16''
2. Mason City OO0687 41 1 -12.734 -0.06724 1 : 78,529 1.000043252 0.999944016 0.999987266 –0°30'51.68''
2. Mason City OO1164 AIR -9.614 -0.05076 1 : 104,010 1.000043040 0.999947347 0.999990386 –0°24'03.74''
2. Mason City OO0967 AIRPORT -4.208 -0.02222 1 : 237,642 1.000044498 0.999951297 0.999995792 +0°05'43.03''
2. Mason City OO1148 BEANS -9.097 -0.04803 1 : 109,928 1.000044513 0.999946393 0.999990903 –0°18'14.71''
2. Mason City AB2419 BRUA RESET -3.174 -0.01676 1 : 315,101 1.000056900 0.999939930 0.999996826 –0°29'29.66''
2. Mason City OO0226 C 37 -5.756 -0.03039 1 : 173,744 1.000044592 0.999949654 0.999994244 +0°21'34.19''
2. Mason City ON0867 CANOE -1.600 -0.00845 1 : 625,105 1.000050216 0.999948187 0.999998400 +0°41'31.58''
2. Mason City DL5322 CCY A -4.210 -0.02223 1 : 237,545 1.000044190 0.999951602 0.999995790 +0°05'26.79''
2. Mason City OO1315 CHARLPORT -4.134 -0.02182 1 : 241,925 1.000044342 0.999951526 0.999995866 +0°05'45.85''
2. Mason City OO1209 CLOVER -14.241 -0.07519 1 : 70,222 1.000043557 0.999942205 0.999985759 –0°45'08.87''
2. Mason City AE2134 DEH A -5.915 -0.03123 1 : 169,064 1.000044738 0.999949349 0.999994085 +0°41'46.49''
2. Mason City ON0899 HESPER -0.487 -0.00257 1 : 2,053,081 1.000058543 0.999940973 0.999999513 +0°40'50.79''
2. Mason City OO1179 JOICE RESET -10.972 -0.05793 1 : 91,144 1.000048651 0.999940381 0.999989028 –0°27'01.87''
2. Mason City OO1635 LOUISE 3.479 0.01837 1 : 287,448 1.000059912 0.999943571 1.000003479 +0°10'17.62''
2. Mason City OO0292 M 36 0.697 0.00368 1 : 1,434,213 1.000044282 0.999956417 1.000000697 +0°02'50.05''
2. Mason City OO0945 MAPLE -13.632 -0.07198 1 : 73,354 1.000046378 0.999939992 0.999986368 +0°12'54.21''
2. Mason City OO0274 N 40 -5.035 -0.02658 1 : 198,629 1.000047288 0.999947680 0.999994965 –0°05'15.54''
2. Mason City NK0179 T 39 6.241 0.03295 1 : 160,230 1.000048271 0.999957972 1.000006241 +0°08'38.60''
2. Mason City DF4650 TT 10 WM 4.053 0.02140 1 : 246,743 1.000059851 0.999944205 1.000004053 –0°37'21.18''
2. Mason City OO0257 V 39 2.643 0.01395 1 : 378,392 1.000046202 0.999956443 1.000002643 +0°06'31.04''
3. Elkader NJ0606 997 2.086 0.01101 1 : 479,372 1.000044976 0.999957112 1.000002086 –0°14'05.04''

Iowa Regional Coordinate System Handbook and User Guide
C-5
Zone number and name NGS PID Station designation
Linear distortion at ground surface Grid point scale factor
Height scale factor
Combined scale factor
Convergence angle (ppm) (ft/mile) (ratio)
3. Elkader ON0828 EGAN -15.122 -0.07984 1 : 66,129 1.000035416 0.999949464 0.999984878 –0°02'56.08''
3. Elkader NJ0754 ET 2 JS -8.942 -0.04721 1 : 111,830 1.000035249 0.999955811 0.999991058 +0°02'12.48''
3. Elkader NJ0700 GUTTEN -5.257 -0.02775 1 : 190,240 1.000035413 0.999959332 0.999994743 +0°02'52.93''
3. Elkader ON0786 MINNOWA -9.565 -0.05050 1 : 104,553 1.000040648 0.999949789 0.999990435 –0°10'56.70''
4. Sioux City-Iowa Falls NK0300 42 105 2.658 0.01403 1 : 376,211 1.000051137 0.999951523 1.000002658 +1°01'47.74''
4. Sioux City-Iowa Falls NK0284 42 140 -3.866 -0.02041 1 : 258,656 1.000045353 0.999950783 0.999996134 +1°03'42.56''
4. Sioux City-Iowa Falls NK0285 42 141 -3.935 -0.02078 1 : 254,133 1.000045595 0.999950472 0.999996065 +1°03'42.81''
4. Sioux City-Iowa Falls NM0820 A 146 4.008 0.02116 1 : 249,496 1.000054426 0.999949585 1.000004008 –1°11'21.80''
4. Sioux City-Iowa Falls NK0186 A 29 -1.927 -0.01018 1 : 518,876 1.000051471 0.999946605 0.999998073 +1°02'09.57''
4. Sioux City-Iowa Falls NM1659 AITKEN -15.960 -0.08427 1 : 62,658 1.000047132 0.999936912 0.999984040 –0°52'25.14''
4. Sioux City-Iowa Falls NL0062 B 28 -1.040 -0.00549 1 : 961,932 1.000048758 0.999950205 0.999998960 +0°32'34.90''
4. Sioux City-Iowa Falls NL0066 D 3 9.418 0.04973 1 : 106,174 1.000059411 0.999950011 1.000009418 +0°31'51.45''
4. Sioux City-Iowa Falls NL0581 DIVIDE -9.773 -0.05160 1 : 102,327 1.000059515 0.999930717 0.999990227 –0°20'06.14''
4. Sioux City-Iowa Falls NL0584 EARLY -16.127 -0.08515 1 : 62,007 1.000046874 0.999937002 0.999983873 –0°11'33.98''
4. Sioux City-Iowa Falls DI3115 EBS A -2.220 -0.01172 1 : 450,355 1.000046276 0.999951506 0.999997780 +0°38'54.96''
4. Sioux City-Iowa Falls DI3116 EBS B -2.365 -0.01249 1 : 422,798 1.000046349 0.999951288 0.999997635 +0°39'05.15''
4. Sioux City-Iowa Falls DI3117 EBS C -2.632 -0.01390 1 : 379,901 1.000046555 0.999950815 0.999997368 +0°39'19.86''
4. Sioux City-Iowa Falls NL0804 ET 1 HK 7.641 0.04035 1 : 130,868 1.000056941 0.999950703 1.000007641 +0°18'25.56''
4. Sioux City-Iowa Falls NK0735 ET 7 JA 6.745 0.03561 1 : 148,258 1.000055716 0.999951032 1.000006745 +0°43'39.27''
4. Sioux City-Iowa Falls NL0374 F 14 -7.804 -0.04121 1 : 128,137 1.000045551 0.999946647 0.999992196 –0°36'16.85''
4. Sioux City-Iowa Falls NL0119 F 32 -3.325 -0.01756 1 : 300,768 1.000045569 0.999951109 0.999996675 +0°31'45.59''
4. Sioux City-Iowa Falls AE2135 FOD A -4.779 -0.02523 1 : 209,247 1.000045057 0.999950166 0.999995221 +0°26'11.83''
4. Sioux City-Iowa Falls AE2149 GPS 048 -16.060 -0.08479 1 : 62,268 1.000048787 0.999935157 0.999983940 –1°00'44.83''
4. Sioux City-Iowa Falls NK0673 HILL ET 14.500 0.07656 1 : 68,965 1.000062962 0.999951542 1.000014500 +1°09'20.16''

Iowa Regional Coordinate System Handbook and User Guide
C-6
Zone number and name NGS PID Station designation
Linear distortion at ground surface Grid point scale factor
Height scale factor
Combined scale factor
Convergence angle (ppm) (ft/mile) (ratio)
4. Sioux City-Iowa Falls NM1615 HOMAN RESET 2.752 0.01453 1 : 363,358 1.000066599 0.999936158 1.000002752 –0°48'18.59''
4. Sioux City-Iowa Falls DL5969 HPT A -0.479 -0.00253 1 : 2,087,970 1.000050620 0.999948904 0.999999521 +1°05'13.46''
4. Sioux City-Iowa Falls DL5971 HPT B -0.787 -0.00416 1 : 1,270,407 1.000050906 0.999948309 0.999999213 +1°05'13.50''
4. Sioux City-Iowa Falls DL5970 HPT C -0.459 -0.00242 1 : 2,178,908 1.000050176 0.999949367 0.999999541 +1°05'13.02''
4. Sioux City-Iowa Falls NL0235 K 22 RESET -1.169 -0.00617 1 : 855,653 1.000060399 0.999938436 0.999998831 –0°05'46.91''
4. Sioux City-Iowa Falls NK0459 L 28 -0.383 -0.00202 1 : 2,612,445 1.000050757 0.999948863 0.999999617 +0°44'00.80''
4. Sioux City-Iowa Falls NL0869 POCAHONTAS 3 -2.953 -0.01559 1 : 338,677 1.000051212 0.999945839 0.999997047 +0°08'40.31''
4. Sioux City-Iowa Falls NK0427 R 31 -8.807 -0.04650 1 : 113,551 1.000045379 0.999945817 0.999991193 +0°49'18.82''
4. Sioux City-Iowa Falls NM1700 SIOUX CITY ARP 2 -0.627 -0.00331 1 : 1,595,238 1.000047535 0.999951841 0.999999373 –1°02'52.51''
4. Sioux City-Iowa Falls AI1965 SLB A -20.366 -0.10753 1 : 49,101 1.000045754 0.999933883 0.999979634 –0°16'38.89''
4. Sioux City-Iowa Falls NM0113 SLOAN 13.469 0.07112 1 : 74,242 1.000060395 0.999953077 1.000013469 –0°56'02.79''
4. Sioux City-Iowa Falls NL0936 STORMPORT -20.239 -0.10686 1 : 49,409 1.000045709 0.999934054 0.999979761 –0°16'31.89''
4. Sioux City-Iowa Falls NL0937 STORMPORT AZ MK -20.003 -0.10561 1 : 49,994 1.000045635 0.999934366 0.999979997 –0°16'19.29''
4. Sioux City-Iowa Falls DG6506 SUX A -0.461 -0.00243 1 : 2,169,053 1.000047396 0.999952145 0.999999539 –1°03'17.56''
4. Sioux City-Iowa Falls DG6507 SUX B -0.177 -0.00093 1 : 5,661,744 1.000047901 0.999951925 0.999999823 –1°02'37.17''
4. Sioux City-Iowa Falls NL0870 TJEBBEN -9.626 -0.05083 1 : 103,883 1.000045142 0.999945234 0.999990374 +0°09'09.16''
4. Sioux City-Iowa Falls NM1911 U 181 3.765 0.01988 1 : 265,626 1.000051339 0.999952428 1.000003765 –0°59'31.03''
4. Sioux City-Iowa Falls NM1912 Y 181 0.637 0.00336 1 : 1,571,051 1.000048671 0.999951968 1.000000637 –1°01'02.10''
5. Waterloo NK0164 B 30 -6.848 -0.03616 1 : 146,029 1.000032970 0.999960183 0.999993152 –0°11'35.93''
5. Waterloo NK0663 BEST -9.276 -0.04898 1 : 107,800 1.000036148 0.999954577 0.999990724 –0°21'12.08''
5. Waterloo NJ0599 C 12 -7.218 -0.03811 1 : 138,545 1.000044382 0.999948403 0.999992782 +0°16'16.09''
5. Waterloo NK0514 DETTMER -9.624 -0.05082 1 : 103,902 1.000036165 0.999954212 0.999990376 –0°05'09.42''
5. Waterloo NJ1003 G 75 RESET 6.183 0.03265 1 : 161,732 1.000046321 0.999959864 1.000006183 +0°17'26.45''
5. Waterloo NK0584 HUDSON -1.421 -0.00750 1 : 703,624 1.000039369 0.999959211 0.999998579 –0°08'46.17''

Iowa Regional Coordinate System Handbook and User Guide
C-7
Zone number and name NGS PID Station designation
Linear distortion at ground surface Grid point scale factor
Height scale factor
Combined scale factor
Convergence angle (ppm) (ft/mile) (ratio)
5. Waterloo AE2138 IIB A -3.409 -0.01800 1 : 293,324 1.000037875 0.999958717 0.999996591 +0°12'03.99''
5. Waterloo NK0036 L 11 1.757 0.00927 1 : 569,297 1.000038492 0.999963266 1.000001757 –0°06'56.26''
5. Waterloo DL3989 OLZ A -13.567 -0.07164 1 : 73,706 1.000032098 0.999954336 0.999986433 +0°11'24.43''
5. Waterloo DL3988 OLZ B -13.752 -0.07261 1 : 72,715 1.000032119 0.999954130 0.999986248 +0°11'13.69''
5. Waterloo DL3990 OLZ C -14.298 -0.07549 1 : 69,941 1.000032158 0.999953546 0.999985702 +0°10'59.30''
5. Waterloo NK0006 S 11 -10.691 -0.05645 1 : 93,535 1.000032258 0.999957052 0.999989309 +0°06'14.29''
5. Waterloo NK0652 SALEM -12.466 -0.06582 1 : 80,217 1.000034822 0.999952714 0.999987534 –0°20'51.81''
5. Waterloo NJ1008 T 74 RESET -11.177 -0.05901 1 : 89,471 1.000032011 0.999956814 0.999988823 +0°13'53.64''
5. Waterloo NJ0626 X 74 -9.400 -0.04963 1 : 106,382 1.000033797 0.999956804 0.999990600 +0°13'50.10''
5. Waterloo NJ0596 Z 11 -9.820 -0.05185 1 : 101,829 1.000036287 0.999953894 0.999990180 +0°14'40.21''
6. Council Bluffs MJ0984 43 58 0.889 0.00469 1 : 1,124,739 1.000044427 0.999956464 1.000000889 –0°10'01.14''
6. Council Bluffs AI8383 743816 3 8.914 0.04707 1 : 112,178 1.000060742 0.999948176 1.000008914 +0°19'48.57''
6. Council Bluffs AI8381 744006 1 -7.929 -0.04186 1 : 126,120 1.000044529 0.999947545 0.999992071 +0°10'00.25''
6. Council Bluffs AI8382 744224 3 -13.058 -0.06894 1 : 76,584 1.000039890 0.999947054 0.999986942 +0°04'00.40''
6. Council Bluffs AI8380 753913 3 0.890 0.00470 1 : 1,123,095 1.000056044 0.999944849 1.000000890 +0°17'35.56''
6. Council Bluffs AI8379 764033 3 -6.493 -0.03428 1 : 154,018 1.000045406 0.999948103 0.999993507 +0°10'48.13''
6. Council Bluffs AI8375 764204 1 -8.421 -0.04446 1 : 118,757 1.000039349 0.999952232 0.999991579 +0°02'31.73''
6. Council Bluffs AI8378 764235 3 -16.846 -0.08895 1 : 59,360 1.000039659 0.999943497 0.999983154 +0°03'27.84''
6. Council Bluffs AI8374 764306 1 -4.079 -0.02154 1 : 245,176 1.000039729 0.999956194 0.999995921 –0°03'39.26''
6. Council Bluffs AI8377 773936 3 -1.569 -0.00828 1 : 637,513 1.000055965 0.999942469 0.999998431 +0°17'37.93''
6. Council Bluffs AI8376 774035 2 -10.132 -0.05349 1 : 98,701 1.000048367 0.999941504 0.999989868 +0°13'06.10''
6. Council Bluffs MJ0283 83 99 RESET 2 -0.682 -0.00360 1 : 1,465,768 1.000062392 0.999936929 0.999999318 +0°20'56.63''
6. Council Bluffs MJ0639 A 140 -2.739 -0.01446 1 : 365,110 1.000040888 0.999956374 0.999997261 –0°05'53.65''
6. Council Bluffs MJ1160 ASPIN 0.394 0.00208 1 : 2,538,054 1.000067735 0.999932664 1.000000394 +0°23'22.44''

Iowa Regional Coordinate System Handbook and User Guide
C-8
Zone number and name NGS PID Station designation
Linear distortion at ground surface Grid point scale factor
Height scale factor
Combined scale factor
Convergence angle (ppm) (ft/mile) (ratio)
6. Council Bluffs AH9100 BLENCOE RESET 4.554 0.02404 1 : 219,590 1.000049731 0.999954825 1.000004554 –0°14'16.49''
6. Council Bluffs LF1169 C 133 -0.294 -0.00155 1 : 3,397,963 1.000039513 0.999960194 0.999999706 –0°02'59.69''
6. Council Bluffs MJ0513 C 147 2.894 0.01528 1 : 345,527 1.000052481 0.999950416 1.000002894 +0°15'44.44''
6. Council Bluffs MJ1403 COUNPORT -16.224 -0.08566 1 : 61,638 1.000039065 0.999944714 0.999983776 –0°01'04.95''
6. Council Bluffs MJ1411 COUNPORT AZ MK -15.397 -0.08130 1 : 64,948 1.000039090 0.999945515 0.999984603 –0°01'16.68''
6. Council Bluffs MJ1382 E 180 -1.505 -0.00795 1 : 664,394 1.000041224 0.999957273 0.999998495 –0°06'22.79''
6. Council Bluffs LF1531 EE 158 RESET -0.882 -0.00466 1 : 1,133,635 1.000041726 0.999957393 0.999999118 +0°06'56.80''
6. Council Bluffs LF1445 G 182 0.649 0.00343 1 : 1,540,515 1.000039457 0.999961194 1.000000649 +0°02'48.56''
6. Council Bluffs MJ1199 HANCOCK -3.612 -0.01907 1 : 276,822 1.000051844 0.999944546 0.999996388 +0°15'19.44''
6. Council Bluffs AE2137 HNR A -1.127 -0.00595 1 : 887,299 1.000052119 0.999946757 0.999998873 +0°15'35.76''
6. Council Bluffs NL0444 J 159 -20.329 -0.10734 1 : 49,191 1.000040137 0.999939537 0.999979671 –0°04'39.57''
6. Council Bluffs MJ1402 J 180 -2.882 -0.01521 1 : 347,039 1.000039541 0.999957579 0.999997118 –0°03'07.21''
6. Council Bluffs NL0901 MAPPORT -9.617 -0.05078 1 : 103,983 1.000039299 0.999951086 0.999990383 –0°02'24.33''
6. Council Bluffs AE9294 OMA 1 -19.754 -0.10430 1 : 50,624 1.000041702 0.999938547 0.999980246 –0°07'07.55''
6. Council Bluffs AE9293 OMA 2 -19.673 -0.10387 1 : 50,831 1.000041675 0.999938655 0.999980327 –0°07'05.42''
6. Council Bluffs AE2142 SDA A 6.766 0.03572 1 : 147,807 1.000048466 0.999958302 1.000006766 +0°12'51.92''
6. Council Bluffs LF1495 SHENPORT 7.099 0.03748 1 : 140,873 1.000047806 0.999959295 1.000007099 +0°12'24.52''
6. Council Bluffs LF1496 SHENPORT AZ MK 6.747 0.03562 1 : 148,220 1.000048084 0.999958665 1.000006747 +0°12'36.10''
6. Council Bluffs MJ0955 T 150 -9.437 -0.04983 1 : 105,962 1.000042663 0.999947902 0.999990563 +0°08'15.25''
6. Council Bluffs LF0985 V 134 0.146 0.00077 1 : 6,830,936 1.000039000 0.999961148 1.000000146 –0°00'04.46''
7. Carroll-Atlantic DL6007 CIN A -5.776 -0.03050 1 : 173,118 1.000047003 0.999947223 0.999994224 –0°06'11.68''
7. Carroll-Atlantic DL6008 CIN B -5.854 -0.03091 1 : 170,827 1.000047212 0.999946937 0.999994146 –0°06'30.63''
7. Carroll-Atlantic DL6009 CIN C -5.687 -0.03003 1 : 175,845 1.000046886 0.999947429 0.999994313 –0°06'00.55''
7. Carroll-Atlantic MJ0181 P 163 -18.959 -0.10011 1 : 52,744 1.000045061 0.999935982 0.999981041 –0°01'03.80''

Iowa Regional Coordinate System Handbook and User Guide
C-9
Zone number and name NGS PID Station designation
Linear distortion at ground surface Grid point scale factor
Height scale factor
Combined scale factor
Convergence angle (ppm) (ft/mile) (ratio)
7. Carroll-Atlantic MJ1121 TURK -2.372 -0.01252 1 : 421,600 1.000055785 0.999941847 0.999997628 –0°14'00.90''
7. Carroll-Atlantic MJ1465 W 100 RESET -13.505 -0.07131 1 : 74,045 1.000048826 0.999937672 0.999986495 –0°08'26.93''
7. Carroll-Atlantic NL0186 W 89 -6.033 -0.03185 1 : 165,758 1.000046905 0.999947064 0.999993967 –0°06'02.57''
7. Carroll-Atlantic MJ0136 X 103 -13.103 -0.06918 1 : 76,320 1.000047510 0.999939390 0.999986897 +0°06'44.99''
7. Carroll-Atlantic NL0140 X 93 -4.259 -0.02249 1 : 234,806 1.000050940 0.999944804 0.999995741 –0°10'40.74''
7. Carroll-Atlantic NL0192 Y 89 -5.830 -0.03078 1 : 171,515 1.000049802 0.999944371 0.999994170 –0°09'35.79''
8. Ames-Des Moines AE2154 20 ADP -10.150 -0.05359 1 : 98,522 1.000033415 0.999956436 0.999989850 –0°02'45.30''
8. Ames-Des Moines MJ0089 A 162 -1.289 -0.00680 1 : 775,950 1.000046343 0.999952370 0.999998711 –0°15'40.58''
8. Ames-Des Moines AJ8301 AMW D -5.577 -0.02945 1 : 179,314 1.000033818 0.999960606 0.999994423 +0°03'57.08''
8. Ames-Des Moines AJ8302 AMW E -6.614 -0.03492 1 : 151,191 1.000033724 0.999959663 0.999993386 +0°03'42.92''
8. Ames-Des Moines AJ8303 AMW F -5.728 -0.03024 1 : 174,578 1.000033705 0.999960569 0.999994272 +0°03'40.05''
8. Ames-Des Moines DI3066 BNW A -15.453 -0.08159 1 : 64,713 1.000034526 0.999950023 0.999984547 –0°05'24.46''
8. Ames-Des Moines DI3067 BNW B -15.473 -0.08169 1 : 64,631 1.000034330 0.999950199 0.999984527 –0°05'02.81''
8. Ames-Des Moines NK0751 BOONEPORT AZ MK -15.526 -0.08198 1 : 64,410 1.000034398 0.999950078 0.999984474 –0°05'10.47''
8. Ames-Des Moines AB5750 DSM ARP -6.309 -0.03331 1 : 158,514 1.000033285 0.999960407 0.999993691 +0°02'17.76''
8. Ames-Des Moines AJ6051 DSM C -5.534 -0.02922 1 : 180,693 1.000033183 0.999961284 0.999994466 +0°01'50.26''
8. Ames-Des Moines AJ6052 DSM D -5.834 -0.03080 1 : 171,404 1.000033235 0.999960932 0.999994166 +0°02'04.98''
8. Ames-Des Moines MH0688 ET 9 JA -13.005 -0.06866 1 : 76,896 1.000033138 0.999953859 0.999986995 –0°01'37.24''
8. Ames-Des Moines AE2151 GPS 15 -0.801 -0.00423 1 : 1,248,512 1.000036891 0.999962310 0.999999199 +0°08'29.31''
8. Ames-Des Moines AE2150 GPS 9 -6.684 -0.03529 1 : 149,618 1.000033323 0.999959994 0.999993316 –0°02'26.54''
8. Ames-Des Moines NK0704 HUBBARD WEST BASE -6.940 -0.03664 1 : 144,099 1.000043309 0.999949754 0.999993060 +0°14'07.30''
8. Ames-Des Moines AE1868 IADOT BASE STATION -7.547 -0.03985 1 : 132,498 1.000033752 0.999958702 0.999992453 +0°03'47.58''
8. Ames-Des Moines AE2139 IKV A -2.632 -0.01390 1 : 379,920 1.000034913 0.999962456 0.999997368 +0°05'58.72''
8. Ames-Des Moines DG6295 IKV B -2.445 -0.01291 1 : 409,043 1.000034917 0.999962640 0.999997555 +0°05'58.93''

Iowa Regional Coordinate System Handbook and User Guide
C-10
Zone number and name NGS PID Station designation
Linear distortion at ground surface Grid point scale factor
Height scale factor
Combined scale factor
Convergence angle (ppm) (ft/mile) (ratio)
8. Ames-Des Moines DG6296 IKV C -3.261 -0.01722 1 : 306,664 1.000034916 0.999961824 0.999996739 +0°05'59.04''
8. Ames-Des Moines DF6532 IOWA DOT RCE OFFICE -5.908 -0.03119 1 : 169,272 1.000034205 0.999959889 0.999994092 +0°04'44.31''
8. Ames-Des Moines MJ1441 PERRYPORT 5.980 0.03157 1 : 167,235 1.000049633 0.999956348 1.000005980 –0°17'42.75''
8. Ames-Des Moines AE2153 STORY 11 -10.091 -0.05328 1 : 99,094 1.000033793 0.999956117 0.999989909 +0°03'52.37''
8. Ames-Des Moines AE2152 STORY 5 0.881 0.00465 1 : 1,134,884 1.000044500 0.999956383 1.000000881 +0°14'48.26''
8. Ames-Des Moines MH0406 U 33 -4.393 -0.02320 1 : 227,631 1.000036545 0.999959064 0.999995607 +0°08'13.19''
8. Ames-Des Moines NL0104 U 88 -1.076 -0.00568 1 : 929,280 1.000044547 0.999954379 0.999998924 –0°14'52.03''
8. Ames-Des Moines MJ0074 X 3 -2.105 -0.01111 1 : 475,034 1.000042357 0.999955540 0.999997895 –0°13'15.66''
9. Newton MH0207 A 5 -2.041 -0.01078 1 : 489,890 1.000037067 0.999960893 0.999997959 –0°13'39.21''
9. Newton NK0611 BROOK -16.404 -0.08661 1 : 60,962 1.000028367 0.999955231 0.999983596 +0°05'08.31''
9. Newton MH0163 D 88 -17.164 -0.09063 1 : 58,261 1.000027096 0.999955741 0.999982836 +0°01'20.82''
9. Newton MH0650 DYER 5.284 0.02790 1 : 189,260 1.000044788 0.999960498 1.000005284 –0°18'02.99''
9. Newton AE2136 GGI A -15.291 -0.08074 1 : 65,399 1.000027579 0.999957131 0.999984709 +0°03'17.45''
9. Newton MH0783 KNOXPORT -4.692 -0.02477 1 : 213,119 1.000034566 0.999960743 0.999995308 –0°11'43.52''
9. Newton MH0784 KNOXPORT AZ MK -4.376 -0.02311 1 : 228,519 1.000034748 0.999960878 0.999995624 –0°11'52.06''
9. Newton MH0109 L 87 -6.794 -0.03587 1 : 147,184 1.000029471 0.999963735 0.999993206 +0°06'44.42''
9. Newton MH0578 LARSON -11.890 -0.06278 1 : 84,106 1.000030299 0.999957813 0.999988110 +0°07'51.19''
9. Newton DK3690 OOA A 2007 1.554 0.00821 1 : 643,311 1.000036348 0.999965208 1.000001554 +0°12'59.88''
9. Newton MH0795 OSKAPORT 1.315 0.00694 1 : 760,565 1.000036135 0.999965181 1.000001315 +0°12'51.00''
9. Newton MH0796 OSKAPORT AZ MK 1.029 0.00543 1 : 971,696 1.000035913 0.999965117 1.000001029 +0°12'41.66''
9. Newton AJ8304 OXV A -4.899 -0.02587 1 : 204,106 1.000034430 0.999960672 0.999995101 –0°11'37.08''
9. Newton MH0124 T 5 1.425 0.00752 1 : 701,718 1.000029271 0.999972154 1.000001425 +0°06'24.34''
9. Newton AE2147 TT 10 FHJ -12.310 -0.06500 1 : 81,234 1.000028727 0.999958964 0.999987690 –0°05'44.62''
9. Newton NK0107 Y 10 -13.102 -0.06918 1 : 76,324 1.000027658 0.999959241 0.999986898 +0°03'34.05''

Iowa Regional Coordinate System Handbook and User Guide
C-11
Zone number and name NGS PID Station designation
Linear distortion at ground surface Grid point scale factor
Height scale factor
Combined scale factor
Convergence angle (ppm) (ft/mile) (ratio)
10. Cedar Rapids MG0566 57 27 -13.296 -0.07020 1 : 75,210 1.000020379 0.999966326 0.999986704 +0°00'47.83''
10. Cedar Rapids AE2145 95 03 -14.433 -0.07620 1 : 69,288 1.000020053 0.999965515 0.999985567 +0°26'44.09''
10. Cedar Rapids AB5732 CID ARP 2 -15.481 -0.08174 1 : 64,596 1.000020403 0.999964116 0.999984519 –0°01'41.56''
10. Cedar Rapids DM6119 CID C -15.706 -0.08293 1 : 63,671 1.000020431 0.999963864 0.999984294 –0°01'53.27''
10. Cedar Rapids AJ8568 CID GP 1 -15.991 -0.08443 1 : 62,537 1.000020380 0.999963631 0.999984009 –0°02'40.16''
10. Cedar Rapids AJ8598 CID GP 2 -15.260 -0.08057 1 : 65,529 1.000020374 0.999964366 0.999984740 –0°01'16.03''
10. Cedar Rapids NJ0755 ET 4 JS 6.915 0.03651 1 : 144,611 1.000046916 0.999960001 1.000006915 +0°17'36.99''
10. Cedar Rapids AE2155 GPS CONTROL POINT 96 102 5.042 0.02662 1 : 198,350 1.000035722 0.999969321 1.000005042 –0°08'48.88''
10. Cedar Rapids MH0487 HARTWICK -19.725 -0.10415 1 : 50,696 1.000020001 0.999960274 0.999980275 –0°24'53.10''
10. Cedar Rapids AE9184 NLIB A -13.375 -0.07062 1 : 74,767 1.000020733 0.999965893 0.999986625 +0°03'31.27''
10. Cedar Rapids MG0916 NORTH LIBERTY -11.690 -0.06172 1 : 85,545 1.000020570 0.999967741 0.999988310 +0°03'40.98''
10. Cedar Rapids NK0557 PRATT -0.232 -0.00122 1 : 4,316,967 1.000041647 0.999958123 0.999999768 –0°21'48.99''
10. Cedar Rapids AE9186 X 183 -11.472 -0.06057 1 : 87,171 1.000020883 0.999967646 0.999988528 +0°02'23.39''
11. Dubuque-Davenport NJ0271 52 JDF -19.587 -0.10342 1 : 51,055 1.000027314 0.999953100 0.999980413 –0°02'29.04''
11. Dubuque-Davenport NJ0367 A 178 -10.131 -0.05349 1 : 98,712 1.000038457 0.999951414 0.999989869 –0°15'05.84''
11. Dubuque-Davenport AE9312 A 185 1.686 0.00890 1 : 593,007 1.000034866 0.999966822 1.000001686 +0°12'15.84''
11. Dubuque-Davenport NJ0104 C 175 10.457 0.05521 1 : 95,634 1.000035257 0.999975201 1.000010457 +0°12'36.40''
11. Dubuque-Davenport AJ8298 CWI A 2.678 0.01414 1 : 373,470 1.000030471 0.999972207 1.000002678 +0°08'05.49''
11. Dubuque-Davenport AJ8299 CWI B 2.030 0.01072 1 : 492,682 1.000030369 0.999971662 1.000002030 +0°07'58.39''
11. Dubuque-Davenport AJ8300 CWI C 2.204 0.01164 1 : 453,645 1.000030721 0.999971484 1.000002204 +0°08'22.84''
11. Dubuque-Davenport DF9357 DBQ A -14.538 -0.07676 1 : 68,787 1.000029636 0.999955828 0.999985462 –0°07'11.57''
11. Dubuque-Davenport DF9358 DBQ B -16.713 -0.08825 1 : 59,833 1.000029296 0.999953992 0.999983287 –0°06'42.84''
11. Dubuque-Davenport NJ0939 DUBUQUE -11.794 -0.06227 1 : 84,788 1.000030208 0.999958000 0.999988206 –0°07'58.31''
11. Dubuque-Davenport NJ0258 DUBUQUE APT ARP -15.857 -0.08372 1 : 63,065 1.000029572 0.999954573 0.999984143 –0°07'06.40''

Iowa Regional Coordinate System Handbook and User Guide
C-12
Zone number and name NGS PID Station designation
Linear distortion at ground surface Grid point scale factor
Height scale factor
Combined scale factor
Convergence angle (ppm) (ft/mile) (ratio)
11. Dubuque-Davenport AB5747 DVN A 1975 -3.479 -0.01837 1 : 287,447 1.000027316 0.999969206 0.999996521 –0°02'25.40''
11. Dubuque-Davenport NJ0232 E 79 -10.172 -0.05371 1 : 98,310 1.000027000 0.999962829 0.999989828 –0°00'02.35''
11. Dubuque-Davenport MG0328 G 70 -4.952 -0.02614 1 : 201,955 1.000027193 0.999967856 0.999995048 –0°01'53.69''
11. Dubuque-Davenport NJ0893 HANTEN -22.688 -0.11980 1 : 44,075 1.000028461 0.999948852 0.999977312 –0°05'21.31''
11. Dubuque-Davenport NJ0119 Q 175 5.419 0.02861 1 : 184,544 1.000029025 0.999976394 1.000005419 +0°06'15.68''
11. Dubuque-Davenport AE9310 RISL A 2.109 0.01114 1 : 474,165 1.000035045 0.999967065 1.000002109 +0°12'23.90''
11. Dubuque-Davenport AE9311 RISL B 2.049 0.01082 1 : 488,154 1.000034738 0.999967312 1.000002049 +0°12'09.55''
11. Dubuque-Davenport NJ0153 X 175 -2.572 -0.01358 1 : 388,863 1.000027495 0.999969935 0.999997428 +0°03'06.38''
12. Red Oak-Ottumwa AB5782 AP 1963 STA B 7.459 0.03939 1 : 134,058 1.000042612 0.999964848 1.000007459 +0°50'55.79''
12. Red Oak-Ottumwa MH0780 CHARIPORT AZ MK -6.357 -0.03357 1 : 157,299 1.000038625 0.999955019 0.999993643 +0°15'10.00''
12. Red Oak-Ottumwa MJ1425 CRESTPORT -18.437 -0.09735 1 : 54,239 1.000038603 0.999942963 0.999981563 –0°24'05.23''
12. Red Oak-Ottumwa MJ1426 CRESTPORT AZ MK -18.518 -0.09777 1 : 54,002 1.000038457 0.999943027 0.999981482 –0°24'01.17''
12. Red Oak-Ottumwa AE2133 CSQ A -18.297 -0.09661 1 : 54,653 1.000038911 0.999942794 0.999981703 –0°24'16.21''
12. Red Oak-Ottumwa MH0054 D 6 8.325 0.04396 1 : 120,122 1.000041550 0.999966777 1.000008325 +0°54'31.33''
12. Red Oak-Ottumwa MH0055 E 6 11.507 0.06075 1 : 86,907 1.000042294 0.999969214 1.000011507 +0°56'23.43''
12. Red Oak-Ottumwa LE0588 ET 2 MES 3.130 0.01652 1 : 319,537 1.000050146 0.999952986 1.000003130 +0°00'05.46''
12. Red Oak-Ottumwa LE0532 FAIRALL -7.759 -0.04097 1 : 128,879 1.000040347 0.999951896 0.999992241 +0°10'19.62''
12. Red Oak-Ottumwa MH0272 H 110 -10.360 -0.05470 1 : 96,529 1.000039207 0.999950435 0.999989640 –0°00'36.50''
12. Red Oak-Ottumwa DL2463 I75 A -8.160 -0.04309 1 : 122,543 1.000039924 0.999951918 0.999991840 +0°02'25.98''
12. Red Oak-Ottumwa DL2464 I75 B -8.433 -0.04452 1 : 118,587 1.000039720 0.999951849 0.999991567 +0°02'20.46''
12. Red Oak-Ottumwa DL2465 I75 C -8.713 -0.04600 1 : 114,774 1.000039529 0.999951760 0.999991287 +0°02'24.74''
12. Red Oak-Ottumwa LF0049 K 105 -2.339 -0.01235 1 : 427,547 1.000047486 0.999950177 0.999997661 –0°23'22.91''
12. Red Oak-Ottumwa MH0561 LOVILIA 4.620 0.02439 1 : 216,446 1.000044399 0.999960223 1.000004620 +0°33'07.89''
12. Red Oak-Ottumwa LE0593 OSCEOLA -12.025 -0.06349 1 : 83,158 1.000038044 0.999949933 0.999987975 –0°00'46.33''

Iowa Regional Coordinate System Handbook and User Guide
C-13
Zone number and name NGS PID Station designation
Linear distortion at ground surface Grid point scale factor
Height scale factor
Combined scale factor
Convergence angle (ppm) (ft/mile) (ratio)
12. Red Oak-Ottumwa LE0502 PARKER 1.870 0.00988 1 : 534,618 1.000037461 0.999964411 1.000001870 +0°48'34.99''
12. Red Oak-Ottumwa LF1299 PRESCOTT 2 -19.689 -0.10396 1 : 50,790 1.000037591 0.999942723 0.999980311 –0°34'17.22''
12. Red Oak-Ottumwa LF0026 R 104 RESET -17.480 -0.09230 1 : 57,207 1.000037001 0.999945521 0.999982520 –0°23'04.95''
12. Red Oak-Ottumwa MH0280 R 110 -2.150 -0.01135 1 : 465,062 1.000038224 0.999959627 0.999997850 +0°06'44.14''
12. Red Oak-Ottumwa MJ1447 REDPORT -6.697 -0.03536 1 : 149,325 1.000038338 0.999954967 0.999993303 –0°59'20.04''
12. Red Oak-Ottumwa LF1488 S 106 RESET -12.746 -0.06730 1 : 78,455 1.000041461 0.999945795 0.999987254 –0°40'52.03''
12. Red Oak-Ottumwa LF0231 S 8 9.498 0.05015 1 : 105,285 1.000051212 0.999958288 1.000009498 –0°57'47.01''
12. Red Oak-Ottumwa LF1489 SCHEPORT 0.449 0.00237 1 : 2,229,547 1.000042699 0.999957751 1.000000449 –0°50'09.41''
12. Red Oak-Ottumwa MJ0521 U 148 -11.489 -0.06066 1 : 87,040 1.000045004 0.999943509 0.999988511 –1°00'28.79''
12. Red Oak-Ottumwa MH0053 WAPELLO 7.341 0.03876 1 : 136,215 1.000042469 0.999964874 1.000007341 +0°51'17.09''
12. Red Oak-Ottumwa LE0188 X 7 5.190 0.02740 1 : 192,678 1.000049494 0.999955699 1.000005190 +0°32'40.78''
13. Fairfield DK3513 AWG A 2007 -5.639 -0.02977 1 : 177,336 1.000025087 0.999969274 0.999994361 +0°09'36.48''
13. Fairfield DK3514 AWG B 2007 -5.589 -0.02951 1 : 178,913 1.000025002 0.999969409 0.999994411 +0°09'31.47''
13. Fairfield MG0476 B 8 0.050 0.00026 1 : 19,989,475 1.000030907 0.999969144 1.000000050 +0°14'05.52''
13. Fairfield LE0437 COPELAND -8.084 -0.04269 1 : 123,696 1.000024011 0.999967906 0.999991916 –0°08'25.45''
13. Fairfield MG0416 D 8 8.559 0.04519 1 : 116,832 1.000036083 0.999972477 1.000008559 +0°17'07.74''
13. Fairfield AE2156 GPS CONTROL PT 96 150 -5.386 -0.02844 1 : 185,681 1.000020066 0.999974549 0.999994614 –0°01'05.37''
13. Fairfield LD0592 T 124 -10.086 -0.05326 1 : 99,144 1.000020968 0.999968946 0.999989914 +0°04'08.98''
13. Fairfield MG0914 WASHPORT AZ MK -5.550 -0.02930 1 : 180,181 1.000025248 0.999969202 0.999994450 +0°09'45.44''
13. Fairfield MG0472 X 6 -5.406 -0.02854 1 : 184,990 1.000023165 0.999971430 0.999994594 +0°07'34.93''
14. Burlington AE2146 39 RWM -8.012 -0.04230 1 : 124,814 1.000020636 0.999971353 0.999991988 +0°06'49.52''
14. Burlington AE2148 ARDON AZ MK RESET -11.811 -0.06236 1 : 84,667 1.000018497 0.999969692 0.999988189 +0°03'01.31''
14. Burlington AJ8295 EOK A 2000 -5.647 -0.02982 1 : 177,075 1.000021017 0.999973336 0.999994353 –0°07'11.34''
14. Burlington AJ8296 EOK B 2000 -5.809 -0.03067 1 : 172,156 1.000020924 0.999973268 0.999994191 –0°07'04.56''

Iowa Regional Coordinate System Handbook and User Guide
C-14
Zone number and name NGS PID Station designation
Linear distortion at ground surface Grid point scale factor
Height scale factor
Combined scale factor
Convergence angle (ppm) (ft/mile) (ratio)
14. Burlington AJ8297 EOK C -5.996 -0.03166 1 : 166,785 1.000020659 0.999973345 0.999994004 –0°06'44.94''
14. Burlington MG0794 HASCHAR -9.327 -0.04925 1 : 107,219 1.000018858 0.999971816 0.999990673 +0°03'56.73''
14. Burlington LD0867 JACKSON -0.507 -0.00268 1 : 1,973,740 1.000028572 0.999970922 0.999999493 –0°13'39.19''
14. Burlington LD0882 KEOPORT AZ MK -5.632 -0.02973 1 : 177,569 1.000020804 0.999973565 0.999994368 –0°06'55.74''
14. Burlington DF6531 LEE CO GPS CONTROL PT 2001 013 0.003 0.00002 1 : 312,086,746 1.000028951 0.999971053 1.000000003 –0°13'49.47''
14. Burlington LD0800 MADISON -10.598 -0.05596 1 : 94,358 1.000018120 0.999971283 0.999989402 –0°01'26.61''
14. Burlington AE2140 MPZ A -5.602 -0.02958 1 : 178,506 1.000023937 0.999970462 0.999994398 –0°10'15.44''
14. Burlington MG0791 MUSCATINE -8.746 -0.04618 1 : 114,338 1.000020733 0.999970521 0.999991254 +0°07'04.72''
14. Burlington AJ8263 MUT A 2001 -2.056 -0.01086 1 : 486,279 1.000018813 0.999979131 0.999997944 +0°03'51.10''
14. Burlington AJ8264 MUT B 2001 -1.599 -0.00844 1 : 625,477 1.000019131 0.999979271 0.999998401 +0°04'32.67''
14. Burlington AJ8265 MUT C -1.663 -0.00878 1 : 601,208 1.000018836 0.999979501 0.999998337 +0°03'54.42''
14. Burlington LD0612 R 122=56 34 -1.621 -0.00856 1 : 616,773 1.000026651 0.999971729 0.999998379 –0°12'17.10''
14. Burlington LD0616 T 122 RESET -2.130 -0.01125 1 : 469,420 1.000026636 0.999971235 0.999997870 –0°12'17.34''
14. Burlington LD0531 ZZ 125 -8.219 -0.04340 1 : 121,667 1.000019543 0.999972238 0.999991781 +0°05'11.95''