Embed Size (px)
Citation preview

Iowa Farm Financial
Conditions
Alejandro Plastina, PhD
Assistant Professor, Economics
Le Mars, IA
December 1, 2017

Overview
1) How has the financial situation of Iowa
farms changed over the last 3 years?
2) What did successful farms do differently
in 2016?

Data• Source: Iowa Farm Business Association
• Actively Managed Mid-size Commercial Farms
• Focus on Farm Management Decisions
• Machinery and Land recorded at COST value

Average Net Farm Income in Iowa:
(accrual, nominal)
$243,072
$27,927$45,597
$0
$50,000
$100,000
$150,000
$200,000
$250,000
Source: Iowa Farm Costs and Returns. Ag Decision Maker File C1-10. Various years.

Average Farm Profitability in Iowa: ROA, ROE, Operating profit margin ratio
1.7%1.0%0%
5%
10%
15%
20%
25%
30%
35%
40% Operating profit margin ratio Rate of return on farm assets Rate of return on farm equity
Source: Iowa Farm Costs and Returns. Ag Decision Maker File C1-10. Various years.

Average Farm Liquidity & Solvency
Liquidity: Current Ratio = Current Assets/Current Liabilities Solvency: Debt-to-Asset Ratio = Total Liabilities / Total Assets
Higher better Lower better

Track evolution of same set
of farms through time
• December 31, 2014
• December 31, 2015
• December 31, 2016
• Number of farms =273

IFBA Farms vs. Ag Census
0 10 20 30 40 50
a)1 to 9
b)10 to 49
c)50 to 179
d)180 to 499
e)500 to 999
f)1000 and up
Distribution of Farms by Size (Acres), in %
IFBA Census
0 10 20 30 40 50
a)Under 25
b)25 to 34
c)35 to 44
d)45 to 54
e)55 to 64
f)65 and up
Distribution of Farms by Age of Principal Operator, in %
IFBA Census

Farms grouped according to:
1) LIQUIDITY RATING:
• Strong:
Current ratio > 2
• Under Watch:
1.3 < Current ratio < 2
• Vulnerable:
Current ratio < 1.3
2) SOLVENCY RATING
• Strong:
Debt-to-Asset Ratio < 30%
• Under Watch:
30% < DTA Ratio < 60%
• Vulnerable:
DTA ratio > 60%
Source: Farm Financial Scorecard

+8.1%+2.2%31.5%
40.7% 42.8%
FinancialLiquidity
Plastina, A.2017. “"Financial Stress in Iowa Farms: 2014-2016.“ FM 1892 R. https://store.extension.iastate.edu/product/15261

+4%+0.8%20.5% 24.5% 25.3%
FinancialSolvency
Plastina, A.2017. “"Financial Stress in Iowa Farms: 2014-2016.“ FM 1892 R. https://store.extension.iastate.edu/product/15261

Classification MatrixSolvency: Total Debt-to-Asset Ratio
Strong:
Under 30%
Watch:
Between 30%
and 60%
Vulnerable:
Above 60%
Liquidity:
Current
Ratio
Strong:
Over 2.0
Watch:
Between 1.3
and 2.0
Vulnerable:
Below 1.3
Current Ratio = Current Assets/Current LiabilitiesDebt-to-Asset Ratio = Total Liabilities / Total Assets

Dec 31, 2014 (273 farms)
Plastina, A.2017. “A panel study of Iowa Farm Financial Conditions: 2014-2016.” AAEA Meetings, Chicago, August 1.
Percent of Farms in Each
CategorySolvency: Total Debt-to-Asset Ratio
Strong:
Under 30%
Watch:
Between 30%
and 60%
Vulnerable:
Above 60%
Liquidity:
Current
Ratio
Strong:
Over 2.033.0% 12.1% 2.2%
Watch:
Between 1.3
and 2.07.0% 10.6% 3.7%
Vulnerable:
Below 1.3 2.6% 14.3% 14.7%

Dec 31, 2014 (273 farms)Percent of Farms in Each
CategorySolvency: Total Debt-to-Asset Ratio
Strong:
Under 30%
Watch:
Between 30%
and 60%
Vulnerable:
Above 60%
Liquidity:
Current
Ratio
Strong:
Over 2.0
Watch:
Between 1.3
and 2.0
Vulnerable:
Below 1.3
Total Vulnerable:
37.4%Plastina, A.2017. “A panel study of Iowa Farm Financial Conditions: 2014-2016.” AAEA Meetings, Chicago, August 1.
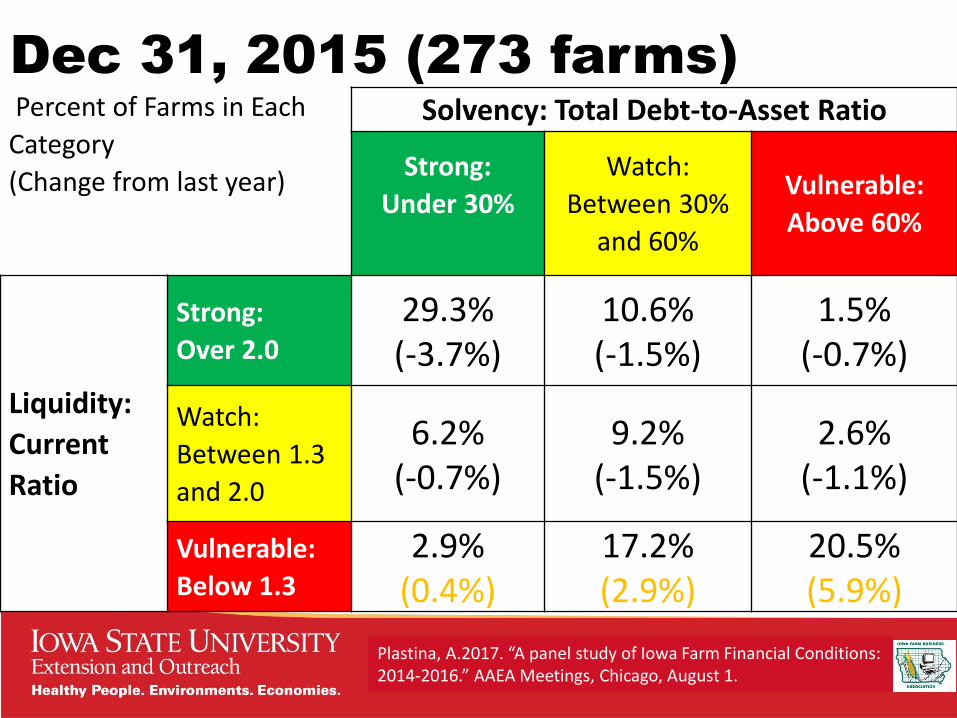
Dec 31, 2015 (273 farms)Percent of Farms in Each
Category
(Change from last year)
Solvency: Total Debt-to-Asset Ratio
Strong:
Under 30%
Watch:
Between 30%
and 60%
Vulnerable:
Above 60%
Liquidity:
Current
Ratio
Strong:
Over 2.0
29.3% (-3.7%)
10.6% (-1.5%)
1.5% (-0.7%)
Watch:
Between 1.3
and 2.0
6.2% (-0.7%)
9.2% (-1.5%)
2.6% (-1.1%)
Vulnerable:
Below 1.3
2.9% (0.4%)
17.2% (2.9%)
20.5% (5.9%)
Plastina, A.2017. “A panel study of Iowa Farm Financial Conditions: 2014-2016.” AAEA Meetings, Chicago, August 1.

Dec 31, 2015 (273 farms)Percent of Farms in Each
CategorySolvency: Total Debt-to-Asset Ratio
Strong:
Under 30%
Normal:
Between 30%
and 60%
Vulnerable:
Above 60%
Liquidity:
Current
Ratio
Strong:
Over 2.0
Normal:
Between 1.3
and 2.0
Vulnerable:
Below 1.3
Total Vulnerable:44.7% (+7%)
Plastina, A.2017. “A panel study of Iowa Farm Financial Conditions: 2014-2016.” AAEA Meetings, Chicago, August 1.

Dec 31, 2016 (273 farms)Percent of Farms in Each
Category
(Change from last year)
Solvency: Total Debt-to-Asset Ratio
Strong:
Under 30%
Watch:
Between 30%
and 60%
Vulnerable:
Above 60%
Liquidity:
Current
Ratio
Strong:
Over 2.0
30.8% (1.5%)
10.3% (-0.4%)
0.7% (-0.7%)
Watch:
Between 1.3
and 2.0
6.2% (0%)
6.2% (-2.9%)
2.9% (0.4%)
Vulnerable:
Below 1.3
2.9% (0%)
18.3% (1.1%)
21.6% (1.1%)
Plastina, A.2017. “A panel study of Iowa Farm Financial Conditions: 2014-2016.” AAEA Meetings, Chicago, August 1.

Dec 31, 2016 (273 farms)Percent of Farms in Each
CategorySolvency: Total Debt-to-Asset Ratio
Strong:
Under 30%
Watch:
Between 30%
and 60%
Vulnerable:
Above 60%
Liquidity:
Current
Ratio
Strong:
Over 2.0
Watch:
Between 1.3
and 2.0
Vulnerable:
Below 1.3
Total Vulnerable:46.5%
(+1.8%)
Plastina, A.2017. “A panel study of Iowa Farm Financial Conditions: 2014-2016.” AAEA Meetings, Chicago, August 1.

Changes in
Working Capital
per Acre

1)How has the financial situation
of Iowa farms changed over the
last 3 years?
• Increased number of vulnerable farms
• Big losses in Working Capital
• December 2016:
43% of farms with vulnerable liquidity
25% of farms with vulnerable solvency
22% of farms w/ vulnerable liq. & solvency
2) What did successful farms
do differently in 2016?

Average Net Farm Income in Iowa:
(accrual, nominal)
$243,072
$27,927$45,597
$0
$50,000
$100,000
$150,000
$200,000
$250,000
Source: Iowa Farm Costs and Returns. Ag Decision Maker File C1-10. Various years.
Farmers can live off depreciation for short periods of time
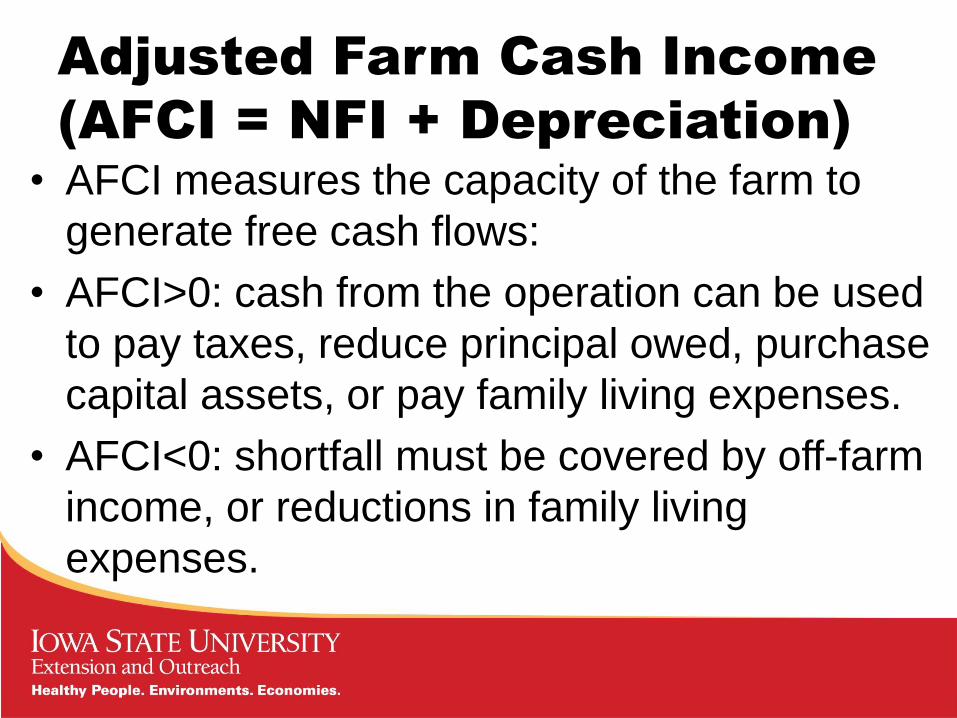
Adjusted Farm Cash Income
(AFCI = NFI + Depreciation)• AFCI measures the capacity of the farm to
generate free cash flows:
• AFCI>0: cash from the operation can be used
to pay taxes, reduce principal owed, purchase
capital assets, or pay family living expenses.
• AFCI<0: shortfall must be covered by off-farm
income, or reductions in family living
expenses.

Average NFI and Adjusted Farm Cash
Income (AFCI = NFI + Depreciation)
$45,597
$113,168
$0
$50,000
$100,000
$150,000
$200,000
$250,000
$300,000
NFI Accrual AFCI
Source: Iowa Farm Costs and Returns. Ag Decision Maker File C1-10. Various years.

Grouping of 527 farms
1) Ordered all farms from largest AFCI to smallest AFCI
2) Divided the sample into 5 equal groups:
Top 20%
Upper 20% to 40%
Middle 20%
Lower 20% to 40%
Lowest 20%

2016 Adjusted Farm Cash
Income per Acre ($)$274
$206
$157
$102
-$65
$164
Top 20% Upper 20%to 40%
Middle 20% Lower 20%to 40%
Lowest 20%
Cash Farm Income Quintiles Average
-10000%
-5000%
0%
5000%
10000%
15000%
20000%
25000%
30000%
RO
A (
Perc
ent)
Source: A.Plastina’s calculations based on IFBA data

Average Farm Size (Acres)
by 2016 AFCI Quintile
1,181
799 633
510 556
736
0
200
400
600
800
1,000
1,200
1,400
Top 20% Upper 20%to 40%
Middle 20% Lower 20%to 40%
Lowest 20%
Cash Farm Income Quintiles Average
Source: A.Plastina’s calculations based on IFBA data

2016 Total Expenses per Acre
$1,151
$864 $881 $910
$1,456
$1,055
0
200
400
600
800
1,000
1,200
1,400
1,600
Top 20% Upper 20%to 40%
Middle 20% Lower 20%to 40%
Lowest 20%
Cash Farm Income Quintiles Average
Tota
l Exp
ense
s
Source: A.Plastina’s calculations based on IFBA data

0%10%20%30%40%50%60%70%80%90%
100%
Top 20% Upper 20% to40%
Middle 20% Lower 20% to40%
Lowest 20% Average
Cash Farm Income Quintiles
Cash Grain Grain-Livestock Hog Beef Mixed
2016 Sources of AFCI by Group
Source: A.Plastina’s calculations based on IFBA data

2016 Cost of Debt and Interest
Expense Ratio by Group
3.7% 4.6%
7.4% 7.6%
15.8%
8.0%
4.2% 4.0% 4.9% 4.9%
13.0%
6.3%
0.00
0.02
0.04
0.06
0.08
0.10
0.12
0.14
0.16
0.18
Top 20% Upper 20%to 40%
Middle 20% Lower 20%to 40%
Lowest 20%
Cash Farm Income Quintiles Average
Cost of Debt (End)
Interest Expense Ratio
Source: A.Plastina’s calculations based on IFBA data
Interest Expense/Total Liabilities
Interest Expense/Gross Farm Revenue
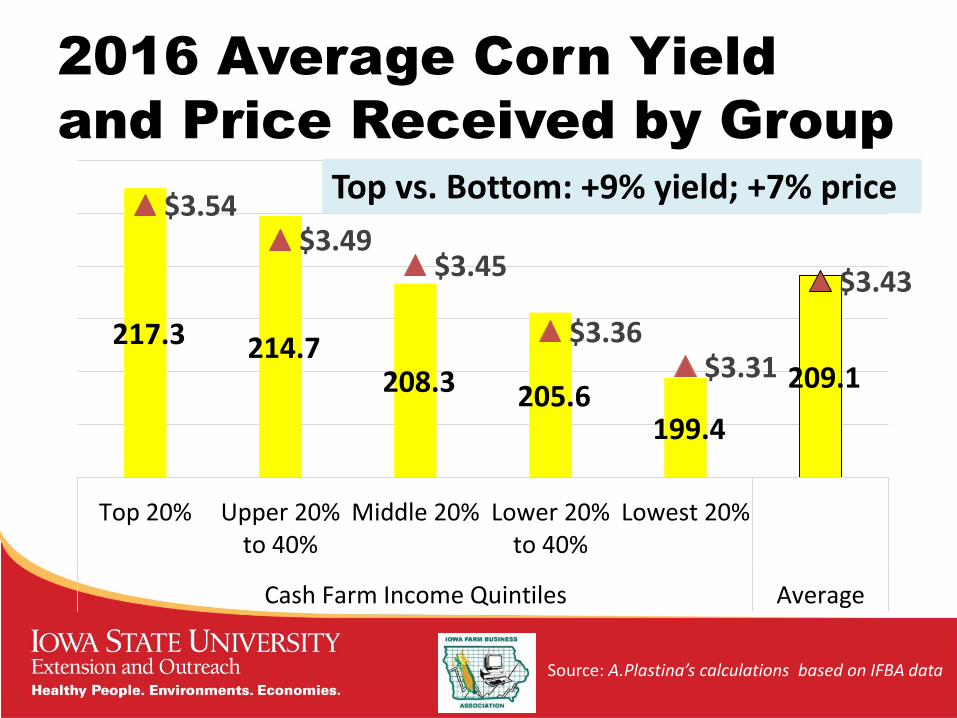
2016 Average Corn Yield
and Price Received by Group
217.3 214.7 208.3 205.6
199.4
209.1
$3.54$3.49
$3.45
$3.36$3.31
$3.43
$3.15
$3.20
$3.25
$3.30
$3.35
$3.40
$3.45
$3.50
$3.55
$3.60
190
195
200
205
210
215
220
Top 20% Upper 20%to 40%
Middle 20% Lower 20%to 40%
Lowest 20%
Cash Farm Income Quintiles Average
Pri
ce (
do
llare
s p
er b
ush
el)
Source: A.Plastina’s calculations based on IFBA data
Top vs. Bottom: +9% yield; +7% price

2016 Average Soybean Yield
and Price Received by Group
Source: A.Plastina’s calculations based on IFBA data
64.6 64.0 63.5
61.9 61.4
63.1
$9.25
$9.08 $9.09$9.05
$8.87
$9.07
$8.60
$8.70
$8.80
$8.90
$9.00
$9.10
$9.20
$9.30
59
60
61
62
63
64
65
Top 20% Upper 20%to 40%
Middle 20% Lower 20%to 40%
Lowest 20%
Cash Farm Income Quintiles Average
Pri
ce (
do
llare
s p
er b
ush
el)
Yiel
d (
bu
shel
s p
er a
cre)
Top vs. Bottom: +5% yield; +4% price

Average Liquidity in Dec 2016
$591 $597 $565
$401
$238
$508
Top 20% Upper 20% to40%
Middle 20% Lower 20% to40%
Lowest 20%
Cash Farm Income Quintiles Average
Working Capital per Acre
Source: A.Plastina’s calculations based on IFBA data
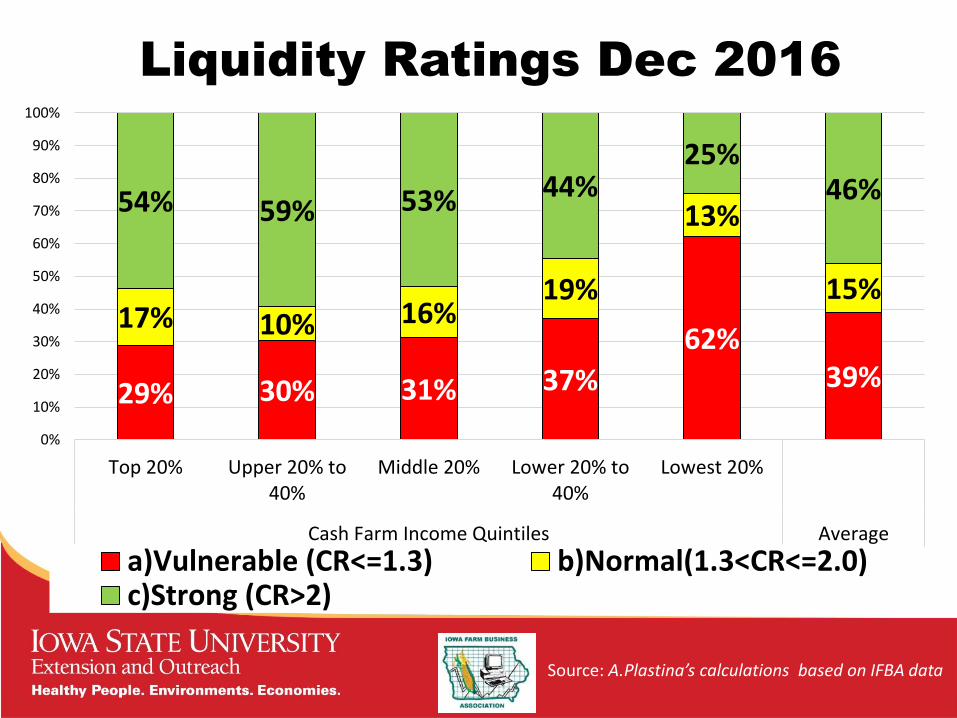
Liquidity Ratings Dec 2016
29% 30% 31% 37%
62%39%
17% 10% 16%19%
13%
15%
54% 59% 53% 44%25%
46%
0%
10%
20%
30%
40%
50%
60%
70%
80%
90%
100%
Top 20% Upper 20% to40%
Middle 20% Lower 20% to40%
Lowest 20%
Cash Farm Income Quintiles Average
a)Vulnerable (CR<=1.3) b)Normal(1.3<CR<=2.0)c)Strong (CR>2)
Source: A.Plastina’s calculations based on IFBA data

Average Solvency in Dec 2016
$2,798 $2,851$2,543 $2,477
$1,837
$2,577
Top 20% Upper 20%to 40%
Middle 20% Lower 20%to 40%
Lowest 20%
Cash Farm Income Quintiles Average
Farm Net Worth per Acre Farmed
Source: A.Plastina’s calculations based on IFBA data

Solvency Ratings Dec 2016
(Debt to Asset Ratio)
22%10% 16% 24%
47%25%
36%
34%45% 22%
25%
33%
42%56%
39%54%
29%43%
0%
10%
20%
30%
40%
50%
60%
70%
80%
90%
100%
Top 20% Upper 20% to40%
Middle 20% Lower 20% to40%
Lowest 20%
Cash Farm Income Quintiles Average
a)Vulnerable(DTA>60%) b)Normal(30%<DTA<=60%)c)Strong (DTA<=30%)
Source: A.Plastina’s calculations based on IFBA data

Percent of Vulnerable Farms
Dec 2016
19%8% 8%
19%
40%
20%
10%22% 23%
19%
22%
19%3% 2%8%
6%
7%
5%
0%
10%
20%
30%
40%
50%
60%
70%
Top 20% Upper 20%to 40%
Middle 20% Lower 20%to 40%
Lowest 20%
Cash Farm Income Quintiles Average
Liq & Solv Vulnerable
Only Liq Vulnerable
Only Solvency Vulnerable
Source: A.Plastina’s calculations based on IFBA data

Lower expenses per acre
Less Specialized in Livestock
Lower Cost of Debt and Interest Expense
Better Marketing
Better Yields
Higher liquidity
Higher solvency
2) What did successful
farms do differently in 2016?

Financial stress might affect…
Family living expenses /Repayment of loans
Local jobs
Local communities
Family relations / stress
Litigation
ISU Extension and Outreach Iowa Concern Hotline: 800-447-1985www.extension.iastate.edu/iowaconcern

Concerns for 2017 & 2018
• Low profitability margins
• A sizable share incurring cash losses
• 44% of all farms are financially vulnerable
• 70% of the farms in the bottom group are
financially vulnerable
• Liquidity problems are more widespread
than solvency problems

More Information
1. Financial stress in Iowa farms: 2014-2016. https://store.extension.iastate.edu/Product/15261
2. 2016 Iowa Farm Costs and Returns: https://www.extension.iastate.edu/agdm/wholefarm/pdf/c1-10.pdf
3. Financial Performance Measures for Iowa Farms: https://www.extension.iastate.edu/agdm/wholefarm/html/c3-55.html
4. ARC/PLC Payments by County in Iowa: http://card.iastate.edu/tools/farm-bill/arc-plc/

Thank you for your attention!
Questions?
Alejandro Plastina
Assistant Professor/Extension Economist
(515) 294-6160