Embed Size (px)
Citation preview

IOWA ANGLER SURVEY
Conducted for the Iowa Department of Natural Resources
by Responsive Management
2008
IOWA ANGLER SURVEY
2008
Responsive Management National Office Mark Damian Duda, Executive Director
Tom Beppler, Research Associate Steven J. Bissell, Ph.D., Qualitative Research Associate
Andrea Criscione, Research Associate Brad Hepler, Ph.D., Research Associate
James B. Herrick, Ph.D., Research Associate Martin Jones, Senior Research Associate
Alison Lanier, Business Manager Amanda Ritchie, Research Associate Carol L. Schilli, Research Associate
Tim Winegord, Survey Center Manager
130 Franklin Street Harrisonburg, VA 22801
Phone: 540/432-1888 Fax: 540/432-1892 E-mail: [email protected]
www.responsivemanagement.com

Acknowledgements
Responsive Management would like to thank Jeff Kopaska, Marion Conover, and Don Bonneau of the Iowa Department of Natural Resources for their input, support, and guidance on this
project.
Federal law prohibits employment discrimination on the basis of race, color, age, religion, national origin, sex, or disability. State law prohibits employment discrimination on the basis of race, color, creed, age, sex, sexual orientation, gender identity, national origin, religion, pregnancy, or disability. State law also prohibits public accommodation (such as access to services or physical facilities) discrimination on the basis of race, color, creed, religion, sex, sexual orientation, gender identity, religion, national origin, or disability. If you believe you have been discriminated against in any program, activity, or facility as described above, or if you desire further information, please contact the Iowa Civil Rights Commission, 1-800-457-4416.
Iowa Angler Survey i
EXECUTIVE SUMMARY INTRODUCTION AND METHODOLOGY This study was conducted for the Iowa Department of Natural Resources (IDNR) to learn about
anglers’ fishing preferences and behaviors, as well as their opinions on and attitudes toward the
IDNR and its programs. The study entailed a survey of Iowa anglers.
For the survey, telephones were selected as the preferred sampling medium because of the
universality of telephone ownership. The telephone survey questionnaire was developed
cooperatively by Responsive Management and the IDNR. Responsive Management conducted a
pre-test of the questionnaire and made revisions to the questionnaire based on the pre-test.
Interviews were conducted Monday through Friday from 9:00 a.m. to 9:00 p.m., Saturday noon
to 5:00 p.m., and Sunday from 5:00 p.m. to 9:00 p.m., local time. The survey was conducted in
November and December 2007. Responsive Management obtained a total of 1,649 completed
interviews. The software used for data collection was Questionnaire Programming Language.
The analysis of data was performed using Statistical Package for the Social Sciences software as
well as proprietary software developed by Responsive Management. The results were weighted
so that the proportions of the sample among the State’s regions matched the distribution of the
angler population statewide. The analysis included a crosstabulation of data by type of angler:
avid angler (purchased a license all 3 of the past 3 years) and casual angler (purchased a license
for only 1 or 2 of the past 3 years).
FISHING PARTICIPATION AND AVIDITY The overwhelming majority of anglers in the sample (80%) had fished within the previous 12
months. Additionally, the mean number of years that anglers had fished out of the past 3
years is 2.42 years.
• The crosstabulation by avid versus casual angler shows that avid anglers have a greater
measure of avidity: 95% of avid anglers (compared to 74% of casual anglers) had fished
in the last 12 months.

ii Responsive Management
Of those who had fished in the past year, the median number of days they fished was 10
days, and 56% had fished no more than 10 days; nonetheless, a substantial percentage (24%)
had fished for more than 20 days.
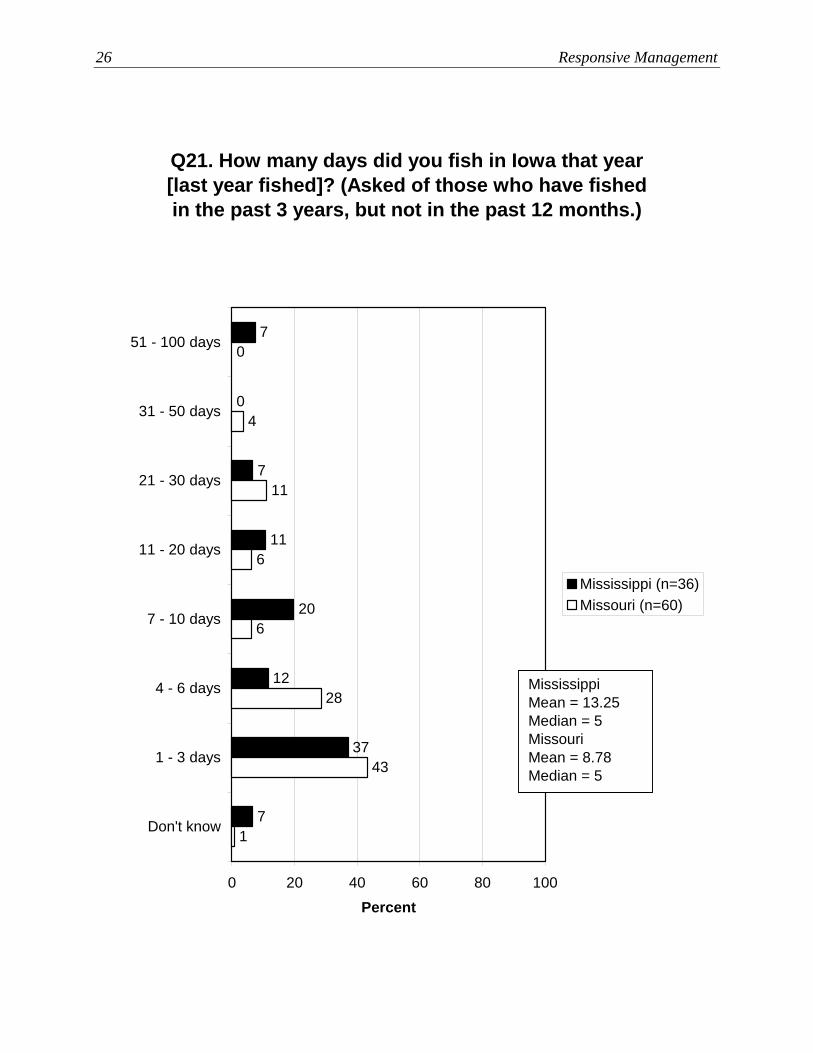
• Those who had not fished in the past year were asked about their number of days fishing
in the last year that they fished, with lower numbers than those who fished in the
previous year: their median number of days fishing was 5 days in the last year they
fished.
• The results of this question and the fishing participation question indicate that Iowa
anglers fished for 8.30 million days in Iowa in 2007.
• The crosstabulation by avid versus casual angler shows that avid anglers fished for more
days in the last year they went fishing compared to casual anglers.
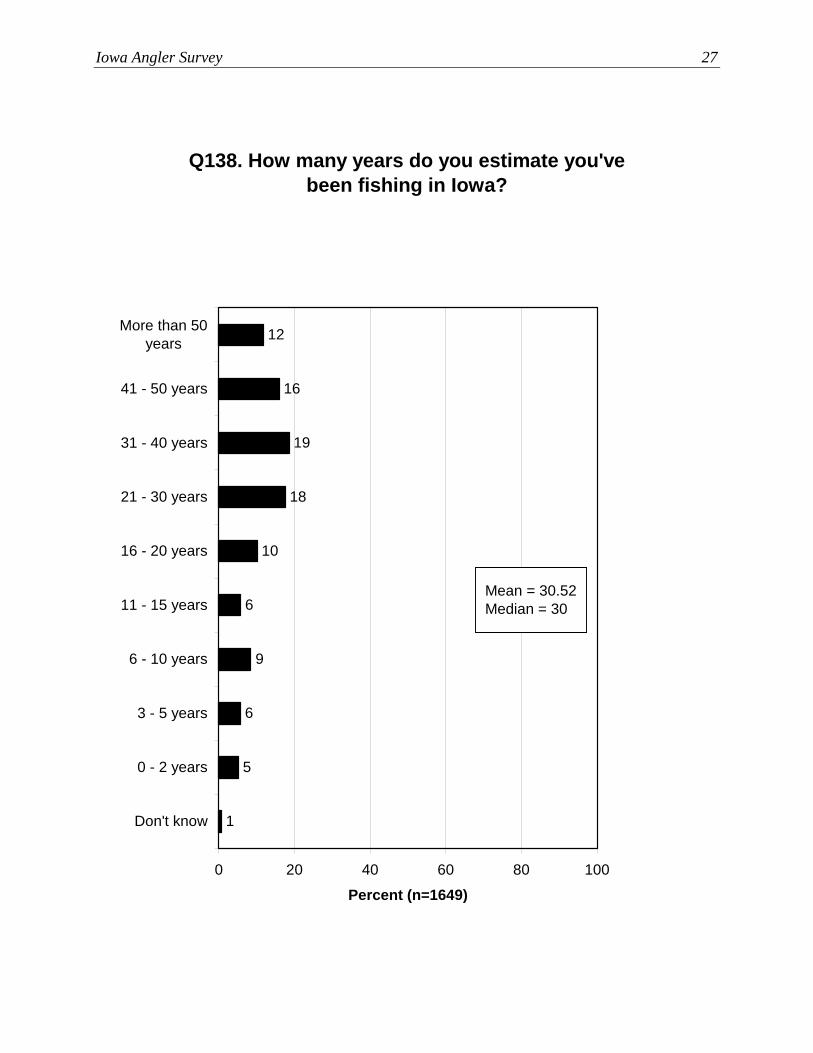
The survey asked Iowa anglers how many years they had fished in Iowa. The mean is 30.5
years.
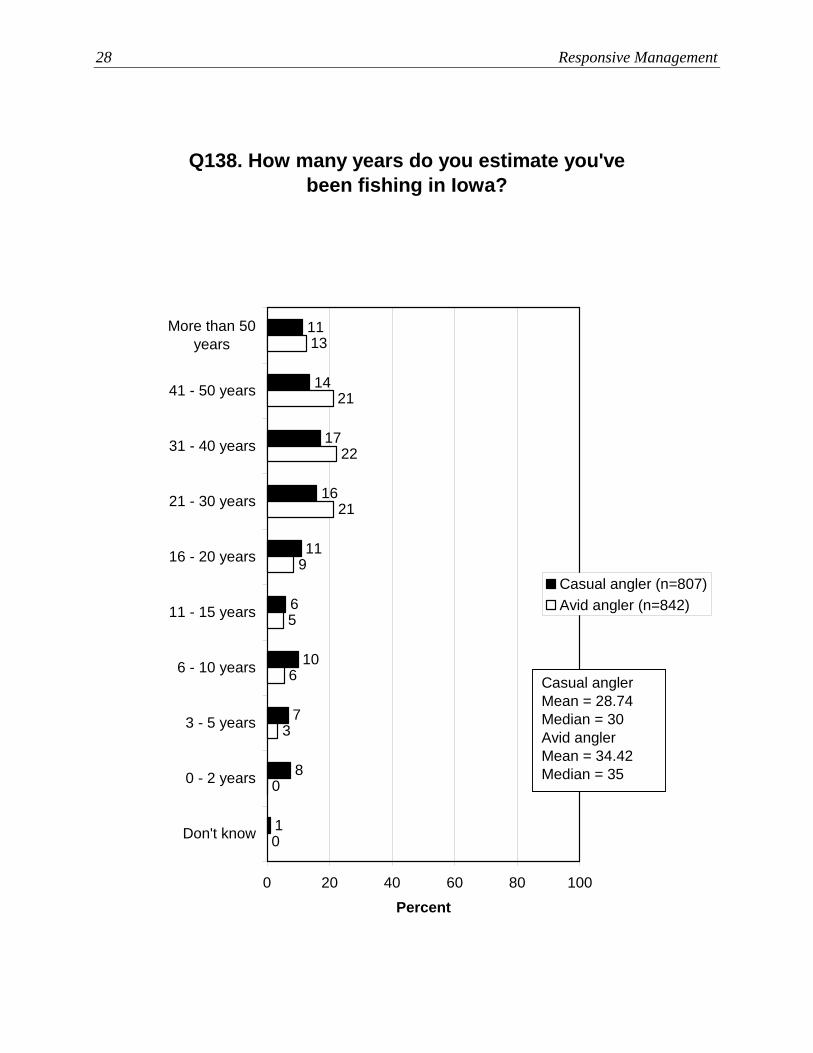
• The crosstabulation by avid versus casual angler shows that avid anglers tend to have
fished for more years than have casual anglers.
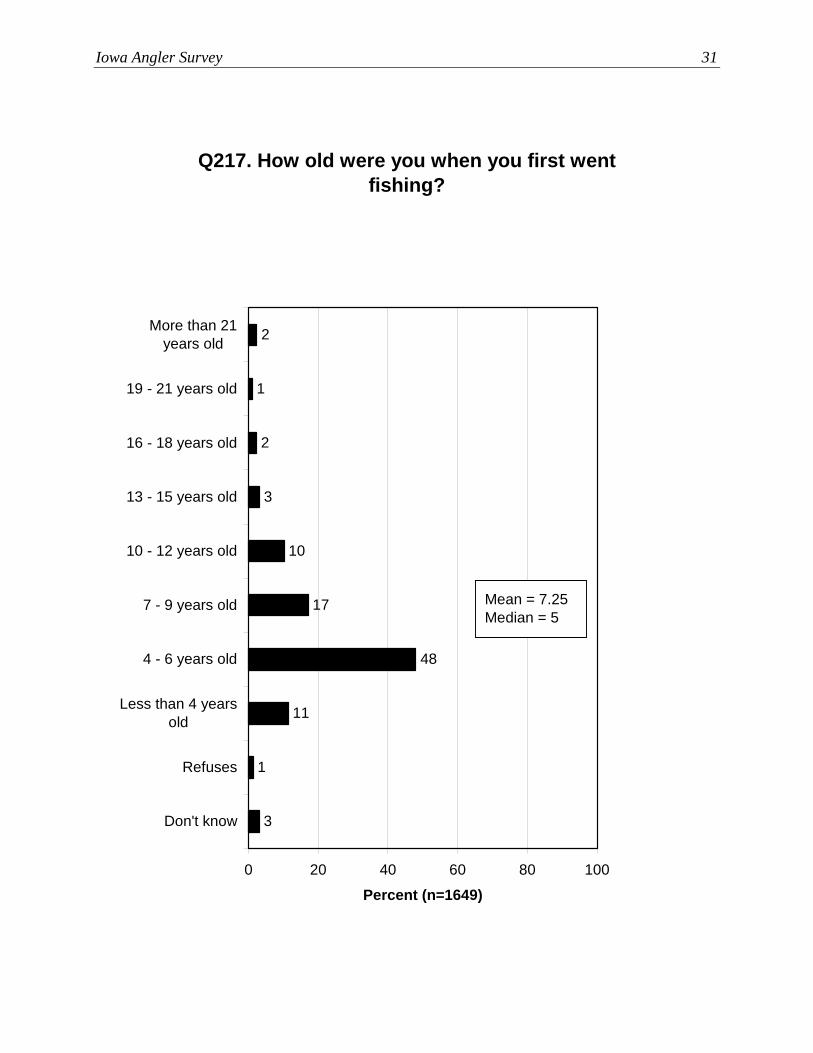
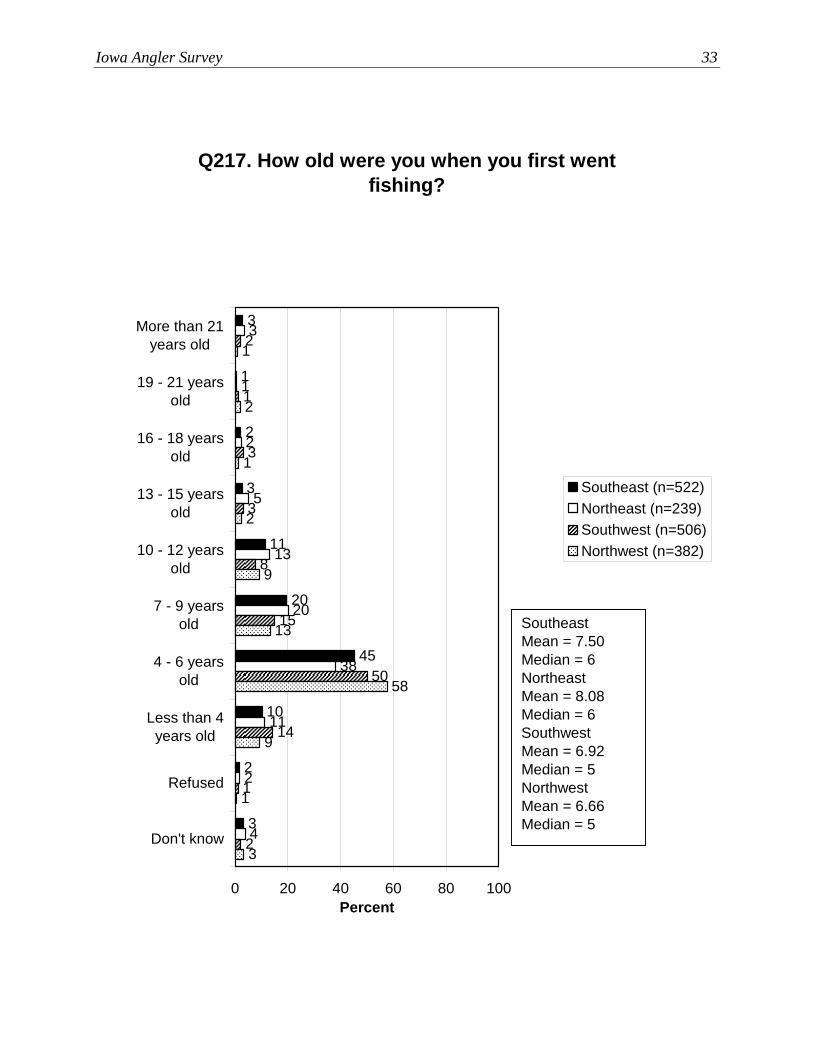
Nearly all anglers started fishing when they were children, typically prior to the age of 10.
Indeed, nearly half of anglers (48%) started when they were from 4 to 6 years old. The mean
age at which people first went fishing was 7.25 years old.
• The crosstabulation by avid versus casual angler shows that avid anglers typically started
fishing at a slightly younger age relative to casual anglers.
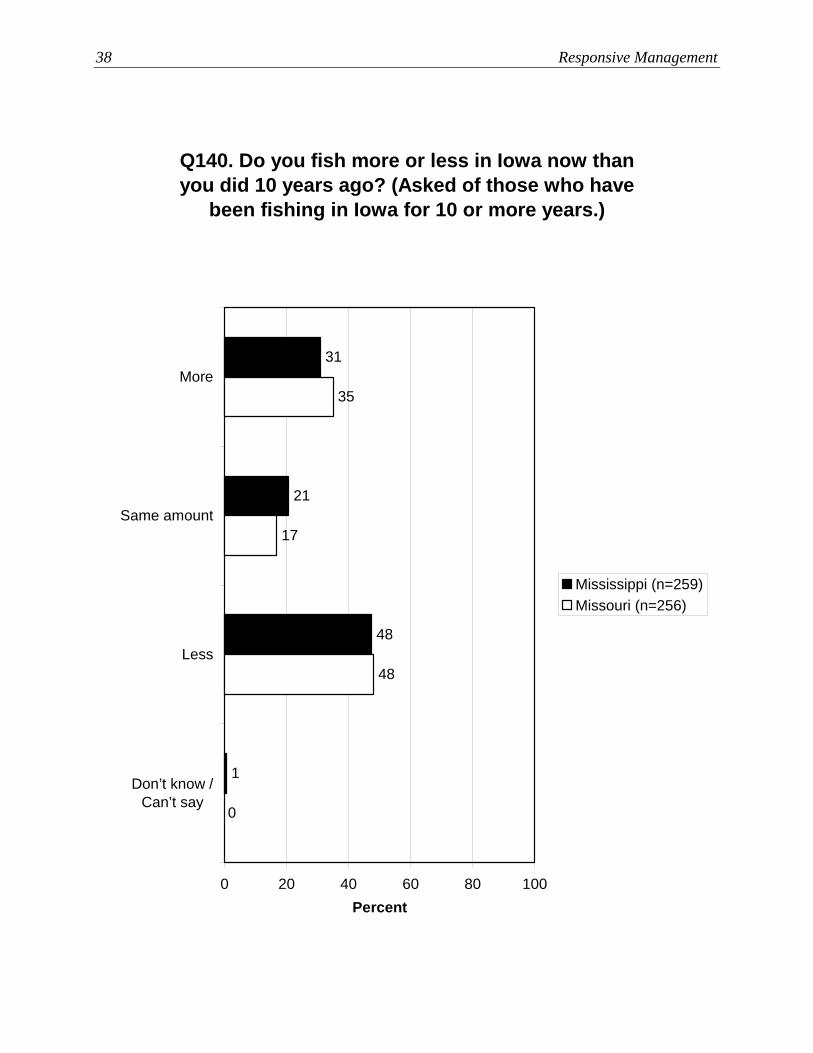
Those anglers who had fished for at least 10 years were asked about their amount of fishing
now compared to 10 years ago. A greater percentage of them currently fish less (44%) than
fish more (34%) when compared to 10 years ago.
• The crosstabulation by avid versus casual angler shows that avid anglers have a greater
likelihood to say that they now fish more than they did 10 years ago.
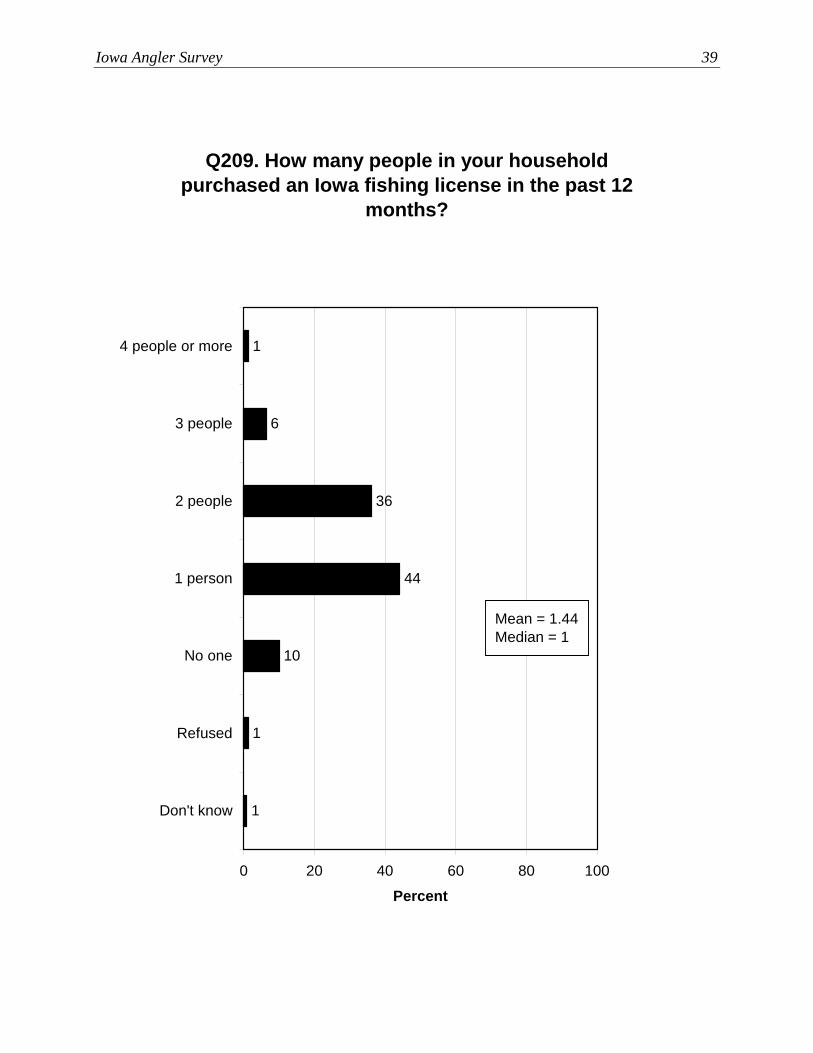
Respondents are evenly divided between those who live in a household where only 1 person
bought an Iowa fishing license in the past 12 months (44%) and those who live in a
Iowa Angler Survey iii
household in which 2 or more people purchased a fishing license (also 44%). Respondents
were asked how many people in their household went fishing in the past 12 months (the
above question asked only about purchasing a license): 32% said 1 person in their
household went fishing in the past 12 months, while 55% said 2 or more people went fishing
in Iowa in the past 12 months.
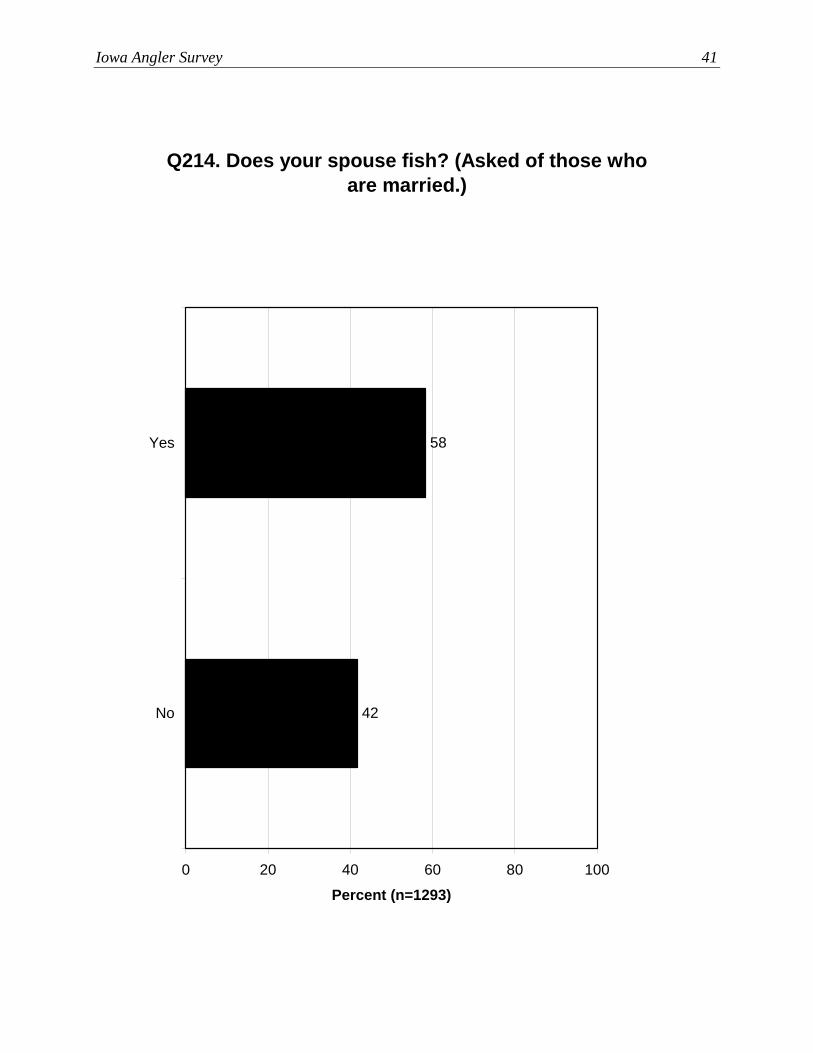
• Among married anglers, 58% say that their spouse fishes.
• In the crosstabulations by avid versus casual angler, the results show that avid anglers are
more likely than are casual anglers to live in a household where somebody bought a
fishing license and/or went fishing. Interestingly, however, avid anglers and casual
anglers are about the same regarding whether their spouse fishes.
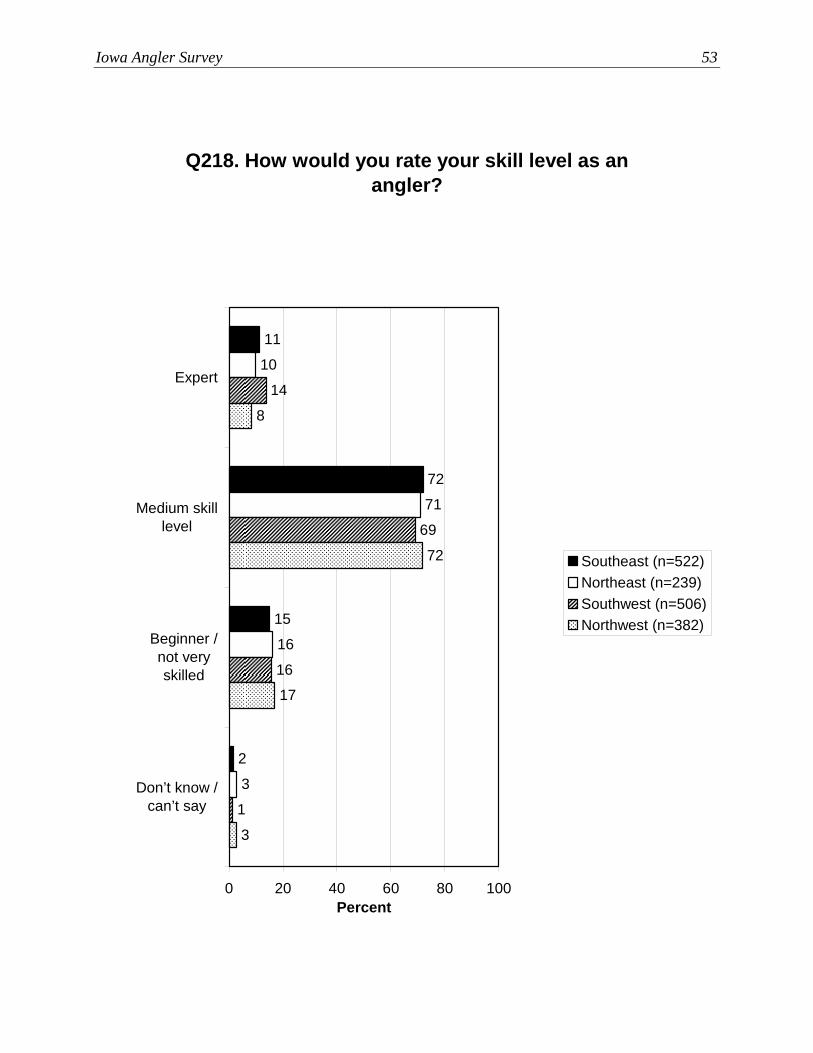
A question that tangentially relates to avidity is skill level. The large majority of Iowa
anglers (71%) rate their skill level as medium. Otherwise, a slightly higher percentage rate
themselves as beginner (16%) than rate themselves as expert (11%).
• Not surprisingly, avid anglers are more likely to rate themselves as expert at fishing than
are casual anglers.
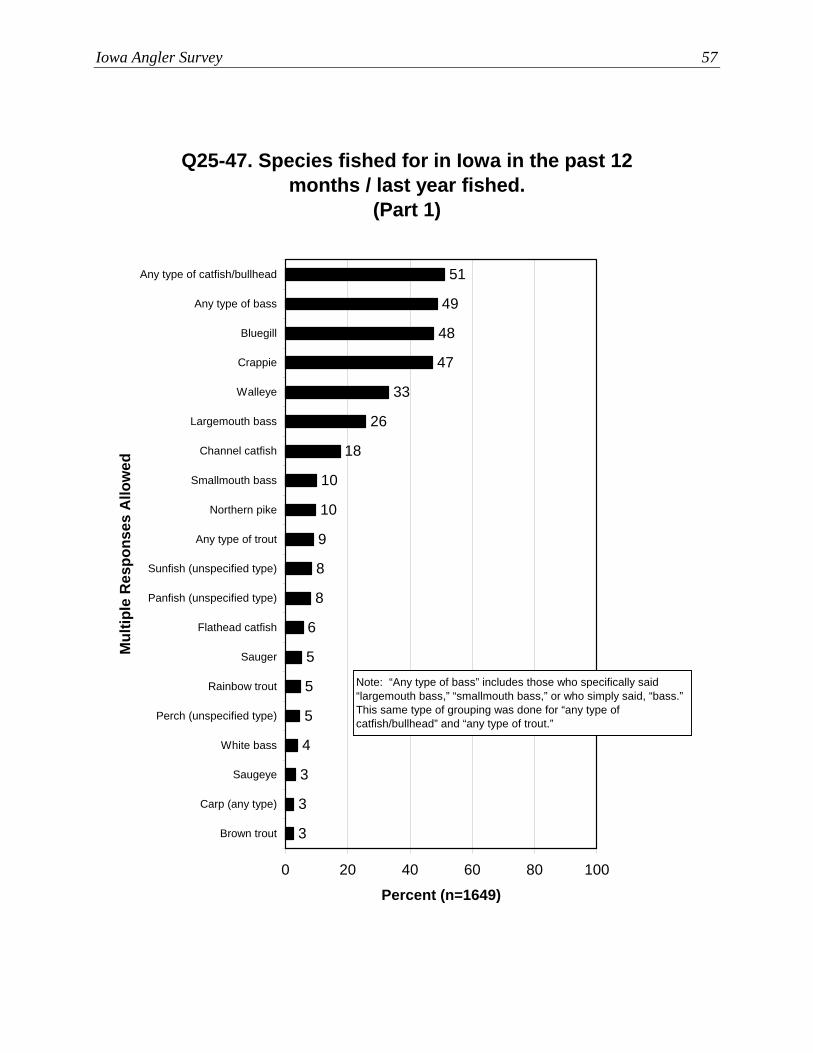
SPECIES FISHED AND PREFERRED The most-fished species of fish are catfish/bullhead (51% of anglers fished for these in the
previous 12 months or the last year they fished), bass (49%), bluegill (48%), and crappie
(47%)—the species that are most popular by far. Next in the ranking is walleye (33%), but
with a much lower percentage having fished for that species.
• An analysis was run of the species of fish sought by anglers in various types of water.
o Catfish, bass, bluegill, walleye, and crappie are the species most fished for in border
rivers.
o Catfish, bass, crappie, and walleye are the species most fished for in inland rivers.
o Trout is, by far, the species most fished for in trout streams.
o Walleye, catfish, bass, and crappie are the species most fished for in natural lakes.
o Crappie, catfish, and bass are the species most fished for in reservoirs.
o Bass, crappie, catfish, and bluegill are the species most fished for in constructed
lakes.

iv Responsive Management
o Bass, catfish, and crappie are the species most fished for in oxbow lakes.
o Bass, crappie, bluegill, and catfish are the species most fished for in farm
ponds/gravel pits.
Bass (49%) and catfish/bullhead (43%) are the types of fish that anglers most commonly say
they fish for most often in Iowa, distantly followed by crappie (16%), bluegill (12%),
walleye (9%), and trout (8%). (Note that the question in the bullet above asked for all fish
that anglers had fished for, while this question asked which single type of fish they most
often fished for in Iowa.)
• When anglers were asked which single species of fish they would prefer to fish for, their
answers closely mirror the fish that they most commonly fish for, with one notable
exception: preference for walleye (14% prefer walleye) exceeds actual fishing for it (9%
say that walleye is the species they most often fish for).
• The crosstabulations by avid versus casual angler shows that the two groups are similar in
the type of fish they most commonly fish for and the type they prefer, with a couple of
exceptions: avid anglers more often than casual anglers say their most-fished type is
crappie or walleye, and avid anglers more often say they prefer walleye.
METHODS OF FISHING The large majority of Iowa anglers (83%) fished from the shore at least some of the time,
while 62% fished from a boat, 46% fished from a pier or dock, and 11% waded while fishing
in Iowa in the past 12 months or last year they fished.
• Avid anglers are more likely than casual anglers to have fished from a boat, fished from a
pier or dock, or waded while fishing in the past 12 months or last year they fished.
A large majority of Iowa anglers (72%) did catch-and-release fishing at least some of the
time. Smaller amounts went ice fishing (15%) or fly fishing (7%) in Iowa in the past 12
months or last year they fished.
• Avid anglers are more likely than casual anglers to have done catch-and-release, gone ice
fishing, and gone fly fishing in the past 12 months or last year they fished in Iowa.
Iowa Angler Survey v
As indicated above, a large majority of Iowa anglers (72%) had done catch-and-release
fishing at least once in the last year they fished. Note that the survey was structured to
determine the amount of trout typically released versus non-trout released by those who
fished for trout and other species.
• Those who fished for trout and who indicated having done catch-and-release were asked
about the amount of trout they release: 66% release about half or more, while 30%
release few to none.
• Those same anglers (who fished for trout and other species and who indicated having
done catch-and-release) were asked about the amount of non-trout they release: 77%
release half or more, while 20% release few to none.
• Those anglers who did not fish for trout and who indicated having done catch-and-release
were asked about the amount of fish they release: 84% release half or more, while 15%
release few to none.
• Casual anglers are more likely to release fish—both trout and non-trout—than are avid
anglers on all three of these questions.
A previous section indicated that 62% of Iowa anglers had fished from a boat at least once in
the last year they fished.
• The majority of the anglers who had fished from a boat (70%) had done so for 10 days or
less in their most recent year of fishing.
• The crosstabulation by avid versus casual angler demonstrates that avid anglers fished
more days on a boat than did casual anglers.
Another question asked anglers who had fished from a boat about the amount of their fishing
that is done from a boat: 21% said all their fishing is from a boat, another 30% said that most
of their fishing is from a boat, and 20% said at least half is done that way, for a total of 71%
of “boater-anglers” doing at least half of their fishing from a boat.
• Avid anglers are more likely to fish from a boat most of their time than are casual
anglers.
vi Responsive Management
FISHING LOCATIONS AND PREFERRED LOCATIONS
The most commonly fished body of water was not a specific water body but a type of water body: the unnamed farm pond (or gravel pit, although nearly all responses within this category were “farm pond”), in which 27.1% of respondents fished. Otherwise, the Mississippi River (15.6%), the Cedar River (4.4%), Okoboji Lake (4.1%), Lake Red Rock (3.9%), Clear Lake in Cerro Gordo County (3.7%), the Wapsipinicon River (3.6%), Rathbun Lake (3.5%), Spirit Lake and/or Little Spirit Lake (3.4%), the Des Moines River (3.4%), and Big Creek (3.1%) were the most commonly fished bodies of water.
The questions regarding location of fishing included the county. Note that many anglers did
not know the county in which they most often fished. In some cases, the analyst was able to complete the county information because the water body the respondent named was known to be in a certain county; in other cases, however, the county information could not be completed. Nonetheless, the top counties for fishing are Dickinson (8.9% indicated that this was the county in which they most commonly fished), Polk (8.3%), Johnson (6.6%), Marion (5.0%), Linn (4.6%), Scott (4.5%), and Appanoose (4.1%).
The most commonly fished type of water body was constructed lake (35% named a
constructed lake as one of the two most fished bodies of water), followed by farm pond/gravel pit (27%), inland river (21%), border river (17%), natural lake (15%), reservoir (9%), trout stream (2%), and oxbow lake (2%).
The survey asked Iowa anglers to name their preferred body of water and county in which to
fish. Again, the top is a type of water body, not a specific one: 18.0% prefer an unnamed pond or gravel pit. Otherwise, the Mississippi River (10.1%), Clear Lake in Cerro Gordo County (2.6%), the Cedar River (2.5%), Okoboji Lake (2.2%), Spirit Lake or Little Spirit Lake (2.2%), Rathbun Lake (2.1%), and Lake Red Rock (2.0%) are the most preferred bodies of water. The most preferred counties are Dickinson (5.2%), Polk (4.6%), Johnson (4.1%), Marion (2.9%), and Clayton (2.6%).
The most preferred types of water body are farm pond/gravel pit (20% prefer this) and
constructed lake (also 20%), followed by border river (12%), inland river (11%), natural lake (10%), reservoir (6%), trout stream (1%), and oxbow lake (1%).
Iowa Angler Survey vii
While the large majority of Iowa anglers (60%) typically travel no more than 20 miles to fish
in Iowa, 16% typically travel more than 50 miles.
• The crosstabulation by avid versus casual angler found that avid anglers tend to drive a
little longer than casual anglers to fish in Iowa, but note that the difference is small.
MOTIVATIONS FOR FISHING The survey asked anglers about their most important reason for fishing out of a list of seven
reasons, and the order of the reasons read to the respondent was randomly changed to
eliminate bias in the answers. “For relaxation” was the most common reason for fishing
(34%), followed by “to be with family” (26%), and “for the sport” (16%). Note that in
general aesthetic reasons exceed utilitarian reasons for fishing.
• In the crosstabulation by avid versus casual angler, avid anglers are more likely to fish
“for the sport” than are casual anglers, while casual anglers are more likely to fish “to be
with family.”
The survey asked anglers whether fourteen specific things would increase their motivation to
go fishing. Two motivations stand out: being asked by a child to go fishing (93% said this
would increase their motivation to go fishing), and being invited by a friend (92%). Below
these is a grouping of items, many of which relate to the health of the fishery and good water
quality (all within the range of 67% to 75% saying the item would increase their motivation
to go fishing). Within this range also is having fishing offered as part of a vacation. Low
down on the ranking is having equipment made available, whether for rent or for free.
• For nearly every potential motivation, a greater percentage of avid anglers relative to
casual anglers say that it would increase their motivation to fish a lot.
CONSTRAINTS TO FISHING PARTICIPATION The survey asked anglers about 26 potential constraints on fishing participation, asking if
each was a major factor, a minor factor, or not a factor causing the respondent not to fish as
much as he/she wanted or took away from enjoyment of fishing. The top constraint, by far,
was lack of time because of work obligations (45% said this was a major factor), distantly
followed by lack of time because of family obligations (22%). Below these were poor water

viii Responsive Management
quality (13%), lack of fish to catch (10%), and the feeling that places outside of Iowa are
better for fishing (10%).
• Casual anglers were more likely than avid anglers to say that lack of time because of
family obligations was a major factor. On the other hand, avid anglers were more likely
to say that poor behavior of other recreationists excluding anglers was a major factor. In
looking at major and minor factors combined, casual anglers were more likely than avid
anglers to say that lack of skill or lack of interest was a factor. Meanwhile, avid anglers
were more likely than casual anglers to say that poor behavior of other recreationists
(both anglers and non-anglers) was a factor, that interference from others was a factor,
and that lack of access was a factor.
The survey asked if the price of gas had negatively affected anglers’ fishing, and 14%
indicated that it negatively affected their fishing participation “a great deal.” In total, 29%
indicated that it had affected their fishing “a little” or “a great deal.”
• The crosstabulation by avid versus casual angler found that avid anglers were more likely
to be affected by the price of gas.
• A crosstabulation found that those who typically travel farther were more likely to be
affected by the price of gas.
In a direct question regarding trends in water quality over the past 10 years, a third of anglers
(33%) say that water quality is worse now compared to 10 years ago. For these people, water
quality may be a constraint.
RATINGS OF FISHING AND FISHERIES MANAGEMENT IN IOWA The majority of Iowa anglers (66%) rate fishing in Iowa as excellent or good (most of those
saying good), while 32% rate it as fair or poor (most of those saying fair).
The majority of Iowa anglers (63%) rate public access to Iowa’s rivers and streams for
fishing as excellent or good (mostly good), while 26% rate such access as fair or poor
(mostly fair). Regarding access to lakes, the majority of Iowa anglers (76%) rate public

Iowa Angler Survey ix
access to Iowa’s lakes for fishing as excellent or good (mostly good), while 15% rate access
to lakes as fair or poor (mostly fair).
• The survey asked specifically about public access to the Mississippi and Missouri Rivers.
For both questions, most anglers indicate that they cannot say/don’t know. Otherwise,
many more give good or excellent ratings than give fair or poor ratings for both rivers.
The majority of Iowa anglers (72%) rate the IDNR as excellent or good in managing fishing
and fisheries in Iowa (most of those saying good), while 16% rate the IDNR as fair or poor
(most of those saying fair).
The large majority of Iowa anglers (77%) rate Iowa’s enforcement of fishing regulations and
laws as excellent or good (most of those saying good), while only 14% rate Iowa’s
enforcement as fair or poor (most of those saying fair).
• In related questions, the majority of Iowa anglers describe fishing management in Iowa as
regulated the right amount (77%). Otherwise, more of them said, “Don’t know” (12%),
than said that fishing was over- or under-regulated. Also, the overwhelming majority of
Iowa anglers (84%) describe Iowa’s fishing regulations as clear, while only 7% describe
them as confusing.
The survey asked those anglers who have fished in Iowa for at least 10 years to rate whether
Iowa’s fishing is better or worse now compared to 10 years ago. A greater percentage think
that fishing is currently better (30%) than think it is currently worse (23%). The most
common answer is that fishing is the same now as compared to 10 years ago (36%).
• The crosstabulation by avid versus casual angler found that avid anglers are slightly more
likely to say that fishing is better now.
Anglers were asked about water quality now compared to 10 years ago, and they are about
evenly divided: 30% think it is better now than it was 10 years ago, while 33% think it is
worse now.
• The crosstabulation by avid versus casual angler found that avid anglers are slightly more
likely to say that water quality is better now.
x Responsive Management
The overwhelming majority of Iowa anglers (78%) agree, after being informed that one of
the uses of funds from license fees is to improve Iowa’s fishing, that anglers are currently
getting their money’s worth for those fees; only 11% disagree.
RATINGS OF IMPORTANCE OF IOWA DEPARTMENT OF NATURAL RESOURCES PROGRAMS AND EFFORTS
The survey asked anglers to rate the importance of eight IDNR efforts related to fishing, on a
scale of 0 to 10, with 10 being the most important. All the means are high in importance,
ranging from 8.07 to 9.07, with protecting water quality (9.07) and conserving streams and
rivers (8.75) at the top. In looking at the percentage giving a rating of 9 or 10, again,
protecting water quality (73% of anglers rated it at a 9 or 10) and conserving streams and
rivers (62%) are at the top, followed by protecting endangered fish species (55%) and
controlling invasive species (52%). Enforcing boating regulations also has a majority rating
it a 9 or 10 (51%).
OPINIONS ON PANFISH REGULATIONS IN IOWA A large majority of Iowa anglers (65%) support having the IDNR set a daily creel limit on
the number of panfish that anglers can take. In a related question, 63% disagree that anglers
should be allowed to take all the panfish that they can harvest for consumption.
• In follow-up questions, anglers were asked to name the appropriate amount of panfish
that an angler should take (not legally limited, but ethically limited) in the absence of a
legal limit: the mean was 16.7 panfish, and respondents most commonly gave a limit in
the range of 6 to 10 panfish. The results were similar when respondents were asked to
name the limit that should be legally set, if the IDNR chooses to set a limit.
CONTACT WITH DEPARTMENT OF NATURAL RESOURCES’ LAW ENFORCEMENT PERSONNEL
The majority of Iowa anglers (57%) have had contact with an IDNR enforcement officer
while fishing. Just more than half (51%) have been checked for a fishing license by an IDNR
officer.
• Avid anglers are more likely than casual anglers to have had contact with an IDNR
officer while fishing, and they are more likely to have been checked for a license.
Iowa Angler Survey xi
CONSUMPTION OF FISH CAUGHT IN IOWA The large majority of Iowa anglers (80%) eat (or their family members eat) the fish they
catch at least some of the time.
• Most commonly, those who consume fish they have caught have about 3 to 5 meals per
year of fish they have caught.
• Avid anglers more often than casual anglers eat (or their family members more often eat)
the fish they catch, and they typically eat more meals in a year of fish they have caught.
• The results of these questions indicate that Iowa anglers consumed approximately
4.57 million meals of Iowa-caught fish in 2007.
The overwhelming majority of those who consume fish that they have caught (88%) consider
Iowa’s fish to be safe for eating; however, a small percentage (7%) consider Iowa’s fish to be
unsafe for eating. Most of those who consume fish that they have caught do not limit their
consumption based on safety concerns about eating the fish caught in Iowa. Nonetheless,
16% of such anglers limit their consumption at least a little because of safety concerns.
• In a related question, 49% of Iowa’s anglers have been aware of at least one fish advisory
about eating fish from Iowa waters.
• Avid anglers are just slightly more likely to have heard/seen a fish advisory, relative to
casual anglers.
SOURCES OF INFORMATION ABOUT FISHING IN IOWA When asked directly about whether they had ever visited the IDNR’s website, 41% of Iowa
anglers indicated that they had visited the site. Just more than half of those respondents
visited the site for a fishing-related reason.
• The crosstabulation by avid versus casual angler found that avid anglers are more likely
to have visited the website.
• Commonly sought information includes fishing locations and regulations (the two
answers markedly higher than the others), as well as the site’s fishing reports, license
information, fishing survey reports, and stocking reports.
• About 1 in 10 of those going to the site for a fishing-related reason bought a license
on-line.

xii Responsive Management
• Other common sources of information among all anglers include word-of-mouth (34%),
IDNR publications (21%), the IDNR website (15%), other publications (12%), magazines
not otherwise listed (12%), Iowa Game & Fish magazine (10%), newspapers (10%), and
Iowa Outdoors magazine (8%).
• The crosstabulation by avid versus casual angler found that casual anglers more often get
information by word-of-mouth relative to avid anglers. On the other hand, avid anglers
more often get information from the IDNR website and IDNR publications.
• The regional crosstabulation shows no marked differences among the regions on this
question.
• It appears that the river region anglers get information from word-of-mouth more often
than do anglers overall. There is little difference between the two river regions.
URBAN TROUT FISHERIES Of those who fished for trout, about half (48%) purchased a trout stamp specifically for an
urban trout fishery.
AWARENESS OF LAKE PROTECTION OR IMPROVEMENT EFFORTS IN IOWA Just more than a third of Iowa anglers (37%) are aware of at least one lake protection or
improvement effort undertaken in Iowa by the IDNR.
• Avid anglers are more aware than are casual anglers of lake protection or improvement
efforts undertaken in Iowa by the IDNR.
AQUATIC INVASIVE SPECIES IN IOWA While most Iowa anglers (60%) are unaware of any invasive species, a substantial percentage
are aware of something: 22% mentioned zebra mussels, 9% mentioned carp or Asian carp,
and 8% mentioned milfoil.
• Avid anglers are more aware of invasive species than are casual anglers, particularly
zebra mussels and milfoil.
• The majority of those who have fished from a boat and are aware of invasive species take
steps to prevent the spread of invasive species. Those who did not take preventive steps

Iowa Angler Survey xiii
most commonly said that they do not believe invasive species are a problem, that they did
not boat on infested waters, or that they do not know what to do.
• Avid anglers who have fished from a boat and are aware of invasive species are more
likely than their casual angler counterparts to take preventive action regarding spread of
invasive species. Additionally, among those who do not take steps, avid anglers are less
likely to say that they do not believe invasive species are a problem, and they are less
likely to say that they do not know what to do, relative to casual anglers who do not take
preventive steps.

xiv Responsive Management
TABLE OF CONTENTS Introduction and Methodology ........................................................................................................1 Fishing Participation and Avidity ....................................................................................................8 Species Fished and Preferred, and Methods of Fishing.................................................................55
Species Fished and Preferred.................................................................................................55 Methods of Fishing................................................................................................................84
Methods of Fishing in General......................................................................................84 Catch-and-Release Fishing ...........................................................................................93 Fishing from a Boat.....................................................................................................104
Fishing Locations and Preferred Locations .................................................................................115 Motivations for Fishing................................................................................................................129 Constraints To Fishing Participation ...........................................................................................143 Ratings of Fishing and Fisheries Management in Iowa...............................................................161 Ratings of Importance of Iowa Department of Natural Resources Programs and Efforts...........223 Opinions on Panfish Regulations in Iowa....................................................................................232 Contact with Department of Natural Resources’ Law Enforcement Personnel ..........................249 Consumption of Fish Caught in Iowa ..........................................................................................259 Sources of Information About Fishing in Iowa ...........................................................................281 Miscellaneous Issues Pertaining to Fishing in Iowa ....................................................................304
Urban Trout Fisheries..........................................................................................................304 Awareness of Lake Protection or Improvement Efforts in Iowa.........................................308 Aquatic Invasive Species in Iowa........................................................................................313
Demographic Data .......................................................................................................................324 About Responsive Management ..................................................................................................359

Iowa Angler Survey 1
INTRODUCTION AND METHODOLOGY This study was conducted for the Iowa Department of Natural Resources (IDNR) to learn about
anglers’ fishing preferences and behaviors, as well as their opinions on and attitudes toward the
IDNR and its programs. The study entailed a telephone survey of Iowa anglers who had
purchased an Iowa fishing license within the 3 years previous to the survey. Specific aspects of
the research methodology are discussed below.
For the survey, telephones were selected as the preferred sampling medium because of the
universality of telephone ownership. In addition, a central polling site at the Responsive
Management office allowed for rigorous quality control over the interviews and data collection.
Responsive Management maintains its own in-house telephone interviewing facilities. These
facilities are staffed by interviewers with experience conducting computer-assisted telephone
interviews on the subjects of natural resources and outdoor recreation. The telephone survey
questionnaire was developed cooperatively by Responsive Management and the IDNR.
Responsive Management conducted a pre-test of the questionnaire and made revisions to the
questionnaire based on the pre-test.
To ensure the integrity of the telephone survey data, Responsive Management has interviewers
who have been trained according to the standards established by the Council of American Survey
Research Organizations. Methods of instruction included lecture and role-playing. The Survey
Center Managers and other professional staff conducted project briefings with the interviewers
prior to the administration of this survey. Interviewers were instructed on type of study, study
goals and objectives, handling of survey questions, interview length, termination points and
qualifiers for participation, interviewer instructions within the survey instrument, reading of the
survey instrument, skip patterns, and probing and clarifying techniques necessary for specific
questions on the survey instrument. The Survey Center Managers and statisticians monitored the
data collection, including monitoring of the actual telephone interviews without the interviewers’
knowledge, to evaluate the performance of each interviewer and ensure the integrity of the data.
After the surveys were obtained by the interviewers, the Survey Center Managers and/or
statisticians edited each completed survey to ensure clarity and completeness.
2 Responsive Management
Interviews were conducted Monday through Friday from 9:00 a.m. to 9:00 p.m., Saturday noon
to 5:00 p.m., and Sunday from 5:00 p.m. to 9:00 p.m., local time. A five-callback design was
used to maintain the representativeness of the sample, to avoid bias toward people easy to reach
by telephone, and to provide an equal opportunity for all to participate. When a respondent
could not be reached on the first call, subsequent calls were placed on different days of the week
and at different times of the day. The survey was conducted in November and December 2007.
Responsive Management obtained a total of 1,649 completed interviews.
The software used for data collection was Questionnaire Programming Language 4.1 (QPL).
The survey data were entered into the computer as each interview was being conducted,
eliminating manual data entry after the completion of the survey and the concomitant data entry
errors that may occur with manual data entry. The survey instrument was programmed so that
QPL branched, coded, and substituted phrases in the survey based on previous responses to
ensure the integrity and consistency of the data collection. The analysis of data was performed
using Statistical Package for the Social Sciences software as well as proprietary software
developed by Responsive Management.
The results were weighted so that the proportions of the sample among the State’s regions (by
respondents’ counties of residence, not by the locations of respondents’ fishing) matched the
distribution of the angler population statewide. The IDNR expressed interest in regional data
among four state regions, as well as river-specific data for the Missouri and Mississippi River
regions. The regions of interest overlapped: portions of the Missouri River Region are in both
the Northwest Region and the Southwest Region of the state, and portions of the Mississippi
River Region are in both the Northeast Region and the Southeast Region of the state. The map
that follows shows the regional breakdowns.

Iowa Angler Survey 3
To be able to obtain enough sample in each region for analyses, some regions had to be
oversampled; subsequently, their data were weighted down when presenting results of anglers as
a whole statewide or as a whole within a particular region. The sampling plan accounted for the
four statewide regions as well as the river regions by partitioning the state into eight regions
(e.g., “Northwest, Non-Missouri Region” and “Northwest, Missouri Region”). The counties of
each of the eight regions are listed on the following page.
4 Responsive Management
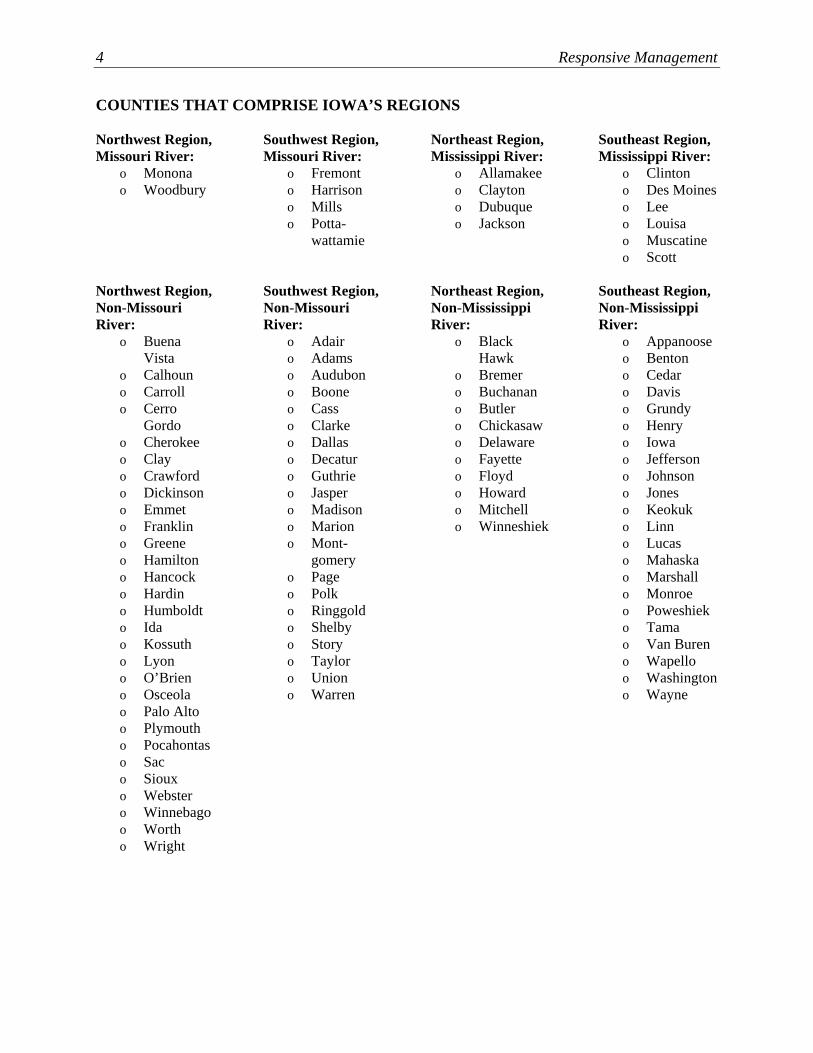
COUNTIES THAT COMPRISE IOWA’S REGIONS Northwest Region, Missouri River:
o Monona o Woodbury
Northwest Region, Non-Missouri River:
o Buena Vista
o Calhoun o Carroll o Cerro
Gordo o Cherokee o Clay o Crawford o Dickinson o Emmet o Franklin o Greene o Hamilton o Hancock o Hardin o Humboldt o Ida o Kossuth o Lyon o O’Brien o Osceola o Palo Alto o Plymouth o Pocahontas o Sac o Sioux o Webster o Winnebago o Worth o Wright
Southwest Region, Missouri River:
o Fremont o Harrison o Mills o Potta-
wattamie Southwest Region, Non-Missouri River:
o Adair o Adams o Audubon o Boone o Cass o Clarke o Dallas o Decatur o Guthrie o Jasper o Madison o Marion o Mont-
gomery o Page o Polk o Ringgold o Shelby o Story o Taylor o Union o Warren
Northeast Region, Mississippi River:
o Allamakee o Clayton o Dubuque o Jackson
Northeast Region, Non-Mississippi River:
o Black Hawk
o Bremer o Buchanan o Butler o Chickasaw o Delaware o Fayette o Floyd o Howard o Mitchell o Winneshiek
Southeast Region, Mississippi River:
o Clinton o Des Moines o Lee o Louisa o Muscatine o Scott
Southeast Region, Non-Mississippi River:
o Appanoose o Benton o Cedar o Davis o Grundy o Henry o Iowa o Jefferson o Johnson o Jones o Keokuk o Linn o Lucas o Mahaska o Marshall o Monroe o Poweshiek o Tama o Van Buren o Wapello o Washington o Wayne
Iowa Angler Survey 5
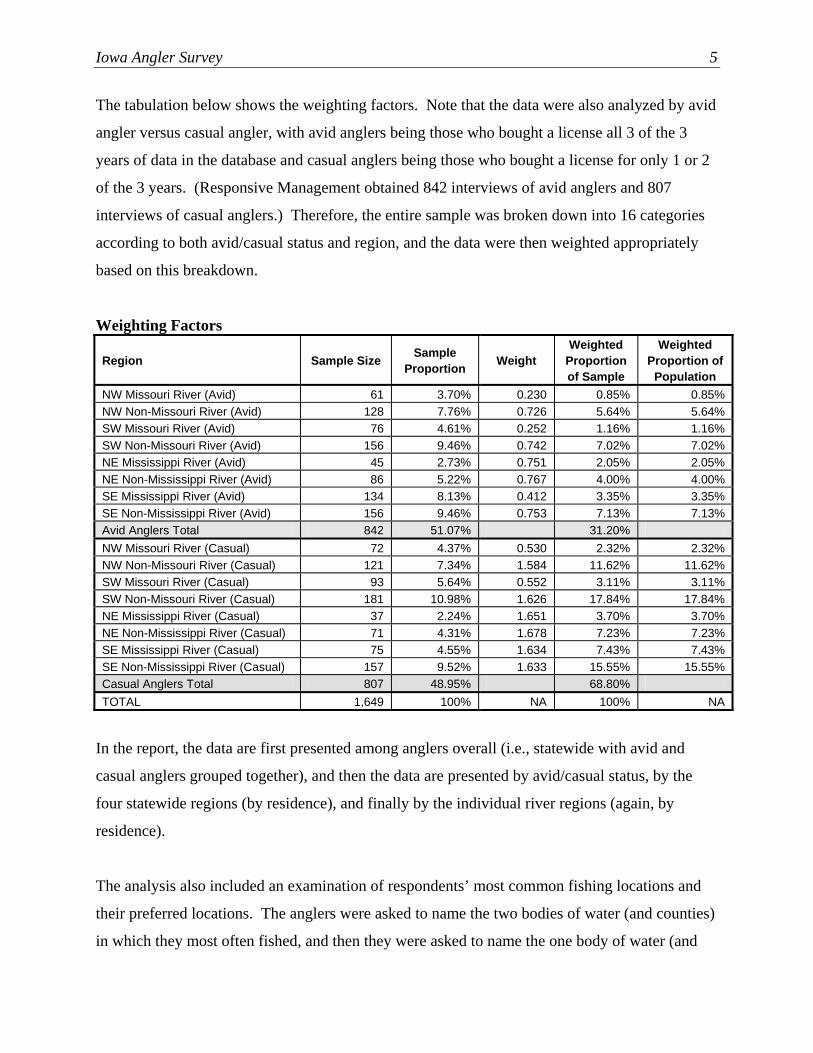
The tabulation below shows the weighting factors. Note that the data were also analyzed by avid
angler versus casual angler, with avid anglers being those who bought a license all 3 of the 3
years of data in the database and casual anglers being those who bought a license for only 1 or 2
of the 3 years. (Responsive Management obtained 842 interviews of avid anglers and 807
interviews of casual anglers.) Therefore, the entire sample was broken down into 16 categories
according to both avid/casual status and region, and the data were then weighted appropriately
based on this breakdown.
Weighting Factors
Region Sample Size Sample Proportion Weight
Weighted Proportion of Sample
Weighted Proportion of
Population NW Missouri River (Avid) 61 3.70% 0.230 0.85% 0.85%NW Non-Missouri River (Avid) 128 7.76% 0.726 5.64% 5.64%SW Missouri River (Avid) 76 4.61% 0.252 1.16% 1.16%SW Non-Missouri River (Avid) 156 9.46% 0.742 7.02% 7.02%NE Mississippi River (Avid) 45 2.73% 0.751 2.05% 2.05%NE Non-Mississippi River (Avid) 86 5.22% 0.767 4.00% 4.00%SE Mississippi River (Avid) 134 8.13% 0.412 3.35% 3.35%SE Non-Mississippi River (Avid) 156 9.46% 0.753 7.13% 7.13%Avid Anglers Total 842 51.07% 31.20% NW Missouri River (Casual) 72 4.37% 0.530 2.32% 2.32%NW Non-Missouri River (Casual) 121 7.34% 1.584 11.62% 11.62%SW Missouri River (Casual) 93 5.64% 0.552 3.11% 3.11%SW Non-Missouri River (Casual) 181 10.98% 1.626 17.84% 17.84%NE Mississippi River (Casual) 37 2.24% 1.651 3.70% 3.70%NE Non-Mississippi River (Casual) 71 4.31% 1.678 7.23% 7.23%SE Mississippi River (Casual) 75 4.55% 1.634 7.43% 7.43%SE Non-Mississippi River (Casual) 157 9.52% 1.633 15.55% 15.55%Casual Anglers Total 807 48.95% 68.80% TOTAL 1,649 100% NA 100% NA
In the report, the data are first presented among anglers overall (i.e., statewide with avid and
casual anglers grouped together), and then the data are presented by avid/casual status, by the
four statewide regions (by residence), and finally by the individual river regions (again, by
residence).
The analysis also included an examination of respondents’ most common fishing locations and
their preferred locations. The anglers were asked to name the two bodies of water (and counties)
in which they most often fished, and then they were asked to name the one body of water (and
6 Responsive Management
county) in which they preferred to fish. These data were captured in an open-ended format,
where respondents could name any body of water, and then the answers were later matched to
actual bodies of water (using a list provided from various sources of approximately 1,000 bodies
of water in Iowa) and the spellings were standardized (e.g., “Miss River” and “MS River” were
both renamed in the data as “Mississippi River”; “okobogee” and “okaboji” were renamed in the
data as “Okoboji Lake”). In addition, the analysis accounted for names of bodies of water that
were used in more than one county (e.g., there is a “Clear Lake” in Cerro Gordo County and one
in Pocahontas County). Note that this analysis entailed examining approximately 4,800 entries.
Note that many of the bodies of water do not have names (e.g., “farm pond”) and are in the data
as “Unnamed pond or gravel pit”; in other cases, respondents did not know the name of the body
of water or did not know the county in which a body of water was located. In some cases, the
county information could be completed by the analyst (e.g., Belvadeer Lake is known to be in
Keokuk County, so for respondents who fished in Belvadeer Lake but did not know the county,
the analyst was able to complete the county information in the data set). In other cases, the
analyst could not complete the information, and these had to be entered into the data set as
“unknown”; note that every attempt was made, however, to complete the data.
The analysis included a look at the types of fish sought and preferred. Again, the data had to be
standardized to account for multiple names of the same fish (e.g., silver bass, striped bass,
stripers, white bass, and wipers are all considered white bass; drum, white perch, and sheephead
are all considered drum).
Note that for this project, two separate nonparametric analyses were performed to examine how
the various responses related to behavioral, participatory and demographic characteristics; one
analysis was among avid anglers, and the second nonparametric analysis was among casual
anglers. These analyses are presented in a separate document that is a companion to this report
titled, Iowa Angler Survey: Nonparametric Analyses.
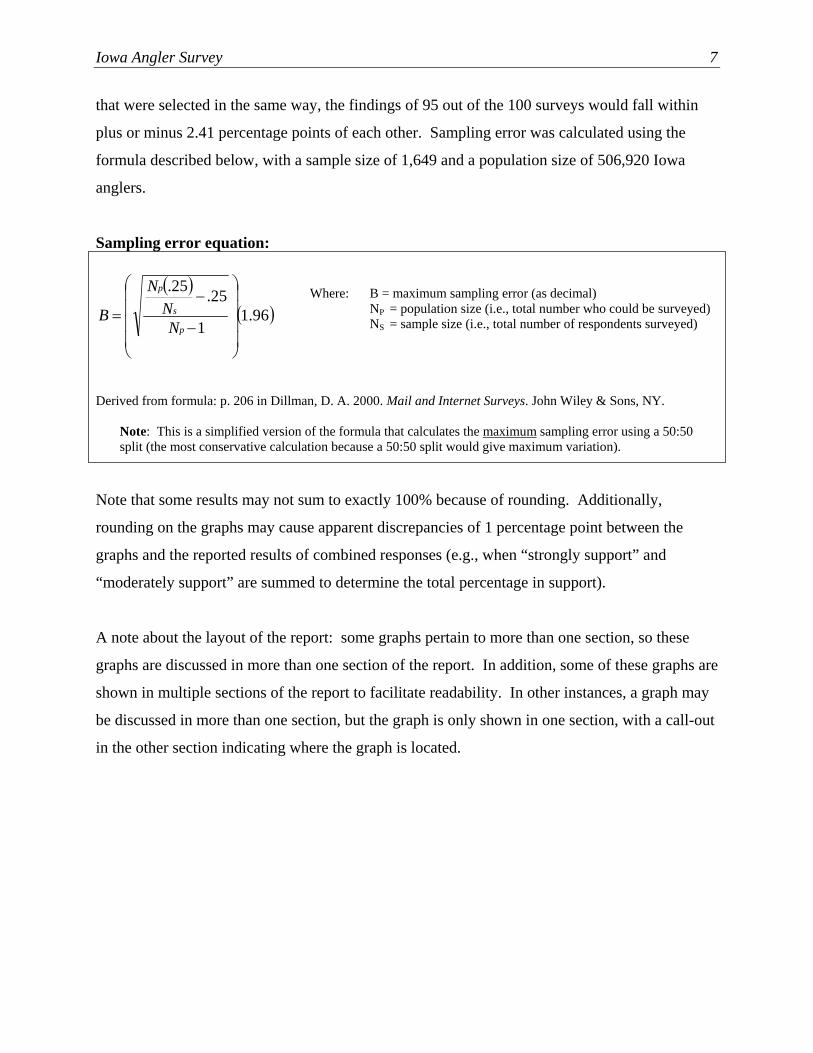
Throughout this report, findings of the telephone survey are reported at a 95% confidence
interval. For the entire sample of Iowa anglers, the sampling error is at most plus or minus 2.41
percentage points. This means that if the survey were conducted 100 times on different samples
Iowa Angler Survey 7
that were selected in the same way, the findings of 95 out of the 100 surveys would fall within
plus or minus 2.41 percentage points of each other. Sampling error was calculated using the
formula described below, with a sample size of 1,649 and a population size of 506,920 Iowa
anglers.
Sampling error equation:
( )( )96.1
1
25.25.
⎟⎟⎟⎟
⎠
⎞
⎜⎜⎜⎜
⎝
⎛
−
−=
p
s
p
NN
N
B
Derived from formula: p. 206 in Dillman, D. A. 2000. Mail and Internet Surveys. John Wiley & Sons, NY.
Note: This is a simplified version of the formula that calculates the maximum sampling error using a 50:50 split (the most conservative calculation because a 50:50 split would give maximum variation).
Note that some results may not sum to exactly 100% because of rounding. Additionally,
rounding on the graphs may cause apparent discrepancies of 1 percentage point between the
graphs and the reported results of combined responses (e.g., when “strongly support” and
“moderately support” are summed to determine the total percentage in support).
A note about the layout of the report: some graphs pertain to more than one section, so these
graphs are discussed in more than one section of the report. In addition, some of these graphs are
shown in multiple sections of the report to facilitate readability. In other instances, a graph may
be discussed in more than one section, but the graph is only shown in one section, with a call-out
in the other section indicating where the graph is located.
Where: B = maximum sampling error (as decimal) NP = population size (i.e., total number who could be surveyed) NS = sample size (i.e., total number of respondents surveyed)

8 Responsive Management
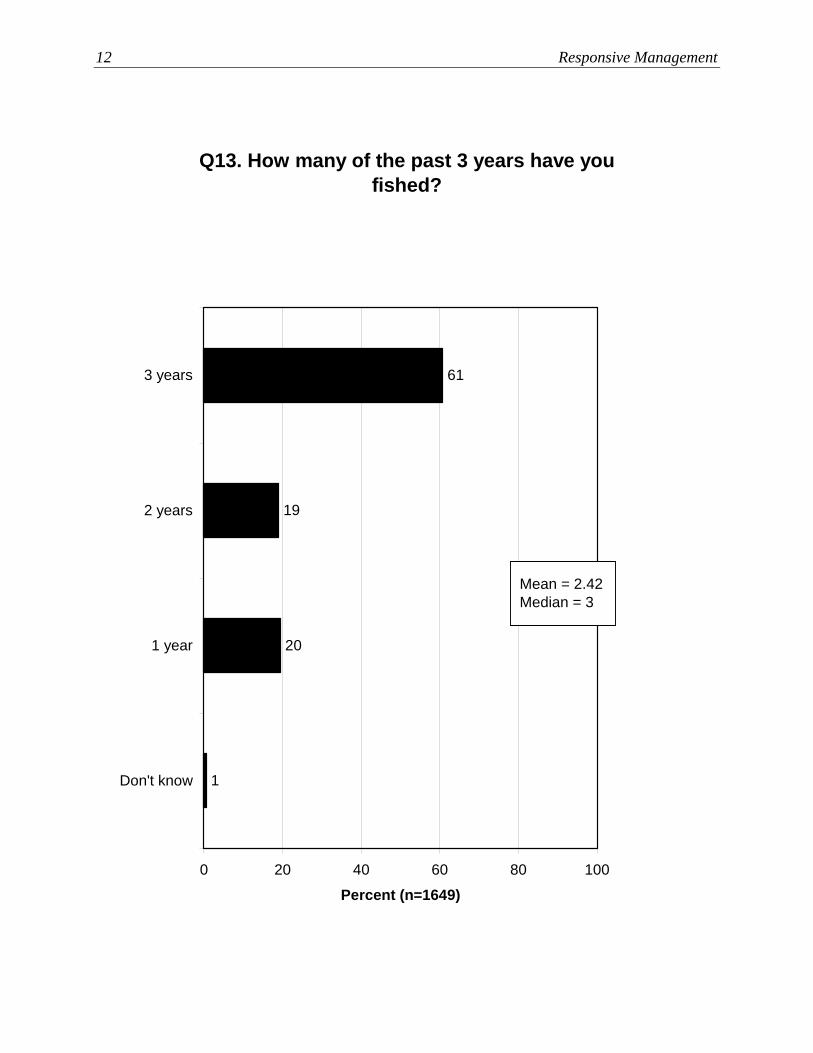
FISHING PARTICIPATION AND AVIDITY The overwhelming majority of anglers in the sample (80%) had fished within the previous 12
months. Additionally, the mean number of years that anglers had fished out of the past 3
years is 2.42 years.
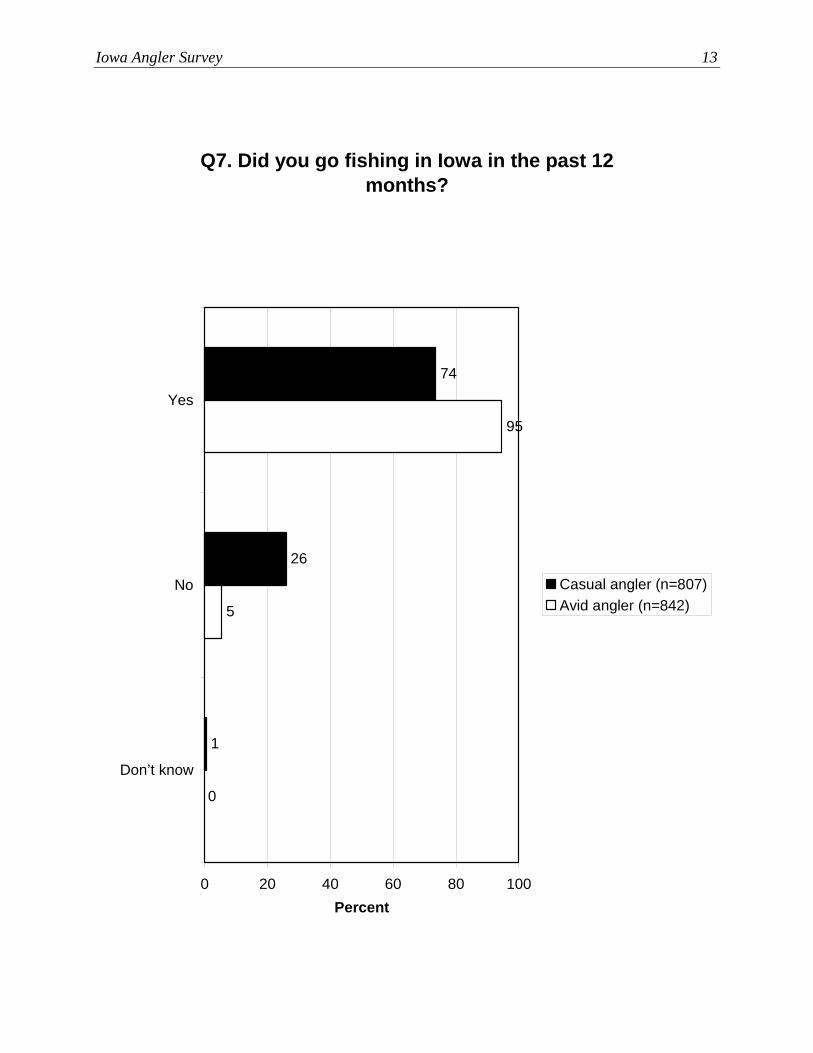
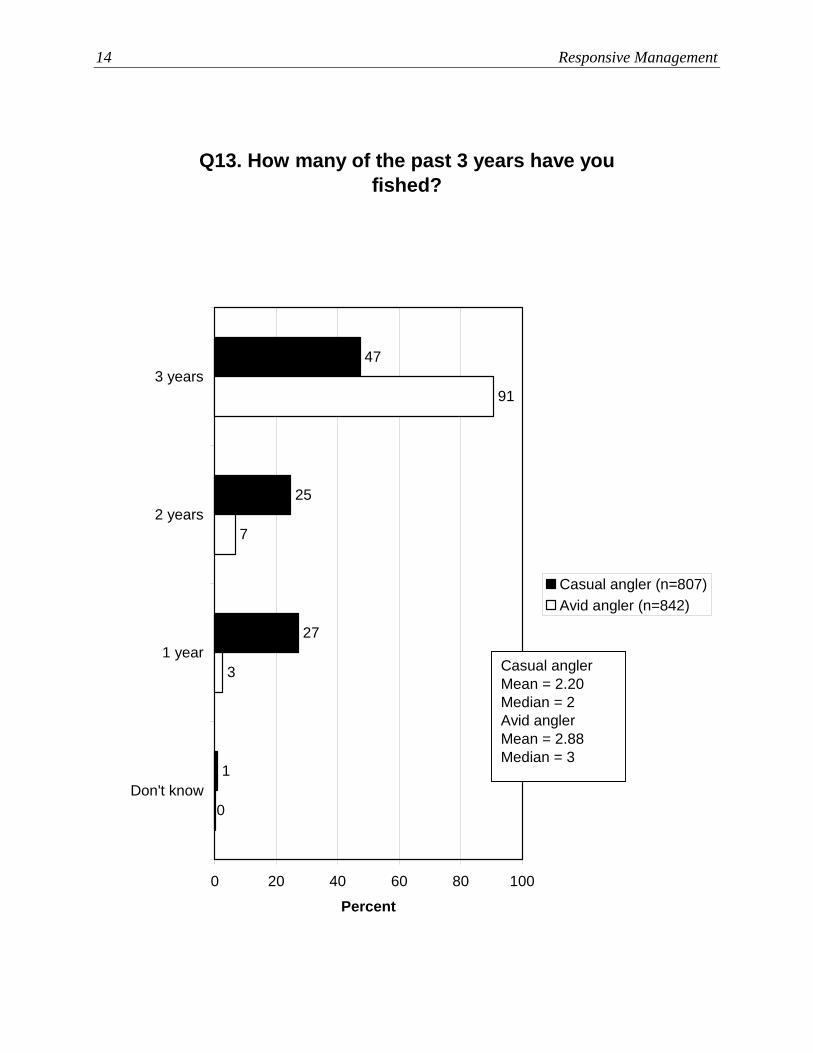
• The crosstabulation by avid versus casual angler shows that avid anglers have a greater
measure of avidity: 95% of avid anglers (compared to 74% of casual anglers) had fished
in the last 12 months. Also shown is the graph for number of the last 3 years the
respondents fished.
• The regional crosstabulations show no marked differences among the regions on these
questions.
• Anglers from the two river regions are not markedly different than anglers overall
regarding whether they had fished in the past 12 months and regarding the number of the
past 3 years they had fished.
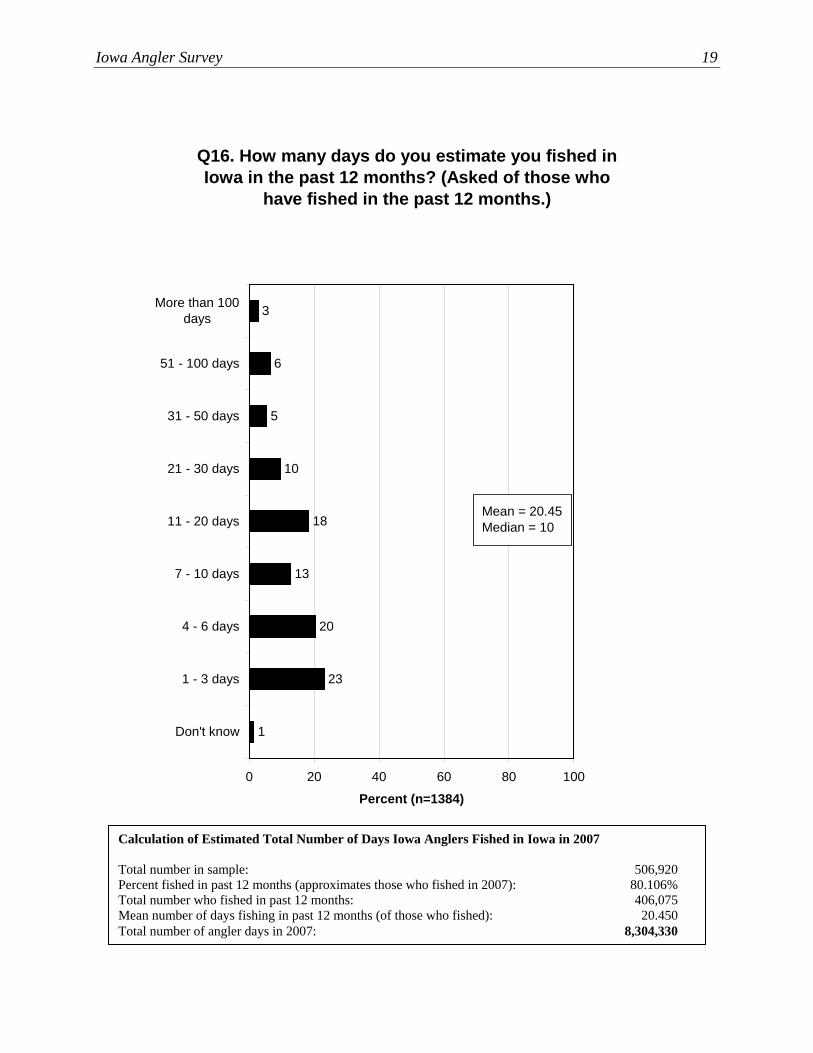
Of those who had fished in the past year, the median number of days they fished was 10
days, and 56% had fished no more than 10 days; nonetheless, a substantial percentage (24%)
had fished for more than 20 days.
• The results of this question and the fishing participation question indicate that Iowa
anglers fished for 8.30 million days in Iowa in 2007.
• Those who had not fished in the past year were asked about their number of days fishing
in the last year that they fished, with lower numbers than those who fished in the
previous year: 77% fished no more than 10 days, and only 12% fished for more than 20
days, in the last year they fished. Their median number of days fishing was 5 days in the
last year they fished.
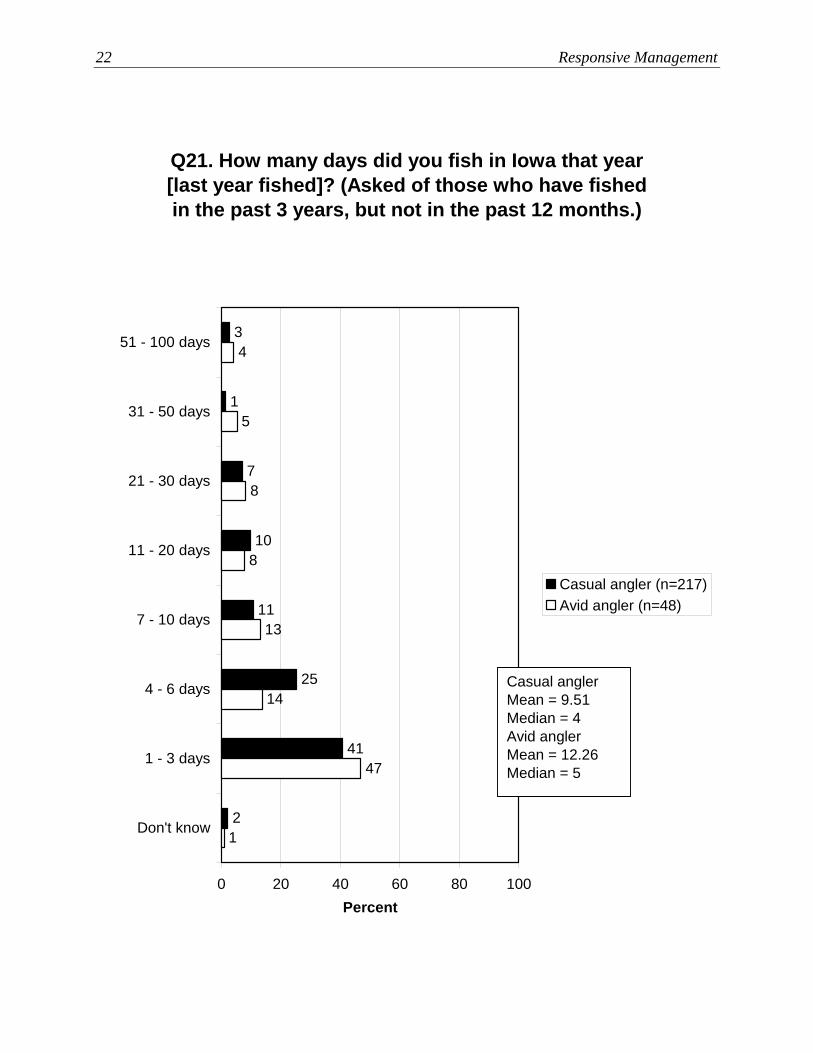
• The crosstabulation by avid versus casual angler shows that avid anglers fished for more
days in the last year they went fishing compared to casual anglers.
• The regional crosstabulation shows only small differences in the days fished in the last
year that the respondent fished.
• The data analysis by river regions shows that Mississippi River Region anglers are
slightly more avid than are Missouri River Region anglers and anglers overall.
Iowa Angler Survey 9
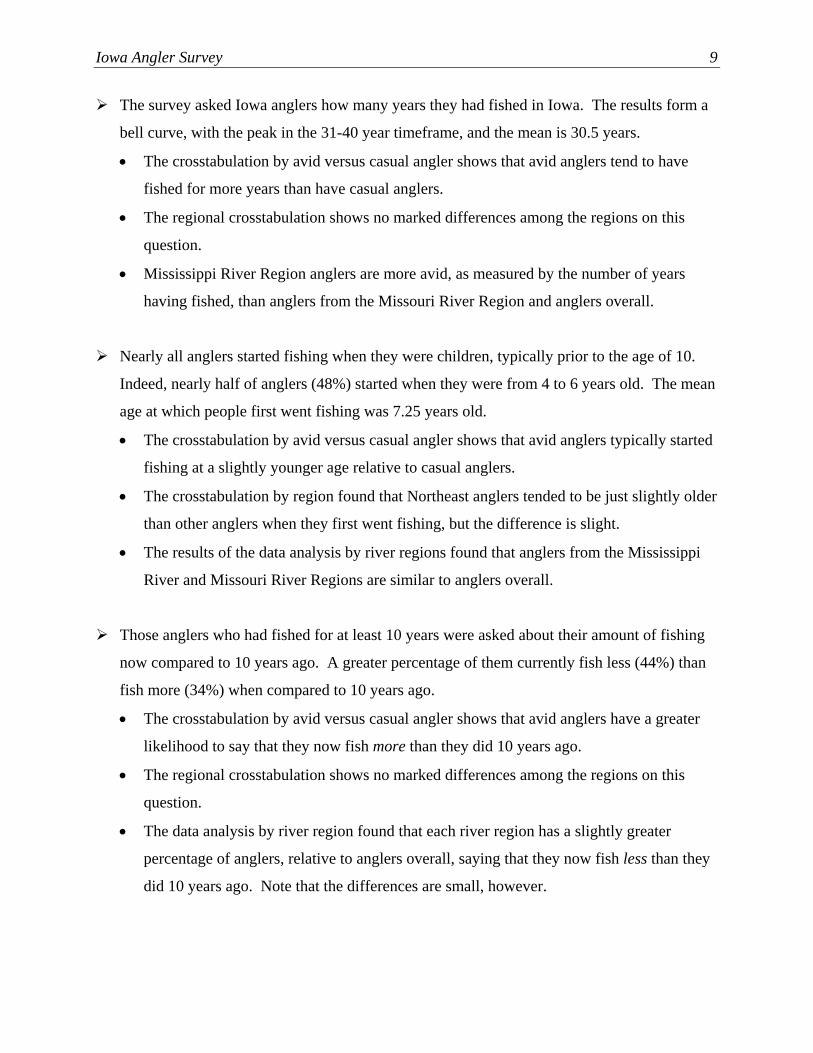
The survey asked Iowa anglers how many years they had fished in Iowa. The results form a
bell curve, with the peak in the 31-40 year timeframe, and the mean is 30.5 years.
• The crosstabulation by avid versus casual angler shows that avid anglers tend to have
fished for more years than have casual anglers.
• The regional crosstabulation shows no marked differences among the regions on this
question.
• Mississippi River Region anglers are more avid, as measured by the number of years
having fished, than anglers from the Missouri River Region and anglers overall.
Nearly all anglers started fishing when they were children, typically prior to the age of 10.
Indeed, nearly half of anglers (48%) started when they were from 4 to 6 years old. The mean
age at which people first went fishing was 7.25 years old.
• The crosstabulation by avid versus casual angler shows that avid anglers typically started
fishing at a slightly younger age relative to casual anglers.
• The crosstabulation by region found that Northeast anglers tended to be just slightly older
than other anglers when they first went fishing, but the difference is slight.
• The results of the data analysis by river regions found that anglers from the Mississippi
River and Missouri River Regions are similar to anglers overall.
Those anglers who had fished for at least 10 years were asked about their amount of fishing
now compared to 10 years ago. A greater percentage of them currently fish less (44%) than
fish more (34%) when compared to 10 years ago.
• The crosstabulation by avid versus casual angler shows that avid anglers have a greater
likelihood to say that they now fish more than they did 10 years ago.
• The regional crosstabulation shows no marked differences among the regions on this
question.
• The data analysis by river region found that each river region has a slightly greater
percentage of anglers, relative to anglers overall, saying that they now fish less than they
did 10 years ago. Note that the differences are small, however.
10 Responsive Management
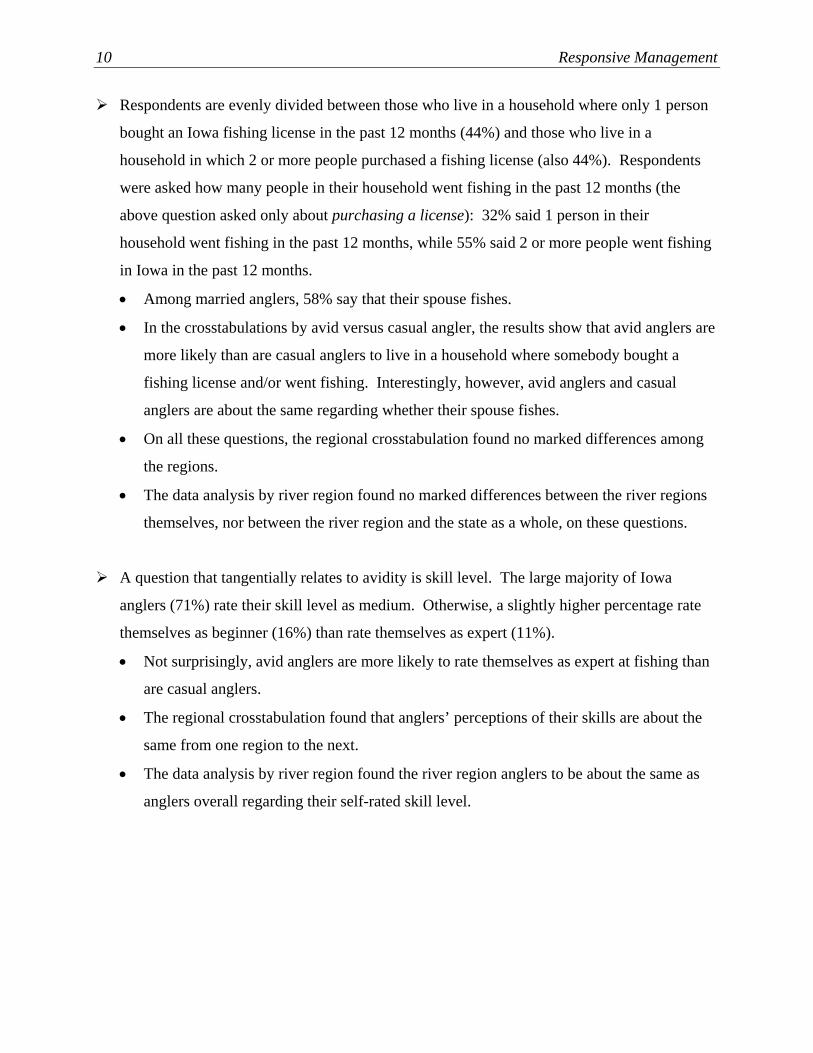
Respondents are evenly divided between those who live in a household where only 1 person
bought an Iowa fishing license in the past 12 months (44%) and those who live in a
household in which 2 or more people purchased a fishing license (also 44%). Respondents
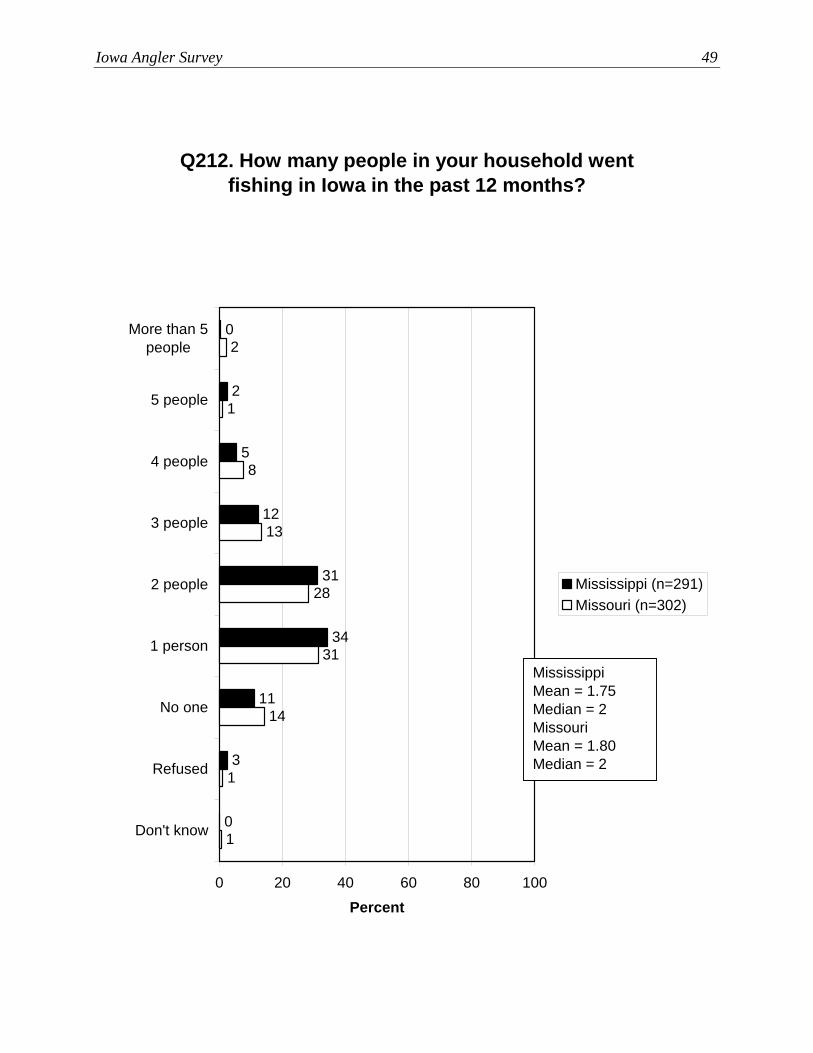
were asked how many people in their household went fishing in the past 12 months (the
above question asked only about purchasing a license): 32% said 1 person in their
household went fishing in the past 12 months, while 55% said 2 or more people went fishing
in Iowa in the past 12 months.
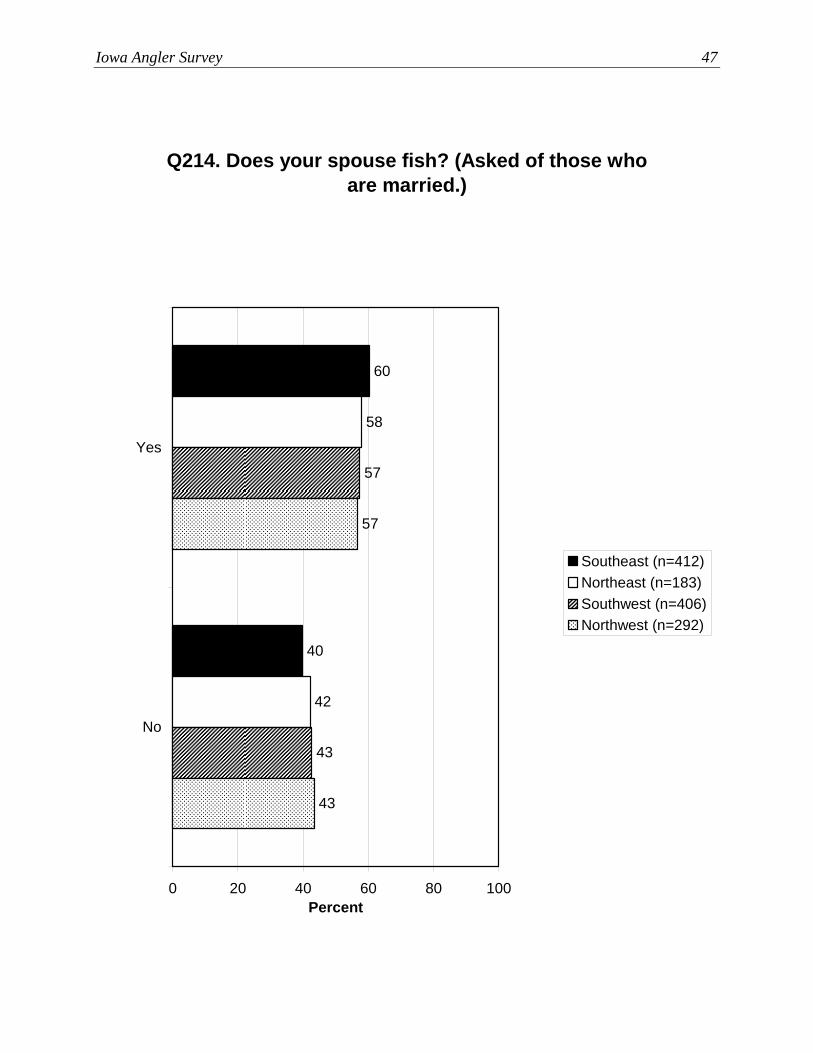
• Among married anglers, 58% say that their spouse fishes.
• In the crosstabulations by avid versus casual angler, the results show that avid anglers are
more likely than are casual anglers to live in a household where somebody bought a
fishing license and/or went fishing. Interestingly, however, avid anglers and casual
anglers are about the same regarding whether their spouse fishes.
• On all these questions, the regional crosstabulation found no marked differences among
the regions.
• The data analysis by river region found no marked differences between the river regions
themselves, nor between the river region and the state as a whole, on these questions.
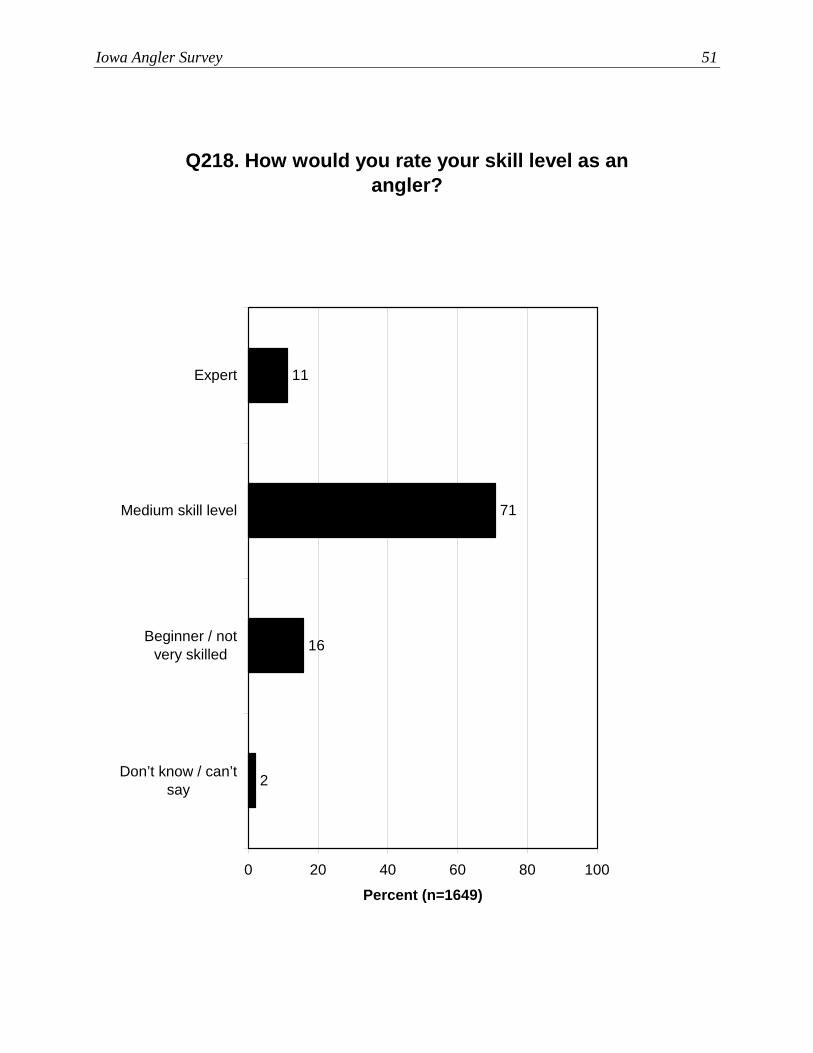
A question that tangentially relates to avidity is skill level. The large majority of Iowa
anglers (71%) rate their skill level as medium. Otherwise, a slightly higher percentage rate
themselves as beginner (16%) than rate themselves as expert (11%).
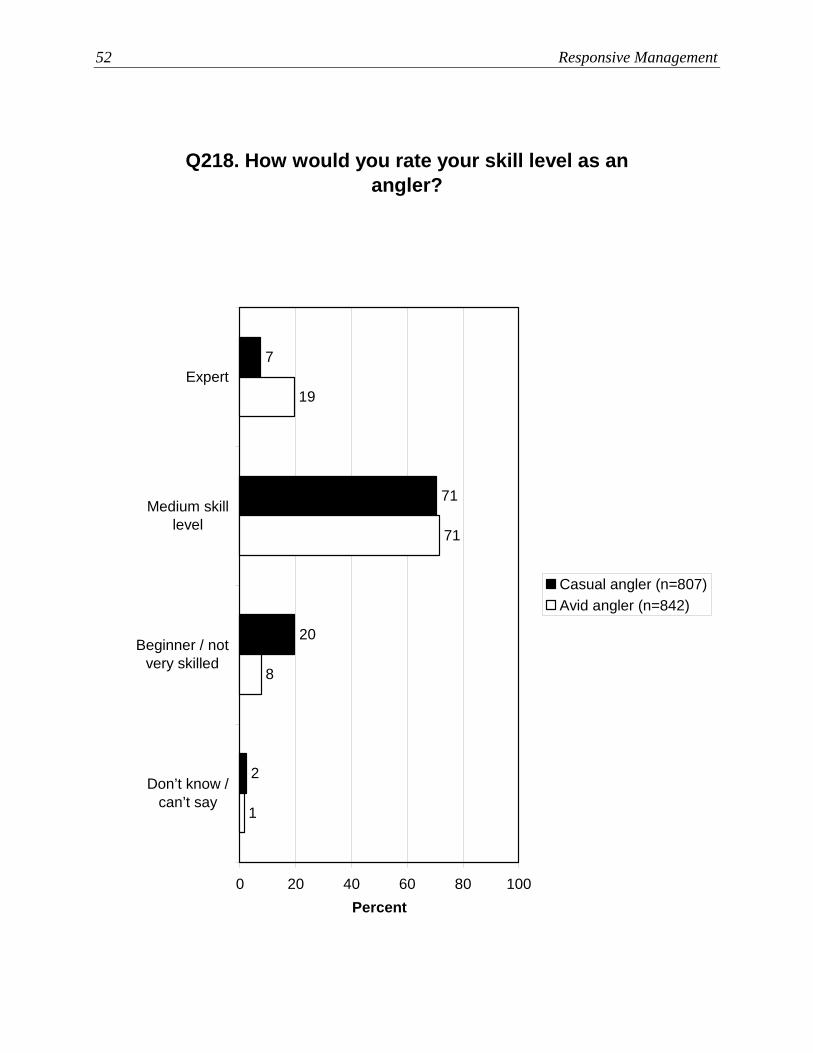
• Not surprisingly, avid anglers are more likely to rate themselves as expert at fishing than
are casual anglers.
• The regional crosstabulation found that anglers’ perceptions of their skills are about the
same from one region to the next.
• The data analysis by river region found the river region anglers to be about the same as
anglers overall regarding their self-rated skill level.

Iowa Angler Survey 11
Q7. Did you go fishing in Iowa in the past 12 months?
20
80
0 20 40 60 80 100
Yes
No
Percent (n=1649)
12 Responsive Management
Q13. How many of the past 3 years have you fished?
61
19
20
1
0 20 40 60 80 100
3 years
2 years
1 year
Don't know
Percent (n=1649)
Mean = 2.42Median = 3
Iowa Angler Survey 13
Q7. Did you go fishing in Iowa in the past 12 months?
1
26
74
0
5
95
0 20 40 60 80 100
Yes
No
Don’t know
Percent
Casual angler (n=807)Avid angler (n=842)
14 Responsive Management
Q13. How many of the past 3 years have you fished?
1
27
25
47
0
3
7
91
0 20 40 60 80 100
3 years
2 years
1 year
Don't know
Percent
Casual angler (n=807)Avid angler (n=842)
Casual anglerMean = 2.20Median = 2Avid anglerMean = 2.88Median = 3

Iowa Angler Survey 15
Q7. Did you go fishing in Iowa in the past 12 months?
1
17
82
1
19
80
78
22
0
80
20
0
0 20 40 60 80 100
Yes
No
Don’t know
Percent
Southeast (n=522)Northeast (n=239)Southwest (n=506)Northwest (n=382)

16 Responsive Management
Q13. How many of the past 3 years have you fished?
1
18
18
63
0
19
21
60
1
59
19
21
1
59
19
21
0 20 40 60 80 100
3 years
2 years
1 year
Don't know
Percent
Southeast (n=522)Northeast (n=239)Southwest (n=506)Northwest (n=382)
SoutheastMean = 2.45Median = 3NortheastMean = 2.42Median = 3SouthwestMean = 2.39Median = 3NorthwestMean = 2.39Median = 3

Iowa Angler Survey 17
Q7. Did you go fishing in Iowa in the past 12 months?
1
18
82
1
23
76
0 20 40 60 80 100
Yes
No
Don’t know
Percent
Mississippi (n=291)Missouri (n=302)

18 Responsive Management
Q13. How many of the past 3 years have you fished?
22
15
62
20
22
58
0 20 40 60 80 100
3 years
2 years
1 year
Percent
Mississippi (n=291)Missouri (n=302)
MississippiMean = 2.40Median = 3MissouriMean = 2.38Median = 3
Iowa Angler Survey 19
Q16. How many days do you estimate you fished in Iowa in the past 12 months? (Asked of those who
have fished in the past 12 months.)
13
18
10
5
6
3
20
23
1
0 20 40 60 80 100
More than 100days
51 - 100 days
31 - 50 days
21 - 30 days
11 - 20 days
7 - 10 days
4 - 6 days
1 - 3 days
Don't know
Percent (n=1384)
Mean = 20.45Median = 10
Calculation of Estimated Total Number of Days Iowa Anglers Fished in Iowa in 2007 Total number in sample: 506,920 Percent fished in past 12 months (approximates those who fished in 2007): 80.106% Total number who fished in past 12 months: 406,075 Mean number of days fishing in past 12 months (of those who fished): 20.450 Total number of angler days in 2007: 8,304,330

20 Responsive Management
Q21. How many days did you fish in Iowa that year [last year fished]? (Asked of those who have fished in the past 3 years, but not in the past 12 months.)
2
41
3
2
7
10
11
24
0 20 40 60 80 100
51 - 100 days
31 - 50 days
21 - 30 days
11 - 20 days
7 - 10 days
4 - 6 days
1 - 3 days
Don't know
Percent (n=265)
Mean = 9.75Median = 5

Iowa Angler Survey 21
Q16. How many days do you estimate you fished in Iowa in the past 12 months? (Asked of those who
have fished in the past 12 months.)
13
15
7
3
5
2
24
29
21
12
15
13
25
14
9
9
4
0 20 40 60 80 100
More than 100days
51 - 100 days
31 - 50 days
21 - 30 days
11 - 20 days
7 - 10 days
4 - 6 days
1 - 3 days
Don't know
Percent
Casual angler (n=590)Avid angler (n=794)
Casual anglerMean = 16.48Median = 6Avid anglerMean = 27.17Median = 15
22 Responsive Management
Q21. How many days did you fish in Iowa that year [last year fished]? (Asked of those who have fished in the past 3 years, but not in the past 12 months.)
25
11
10
7
1
3
41
21
47
14
13
8
8
5
4
0 20 40 60 80 100
51 - 100 days
31 - 50 days
21 - 30 days
11 - 20 days
7 - 10 days
4 - 6 days
1 - 3 days
Don't know
Percent
Casual angler (n=217)Avid angler (n=48)
Casual anglerMean = 9.51Median = 4Avid anglerMean = 12.26Median = 5
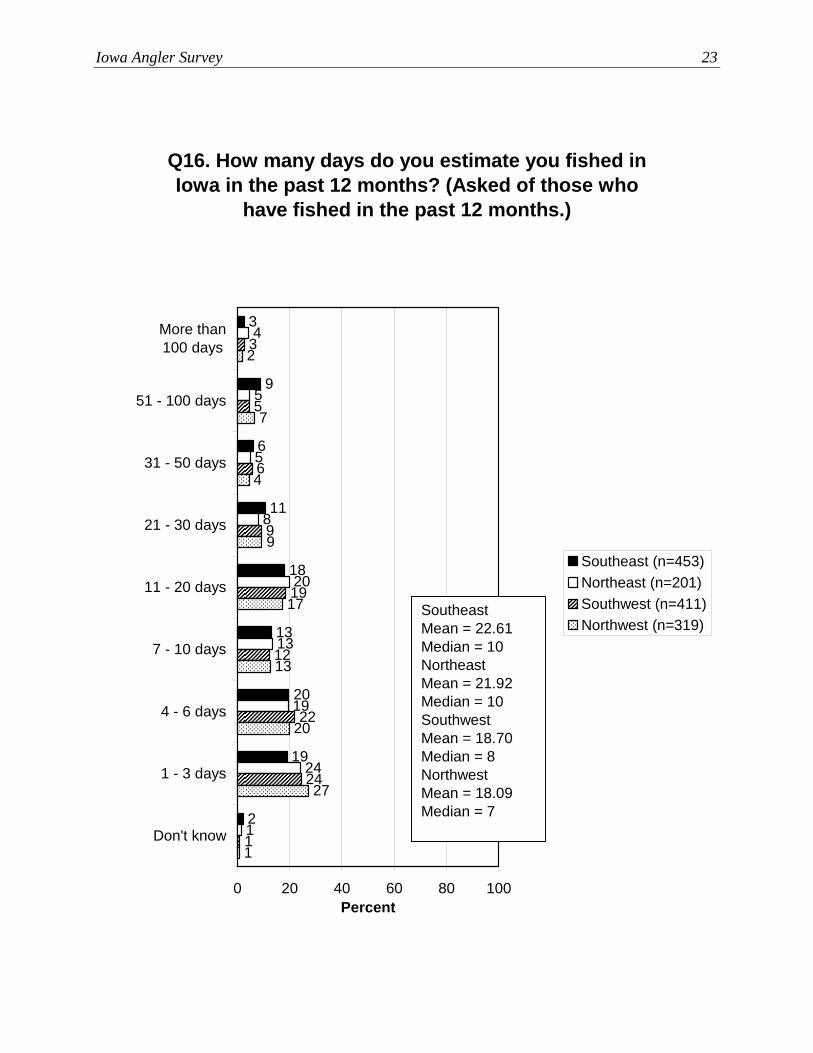
Iowa Angler Survey 23
Q16. How many days do you estimate you fished in Iowa in the past 12 months? (Asked of those who
have fished in the past 12 months.)
13
18
11
6
9
3
20
19
21
24
19
13
20
8
5
5
4
1
24
22
12
19
9
3
5
6
1
27
20
13
17
9
2
7
4
0 20 40 60 80 100
More than100 days
51 - 100 days
31 - 50 days
21 - 30 days
11 - 20 days
7 - 10 days
4 - 6 days
1 - 3 days
Don't know
Percent
Southeast (n=453)Northeast (n=201)Southwest (n=411)Northwest (n=319)
SoutheastMean = 22.61Median = 10NortheastMean = 21.92Median = 10SouthwestMean = 18.70Median = 8NorthwestMean = 18.09Median = 7
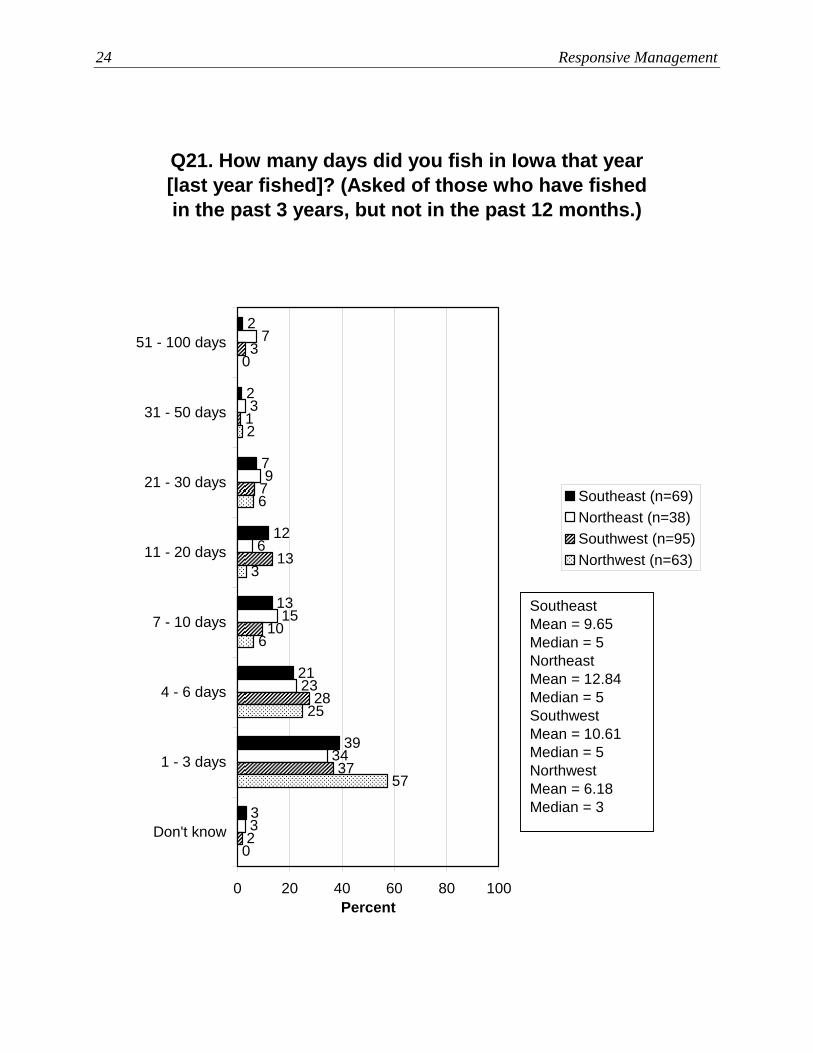
24 Responsive Management
Q21. How many days did you fish in Iowa that year [last year fished]? (Asked of those who have fished in the past 3 years, but not in the past 12 months.)
21
13
12
7
2
2
39
33
34
23
15
6
9
3
7
2
37
28
10
13
3
1
7
0
57
25
6
3
0
2
6
0 20 40 60 80 100
51 - 100 days
31 - 50 days
21 - 30 days
11 - 20 days
7 - 10 days
4 - 6 days
1 - 3 days
Don't know
Percent
Southeast (n=69)Northeast (n=38)Southwest (n=95)Northwest (n=63)
SoutheastMean = 9.65Median = 5NortheastMean = 12.84Median = 5SouthwestMean = 10.61Median = 5NorthwestMean = 6.18Median = 3
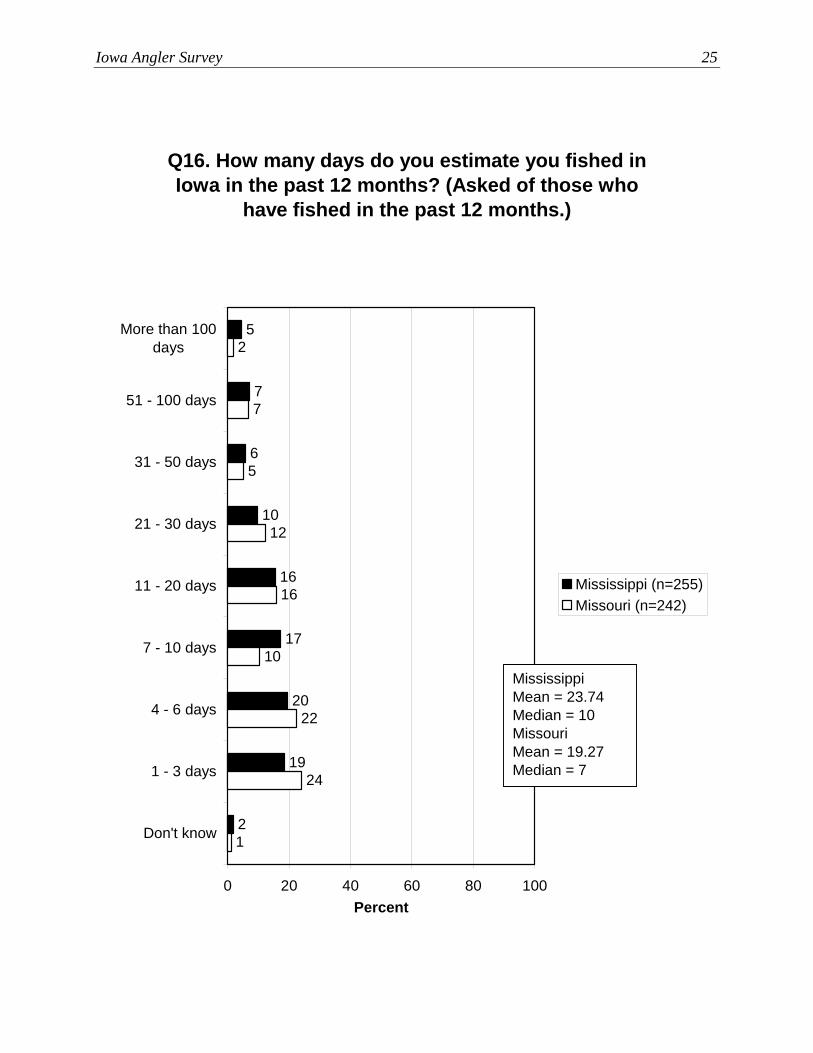
Iowa Angler Survey 25
Q16. How many days do you estimate you fished in Iowa in the past 12 months? (Asked of those who
have fished in the past 12 months.)
17
16
10
6
7
5
20
19
21
24
22
10
16
12
5
7
2
0 20 40 60 80 100
More than 100days
51 - 100 days
31 - 50 days
21 - 30 days
11 - 20 days
7 - 10 days
4 - 6 days
1 - 3 days
Don't know
Percent
Mississippi (n=255)Missouri (n=242)
MississippiMean = 23.74Median = 10MissouriMean = 19.27Median = 7
26 Responsive Management
Q21. How many days did you fish in Iowa that year [last year fished]? (Asked of those who have fished in the past 3 years, but not in the past 12 months.)
12
20
11
7
0
7
37
71
43
28
6
6
11
4
0
0 20 40 60 80 100
51 - 100 days
31 - 50 days
21 - 30 days
11 - 20 days
7 - 10 days
4 - 6 days
1 - 3 days
Don't know
Percent
Mississippi (n=36)Missouri (n=60)
MississippiMean = 13.25Median = 5MissouriMean = 8.78Median = 5
Iowa Angler Survey 27
Q138. How many years do you estimate you've been fishing in Iowa?
1
6
10
18
19
16
12
9
6
5
0 20 40 60 80 100
More than 50years
41 - 50 years
31 - 40 years
21 - 30 years
16 - 20 years
11 - 15 years
6 - 10 years
3 - 5 years
0 - 2 years
Don't know
Percent (n=1649)
Mean = 30.52Median = 30
28 Responsive Management
Q138. How many years do you estimate you've been fishing in Iowa?
1
6
11
16
17
14
11
10
7
8
0
0
3
6
5
9
21
22
21
13
0 20 40 60 80 100
More than 50years
41 - 50 years
31 - 40 years
21 - 30 years
16 - 20 years
11 - 15 years
6 - 10 years
3 - 5 years
0 - 2 years
Don't know
Percent
Casual angler (n=807)Avid angler (n=842)
Casual anglerMean = 28.74Median = 30Avid anglerMean = 34.42Median = 35

Iowa Angler Survey 29
Q138. How many years do you estimate you've been fishing in Iowa?
1
5
8
20
18
16
12
7
5
7
1
4
6
9
7
8
16
17
18
14
0
5
6
8
7
13
16
10
14
22
1
3
7
11
4
11
16
13
17
16
0 20 40 60 80 100
More than 50years
41 - 50 years
31 - 40 years
21 - 30 years
16 - 20 years
11 - 15 years
6 - 10 years
3 - 5 years
0 - 2 years
Don't know
Percent
Southeast (n=522)Northeast (n=239)Southwest (n=506)Northwest (n=382)Southeast
Mean = 30.82Median = 30NortheastMean = 31.23Median = 30SouthwestMean = 29.40Median = 30NorthwestMean = 31.06Median = 30

30 Responsive Management
Q138. How many years do you estimate you've been fishing in Iowa?
1
4
9
16
19
18
13
8
3
8
2
4
6
11
4
19
15
16
13
9
0 20 40 60 80 100
More than 50years
41 - 50 years
31 - 40 years
21 - 30 years
16 - 20 years
11 - 15 years
6 - 10 years
3 - 5 years
0 - 2 years
Don't know
Percent
Mississippi (n=291)Missouri (n=302)
MississippiMean = 31.71Median = 35MissouriMean = 27.57Median = 25
Iowa Angler Survey 31
Q217. How old were you when you first went fishing?
3
17
10
3
2
1
2
48
11
1
0 20 40 60 80 100
More than 21years old
19 - 21 years old
16 - 18 years old
13 - 15 years old
10 - 12 years old
7 - 9 years old
4 - 6 years old
Less than 4 yearsold
Refuses
Don't know
Percent (n=1649)
Mean = 7.25Median = 5

32 Responsive Management
Q217. How old were you when you first went fishing?
3
18
10
4
3
1
3
46
11
2
2
1
13
53
15
11
2
1
1
2
0 20 40 60 80 100
More than 21years old
19 - 21 yearsold
16 - 18 yearsold
13 - 15 yearsold
10 - 12 yearsold
7 - 9 years old
4 - 6 years old
Less than 4years old
Refuses
Don't know
Percent
Casual angler (n=807)Avid angler (n=842)
Casual anglerMean = 7.54Median = 6Avid anglerMean = 6.64Median = 5
Iowa Angler Survey 33
Q217. How old were you when you first went fishing?
3
20
11
3
2
1
3
45
10
2
4
2
11
38
20
13
5
2
1
3
2
1
14
50
15
8
3
2
1
3
3
1
9
58
13
9
2
1
2
1
0 20 40 60 80 100
More than 21years old
19 - 21 yearsold
16 - 18 yearsold
13 - 15 yearsold
10 - 12 yearsold
7 - 9 yearsold
4 - 6 yearsold
Less than 4years old
Refused
Don't know
Percent
Southeast (n=522)Northeast (n=239)Southwest (n=506)Northwest (n=382)
SoutheastMean = 7.50Median = 6NortheastMean = 8.08Median = 6SouthwestMean = 6.92Median = 5NorthwestMean = 6.66Median = 5

34 Responsive Management
Q217. How old were you when you first went fishing?
4
19
15
4
2
1
2
41
10
3
3
1
12
46
18
9
4
2
0
4
0 20 40 60 80 100
More than 21years old
19 - 21 yearsold
16 - 18 yearsold
13 - 15 yearsold
10 - 12 yearsold
7 - 9 years old
4 - 6 years old
Less than 4years old
Refuses
Don't know
Percent
Mississippi (n=291)Missouri (n=302)
MississippiMean = 7.68Median = 6MissouriMean = 7.45Median = 5

Iowa Angler Survey 35
Q140. Do you fish more or less in Iowa now than you did 10 years ago? (Asked of those who have
been fishing in Iowa for 10 or more years.)
44
22
34
0 20 40 60 80 100
More
Same amount
Less
Percent (n=1435)

36 Responsive Management
Q140. Do you fish more or less in Iowa now than you did 10 years ago? (Asked of those who have
been fishing in Iowa for 10 or more years.)
50
19
30
33
27
40
0 20 40 60 80 100
More
Same amount
Less
Percent
Casual angler (n=649)Avid angler (n=786)

Iowa Angler Survey 37
Q140. Do you fish more or less in Iowa now than you did 10 years ago? (Asked of those who have
been fishing in Iowa for 10 or more years.)
41
22
37
45
20
36
31
24
44
30
21
49
0 20 40 60 80 100
More
Sameamount
Less
Percent
Southeast (n=458)Northeast (n=208)Southwest (n=437)Northwest (n=332)
38 Responsive Management
Q140. Do you fish more or less in Iowa now than you did 10 years ago? (Asked of those who have
been fishing in Iowa for 10 or more years.)
1
48
21
31
0
48
17
35
0 20 40 60 80 100
More
Same amount
Less
Don’t know /Can’t say
Percent
Mississippi (n=259)Missouri (n=256)
Iowa Angler Survey 39
Q209. How many people in your household purchased an Iowa fishing license in the past 12
months?
1
10
44
36
6
1
1
0 20 40 60 80 100
4 people or more
3 people
2 people
1 person
No one
Refused
Don't know
Percent
Mean = 1.44Median = 1

40 Responsive Management
Q212. How many people in your household went fishing in Iowa in the past 12 months?
32
32
13
8
2
1
10
1
0 20 40 60 80 100
More than 5people
5 people
4 people
3 people
2 people
1 person
No one
Refused
Percent (n=1649)
Mean = 1.85Median = 2
Iowa Angler Survey 41
Q214. Does your spouse fish? (Asked of those who are married.)
42
58
0 20 40 60 80 100
Yes
No
Percent (n=1293)
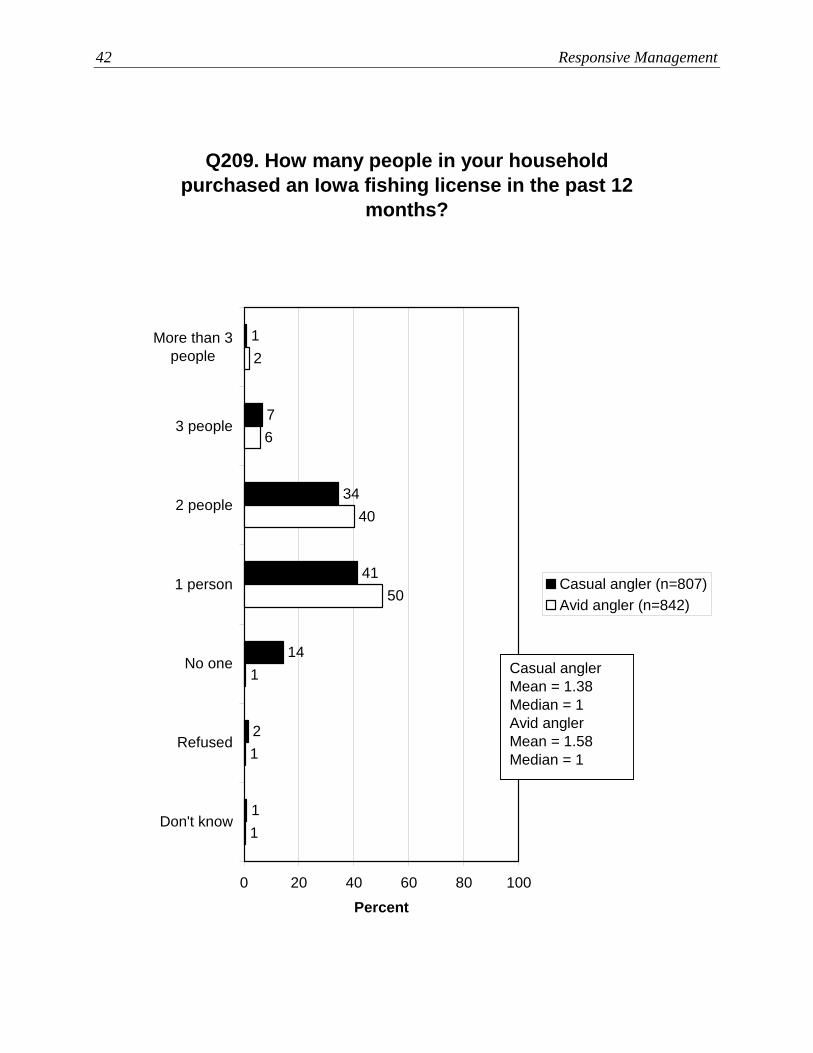
42 Responsive Management
Q209. How many people in your household purchased an Iowa fishing license in the past 12
months?
2
14
41
34
7
1
11
1
1
50
40
6
2
0 20 40 60 80 100
More than 3people
3 people
2 people
1 person
No one
Refused
Don't know
Percent
Casual angler (n=807)Avid angler (n=842)
Casual anglerMean = 1.38Median = 1Avid anglerMean = 1.58Median = 1
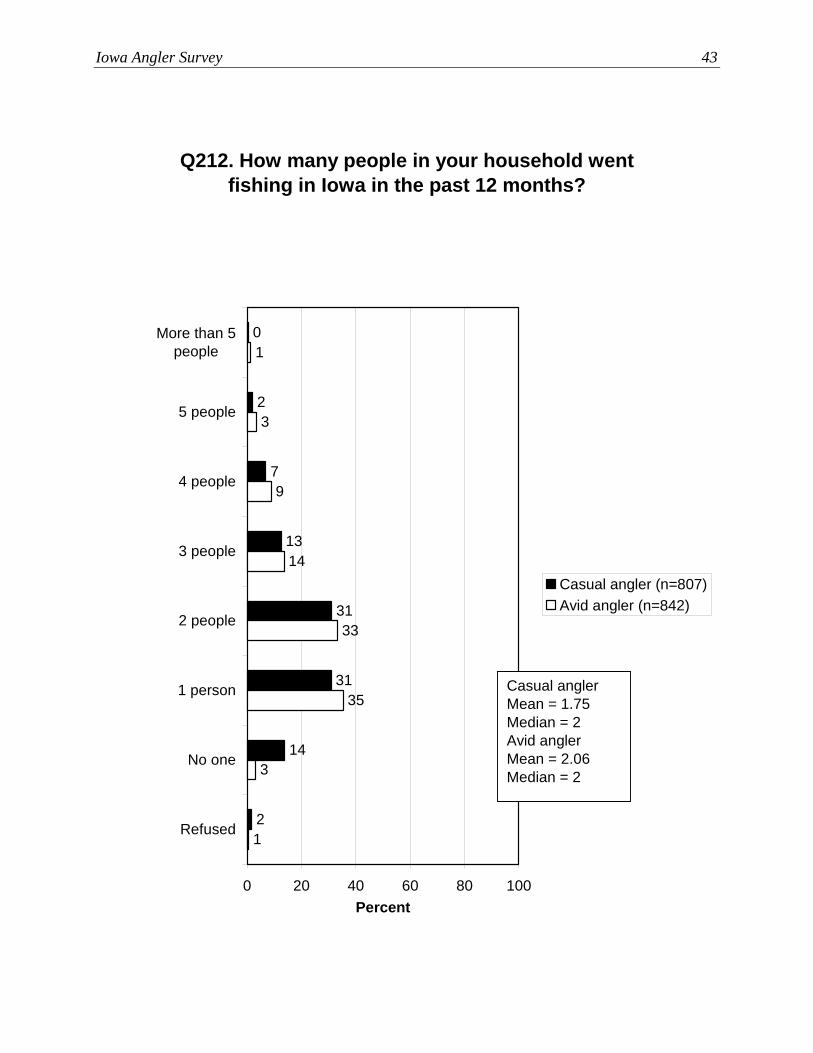
Iowa Angler Survey 43
Q212. How many people in your household went fishing in Iowa in the past 12 months?
31
31
13
7
2
0
14
21
3
35
33
14
9
3
1
0 20 40 60 80 100
More than 5people
5 people
4 people
3 people
2 people
1 person
No one
Refused
Percent
Casual angler (n=807)Avid angler (n=842)
Casual anglerMean = 1.75Median = 2Avid anglerMean = 2.06Median = 2
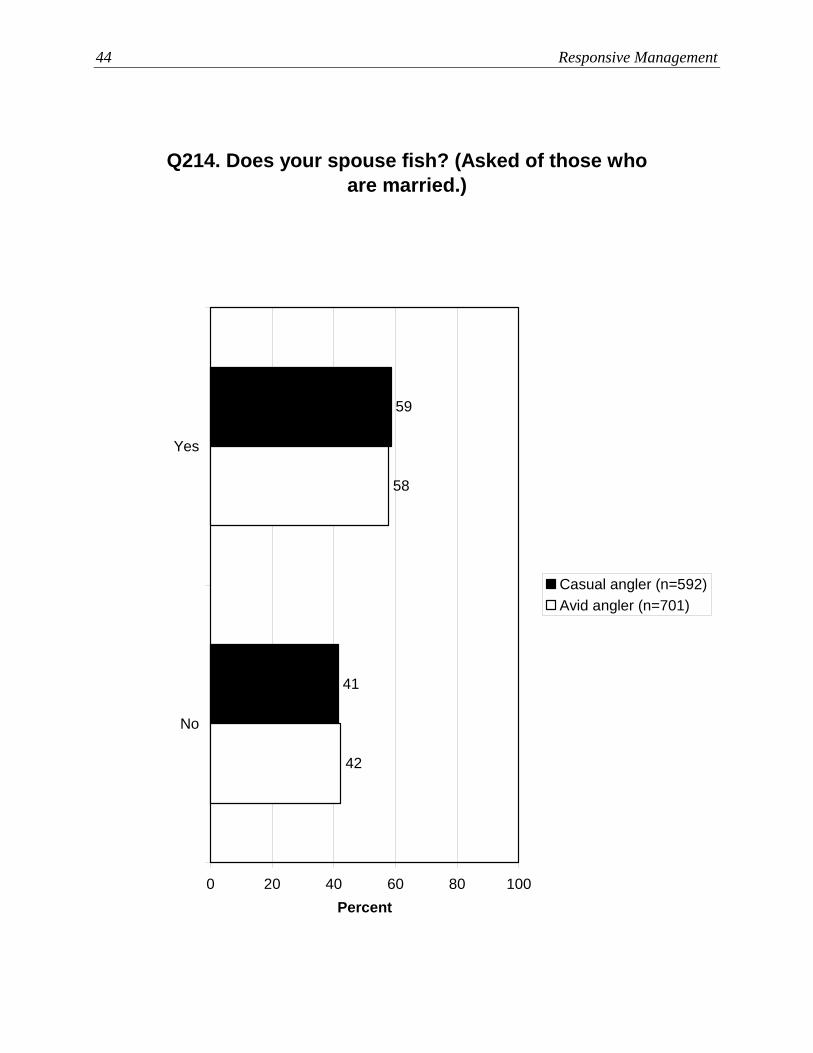
44 Responsive Management
Q214. Does your spouse fish? (Asked of those who are married.)
41
59
42
58
0 20 40 60 80 100
Yes
No
Percent
Casual angler (n=592)Avid angler (n=701)
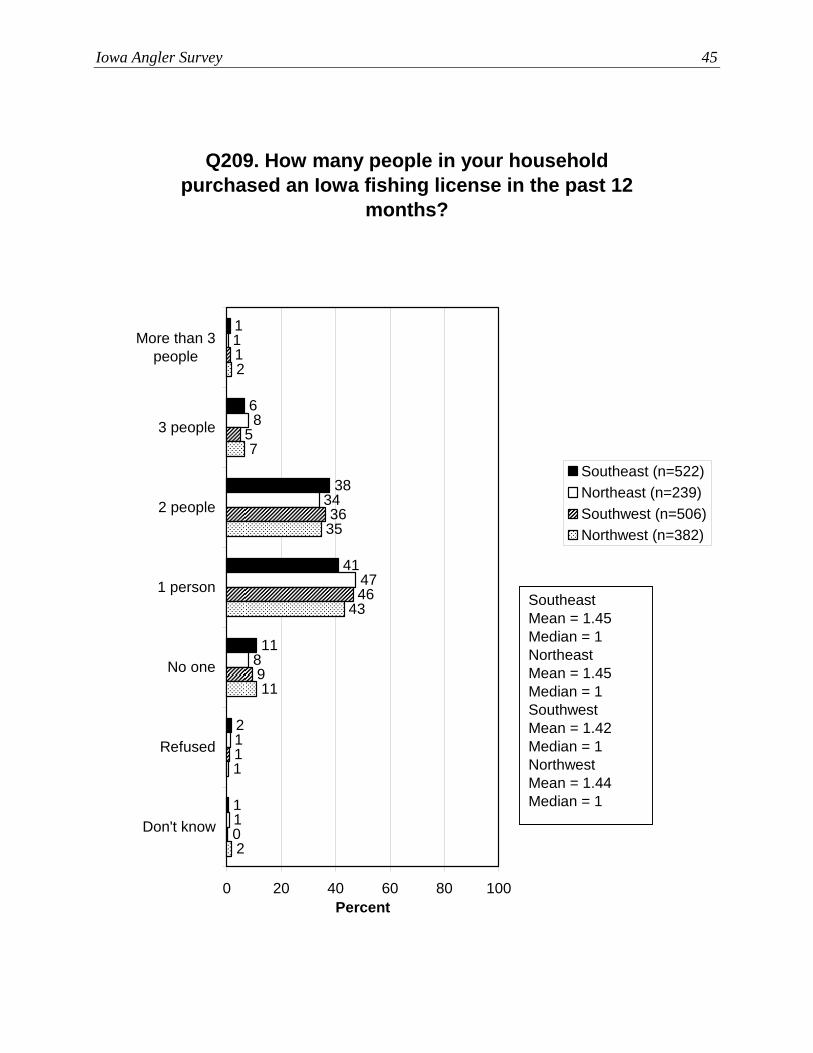
Iowa Angler Survey 45
Q209. How many people in your household purchased an Iowa fishing license in the past 12
months?
2
11
41
38
6
1
11
1
8
47
34
8
1
0
1
9
46
1
5
36
2
1
11
43
2
7
35
0 20 40 60 80 100
More than 3people
3 people
2 people
1 person
No one
Refused
Don't know
Percent
Southeast (n=522)Northeast (n=239)Southwest (n=506)Northwest (n=382)
SoutheastMean = 1.45Median = 1NortheastMean = 1.45Median = 1SouthwestMean = 1.42Median = 1NorthwestMean = 1.44Median = 1

46 Responsive Management
Q212. How many people in your household went fishing in Iowa in the past 12 months?
33
33
13
5
3
1
10
2
01
1
12
35
28
14
8
1
0
0
1
10
32
33
12
1
2
9
2
1
11
29
32
12
1
3
10
0 20 40 60 80 100
More than 5people
5 people
4 people
3 people
2 people
1 person
No one
Refused
Don't know
Percent
Southeast (n=522)Northeast (n=239)Southwest (n=506)Northwest (n=382)
SoutheastMean = 1.82Median = 2NortheastMean = 1.78Median = 2SouthwestMean = 1.87Median = 2NorthwestMean = 1.93Median = 2
Iowa Angler Survey 47
Q214. Does your spouse fish? (Asked of those who are married.)
40
60
42
58
57
43
57
43
0 20 40 60 80 100
Yes
No
Percent
Southeast (n=412)Northeast (n=183)Southwest (n=406)Northwest (n=292)

48 Responsive Management
Q209. How many people in your household purchased an Iowa fishing license in the past 12
months?
3
13
41
38
5
0
1
10
44
36
7
1
0 20 40 60 80 100
More than 3people
3 people
2 people
1 person
No one
Refused
Percent
Mississippi (n=291)Missouri (n=302)
MississippiMean = 1.37Median = 1MissouriMean = 1.44Median = 1
Iowa Angler Survey 49
Q212. How many people in your household went fishing in Iowa in the past 12 months?
34
31
12
5
2
0
11
3
01
1
14
31
28
13
8
1
2
0 20 40 60 80 100
More than 5people
5 people
4 people
3 people
2 people
1 person
No one
Refused
Don't know
Percent
Mississippi (n=291)Missouri (n=302)
MississippiMean = 1.75Median = 2MissouriMean = 1.80Median = 2

50 Responsive Management
Q214. Does your spouse fish? (Asked of those who are married.)
45
55
43
57
0 20 40 60 80 100
Yes
No
Percent
Mississippi (n=232)Missouri (n=224)
Iowa Angler Survey 51
Q218. How would you rate your skill level as an angler?
2
16
71
11
0 20 40 60 80 100
Expert
Medium skill level
Beginner / notvery skilled
Don’t know / can’tsay
Percent (n=1649)
52 Responsive Management
Q218. How would you rate your skill level as an angler?
2
20
71
7
1
8
71
19
0 20 40 60 80 100
Expert
Medium skilllevel
Beginner / notvery skilled
Don’t know /can’t say
Percent
Casual angler (n=807)Avid angler (n=842)
Iowa Angler Survey 53
Q218. How would you rate your skill level as an angler?
2
15
72
11
3
16
71
10
1
14
69
16
3
8
72
17
0 20 40 60 80 100
Expert
Medium skilllevel
Beginner /not veryskilled
Don’t know /can’t say
Percent
Southeast (n=522)Northeast (n=239)Southwest (n=506)Northwest (n=382)

54 Responsive Management
Q218. How would you rate your skill level as an angler?
3
14
72
12
2
16
70
13
0 20 40 60 80 100
Expert
Medium skilllevel
Beginner / notvery skilled
Don’t know /can’t say
Percent
Mississippi (n=291)Missouri (n=302)
Iowa Angler Survey 55
SPECIES FISHED AND PREFERRED, AND METHODS OF FISHING SPECIES FISHED AND PREFERRED
The most-fished species of fish are catfish/bullhead (51% of anglers fished for these in the previous 12 months or the last year they fished), bass (49%), bluegill (48%), and crappie (47%)—the species that are most popular by far. Next in the ranking is walleye (33%), but with a much lower percentage having fished for that species. • An analysis was run of the species of fish sought by anglers in various types of water.
o Catfish, bass, bluegill, walleye, and crappie are the species most fished for in border rivers.
o Catfish, bass, crappie, and walleye are the species most fished for in inland rivers. o Trout is, by far, the species most fished for in trout streams. o Walleye, catfish, bass, and crappie are the species most fished for in natural lakes. o Crappie, catfish, and bass are the species most fished for in reservoirs. o Bass, crappie, catfish, and bluegill are the species most fished for in constructed
lakes. o Bass, catfish, and crappie are the species most fished for in oxbow lakes. o Bass, crappie, bluegill, and catfish are the species most fished for in farm
ponds/gravel pits. • For nearly every species, a greater percentage of avid anglers fished for them relative to
casual anglers. • The regional crosstabulation found some marked differences among the regions in
species fished. In particular, the listing below for each region shows the species that were markedly more commonly fished in that region relative to the other regions. o Southeast Region: catfish/bullhead (particularly channel catfish), crappie, and trout. o Northeast Region: walleye, northern pike, and trout. o Southwest Region: bass (particularly largemouth bass) and crappie. o Northwest Region: walleye and northern pike.
• The data analysis by river region found some differences between river regions in species fished, the most important being that Missouri River Region anglers fished for bass more often than did Mississippi River Region anglers.
Bass (49%) and catfish/bullhead (43%) are the types of fish that anglers most commonly say they fish for most often in Iowa, distantly followed by crappie (16%), bluegill (12%), walleye (9%), and trout (8%). (Note that the question in the first bullet above asked for all
56 Responsive Management
fish that anglers had fished for, while this question asked which single type of fish they most often fished for in Iowa.) • When anglers were asked which single species of fish they would prefer to fish for, their
answers closely mirror the fish that they most commonly fish for, with one notable exception: preference for walleye (14% prefer walleye) exceeds actual fishing for it (9% say that walleye is the species they most often fish for).
• The crosstabulations by avid versus casual angler shows that the two groups are similar in the type of fish they most commonly fish for and the type they prefer, with a couple of exceptions: avid anglers more often than casual anglers say their most-fished type is crappie or walleye, and avid anglers more often say they prefer walleye.
• The regional crosstabulation found some marked differences among the regions in species most commonly fished. In particular, the listing below for each region shows the species that are markedly more common in that region relative to the other regions. o Southeast Region: catfish/bullhead. o Northeast Region: bass, bluegill, and trout. o Southwest Region: bass and crappie. o Northwest Region: catfish/bullhead and walleye.
• The regional crosstabulation found some marked differences among the regions in species of fish preferred. In particular, the listing below for each region shows the species that are markedly more preferred in that region relative to the other regions. o Southeast Region: catfish/bullhead. o Northeast Region: bass, bluegill, and trout. o Southwest Region: bass. o Northwest Region: catfish/bullhead and walleye.
• The data analysis by river region found that anglers from both the Mississippi River Region and the Missouri River Region more often fish for catfish/bullhead than do anglers overall. Additionally, Mississippi River Region anglers fish for bass less often than anglers overall (Missouri River Region anglers are about the same as anglers overall in bass fishing). Regarding fish type that is preferred, the river region anglers are more likely to say that they prefer catfish/bullhead. Mississippi River Region anglers are less likely than angler overall to prefer bass.
Iowa Angler Survey 57
Q25-47. Species fished for in Iowa in the past 12 months / last year fished.
(Part 1)
5
4
3
3
3
5
5
6
8
8
9
26
33
47
48
49
51
18
10
10
0 20 40 60 80 100
Any type of catfish/bullhead
Any type of bass
Bluegill
Crappie
Walleye
Largemouth bass
Channel catfish
Smallmouth bass
Northern pike
Any type of trout
Sunfish (unspecified type)
Panfish (unspecified type)
Flathead catfish
Sauger
Rainbow trout
Perch (unspecified type)
White bass
Saugeye
Carp (any type)
Brown trout
Mul
tiple
Res
pons
es A
llow
ed
Percent (n=1649)
Note: “Any type of bass” includes those who specifically said “largemouth bass,” “smallmouth bass,” or who simply said, “bass.” This same type of grouping was done for “any type of catfish/bullhead” and “any type of trout.”
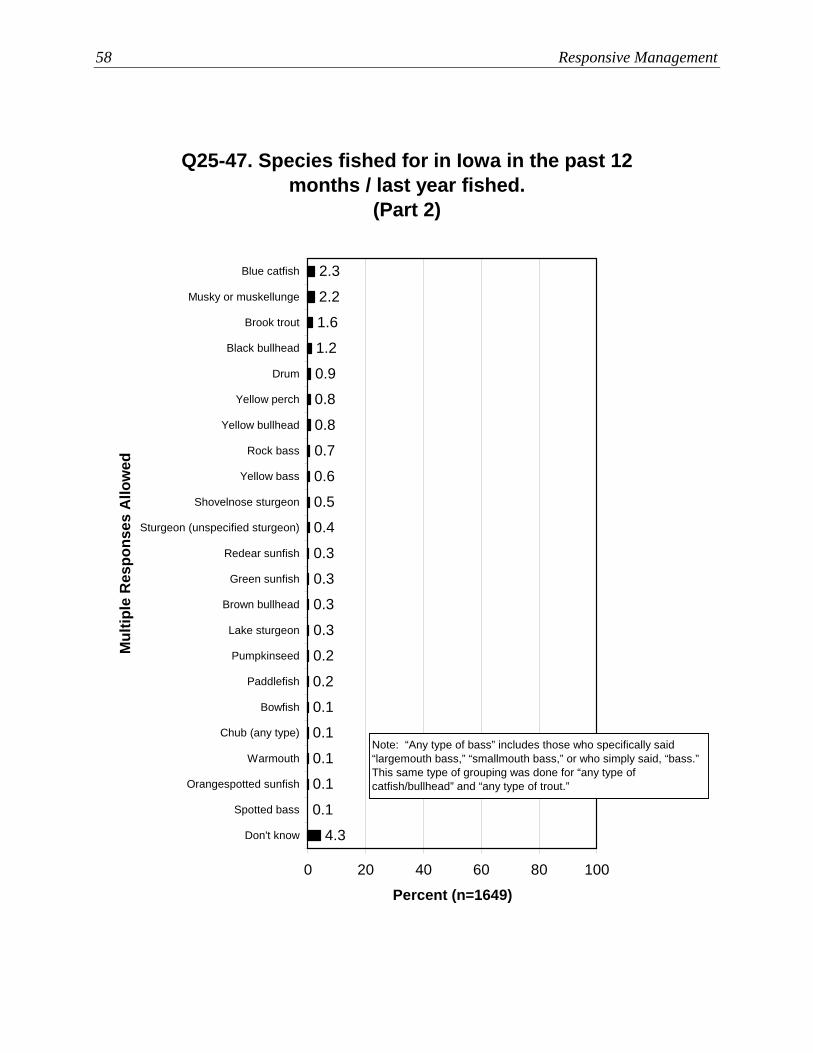
58 Responsive Management
Q25-47. Species fished for in Iowa in the past 12 months / last year fished.
(Part 2)
0.2
0.2
0.1
0.1
0.1
0.1
0.1
4.3
0.3
0.3
0.3
0.3
0.4
0.5
0.8
0.9
1.2
1.6
2.2
2.3
0.8
0.7
0.6
0 20 40 60 80 100
Blue catfish
Musky or muskellunge
Brook trout
Black bullhead
Drum
Yellow perch
Yellow bullhead
Rock bass
Yellow bass
Shovelnose sturgeon
Sturgeon (unspecified sturgeon)
Redear sunfish
Green sunfish
Brown bullhead
Lake sturgeon
Pumpkinseed
Paddlefish
Bowfish
Chub (any type)
Warmouth
Orangespotted sunfish
Spotted bass
Don't know
Mul
tiple
Res
pons
es A
llow
ed
Percent (n=1649)
Note: “Any type of bass” includes those who specifically said “largemouth bass,” “smallmouth bass,” or who simply said, “bass.” This same type of grouping was done for “any type of catfish/bullhead” and “any type of trout.”
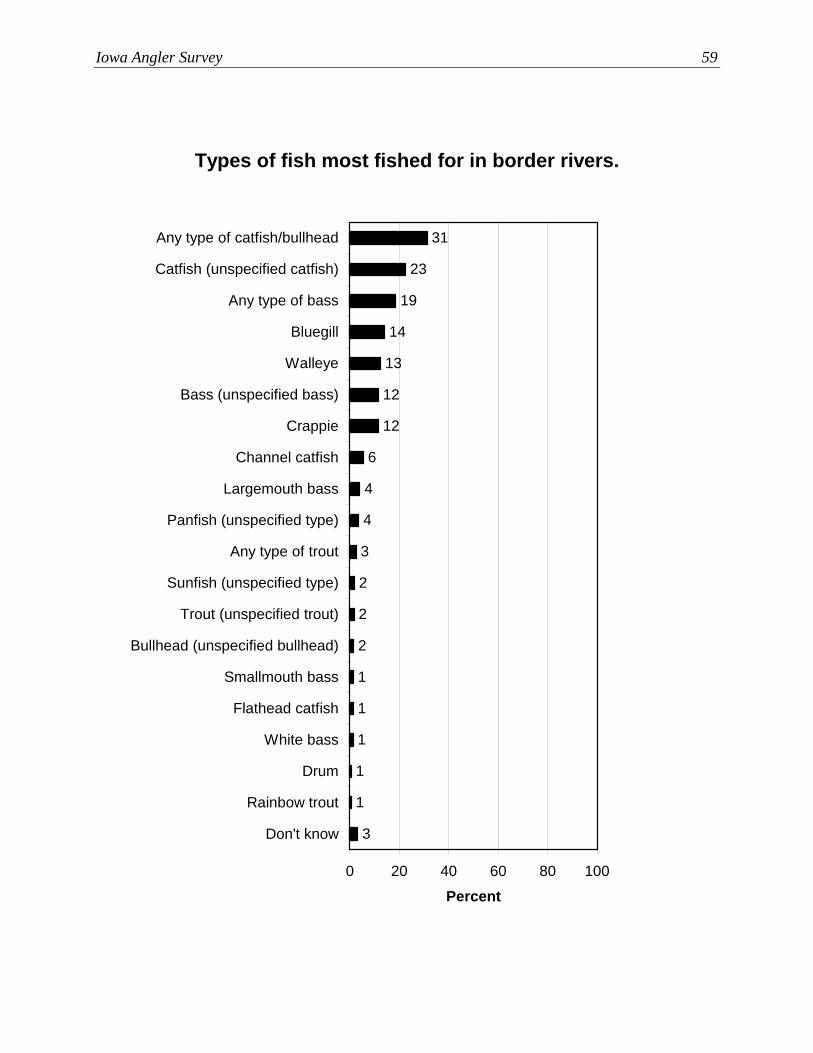
Iowa Angler Survey 59
Types of fish most fished for in border rivers.
1
1
1
1
3
1
2
2
2
3
4
12
13
14
19
23
31
12
6
4
0 20 40 60 80 100
Any type of catfish/bullhead
Catfish (unspecified catfish)
Any type of bass
Bluegill
Walleye
Bass (unspecified bass)
Crappie
Channel catfish
Largemouth bass
Panfish (unspecified type)
Any type of trout
Sunfish (unspecified type)
Trout (unspecified trout)
Bullhead (unspecified bullhead)
Smallmouth bass
Flathead catfish
White bass
Drum
Rainbow trout
Don't know
Percent
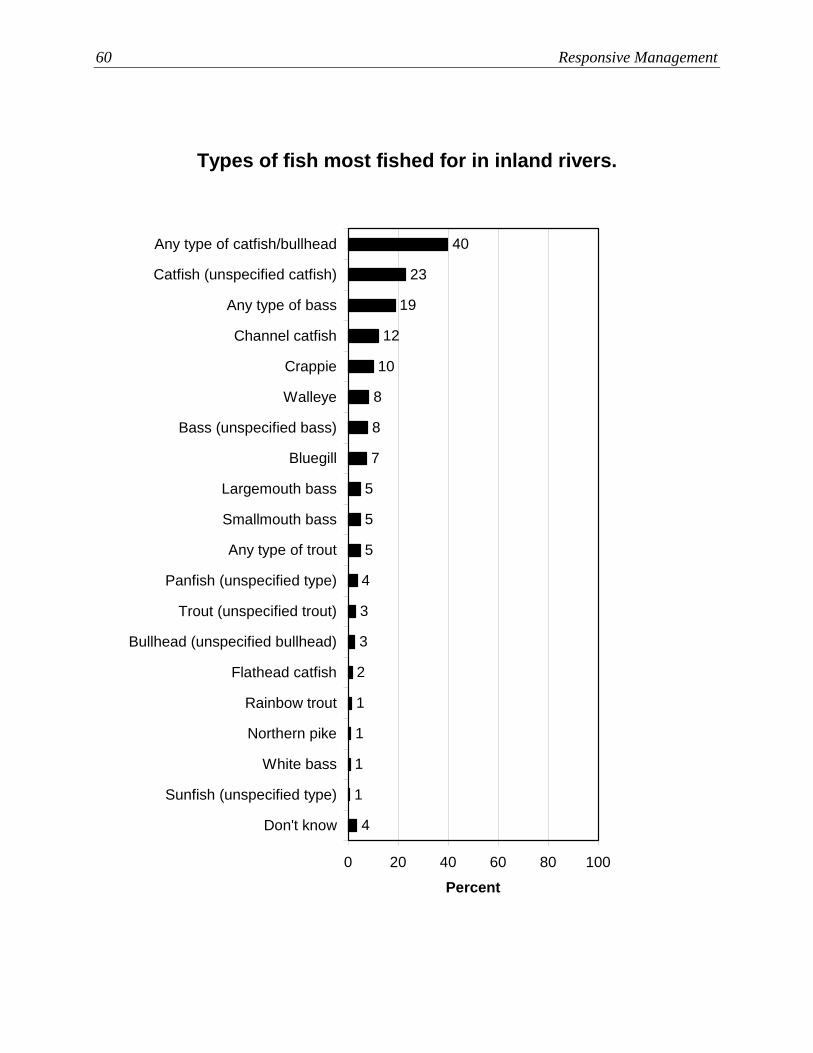
60 Responsive Management
Types of fish most fished for in inland rivers.
1
1
1
1
4
2
3
3
4
5
5
8
10
12
19
23
40
8
7
5
0 20 40 60 80 100
Any type of catfish/bullhead
Catfish (unspecified catfish)
Any type of bass
Channel catfish
Crappie
Walleye
Bass (unspecified bass)
Bluegill
Largemouth bass
Smallmouth bass
Any type of trout
Panfish (unspecified type)
Trout (unspecified trout)
Bullhead (unspecified bullhead)
Flathead catfish
Rainbow trout
Northern pike
White bass
Sunfish (unspecified type)
Don't know
Percent

Iowa Angler Survey 61
Types of fish most fished for in trout streams.
2
2
2
2
4
8
8
9
25
39
73
6
5
4
0 20 40 60 80 100
Any type of trout
Trout (unspecified trout)
Rainbow trout
Any type of bass
Brown trout
Any type of catfish/bullhead
Catfish (unspecified catfish)
Largemouth bass
Walleye
Crappie
Bass (unspecified bass)
Smallmouth bass
Channel catfish
Don't know
Percent
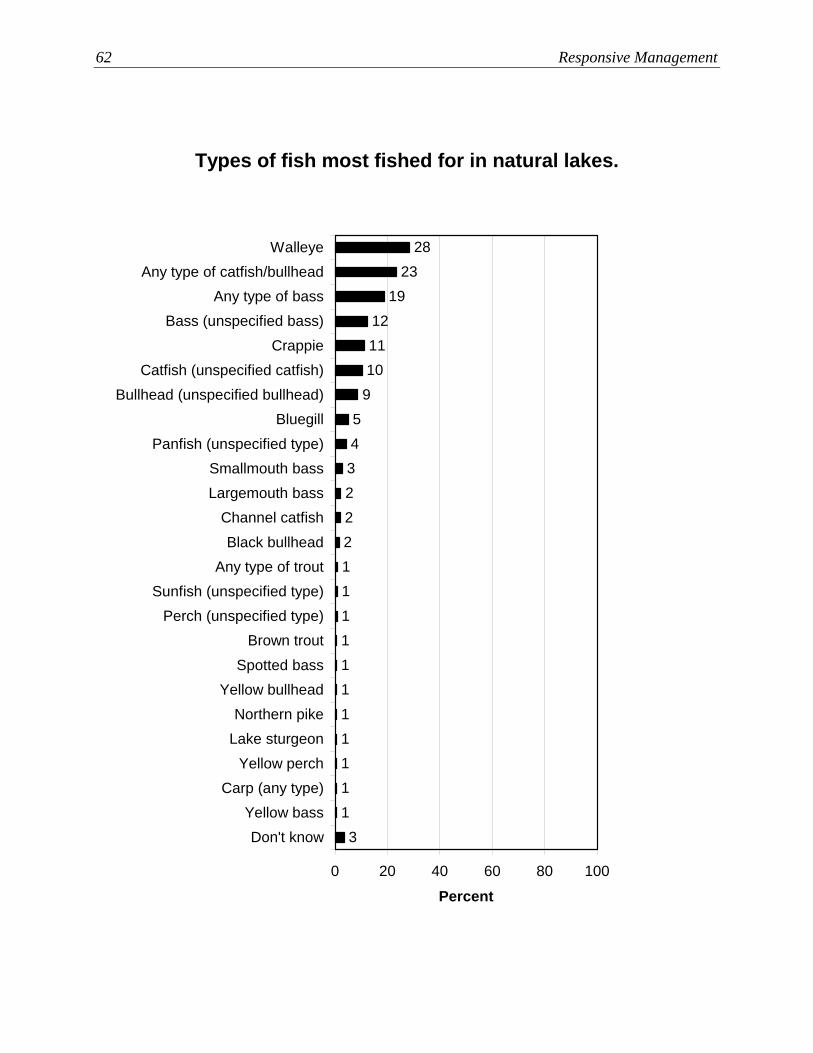
62 Responsive Management
Types of fish most fished for in natural lakes.
1111111113
112223
101112
1923
28
954
0 20 40 60 80 100
WalleyeAny type of catfish/bullhead
Any type of bassBass (unspecified bass)
CrappieCatfish (unspecified catfish)
Bullhead (unspecified bullhead)Bluegill
Panfish (unspecified type)Smallmouth bassLargemouth bass
Channel catfishBlack bullhead
Any type of troutSunfish (unspecified type)
Perch (unspecified type)Brown trout
Spotted bassYellow bullhead
Northern pikeLake sturgeon
Yellow perchCarp (any type)
Yellow bassDon't know
Percent
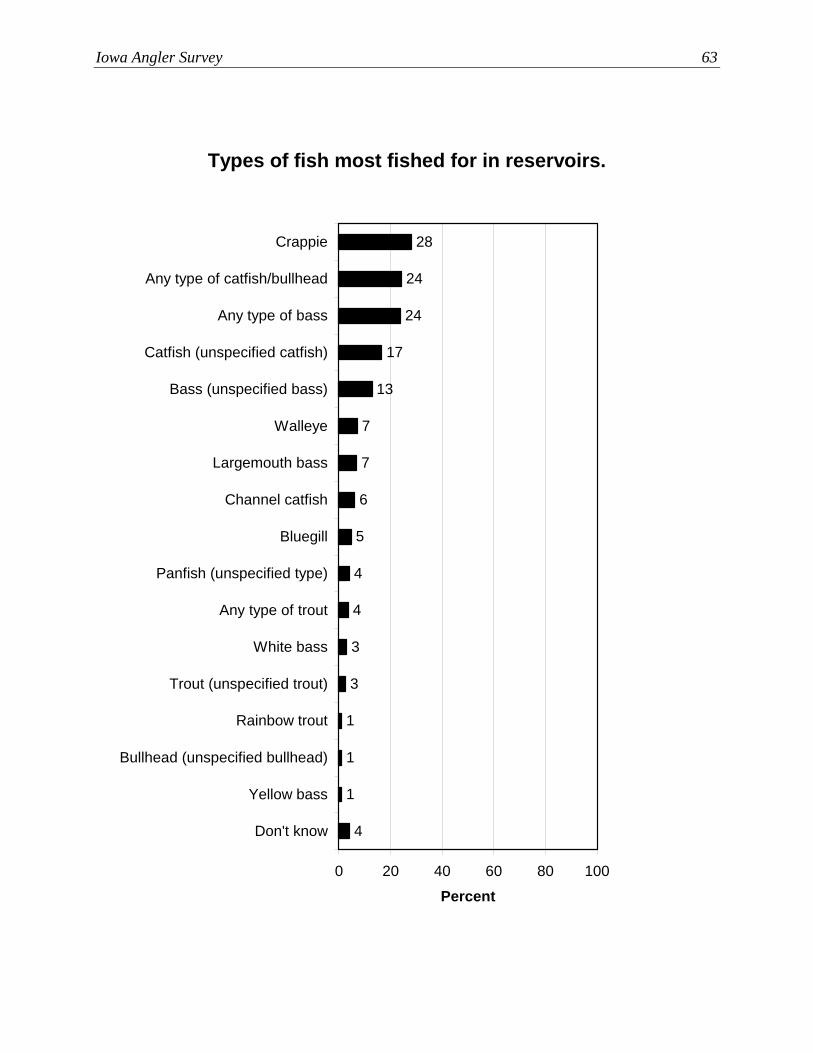
Iowa Angler Survey 63
Types of fish most fished for in reservoirs.
1
4
1
1
3
3
4
4
7
13
17
24
24
28
7
6
5
0 20 40 60 80 100
Crappie
Any type of catfish/bullhead
Any type of bass
Catfish (unspecified catfish)
Bass (unspecified bass)
Walleye
Largemouth bass
Channel catfish
Bluegill
Panfish (unspecified type)
Any type of trout
White bass
Trout (unspecified trout)
Rainbow trout
Bullhead (unspecified bullhead)
Yellow bass
Don't know
Percent
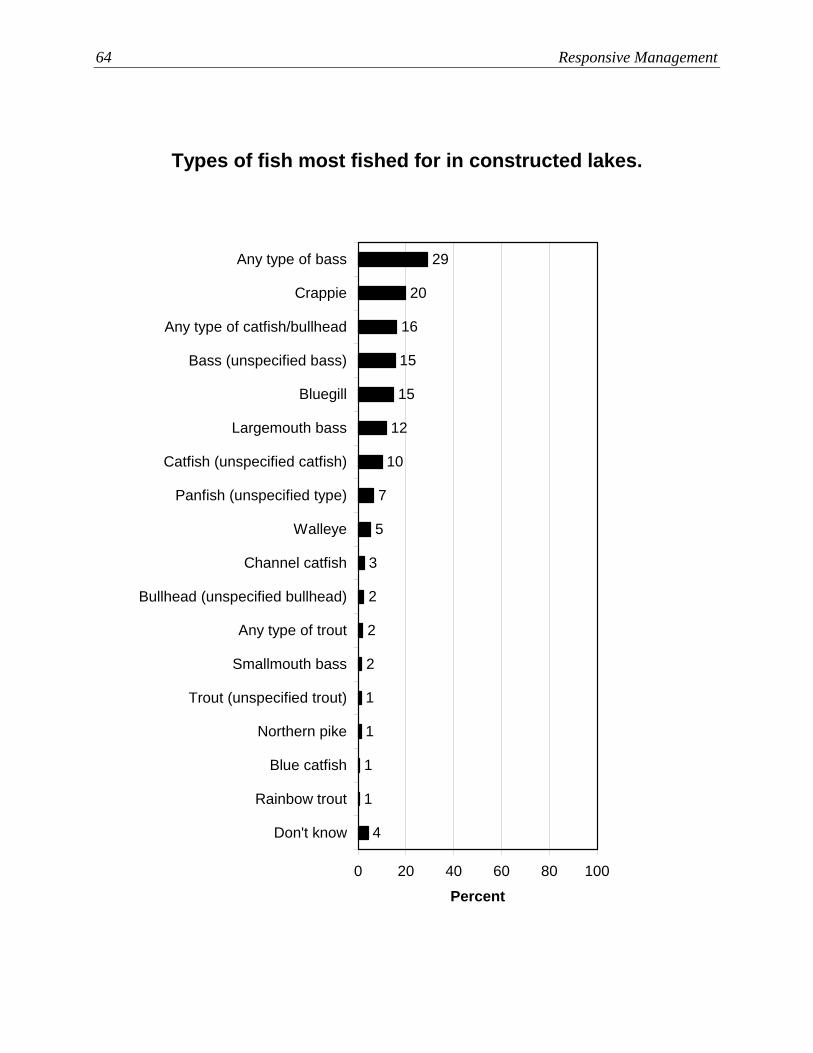
64 Responsive Management
Types of fish most fished for in constructed lakes.
1
1
4
1
1
2
2
2
3
12
15
15
16
20
29
10
7
5
0 20 40 60 80 100
Any type of bass
Crappie
Any type of catfish/bullhead
Bass (unspecified bass)
Bluegill
Largemouth bass
Catfish (unspecified catfish)
Panfish (unspecified type)
Walleye
Channel catfish
Bullhead (unspecified bullhead)
Any type of trout
Smallmouth bass
Trout (unspecified trout)
Northern pike
Blue catfish
Rainbow trout
Don't know
Percent
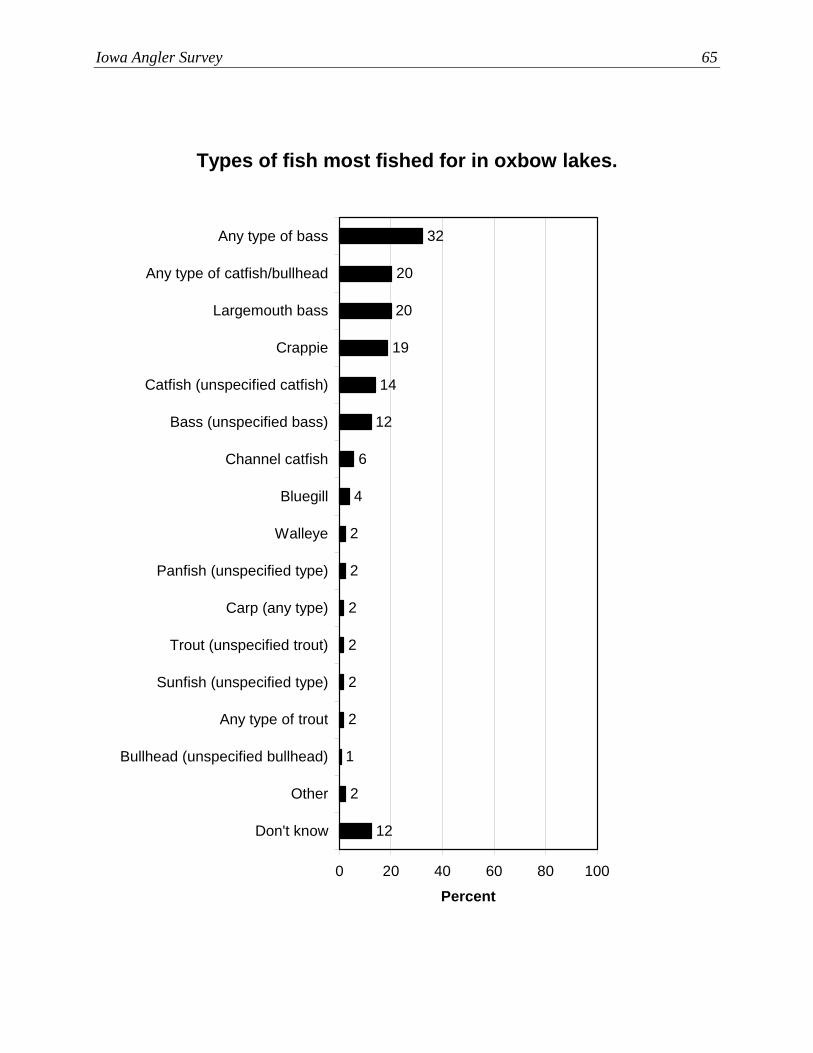
Iowa Angler Survey 65
Types of fish most fished for in oxbow lakes.
2
12
1
2
2
2
2
2
12
14
19
20
20
32
6
4
2
0 20 40 60 80 100
Any type of bass
Any type of catfish/bullhead
Largemouth bass
Crappie
Catfish (unspecified catfish)
Bass (unspecified bass)
Channel catfish
Bluegill
Walleye
Panfish (unspecified type)
Carp (any type)
Trout (unspecified trout)
Sunfish (unspecified type)
Any type of trout
Bullhead (unspecified bullhead)
Other
Don't know
Percent
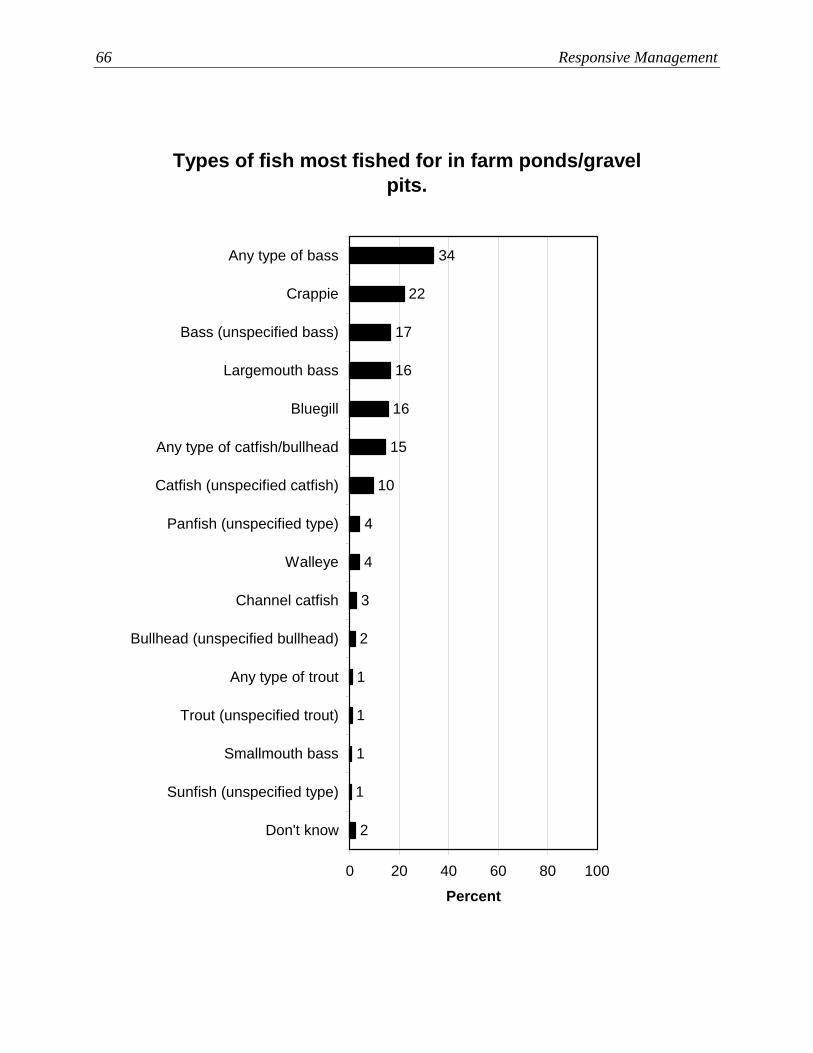
66 Responsive Management
Types of fish most fished for in farm ponds/gravel pits.
2
1
1
1
1
2
3
15
16
16
17
22
34
10
4
4
0 20 40 60 80 100
Any type of bass
Crappie
Bass (unspecified bass)
Largemouth bass
Bluegill
Any type of catfish/bullhead
Catfish (unspecified catfish)
Panfish (unspecified type)
Walleye
Channel catfish
Bullhead (unspecified bullhead)
Any type of trout
Trout (unspecified trout)
Smallmouth bass
Sunfish (unspecified type)
Don't know
Percent

Iowa Angler Survey 67
Q25-47. Species fished for in Iowa in the past 12 months / last year fished.
(Part 1)
2
3
3
8
8
14
48
45
44
42
27
23
9
9
8
4
3
4
7
6
8
6
9
9
9
6
10
13
14
24
31
48
59
57
56
56
0 20 40 60 80 100
Any type of catfish/bullhead
Any type of bass
Bluegill
Crappie
Walleye
Largemouth bass
Channel catfish
Smallmouth bass
Northern pike
Any type of trout
Sunfish (unspecified type)
Panfish (unspecified type)
Flathead catfish
Sauger
Rainbow trout
Perch (unspecified type)
White bass
Saugeye
Mul
tiple
Res
pons
es A
llow
ed
Percent
Casual angler (n=807)Avid angler (n=842)
Note: “Any type of bass” includes those who specifically said “largemouth bass,” “smallmouth bass,” or who simply said, “bass.” This same type of grouping was done for “any type of catfish/bullhead” and “any type of trout.”
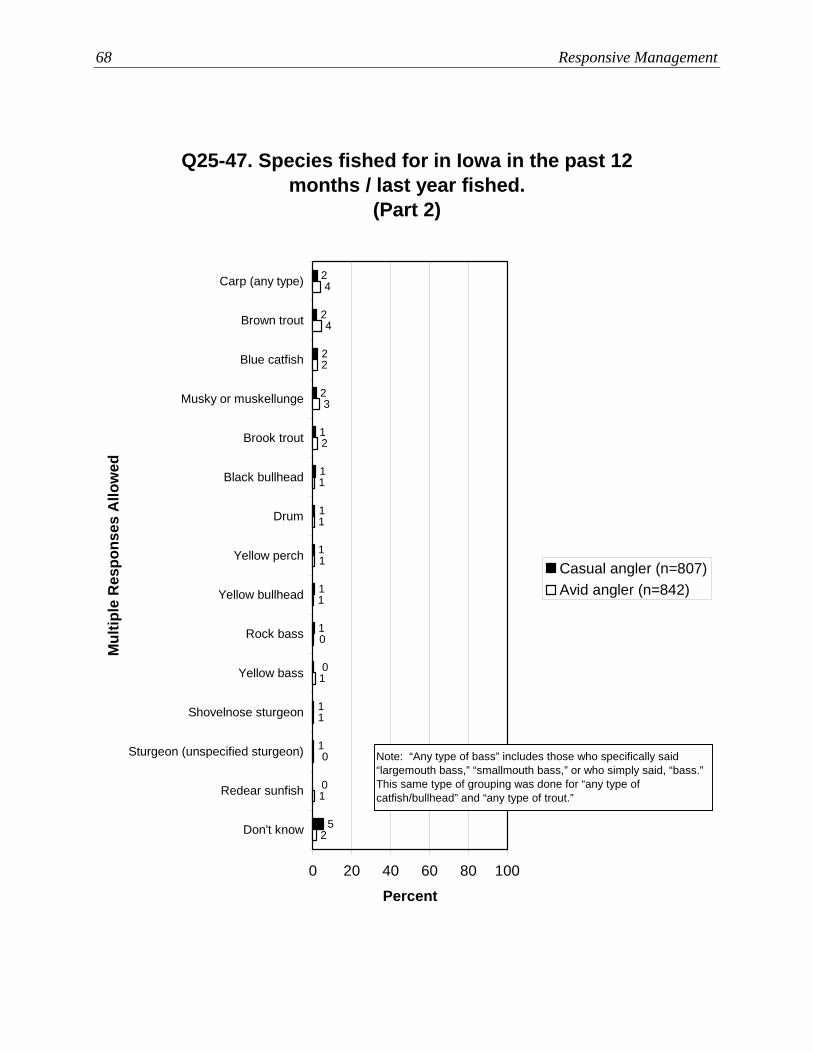
68 Responsive Management
Q25-47. Species fished for in Iowa in the past 12 months / last year fished.
(Part 2)
5
0
1
1
0
1
1
1
2
2
2
2
1
1
1
2
1
0
1
1
0
1
1
1
1
2
3
2
4
4
0 20 40 60 80 100
Carp (any type)
Brown trout
Blue catfish
Musky or muskellunge
Brook trout
Black bullhead
Drum
Yellow perch
Yellow bullhead
Rock bass
Yellow bass
Shovelnose sturgeon
Sturgeon (unspecified sturgeon)
Redear sunfish
Don't know
Mul
tiple
Res
pons
es A
llow
ed
Percent
Casual angler (n=807)Avid angler (n=842)
Note: “Any type of bass” includes those who specifically said “largemouth bass,” “smallmouth bass,” or who simply said, “bass.” This same type of grouping was done for “any type of catfish/bullhead” and “any type of trout.”
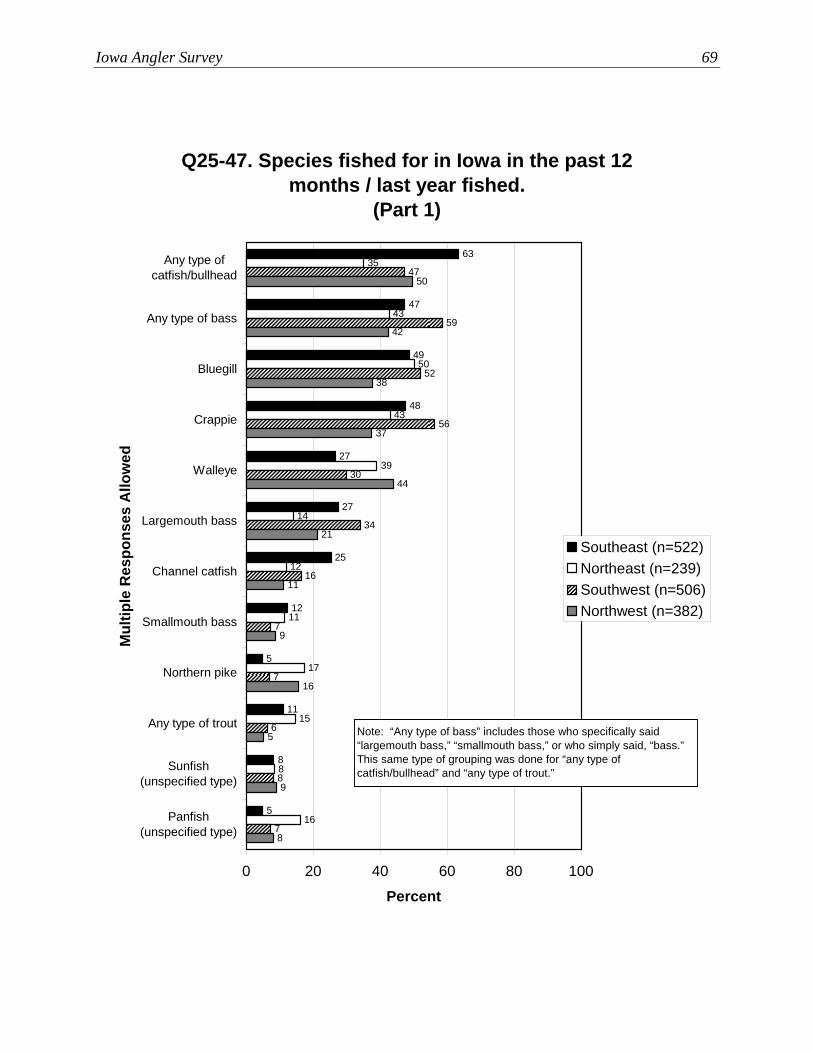
Iowa Angler Survey 69
Q25-47. Species fished for in Iowa in the past 12 months / last year fished.
(Part 1)
5
8
11
27
27
48
49
47
63
25
12
5
16
8
15
17
11
12
14
39
43
50
43
35
7
8
6
7
7
16
34
30
56
47
59
52
8
9
5
16
9
11
21
44
37
50
42
38
0 20 40 60 80 100
Any type ofcatfish/bullhead
Any type of bass
Bluegill
Crappie
Walleye
Largemouth bass
Channel catfish
Smallmouth bass
Northern pike
Any type of trout
Sunfish(unspecified type)
Panfish(unspecified type)
Mul
tiple
Res
pons
es A
llow
ed
Percent
Southeast (n=522)Northeast (n=239)Southwest (n=506)Northwest (n=382)
Note: “Any type of bass” includes those who specifically said “largemouth bass,” “smallmouth bass,” or who simply said, “bass.” This same type of grouping was done for “any type of catfish/bullhead” and “any type of trout.”
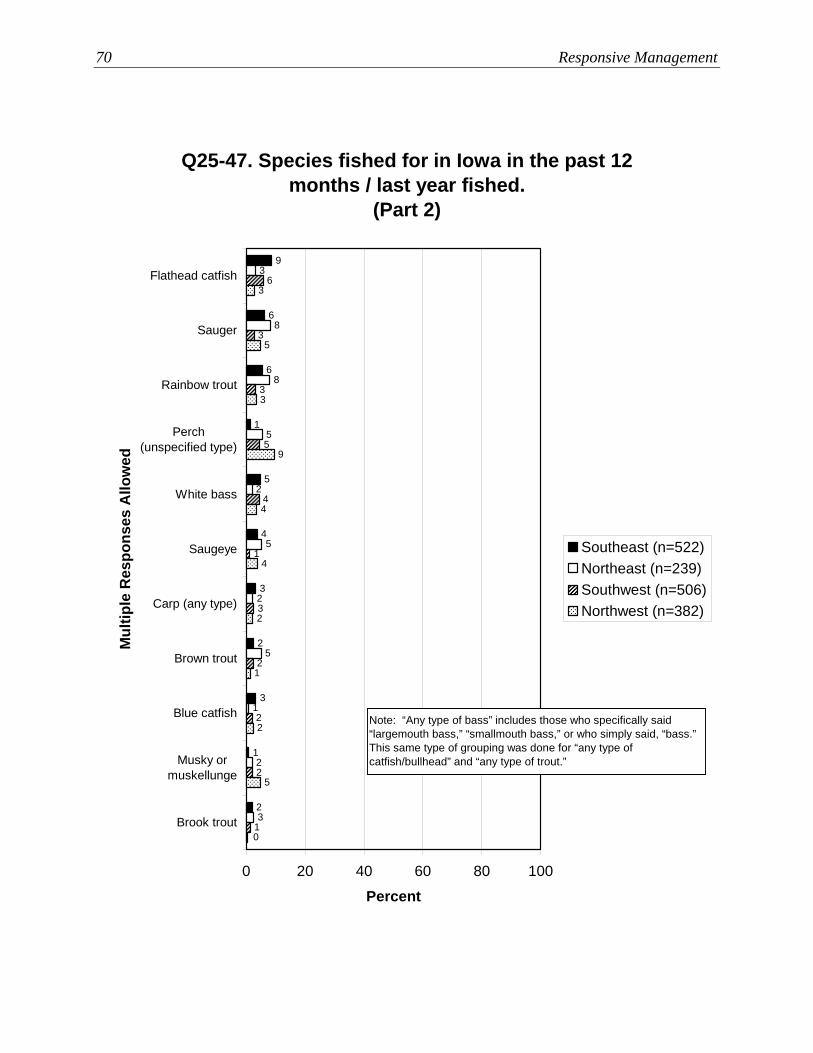
70 Responsive Management
Q25-47. Species fished for in Iowa in the past 12 months / last year fished.
(Part 2)
2
1
4
5
1
6
6
9
3
2
3
3
2
1
5
2
5
2
5
8
8
3
1
2
2
2
3
1
4
5
6
3
3
0
5
2
1
2
4
4
9
3
5
3
0 20 40 60 80 100
Flathead catfish
Sauger
Rainbow trout
Perch(unspecified type)
White bass
Saugeye
Carp (any type)
Brown trout
Blue catfish
Musky ormuskellunge
Brook trout
Mul
tiple
Res
pons
es A
llow
ed
Percent
Southeast (n=522)Northeast (n=239)Southwest (n=506)Northwest (n=382)
Note: “Any type of bass” includes those who specifically said “largemouth bass,” “smallmouth bass,” or who simply said, “bass.” This same type of grouping was done for “any type of catfish/bullhead” and “any type of trout.”
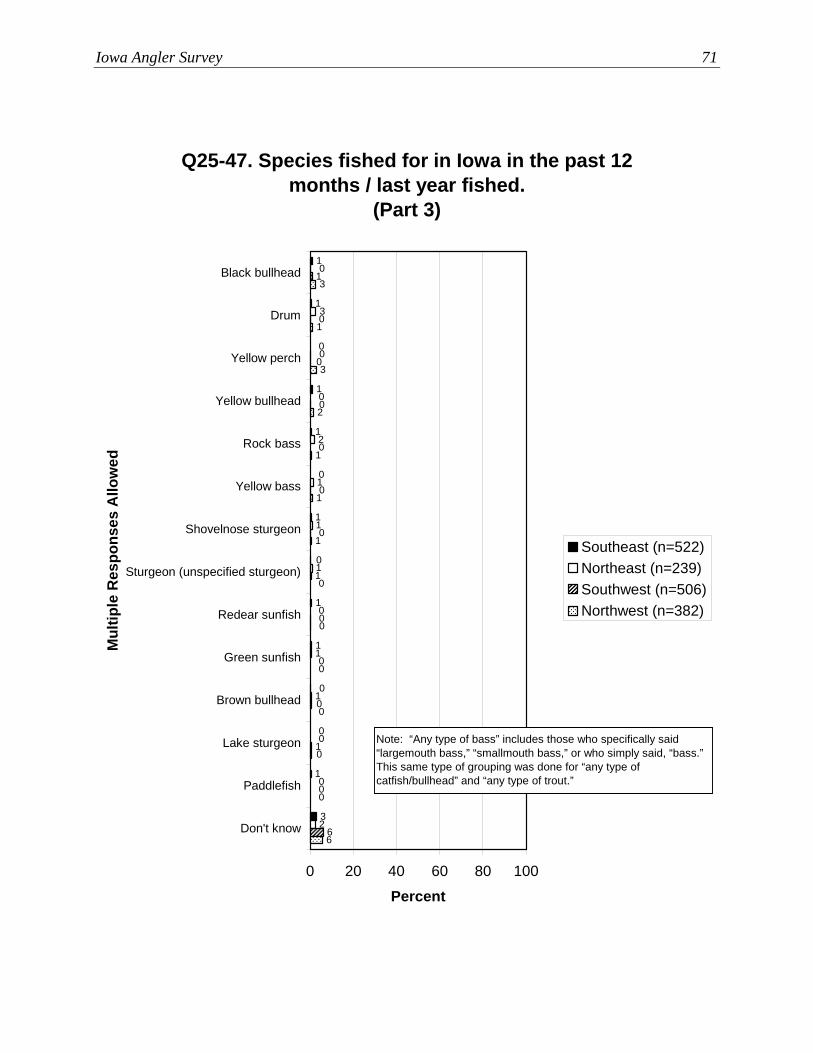
Iowa Angler Survey 71
Q25-47. Species fished for in Iowa in the past 12 months / last year fished.
(Part 3)
3
1
0
0
1
0
1
1
0
1
1
1
0
1
2
0
0
1
1
0
1
1
1
2
0
0
3
0
6
0
1
0
0
0
1
0
0
0
0
1
0
0
6
0
0
0
0
0
0
1
1
1
2
3
1
3
0 20 40 60 80 100
Black bullhead
Drum
Yellow perch
Yellow bullhead
Rock bass
Yellow bass
Shovelnose sturgeon
Sturgeon (unspecified sturgeon)
Redear sunfish
Green sunfish
Brown bullhead
Lake sturgeon
Paddlefish
Don't know
Mul
tiple
Res
pons
es A
llow
ed
Percent
Southeast (n=522)Northeast (n=239)Southwest (n=506)Northwest (n=382)
Note: “Any type of bass” includes those who specifically said “largemouth bass,” “smallmouth bass,” or who simply said, “bass.” This same type of grouping was done for “any type of catfish/bullhead” and “any type of trout.”
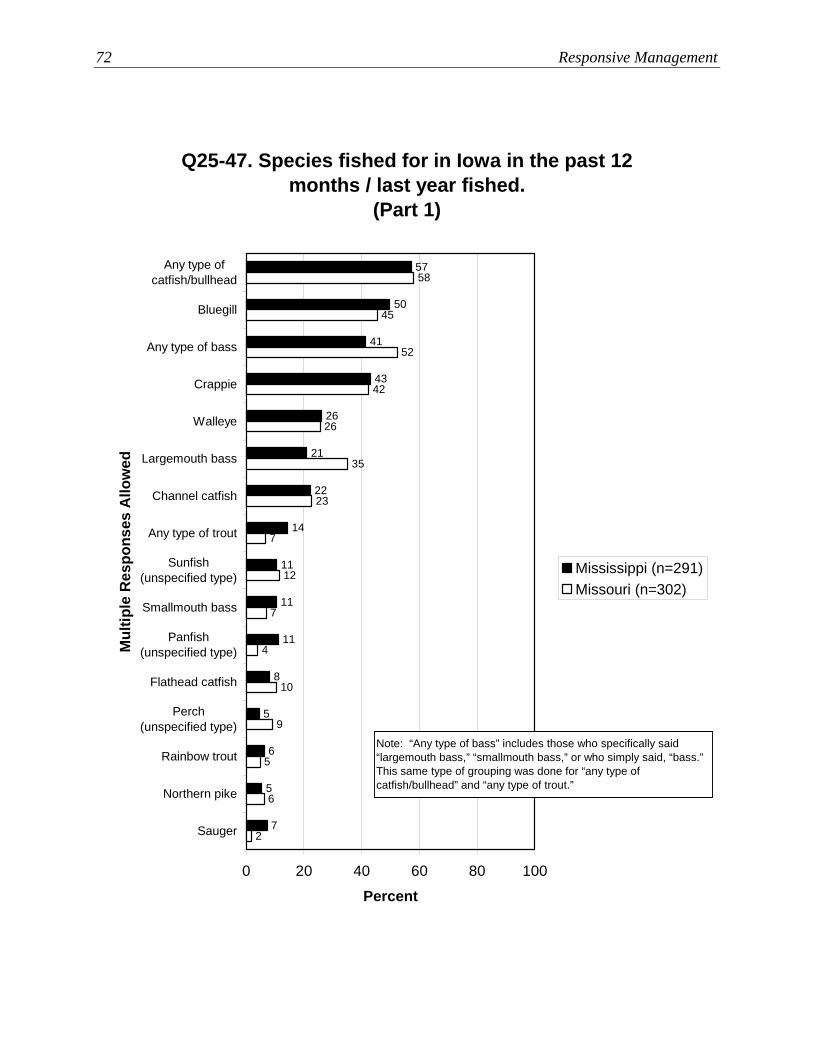
72 Responsive Management
Q25-47. Species fished for in Iowa in the past 12 months / last year fished.
(Part 1)
7
5
6
5
8
11
11
21
26
43
41
50
57
22
14
11
2
6
5
9
10
4
7
12
7
23
35
26
42
52
45
58
0 20 40 60 80 100
Any type ofcatfish/bullhead
Bluegill
Any type of bass
Crappie
Walleye
Largemouth bass
Channel catfish
Any type of trout
Sunfish(unspecified type)
Smallmouth bass
Panfish(unspecified type)
Flathead catfish
Perch(unspecified type)
Rainbow trout
Northern pike
Sauger
Mul
tiple
Res
pons
es A
llow
ed
Percent
Mississippi (n=291)Missouri (n=302)
Note: “Any type of bass” includes those who specifically said “largemouth bass,” “smallmouth bass,” or who simply said, “bass.” This same type of grouping was done for “any type of catfish/bullhead” and “any type of trout.”
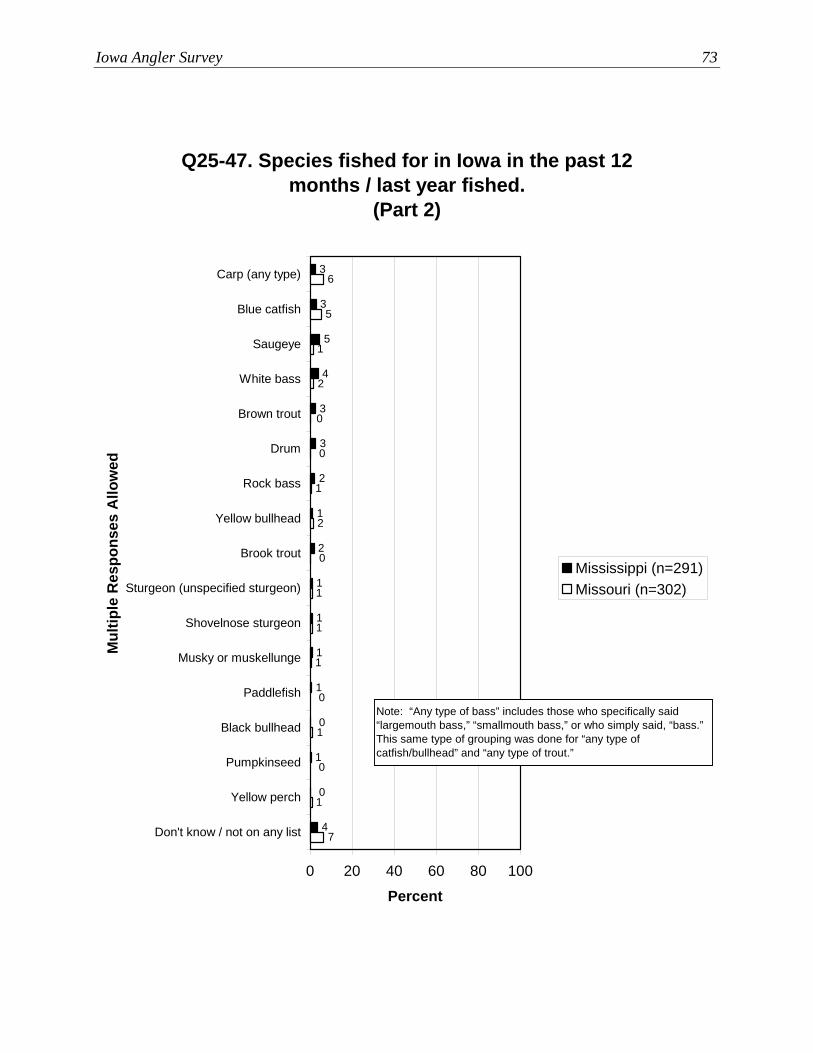
Iowa Angler Survey 73
Q25-47. Species fished for in Iowa in the past 12 months / last year fished.
(Part 2)
4
0
1
0
1
1
1
1
3
3
4
5
3
3
2
1
2
7
1
0
1
0
1
1
1
0
2
1
0
0
2
1
5
6
0 20 40 60 80 100
Carp (any type)
Blue catfish
Saugeye
White bass
Brown trout
Drum
Rock bass
Yellow bullhead
Brook trout
Sturgeon (unspecified sturgeon)
Shovelnose sturgeon
Musky or muskellunge
Paddlefish
Black bullhead
Pumpkinseed
Yellow perch
Don't know / not on any list
Mul
tiple
Res
pons
es A
llow
ed
Percent
Mississippi (n=291)Missouri (n=302)
Note: “Any type of bass” includes those who specifically said “largemouth bass,” “smallmouth bass,” or who simply said, “bass.” This same type of grouping was done for “any type of catfish/bullhead” and “any type of trout.”

74 Responsive Management
Q51. Which one species do you most often fish for in Iowa?
5
1
1
1
1
1
2
9
9
12
16
43
49
8
4
4
0 20 40 60 80 100
Any type of bass
Any type ofcatfish/bullhead
Crappie
Bluegill
Walleye
Largemouth bass
Any type of trout
Channel catfish
Panfish (unspecifiedtype)
Smallmouth bass
Rainbow trout
Northern pike
White bass
Sunfish (unspecifiedtype)
Flathead catfish
Don't know
Percent (n=1649)
Note: “Any type of bass” includes those who specifically said “largemouth bass,” “smallmouth bass,” or who simply said, “bass.” This same type of grouping was done for “any type of catfish/bullhead” and “any type of trout.”

Iowa Angler Survey 75
Q54. Which one species would you most prefer to fish for?
1
1
1
1
2
2
9
10
14
15
39
51
9
4
3
0 20 40 60 80 100
Any type of bass
Any type ofcatfish/bullhead
Crappie
Walleye
Any type of trout
Bluegill
Largemouth bass
Channel catfish
Panfish (unspecifiedtype)
Smallmouth bass
Northern pike
Rainbow trout
Flathead catfish
Brown trout
White bass
Percent (n=1649)
Note: “Any type of bass” includes those who specifically said “largemouth bass,” “smallmouth bass,” or who simply said, “bass.” This same type of grouping was done for “any type of catfish/bullhead” and “any type of trout.”

76 Responsive Management
Q51. Which one species do you most often fish for in Iowa?
4
4
8
48
43
14
12
8
9
2
1
1
1
1
0
6
50
43
19
12
13
8
7
5
4
2
0
1
1
0
2
2
0 20 40 60 80 100
Any type of bass
Any type ofcatfish/bullhead
Crappie
Bluegill
Walleye
Largemouth bass
Any type of trout
Channel catfish
Panfish (unspecifiedtype)
Smallmouth bass
Rainbow trout
Northern pike
White bass
Sunfish (unspecifiedtype)
Flathead catfish
Don't know
Percent
Casual angler (n=807)Avid angler (n=842)
Note: “Any type of bass” includes those who specifically said “largemouth bass,” “smallmouth bass,” or who simply said, “bass.” This same type of grouping was done for “any type of catfish/bullhead” and “any type of trout.”
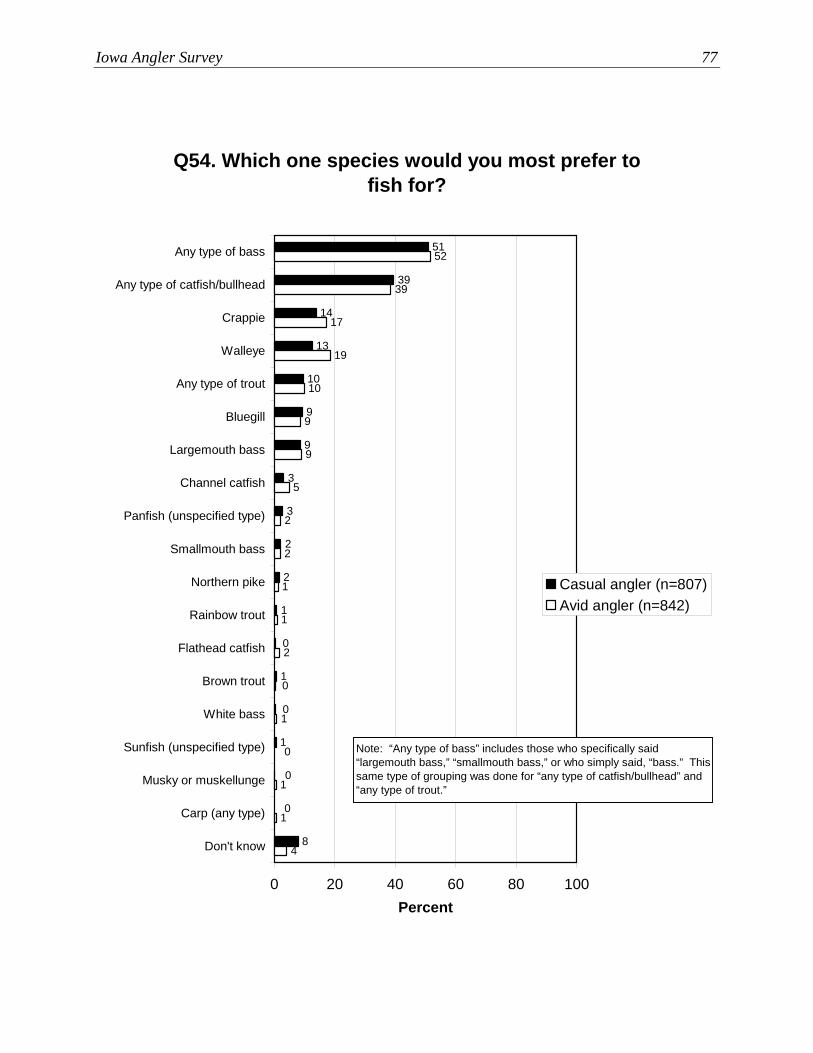
Iowa Angler Survey 77
Q54. Which one species would you most prefer to fish for?
8
0
0
1
0
1
0
1
2
2
9
10
13
14
39
51
9
3
3
4
1
1
0
1
0
2
1
1
2
2
5
9
9
10
19
17
39
52
0 20 40 60 80 100
Any type of bass
Any type of catfish/bullhead
Crappie
Walleye
Any type of trout
Bluegill
Largemouth bass
Channel catfish
Panfish (unspecified type)
Smallmouth bass
Northern pike
Rainbow trout
Flathead catfish
Brown trout
White bass
Sunfish (unspecified type)
Musky or muskellunge
Carp (any type)
Don't know
Percent
Casual angler (n=807)Avid angler (n=842)
Note: “Any type of bass” includes those who specifically said “largemouth bass,” “smallmouth bass,” or who simply said, “bass.” This same type of grouping was done for “any type of catfish/bullhead” and “any type of trout.”

78 Responsive Management
Q51. Which one species do you most often fish for in Iowa?(Part 1)
0
1
1
9
5
11
15
52
39
9
8
2
2
2
3
7
1
18
1
10
20
13
27
54
0
0
2
5
3
4
14
5
11
61
35
23
2
1
2
4
3
3
7
21
8
46
50
10
0 20 40 60 80 100
Any type of bass
Any type ofcatfish/bullhead
Crappie
Bluegill
Walleye
Largemouth bass
Any type of trout
Channel catfish
Panfish(unspecified type)
Smallmouth bass
Rainbow trout
Northern pike
Percent
Southeast (n=522)Northeast (n=239)Southwest (n=506)Northwest (n=382)
Note: “Any type of bass” includes those who specifically said “largemouth bass,” “smallmouth bass,” or who simply said, “bass.” This same type of grouping was done for “any type of catfish/bullhead” and “any type of trout.”

Iowa Angler Survey 79
Q51. Which one species do you most often fish for in Iowa?(Part 2)
6.1
0.3
0.0
0.0
0.4
0.1
0.6
0.6
0.7
1.2
0.3
0.3
0.0
2.7
0.6
0.6
0.3
0.0
0.6
0.0
0.6
0.3
0.3
0.3
1.1
0.0
3.4
0.7
0.0
0.3
0.0
0.0
0.0
0.1
0.3
0.0
0.6
0.0
0.8
5.3
0.5
0.2
0.2
0.9
0.0
0.8
0.0
0.5
0.2
0.2
0.8
0.2
0 20 40 60 80 100
White bass
Sunfish (unspecified type)
Flathead catfish
Brown trout
Carp (any type)
Blue catfish
Black bullhead
Drum
Yellow bullhead
Yellow bass
Green sunfish
Other
Don't know
Percent
Southeast (n=522)Northeast (n=239)Southwest (n=506)Northwest (n=382)
Note: “Any type of bass” includes those who specifically said “largemouth bass,” “smallmouth bass,” or who simply said, “bass.” This same type of grouping was done for “any type of catfish/bullhead” and “any type of trout.”
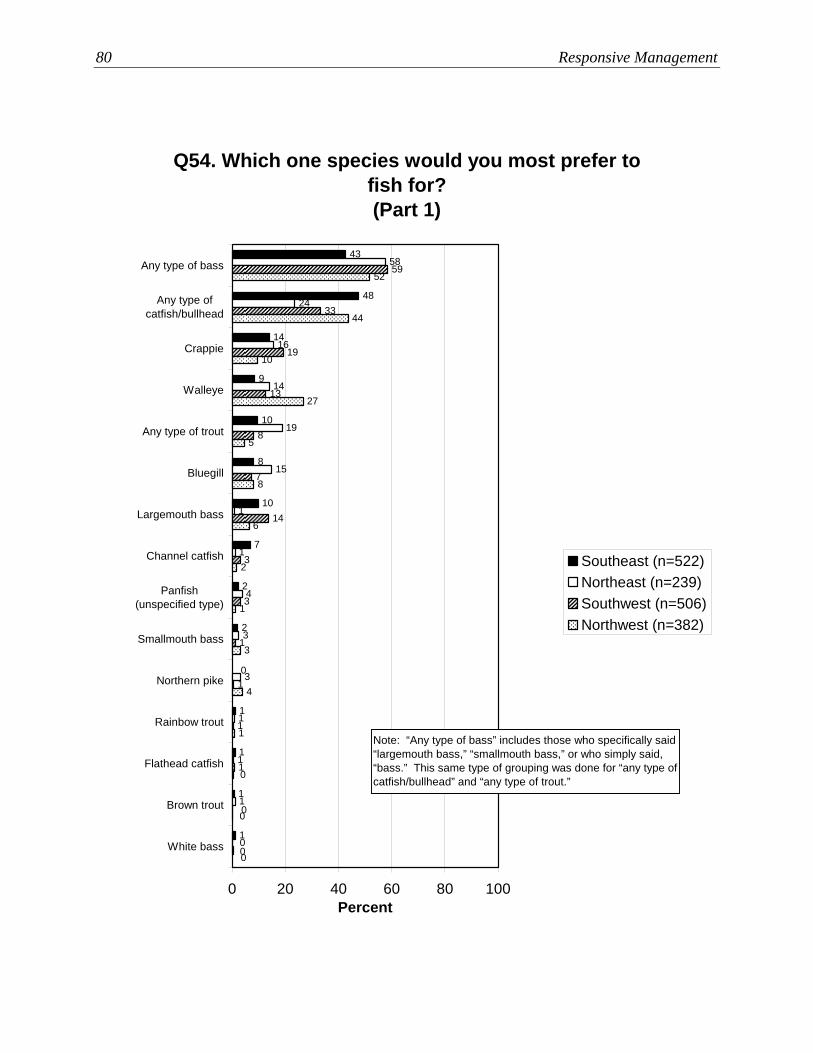
80 Responsive Management
Q54. Which one species would you most prefer to fish for?(Part 1)
1
1
1
1
0
2
8
10
9
14
48
43
10
7
2
0
1
1
1
3
3
4
1
1
15
19
14
16
24
58
0
0
1
1
1
1
3
3
14
7
8
13
59
33
19
0
0
0
1
4
3
1
2
6
8
5
27
52
44
10
0 20 40 60 80 100
Any type of bass
Any type ofcatfish/bullhead
Crappie
Walleye
Any type of trout
Bluegill
Largemouth bass
Channel catfish
Panfish(unspecified type)
Smallmouth bass
Northern pike
Rainbow trout
Flathead catfish
Brown trout
White bass
Percent
Southeast (n=522)Northeast (n=239)Southwest (n=506)Northwest (n=382)
Note: “Any type of bass” includes those who specifically said “largemouth bass,” “smallmouth bass,” or who simply said, “bass.” This same type of grouping was done for “any type of catfish/bullhead” and “any type of trout.”

Iowa Angler Survey 81
Q54. Which one species would you most prefer to fish for?(Part 2)
8
1
0
0
0
0
0
0
0
0
0
0
4
1
1
1
1
1
1
0
0
1
1
0
6
1
0
0
0
0
0
0
0
0
0
0
8
0
0
0
0
0
0
1
1
2
1
0
0 20 40 60 80 100
Perch (unspecified type)
Sunfish (unspecified type)
Blue catfish
Yellow bullhead
Black bullhead
Carp (any type)
Yellow bass
Rock bass
Sauger
Drum
Other
Don't know
Percent
Southeast (n=522)Northeast (n=239)Southwest (n=506)Northwest (n=382)
Note: “Any type of bass” includes those who specifically said “largemouth bass,” “smallmouth bass,” or who simply said, “bass.” This same type of grouping was done for “any type of catfish/bullhead” and “any type of trout.”
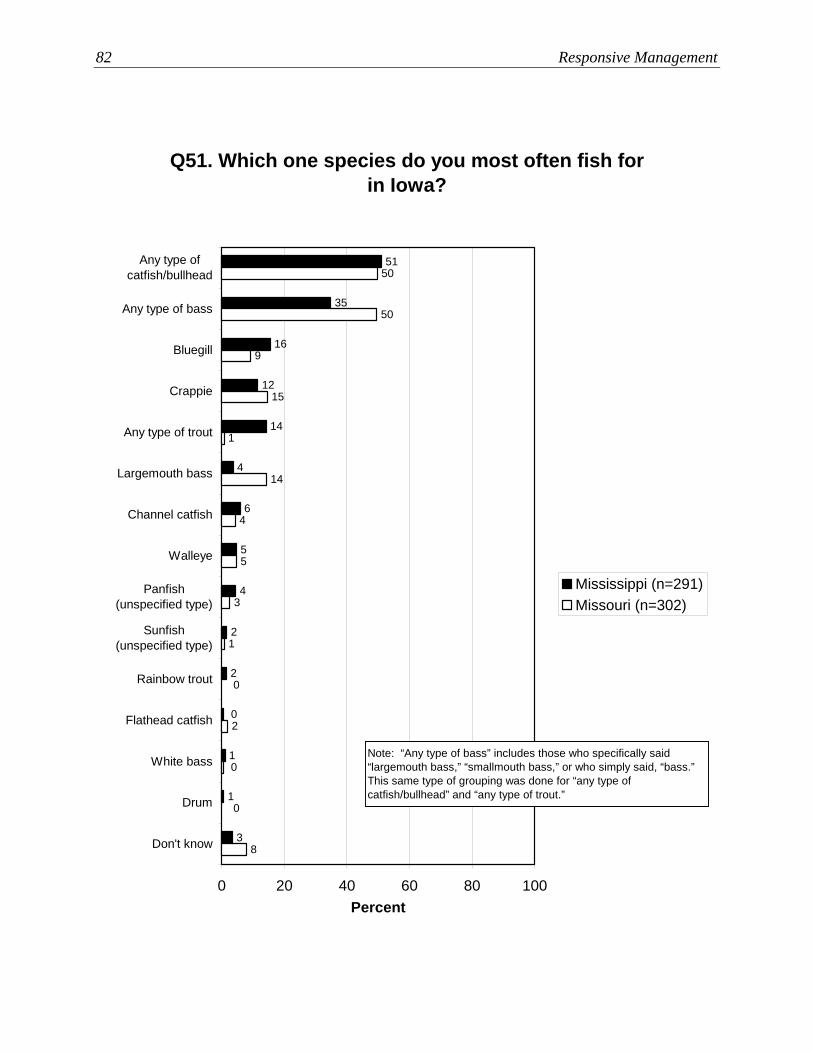
82 Responsive Management
Q51. Which one species do you most often fish for in Iowa?
3
1
1
0
2
2
4
14
12
16
35
51
6
5
4
8
0
0
2
0
1
3
5
4
14
1
15
9
50
50
0 20 40 60 80 100
Any type ofcatfish/bullhead
Any type of bass
Bluegill
Crappie
Any type of trout
Largemouth bass
Channel catfish
Walleye
Panfish(unspecified type)
Sunfish(unspecified type)
Rainbow trout
Flathead catfish
White bass
Drum
Don't know
Percent
Mississippi (n=291)Missouri (n=302)
Note: “Any type of bass” includes those who specifically said “largemouth bass,” “smallmouth bass,” or who simply said, “bass.” This same type of grouping was done for “any type of catfish/bullhead” and “any type of trout.”

Iowa Angler Survey 83
Q54. Which one species would you most prefer to fish for?
6
0
1
1
0
1
1
1
1
1
1
2
1
8
13
12
11
41
45
3
6
3
10
1
0
0
2
0
0
0
1
0
0
1
3
0
3
14
14
2
6
13
53
45
0 20 40 60 80 100
Any type of catfish/bullhead
Any type of bass
Crappie
Bluegill
Any type of trout
Walleye
Largemouth bass
Channel catfish
Panfish (unspecified type)
Flathead catfish
Smallmouth bass
Sunfish (unspecified type)
White bass
Northern pike
Rainbow trout
Sauger
Blue catfish
Perch (unspecified type)
Brown trout
Drum
Black bullhead
Don't know
Percent
Mississippi (n=291)Missouri (n=302)
Note: “Any type of bass” includes those who specifically said “largemouth bass,” “smallmouth bass,” or who simply said, “bass.” This same type of grouping was done for “any type of catfish/bullhead” and “any type of trout.”
84 Responsive Management
METHODS OF FISHING Methods of Fishing in General
The large majority of Iowa anglers (83%) fished from the shore at least some of the time,
while 62% fished from a boat, 46% fished from a pier or dock, and 11% waded while fishing
in Iowa in the past 12 months or last year they fished.
• Avid anglers are more likely than casual anglers to have fished from a boat, fished from a
pier or dock, or waded while fishing in the past 12 months or last year they fished.
• In the regional crosstabulation, Northeast Region anglers are slightly more likely than the
other anglers to have fished from a boat. Meanwhile, Northwest Region anglers are more
likely than the other anglers to have fished from a pier or dock.
• Interestingly, Mississippi River Region anglers are only slightly more likely than anglers
overall to have fished from a boat. Mississippi River Region anglers are less likely than
anglers overall to have fished from a pier or dock. Missouri River Region anglers are
slightly less likely to have fished from a boat, when compared to anglers overall, and they
are about the same regarding fishing from a pier or dock.
A large majority of Iowa anglers (72%) did catch-and-release fishing at least some of the
time. Smaller amounts went ice fishing (15%), fly fishing (7%), or fishing in a tournament
(3%) in Iowa in the past 12 months or last year they fished.
• Avid anglers are more likely than casual anglers to have done catch-and-release, gone ice
fishing, gone fly fishing, or fished in a tournament in the past 12 months or last year they
fished in Iowa.
• The regional crosstabulation shows no marked differences among the regions on this
question.
• The data analysis by river region found no marked differences between anglers overall
and anglers from either river region on this question.
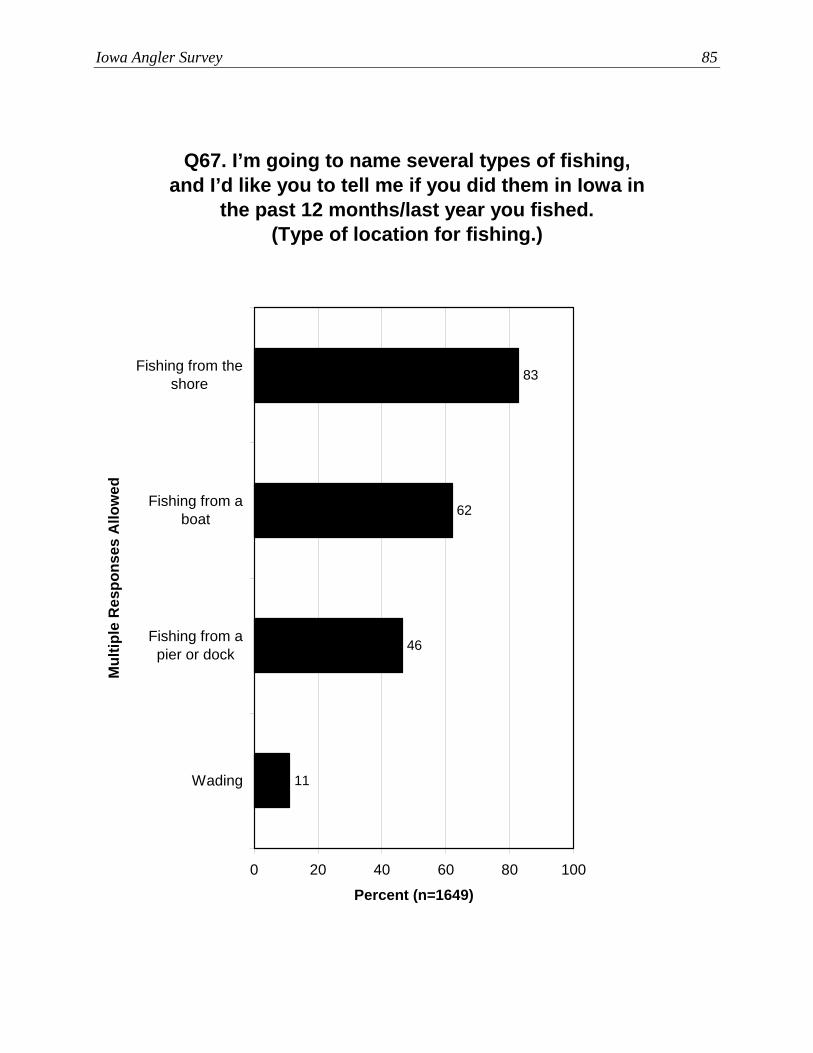
Iowa Angler Survey 85
Q67. I’m going to name several types of fishing, and I’d like you to tell me if you did them in Iowa in
the past 12 months/last year you fished. (Type of location for fishing.)
11
46
62
83
0 20 40 60 80 100
Fishing from theshore
Fishing from aboat
Fishing from apier or dock
Wading
Mul
tiple
Res
pons
es A
llow
ed
Percent (n=1649)

86 Responsive Management
Q67. I’m going to name several types of fishing, and I’d like you to tell me if you did them in Iowa in the past 12 months/last year you fished. (Type of
location for fishing.)
9
44
55
83
16
51
77
82
0 20 40 60 80 100
Fishing fromthe shore
Fishing from aboat
Fishing from apier or dock
Wading
Mul
tiple
Res
pons
es A
llow
ed
Percent
Casual angler (n=807)Avid angler (n=842)

Iowa Angler Survey 87
Q67. I’m going to name several types of fishing, and I’d like you to tell me if you did them in Iowa in
the past 12 months/last year you fished.
11
42
63
84
13
42
68
78
10
86
61
47
11
81
57
56
0 20 40 60 80 100
Fishing fromthe shore
Fishing from aboat
Fishing from apier or dock
Wading
Mul
tiple
Res
pons
es A
llow
ed
Percent
Southeast (n=522)Northeast (n=239)Southwest (n=506)Northwest (n=382)
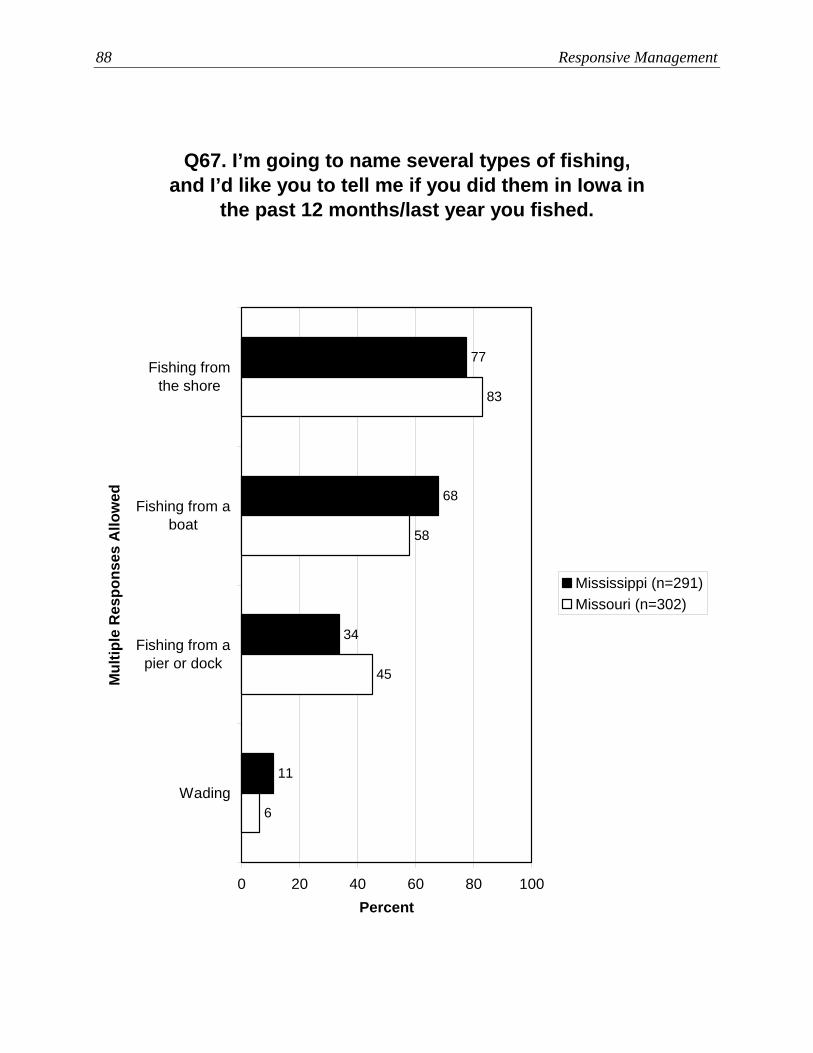
88 Responsive Management
Q67. I’m going to name several types of fishing, and I’d like you to tell me if you did them in Iowa in
the past 12 months/last year you fished.
11
34
68
77
6
45
58
83
0 20 40 60 80 100
Fishing fromthe shore
Fishing from aboat
Fishing from apier or dock
Wading
Mul
tiple
Res
pons
es A
llow
ed
Percent
Mississippi (n=291)Missouri (n=302)

Iowa Angler Survey 89
Q67. I’m going to name several types of fishing, and I’d like you to tell me if you did them in Iowa in
the past 12 months/last year you fished.(Types of fishing.)
3
7
15
72
0 20 40 60 80 100
Catch-and-release fishing
Ice fishing
Fly fishing
Fishing in atournament
Mul
tiple
Res
pons
es A
llow
ed
Percent (n=1649)

90 Responsive Management
Q67. I’m going to name several types of fishing, and I’d like you to tell me if you did them in Iowa in the past 12 months/last year you fished. (Type of
fishing.)
2
7
10
68
5
9
26
80
0 20 40 60 80 100
Catch-and-release fishing
Ice fishing
Fly fishing
Fishing in atournament
Mul
tiple
Res
pons
es A
llow
ed
Percent
Casual angler (n=807)Avid angler (n=842)
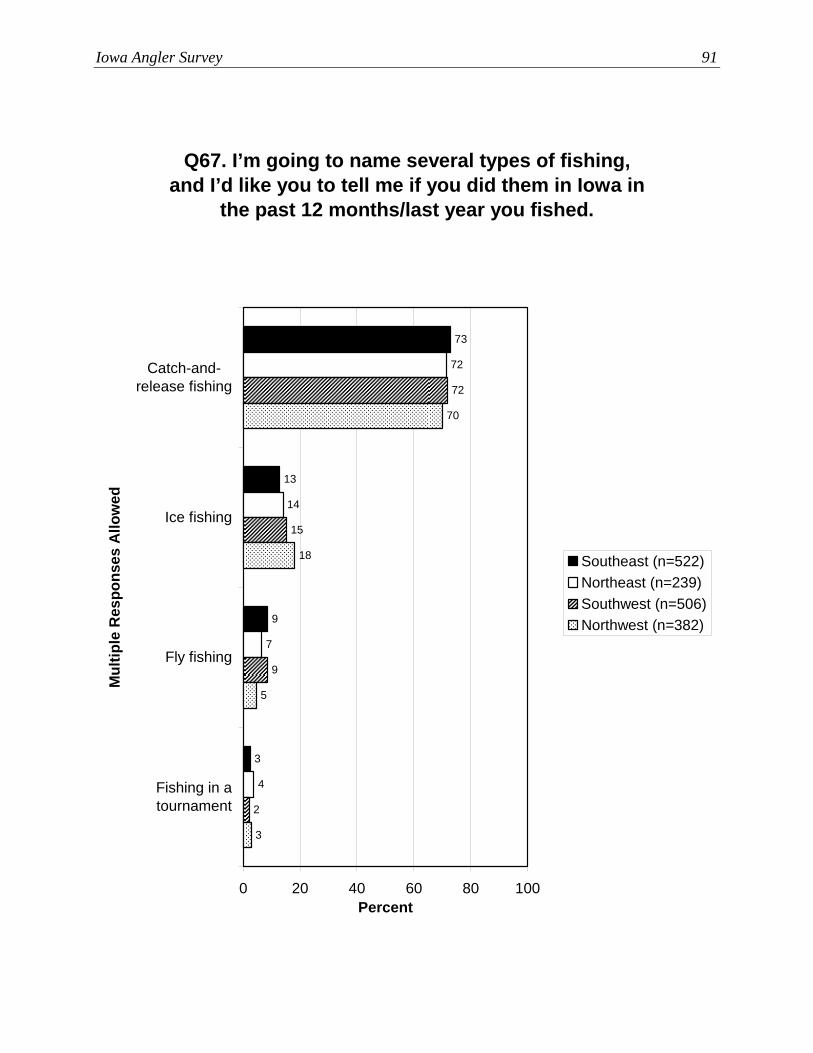
Iowa Angler Survey 91
Q67. I’m going to name several types of fishing, and I’d like you to tell me if you did them in Iowa in
the past 12 months/last year you fished.
3
9
13
73
4
7
14
72
2
72
15
9
3
70
18
5
0 20 40 60 80 100
Catch-and-release fishing
Ice fishing
Fly fishing
Fishing in atournament
Mul
tiple
Res
pons
es A
llow
ed
Percent
Southeast (n=522)Northeast (n=239)Southwest (n=506)Northwest (n=382)
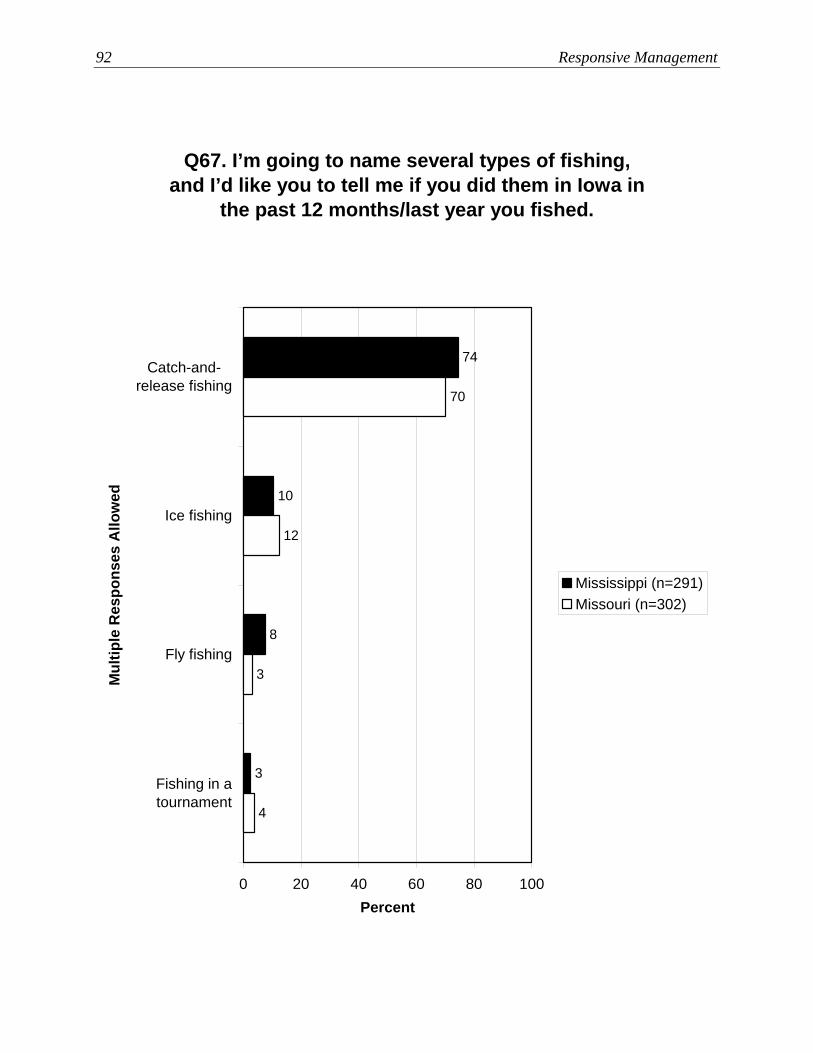
92 Responsive Management
Q67. I’m going to name several types of fishing, and I’d like you to tell me if you did them in Iowa in
the past 12 months/last year you fished.
3
8
10
74
4
3
12
70
0 20 40 60 80 100
Catch-and-release fishing
Ice fishing
Fly fishing
Fishing in atournament
Mul
tiple
Res
pons
es A
llow
ed
Percent
Mississippi (n=291)Missouri (n=302)

Iowa Angler Survey 93
Catch-and-Release Fishing The previous section indicated that a large majority of Iowa anglers (72%) had done catch-
and-release fishing at least once in the last year they fished. Note that the survey was
structured to determine the amount of trout typically released versus non-trout released by
those who fished for trout and other species.
• Those who fished for trout and who indicated having done catch-and-release were asked
about the amount of trout they release: 66% release about half or more, while 30%
release few to none.
• Those same anglers (who fished for trout and other species and who indicated having
done catch-and-release) were asked about the amount of non-trout they release: 77%
release half or more, while 20% release few to none.
• Those anglers who did not fish for trout and who indicated having done catch-and-release
were asked about the amount of fish they release: 84% release half or more, while 15%
release few to none.
• Casual anglers are more likely to release fish—both trout and non-trout—than are avid
anglers on all three of these questions.
• The regional crosstabulations found that Southeast Region and Northwest Region anglers
are more likely to say that they release all trout and all other fish that they catch, relative
to the other two regions (among anglers who fished for both trout and other species).
Those who did not fish for trout are about the same from region to region in their catch-
and-release behavior.
• The data analysis compared river region anglers to anglers overall regarding catch-and-
release of fish other than trout (this river region analysis did not examine trout fishing
because the data indicate that trout is not an important type of fish in the river regions).
Missouri River Region anglers are more likely to release all the fish they catch than are
either anglers overall or anglers from the Mississippi River Region.
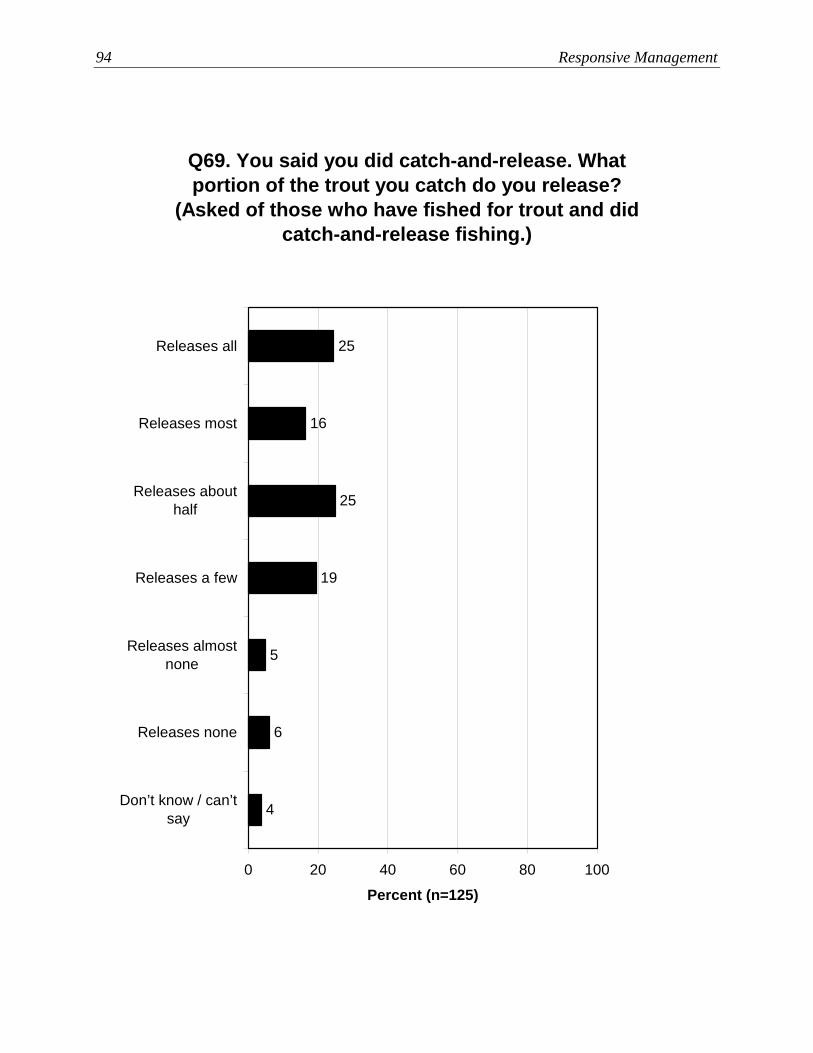
94 Responsive Management
Q69. You said you did catch-and-release. What portion of the trout you catch do you release?
(Asked of those who have fished for trout and did catch-and-release fishing.)
6
5
19
25
16
25
4
0 20 40 60 80 100
Releases all
Releases most
Releases abouthalf
Releases a few
Releases almostnone
Releases none
Don’t know / can’tsay
Percent (n=125)
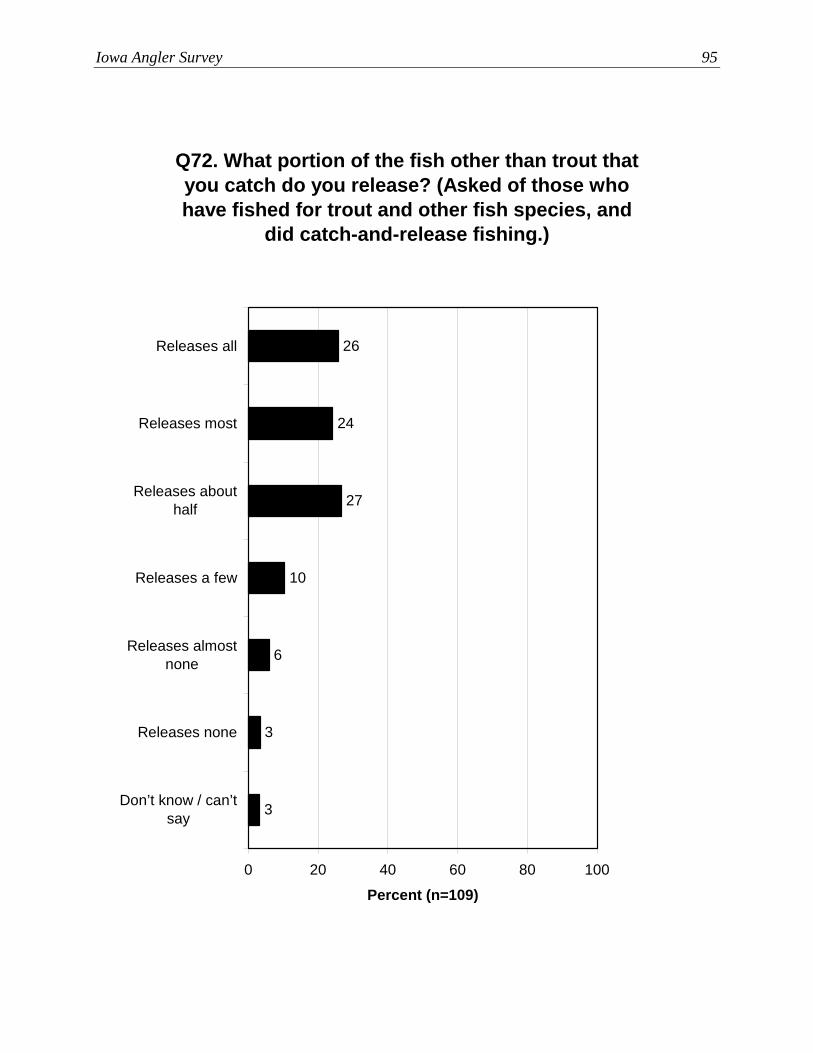
Iowa Angler Survey 95
Q72. What portion of the fish other than trout that you catch do you release? (Asked of those who have fished for trout and other fish species, and
did catch-and-release fishing.)
3
6
10
27
24
26
3
0 20 40 60 80 100
Releases all
Releases most
Releases abouthalf
Releases a few
Releases almostnone
Releases none
Don’t know / can’tsay
Percent (n=109)
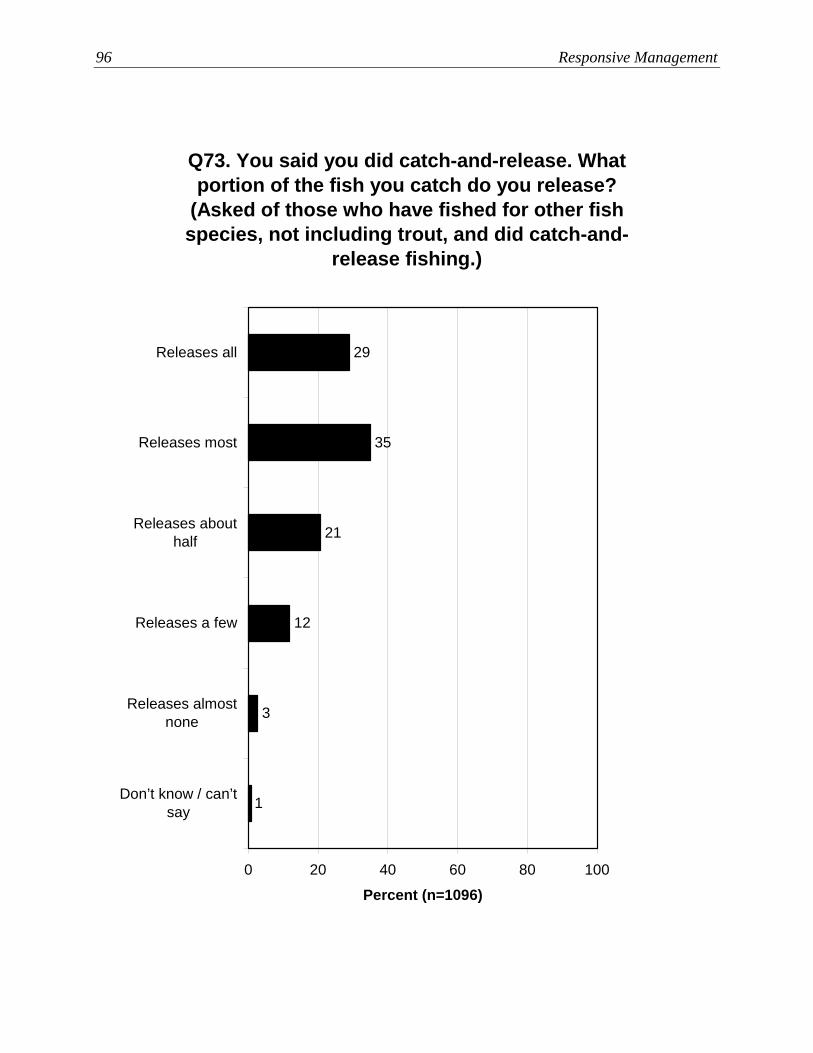
96 Responsive Management
Q73. You said you did catch-and-release. What portion of the fish you catch do you release?
(Asked of those who have fished for other fish species, not including trout, and did catch-and-
release fishing.)
1
3
12
21
35
29
0 20 40 60 80 100
Releases all
Releases most
Releases abouthalf
Releases a few
Releases almostnone
Don’t know / can’tsay
Percent (n=1096)
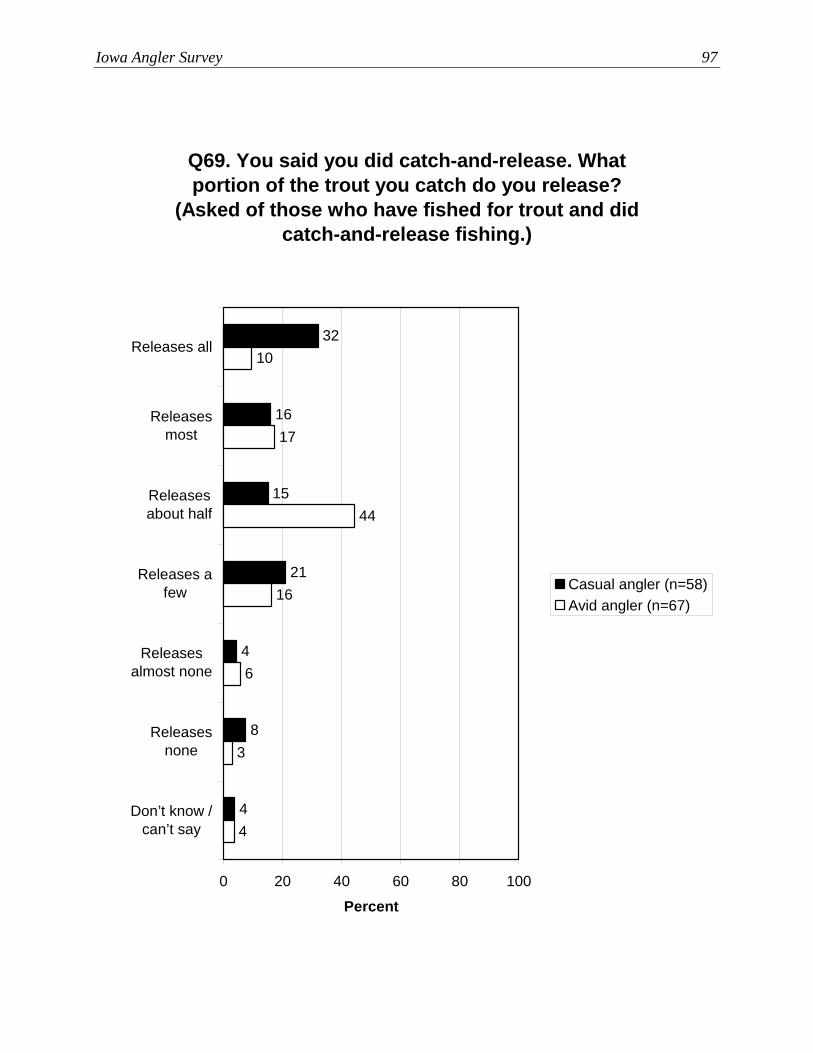
Iowa Angler Survey 97
Q69. You said you did catch-and-release. What portion of the trout you catch do you release?
(Asked of those who have fished for trout and did catch-and-release fishing.)
8
4
21
15
16
32
44
3
6
16
44
17
10
0 20 40 60 80 100
Releases all
Releasesmost
Releasesabout half
Releases afew
Releasesalmost none
Releasesnone
Don’t know /can’t say
Percent
Casual angler (n=58)Avid angler (n=67)
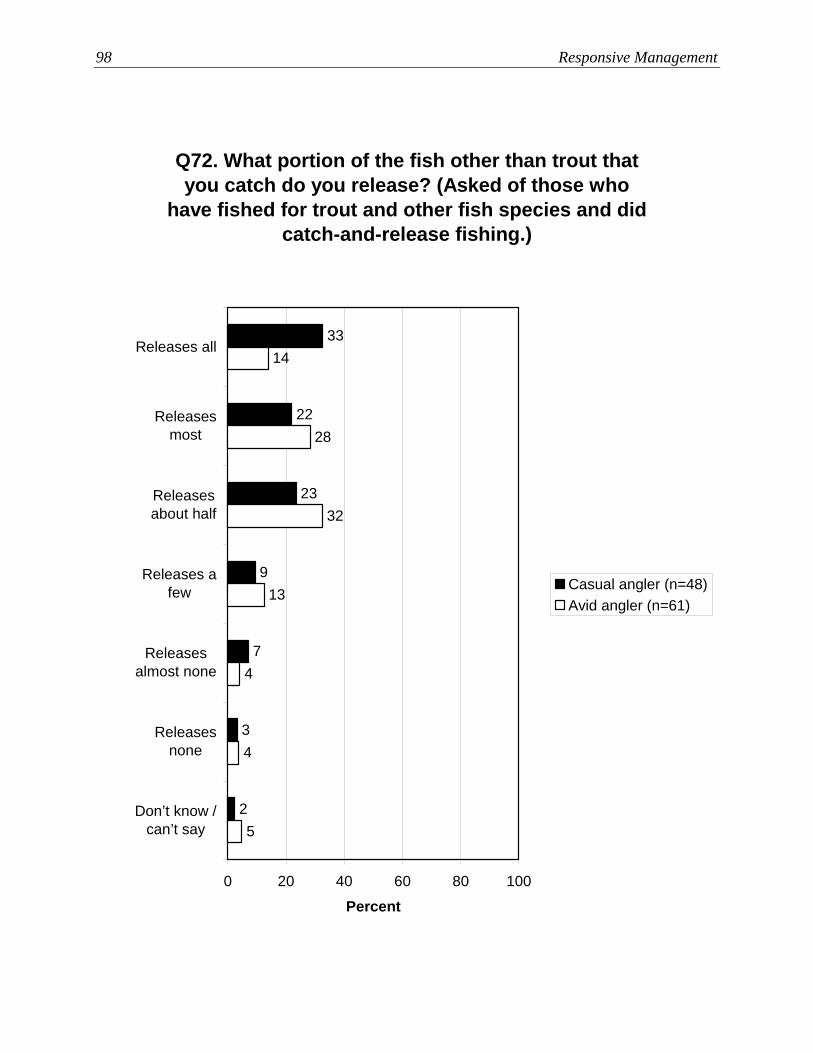
98 Responsive Management
Q72. What portion of the fish other than trout that you catch do you release? (Asked of those who
have fished for trout and other fish species and did catch-and-release fishing.)
3
7
9
23
22
33
25
4
4
13
32
28
14
0 20 40 60 80 100
Releases all
Releasesmost
Releasesabout half
Releases afew
Releasesalmost none
Releasesnone
Don’t know /can’t say
Percent
Casual angler (n=48)Avid angler (n=61)
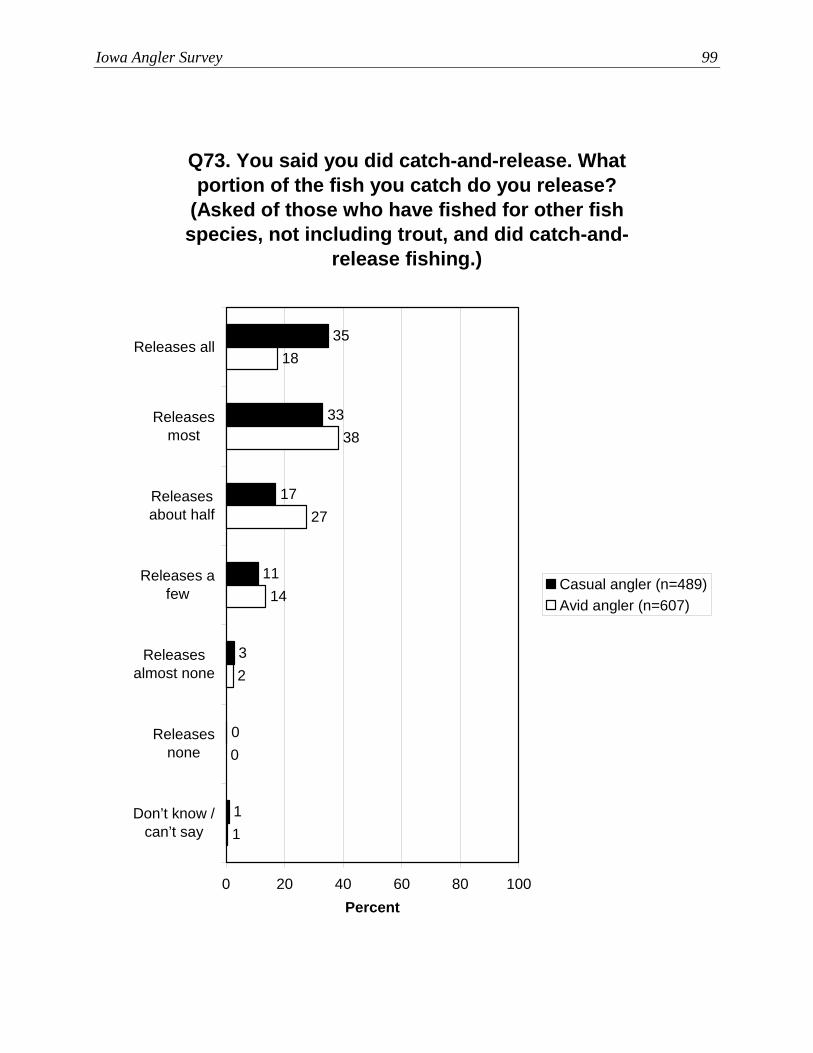
Iowa Angler Survey 99
Q73. You said you did catch-and-release. What portion of the fish you catch do you release?
(Asked of those who have fished for other fish species, not including trout, and did catch-and-
release fishing.)
0
3
11
17
33
35
11
0
2
14
27
38
18
0 20 40 60 80 100
Releases all
Releasesmost
Releasesabout half
Releases afew
Releasesalmost none
Releasesnone
Don’t know /can’t say
Percent
Casual angler (n=489)Avid angler (n=607)
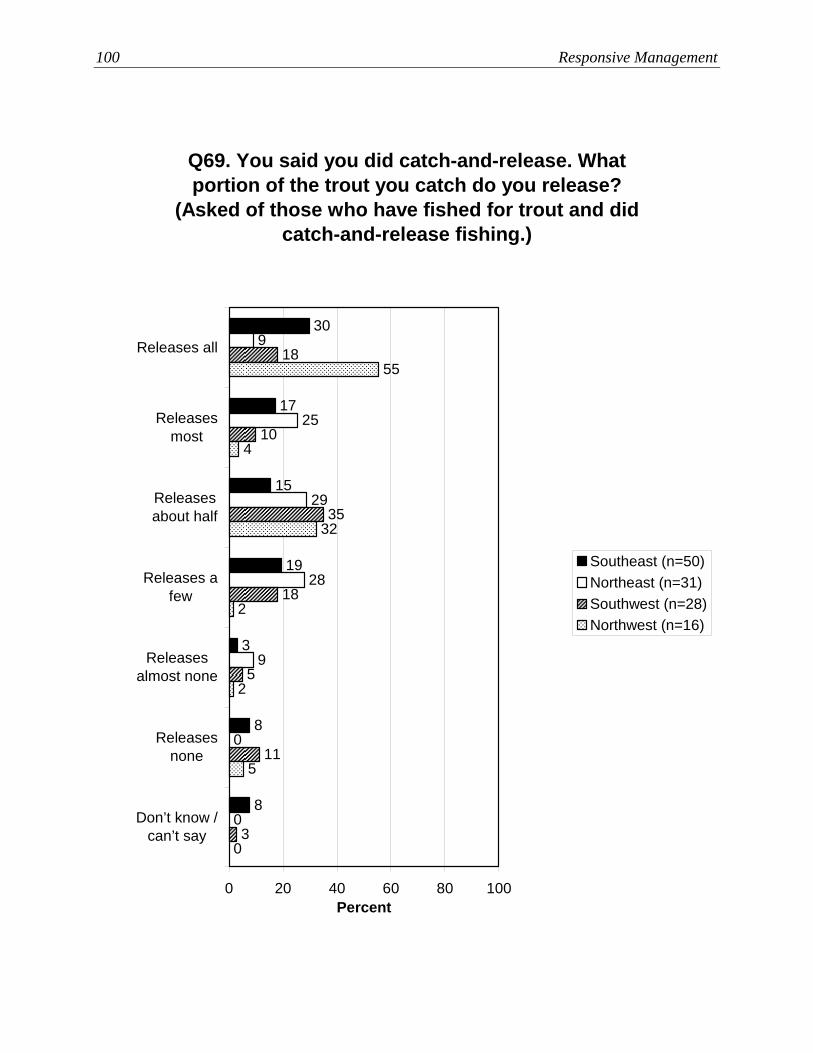
100 Responsive Management
Q69. You said you did catch-and-release. What portion of the trout you catch do you release?
(Asked of those who have fished for trout and did catch-and-release fishing.)
8
3
19
15
17
30
80
0
9
28
29
25
9
3
11
5
18
18
10
35
0
5
2
2
55
4
32
0 20 40 60 80 100
Releases all
Releasesmost
Releasesabout half
Releases afew
Releasesalmost none
Releasesnone
Don’t know /can’t say
Percent
Southeast (n=50)Northeast (n=31)Southwest (n=28)Northwest (n=16)
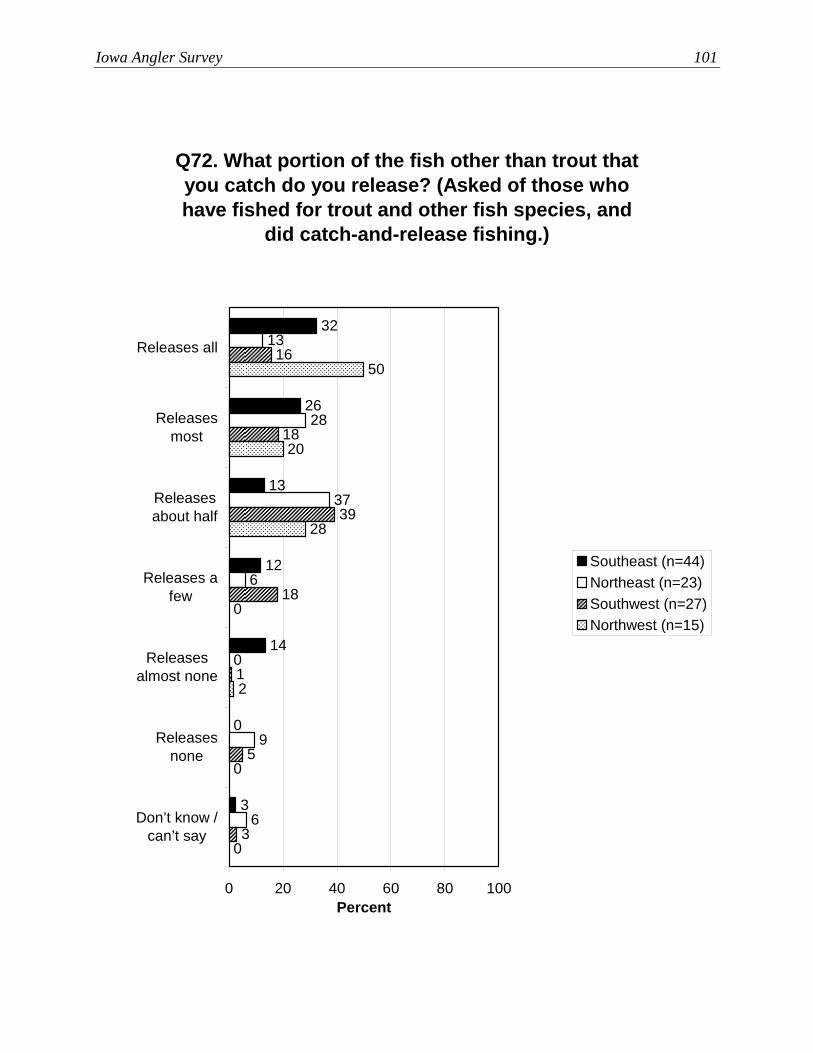
Iowa Angler Survey 101
Q72. What portion of the fish other than trout that you catch do you release? (Asked of those who have fished for trout and other fish species, and
did catch-and-release fishing.)
0
14
12
13
26
32
36
9
0
6
37
28
13
3
5
1
18
16
18
39
0
0
2
0
50
20
28
0 20 40 60 80 100
Releases all
Releasesmost
Releasesabout half
Releases afew
Releasesalmost none
Releasesnone
Don’t know /can’t say
Percent
Southeast (n=44)Northeast (n=23)Southwest (n=27)Northwest (n=15)

102 Responsive Management
Q73. You said you did catch-and-release. What portion of the fish you catch do you release?
(Asked of those who have fished for other fish species, not including trout, and did catch-and-
release fishing.)
0
3
13
21
34
28
11
0
2
10
25
34
27
1
0
2
10
29
40
18
0
0
3
15
32
29
20
0 20 40 60 80 100
Releases all
Releasesmost
Releasesabout half
Releases afew
Releasesalmost none
Releasesnone
Don’t know /can’t say
Percent
Southeast (n=342)Northeast (n=145)Southwest (n=340)Northwest (n=269)
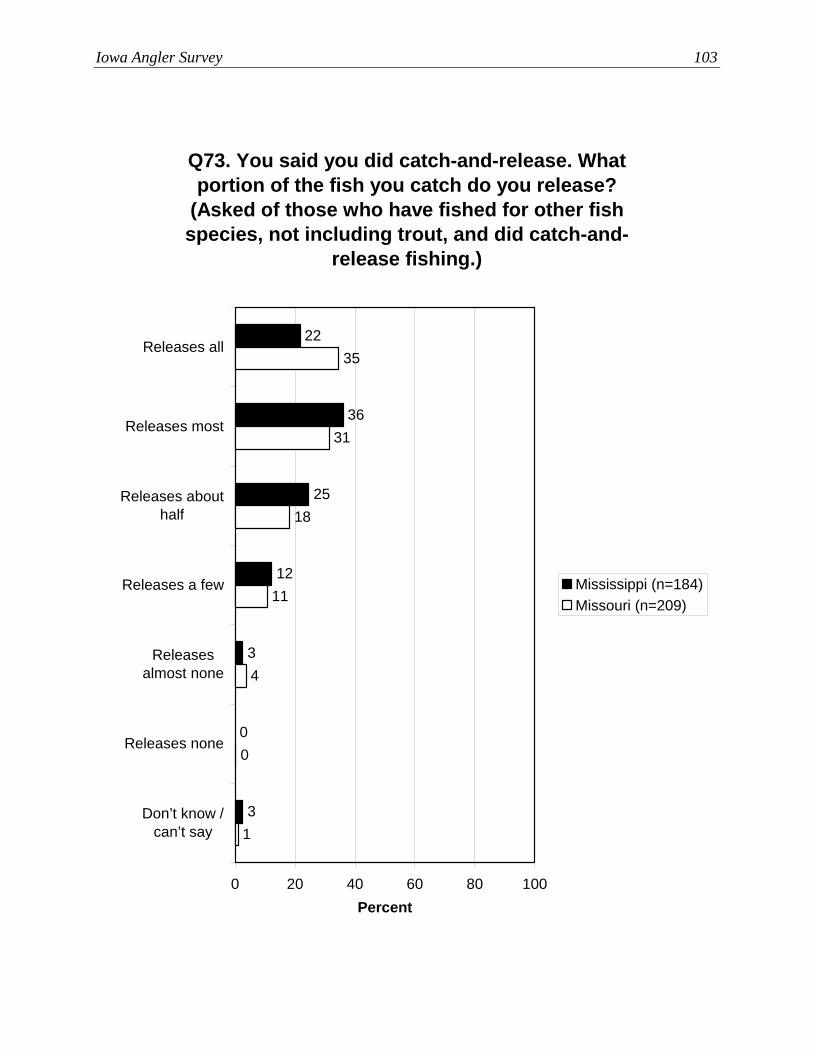
Iowa Angler Survey 103
Q73. You said you did catch-and-release. What portion of the fish you catch do you release?
(Asked of those who have fished for other fish species, not including trout, and did catch-and-
release fishing.)
0
3
12
25
36
22
31
0
4
11
18
31
35
0 20 40 60 80 100
Releases all
Releases most
Releases abouthalf
Releases a few
Releasesalmost none
Releases none
Don’t know /can’t say
Percent
Mississippi (n=184)Missouri (n=209)

104 Responsive Management
Fishing from a Boat A previous section indicated that 62% of Iowa anglers had fished from a boat at least once in
the last year they fished.
• The majority of the anglers who had fished from a boat (70%) had done so for 10 days or
less in their most recent year of fishing. (Another graph shows the days fished from a
boat among all anglers.)
• The crosstabulation by avid versus casual angler demonstrates that avid anglers fished
more days on a boat than did casual anglers.
• The regional crosstabulation shows no large differences among the regions on this
question regarding days fished on a boat.
• The data analysis by river region found that anglers from the Mississippi River Region
and the Missouri River Region spent more time fishing from a boat than did anglers
overall.
• Another question asked anglers who had fished from a boat about the amount of their
fishing that is done from a boat: 21% said all their fishing is from a boat, another 30%
said that most of their fishing is from a boat, and 20% said at least half is done that way,
for a total of 71% of “boater-anglers” doing at least half of their fishing from a boat.
(Another graph shows these results among all anglers.)
• Avid anglers are more likely to fish from a boat most of their time than are casual
anglers.
• The regional crosstabulation shows no marked differences among the regions on this
question about the amount of their fishing done from a boat.
• The data analysis by river region found that Mississippi River Region anglers are more
likely than anglers overall or anglers from the Missouri River Region to do all or most of
their fishing from a boat.
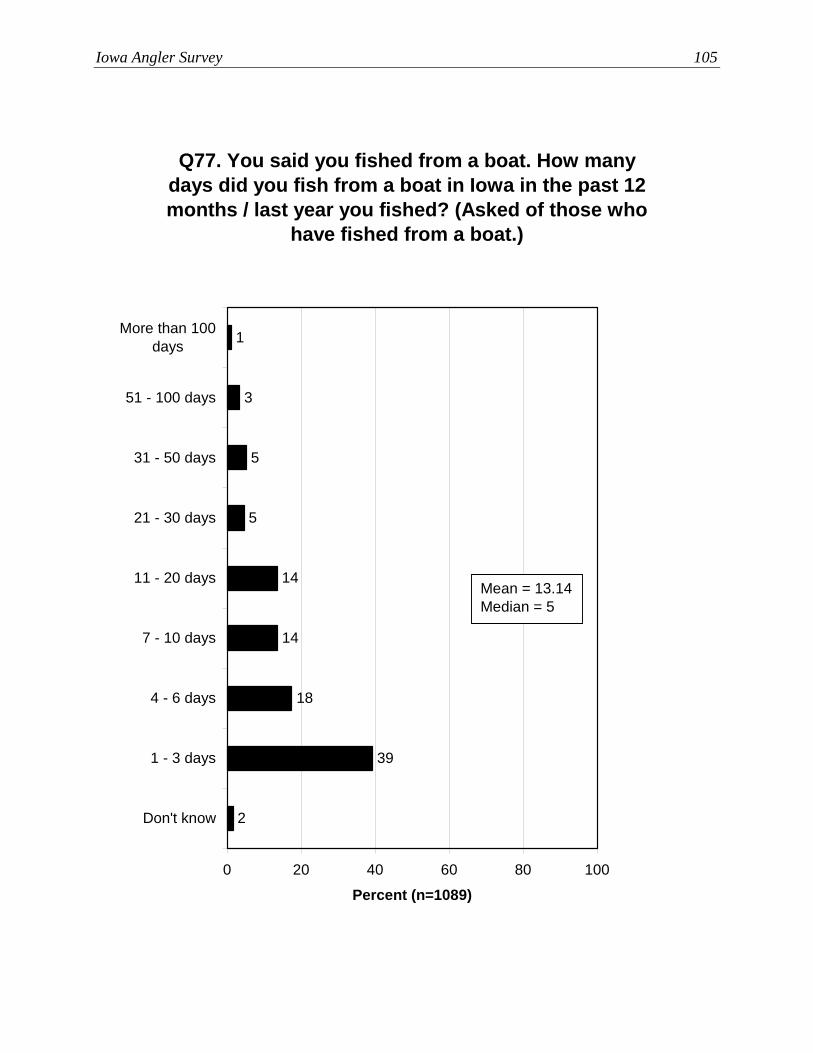
Iowa Angler Survey 105
Q77. You said you fished from a boat. How many days did you fish from a boat in Iowa in the past 12 months / last year you fished? (Asked of those who
have fished from a boat.)
14
14
5
5
3
1
18
39
2
0 20 40 60 80 100
More than 100days
51 - 100 days
31 - 50 days
21 - 30 days
11 - 20 days
7 - 10 days
4 - 6 days
1 - 3 days
Don't know
Percent (n=1089)
Mean = 13.14Median = 5

106 Responsive Management
Q77. How many days did you fish from a boat in Iowa in the past 12 months / last year you fished?
(Among all anglers.)
1
8
8
3
3
2
1
11
24
38
0 20 40 60 80 100
More than 100days
51 - 100 days
31 - 50 days
21 - 30 days
11 - 20 days
7 - 10 days
4 - 6 days
1 - 3 days
Did not fish froma boat
Don't know
Percent (n=1649)
Mean = 8.11Median = 2
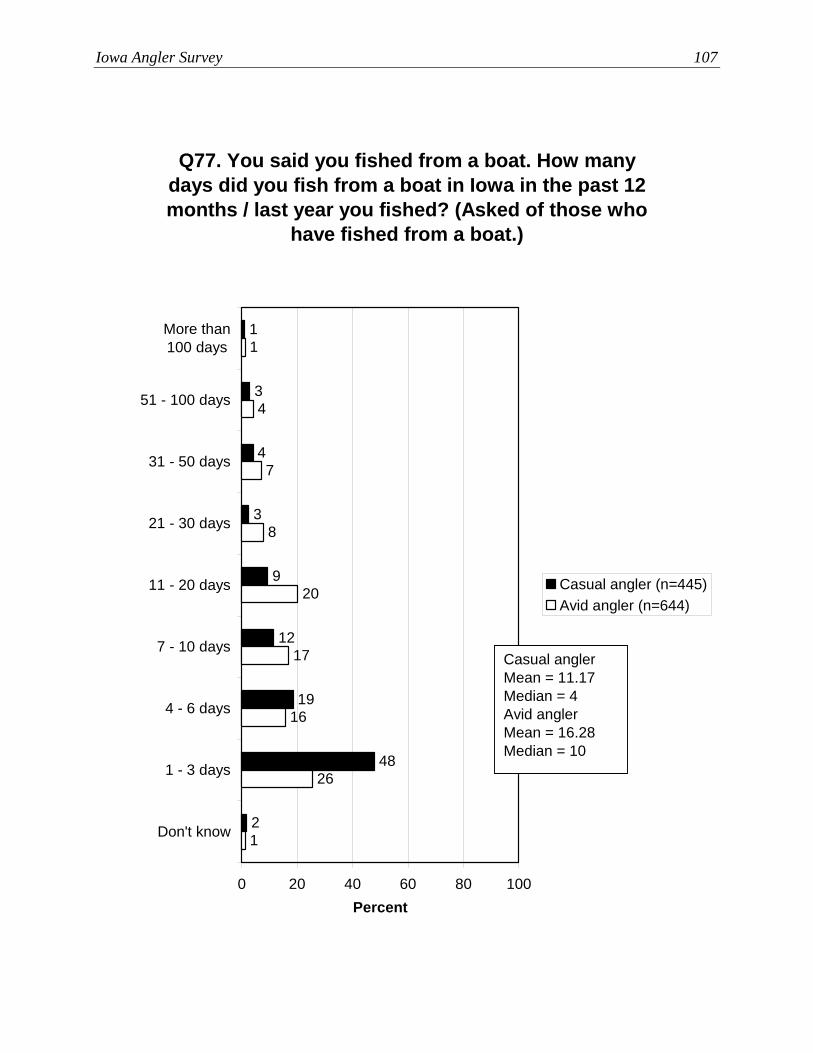
Iowa Angler Survey 107
Q77. You said you fished from a boat. How many days did you fish from a boat in Iowa in the past 12 months / last year you fished? (Asked of those who
have fished from a boat.)
12
9
3
4
3
1
19
48
21
26
16
17
20
8
7
4
1
0 20 40 60 80 100
More than100 days
51 - 100 days
31 - 50 days
21 - 30 days
11 - 20 days
7 - 10 days
4 - 6 days
1 - 3 days
Don't know
Percent
Casual angler (n=445)Avid angler (n=644)
Casual anglerMean = 11.17Median = 4Avid anglerMean = 16.28Median = 10
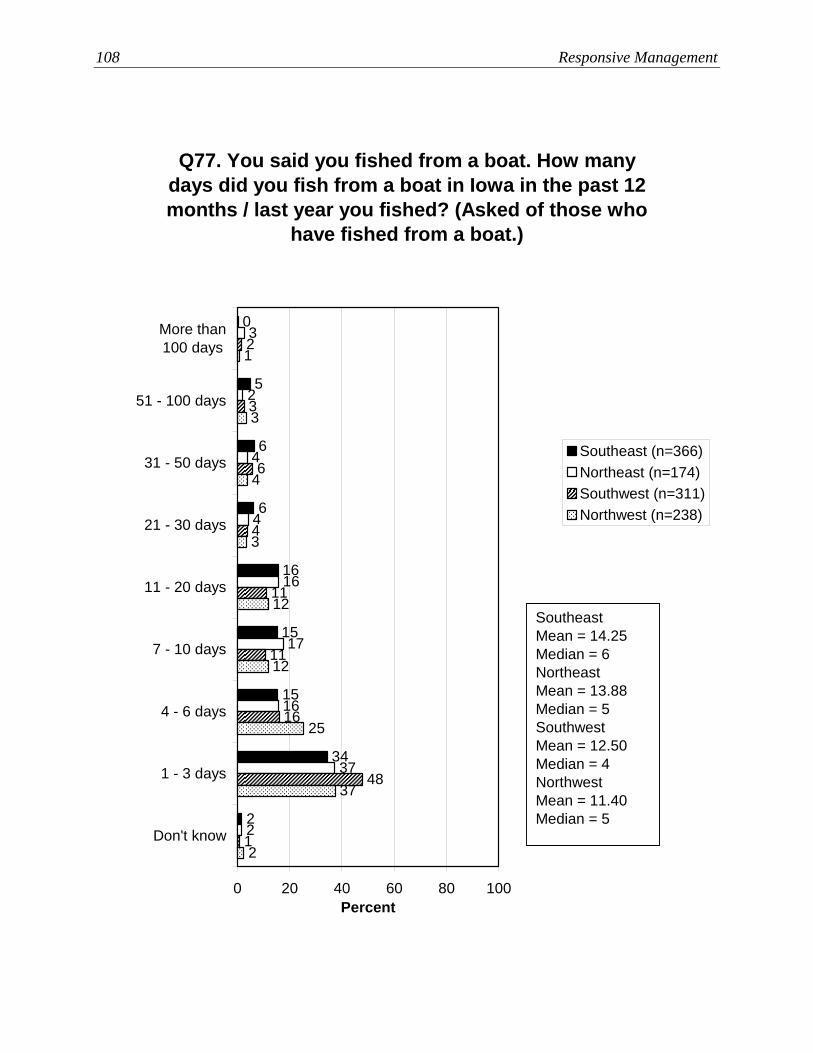
108 Responsive Management
Q77. You said you fished from a boat. How many days did you fish from a boat in Iowa in the past 12 months / last year you fished? (Asked of those who
have fished from a boat.)
15
16
6
6
5
0
15
34
22
37
16
17
16
4
4
2
3
1
48
16
11
11
4
2
3
6
2
37
25
12
12
3
1
3
4
0 20 40 60 80 100
More than100 days
51 - 100 days
31 - 50 days
21 - 30 days
11 - 20 days
7 - 10 days
4 - 6 days
1 - 3 days
Don't know
Percent
Southeast (n=366)Northeast (n=174)Southwest (n=311)Northwest (n=238)
SoutheastMean = 14.25Median = 6NortheastMean = 13.88Median = 5SouthwestMean = 12.50Median = 4NorthwestMean = 11.40Median = 5

Iowa Angler Survey 109
Q77. You said you fished from a boat. How many days did you fish from a boat in Iowa in the past 12 months / last year you fished? (Asked of those who
have fished from a boat.)
15
19
4
6
6
2
15
30
30
37
25
15
11
5
3
2
2
0 20 40 60 80 100
More than 100days
51 - 100 days
31 - 50 days
21 - 30 days
11 - 20 days
7 - 10 days
4 - 6 days
1 - 3 days
Don't know
Percent
Mississippi (n=218)Missouri (n=185)
MississippiMean = 16.87Median = 8MissouriMean = 12.69Median = 5
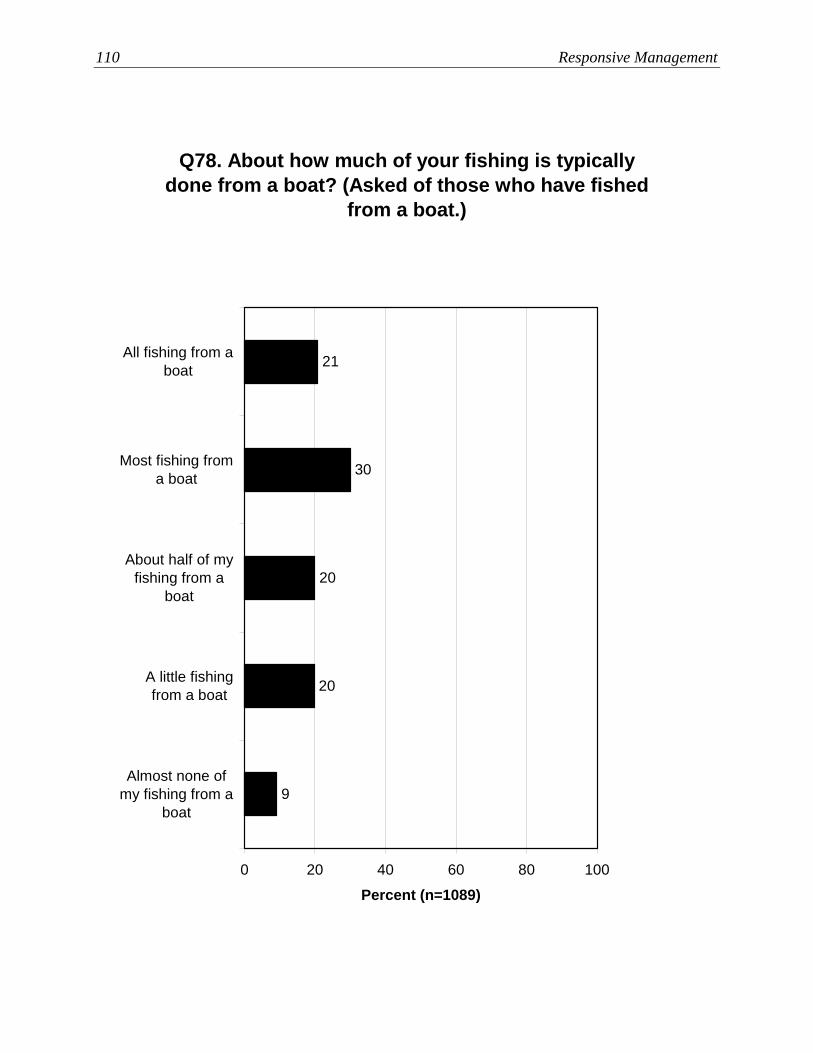
110 Responsive Management
Q78. About how much of your fishing is typically done from a boat? (Asked of those who have fished
from a boat.)
9
20
20
30
21
0 20 40 60 80 100
All fishing from aboat
Most fishing froma boat
About half of myfishing from a
boat
A little fishingfrom a boat
Almost none ofmy fishing from a
boat
Percent (n=1089)
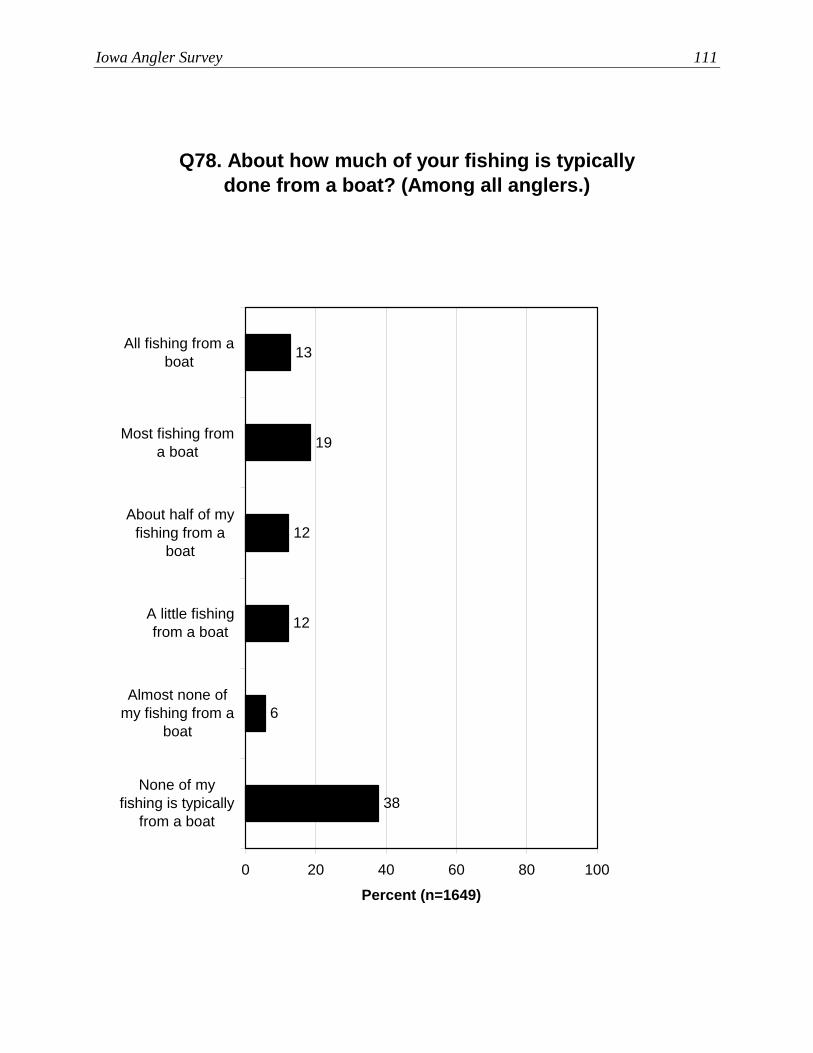
Iowa Angler Survey 111
Q78. About how much of your fishing is typically done from a boat? (Among all anglers.)
38
6
12
12
19
13
0 20 40 60 80 100
All fishing from aboat
Most fishing froma boat
About half of myfishing from a
boat
A little fishingfrom a boat
Almost none ofmy fishing from a
boat
None of myfishing is typically
from a boat
Percent (n=1649)

112 Responsive Management
Q78. About how much of your fishing is typically done from a boat? (Asked of those who have fished
from a boat.)
9
22
22
26
21
9
17
17
37
20
0 20 40 60 80 100
All fishingfrom a boat
Most fishingfrom a boat
About half ofmy fishing
from a boat
A little fishingfrom a boat
Almost noneof my fishingfrom a boat
Percent
Casual angler (n=445)Avid angler (n=644)
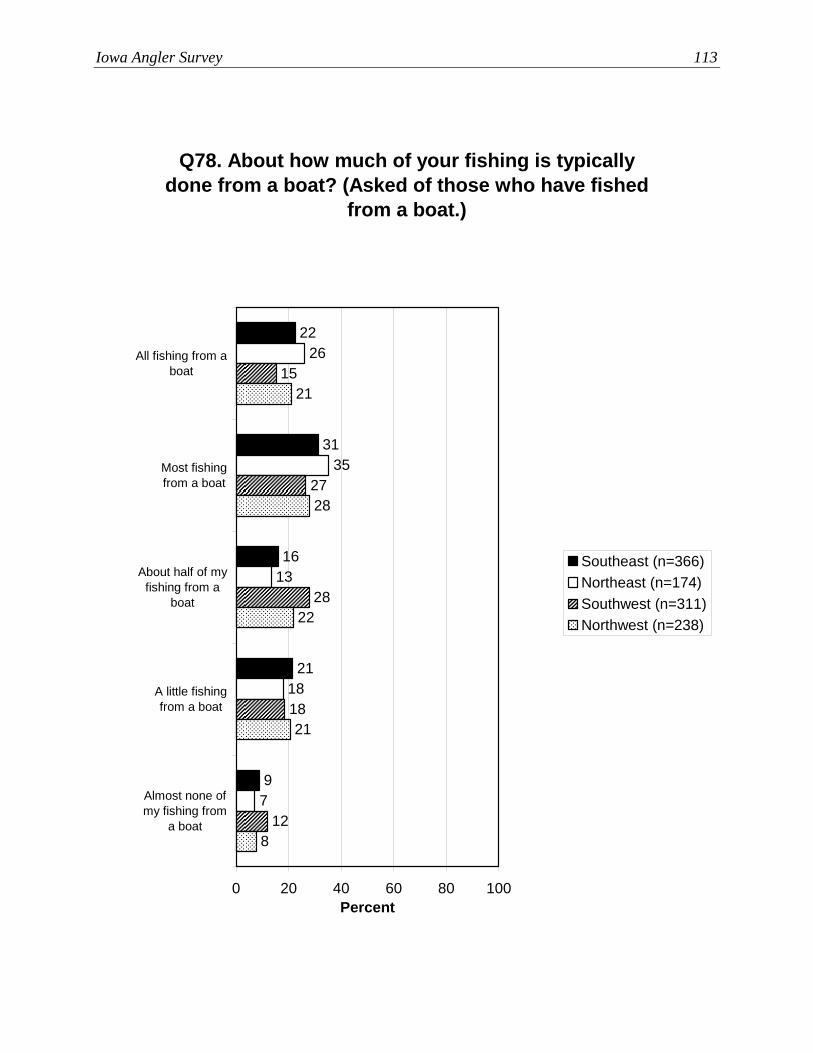
Iowa Angler Survey 113
Q78. About how much of your fishing is typically done from a boat? (Asked of those who have fished
from a boat.)
9
21
16
31
22
7
18
13
35
26
12
18
15
27
28
8
21
21
28
22
0 20 40 60 80 100
All fishing from aboat
Most fishingfrom a boat
About half of myfishing from a
boat
A little fishingfrom a boat
Almost none ofmy fishing from
a boat
Percent
Southeast (n=366)Northeast (n=174)Southwest (n=311)Northwest (n=238)
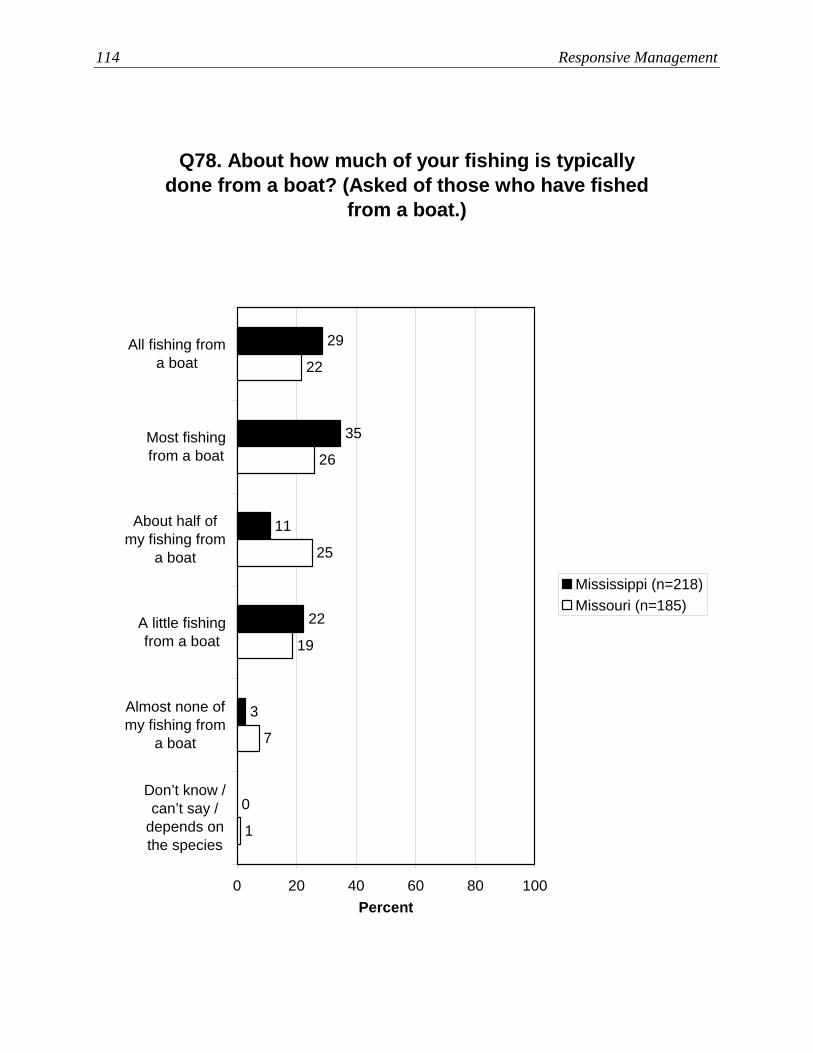
114 Responsive Management
Q78. About how much of your fishing is typically done from a boat? (Asked of those who have fished
from a boat.)
0
3
22
11
35
29
1
7
19
25
26
22
0 20 40 60 80 100
All fishing froma boat
Most fishingfrom a boat
About half ofmy fishing from
a boat
A little fishingfrom a boat
Almost none ofmy fishing from
a boat
Don’t know /can’t say /
depends onthe species
Percent
Mississippi (n=218)Missouri (n=185)
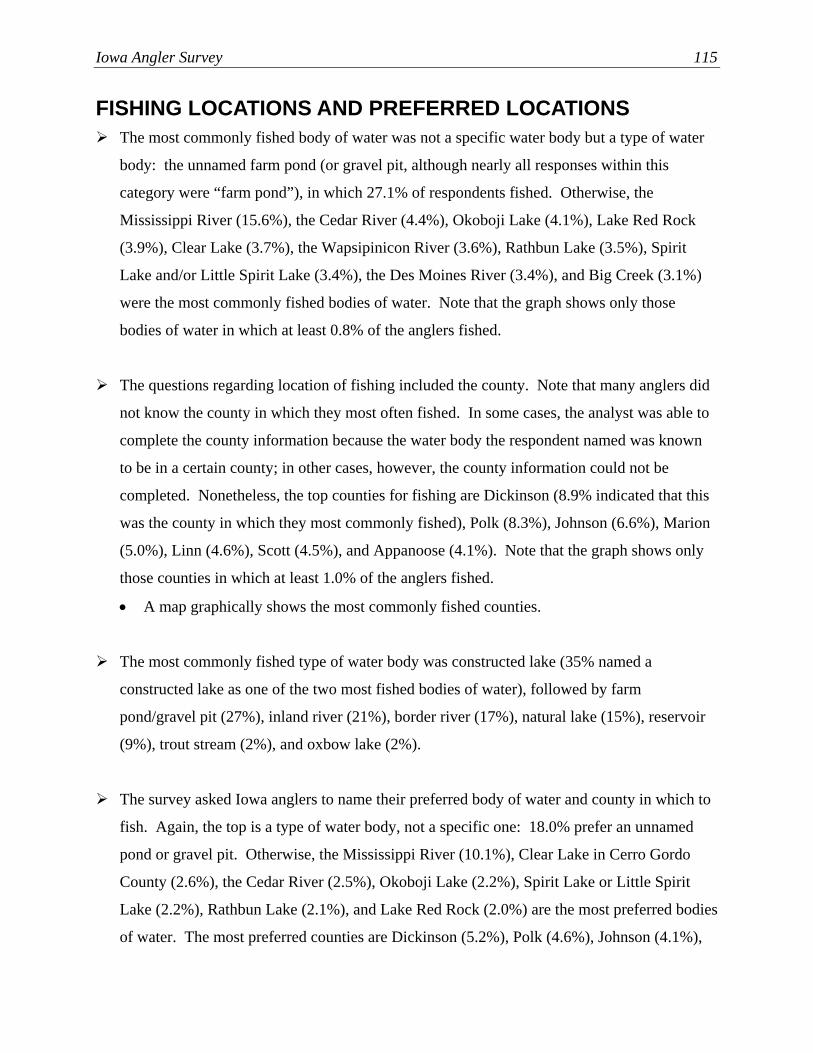
Iowa Angler Survey 115
FISHING LOCATIONS AND PREFERRED LOCATIONS The most commonly fished body of water was not a specific water body but a type of water
body: the unnamed farm pond (or gravel pit, although nearly all responses within this
category were “farm pond”), in which 27.1% of respondents fished. Otherwise, the
Mississippi River (15.6%), the Cedar River (4.4%), Okoboji Lake (4.1%), Lake Red Rock
(3.9%), Clear Lake (3.7%), the Wapsipinicon River (3.6%), Rathbun Lake (3.5%), Spirit
Lake and/or Little Spirit Lake (3.4%), the Des Moines River (3.4%), and Big Creek (3.1%)
were the most commonly fished bodies of water. Note that the graph shows only those
bodies of water in which at least 0.8% of the anglers fished.
The questions regarding location of fishing included the county. Note that many anglers did
not know the county in which they most often fished. In some cases, the analyst was able to
complete the county information because the water body the respondent named was known
to be in a certain county; in other cases, however, the county information could not be
completed. Nonetheless, the top counties for fishing are Dickinson (8.9% indicated that this
was the county in which they most commonly fished), Polk (8.3%), Johnson (6.6%), Marion
(5.0%), Linn (4.6%), Scott (4.5%), and Appanoose (4.1%). Note that the graph shows only
those counties in which at least 1.0% of the anglers fished.
• A map graphically shows the most commonly fished counties.
The most commonly fished type of water body was constructed lake (35% named a
constructed lake as one of the two most fished bodies of water), followed by farm
pond/gravel pit (27%), inland river (21%), border river (17%), natural lake (15%), reservoir
(9%), trout stream (2%), and oxbow lake (2%).
The survey asked Iowa anglers to name their preferred body of water and county in which to
fish. Again, the top is a type of water body, not a specific one: 18.0% prefer an unnamed
pond or gravel pit. Otherwise, the Mississippi River (10.1%), Clear Lake in Cerro Gordo
County (2.6%), the Cedar River (2.5%), Okoboji Lake (2.2%), Spirit Lake or Little Spirit
Lake (2.2%), Rathbun Lake (2.1%), and Lake Red Rock (2.0%) are the most preferred bodies
of water. The most preferred counties are Dickinson (5.2%), Polk (4.6%), Johnson (4.1%),

116 Responsive Management
Marion (2.9%), and Clayton (2.6%). Note that the graphs show only those bodies of water in
which at least 0.5% of the anglers prefer to fish and those counties in which at least 0.8% of
the anglers prefer to fish.
• A map graphically shows the most commonly preferred counties.
The most preferred types of water body are farm pond/gravel pit (20% prefer this) and
constructed lake (also 20%), followed by border river (12%), inland river (11%), natural lake
(10%), reservoir (6%), trout stream (1%), and oxbow lake (1%).
While the large majority of Iowa anglers (60%) typically travel no more than 20 miles to fish
in Iowa, 16% typically travel more than 50 miles.
• The crosstabulation by avid versus casual angler found that avid anglers tend to drive a
little longer than casual anglers to fish in Iowa, but note that the difference is small.
• The regional crosstabulation shows no marked differences among the regions on this
question about distance typically traveled to fish.
• The data analysis by river region found that Mississippi River Region anglers typically
travel a shorter distance to fish in Iowa than do anglers overall or anglers from the
Missouri River Region.
Of those who fished for trout, about half (48%) purchased a trout stamp specifically for an
urban trout fishery. (This graph is shown and discussed in the section of this report titled,
“Miscellaneous Issues Pertaining To Fishing in Iowa: Urban Trout Fisheries.”)
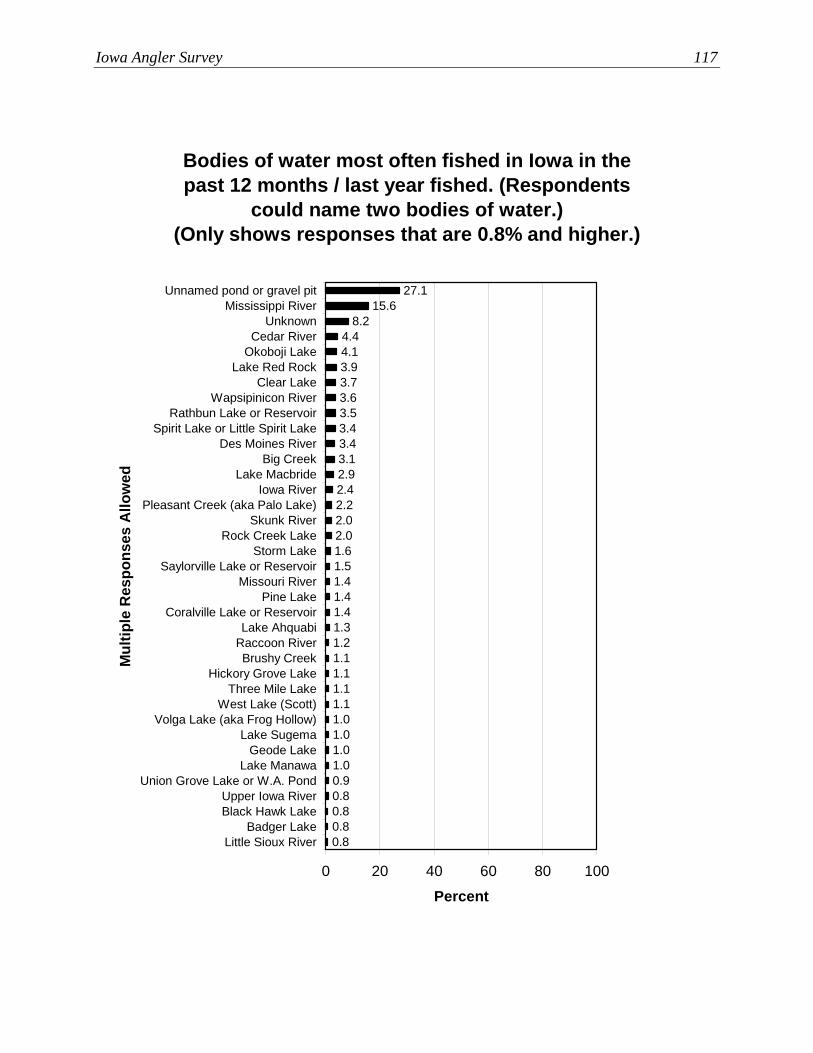
Iowa Angler Survey 117
Bodies of water most often fished in Iowa in the past 12 months / last year fished. (Respondents
could name two bodies of water.)(Only shows responses that are 0.8% and higher.)
2.02.01.61.51.41.41.41.31.21.11.11.11.11.01.01.01.00.90.80.80.80.8
2.22.42.93.13.43.4
3.94.14.4
8.215.6
27.1
3.73.63.5
0 20 40 60 80 100
Unnamed pond or gravel pitMississippi River
UnknownCedar River
Okoboji LakeLake Red Rock
Clear LakeWapsipinicon River
Rathbun Lake or ReservoirSpirit Lake or Little Spirit Lake
Des Moines RiverBig Creek
Lake MacbrideIowa River
Pleasant Creek (aka Palo Lake)Skunk River
Rock Creek LakeStorm Lake
Saylorville Lake or ReservoirMissouri River
Pine LakeCoralville Lake or Reservoir
Lake AhquabiRaccoon RiverBrushy Creek
Hickory Grove LakeThree Mile Lake
West Lake (Scott)Volga Lake (aka Frog Hollow)
Lake SugemaGeode Lake
Lake ManawaUnion Grove Lake or W.A. Pond
Upper Iowa RiverBlack Hawk Lake
Badger LakeLittle Sioux River
Mul
tiple
Res
pons
es A
llow
ed
Percent
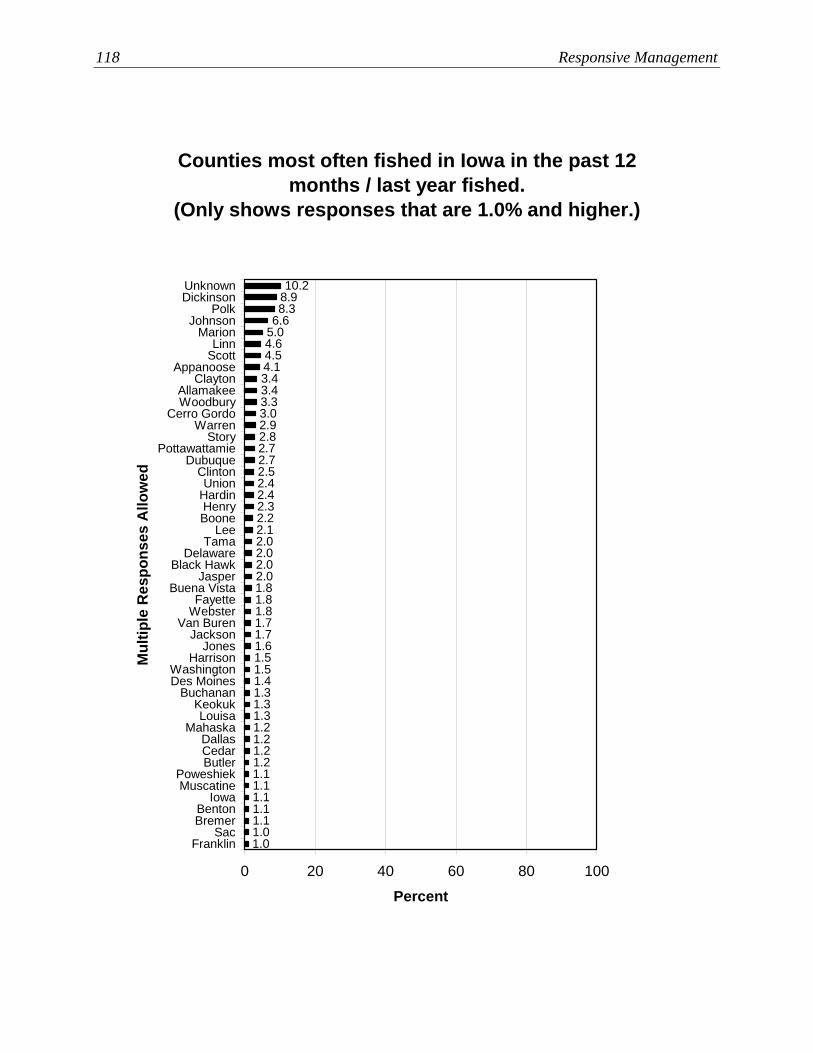
118 Responsive Management
Counties most often fished in Iowa in the past 12 months / last year fished.
(Only shows responses that are 1.0% and higher.)
2.72.52.42.42.32.22.12.02.02.02.01.81.81.81.71.71.61.51.51.41.31.31.31.21.21.21.21.11.11.11.11.11.01.0
2.72.82.93.03.33.4
4.65.06.68.38.910.2
4.54.13.4
0 20 40 60 80 100
UnknownDickinson
PolkJohnson
MarionLinn
ScottAppanoose
ClaytonAllamakeeWoodbury
Cerro GordoWarren
StoryPottawattamie
DubuqueClintonUnion
HardinHenryBoone
LeeTama
DelawareBlack Hawk
JasperBuena Vista
FayetteWebster
Van BurenJackson
JonesHarrison
WashingtonDes Moines
BuchananKeokukLouisa
MahaskaDallasCedarButler
PoweshiekMuscatine
IowaBentonBremer
SacFranklin
Mul
tiple
Res
pons
es A
llow
ed
Percent

Iowa Angler Survey 119

120 Responsive Management
Type of water body fished on most.(Respondent gave top two places fished the most.)
9
15
17
21
27
35
2
2
12
0 20 40 60 80 100
Constructed lake
Farmpond/gravel pit
Inland river
Border river
Natural lake
Reservoir
Trout stream
Oxbow lake
Unknown
Mul
tiple
Res
pons
es A
llow
ed
Percent
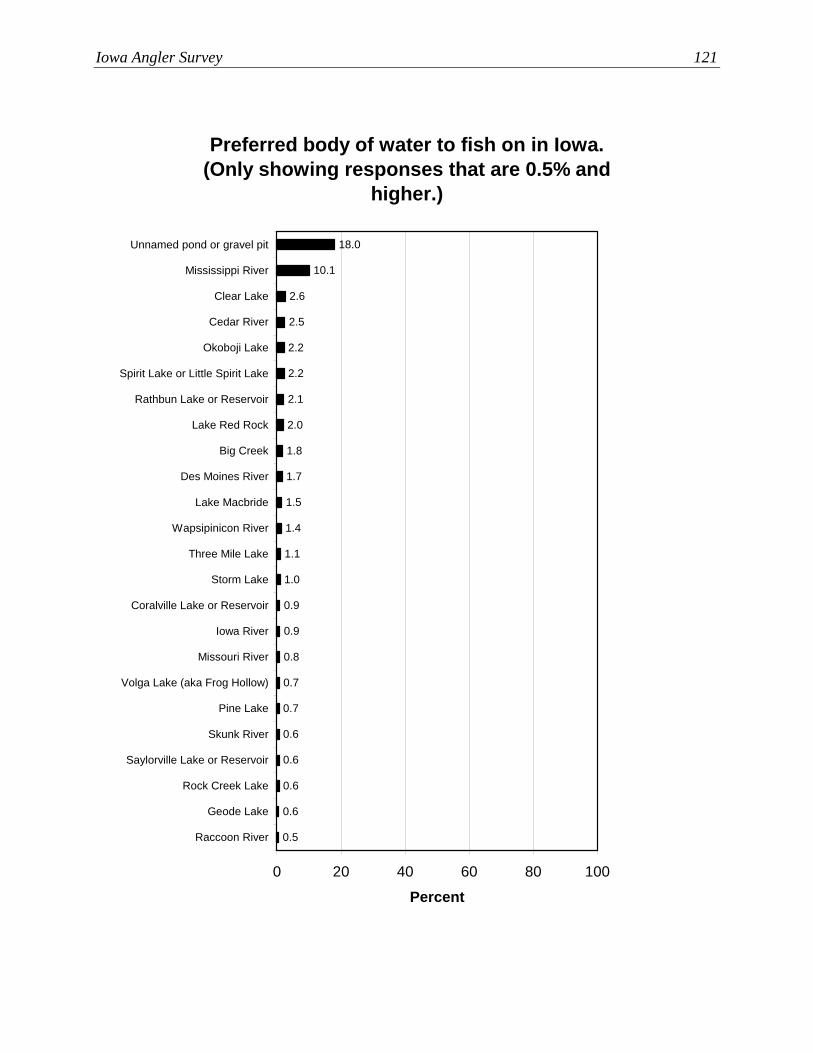
Iowa Angler Survey 121
Preferred body of water to fish on in Iowa.(Only showing responses that are 0.5% and
higher.)
0.9
0.8
0.7
0.7
0.6
0.6
0.6
0.6
0.5
0.9
1.0
1.1
1.4
1.5
1.7
2.2
2.2
2.5
2.6
10.1
18.0
2.1
2.0
1.8
0 20 40 60 80 100
Unnamed pond or gravel pit
Mississippi River
Clear Lake
Cedar River
Okoboji Lake
Spirit Lake or Little Spirit Lake
Rathbun Lake or Reservoir
Lake Red Rock
Big Creek
Des Moines River
Lake Macbride
Wapsipinicon River
Three Mile Lake
Storm Lake
Coralville Lake or Reservoir
Iowa River
Missouri River
Volga Lake (aka Frog Hollow)
Pine Lake
Skunk River
Saylorville Lake or Reservoir
Rock Creek Lake
Geode Lake
Raccoon River
Percent

122 Responsive Management
Preferred county in which to fish in Iowa.(Only showing responses that are 0.8% and
higher.)
1.41.41.41.31.31.21.21.21.21.21.11.01.00.90.90.80.80.80.8
1.41.51.51.61.81.9
2.52.62.94.14.65.2
2.32.32.3
0 20 40 60 80 100
DickinsonPolk
JohnsonMarion
ClaytonAllamakee
AppanooseScott
Cerro GordoUnion
LinnDubuque
PottawattamieFayetteClinton
WoodburyWarren
LeeHenry
JacksonBooneHardin
DelawareBuena Vista
StoryDes MoinesBlack Hawk
JonesVan Buren
KeokukMuscatine
CedarWinneshiek
Harrison
Percent
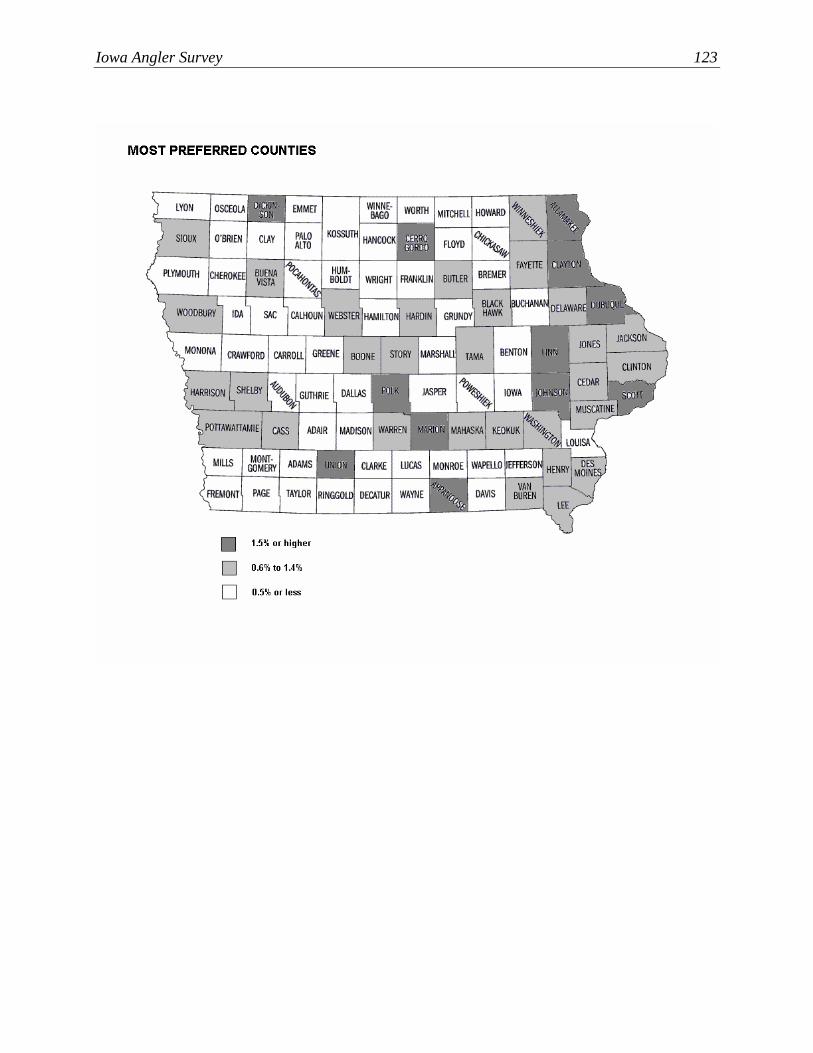
Iowa Angler Survey 123

124 Responsive Management
Type of water body preferred to fish on most.(Respondent only gave one place most preferred to
fish on.)
6
10
11
12
20
20
1
1
19
0 20 40 60 80 100
Farmpond/gravel pit
Constructed lake
Border river
Inland river
Natural lake
Reservoir
Trout stream
Oxbow lake
Unknown
Percent
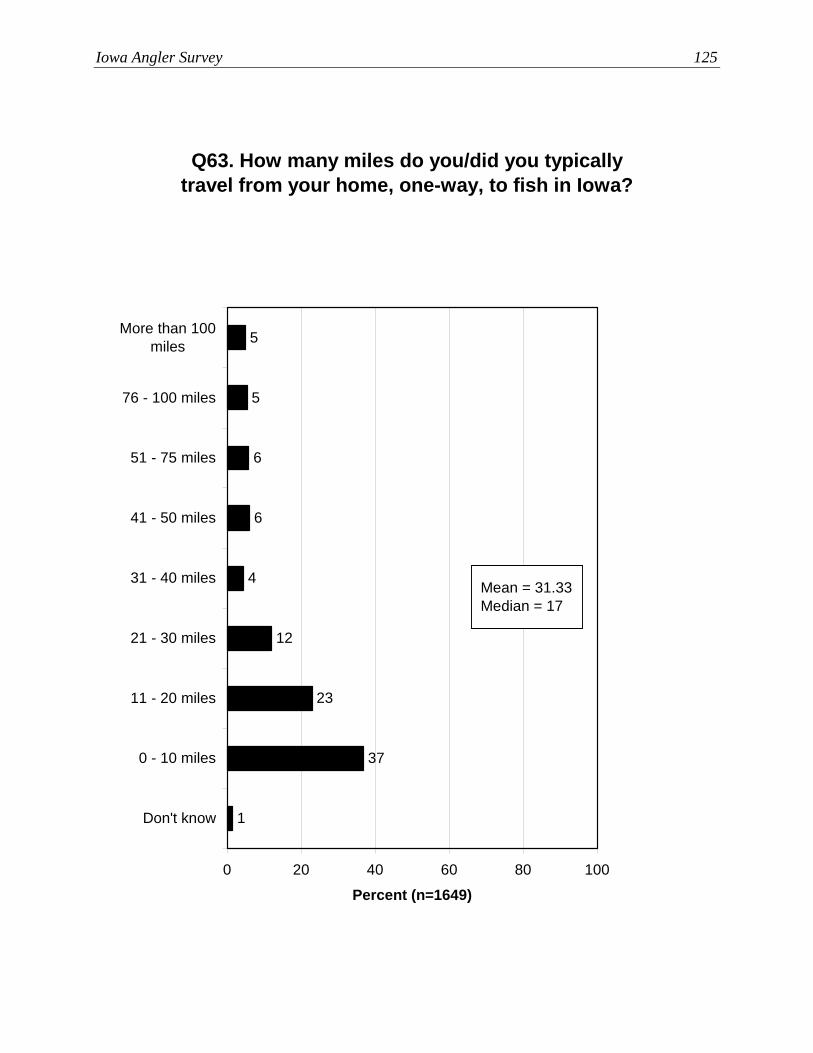
Iowa Angler Survey 125
Q63. How many miles do you/did you typically travel from your home, one-way, to fish in Iowa?
12
4
6
6
5
5
23
37
1
0 20 40 60 80 100
More than 100miles
76 - 100 miles
51 - 75 miles
41 - 50 miles
31 - 40 miles
21 - 30 miles
11 - 20 miles
0 - 10 miles
Don't know
Percent (n=1649)
Mean = 31.33Median = 17
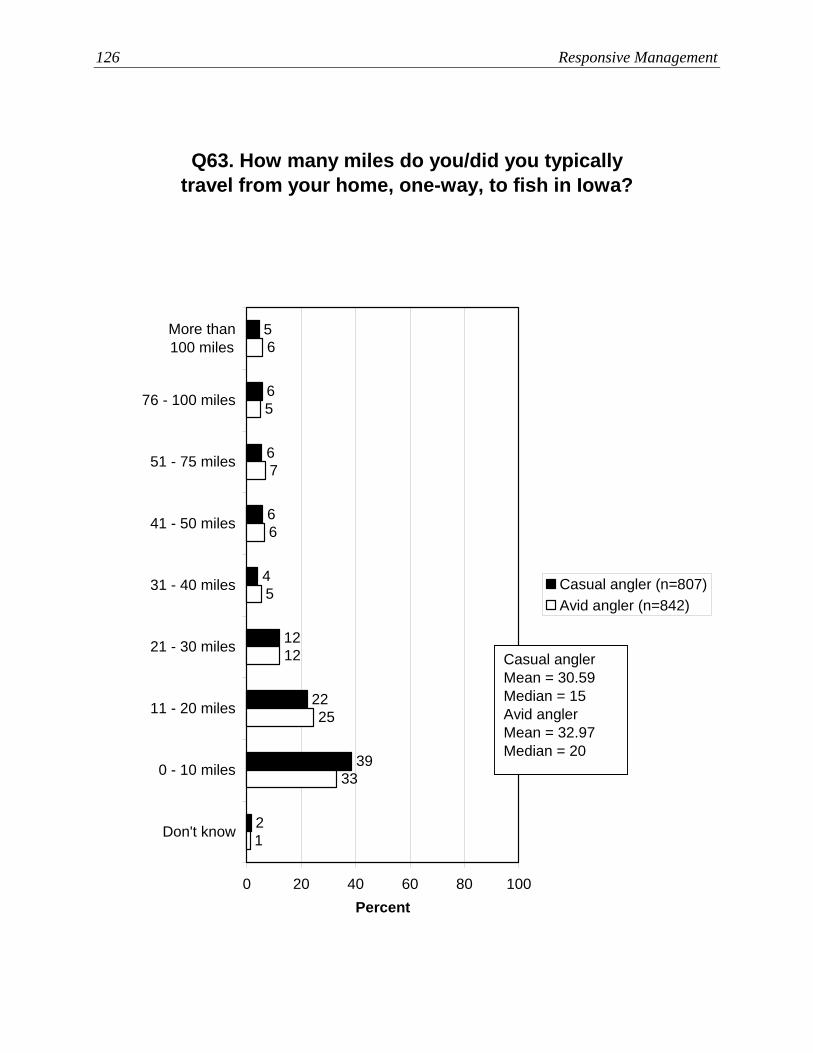
126 Responsive Management
Q63. How many miles do you/did you typically travel from your home, one-way, to fish in Iowa?
12
4
6
6
6
5
22
39
21
33
25
12
5
6
7
5
6
0 20 40 60 80 100
More than100 miles
76 - 100 miles
51 - 75 miles
41 - 50 miles
31 - 40 miles
21 - 30 miles
11 - 20 miles
0 - 10 miles
Don't know
Percent
Casual angler (n=807)Avid angler (n=842)
Casual anglerMean = 30.59Median = 15Avid anglerMean = 32.97Median = 20

Iowa Angler Survey 127
Q63. How many miles do you/did you typically travel from your home, one-way, to fish in Iowa?
13
3
7
5
5
5
24
38
13
37
20
7
5
9
7
3
8
1
37
24
13
4
5
5
6
5
2
34
22
13
6
5
3
7
8
0 20 40 60 80 100
More than100 miles
76 - 100miles
51 - 75 miles
41 - 50 miles
31 - 40 miles
21 - 30 miles
11 - 20 miles
0 - 10 miles
Don't know
Percent
Southeast (n=522)Northeast (n=239)Southwest (n=506)Northwest (n=382)
SoutheastMean = 29.90Median = 17NortheastMean = 33.71Median = 20SouthwestMean = 31.56Median = 15NorthwestMean = 31.42Median = 20
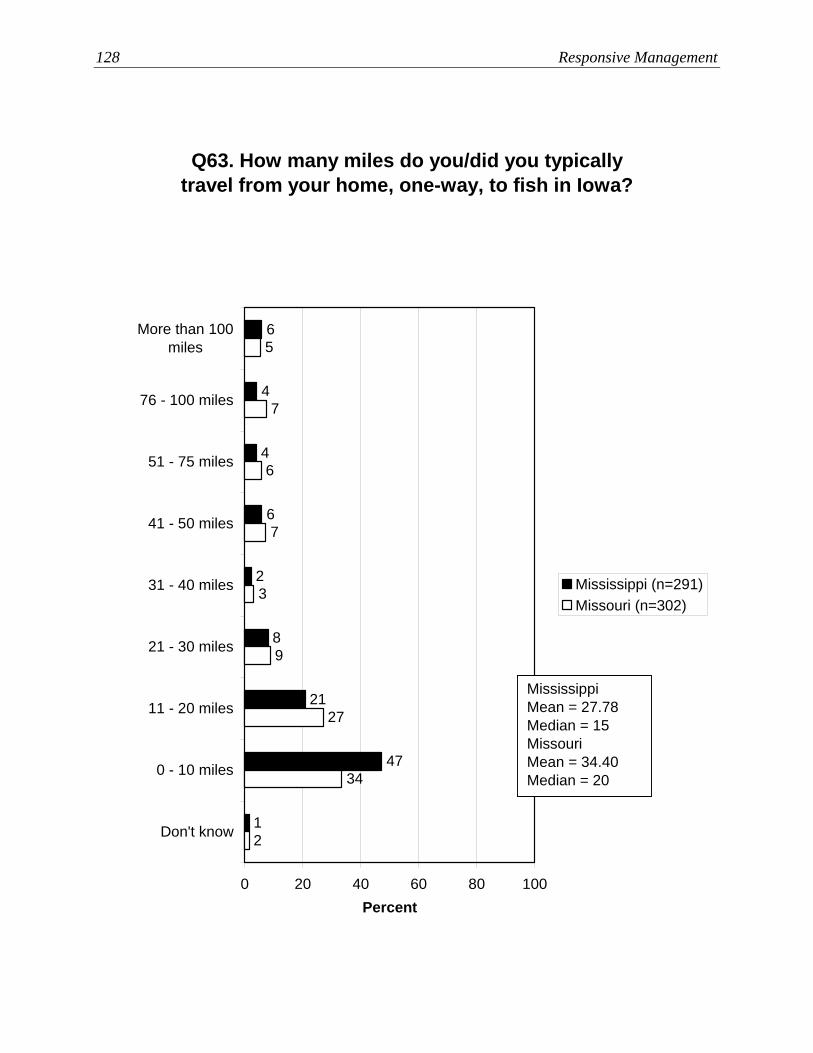
128 Responsive Management
Q63. How many miles do you/did you typically travel from your home, one-way, to fish in Iowa?
8
2
6
4
4
6
21
47
12
34
27
9
3
7
6
7
5
0 20 40 60 80 100
More than 100miles
76 - 100 miles
51 - 75 miles
41 - 50 miles
31 - 40 miles
21 - 30 miles
11 - 20 miles
0 - 10 miles
Don't know
Percent
Mississippi (n=291)Missouri (n=302)
MississippiMean = 27.78Median = 15MissouriMean = 34.40Median = 20
Iowa Angler Survey 129
MOTIVATIONS FOR FISHING The survey asked anglers about their most important reason for fishing out of a list of seven
reasons, and the order of the reasons read to the respondent was randomly changed to
eliminate bias in the answers. “For relaxation” was the most common reason for fishing
(34%), followed by “to be with family” (26%), and “for the sport” (16%). Note that in
general aesthetic reasons exceed utilitarian reasons for fishing.
• Note that previous surveys—both Responsive Management surveys as well as those of
other researchers—have asked about being with “family and friends,” but it was thought
that for some people, the two are completely separate (one focus group participant in
another study indicated that his outdoor recreation was with friends and specifically
excluded family—he wanted to get away from his family), so this survey separated
family and friends: 26% fished primarily to be with family, and 5% did so to be with
friends, for a total of 31% who fished primarily to be with family or friends.
• In the crosstabulation by avid versus casual angler, avid anglers are more likely to fish
“for the sport” than are casual anglers, while casual anglers are more likely to fish “to be
with family.”
• The regional crosstabulation shows no marked differences among the regions on this
question about motivations for fishing.
• The data analysis by river region found no marked differences between anglers overall
and anglers from either the Mississippi River Region or the Missouri River Region
regarding motivations for fishing.
The survey asked anglers whether fourteen specific things would increase their motivation to
go fishing. Two motivations stand out: being asked by a child to go fishing (93% said this
would increase their motivation to go fishing), and being invited by a friend (92%). Below
these is a grouping of items, many of which relate to the health of the fishery and good water
quality (all within the range of 67% to 75% saying the item would increase their motivation
130 Responsive Management
to go fishing). Within this range also is having fishing offered as part of a vacation. Low
down on the ranking is having equipment made available, whether for rent or for free.
• For nearly every potential motivation, a greater percentage of avid anglers relative to
casual anglers say that it would increase their motivation to fish a lot.
• There are no marked regional differences on potential motivations.
• For most potential motivations, a greater percentage of Missouri River Region anglers
relative to Mississippi River Region anglers say that it would increase their motivation to
fish a lot, particularly knowing that his/her fishing license fee helps pay for habitat
protection.
The survey directly asked about fish consumption. The large majority of Iowa anglers (80%)
eat (or their family members eat) the fish they catch at least some of the time. Despite the
finding (as discussed above) that utilitarian reasons are not the primary motivations for
fishing, this finding about fish consumption suggests that utilitarian reasons certainly play a
factor in overall enjoyment of fishing. (This graph is shown in the section of this report
titled, “Consumption of Fish Caught in Iowa.”)

Iowa Angler Survey 131
Q82-84. Which of these is the most important reason that you fish?
5
7
8
16
26
34
1
2
0 20 40 60 80 100
For relaxation
To be with family
For the sport
To be close tonature
To catch fish toeat
To be with friends
To catch largefish
Don't know / can'tsay
Percent (n=1649)

132 Responsive Management
Q82-84. Which of these is the most important reason that you fish?
6
7
8
14
28
34
1
22
2
4
9
9
20
20
35
0 20 40 60 80 100
For relaxation
To be withfamily
For the sport
To be close tonature
To catch fishto eat
To be withfriends
To catch largefish
Don't know /can't say
Percent
Casual angler (n=807)Avid angler (n=842)

Iowa Angler Survey 133
Q82-84. Which of these is the most important reason that you fish?
5
7
8
17
25
34
1
30
1
5
12
9
13
27
32
1
1
5
8
7
36
24
17
1
1
6
7
7
34
28
16
0 20 40 60 80 100
Forrelaxation
To be withfamily
For the sport
To catch fishto eat
To be closeto nature
To be withfriends
To catchlarge fish
Don't know /can't say
Percent
Southeast (n=522)Northeast (n=239)Southwest (n=506)Northwest (n=382)
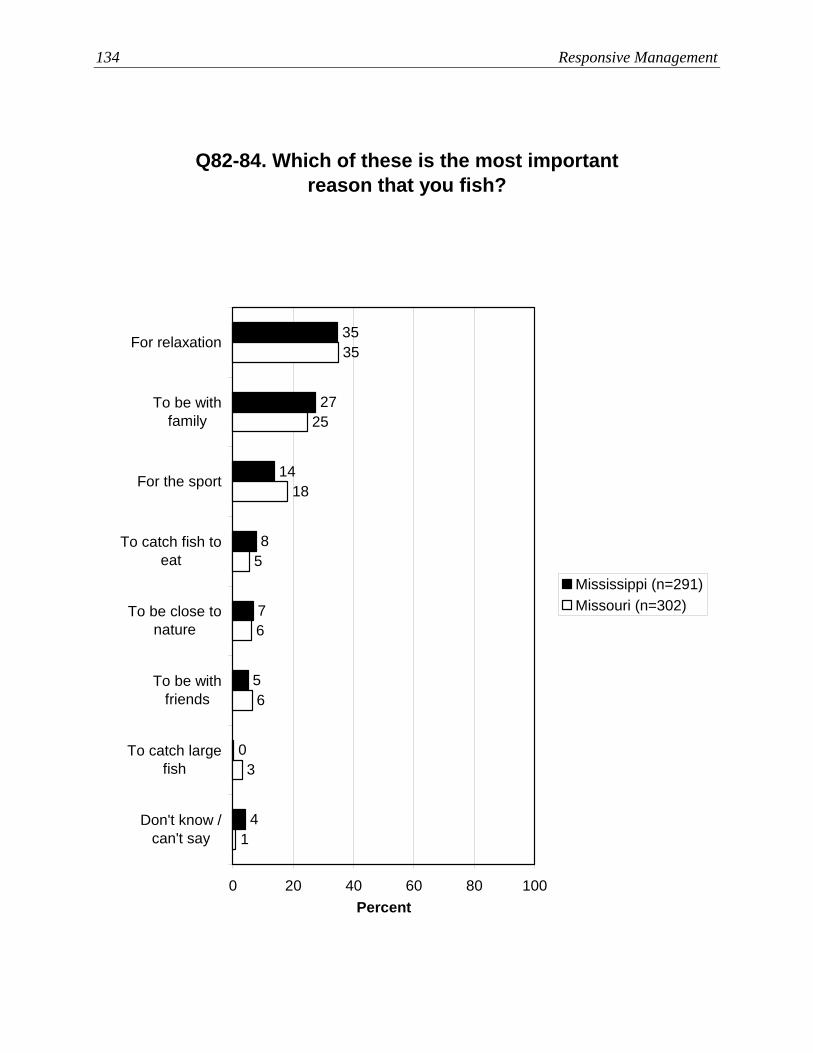
134 Responsive Management
Q82-84. Which of these is the most important reason that you fish?
5
7
8
14
27
35
0
41
3
6
6
5
18
25
35
0 20 40 60 80 100
For relaxation
To be withfamily
For the sport
To catch fish toeat
To be close tonature
To be withfriends
To catch largefish
Don't know /can't say
Percent
Mississippi (n=291)Missouri (n=302)
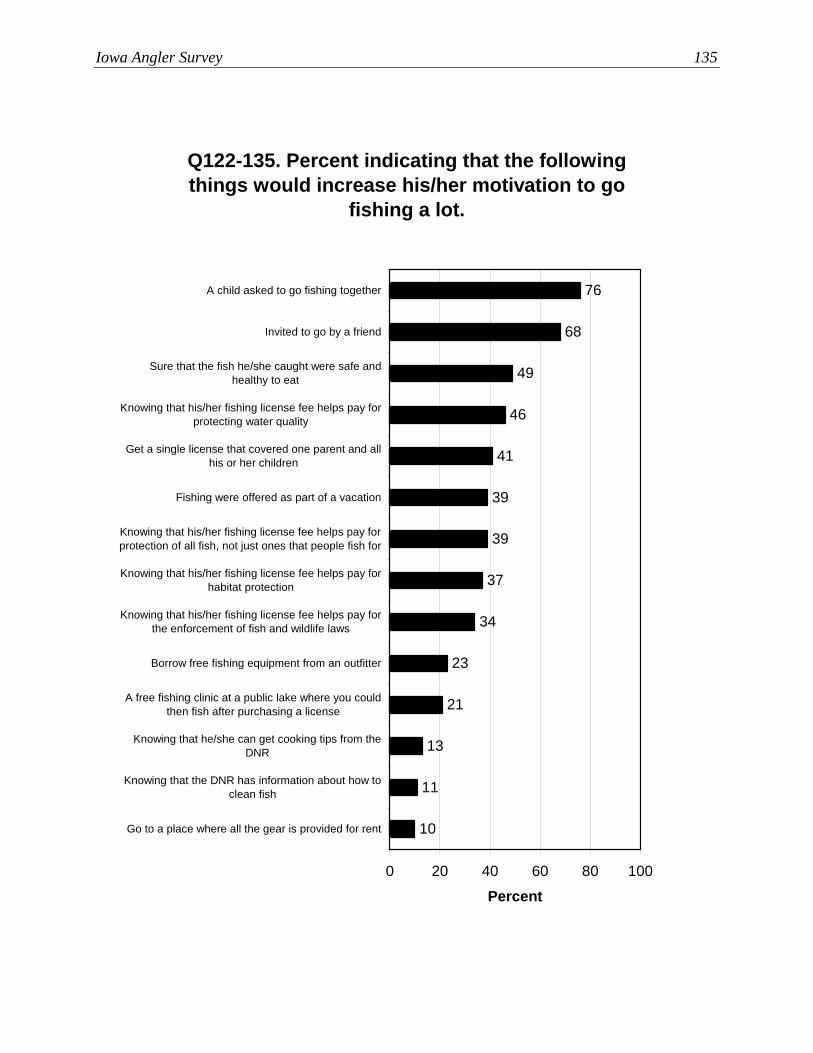
Iowa Angler Survey 135
Q122-135. Percent indicating that the following things would increase his/her motivation to go
fishing a lot.
34
37
39
76
68
49
46
41
39
23
21
13
11
10
0 20 40 60 80 100
A child asked to go fishing together
Invited to go by a friend
Sure that the fish he/she caught were safe andhealthy to eat
Knowing that his/her fishing license fee helps pay forprotecting water quality
Get a single license that covered one parent and allhis or her children
Fishing were offered as part of a vacation
Knowing that his/her fishing license fee helps pay forprotection of all fish, not just ones that people fish for
Knowing that his/her fishing license fee helps pay forhabitat protection
Knowing that his/her fishing license fee helps pay forthe enforcement of fish and wildlife laws
Borrow free fishing equipment from an outfitter
A free fishing clinic at a public lake where you couldthen fish after purchasing a license
Knowing that he/she can get cooking tips from theDNR
Knowing that the DNR has information about how toclean fish
Go to a place where all the gear is provided for rent
Percent
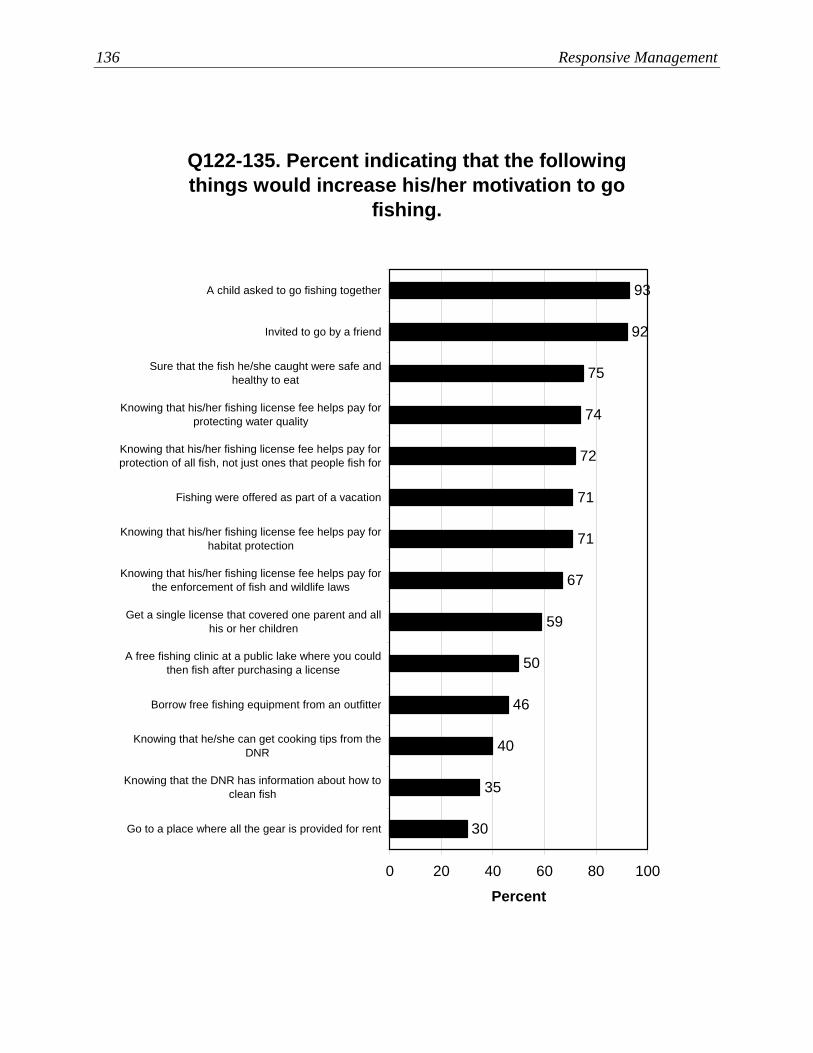
136 Responsive Management
Q122-135. Percent indicating that the following things would increase his/her motivation to go
fishing.
59
67
71
93
92
75
74
72
71
50
46
40
35
30
0 20 40 60 80 100
A child asked to go fishing together
Invited to go by a friend
Sure that the fish he/she caught were safe andhealthy to eat
Knowing that his/her fishing license fee helps pay forprotecting water quality
Knowing that his/her fishing license fee helps pay forprotection of all fish, not just ones that people fish for
Fishing were offered as part of a vacation
Knowing that his/her fishing license fee helps pay forhabitat protection
Knowing that his/her fishing license fee helps pay forthe enforcement of fish and wildlife laws
Get a single license that covered one parent and allhis or her children
A free fishing clinic at a public lake where you couldthen fish after purchasing a license
Borrow free fishing equipment from an outfitter
Knowing that he/she can get cooking tips from theDNR
Knowing that the DNR has information about how toclean fish
Go to a place where all the gear is provided for rent
Percent

Iowa Angler Survey 137
Q122-135. Percent of those who indicated that the following things would increase his/her motivation
to go fishing a lot.
51
38
43
43
41
40
24
18
14
8
9
31
36
37
75
66
49
44
42
37
22
22
12
12
10
79
74
50
0 20 40 60 80 100
A child asked to go fishing together
Invited to go by a friend
Sure that the fish he/she caught were safe andhealthy to eat
Knowing that his/her fishing license fee helpspay for protecting water quality
Get a single license that covered one parentand all his or her children
Fishing were offered as part of a vacation
Knowing that his/her fishing license fee helpspay for protection of all fish, not just ones that
people fish for
Knowing that his/her fishing license fee helpspay for habitat protection
Knowing that his/her fishing license fee helpspay for the enforcement of fish and wildlife
laws
Borrow free fishing equipment from an outfitter
A free fishing clinic at a public lake where youcould then fish after purchasing a license
Knowing that he/she can get cooking tips fromthe DNR
Knowing that the DNR has information abouthow to clean fish
Go to a place where all the gear is providedfor rent
Percent
Casual anglerAvid angler
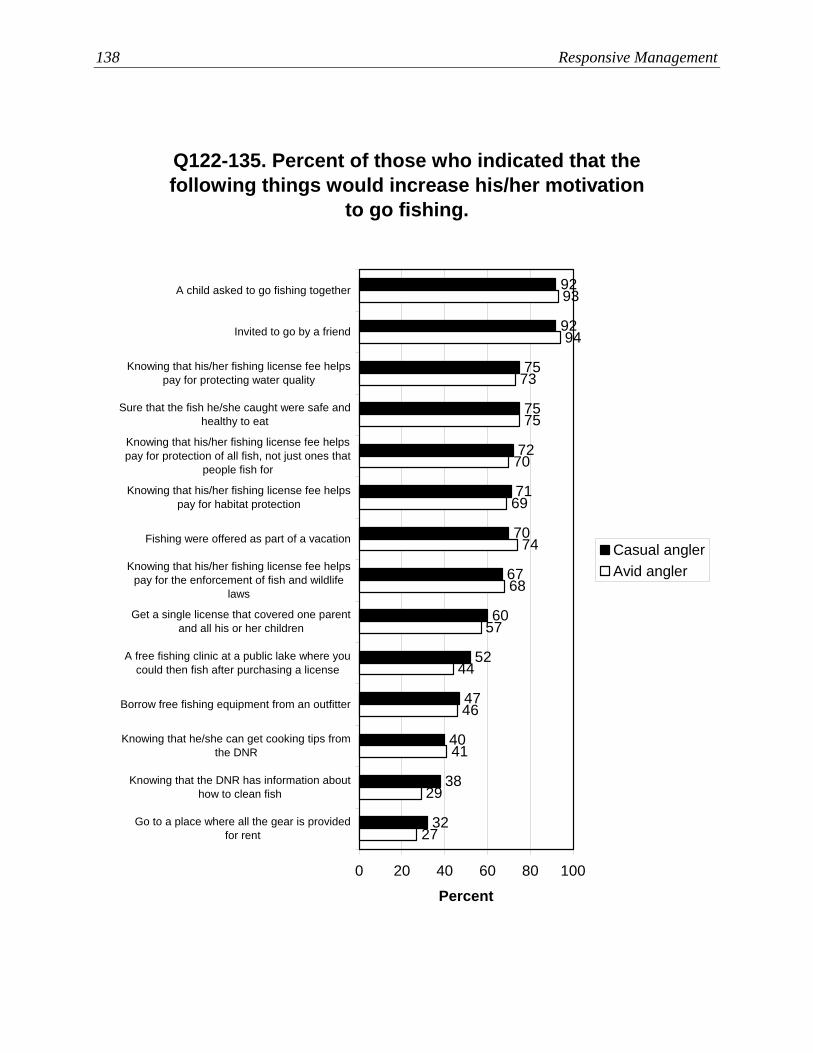
138 Responsive Management
Q122-135. Percent of those who indicated that the following things would increase his/her motivation
to go fishing.
75
70
69
74
68
57
44
46
41
29
27
60
67
70
92
92
75
75
72
71
52
47
40
38
32
93
94
73
0 20 40 60 80 100
A child asked to go fishing together
Invited to go by a friend
Knowing that his/her fishing license fee helpspay for protecting water quality
Sure that the fish he/she caught were safe andhealthy to eat
Knowing that his/her fishing license fee helpspay for protection of all fish, not just ones that
people fish for
Knowing that his/her fishing license fee helpspay for habitat protection
Fishing were offered as part of a vacation
Knowing that his/her fishing license fee helpspay for the enforcement of fish and wildlife
laws
Get a single license that covered one parentand all his or her children
A free fishing clinic at a public lake where youcould then fish after purchasing a license
Borrow free fishing equipment from an outfitter
Knowing that he/she can get cooking tips fromthe DNR
Knowing that the DNR has information abouthow to clean fish
Go to a place where all the gear is providedfor rent
Percent
Casual anglerAvid angler
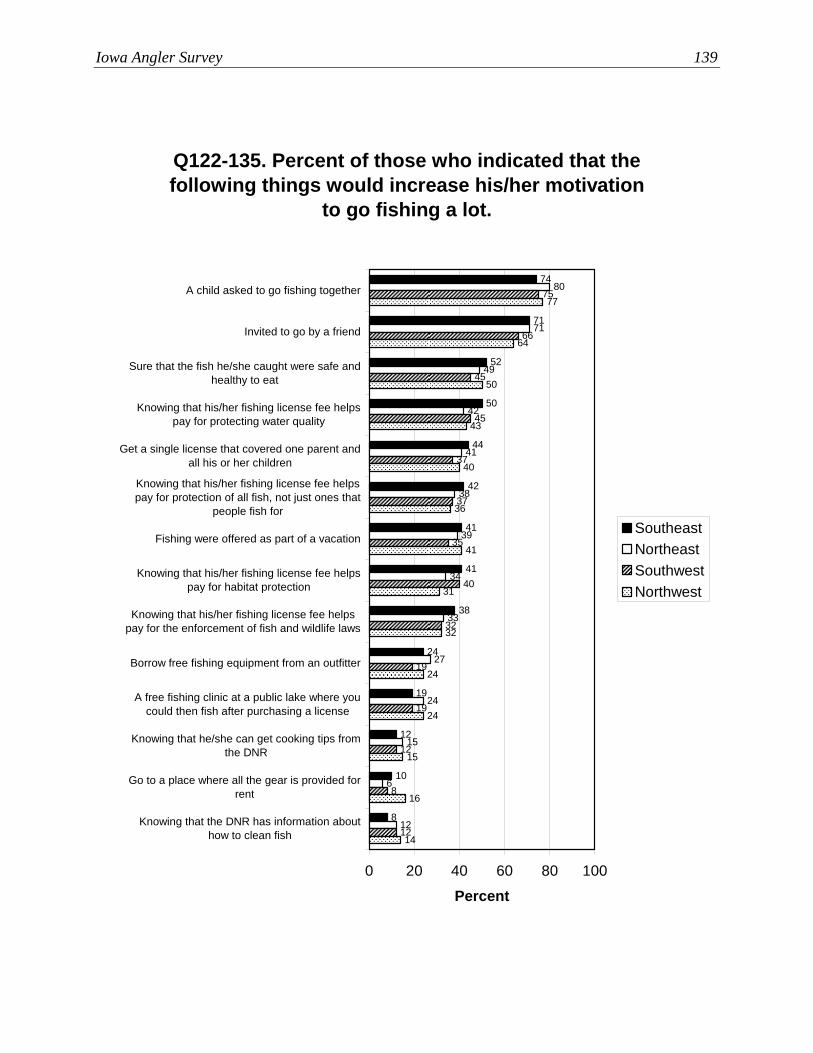
Iowa Angler Survey 139
Q122-135. Percent of those who indicated that the following things would increase his/her motivation
to go fishing a lot.
38
41
41
74
71
52
50
44
42
24
19
12
10
812
6
15
24
27
33
34
39
38
41
42
80
71
49
12
8
12
19
19
32
40
35
37
37
45
66
75
45
14
16
15
24
24
32
31
41
36
40
43
50
64
77
0 20 40 60 80 100
A child asked to go fishing together
Invited to go by a friend
Sure that the fish he/she caught were safe andhealthy to eat
Knowing that his/her fishing license fee helpspay for protecting water quality
Get a single license that covered one parent andall his or her children
Knowing that his/her fishing license fee helpspay for protection of all fish, not just ones that
people fish for
Fishing were offered as part of a vacation
Knowing that his/her fishing license fee helpspay for habitat protection
Knowing that his/her fishing license fee helpspay for the enforcement of fish and wildlife laws
Borrow free fishing equipment from an outfitter
A free fishing clinic at a public lake where youcould then fish after purchasing a license
Knowing that he/she can get cooking tips fromthe DNR
Go to a place where all the gear is provided forrent
Knowing that the DNR has information abouthow to clean fish
Percent
SoutheastNortheastSouthwestNorthwest
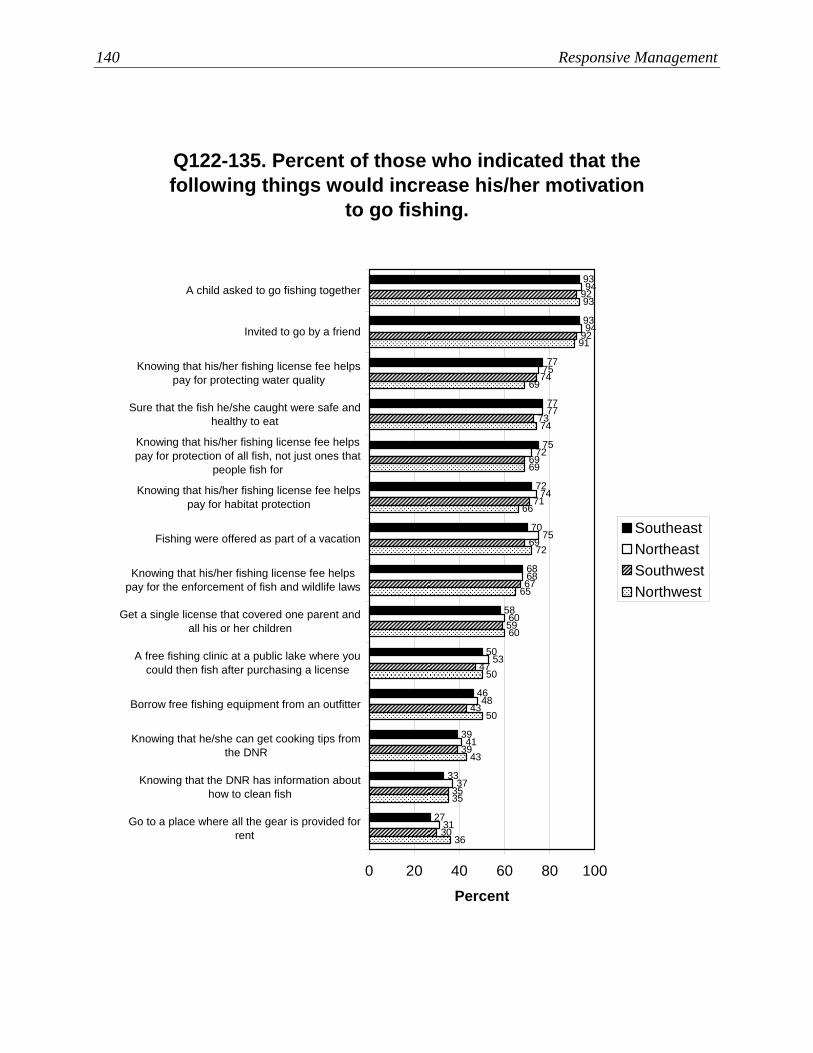
140 Responsive Management
Q122-135. Percent of those who indicated that the following things would increase his/her motivation
to go fishing.
58
68
70
93
93
77
77
75
72
50
46
39
33
2731
37
41
48
53
60
68
75
74
72
77
94
94
75
30
35
39
43
47
59
67
69
71
69
74
92
92
73
36
35
43
50
50
60
65
72
66
69
74
69
91
93
0 20 40 60 80 100
A child asked to go fishing together
Invited to go by a friend
Knowing that his/her fishing license fee helpspay for protecting water quality
Sure that the fish he/she caught were safe andhealthy to eat
Knowing that his/her fishing license fee helpspay for protection of all fish, not just ones that
people fish for
Knowing that his/her fishing license fee helpspay for habitat protection
Fishing were offered as part of a vacation
Knowing that his/her fishing license fee helpspay for the enforcement of fish and wildlife laws
Get a single license that covered one parent andall his or her children
A free fishing clinic at a public lake where youcould then fish after purchasing a license
Borrow free fishing equipment from an outfitter
Knowing that he/she can get cooking tips fromthe DNR
Knowing that the DNR has information abouthow to clean fish
Go to a place where all the gear is provided forrent
Percent
SoutheastNortheastSouthwestNorthwest
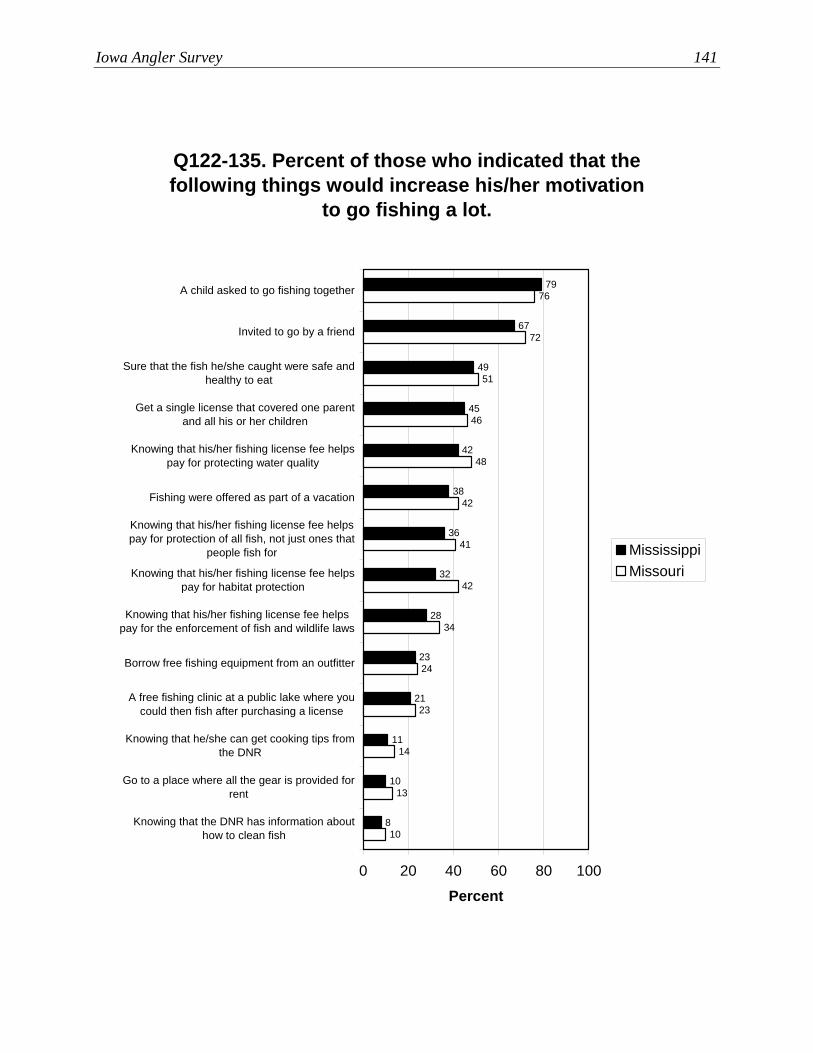
Iowa Angler Survey 141
Q122-135. Percent of those who indicated that the following things would increase his/her motivation
to go fishing a lot.
28
32
36
79
67
49
45
42
38
23
21
11
10
810
13
14
23
24
34
42
41
42
48
46
76
72
51
0 20 40 60 80 100
A child asked to go fishing together
Invited to go by a friend
Sure that the fish he/she caught were safe andhealthy to eat
Get a single license that covered one parentand all his or her children
Knowing that his/her fishing license fee helpspay for protecting water quality
Fishing were offered as part of a vacation
Knowing that his/her fishing license fee helpspay for protection of all fish, not just ones that
people fish for
Knowing that his/her fishing license fee helpspay for habitat protection
Knowing that his/her fishing license fee helpspay for the enforcement of fish and wildlife laws
Borrow free fishing equipment from an outfitter
A free fishing clinic at a public lake where youcould then fish after purchasing a license
Knowing that he/she can get cooking tips fromthe DNR
Go to a place where all the gear is provided forrent
Knowing that the DNR has information abouthow to clean fish
Percent
MississippiMissouri
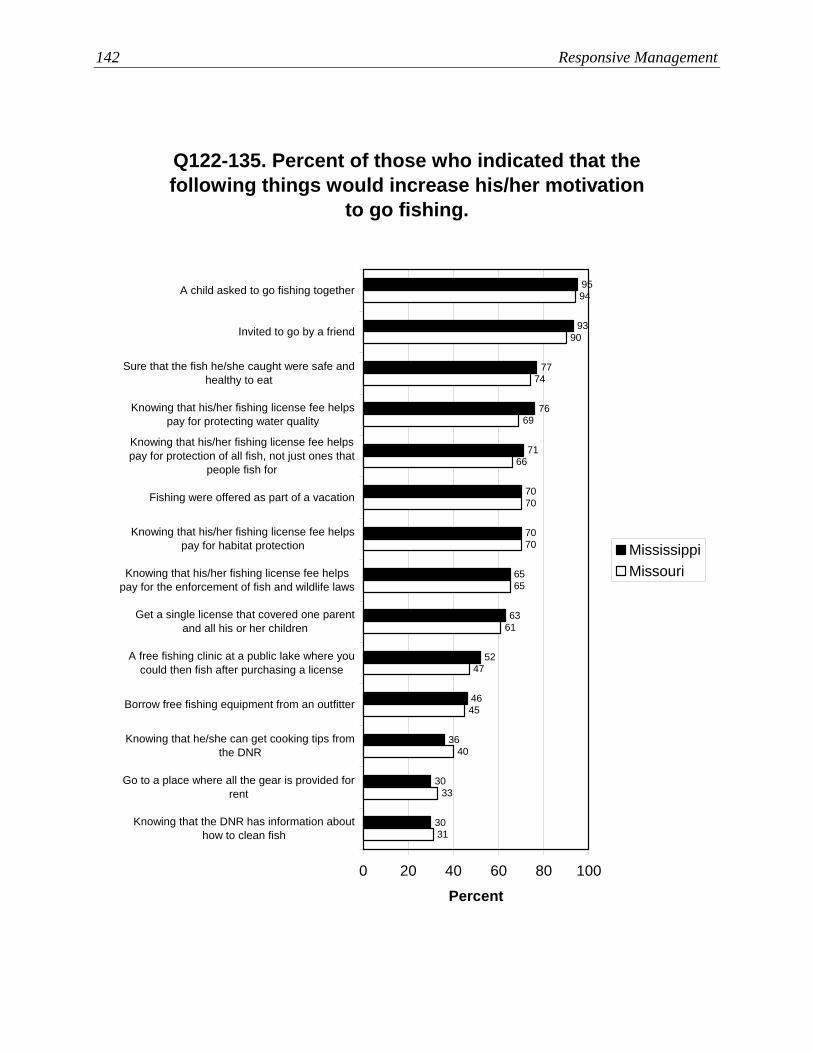
142 Responsive Management
Q122-135. Percent of those who indicated that the following things would increase his/her motivation
to go fishing.
63
65
70
95
93
77
76
71
70
52
46
36
30
3031
33
40
45
47
61
65
70
70
66
69
94
90
74
0 20 40 60 80 100
A child asked to go fishing together
Invited to go by a friend
Sure that the fish he/she caught were safe andhealthy to eat
Knowing that his/her fishing license fee helpspay for protecting water quality
Knowing that his/her fishing license fee helpspay for protection of all fish, not just ones that
people fish for
Fishing were offered as part of a vacation
Knowing that his/her fishing license fee helpspay for habitat protection
Knowing that his/her fishing license fee helpspay for the enforcement of fish and wildlife laws
Get a single license that covered one parentand all his or her children
A free fishing clinic at a public lake where youcould then fish after purchasing a license
Borrow free fishing equipment from an outfitter
Knowing that he/she can get cooking tips fromthe DNR
Go to a place where all the gear is provided forrent
Knowing that the DNR has information abouthow to clean fish
Percent
MississippiMissouri

Iowa Angler Survey 143
CONSTRAINTS TO FISHING PARTICIPATION The survey asked anglers about 26 potential constraints on fishing participation, asking if
each was a major factor, a minor factor, or not a factor causing the respondent not to fish as
much as he/she wanted or took away from enjoyment of fishing. The top constraint, by far,
was lack of time because of work obligations (45% said this was a major factor), distantly
followed by lack of time because of family obligations (22%). Below these were poor water
quality (13%), lack of fish to catch (10%), and the feeling that places outside of Iowa are
better for fishing (10%).
• Casual anglers were more likely than avid anglers to say that lack of time because of
family obligations was a major factor. On the other hand, avid anglers were more likely
to say that poor behavior of other recreationists excluding anglers was a major factor. In
looking at major and minor factors combined, casual anglers were more likely than avid
anglers to say that lack of skill or lack of interest was a factor. Meanwhile, avid anglers
were more likely than casual anglers to say that poor behavior of other recreationists
(both anglers and non-anglers) was a factor, that interference from others was a factor,
and that lack of access was a factor.
• The crosstabulation by region of the state found little difference among regions on the 26
potential constraints on fishing participation.
• The data analysis by river region found only a few small differences among each river
region regarding potential constraints to fishing participation and/or enjoyment. Missouri
River Region anglers were more likely than were Mississippi River Region anglers to cite
lack of fish to catch, lack of access to fishing places, and lack of big fish as major factors.
The survey asked if the price of gas had negatively affected anglers’ fishing, and 14%
indicated that it negatively affected their fishing participation “a great deal.” In total, 29%
indicated that it had affected their fishing “a little” or “a great deal.”
• The crosstabulation by avid versus casual angler found that avid anglers were more likely
to be affected by the price of gas.
• The regional crosstabulation shows no marked differences among the regions on this
question about the price of gas.
144 Responsive Management
• The data analysis by river region found no marked differences between anglers overall
and anglers from either the Mississippi River Region or the Missouri River Region
regarding whether gas prices had negatively affected their fishing participation.
• A crosstabulation shows a correlation to distance typically traveled and whether the price
of gas has negatively affected fishing participation: those who typically travel farther
were more likely to be affected by the price of gas.
A very small percentage of Iowa anglers (3%) rate the IDNR as poor in managing fishing and
fisheries in Iowa, and 13% rate the IDNR as fair (for a total of 16% in the bottom half of the
scale from excellent to poor). Certainly for these anglers, this low perception of fishing
management could be a constraint to fishing in Iowa. These anglers who gave a fair or poor
rating were asked why they had given a low rating, and lack of fish/poor quality of fishing
was the top answer, followed by water quality/pollution. (These graphs are shown in the
section of this report titled, “Ratings of Fishing and Fisheries Management in Iowa.”)
Low percentages of anglers rate public access to fishing as poor in Iowa, as follows: 5% rate
access to inland rivers and streams as poor, 2% rate access to lakes as poor, 2% rate access to
the Mississippi River as poor, and 2% rate access to the Missouri River as poor. In
considering fair and poor ratings combined (i.e., the lower half of the excellent to poor scale),
only access to inland rivers and streams has very many anglers giving a low rating (26%
rated it fair or poor). Otherwise, 15% rate lake access as fair or poor, and 10% rate access to
the Mississippi and 7% rate access to the Missouri River as fair or poor. These findings
suggest that lack of access is not a constraint for most anglers, but may be a constraint for
some. (These graphs are shown in the section of this report titled, “Ratings of Fishing and
Fisheries Management in Iowa.”)
In a direct question regarding trends in water quality over the past 10 years, a third of anglers
(33%) say that water quality is worse now compared to 10 years ago. For these people, water
quality may be a constraint. (This graph is shown in the section of this report titled, “Ratings
of Fishing and Fisheries Management in Iowa.”)

Iowa Angler Survey 145
Several questions in the survey pertained to the safety of consuming fish caught in Iowa. A
low percentage of those who consume fish from Iowa waters say that they limit their
consumption because of safety concerns—only 16% of those who consume fish. Indeed,
among those who consume fish, only 7% consider Iowa’s fish to be somewhat or very unsafe
to eat. This suggests that safety concerns are not a primary constraint among anglers overall.
(These graphs are shown in the section of this report titled, “Ratings of Fishing and Fisheries
Management in Iowa.”)
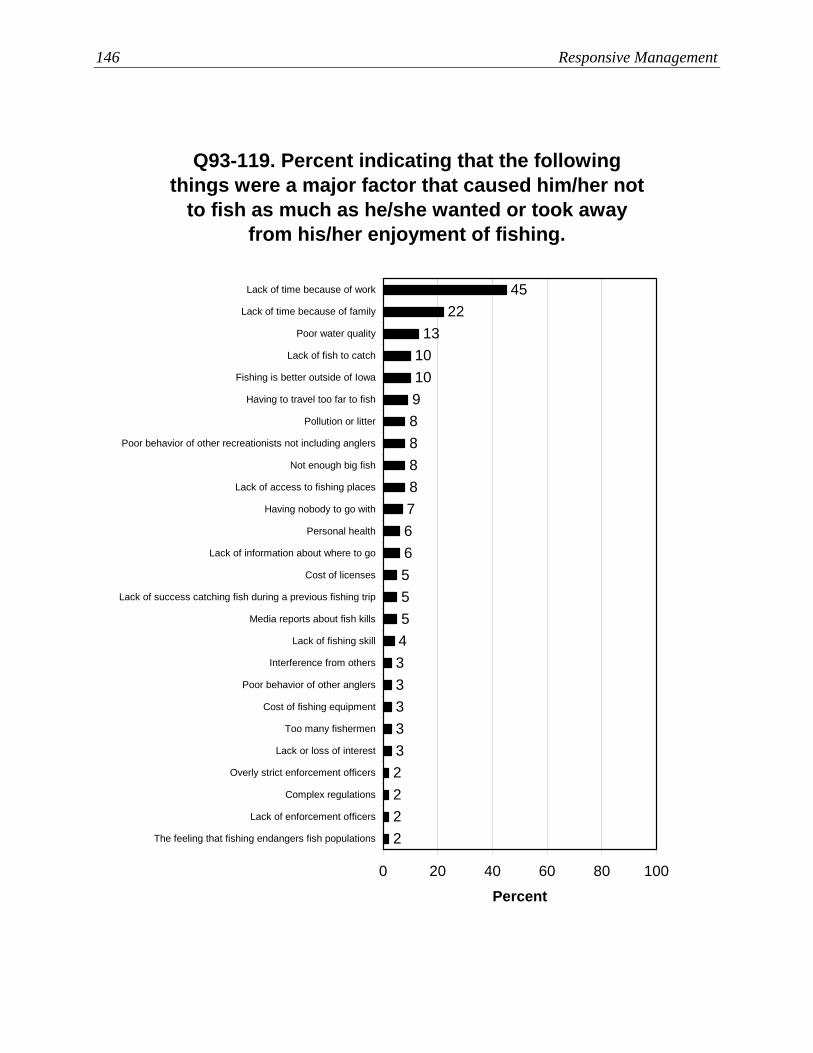
146 Responsive Management
Q93-119. Percent indicating that the following things were a major factor that caused him/her not
to fish as much as he/she wanted or took away from his/her enjoyment of fishing.
54333332222
888
4522
1310109
876655
0 20 40 60 80 100
Lack of time because of work
Lack of time because of family
Poor water quality
Lack of fish to catch
Fishing is better outside of Iowa
Having to travel too far to fish
Pollution or litter
Poor behavior of other recreationists not including anglers
Not enough big fish
Lack of access to fishing places
Having nobody to go with
Personal health
Lack of information about where to go
Cost of licenses
Lack of success catching fish during a previous fishing trip
Media reports about fish kills
Lack of fishing skill
Interference from others
Poor behavior of other anglers
Cost of fishing equipment
Too many fishermen
Lack or loss of interest
Overly strict enforcement officers
Complex regulations
Lack of enforcement officers
The feeling that fishing endangers fish populations
Percent
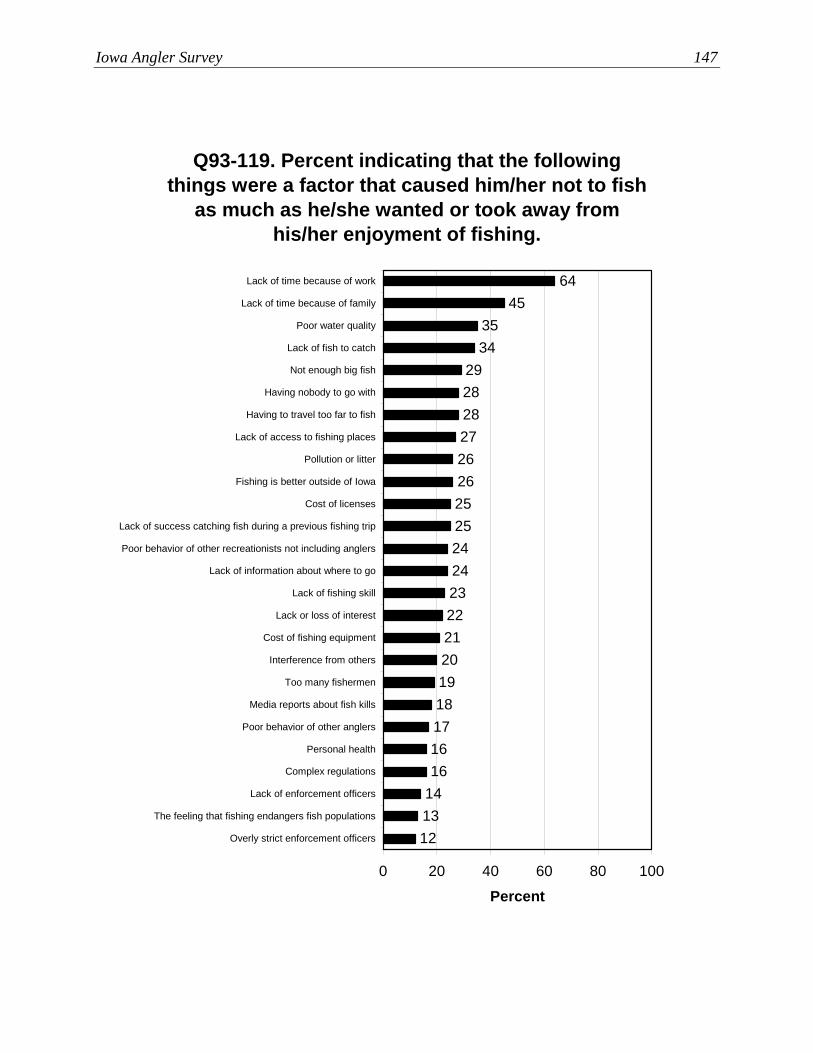
Iowa Angler Survey 147
Q93-119. Percent indicating that the following things were a factor that caused him/her not to fish
as much as he/she wanted or took away from his/her enjoyment of fishing.
2221201918171616
141312
262728
6445
3534
2928
262525242423
0 20 40 60 80 100
Lack of time because of work
Lack of time because of family
Poor water quality
Lack of fish to catch
Not enough big fish
Having nobody to go with
Having to travel too far to fish
Lack of access to fishing places
Pollution or litter
Fishing is better outside of Iowa
Cost of licenses
Lack of success catching fish during a previous fishing trip
Poor behavior of other recreationists not including anglers
Lack of information about where to go
Lack of fishing skill
Lack or loss of interest
Cost of fishing equipment
Interference from others
Too many fishermen
Media reports about fish kills
Poor behavior of other anglers
Personal health
Complex regulations
Lack of enforcement officers
The feeling that fishing endangers fish populations
Overly strict enforcement officers
Percent

148 Responsive Management
Q93-119. Percent of those who indicated that the following things were a major factor that caused him/her not to fish as much as he/she wanted or
took away from his/her enjoyment of fishing.
5
5
3
3
3
2
2
2
2
2
2
11
9
10
9
9
10
7
4
5
10
4
6
2
6
3
4
1
5
4
3
2
3
2
8
8
8
46
23
13
10
10
9
7
6
6
6
6
6
45
18
14
0 20 40 60 80 100
Lack of time because of work
Lack of time because of family
Poor water quality
Lack of fish to catch
Fishing is better outside of Iowa
Having to travel too far to fish
Pollution or litter
Not enough big fish
Lack of access to fishing places
Having nobody to go with
Cost of licenses
Personal healthPoor behavior of other recreationists not including
anglersLack of success catching fish during a previous
fishing tripLack of information about where to go
Lack of fishing skill
Media reports about fish kills
Cost of fishing equipment
Too many fishermen
Lack or loss of interest
Interference from others
Poor behavior of other anglers
Overly strict enforcement officers
Complex regulations
Lack of enforcement officers
The feeling that fishing endangers fish populations
Percent
Casual anglerAvid angler
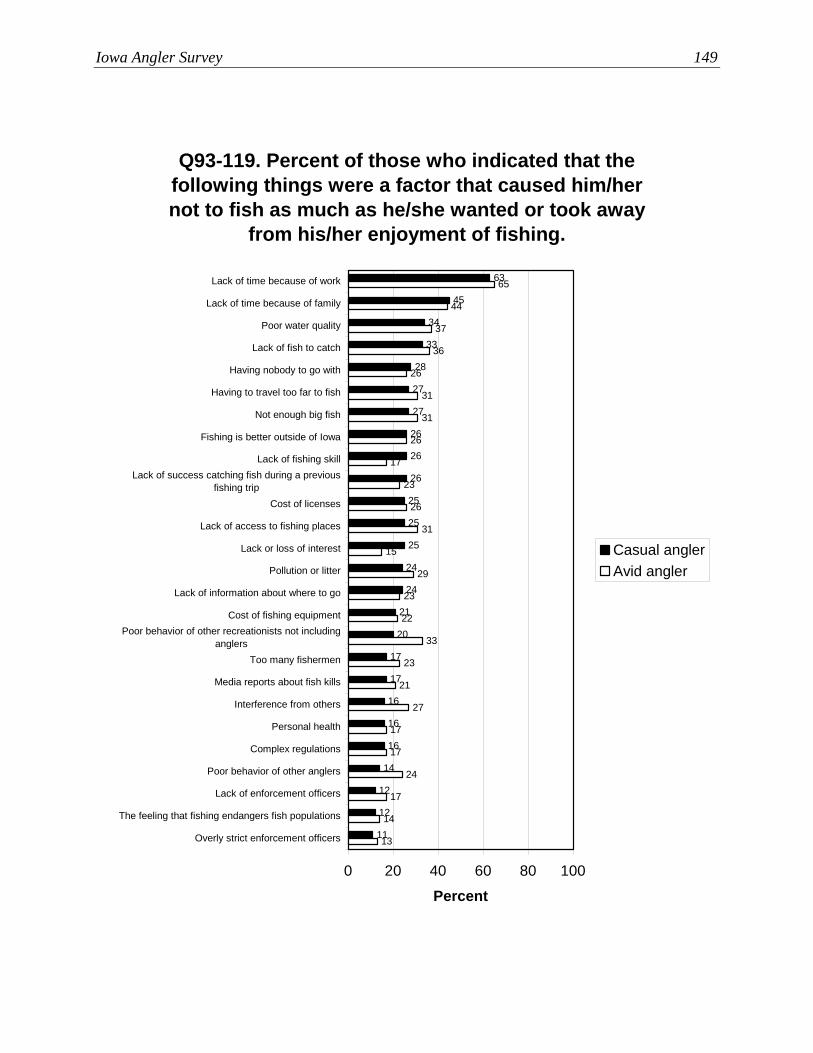
Iowa Angler Survey 149
Q93-119. Percent of those who indicated that the following things were a factor that caused him/her not to fish as much as he/she wanted or took away
from his/her enjoyment of fishing.
21
20
17
17
16
16
16
14
12
12
11
36
26
31
31
26
17
23
26
31
15
29
23
22
33
23
21
27
17
17
24
17
14
13
26
26
27
63
45
34
33
28
27
26
25
25
25
24
24
65
44
37
0 20 40 60 80 100
Lack of time because of work
Lack of time because of family
Poor water quality
Lack of fish to catch
Having nobody to go with
Having to travel too far to fish
Not enough big fish
Fishing is better outside of Iowa
Lack of fishing skillLack of success catching fish during a previous
fishing tripCost of licenses
Lack of access to fishing places
Lack or loss of interest
Pollution or litter
Lack of information about where to go
Cost of fishing equipmentPoor behavior of other recreationists not including
anglersToo many fishermen
Media reports about fish kills
Interference from others
Personal health
Complex regulations
Poor behavior of other anglers
Lack of enforcement officers
The feeling that fishing endangers fish populations
Overly strict enforcement officers
Percent
Casual anglerAvid angler

150 Responsive Management
Q93-119. Percent of those who indicated that the following things were a major factor that caused him/her not to fish as much as he/she wanted or
took away from his/her enjoyment of fishing. (Part 1)
7
7
7
48
21
11
10
9
8
6
6
6
53
8
10
5
12
9
4
7
9
6
43
21
15
4
8
7
7
9
9
11
12
8
12
24
46
6
10
7
9
6
13
9
11
14
12
10
17
21
43
0 20 40 60 80 100
Lack of time because of work
Lack of time because of family
Poor water quality
Pollution or litter
Having to travel too far to fish
Lack of fish to catch
Not enough big fish
Lack of access to fishing places
Fishing is better outside of Iowa
Personal health
Poor behavior of other recreationists notincluding anglers
Having nobody to go with
Cost of licenses
Percent
SoutheastNortheastSouthwestNorthwest
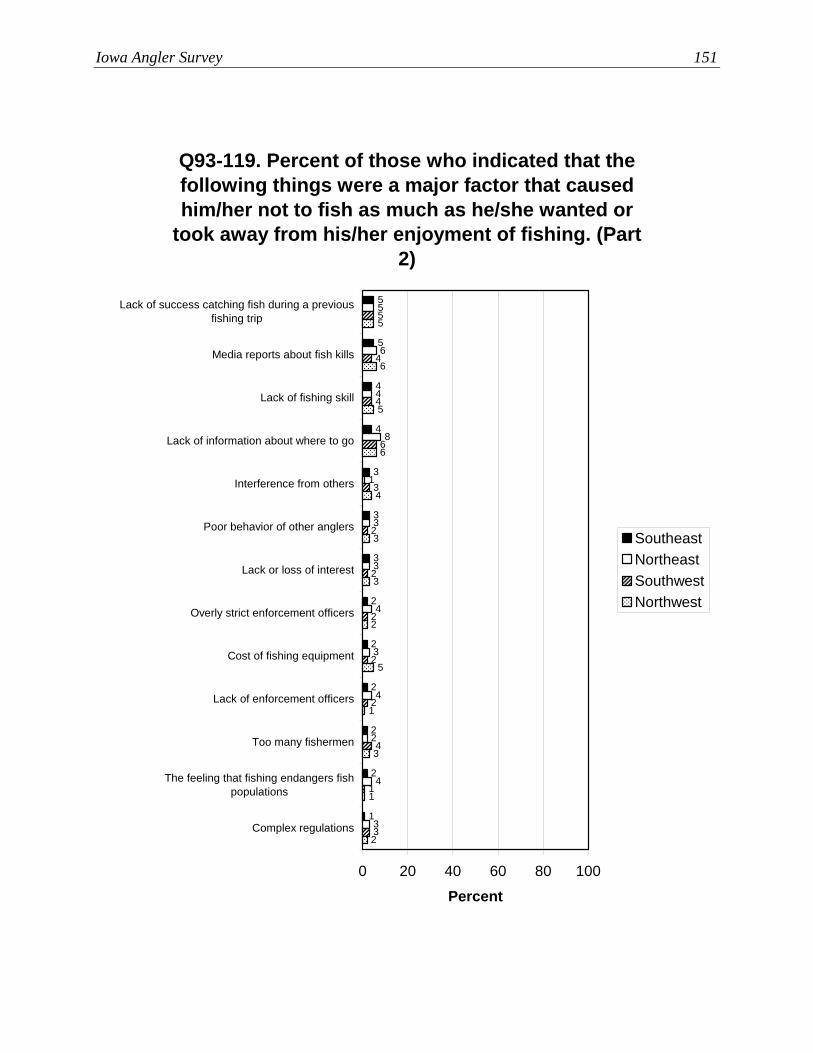
Iowa Angler Survey 151
Q93-119. Percent of those who indicated that the following things were a major factor that caused him/her not to fish as much as he/she wanted or
took away from his/her enjoyment of fishing. (Part 2)
1
2
2
2
3
3
4
4
5
5
3
2
2
3
4
2
4
3
4
3
3
1
8
4
6
5
3
1
4
2
2
2
2
2
3
6
5
4
4
2
1
3
1
5
2
3
3
4
6
5
6
5
0 20 40 60 80 100
Lack of success catching fish during a previousfishing trip
Media reports about fish kills
Lack of fishing skill
Lack of information about where to go
Interference from others
Poor behavior of other anglers
Lack or loss of interest
Overly strict enforcement officers
Cost of fishing equipment
Lack of enforcement officers
Too many fishermen
The feeling that fishing endangers fishpopulations
Complex regulations
Percent
SoutheastNortheastSouthwestNorthwest
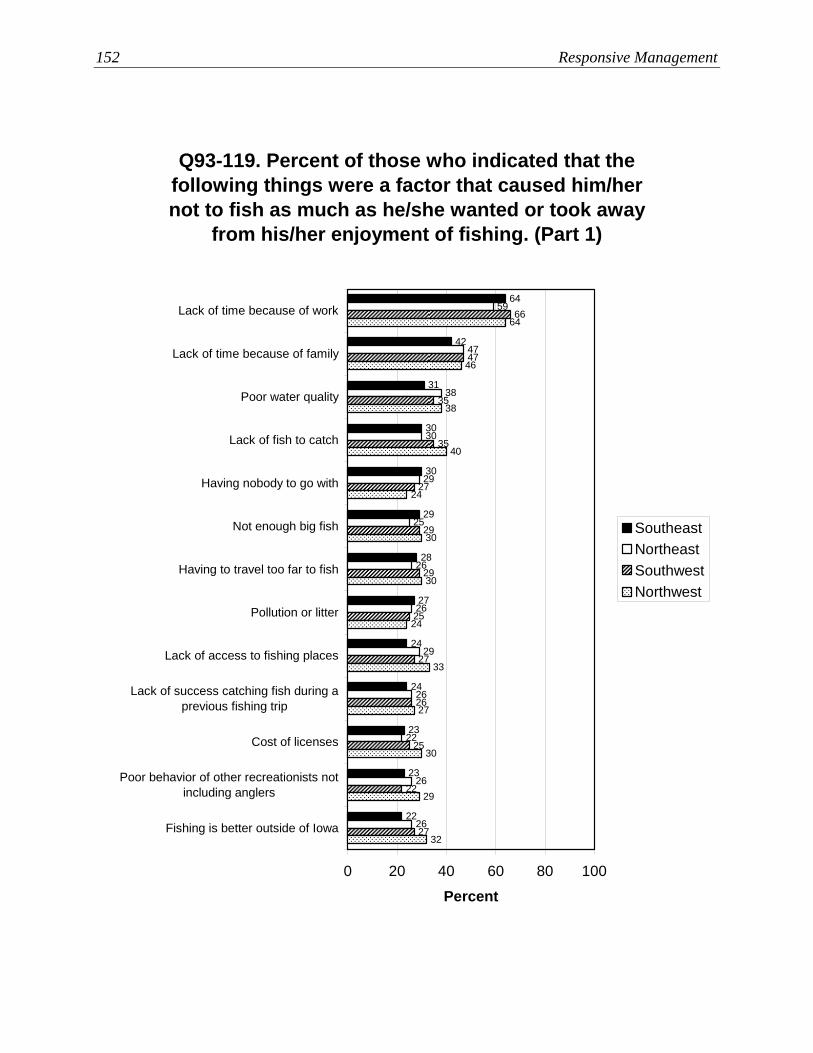
152 Responsive Management
Q93-119. Percent of those who indicated that the following things were a factor that caused him/her not to fish as much as he/she wanted or took away
from his/her enjoyment of fishing. (Part 1)
24
27
28
64
42
31
30
30
29
24
23
23
2226
26
22
26
29
26
26
25
29
30
59
47
38
27
22
25
26
27
25
29
29
27
35
47
66
35
32
29
30
27
33
24
30
30
24
40
38
46
64
0 20 40 60 80 100
Lack of time because of work
Lack of time because of family
Poor water quality
Lack of fish to catch
Having nobody to go with
Not enough big fish
Having to travel too far to fish
Pollution or litter
Lack of access to fishing places
Lack of success catching fish during aprevious fishing trip
Cost of licenses
Poor behavior of other recreationists notincluding anglers
Fishing is better outside of Iowa
Percent
SoutheastNortheastSouthwestNorthwest
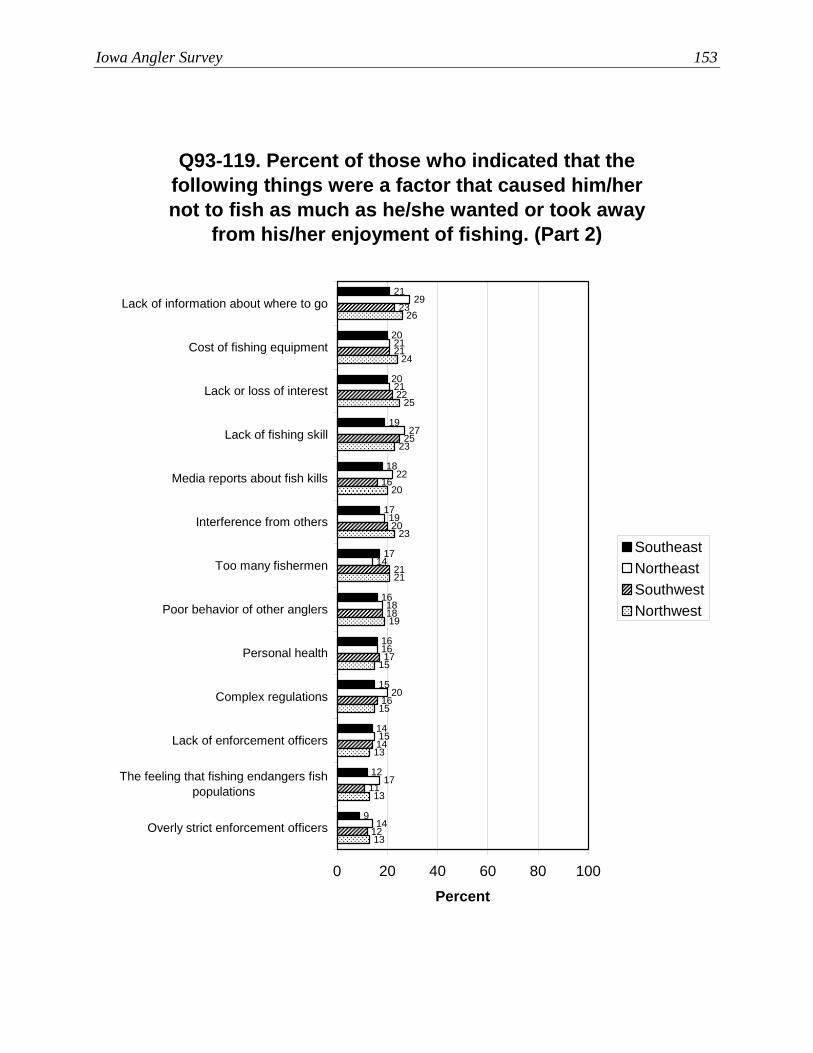
Iowa Angler Survey 153
Q93-119. Percent of those who indicated that the following things were a factor that caused him/her not to fish as much as he/she wanted or took away
from his/her enjoyment of fishing. (Part 2)
9
12
14
15
17
18
19
20
20
21
17
16
16
14
17
15
20
16
18
14
19
22
27
21
21
29
12
11
14
16
17
18
21
20
16
25
23
21
22
13
13
13
15
15
19
21
23
20
23
26
24
25
0 20 40 60 80 100
Lack of information about where to go
Cost of fishing equipment
Lack or loss of interest
Lack of fishing skill
Media reports about fish kills
Interference from others
Too many fishermen
Poor behavior of other anglers
Personal health
Complex regulations
Lack of enforcement officers
The feeling that fishing endangers fishpopulations
Overly strict enforcement officers
Percent
SoutheastNortheastSouthwestNorthwest
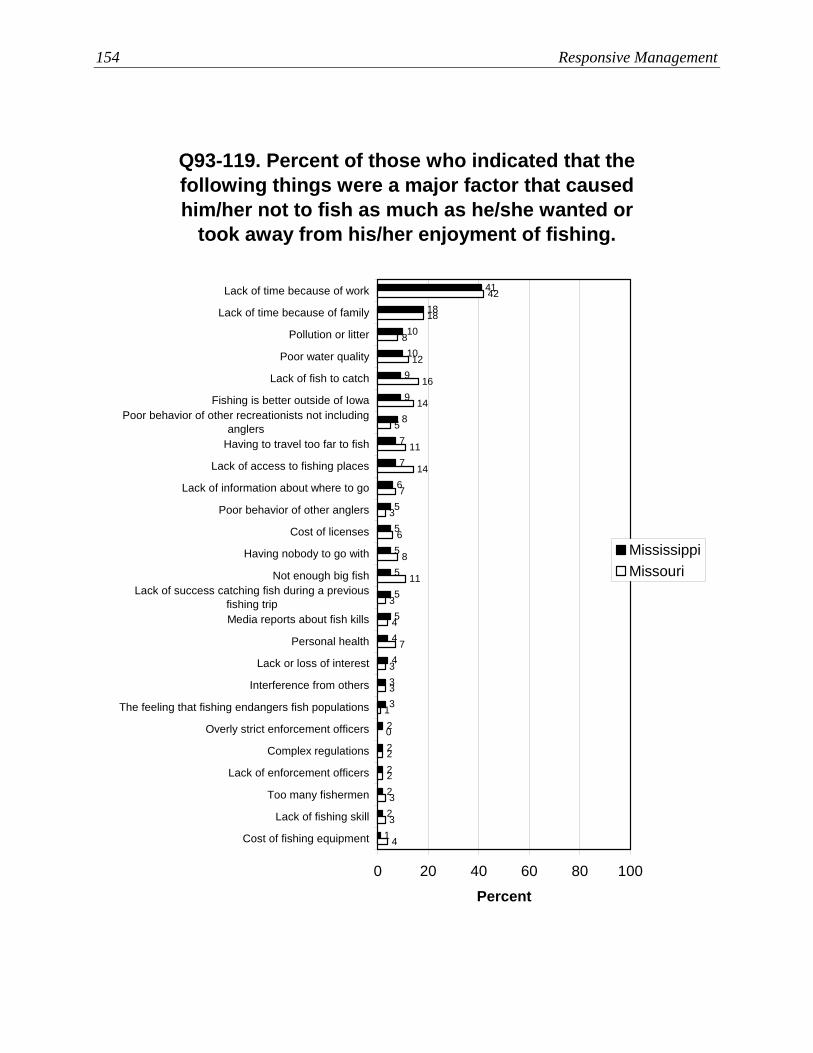
154 Responsive Management
Q93-119. Percent of those who indicated that the following things were a major factor that caused him/her not to fish as much as he/she wanted or
took away from his/her enjoyment of fishing.
1
2
2
2
2
2
3
3
4
4
5
7
7
8
41
18
10
10
9
9
6
5
5
5
5
5
4
3
3
2
2
0
1
3
3
7
4
3
11
8
6
3
7
14
11
5
14
16
12
42
18
8
0 20 40 60 80 100
Lack of time because of work
Lack of time because of family
Pollution or litter
Poor water quality
Lack of fish to catch
Fishing is better outside of IowaPoor behavior of other recreationists not including
anglersHaving to travel too far to fish
Lack of access to fishing places
Lack of information about where to go
Poor behavior of other anglers
Cost of licenses
Having nobody to go with
Not enough big fishLack of success catching fish during a previous
fishing tripMedia reports about fish kills
Personal health
Lack or loss of interest
Interference from others
The feeling that fishing endangers fish populations
Overly strict enforcement officers
Complex regulations
Lack of enforcement officers
Too many fishermen
Lack of fishing skill
Cost of fishing equipment
Percent
MississippiMissouri

Iowa Angler Survey 155
Q93-119. Percent of those who indicated that the following things were a factor that caused him/her not to fish as much as he/she wanted or took away
from his/her enjoyment of fishing.
11
13
14
14
17
18
19
20
20
21
21
26
26
28
60
43
32
31
31
28
25
25
24
23
21
21
7
17
10
10
13
14
14
17
16
25
18
19
16
21
31
28
22
30
24
28
23
24
40
58
41
28
0 20 40 60 80 100
Lack of time because of work
Lack of time because of family
Poor water quality
Lack of fish to catch
Having nobody to go with
Pollution or litter
Not enough big fishPoor behavior of other recreationists not
including anglersHaving to travel too far to fish
Cost of licenses
Fishing is better outside of Iowa
Lack of access to fishing placesLack of success catching fish during a previous
fishing tripPoor behavior of other anglers
Cost of fishing equipment
Lack or loss of interest
Lack of information about where to go
Interference from others
Lack of fishing skill
Too many fishermen
Media reports about fish kills
Complex regulations
Lack of enforcement officersThe feeling that fishing endangers fish
populationsPersonal health
Overly strict enforcement officers
Percent
MississippiMissouri
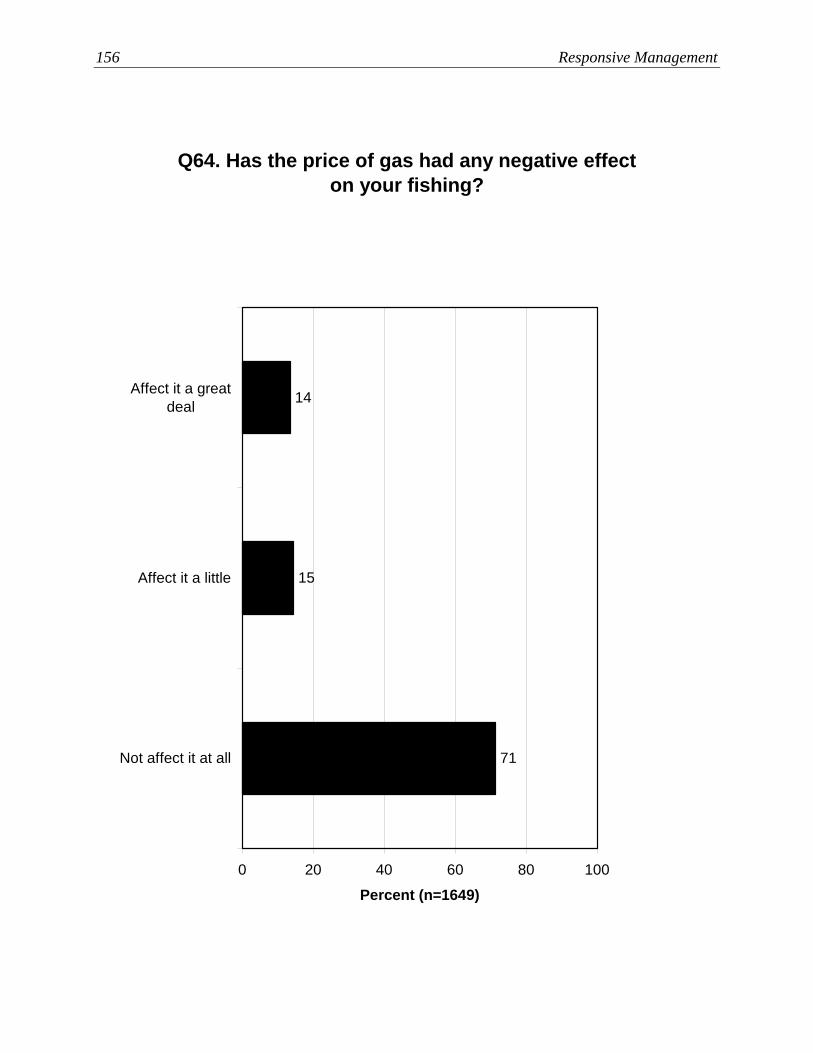
156 Responsive Management
Q64. Has the price of gas had any negative effect on your fishing?
71
15
14
0 20 40 60 80 100
Affect it a greatdeal
Affect it a little
Not affect it at all
Percent (n=1649)

Iowa Angler Survey 157
Q64. Has the price of gas had any negative effect on your fishing?
76
12
13
62
21
16
0 20 40 60 80 100
Affect it agreat deal
Affect it a little
Not affect it atall
Percent
Casual angler (n=807)Avid angler (n=842)
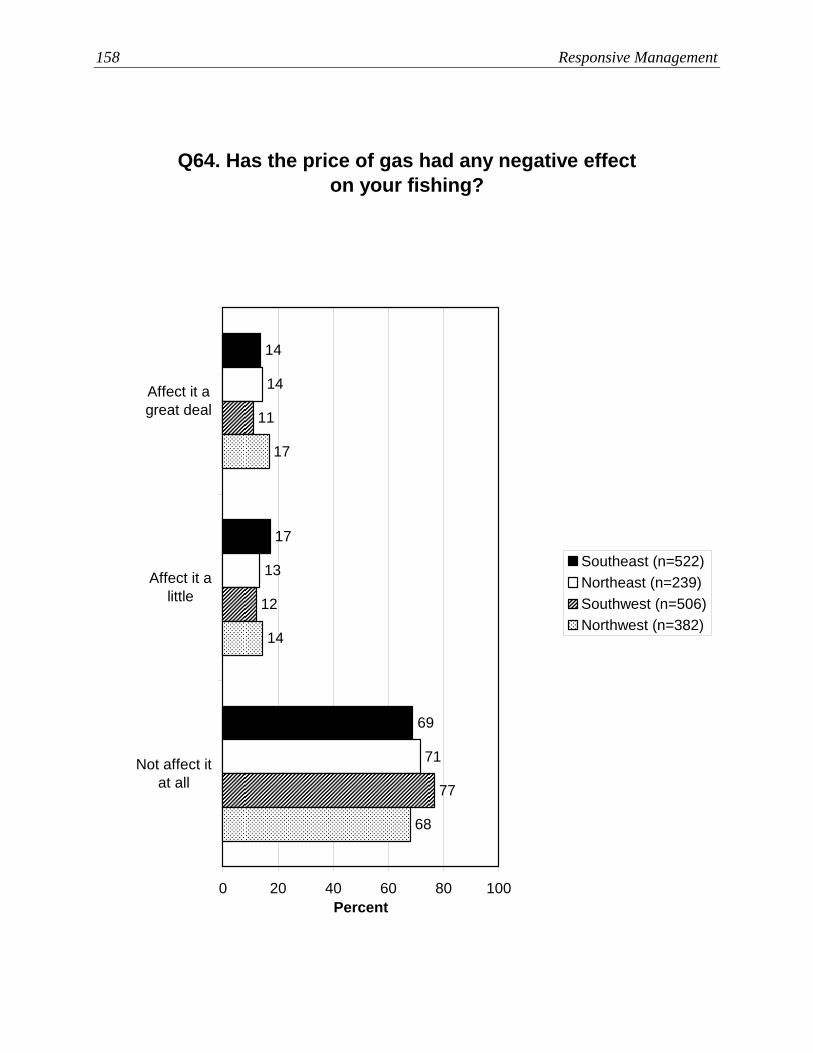
158 Responsive Management
Q64. Has the price of gas had any negative effect on your fishing?
69
17
14
71
13
14
11
12
77
17
14
68
0 20 40 60 80 100
Affect it agreat deal
Affect it alittle
Not affect itat all
Percent
Southeast (n=522)Northeast (n=239)Southwest (n=506)Northwest (n=382)

Iowa Angler Survey 159
Q64. Has the price of gas had any negative effect on your fishing?
71
14
15
69
11
19
0 20 40 60 80 100
Affect it a greatdeal
Affect it a little
Not affect it atall
Percent
Mississippi (n=291)Missouri (n=302)

160 Responsive Management
Q63. How many miles do you/did you typically travel from your home, one-way, to fish in Iowa?
9
5
15
23
26
3
4
11
23
42
1
1
23
26
10
8
8
9
4
12
10
5
4
5
4
5
5
0 20 40 60 80 100
More than100 miles
76 - 100 miles
51 - 75 miles
41 - 50 miles
31 - 40 miles
21 - 30 miles
11 - 20 miles
0 - 10 miles
Don't know
Percent
Price of gas has negativelyaffected fishing a great deal
Price of gas has negativelyaffected fishing a little
Price of gas has notnegatively affected fishingat all
Iowa Angler Survey 161
RATINGS OF FISHING AND FISHERIES MANAGEMENT IN IOWA
The majority of Iowa anglers (66%) rate fishing in Iowa as excellent or good (most of those
saying good), while 32% rate it as fair or poor (most of those saying fair).
• There was almost no difference between avid and casual anglers in the crosstabulation on
this question.
• The regional crosstabulation shows no marked differences among the regions on this
question.
• Ratings of fishing in Iowa are not greatly different in the two river regions compared to
anglers overall.
The majority of Iowa anglers (63%) rate public access to Iowa’s rivers and streams for
fishing as excellent or good (mostly good), while 26% rate such access as fair or poor
(mostly fair). Regarding access to lakes, the majority of Iowa anglers (76%) rate public
access to Iowa’s lakes for fishing as excellent or good (mostly good), while 15% rate access
to lakes as fair or poor (mostly fair).
• The survey asked specifically about public access to the Mississippi and Missouri Rivers.
For both questions, most anglers indicate that they cannot say/don’t know. Otherwise,
many more give good or excellent ratings than give fair or poor ratings for both rivers.
• The results of the crosstabulation of avid versus casual anglers on these questions show
that the groups are similar in their ratings of access.
• The crosstabulation by region found that Southeast Region and Northeast Region anglers
are more likely, relative to anglers from either western region, to rate access to Iowa’s
inland rivers and streams as excellent or good. The regions are about the same regarding
access to lakes for fishing. Regarding access to the rivers, not surprisingly, western
anglers are less knowledgeable about access to the Mississippi River (which is along the
east part of the state), and eastern anglers are less knowledgeable about access to the
Missouri River.
• The data analysis by river region found that Mississippi River Region anglers are about
the same as anglers overall in their rating of public access to Iowa’s inland rivers and
162 Responsive Management
streams; however, Missouri River Region anglers are more likely to give a fair or poor
rating than are anglers overall.
• The data analysis by river region found that Missouri River Region anglers are about the
same as anglers overall in their rating of public access to lakes for fishing in Iowa.
Mississippi River Region anglers, on the other hand, are less likely to give an excellent or
good rating because they are more likely to give a “Don’t know” answer, not because
they more often give a negative rating—as negative ratings are about the same.
• Anglers from both river regions are much less likely to say, “Don’t know,” regarding
ratings of public access to the Mississippi River and the Missouri River, which makes
them more likely to give any other answer, either a positive rating (excellent or good) or
negative rating (fair or poor). Fortunately, a majority of Mississippi River Region
anglers rate access to the Mississippi River as excellent or good, and a majority of
Missouri River Region anglers rate access to the Missouri River as excellent or good.
The majority of Iowa anglers (72%) rate the IDNR as excellent or good in managing fishing
and fisheries in Iowa (most of those saying good), while 16% rate the IDNR as fair or poor
(most of those saying fair).
• There was little difference between avid and casual anglers in this crosstabulation of
ratings of the IDNR in managing fishing and fisheries.
• The regional crosstabulation shows no marked differences among the regions on this
question regarding rating of fishing and fisheries in Iowa.
• The data analysis by river region found no large differences between anglers overall and
anglers from the river regions, with one exception: Mississippi River Region anglers are
more likely to say, “Don’t know,” regarding rating the IDNR at managing fishing and
fisheries. Note that negative ratings (fair or poor) are about the same among the river
regions and anglers overall.
• Most of those anglers who rated management of fishing and fisheries in the higher end of
the scale (excellent or good) gave as their reasoning that the fish, wildlife, and habitat are
managed well; a smaller amount said that good people work in fishing management.
• The crosstabulation by avid versus casual angler found no marked differences on this
question regarding reasons for giving an excellent or good rating.

Iowa Angler Survey 163
• The regional crosstabulation shows no marked differences among the regions on this
question regarding reasons for giving an excellent or good rating.
• The data analysis by river region found no marked differences between anglers overall
and anglers from either river region on this question regarding reasons for giving an
excellent or good rating.
• Those anglers who rated management of fishing and fisheries in the lower end of the
scale (fair or poor) most commonly gave as their reasoning that there is a lack of fish or
that fishing quality is bad, that water quality is bad, or that the agency’s priorities are
wrong.
• The crosstabulation by avid versus casual angler found no marked differences on this
question regarding reasons for giving a fair or poor rating.
• The regional crosstabulation found a marked difference on this question. Almost none of
the Northeast Region anglers indicated that lack of fish/poor quality fishing was a reason
to give a low rating, while some anglers from other regions did give this reason.
• The data analysis by river region found no marked differences between anglers overall
and anglers from either river region on this question.
The large majority of Iowa anglers (77%) rate Iowa’s enforcement of fishing regulations and
laws as excellent or good (most of those saying good), while only 14% rate Iowa’s
enforcement as fair or poor (most of those saying fair).
• In related questions, the majority of Iowa anglers describe fishing management in Iowa as
regulated the right amount (77%). Otherwise, more of them said, “Don’t know” (12%),
than said that fishing was over- or under-regulated. Also, the overwhelming majority of
Iowa anglers (84%) describe Iowa’s fishing regulations as clear, while only 7% describe
them as confusing.
• On all these questions, the crosstabulations by avid versus casual angler show little
difference between the groups.
• On all these questions, the regional crosstabulations show no marked differences among
regions.
• In the data analysis by river region, Mississippi River Region anglers give slightly more
negative ratings to Iowa’s enforcement of fishing regulations and laws, compared to
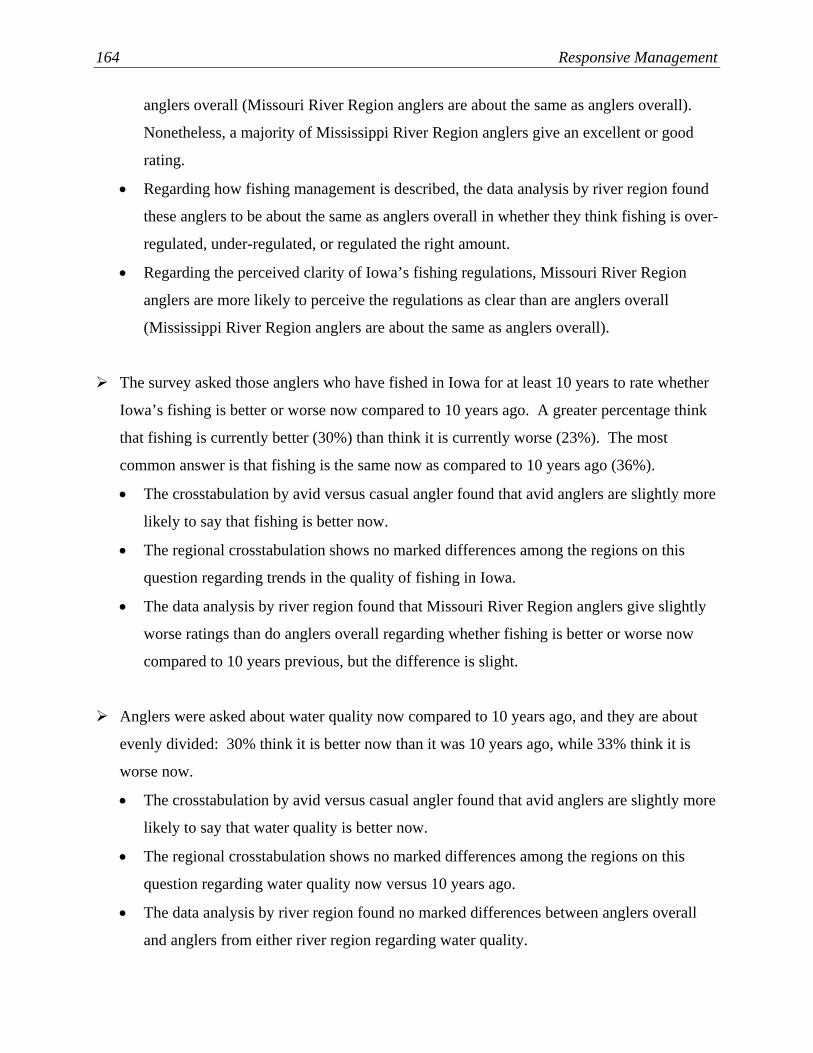
164 Responsive Management
anglers overall (Missouri River Region anglers are about the same as anglers overall).
Nonetheless, a majority of Mississippi River Region anglers give an excellent or good
rating.
• Regarding how fishing management is described, the data analysis by river region found
these anglers to be about the same as anglers overall in whether they think fishing is over-
regulated, under-regulated, or regulated the right amount.
• Regarding the perceived clarity of Iowa’s fishing regulations, Missouri River Region
anglers are more likely to perceive the regulations as clear than are anglers overall
(Mississippi River Region anglers are about the same as anglers overall).
The survey asked those anglers who have fished in Iowa for at least 10 years to rate whether
Iowa’s fishing is better or worse now compared to 10 years ago. A greater percentage think
that fishing is currently better (30%) than think it is currently worse (23%). The most
common answer is that fishing is the same now as compared to 10 years ago (36%).
• The crosstabulation by avid versus casual angler found that avid anglers are slightly more
likely to say that fishing is better now.
• The regional crosstabulation shows no marked differences among the regions on this
question regarding trends in the quality of fishing in Iowa.
• The data analysis by river region found that Missouri River Region anglers give slightly
worse ratings than do anglers overall regarding whether fishing is better or worse now
compared to 10 years previous, but the difference is slight.
Anglers were asked about water quality now compared to 10 years ago, and they are about
evenly divided: 30% think it is better now than it was 10 years ago, while 33% think it is
worse now.
• The crosstabulation by avid versus casual angler found that avid anglers are slightly more
likely to say that water quality is better now.
• The regional crosstabulation shows no marked differences among the regions on this
question regarding water quality now versus 10 years ago.
• The data analysis by river region found no marked differences between anglers overall
and anglers from either river region regarding water quality.
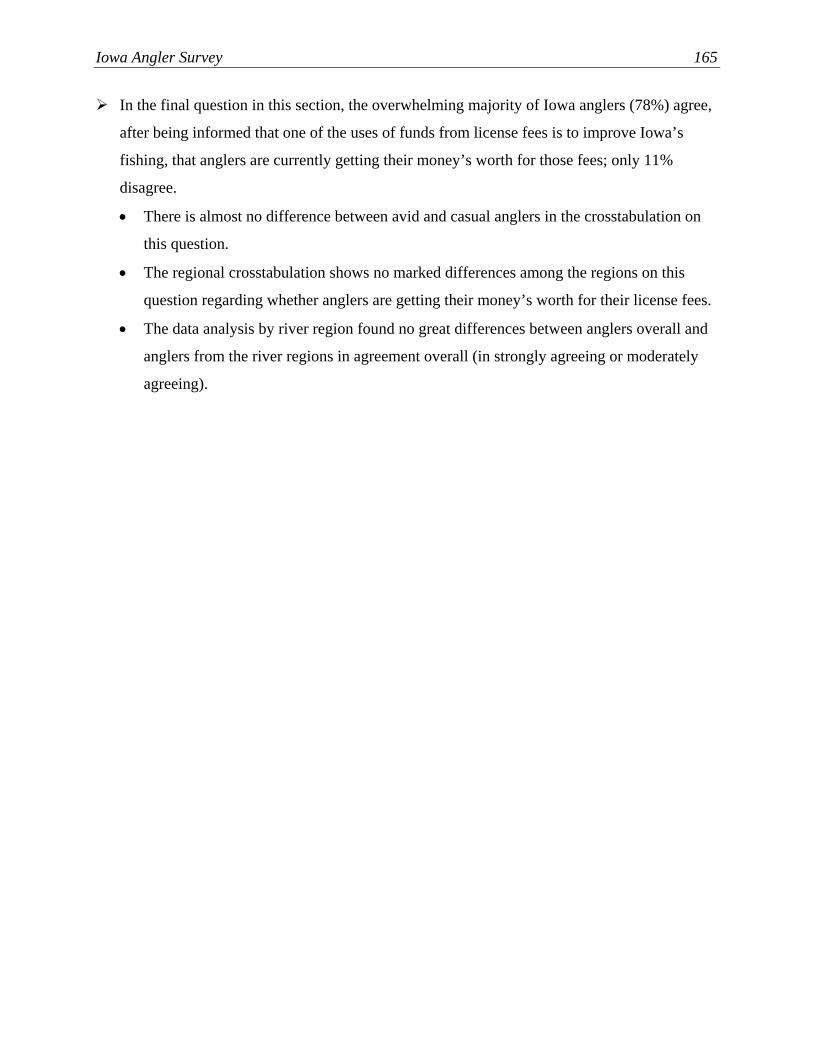
Iowa Angler Survey 165
In the final question in this section, the overwhelming majority of Iowa anglers (78%) agree,
after being informed that one of the uses of funds from license fees is to improve Iowa’s
fishing, that anglers are currently getting their money’s worth for those fees; only 11%
disagree.
• There is almost no difference between avid and casual anglers in the crosstabulation on
this question.
• The regional crosstabulation shows no marked differences among the regions on this
question regarding whether anglers are getting their money’s worth for their license fees.
• The data analysis by river region found no great differences between anglers overall and
anglers from the river regions in agreement overall (in strongly agreeing or moderately
agreeing).

166 Responsive Management
Q142. How would you rate the fishing in Iowa?
2
4
28
56
10
0 20 40 60 80 100
Excellent
Good
Fair
Poor
Don't know / can’tsay
Percent (n=1646)

Iowa Angler Survey 167
Q142. How would you rate the fishing in Iowa?
3
4
28
55
9
1
4
28
56
11
0 20 40 60 80 100
Excellent
Good
Fair
Poor
Don't know /can’t say
Percent
Casual angler (n=806)Avid angler (n=840)

168 Responsive Management
Q142. How would you rate the fishing in Iowa?
3
4
26
56
11
3
2
27
60
8
2
5
10
55
28
1
6
9
52
33
0 20 40 60 80 100
Excellent
Good
Fair
Poor
Don't know /can’t say
Percent
Southeast (n=520)Northeast (n=239)Southwest (n=506)Northwest (n=381)
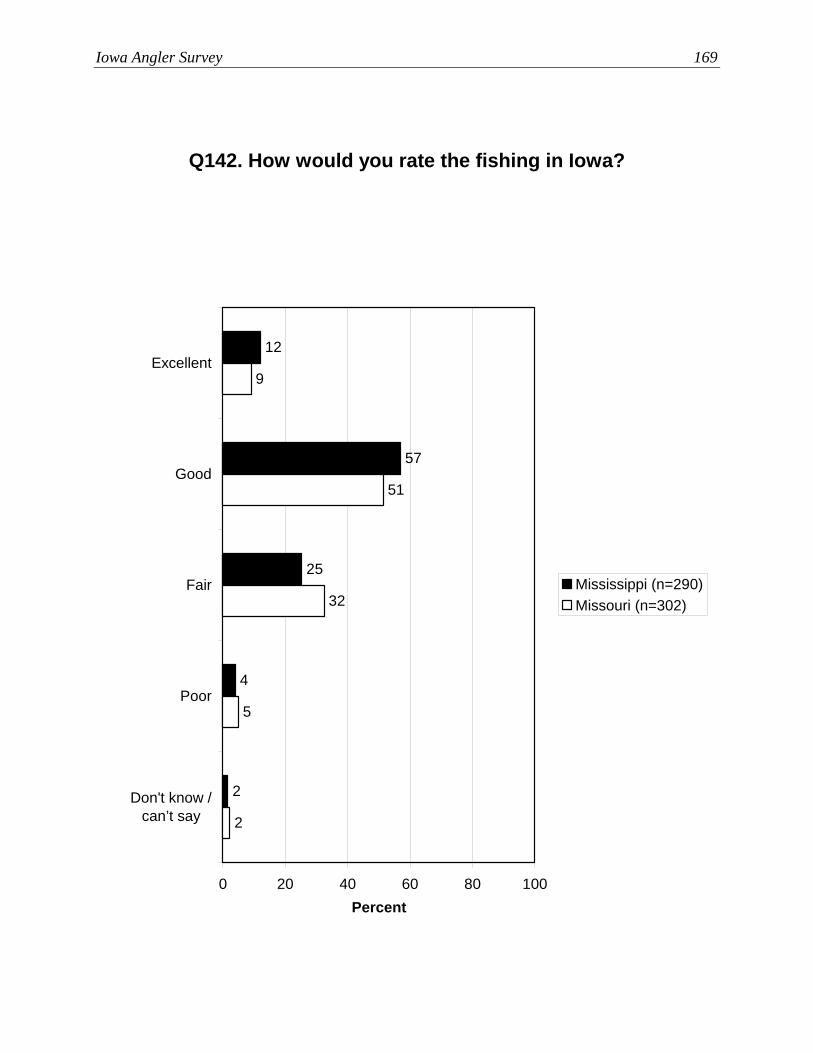
Iowa Angler Survey 169
Q142. How would you rate the fishing in Iowa?
2
4
25
57
12
2
5
32
51
9
0 20 40 60 80 100
Excellent
Good
Fair
Poor
Don't know /can’t say
Percent
Mississippi (n=290)Missouri (n=302)

170 Responsive Management
Q146. How would you rate public access to Iowa’s inland rivers and streams for fishing in general?
11
5
21
54
9
0 20 40 60 80 100
Excellent
Good
Fair
Poor
Don't know / can’tsay
Percent (n=1649)

Iowa Angler Survey 171
Q147. How would you rate public access to Iowa’s lakes for fishing in general?
9
2
13
61
15
0 20 40 60 80 100
Excellent
Good
Fair
Poor
Don't know / can’tsay
Percent (n=1649)
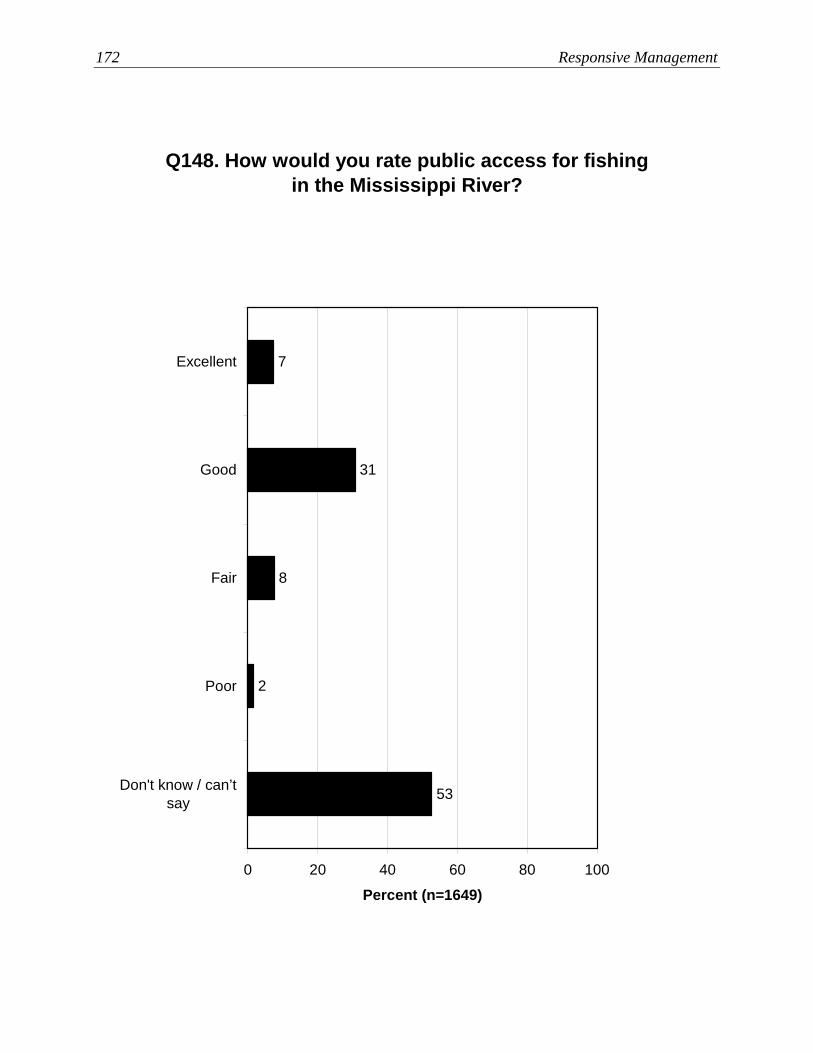
172 Responsive Management
Q148. How would you rate public access for fishing in the Mississippi River?
53
2
8
31
7
0 20 40 60 80 100
Excellent
Good
Fair
Poor
Don't know / can’tsay
Percent (n=1649)
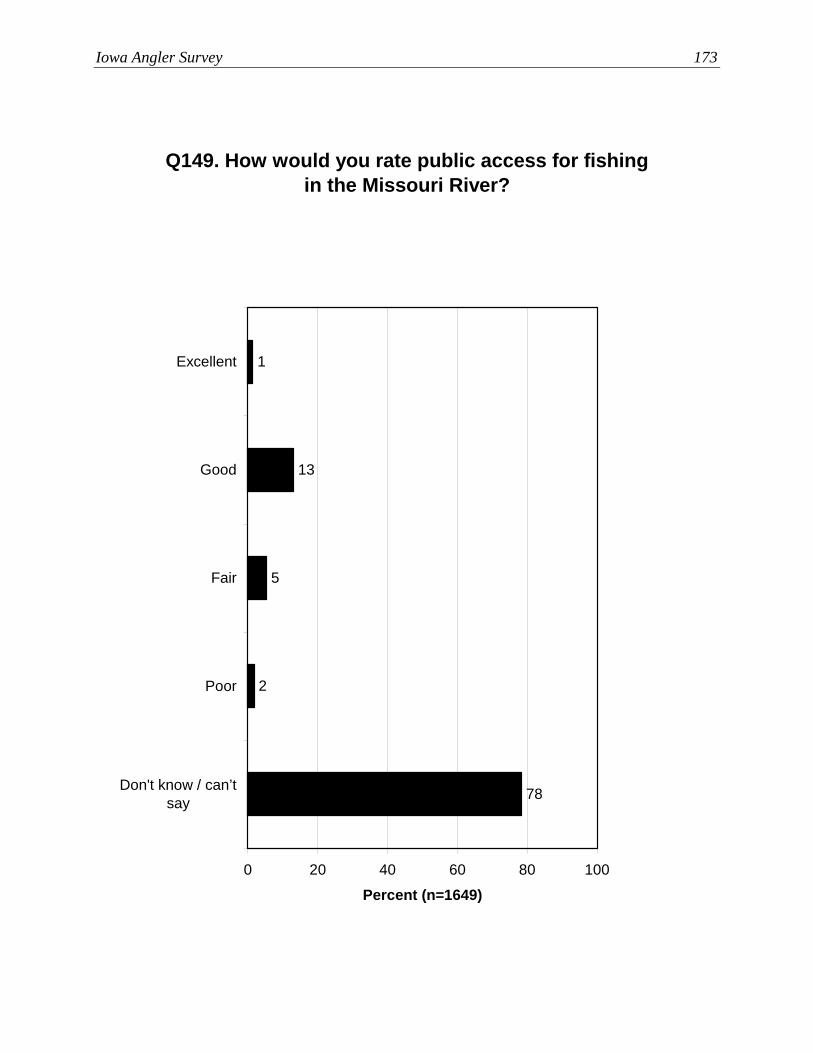
Iowa Angler Survey 173
Q149. How would you rate public access for fishing in the Missouri River?
78
2
5
13
1
0 20 40 60 80 100
Excellent
Good
Fair
Poor
Don't know / can’tsay
Percent (n=1649)

174 Responsive Management
Q146. How would you rate public access to Iowa’s inland rivers and streams for fishing in general?
12
4
21
53
10
8
6
21
55
9
0 20 40 60 80 100
Excellent
Good
Fair
Poor
Don't know /can’t say
Percent
Casual angler (n=807)Avid angler (n=842)

Iowa Angler Survey 175
Q147. How would you rate public access to Iowa’s lakes for fishing in general?
10
2
13
60
15
6
2
13
64
15
0 20 40 60 80 100
Excellent
Good
Fair
Poor
Don't know /can’t say
Percent
Casual angler (n=807)Avid angler (n=842)
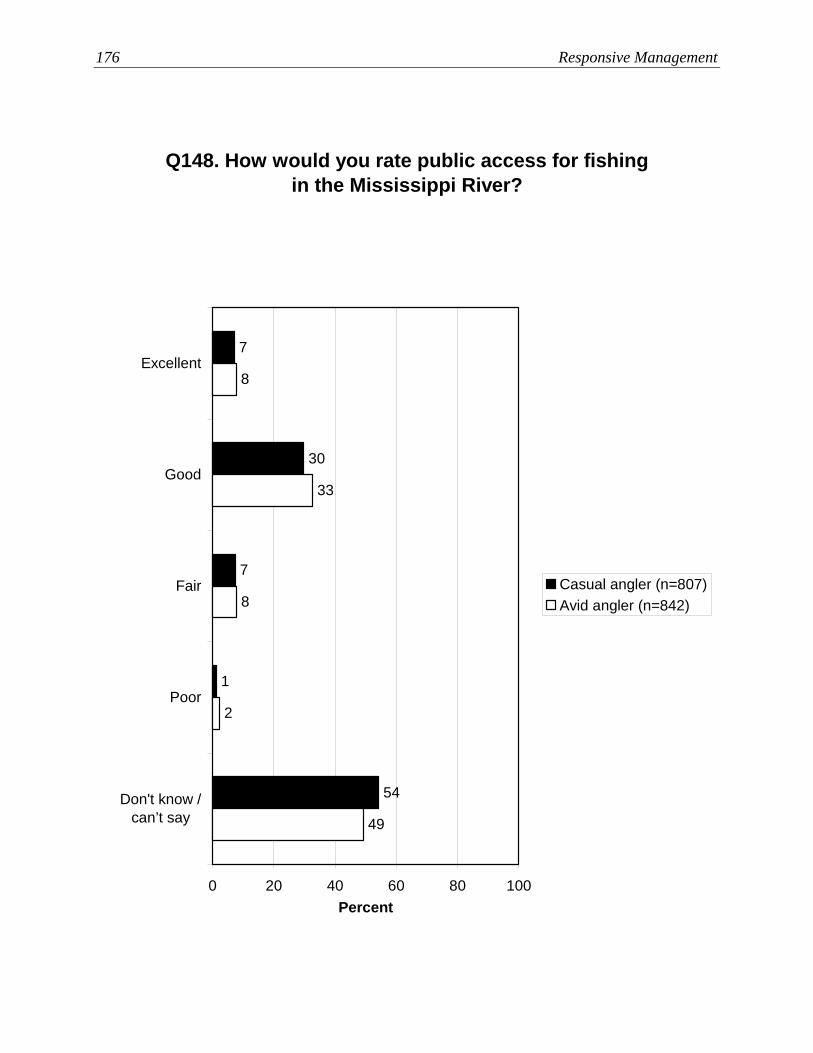
176 Responsive Management
Q148. How would you rate public access for fishing in the Mississippi River?
54
1
7
30
7
49
2
8
33
8
0 20 40 60 80 100
Excellent
Good
Fair
Poor
Don't know /can’t say
Percent
Casual angler (n=807)Avid angler (n=842)
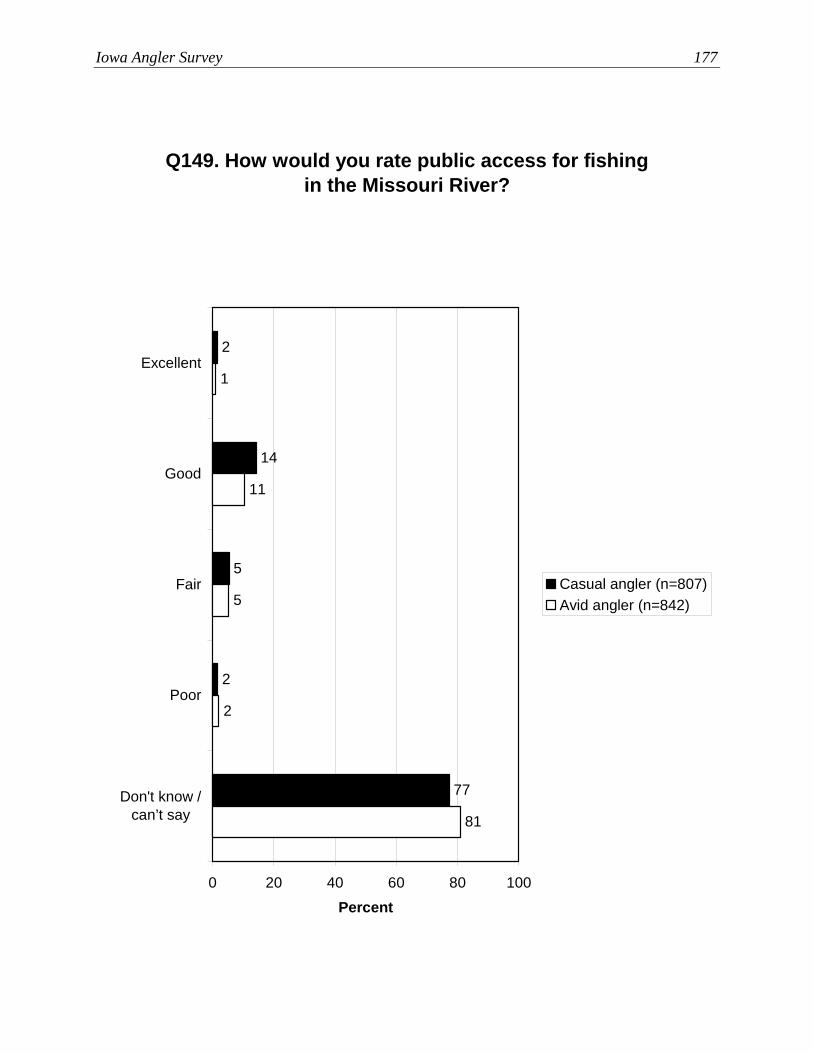
Iowa Angler Survey 177
Q149. How would you rate public access for fishing in the Missouri River?
77
2
5
14
2
81
2
5
11
1
0 20 40 60 80 100
Excellent
Good
Fair
Poor
Don't know /can’t say
Percent
Casual angler (n=807)Avid angler (n=842)
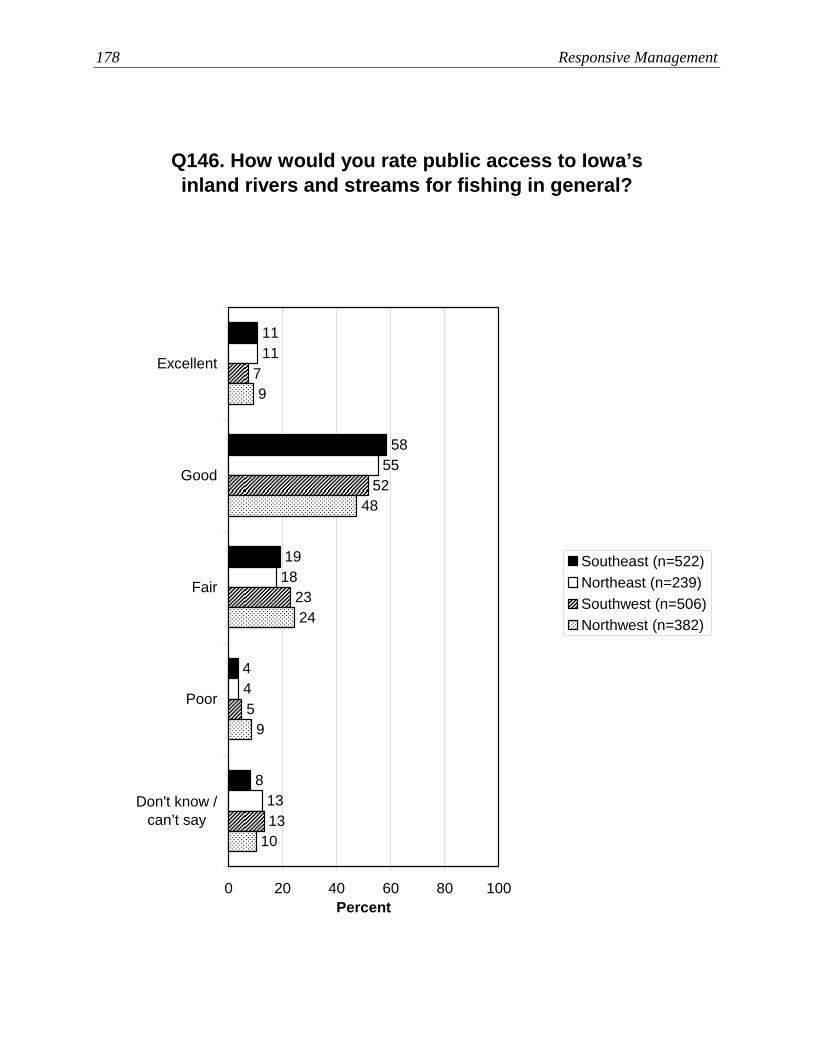
178 Responsive Management
Q146. How would you rate public access to Iowa’s inland rivers and streams for fishing in general?
8
4
19
58
11
13
4
18
55
11
13
5
7
52
23
10
9
9
48
24
0 20 40 60 80 100
Excellent
Good
Fair
Poor
Don't know /can’t say
Percent
Southeast (n=522)Northeast (n=239)Southwest (n=506)Northwest (n=382)

Iowa Angler Survey 179
Q147. How would you rate public access to Iowa’s lakes for fishing in general?
10
1
12
62
15
22
2
13
49
15
4
1
15
67
13
4
5
15
61
15
0 20 40 60 80 100
Excellent
Good
Fair
Poor
Don't know /can’t say
Percent
Southeast (n=522)Northeast (n=239)Southwest (n=506)Northwest (n=382)
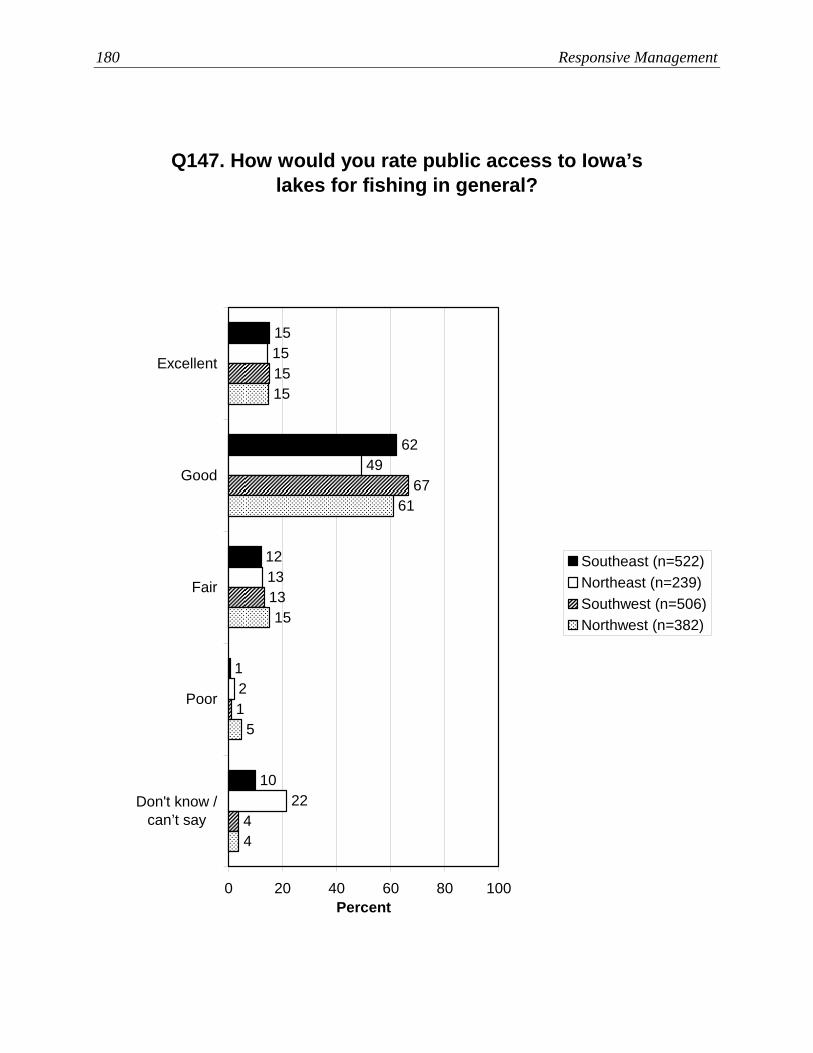
180 Responsive Management
Q147. How would you rate public access to Iowa’s lakes for fishing in general?
10
1
12
62
15
22
2
13
49
15
4
1
15
67
13
4
5
15
61
15
0 20 40 60 80 100
Excellent
Good
Fair
Poor
Don't know /can’t say
Percent
Southeast (n=522)Northeast (n=239)Southwest (n=506)Northwest (n=382)

Iowa Angler Survey 181
Q148. How would you rate public access for fishing in the Mississippi River?
34
2
9
45
10
21
1
13
51
15
77
1
3
14
5
75
2
3
15
5
0 20 40 60 80 100
Excellent
Good
Fair
Poor
Don't know /can’t say
Percent
Southeast (n=522)Northeast (n=239)Southwest (n=506)Northwest (n=382)

182 Responsive Management
Q149. How would you rate public access for fishing in the Missouri River?
84
1
4
10
1
89
1
4
5
1
76
2
1
15
6
63
3
3
23
7
0 20 40 60 80 100
Excellent
Good
Fair
Poor
Don't know /can’t say
Percent
Southeast (n=522)Northeast (n=239)Southwest (n=506)Northwest (n=382)
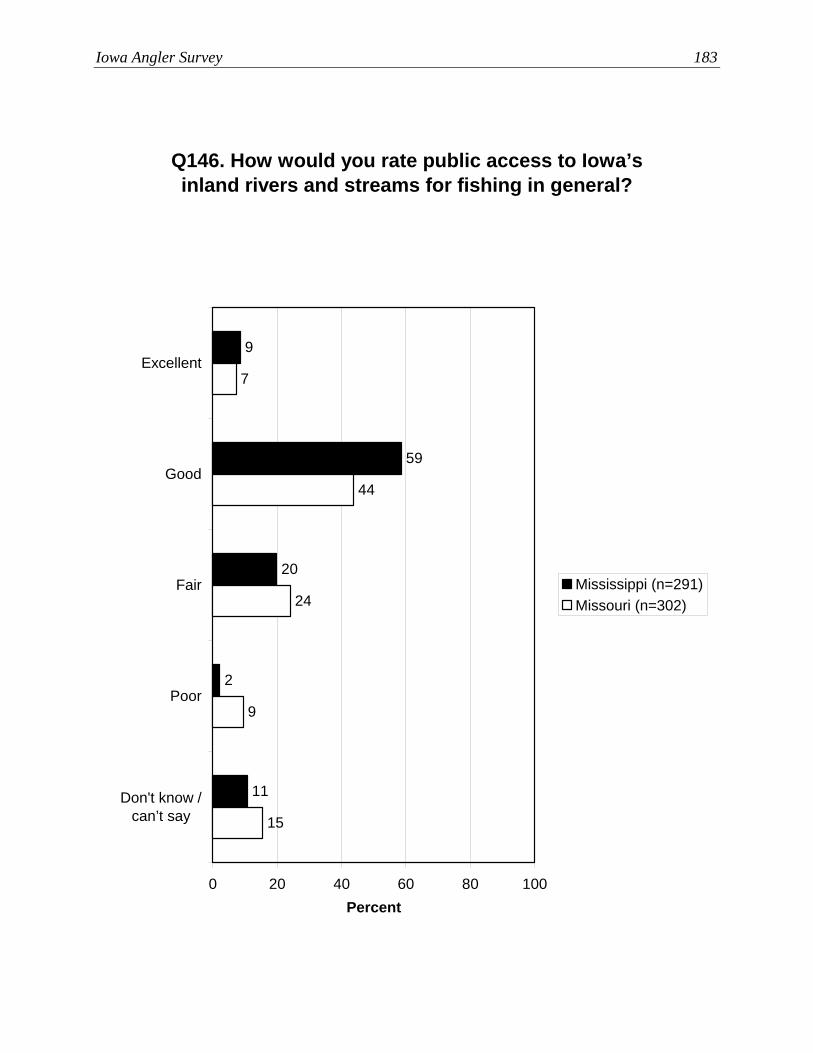
Iowa Angler Survey 183
Q146. How would you rate public access to Iowa’s inland rivers and streams for fishing in general?
11
2
20
59
9
15
9
24
44
7
0 20 40 60 80 100
Excellent
Good
Fair
Poor
Don't know /can’t say
Percent
Mississippi (n=291)Missouri (n=302)
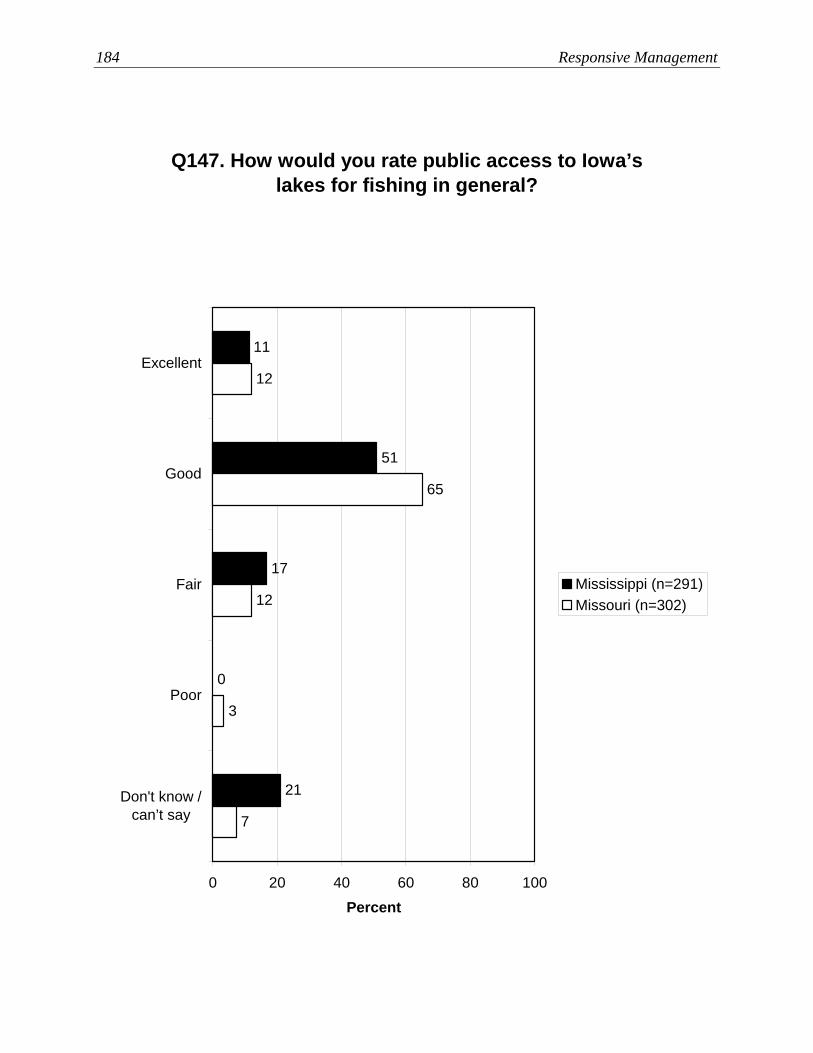
184 Responsive Management
Q147. How would you rate public access to Iowa’s lakes for fishing in general?
21
0
17
51
11
7
3
12
65
12
0 20 40 60 80 100
Excellent
Good
Fair
Poor
Don't know /can’t say
Percent
Mississippi (n=291)Missouri (n=302)

Iowa Angler Survey 185
Q148. How would you rate public access for fishing in the Mississippi River?
10
4
12
61
14
74
1
7
15
3
0 20 40 60 80 100
Excellent
Good
Fair
Poor
Don't know /can’t say
Percent
Mississippi (n=291)Missouri (n=302)
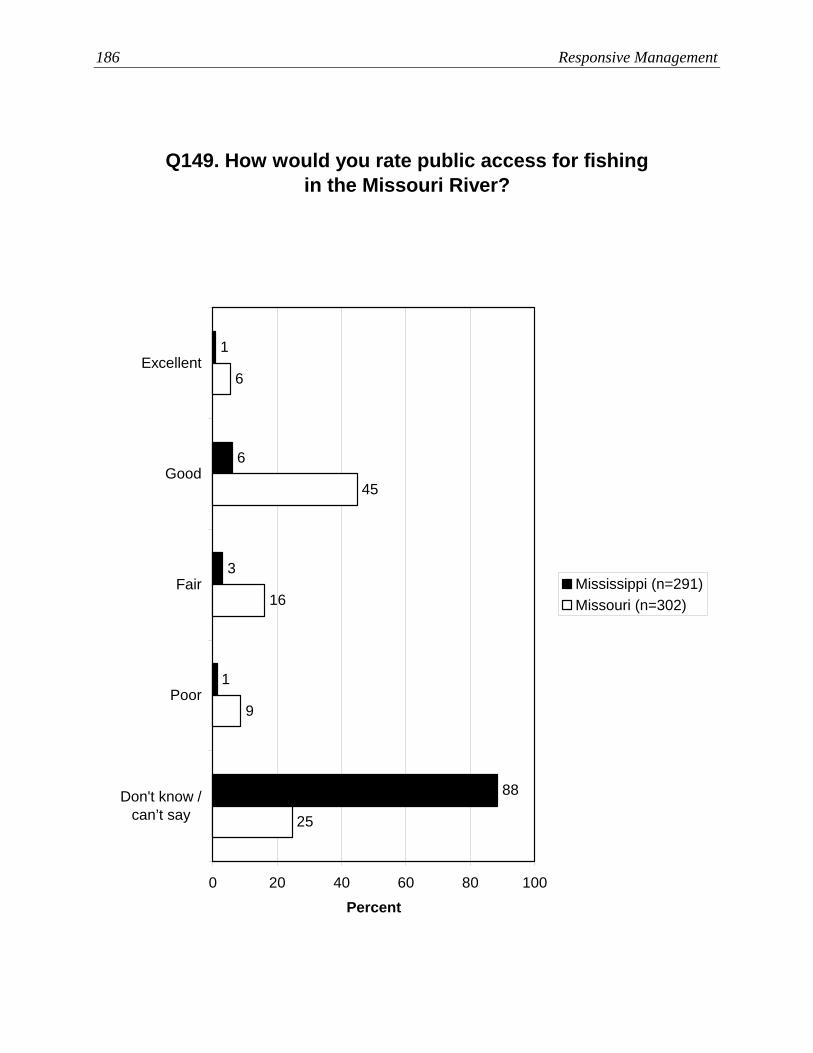
186 Responsive Management
Q149. How would you rate public access for fishing in the Missouri River?
88
1
3
6
1
25
9
16
45
6
0 20 40 60 80 100
Excellent
Good
Fair
Poor
Don't know /can’t say
Percent
Mississippi (n=291)Missouri (n=302)

Iowa Angler Survey 187
Q143. How would you rate the Iowa Department of Natural Resources in managing fisheries and
fishing?
13
3
13
57
15
0 20 40 60 80 100
Excellent
Good
Fair
Poor
Don't know / can’tsay
Percent (n=1649)
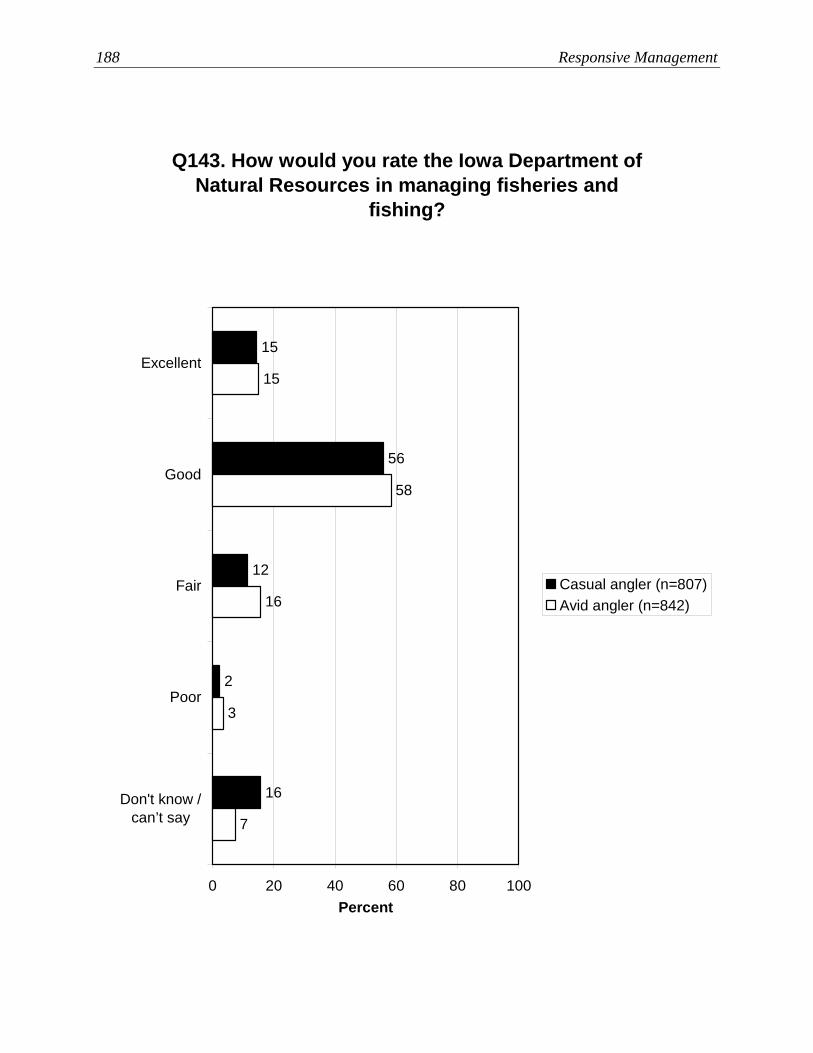
188 Responsive Management
Q143. How would you rate the Iowa Department of Natural Resources in managing fisheries and
fishing?
16
2
12
56
15
7
3
16
58
15
0 20 40 60 80 100
Excellent
Good
Fair
Poor
Don't know /can’t say
Percent
Casual angler (n=807)Avid angler (n=842)
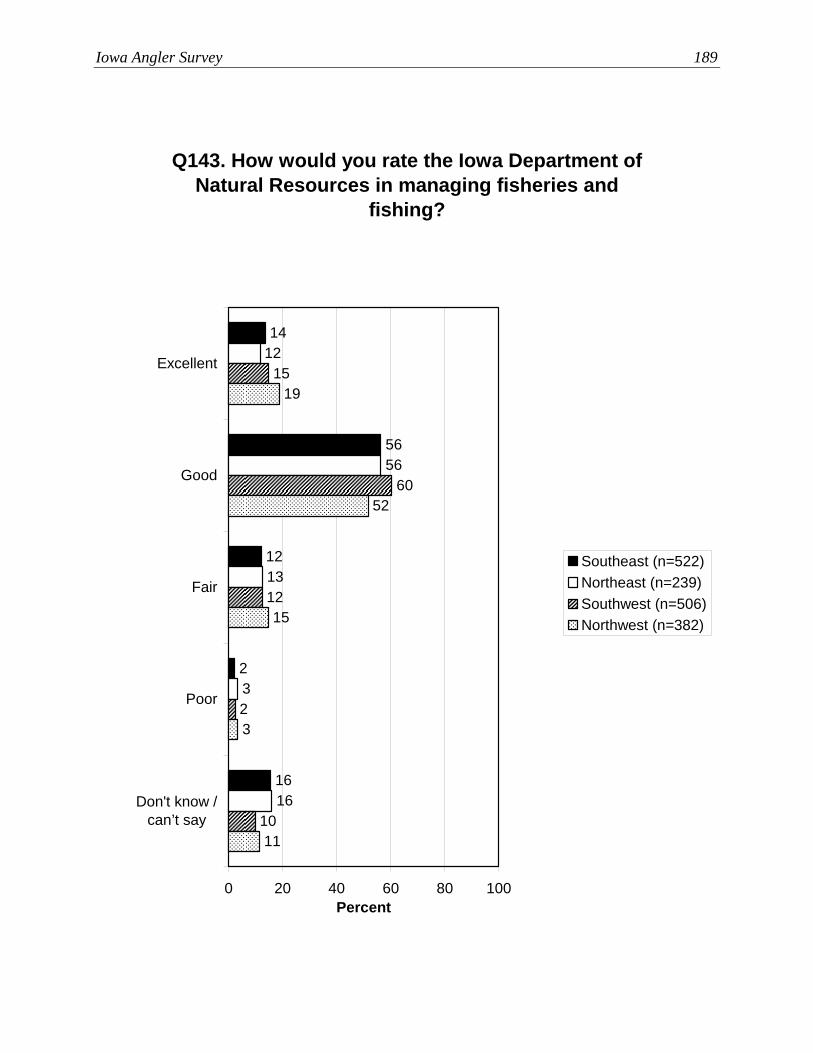
Iowa Angler Survey 189
Q143. How would you rate the Iowa Department of Natural Resources in managing fisheries and
fishing?
16
2
12
56
14
16
3
13
56
12
10
2
15
60
12
11
3
19
52
15
0 20 40 60 80 100
Excellent
Good
Fair
Poor
Don't know /can’t say
Percent
Southeast (n=522)Northeast (n=239)Southwest (n=506)Northwest (n=382)

190 Responsive Management
Q143. How would you rate the Iowa Department of Natural Resources in managing fisheries and
fishing?
22
4
10
48
16
14
3
11
59
13
0 20 40 60 80 100
Excellent
Good
Fair
Poor
Don't know /can’t say
Percent
Mississippi (n=291)Missouri (n=302)

Iowa Angler Survey 191
Q144. Why did you rate the management so high? (Asked of those who rated the Iowa Department of Natural Resources' management of fisheries and
fishing as excellent or good.)
4
5
10
10
11
13
74
2
4
6
0 20 40 60 80 100
They do a good job / wildlife, fish,habitat, and waters are managed well
Good people work in wildlifemanagement / they are helpful / I have
had good interactions
Mentioned stocking or hatcheries inpositive way
Mentioned plenty of fish / good qualityfish / no problems catching fish
Haven't heard or seen bad things /have no reason to rate negatively
Mentioned clean water / good waterquality
Mentioned or alluded to a lack ofresources / they need more resources
Heard or read good things second-hand
Other
Don't know
Mul
tiple
Res
pons
es A
llow
ed
Percent (n=1146)
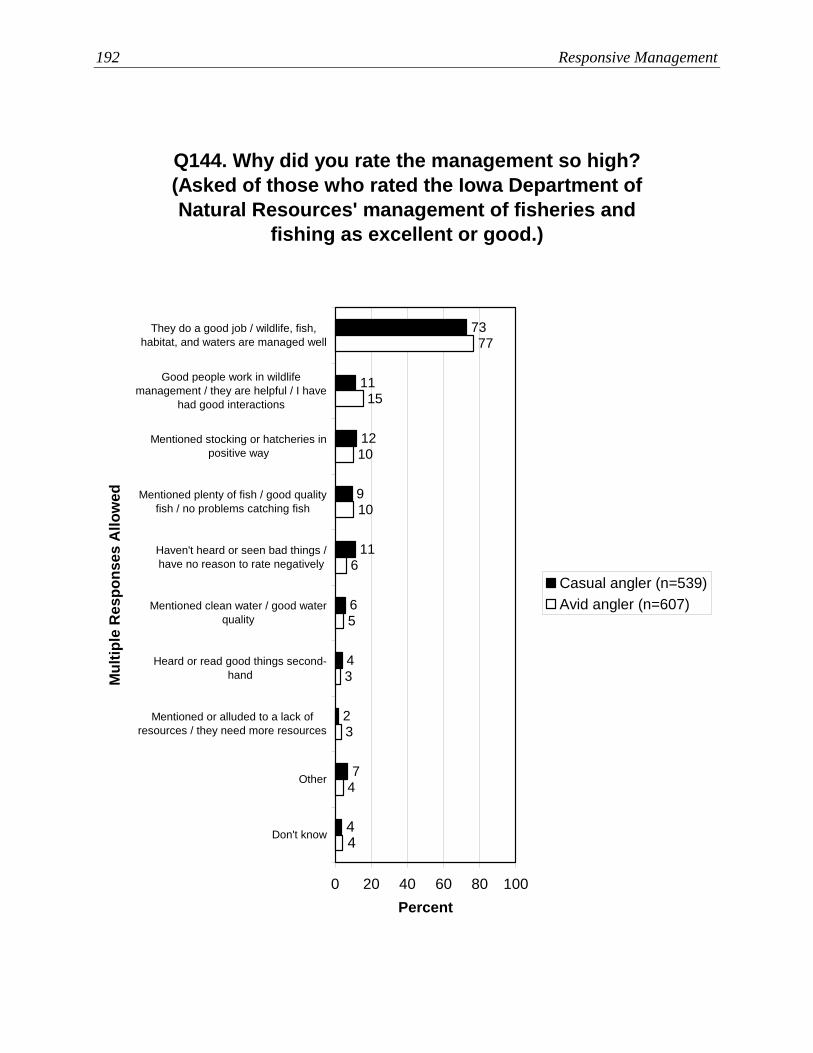
192 Responsive Management
Q144. Why did you rate the management so high? (Asked of those who rated the Iowa Department of Natural Resources' management of fisheries and
fishing as excellent or good.)
44
6
11
9
12
11
73
4
2
74
3
3
5
6
10
10
15
77
0 20 40 60 80 100
They do a good job / wildlife, fish,habitat, and waters are managed well
Good people work in wildlifemanagement / they are helpful / I have
had good interactions
Mentioned stocking or hatcheries inpositive way
Mentioned plenty of fish / good qualityfish / no problems catching fish
Haven't heard or seen bad things /have no reason to rate negatively
Mentioned clean water / good waterquality
Heard or read good things second-hand
Mentioned or alluded to a lack ofresources / they need more resources
Other
Don't know
Mul
tiple
Res
pons
es A
llow
ed
Percent
Casual angler (n=539)Avid angler (n=607)

Iowa Angler Survey 193
Q144. Why did you rate the management so high? (Asked of those who rated the Iowa Department of Natural Resources' management of fisheries and
fishing as excellent or good.)
3
6
13
9
13
12
73
5
1
5
4
9
6
2
4
8
9
15
11
74
4
6
2
3
6
9
13
75
16
9
5
7
2
4
4
7
6
74
10
9
0 20 40 60 80 100
They do a good job / wildlife, fish, habitat,and waters are managed well
Good people work in wildlifemanagement / they are helpful / I have
had good interactions
Mentioned stocking or hatcheries inpositive way
Mentioned plenty of fish / good qualityfish / no problems catching fish
Haven't heard or seen bad things / haveno reason to rate negatively
Mentioned clean water / good waterquality
Heard or read good things second-hand
Mentioned or alluded to a lack ofresources / they need more resources
Other
Don't know
Mul
tiple
Res
pons
es A
llow
ed
Percent
Southeast (n=358)Northeast (n=160)Southwest (n=365)Northwest (n=263)
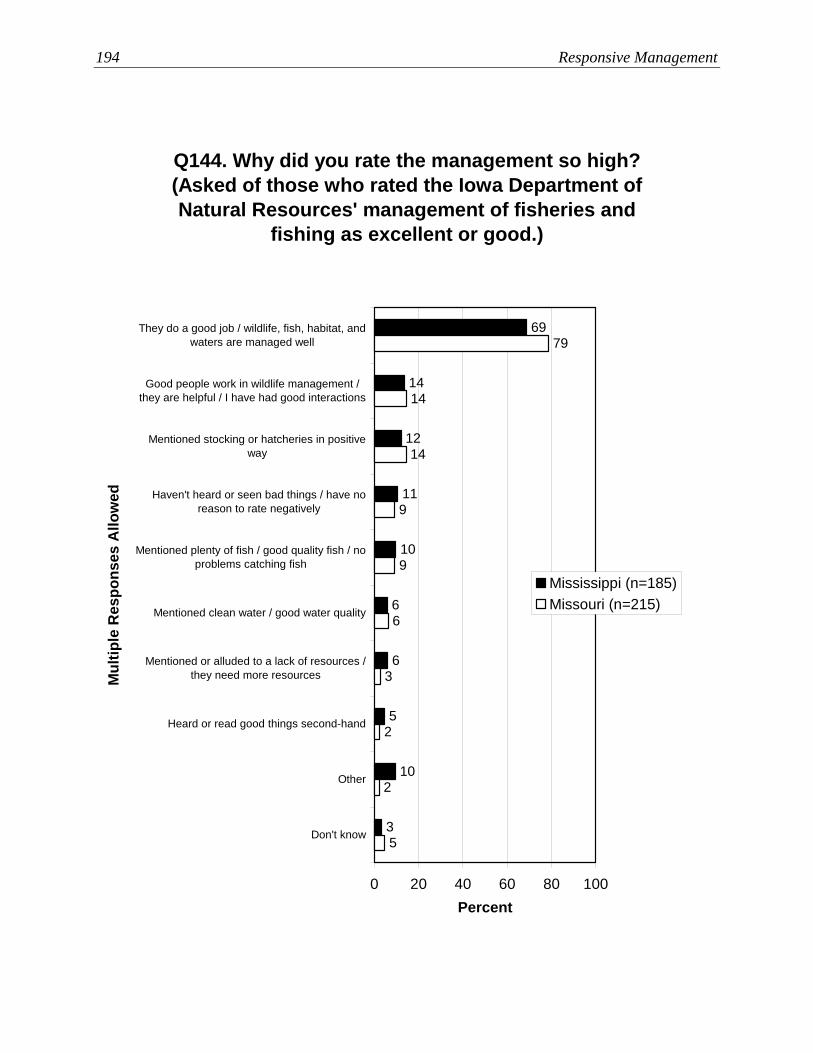
194 Responsive Management
Q144. Why did you rate the management so high? (Asked of those who rated the Iowa Department of Natural Resources' management of fisheries and
fishing as excellent or good.)
3
6
10
11
12
14
69
6
5
10
5
2
2
3
6
9
9
14
14
79
0 20 40 60 80 100
They do a good job / wildlife, fish, habitat, andwaters are managed well
Good people work in wildlife management /they are helpful / I have had good interactions
Mentioned stocking or hatcheries in positiveway
Haven't heard or seen bad things / have noreason to rate negatively
Mentioned plenty of fish / good quality fish / noproblems catching fish
Mentioned clean water / good water quality
Mentioned or alluded to a lack of resources /they need more resources
Heard or read good things second-hand
Other
Don't know
Mul
tiple
Res
pons
es A
llow
ed
Percent
Mississippi (n=185)Missouri (n=215)
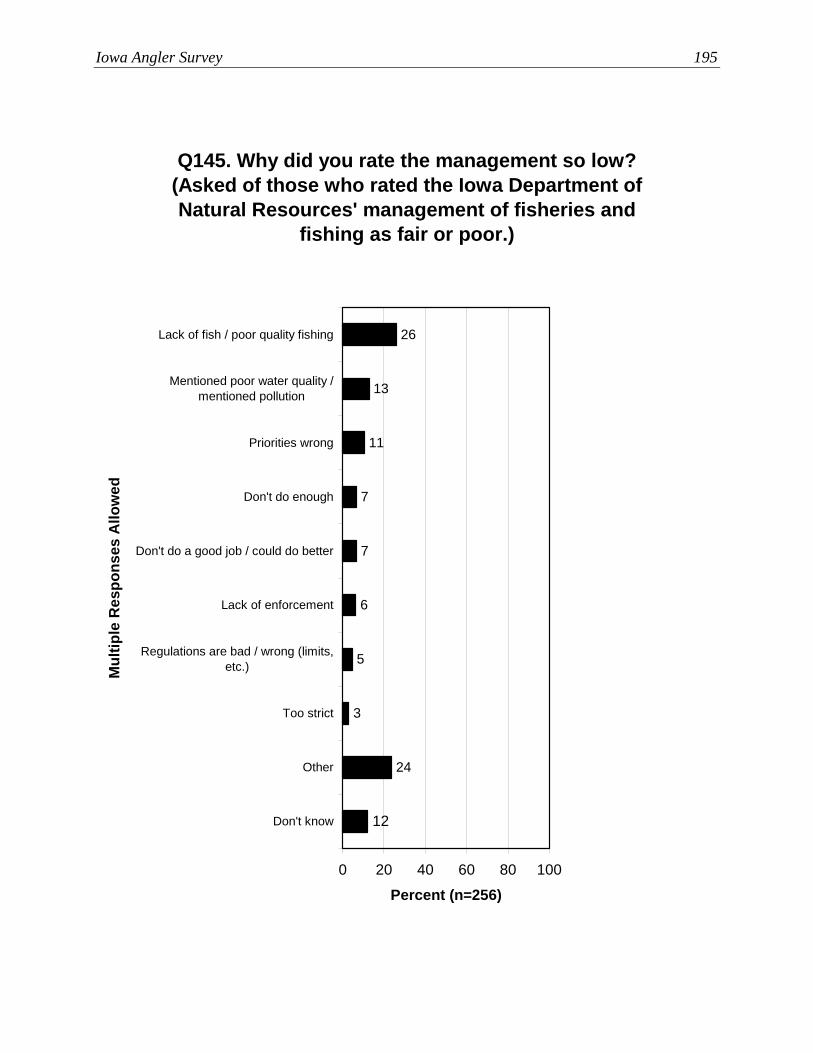
Iowa Angler Survey 195
Q145. Why did you rate the management so low? (Asked of those who rated the Iowa Department of Natural Resources' management of fisheries and
fishing as fair or poor.)
12
6
7
7
11
13
26
5
3
24
0 20 40 60 80 100
Lack of fish / poor quality fishing
Mentioned poor water quality /mentioned pollution
Priorities wrong
Don't do enough
Don't do a good job / could do better
Lack of enforcement
Regulations are bad / wrong (limits,etc.)
Too strict
Other
Don't know
Mul
tiple
Res
pons
es A
llow
ed
Percent (n=256)
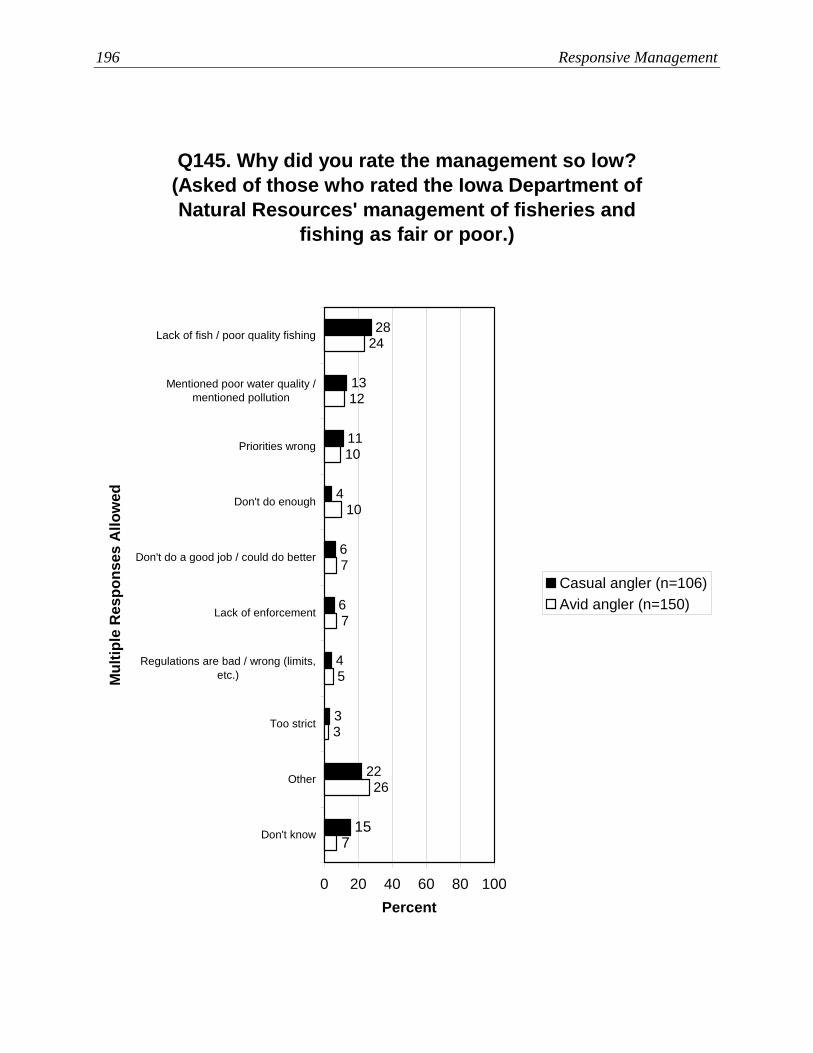
196 Responsive Management
Q145. Why did you rate the management so low? (Asked of those who rated the Iowa Department of Natural Resources' management of fisheries and
fishing as fair or poor.)
715
6
6
4
11
13
28
4
3
2226
3
5
7
7
10
10
12
24
0 20 40 60 80 100
Lack of fish / poor quality fishing
Mentioned poor water quality /mentioned pollution
Priorities wrong
Don't do enough
Don't do a good job / could do better
Lack of enforcement
Regulations are bad / wrong (limits,etc.)
Too strict
Other
Don't know
Mul
tiple
Res
pons
es A
llow
ed
Percent
Casual angler (n=106)Avid angler (n=150)
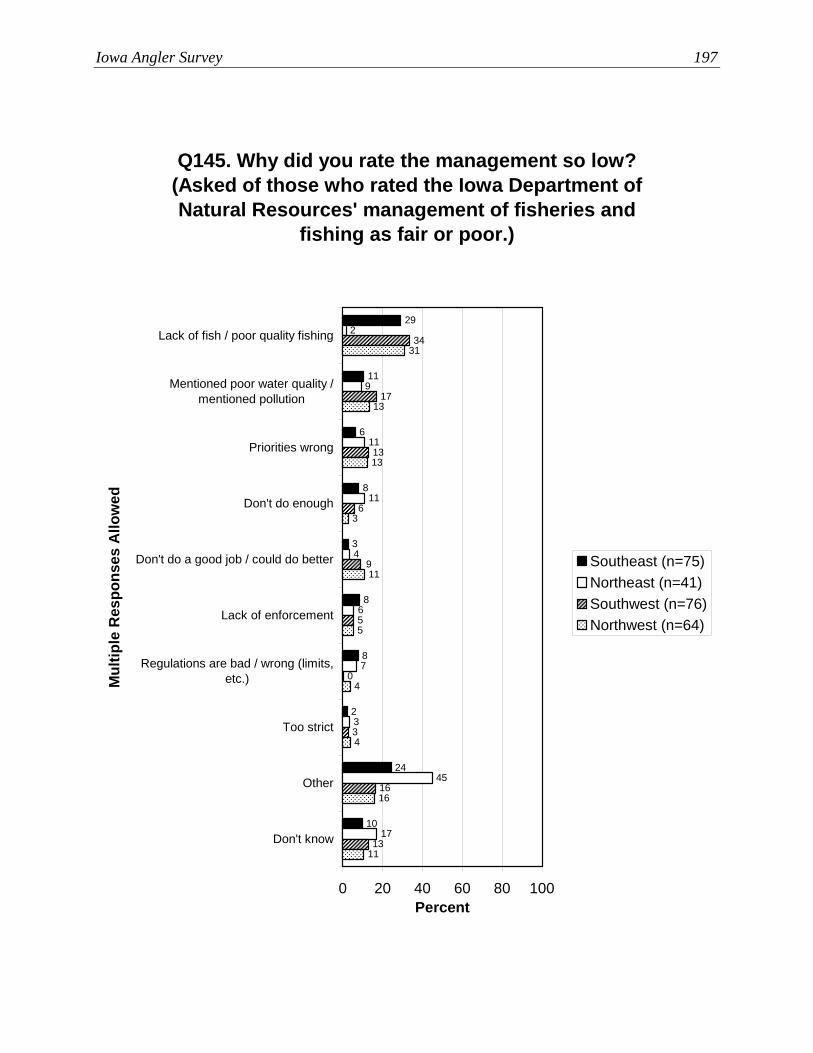
Iowa Angler Survey 197
Q145. Why did you rate the management so low? (Asked of those who rated the Iowa Department of Natural Resources' management of fisheries and
fishing as fair or poor.)
10
8
3
8
6
11
29
8
2
24
17
45
3
7
6
4
11
11
9
2
13
16
3
0
5
9
6
34
17
13
11
16
4
4
5
11
3
31
13
13
0 20 40 60 80 100
Lack of fish / poor quality fishing
Mentioned poor water quality /mentioned pollution
Priorities wrong
Don't do enough
Don't do a good job / could do better
Lack of enforcement
Regulations are bad / wrong (limits,etc.)
Too strict
Other
Don't know
Mul
tiple
Res
pons
es A
llow
ed
Percent
Southeast (n=75)Northeast (n=41)Southwest (n=76)Northwest (n=64)

198 Responsive Management
Q145. Why did you rate the management so low? (Asked of those who rated the Iowa Department of Natural Resources' management of fisheries and
fishing as fair or poor.)
20
2
2
3
6
18
23
4
2
31
11
22
5
2
8
8
11
11
2
27
0 20 40 60 80 100
Lack of fish / poor quality fishing
Regulations are bad / wrong (limits,etc.)
Don't do enough
Don't do a good job / could do better
Mentioned poor water quality /mentioned pollution
Priorities wrong
Too strict
Lack of enforcement
Other
Don't know
Mul
tiple
Res
pons
es A
llow
ed
Percent
Mississippi (n=43)Missouri (n=43)
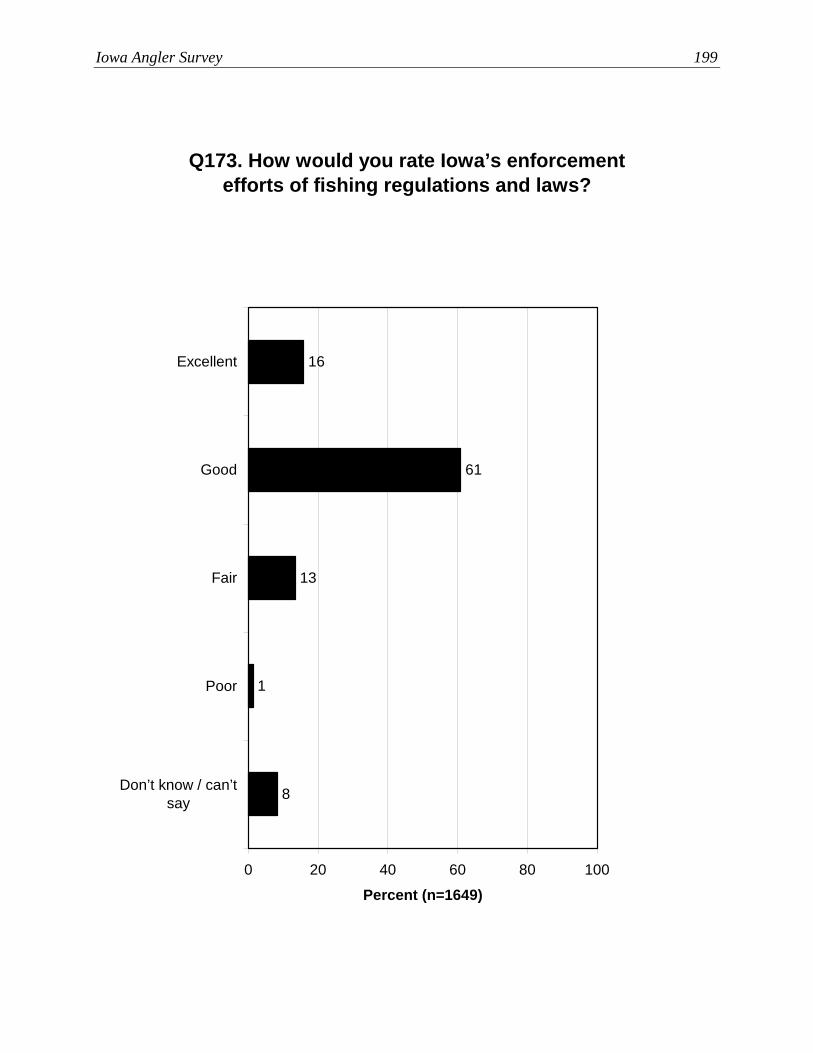
Iowa Angler Survey 199
Q173. How would you rate Iowa’s enforcement efforts of fishing regulations and laws?
8
1
13
61
16
0 20 40 60 80 100
Excellent
Good
Fair
Poor
Don’t know / can’tsay
Percent (n=1649)
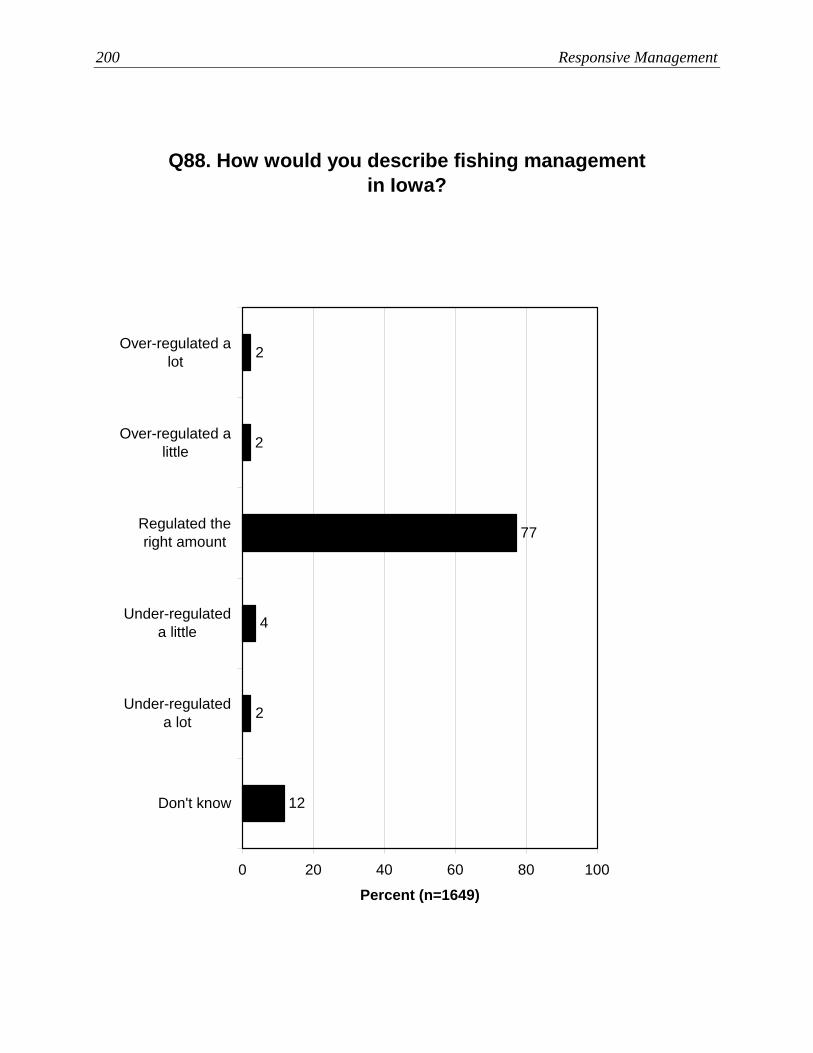
200 Responsive Management
Q88. How would you describe fishing management in Iowa?
12
2
4
77
2
2
0 20 40 60 80 100
Over-regulated alot
Over-regulated alittle
Regulated theright amount
Under-regulateda little
Under-regulateda lot
Don't know
Percent (n=1649)
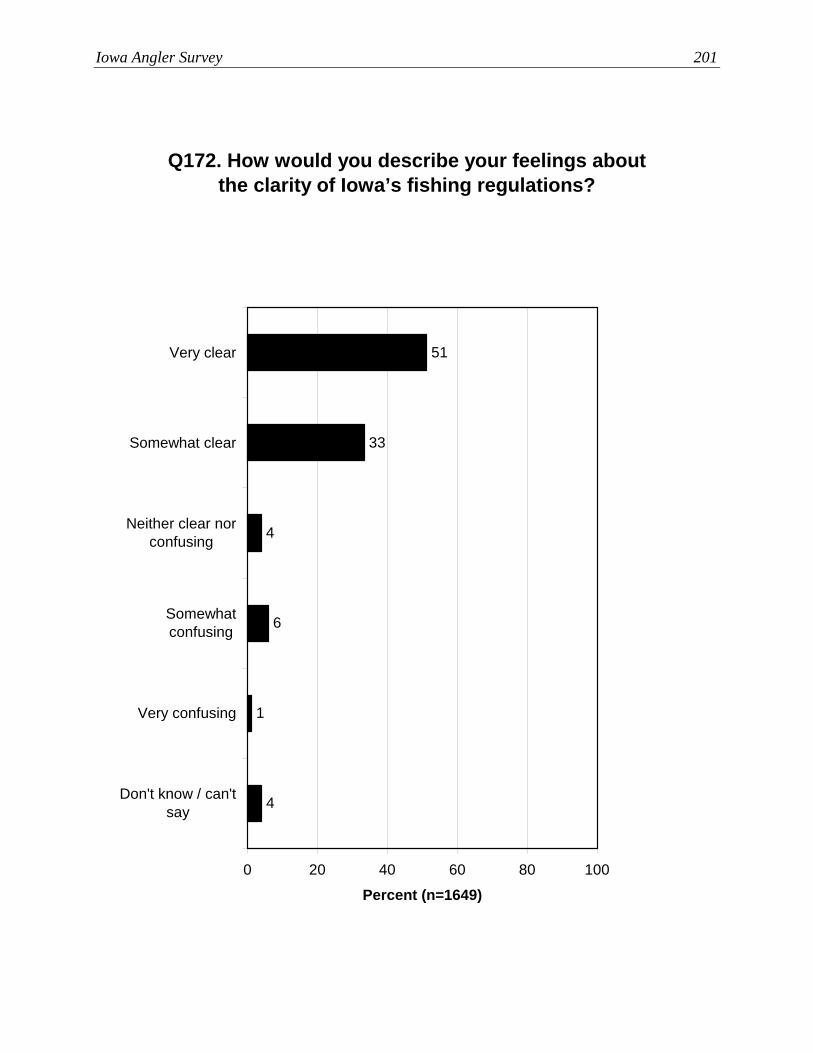
Iowa Angler Survey 201
Q172. How would you describe your feelings about the clarity of Iowa’s fishing regulations?
4
1
6
4
33
51
0 20 40 60 80 100
Very clear
Somewhat clear
Neither clear norconfusing
Somewhatconfusing
Very confusing
Don't know / can'tsay
Percent (n=1649)
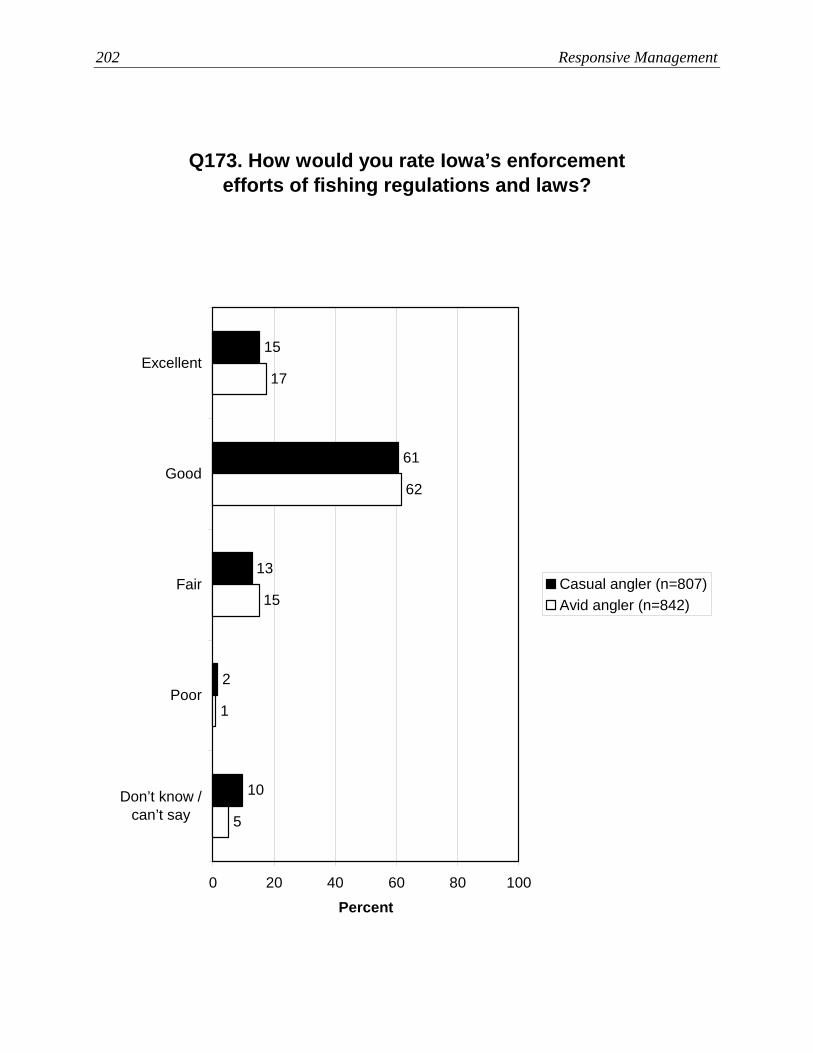
202 Responsive Management
Q173. How would you rate Iowa’s enforcement efforts of fishing regulations and laws?
10
2
13
61
15
5
1
15
62
17
0 20 40 60 80 100
Excellent
Good
Fair
Poor
Don’t know /can’t say
Percent
Casual angler (n=807)Avid angler (n=842)
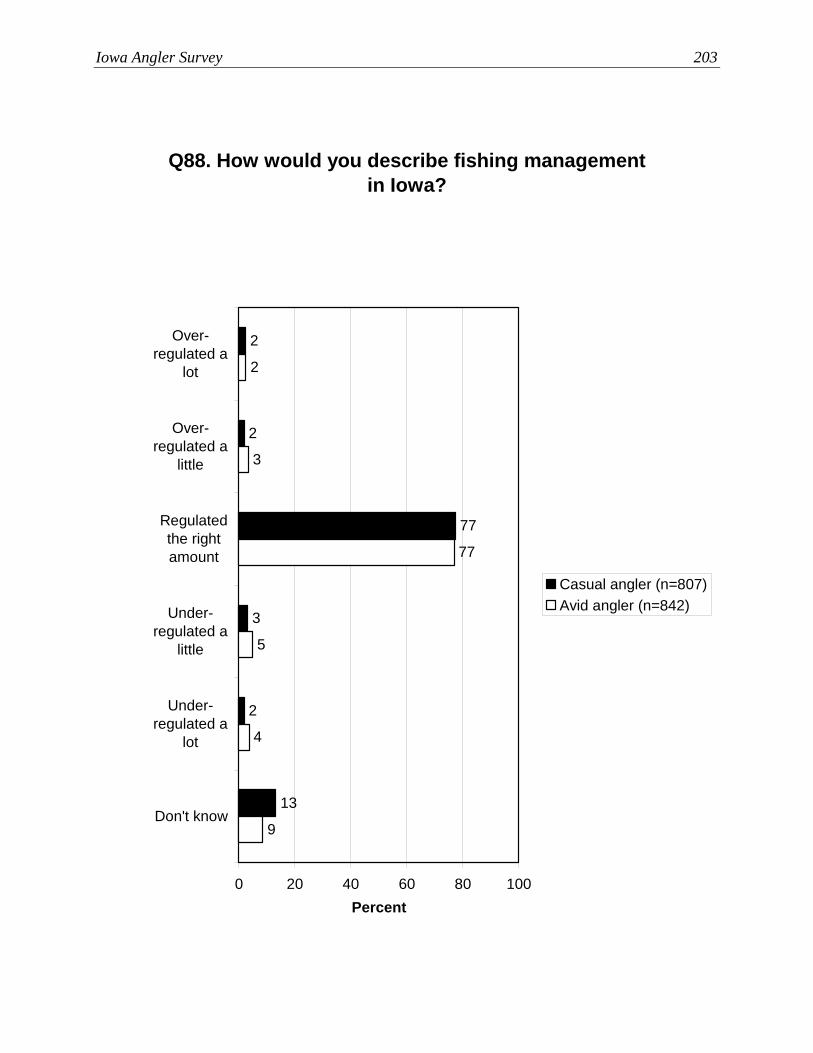
Iowa Angler Survey 203
Q88. How would you describe fishing management in Iowa?
13
2
3
77
2
2
9
4
5
77
3
2
0 20 40 60 80 100
Over-regulated a
lot
Over-regulated a
little
Regulatedthe rightamount
Under-regulated a
little
Under-regulated a
lot
Don't know
Percent
Casual angler (n=807)Avid angler (n=842)
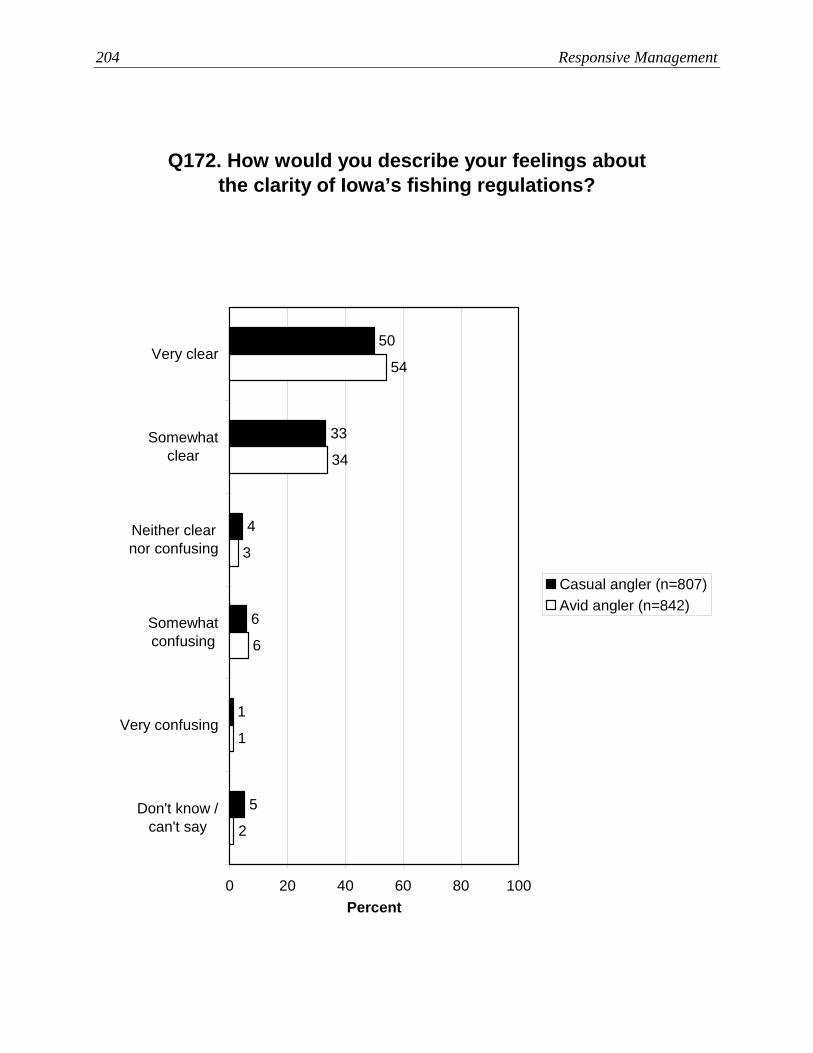
204 Responsive Management
Q172. How would you describe your feelings about the clarity of Iowa’s fishing regulations?
5
1
6
4
33
50
2
1
6
3
34
54
0 20 40 60 80 100
Very clear
Somewhatclear
Neither clearnor confusing
Somewhatconfusing
Very confusing
Don't know /can't say
Percent
Casual angler (n=807)Avid angler (n=842)
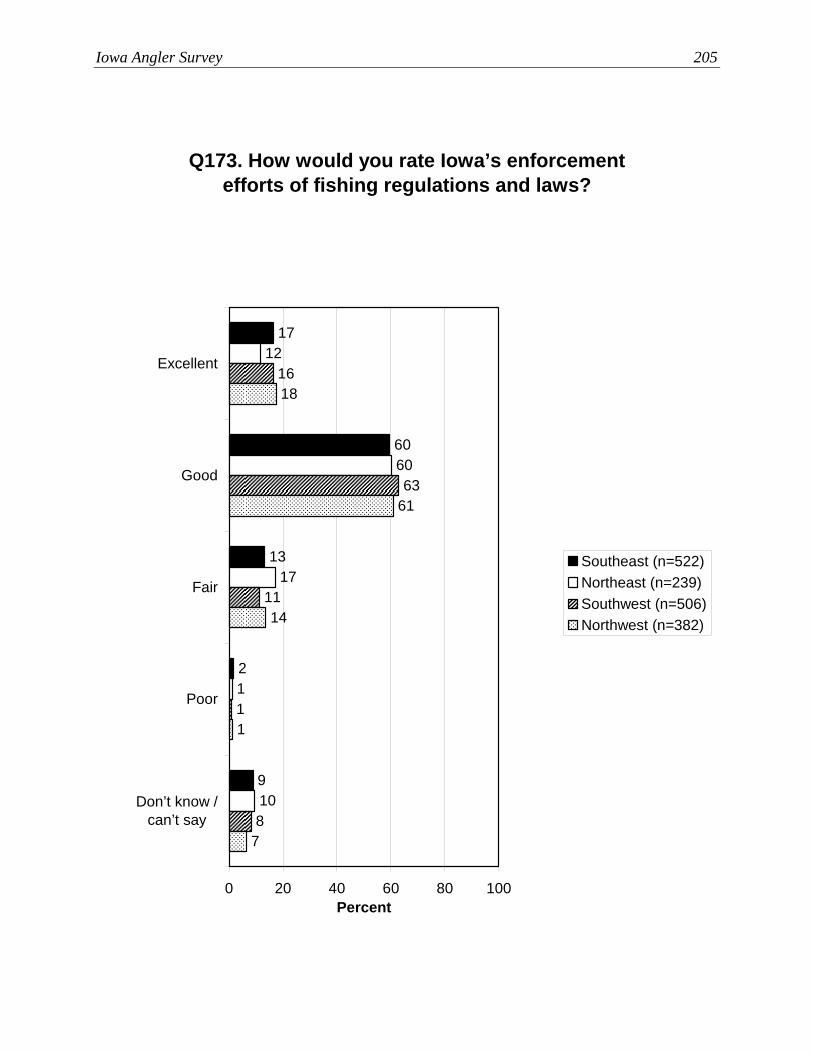
Iowa Angler Survey 205
Q173. How would you rate Iowa’s enforcement efforts of fishing regulations and laws?
9
2
13
60
17
10
1
17
60
12
8
1
16
63
11
7
1
18
61
14
0 20 40 60 80 100
Excellent
Good
Fair
Poor
Don’t know /can’t say
Percent
Southeast (n=522)Northeast (n=239)Southwest (n=506)Northwest (n=382)
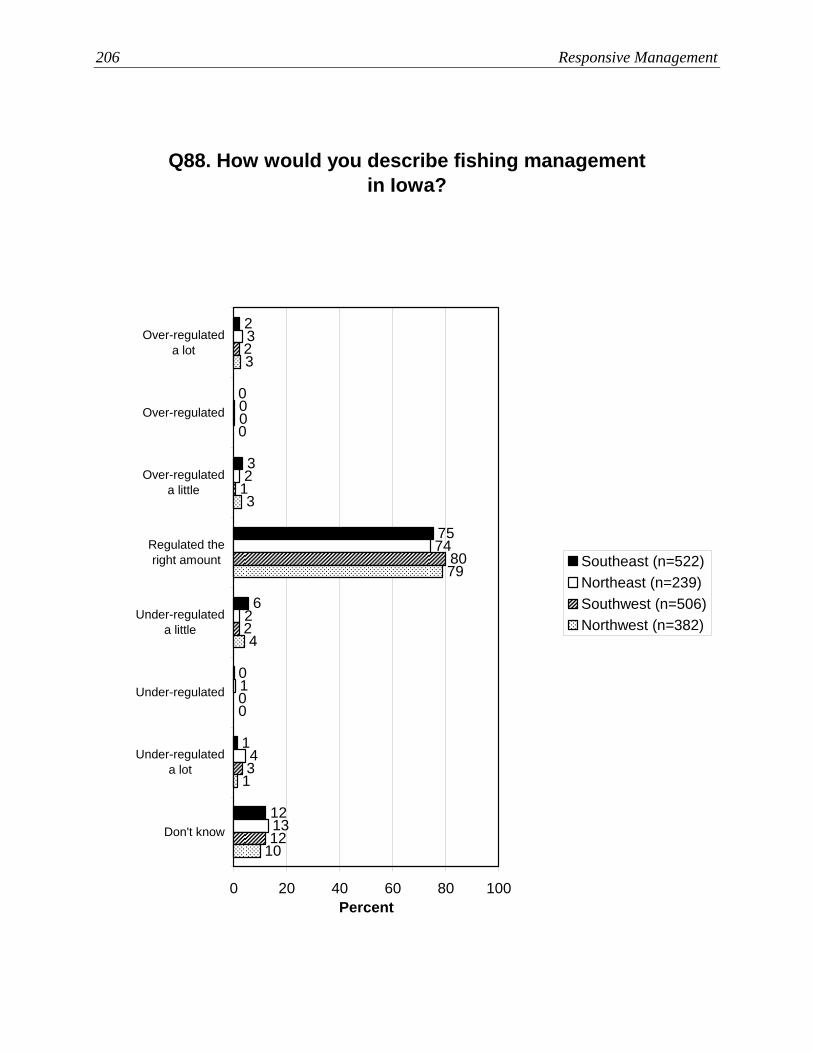
206 Responsive Management
Q88. How would you describe fishing management in Iowa?
0
6
75
3
0
2
1
1213
4
1
2
74
2
0
3
12
3
0
2
80
2
0
1
10
1
0
4
79
3
0
3
0 20 40 60 80 100
Over-regulateda lot
Over-regulated
Over-regulateda little
Regulated theright amount
Under-regulateda little
Under-regulated
Under-regulateda lot
Don't know
Percent
Southeast (n=522)Northeast (n=239)Southwest (n=506)Northwest (n=382)
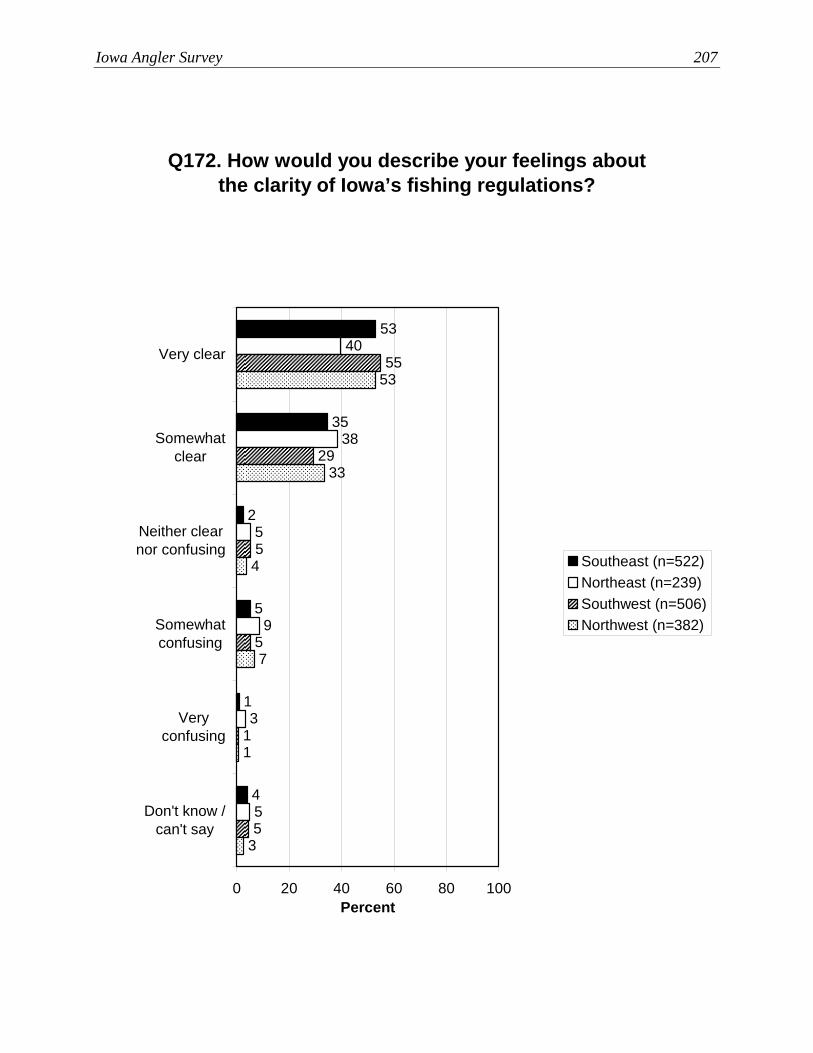
Iowa Angler Survey 207
Q172. How would you describe your feelings about the clarity of Iowa’s fishing regulations?
4
1
5
2
35
53
5
3
9
5
38
40
5
1
5
55
29
5
3
1
7
53
33
4
0 20 40 60 80 100
Very clear
Somewhatclear
Neither clearnor confusing
Somewhatconfusing
Veryconfusing
Don't know /can't say
Percent
Southeast (n=522)Northeast (n=239)Southwest (n=506)Northwest (n=382)

208 Responsive Management
Q173. How would you rate Iowa’s enforcement efforts of fishing regulations and laws?
11
2
19
52
17
6
1
11
64
18
0 20 40 60 80 100
Excellent
Good
Fair
Poor
Don’t know /can’t say
Percent
Mississippi (n=291)Missouri (n=302)

Iowa Angler Survey 209
Q88. How would you describe fishing management in Iowa?
1
1
4
75
4
3
1211
3
0
5
77
2
3
0 20 40 60 80 100
Over-regulateda lot
Over-regulateda little
Regulated theright amount
Under-regulated a
little
Under-regulated
Under-regulated a lot
Don't know
Percent
Mississippi (n=291)Missouri (n=302)

210 Responsive Management
Q172. How would you describe your feelings about the clarity of Iowa’s fishing regulations?
7
1
6
4
40
43
3
0
4
2
31
59
0 20 40 60 80 100
Very clear
Somewhatclear
Neither clearnor confusing
Somewhatconfusing
Very confusing
Don't know /can't say
Percent
Mississippi (n=291)Missouri (n=302)

Iowa Angler Survey 211
Q141. Do you think the fishing in Iowa is better or worse now compared to 10 years ago? (Asked of
those who have been fishing in Iowa for 10 or more years.)
11
23
36
30
0 20 40 60 80 100
Better
The same
Worse
Don't know / can'tsay
Percent (n=1432)
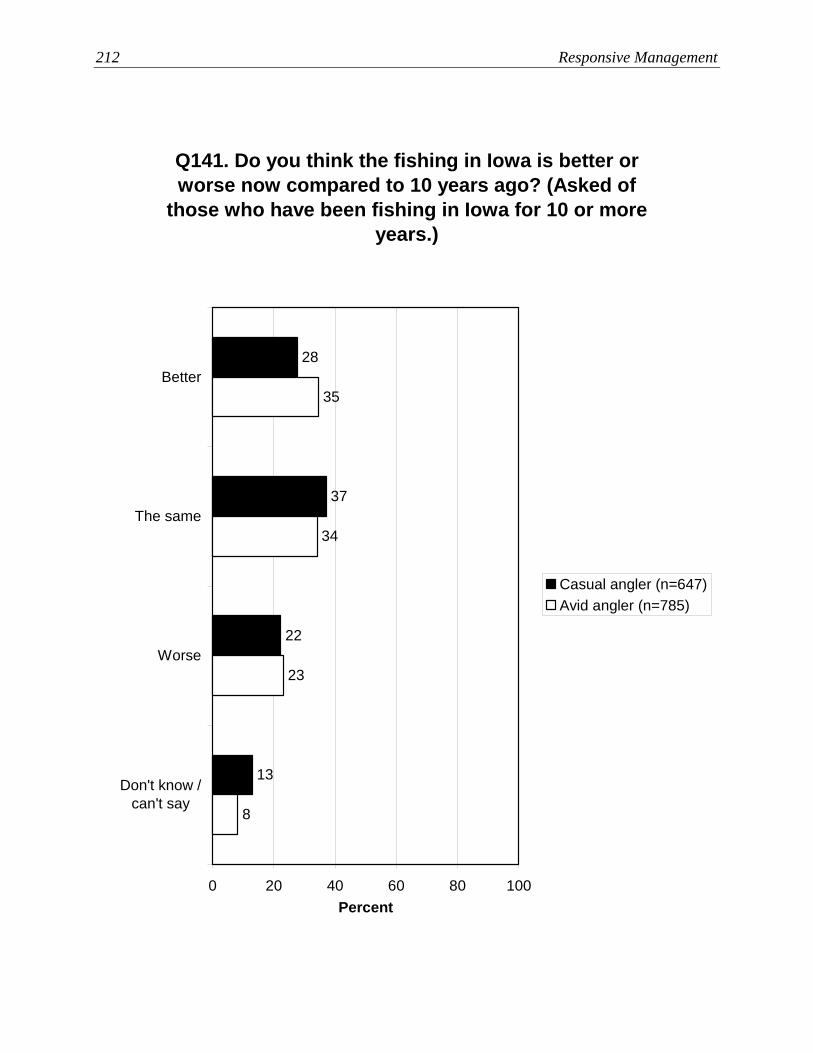
212 Responsive Management
Q141. Do you think the fishing in Iowa is better or worse now compared to 10 years ago? (Asked of
those who have been fishing in Iowa for 10 or more years.)
13
22
37
28
8
23
34
35
0 20 40 60 80 100
Better
The same
Worse
Don't know /can't say
Percent
Casual angler (n=647)Avid angler (n=785)

Iowa Angler Survey 213
Q141. Do you think the fishing in Iowa is better or worse now compared to 10 years ago? (Asked of
those who have been fishing in Iowa for 10 or more years.)
10
20
34
36
16
23
35
26
8
27
41
24
14
28
34
24
0 20 40 60 80 100
Better
The same
Worse
Don't know /can't say
Percent
Southeast (n=457)Northeast (n=208)Southwest (n=436)Northwest (n=331)
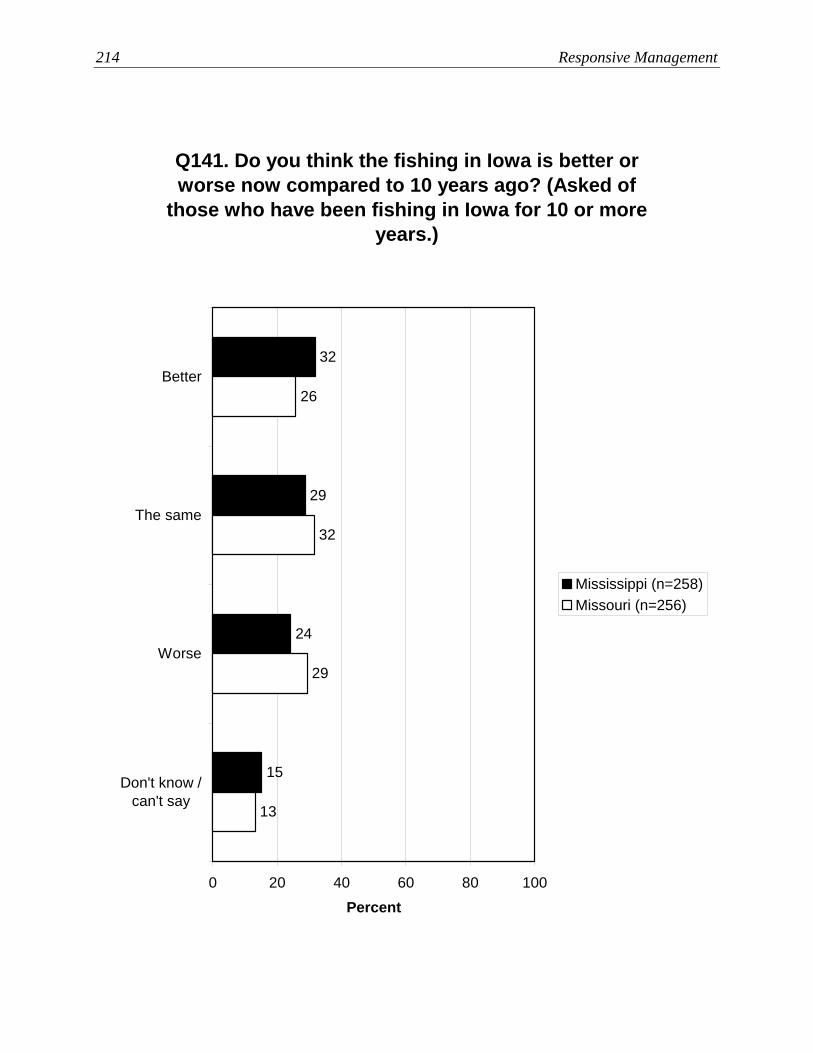
214 Responsive Management
Q141. Do you think the fishing in Iowa is better or worse now compared to 10 years ago? (Asked of
those who have been fishing in Iowa for 10 or more years.)
32
29
24
15
26
32
29
13
0 20 40 60 80 100
Better
The same
Worse
Don't know /can't say
Percent
Mississippi (n=258)Missouri (n=256)
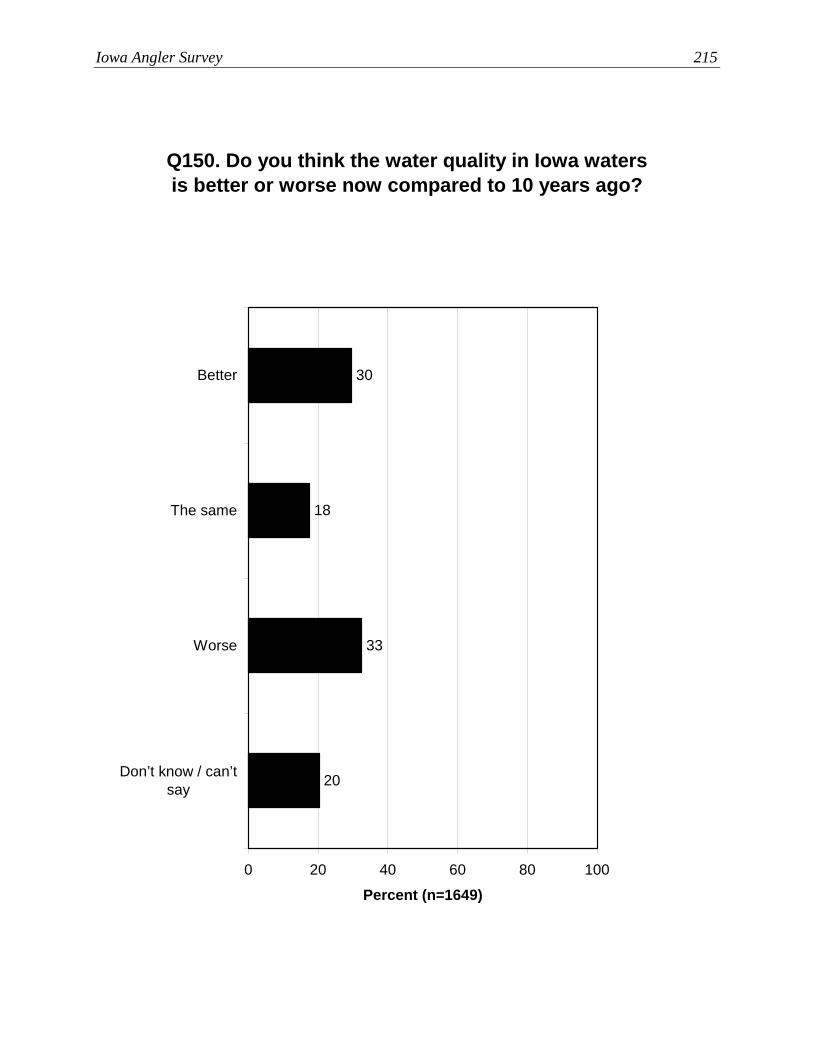
Iowa Angler Survey 215
Q150. Do you think the water quality in Iowa waters is better or worse now compared to 10 years ago?
20
33
18
30
0 20 40 60 80 100
Better
The same
Worse
Don’t know / can’tsay
Percent (n=1649)

216 Responsive Management
Q150. Do you think the water quality in Iowa waters is better or worse now compared to 10 years ago?
23
34
17
27
15
30
19
35
0 20 40 60 80 100
Better
The same
Worse
Don’t know /can’t say
Percent
Casual angler (n=807)Avid angler (n=842)
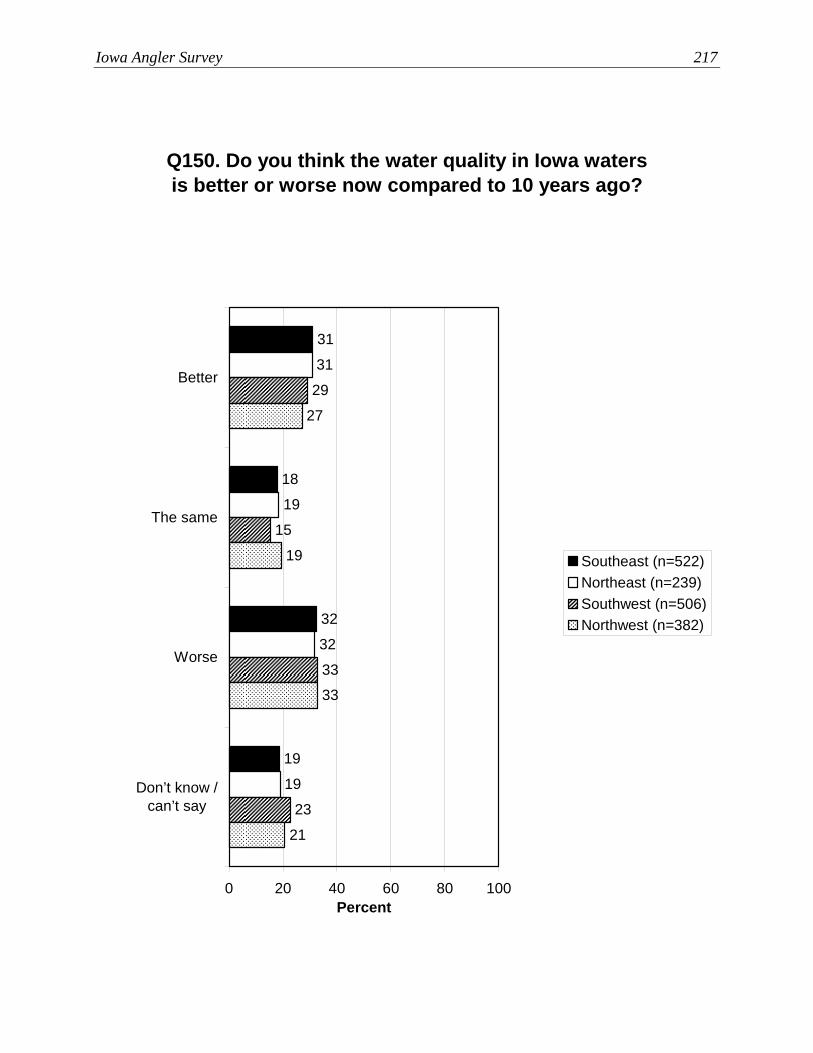
Iowa Angler Survey 217
Q150. Do you think the water quality in Iowa waters is better or worse now compared to 10 years ago?
19
32
18
31
19
32
19
31
23
29
15
33
21
27
19
33
0 20 40 60 80 100
Better
The same
Worse
Don’t know /can’t say
Percent
Southeast (n=522)Northeast (n=239)Southwest (n=506)Northwest (n=382)
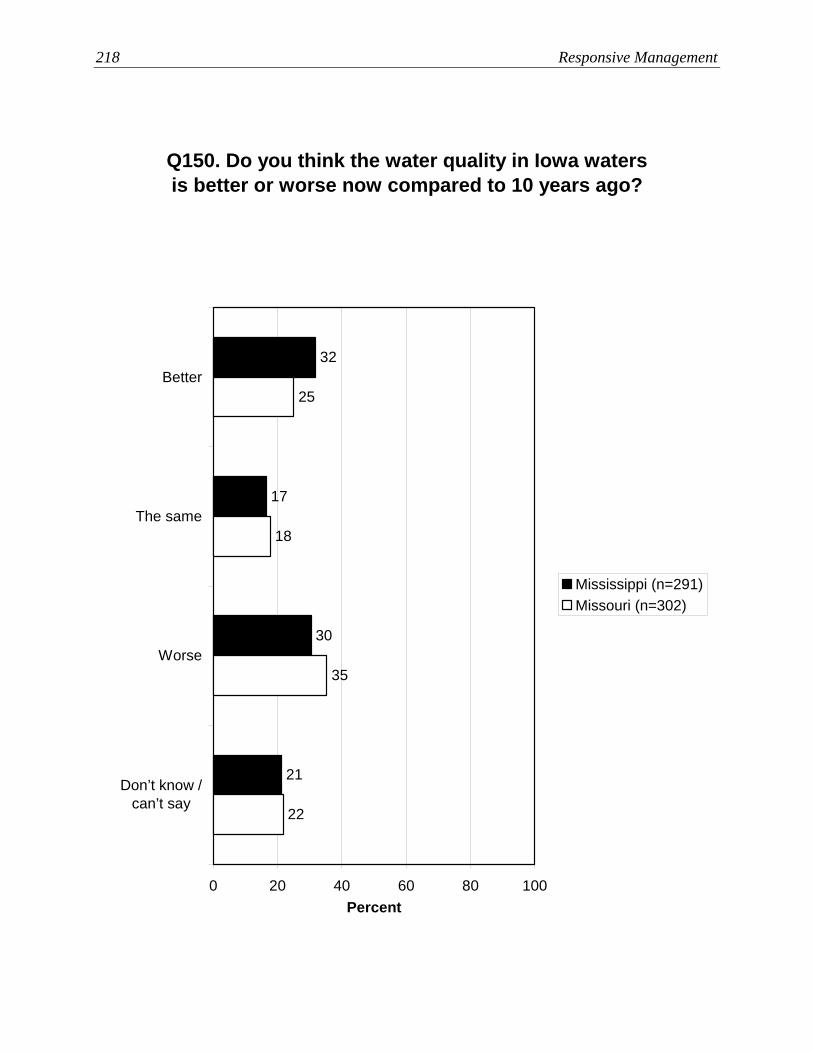
218 Responsive Management
Q150. Do you think the water quality in Iowa waters is better or worse now compared to 10 years ago?
21
30
17
32
22
35
18
25
0 20 40 60 80 100
Better
The same
Worse
Don’t know /can’t say
Percent
Mississippi (n=291)Missouri (n=302)
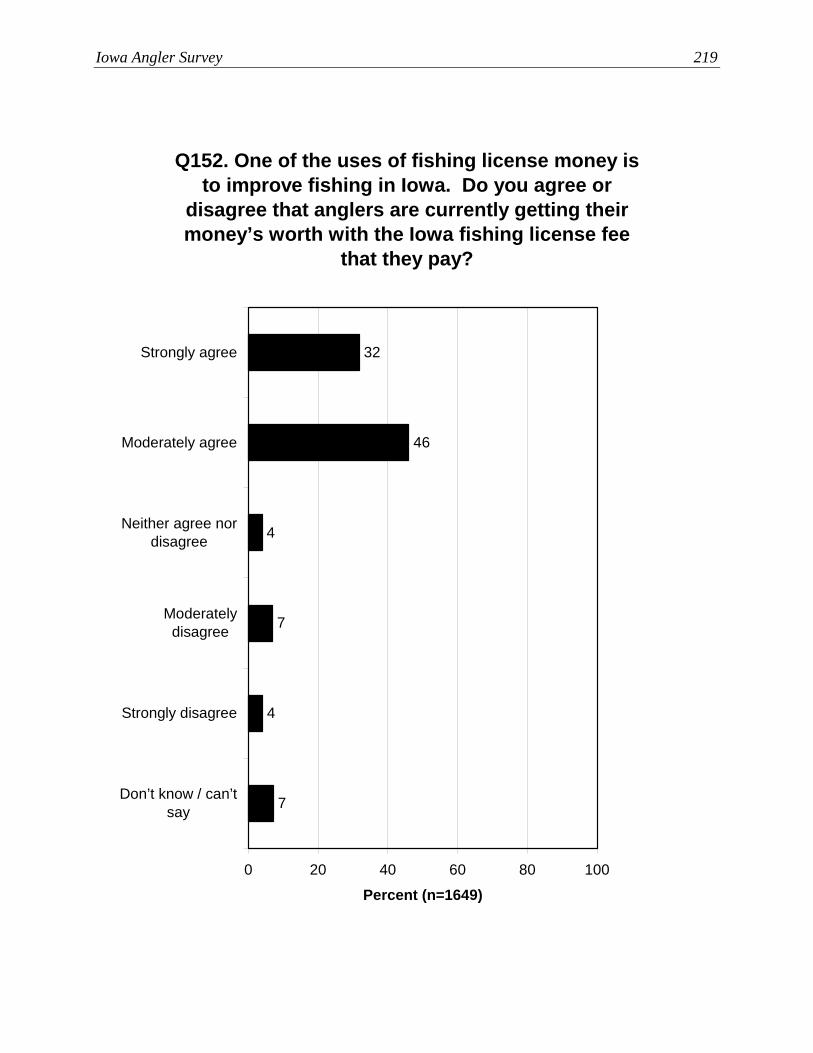
Iowa Angler Survey 219
Q152. One of the uses of fishing license money is to improve fishing in Iowa. Do you agree or
disagree that anglers are currently getting their money’s worth with the Iowa fishing license fee
that they pay?
7
4
7
4
46
32
0 20 40 60 80 100
Strongly agree
Moderately agree
Neither agree nordisagree
Moderatelydisagree
Strongly disagree
Don’t know / can’tsay
Percent (n=1649)

220 Responsive Management
Q152. One of the uses of fishing license money is to improve fishing in Iowa. Do you agree or
disagree that anglers are currently getting their money’s worth with the Iowa fishing license fee
that they pay?
8
4
6
5
47
31
5
5
8
2
45
34
0 20 40 60 80 100
Strongly agree
Moderatelyagree
Neither agreenor disagree
Moderatelydisagree
Stronglydisagree
Don’t know /can’t say
Percent
Casual angler (n=807)Avid angler (n=842)

Iowa Angler Survey 221
Q152. One of the uses of fishing license money is to improve fishing in Iowa. Do you agree or
disagree that anglers are currently getting their money’s worth with the Iowa fishing license fee
that they pay?
9
3
8
3
47
30
5
4
7
5
46
34
6
5
5
33
47
5
8
4
8
33
44
4
0 20 40 60 80 100
Stronglyagree
Moderatelyagree
Neither agreenor disagree
Moderatelydisagree
Stronglydisagree
Don’t know /can’t say
Percent
Southeast (n=522)Northeast (n=239)Southwest (n=506)Northwest (n=382)
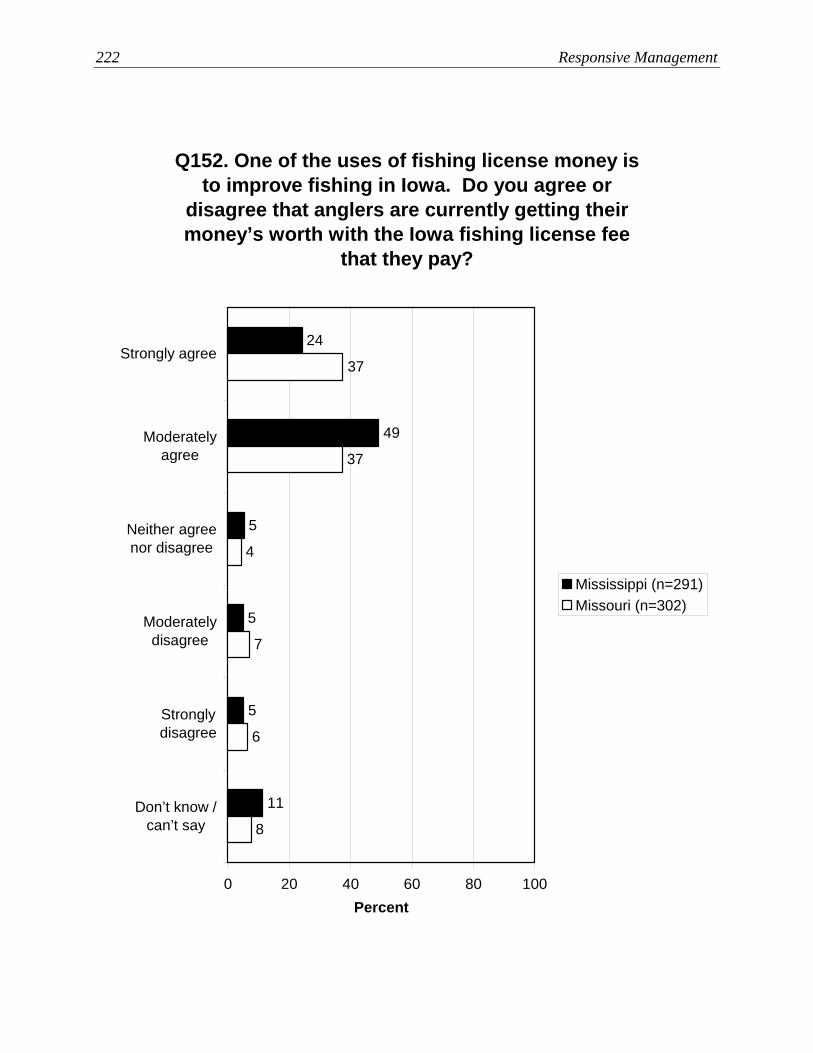
222 Responsive Management
Q152. One of the uses of fishing license money is to improve fishing in Iowa. Do you agree or
disagree that anglers are currently getting their money’s worth with the Iowa fishing license fee
that they pay?
11
5
5
5
49
24
8
6
7
4
37
37
0 20 40 60 80 100
Strongly agree
Moderatelyagree
Neither agreenor disagree
Moderatelydisagree
Stronglydisagree
Don’t know /can’t say
Percent
Mississippi (n=291)Missouri (n=302)

Iowa Angler Survey 223
RATINGS OF IMPORTANCE OF IOWA DEPARTMENT OF NATURAL RESOURCES PROGRAMS AND EFFORTS
The survey asked anglers to rate the importance of eight IDNR efforts related to fishing, on a
scale of 0 to 10, with 10 being the most important. One graph shows the means, ranked from
highest to lowest. All the means are high in importance, ranging from 8.07 to 9.07, with
protecting water quality (9.07) and conserving streams and rivers (8.75) at the top. Another
graph shows the percentage giving a rating of 9 or 10. Again, protecting water quality (73%
of anglers rated it at a 9 or 10) and conserving streams and rivers (62%) are at the top,
followed by protecting endangered fish species (55%) and controlling invasive species
(52%). Enforcing boating regulations also has a majority rating it a 9 or 10 (51%).
• The crosstabulation by avid versus casual angler found little difference between the
groups on their ratings of the importance of the eight IDNR efforts asked about in the
survey.
• The regional crosstabulation found few regional differences in ratings of importance of
IDNR efforts, with the following exceptions: a greater percentage of Southeast Region
anglers rated protecting water quality at a 9 or 10, relative to the other regions; Northeast
Region anglers had a notably lower percentage giving a 9 or 10 rating for conservation of
streams and rivers, controlling aquatic invasive species, and monitoring fish populations.
Northwest Region anglers had a markedly higher percentage giving a rating of 9 or 10 to
stocking fish.
• Missouri River Region anglers in general gave higher ratings of importance for each item
than did Mississippi River Region anglers, particularly for enforcing boating regulations,
controlling aquatic invasive species, and stocking fish.

224 Responsive Management
Q155-162. On a scale of 0 - 10 where 0 is "not at all important" and 10 is "extremely important", the
mean rating of importance for the following for the Iowa Department of Natural Resources.
8.21
8.26
8.35
8.37
8.75
9.07
8.09
8.07
0 2 4 6 8 10
Protecting waterquality in Iowa's
waters
Conservation ofstreams and rivers
Controlling aquaticinvasive species
Protecting endangeredspecies of fish
Stocking fish
Enforcing boatingregulations
Enforcing fishingregulations
Monitoring fisheriespopulations
Percent

Iowa Angler Survey 225
Q155-162. On a scale of 0 - 10 where 0 is "not at all important" and 10 is "extremely important", those who rated the importance for the following for the
Iowa Department of Natural Resources as a 9 or 10.
40
46
73
62
55
52
51
46
0 20 40 60 80 100
Protecting waterquality in Iowa's waters
Conservation ofstreams and rivers
Protecting endangeredspecies of fish
Controlling aquaticinvasive species
Enforcing boatingregulations
Enforcing fishingregulations
Stocking fish
Monitoring fisheriespopulations
Percent

226 Responsive Management
Q155-162. On a scale of 0 - 10 where 0 is "not at all important" and 10 is "extremely important", the
mean rating of importance for the following for the Iowa Department of Natural Resources.
8.46
8.09
8.26
8.19
8.18
8.27
8.27
8.33
8.35
8.72
9.04
8.04
8.03
8.37
8.83
9.15
0 2 4 6 8 10
Protecting waterquality in Iowa's
waters
Conservation ofstreams and
rivers
Protectingendangered
species of fish
Controllingaquatic invasive
species
Enforcingboating
regulations
Stocking fish
Enforcing fishingregulations
Monitoringfisheries
populations
Percent
Casual anglerAvid angler
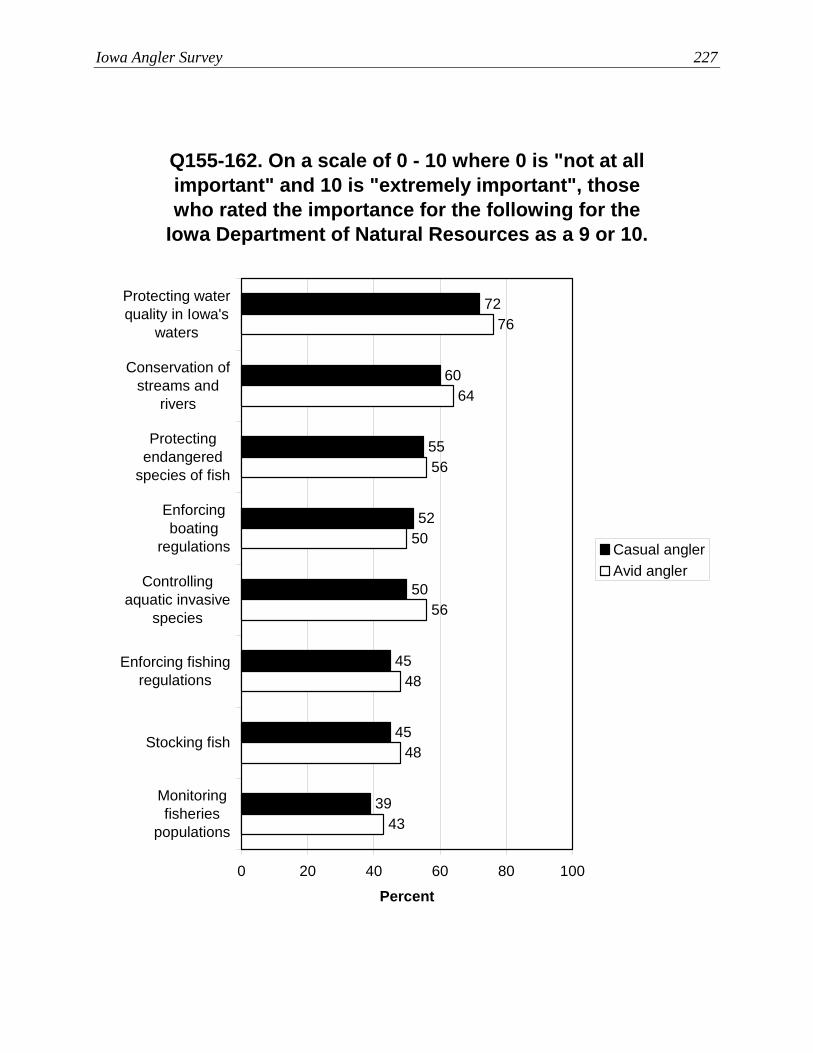
Iowa Angler Survey 227
Q155-162. On a scale of 0 - 10 where 0 is "not at all important" and 10 is "extremely important", those who rated the importance for the following for the
Iowa Department of Natural Resources as a 9 or 10.
50
56
48
48
4339
45
72
60
55
52
50
45
76
64
56
0 20 40 60 80 100
Protecting waterquality in Iowa's
waters
Conservation ofstreams and
rivers
Protectingendangered
species of fish
Enforcingboating
regulations
Controllingaquatic invasive
species
Enforcing fishingregulations
Stocking fish
Monitoringfisheries
populations
Percent
Casual anglerAvid angler

228 Responsive Management
Q155-162. On a scale of 0 - 10 where 0 is "not at all important" and 10 is "extremely important", the
mean rating of importance for the following for the Iowa Department of Natural Resources.
8.20
8.22
8.38
8.45
8.93
9.19
8.15
8.157.63
8.04
7.92
8.07
8.17
8.13
8.48
8.74
8.13
7.96
8.35
8.35
8.49
9.14
8.81
8.46
8.23
8.20
8.27
8.38
8.37
9.06
8.60
8.23
0 2 4 6 8 10
Protecting waterquality in Iowa's
waters
Conservation ofstreams and
rivers
Protectingendangered
species of fish
Controllingaquatic invasive
species
Stocking fish
Enforcing boatingregulations
Enforcing fishingregulations
Monitoringfisheries
populations
Percent
SoutheastNortheastSouthwestNorthwest
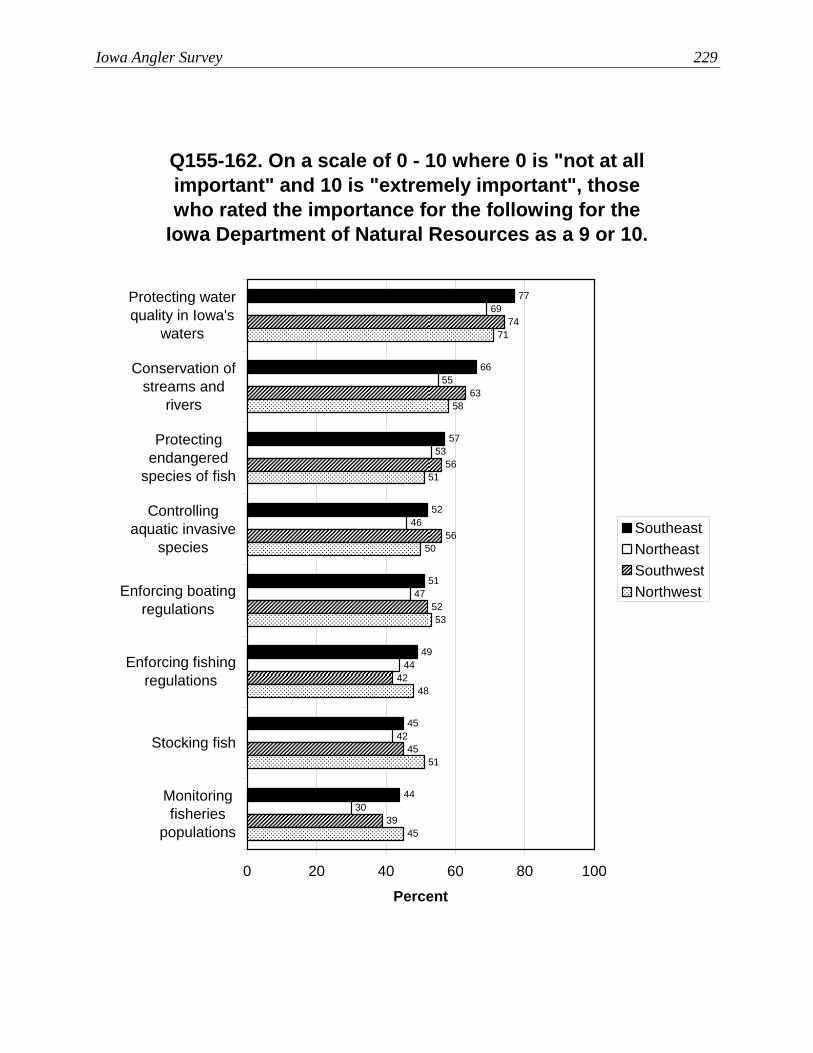
Iowa Angler Survey 229
Q155-162. On a scale of 0 - 10 where 0 is "not at all important" and 10 is "extremely important", those who rated the importance for the following for the
Iowa Department of Natural Resources as a 9 or 10.
44
45
77
66
57
52
51
49
30
42
44
47
46
69
55
53
39
45
42
52
56
63
74
56
45
51
48
53
50
51
58
71
0 20 40 60 80 100
Protecting waterquality in Iowa's
waters
Conservation ofstreams and
rivers
Protectingendangered
species of fish
Controllingaquatic invasive
species
Enforcing boatingregulations
Enforcing fishingregulations
Stocking fish
Monitoringfisheries
populations
Percent
SoutheastNortheastSouthwestNorthwest

230 Responsive Management
Q155-162. On a scale of 0 - 10 where 0 is "not at all important" and 10 is "extremely important", the
mean rating of importance for the following for the Iowa Department of Natural Resources.
8
8
8
8
9
9
8
88
9
8
9
8
9
9
9
0 2 4 6 8 10
Protecting waterquality in Iowa's
waters
Conservation ofstreams and rivers
Controlling aquaticinvasive species
Protectingendangered species
of fish
Enforcing boatingregulations
Enforcing fishingregulations
Stocking fish
Monitoring fisheriespopulations
Percent
MississippiMissouri

Iowa Angler Survey 231
Q155-162. On a scale of 0 - 10 where 0 is "not at all important" and 10 is "extremely important", those who rated the importance for the following for the
Iowa Department of Natural Resources as a 9 or 10.
40
41
72
62
54
51
49
48
43
53
58
53
59
76
61
59
0 20 40 60 80 100
Protecting waterquality in Iowa's
waters
Conservation ofstreams and rivers
Protectingendangered species
of fish
Enforcing boatingregulations
Enforcing fishingregulations
Controlling aquaticinvasive species
Stocking fish
Monitoring fisheriespopulations
Percent
MississippiMissouri
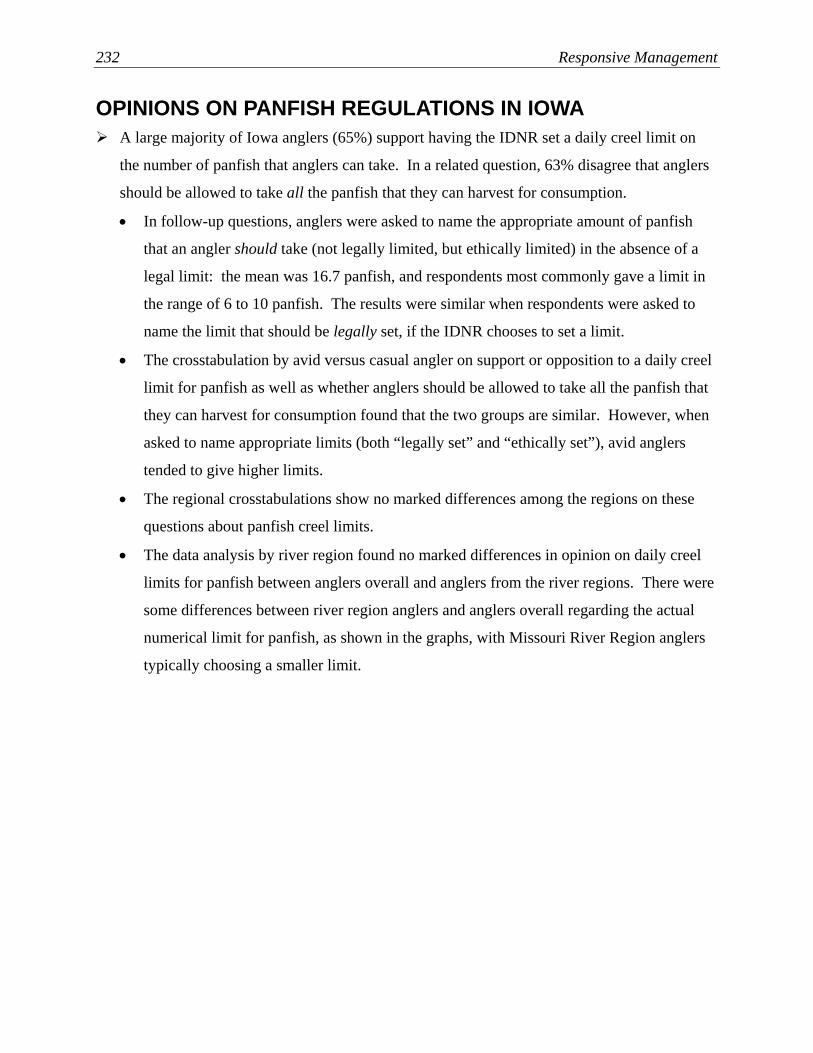
232 Responsive Management
OPINIONS ON PANFISH REGULATIONS IN IOWA A large majority of Iowa anglers (65%) support having the IDNR set a daily creel limit on
the number of panfish that anglers can take. In a related question, 63% disagree that anglers
should be allowed to take all the panfish that they can harvest for consumption.
• In follow-up questions, anglers were asked to name the appropriate amount of panfish
that an angler should take (not legally limited, but ethically limited) in the absence of a
legal limit: the mean was 16.7 panfish, and respondents most commonly gave a limit in
the range of 6 to 10 panfish. The results were similar when respondents were asked to
name the limit that should be legally set, if the IDNR chooses to set a limit.
• The crosstabulation by avid versus casual angler on support or opposition to a daily creel
limit for panfish as well as whether anglers should be allowed to take all the panfish that
they can harvest for consumption found that the two groups are similar. However, when
asked to name appropriate limits (both “legally set” and “ethically set”), avid anglers
tended to give higher limits.
• The regional crosstabulations show no marked differences among the regions on these
questions about panfish creel limits.
• The data analysis by river region found no marked differences in opinion on daily creel
limits for panfish between anglers overall and anglers from the river regions. There were
some differences between river region anglers and anglers overall regarding the actual
numerical limit for panfish, as shown in the graphs, with Missouri River Region anglers
typically choosing a smaller limit.
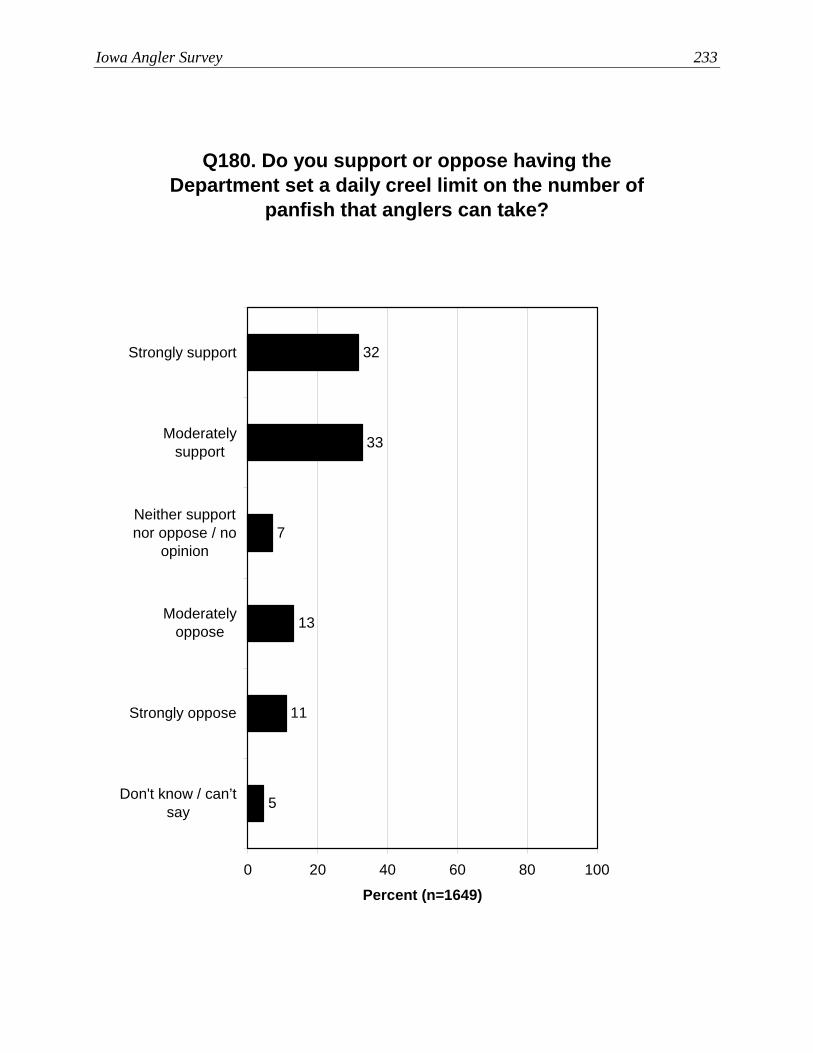
Iowa Angler Survey 233
Q180. Do you support or oppose having the Department set a daily creel limit on the number of
panfish that anglers can take?
5
11
13
7
33
32
0 20 40 60 80 100
Strongly support
Moderatelysupport
Neither supportnor oppose / no
opinion
Moderatelyoppose
Strongly oppose
Don't know / can’tsay
Percent (n=1649)

234 Responsive Management
Q181. Do you agree or disagree that anglers should be allowed to take all the panfish that they can
harvest for consumption?
4
35
28
5
13
14
0 20 40 60 80 100
Strongly agree
Moderately agree
Neither agree nordisagree / no
opinion
Moderatelydisagree
Strongly disagree
Don't know / can’tsay
Percent (n=1649)
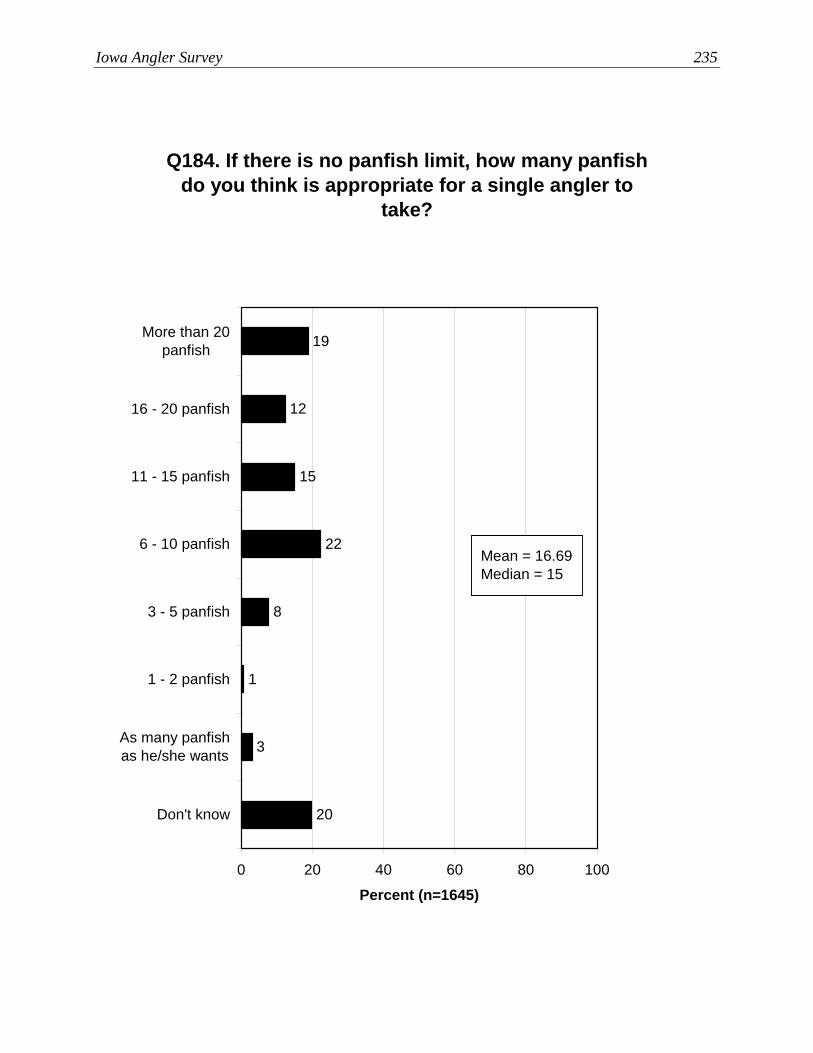
Iowa Angler Survey 235
Q184. If there is no panfish limit, how many panfish do you think is appropriate for a single angler to
take?
1
8
22
15
12
19
3
20
0 20 40 60 80 100
More than 20panfish
16 - 20 panfish
11 - 15 panfish
6 - 10 panfish
3 - 5 panfish
1 - 2 panfish
As many panfishas he/she wants
Don't know
Percent (n=1645)
Mean = 16.69Median = 15
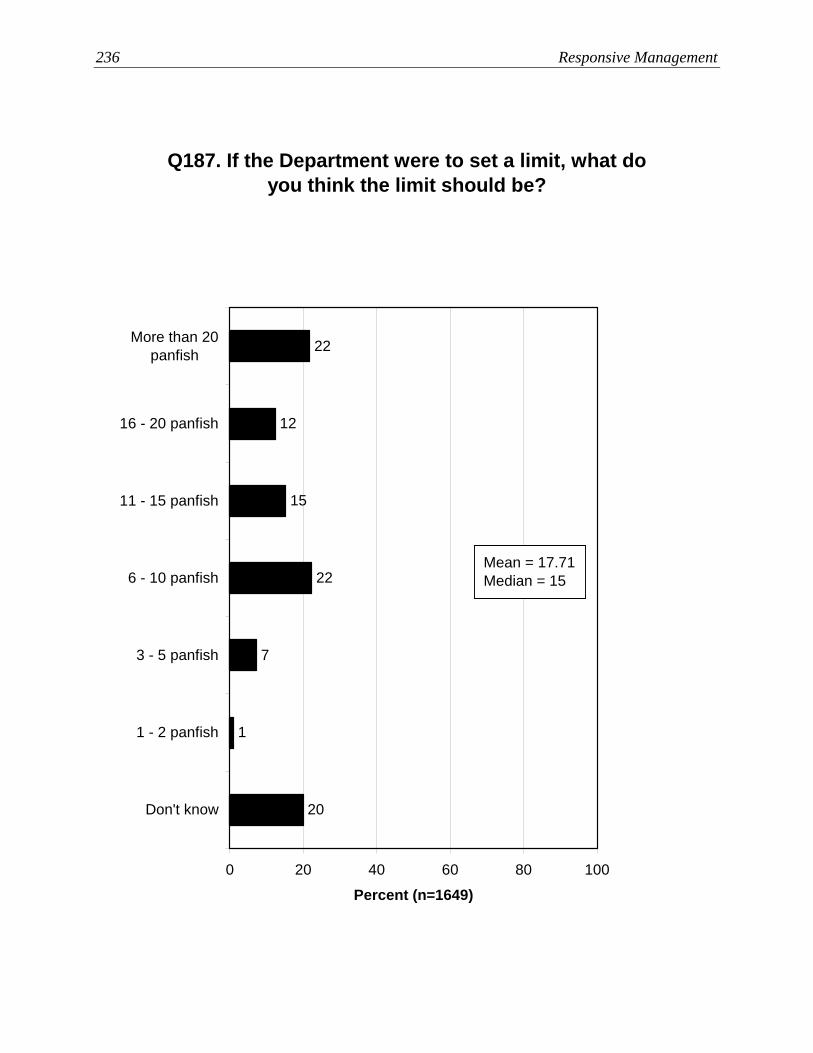
236 Responsive Management
Q187. If the Department were to set a limit, what do you think the limit should be?
1
7
22
15
12
22
20
0 20 40 60 80 100
More than 20panfish
16 - 20 panfish
11 - 15 panfish
6 - 10 panfish
3 - 5 panfish
1 - 2 panfish
Don't know
Percent (n=1649)
Mean = 17.71Median = 15

Iowa Angler Survey 237
Q180. Do you support or oppose having the Department set a daily creel limit on the number of
panfish that anglers can take?
5
10
13
8
34
30
3
12
14
6
30
36
0 20 40 60 80 100
Stronglysupport
Moderatelysupport
Neithersupport noroppose / no
opinion
Moderatelyoppose
Stronglyoppose
Don't know /can’t say
Percent
Casual angler (n=807)Avid angler (n=842)

238 Responsive Management
Q181. Do you agree or disagree that anglers should be allowed to take all the panfish that they can
harvest for consumption?
5
33
29
5
14
13
1
40
27
4
12
15
0 20 40 60 80 100
Strongly agree
Moderatelyagree
Neither agreenor disagree /
no opinion
Moderatelydisagree
Stronglydisagree
Don't know /can’t say
Percent
Casual angler (n=807)Avid angler (n=842)

Iowa Angler Survey 239
Q184. If there is no panfish limit, how many panfish do you think is appropriate for a single angler to
take?
1
9
23
15
12
16
3
2214
3
0
5
21
16
14
26
0 20 40 60 80 100
More than 20panfish
16 - 20 panfish
11 - 15 panfish
6 - 10 panfish
3 - 5 panfish
1 - 2 panfish
As many panfishas he/she wants
Don't know
Percent
Casual angler (n=807)Avid angler (n=842)
Casual anglerMean = 15.46Median = 12Avid anglerMean = 19.16Median = 15

240 Responsive Management
Q187. If the Department were to set a limit, what do you think the limit should be?
1
9
24
15
12
18
2215
0
4
19
17
14
30
0 20 40 60 80 100
More than 20panfish
16 - 20 panfish
11 - 15 panfish
6 - 10 panfish
3 - 5 panfish
1 - 2 panfish
Don't know
Percent
Casual angler (n=807)Avid angler (n=842)
Casual anglerMean = 16.47Median = 12Avid anglerMean = 20.24Median = 20
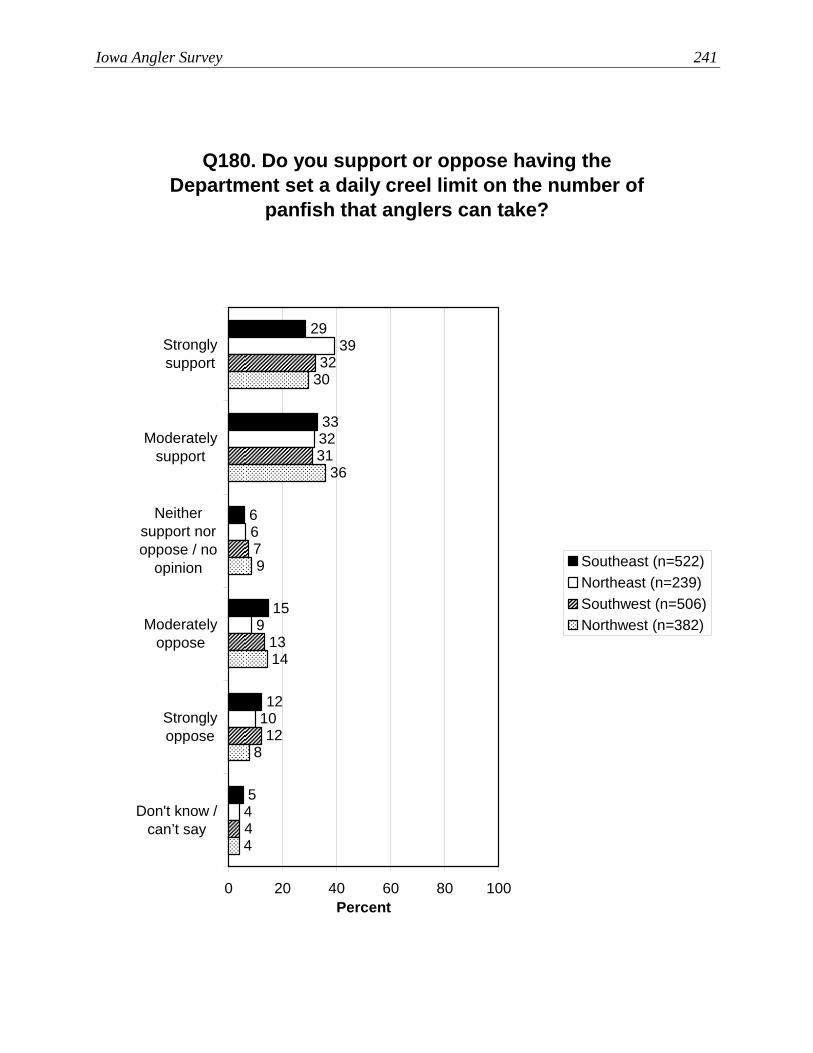
Iowa Angler Survey 241
Q180. Do you support or oppose having the Department set a daily creel limit on the number of
panfish that anglers can take?
5
12
15
6
33
29
4
10
9
6
32
39
4
12
13
32
31
7
4
8
14
30
36
9
0 20 40 60 80 100
Stronglysupport
Moderatelysupport
Neithersupport noroppose / no
opinion
Moderatelyoppose
Stronglyoppose
Don't know /can’t say
Percent
Southeast (n=522)Northeast (n=239)Southwest (n=506)Northwest (n=382)
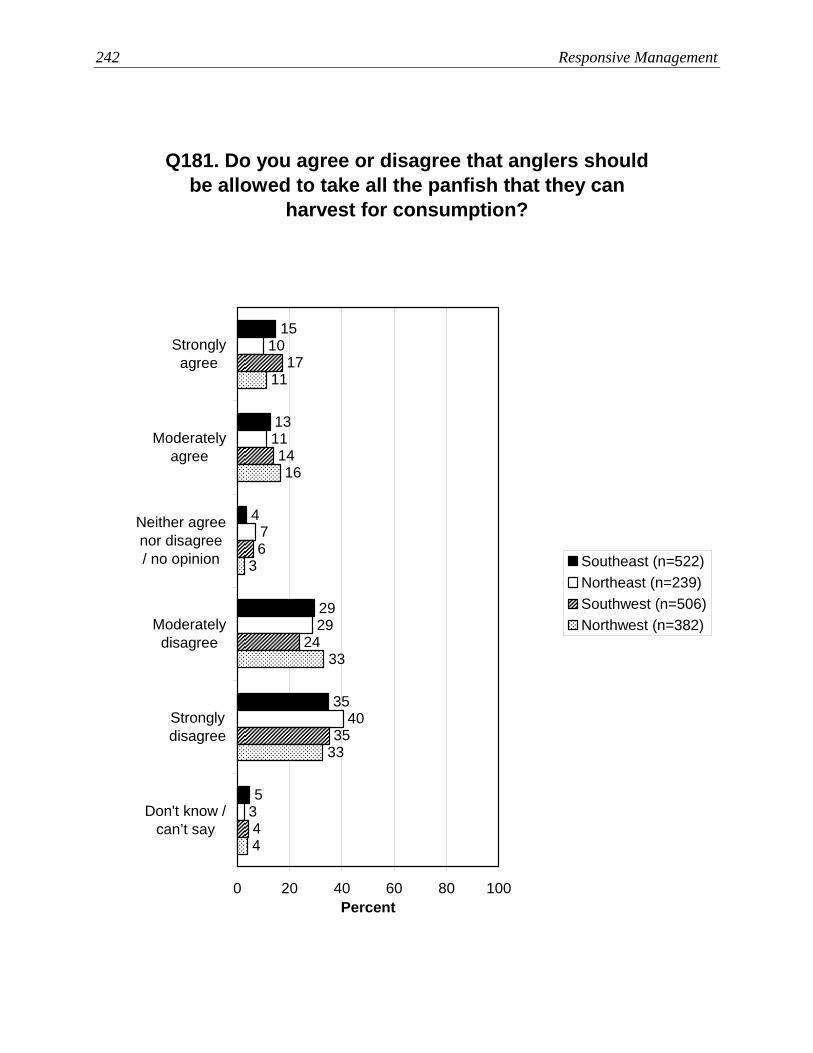
242 Responsive Management
Q181. Do you agree or disagree that anglers should be allowed to take all the panfish that they can
harvest for consumption?
5
35
29
4
13
15
3
40
29
7
11
10
4
35
24
17
14
6
4
33
33
11
16
3
0 20 40 60 80 100
Stronglyagree
Moderatelyagree
Neither agreenor disagree/ no opinion
Moderatelydisagree
Stronglydisagree
Don't know /can’t say
Percent
Southeast (n=522)Northeast (n=239)Southwest (n=506)Northwest (n=382)
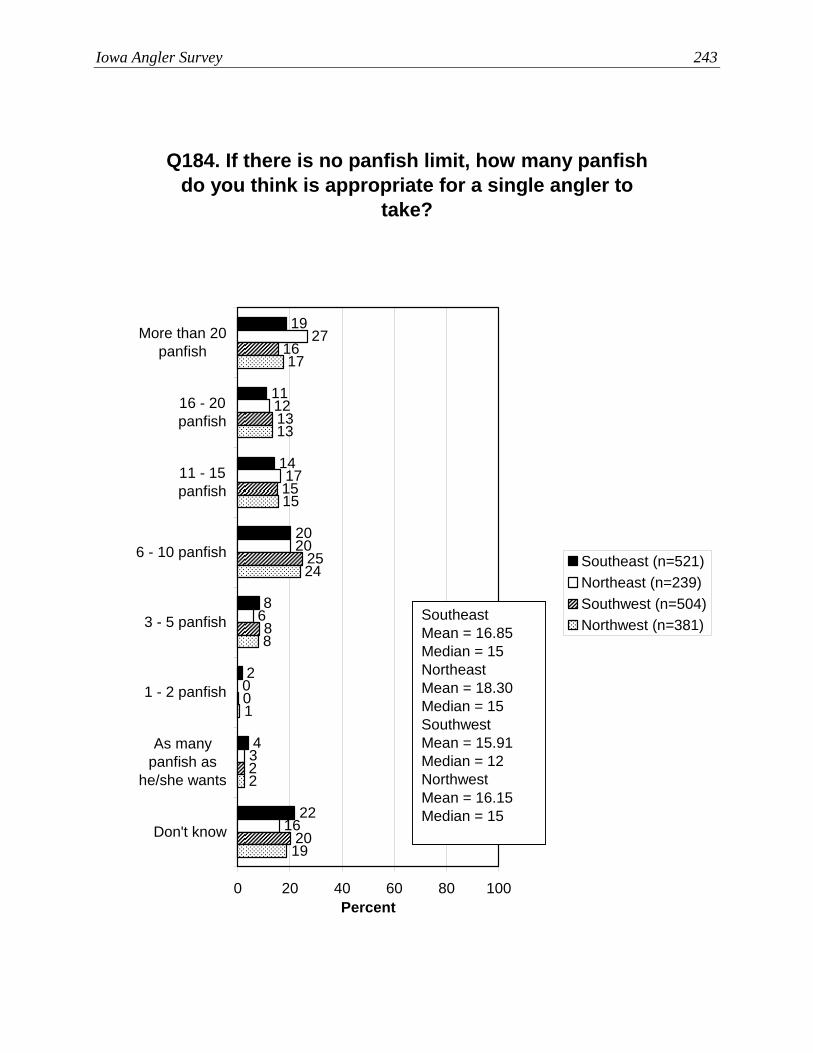
Iowa Angler Survey 243
Q184. If there is no panfish limit, how many panfish do you think is appropriate for a single angler to
take?
2
8
20
14
11
19
4
2216
3
0
6
20
17
12
27
20
2
0
8
25
16
13
15
19
2
1
8
24
17
13
15
0 20 40 60 80 100
More than 20panfish
16 - 20panfish
11 - 15panfish
6 - 10 panfish
3 - 5 panfish
1 - 2 panfish
As manypanfish as
he/she wants
Don't know
Percent
Southeast (n=521)Northeast (n=239)Southwest (n=504)Northwest (n=381)
SoutheastMean = 16.85Median = 15NortheastMean = 18.30Median = 15SouthwestMean = 15.91Median = 12NorthwestMean = 16.15Median = 15
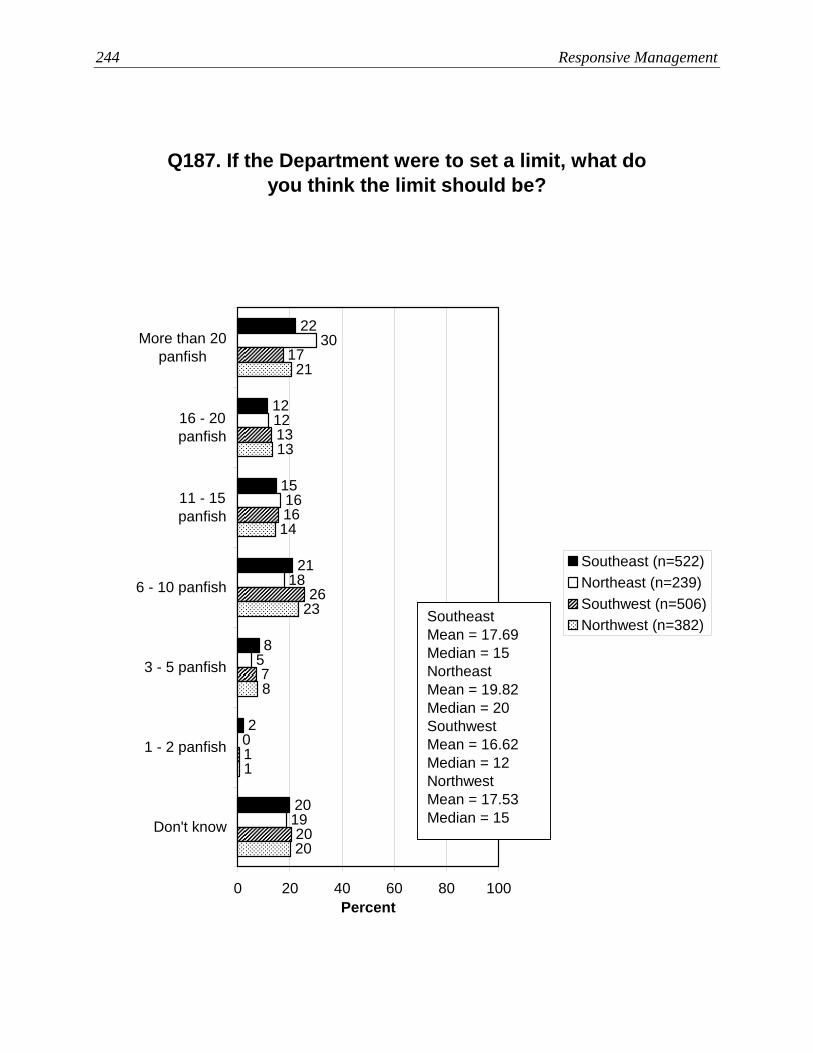
244 Responsive Management
Q187. If the Department were to set a limit, what do you think the limit should be?
2
8
21
15
12
22
2019
0
5
18
16
12
30
20
1
7
26
17
13
16
20
1
8
23
21
13
14
0 20 40 60 80 100
More than 20panfish
16 - 20panfish
11 - 15panfish
6 - 10 panfish
3 - 5 panfish
1 - 2 panfish
Don't know
Percent
Southeast (n=522)Northeast (n=239)Southwest (n=506)Northwest (n=382)Southeast
Mean = 17.69Median = 15NortheastMean = 19.82Median = 20SouthwestMean = 16.62Median = 12NorthwestMean = 17.53Median = 15

Iowa Angler Survey 245
Q180. Do you support or oppose having the Department set a daily creel limit on the number of
panfish that anglers can take?
4
10
15
7
34
31
4
9
13
8
33
34
0 20 40 60 80 100
Stronglysupport
Moderatelysupport
Neither supportnor oppose /no opinion
Moderatelyoppose
Stronglyoppose
Don't know /can’t say
Percent
Mississippi (n=291)Missouri (n=302)
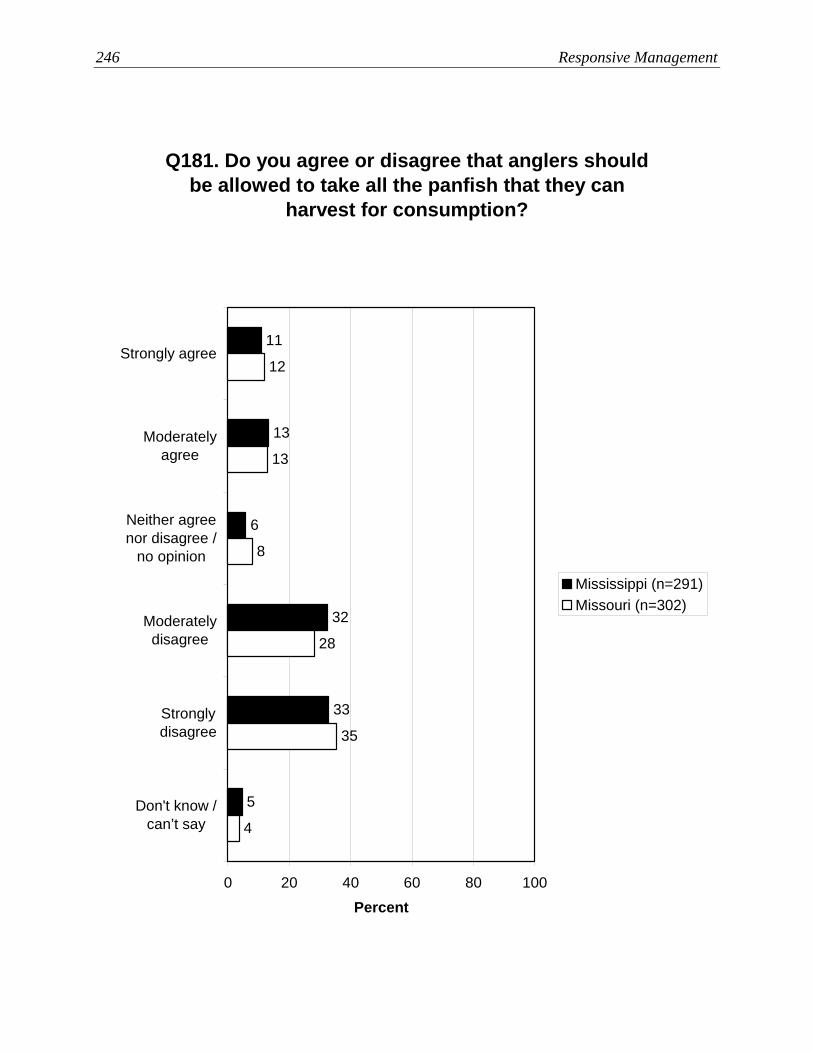
246 Responsive Management
Q181. Do you agree or disagree that anglers should be allowed to take all the panfish that they can
harvest for consumption?
5
33
32
6
13
11
4
35
28
8
13
12
0 20 40 60 80 100
Strongly agree
Moderatelyagree
Neither agreenor disagree /
no opinion
Moderatelydisagree
Stronglydisagree
Don't know /can’t say
Percent
Mississippi (n=291)Missouri (n=302)
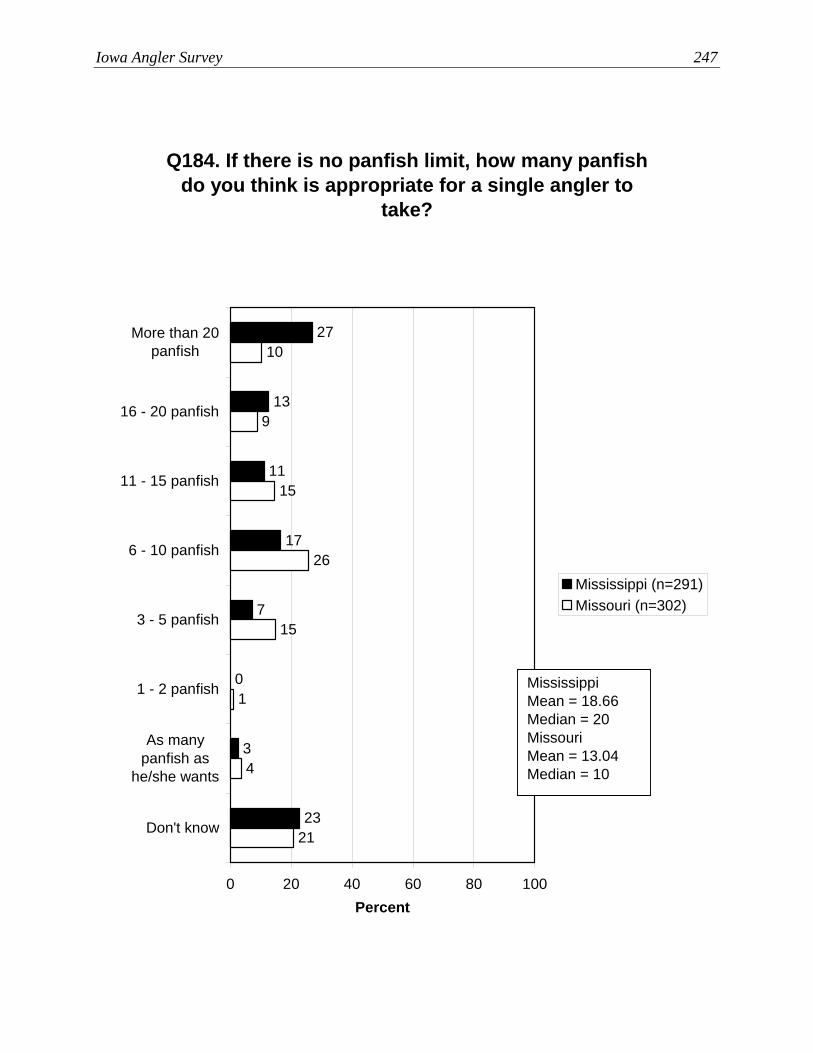
Iowa Angler Survey 247
Q184. If there is no panfish limit, how many panfish do you think is appropriate for a single angler to
take?
0
7
17
11
13
27
3
2321
4
1
15
26
15
9
10
0 20 40 60 80 100
More than 20panfish
16 - 20 panfish
11 - 15 panfish
6 - 10 panfish
3 - 5 panfish
1 - 2 panfish
As manypanfish as
he/she wants
Don't know
Percent
Mississippi (n=291)Missouri (n=302)
MississippiMean = 18.66Median = 20MissouriMean = 13.04Median = 10

248 Responsive Management
Q187. If the Department were to set a limit, what do you think the limit should be?
0
6
16
14
9
32
2320
1
14
27
15
9
14
0 20 40 60 80 100
More than 20panfish
16 - 20 panfish
11 - 15 panfish
6 - 10 panfish
3 - 5 panfish
1 - 2 panfish
Don't know
Percent
Mississippi (n=291)Missouri (n=302)
MississippiMean = 19.79Median = 20MissouriMean = 14.14Median = 10

Iowa Angler Survey 249
CONTACT WITH DEPARTMENT OF NATURAL RESOURCES’ LAW ENFORCEMENT PERSONNEL
The majority of Iowa anglers (57%) have had contact with an IDNR enforcement officer
while fishing. Just more than half (51%) have been checked for a fishing license by an IDNR
officer.
• Avid anglers are more likely than casual anglers to have had contact with an IDNR
officer while fishing, and they are more likely to have been checked for a license.
• In the regional crosstabulation, Northeast Region anglers are slightly less likely to have
had contact with an IDNR officer while fishing. There are no marked regional
differences in having been checked for a license, among those who have had contact with
an officer.
• The data analysis by river region found no marked differences between anglers overall
and anglers from either river region on these questions.
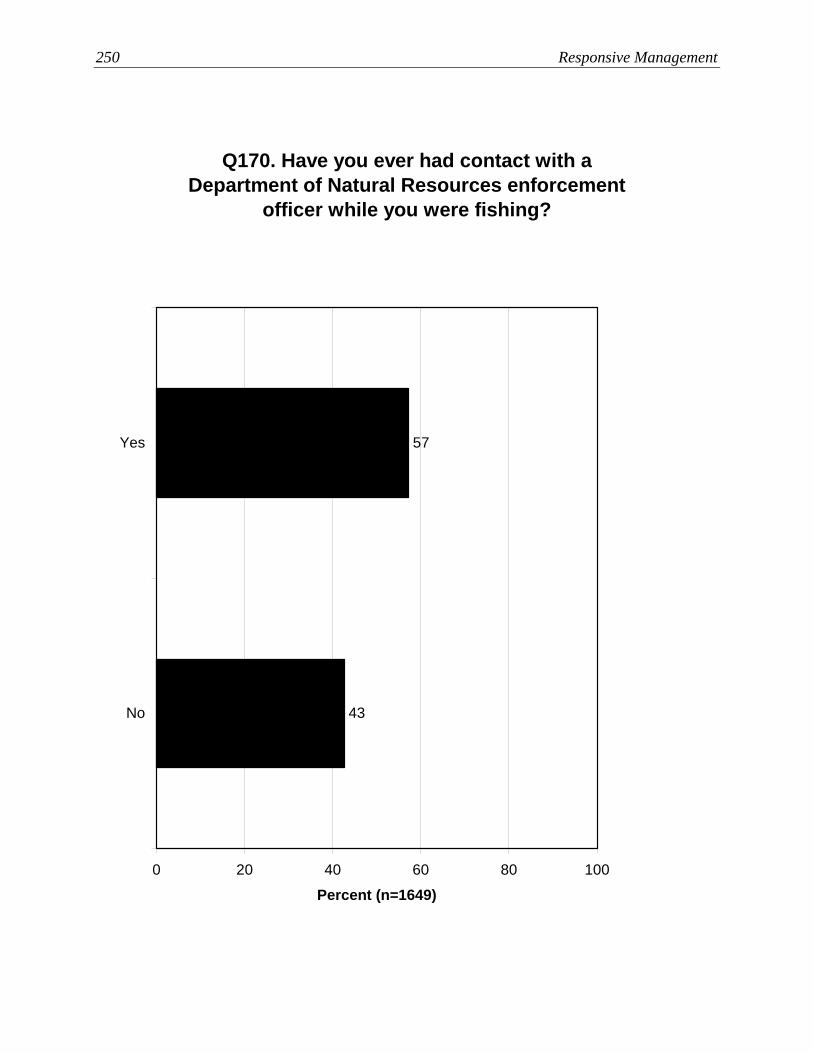
250 Responsive Management
Q170. Have you ever had contact with a Department of Natural Resources enforcement
officer while you were fishing?
43
57
0 20 40 60 80 100
Yes
No
Percent (n=1649)

Iowa Angler Survey 251
Q171. Have you ever been checked by a Department of Natural Resources officer for a
license when you were fishing? (Asked of those who have ever had contact with a DNR
enforcement officer while fishing.)
11
89
0 20 40 60 80 100
Yes
No
Percent (n=1022)
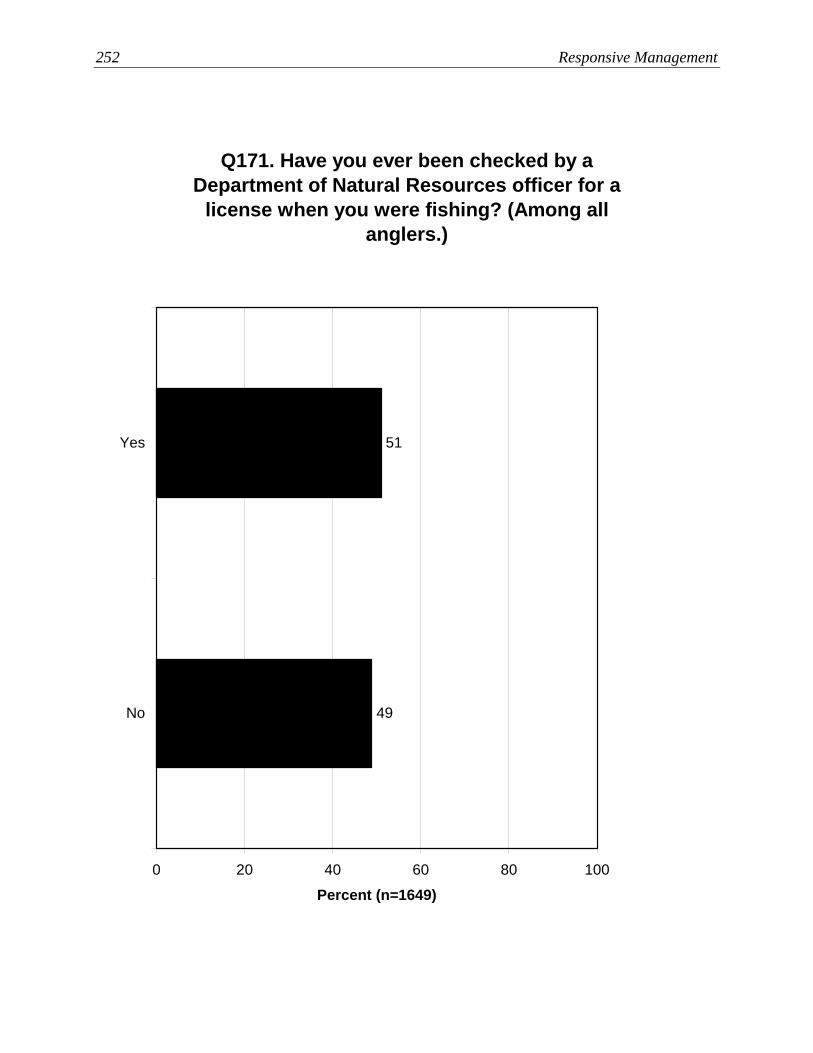
252 Responsive Management
Q171. Have you ever been checked by a Department of Natural Resources officer for a
license when you were fishing? (Among all anglers.)
51
49
0 20 40 60 80 100
Yes
No
Percent (n=1649)

Iowa Angler Survey 253
Q170. Have you ever had contact with a Department of Natural Resources enforcement
officer while you were fishing?
49
50
27
72
0 20 40 60 80 100
Yes
No
Percent
Casual angler (n=807)Avid angler (n=842)

254 Responsive Management
Q171. Have you ever been checked by a Department of Natural Resources officer for a
license when you were fishing? (Asked of those who have ever had contact with a DNR
enforcement officer while fishing.)
13
87
7
93
0 20 40 60 80 100
Yes
No
Percent
Casual angler (n=410)Avid angler (n=612)

Iowa Angler Survey 255
Q170. Have you ever had contact with a Department of Natural Resources enforcement
officer while you were fishing?
40
60
51
49
58
42
58
41
0 20 40 60 80 100
Yes
No
Percent
Southeast (n=522)Northeast (n=239)Southwest (n=506)Northwest (n=382)

256 Responsive Management
Q171. Have you ever been checked by a Department of Natural Resources officer for a
license when you were fishing? (Asked of those who have ever had contact with a DNR
enforcement officer while fishing.)
12
88
8
92
89
10
90
10
0 20 40 60 80 100
Yes
No
Percent
Southeast (n=341)Northeast (n=127)Southwest (n=321)Northwest (n=233)

Iowa Angler Survey 257
Q170. Have you ever had contact with a Department of Natural Resources enforcement
officer while you were fishing?
43
57
41
59
0 20 40 60 80 100
Yes
No
Percent
Mississippi (n=291)Missouri (n=302)
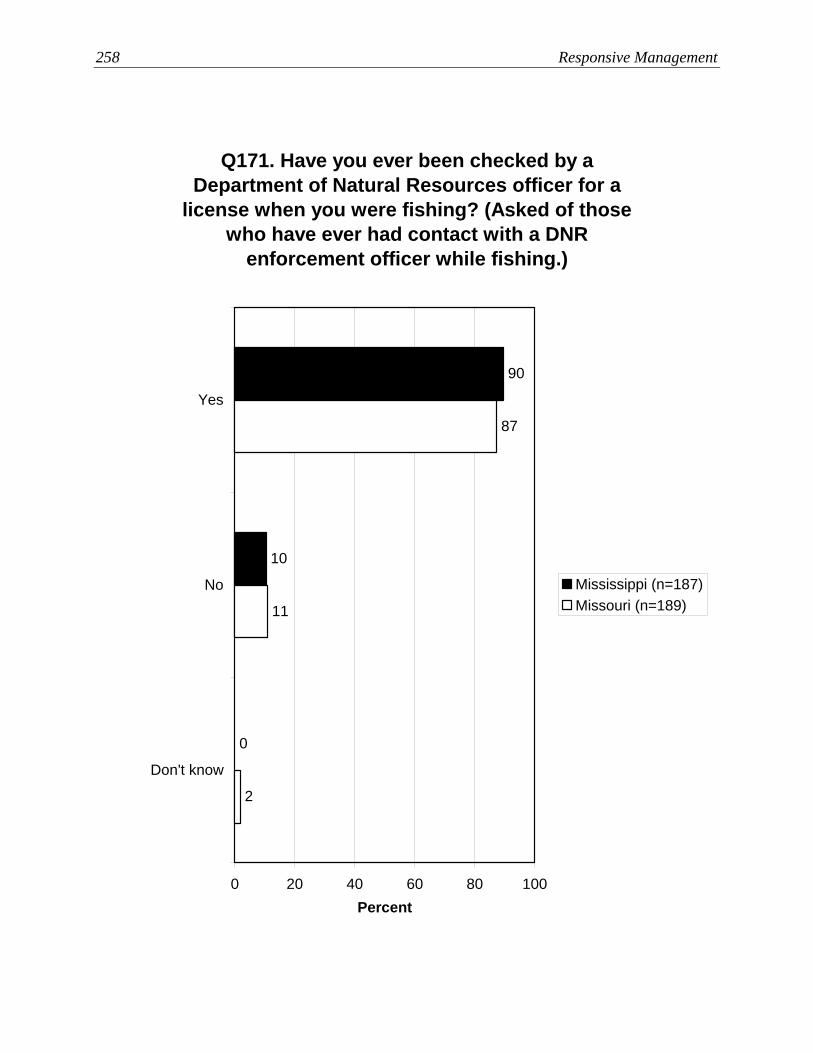
258 Responsive Management
Q171. Have you ever been checked by a Department of Natural Resources officer for a
license when you were fishing? (Asked of those who have ever had contact with a DNR
enforcement officer while fishing.)
0
10
90
2
11
87
0 20 40 60 80 100
Yes
No
Don't know
Percent
Mississippi (n=187)Missouri (n=189)
Iowa Angler Survey 259
CONSUMPTION OF FISH CAUGHT IN IOWA The large majority of Iowa anglers (80%) eat (or their family members eat) the fish they
catch at least some of the time.
• Most commonly, those who consume fish they have caught have about 3 to 5 meals per
year of fish they have caught.
• The results of these questions indicate that Iowa anglers consumed approximately
4.57 million meals of Iowa-caught fish in 2007.
• Avid anglers more often than casual anglers eat (or their family members more often eat)
the fish they catch, and they typically eat more meals in a year of fish they have caught.
• The regional crosstabulations show no marked differences among the regions on these
questions about consuming fish.
• The data analysis by river region found no marked differences between anglers overall
and anglers from either river region on these questions.
The overwhelming majority of those who consume fish that they have caught (88%) consider
Iowa’s fish to be safe for eating; however, a small percentage (7%) consider Iowa’s fish to be
unsafe for eating. Most of those who consume fish that they have caught do not limit their
consumption based on safety concerns about eating the fish caught in Iowa. Nonetheless,
16% of such anglers limit their consumption at least a little because of safety concerns.
• The crosstabulations by avid versus casual angler found no marked differences between
the two groups on the perceived safety of fish caught in Iowa and on whether they limit
their consumption based on safety concerns.
• The regional crosstabulations show no marked differences among the regions on these
questions about the safety of consuming fish or self-imposed limits on consuming fish
caught in Iowa.
• The data analysis by river region found no marked differences between anglers overall
and anglers from either river region on these questions about the safety of consuming fish
caught in Iowa.
• In a related question, 49% of Iowa’s anglers have been aware of at least one fish advisory
about eating fish from Iowa waters.
260 Responsive Management
• Avid anglers are just slightly more likely to have heard/seen a fish advisory, relative to
casual anglers.
• The regional crosstabulation found that both eastern regions’ anglers are more likely to
have been aware of a fish advisory, while western anglers, and Northwest Region anglers
in particular, are less likely to have been aware of a fish advisory.
• In the data analysis by river region, Mississippi River Region anglers are more likely, and
Missouri River Region anglers are less likely, than are anglers overall to have been aware
of a fish advisory.
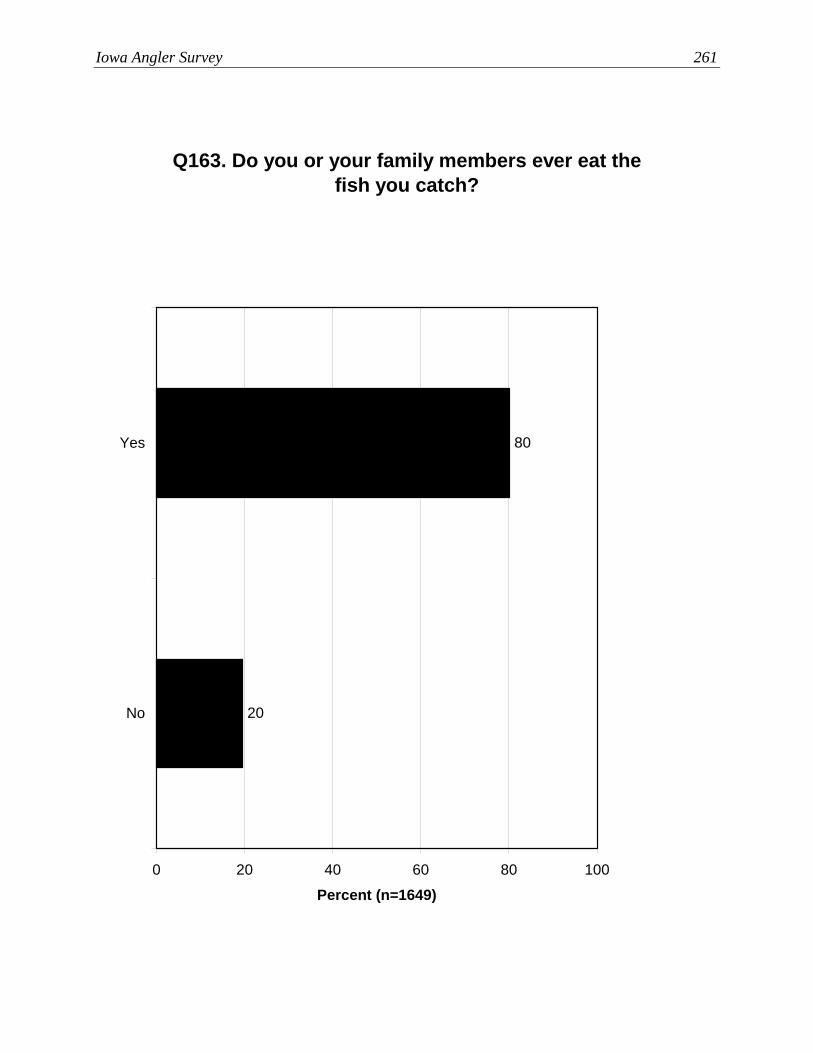
Iowa Angler Survey 261
Q163. Do you or your family members ever eat the fish you catch?
20
80
0 20 40 60 80 100
Yes
No
Percent (n=1649)
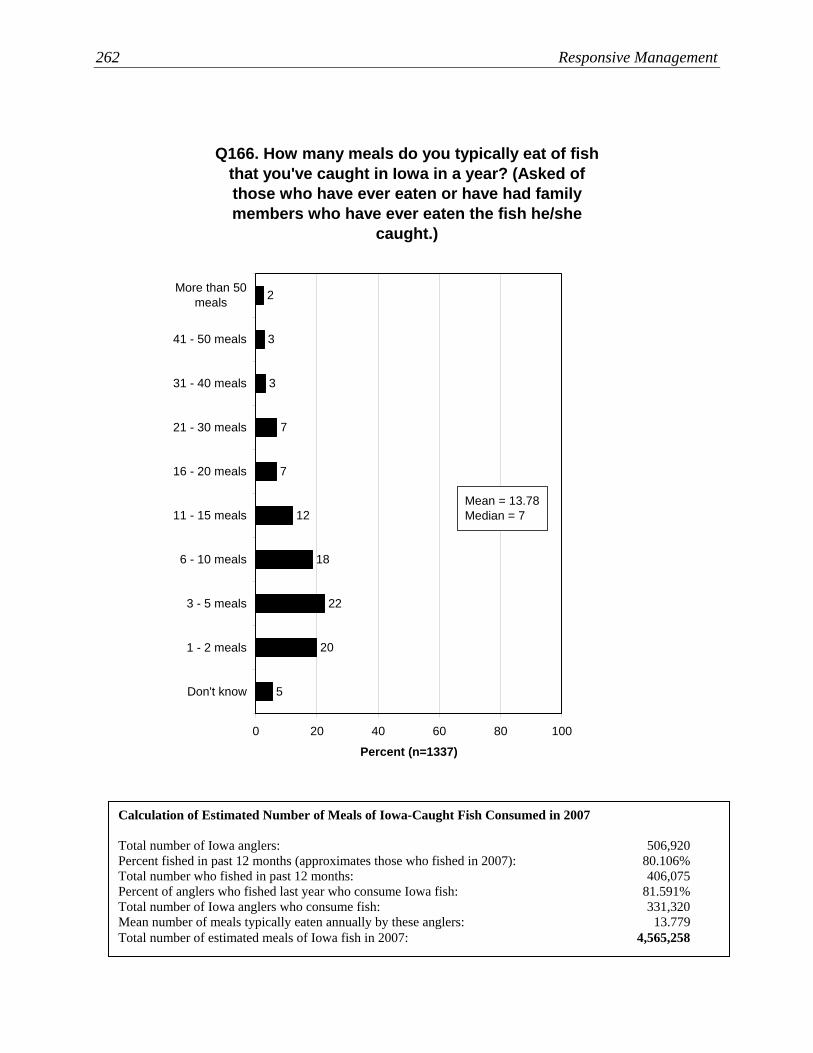
262 Responsive Management
Q166. How many meals do you typically eat of fish that you've caught in Iowa in a year? (Asked of those who have ever eaten or have had family members who have ever eaten the fish he/she
caught.)
5
12
7
7
3
3
2
18
22
20
0 20 40 60 80 100
More than 50meals
41 - 50 meals
31 - 40 meals
21 - 30 meals
16 - 20 meals
11 - 15 meals
6 - 10 meals
3 - 5 meals
1 - 2 meals
Don't know
Percent (n=1337)
Mean = 13.78Median = 7
Calculation of Estimated Number of Meals of Iowa-Caught Fish Consumed in 2007 Total number of Iowa anglers: 506,920 Percent fished in past 12 months (approximates those who fished in 2007): 80.106% Total number who fished in past 12 months: 406,075 Percent of anglers who fished last year who consume Iowa fish: 81.591% Total number of Iowa anglers who consume fish: 331,320 Mean number of meals typically eaten annually by these anglers: 13.779 Total number of estimated meals of Iowa fish in 2007: 4,565,258
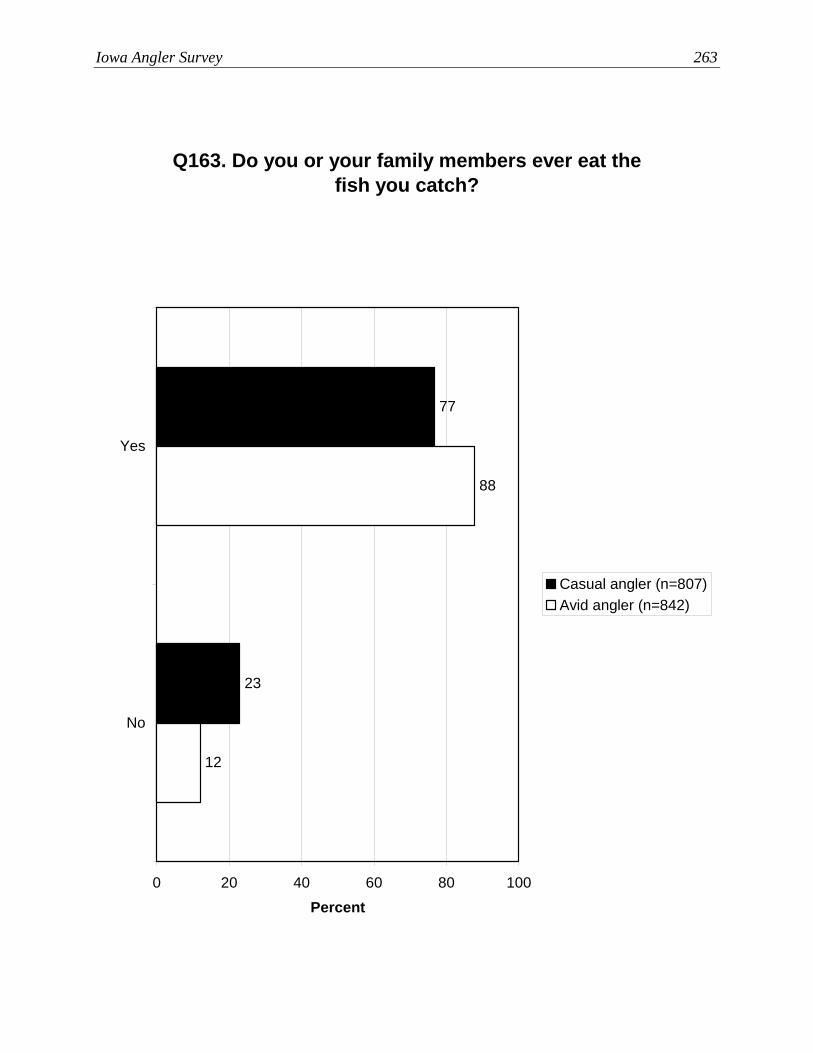
Iowa Angler Survey 263
Q163. Do you or your family members ever eat the fish you catch?
23
77
12
88
0 20 40 60 80 100
Yes
No
Percent
Casual angler (n=807)Avid angler (n=842)

264 Responsive Management
Q166. How many meals do you typically eat of fish that you've caught in Iowa in a year? (Asked of those who have ever eaten or have had family members who have ever eaten the fish he/she
caught.)
6
12
5
6
3
2
2
17
23
23
4
13
21
21
12
9
8
3
4
4
0 20 40 60 80 100
More than 50meals
41 - 50 meals
31 - 40 meals
21 - 30 meals
16 - 20 meals
11 - 15 meals
6 - 10 meals
3 - 5 meals
1 - 2 meals
Don't know
Percent
Casual angler (n=615)Avid angler (n=735)
Casual anglerMean = 12.38Median = 6Avid anglerMean = 16.43Median = 10
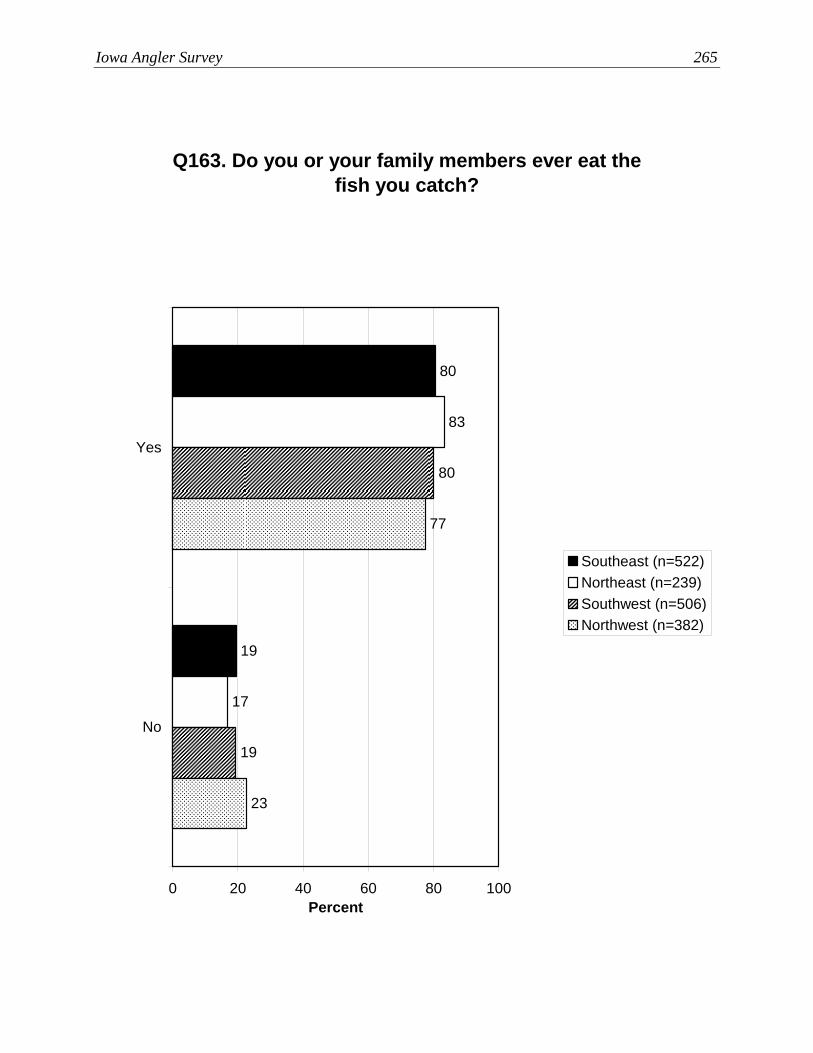
Iowa Angler Survey 265
Q163. Do you or your family members ever eat the fish you catch?
19
80
17
83
80
19
77
23
0 20 40 60 80 100
Yes
No
Percent
Southeast (n=522)Northeast (n=239)Southwest (n=506)Northwest (n=382)
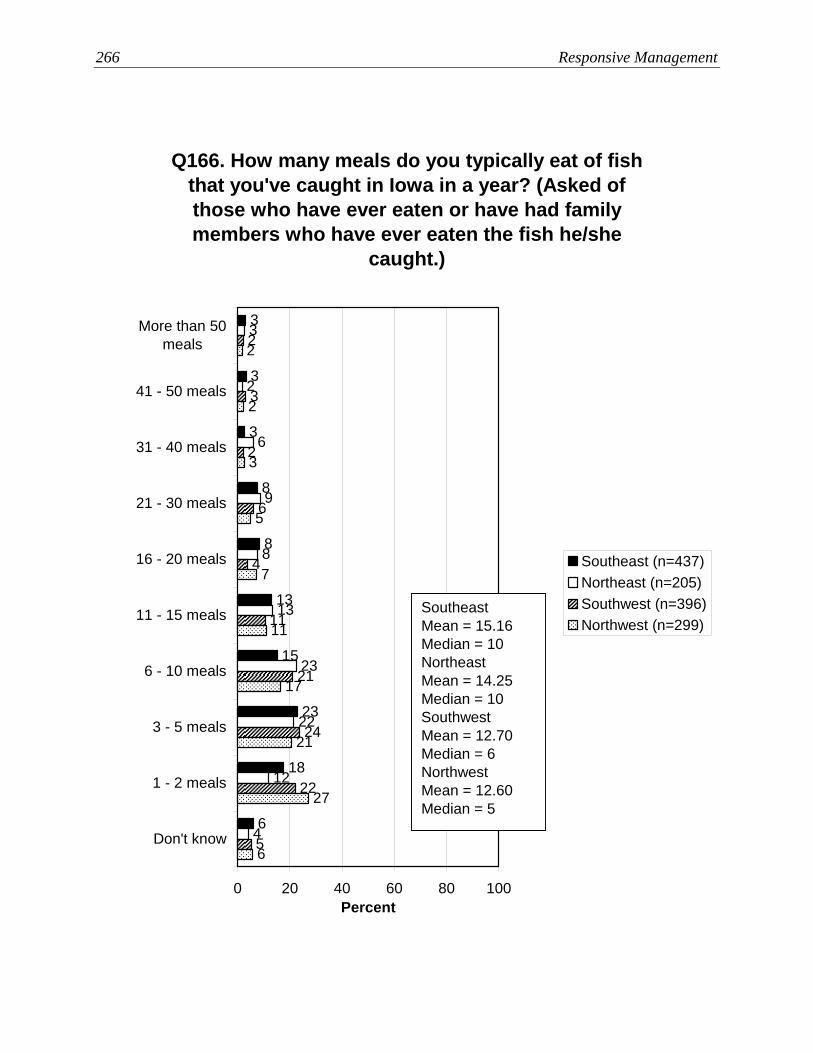
266 Responsive Management
Q166. How many meals do you typically eat of fish that you've caught in Iowa in a year? (Asked of those who have ever eaten or have had family members who have ever eaten the fish he/she
caught.)
6
13
8
8
3
3
3
15
23
18
4
12
22
23
13
8
9
6
2
3
5
22
24
21
11
4
6
2
3
2
6
27
21
17
11
7
5
2
2
3
0 20 40 60 80 100
More than 50meals
41 - 50 meals
31 - 40 meals
21 - 30 meals
16 - 20 meals
11 - 15 meals
6 - 10 meals
3 - 5 meals
1 - 2 meals
Don't know
Percent
Southeast (n=437)Northeast (n=205)Southwest (n=396)Northwest (n=299)
SoutheastMean = 15.16Median = 10NortheastMean = 14.25Median = 10SouthwestMean = 12.70Median = 6NorthwestMean = 12.60Median = 5

Iowa Angler Survey 267
Q163. Do you or your family members ever eat the fish you catch?
17
83
24
75
0 20 40 60 80 100
Yes
No
Percent
Mississippi (n=291)Missouri (n=302)

268 Responsive Management
Q166. How many meals do you typically eat of fish that you've caught in Iowa in a year? (Asked of those who have ever eaten or have had family members who have ever eaten the fish he/she
caught.)
4
13
8
7
5
2
3
20
25
13
5
23
25
18
6
7
8
2
4
0
0 20 40 60 80 100
More than 50meals
41 - 50 meals
31 - 40 meals
21 - 30 meals
16 - 20 meals
11 - 15 meals
6 - 10 meals
3 - 5 meals
1 - 2 meals
Don't know
Percent
Mississippi (n=252)Missouri (n=229)
MississippiMean = 13.49Median = 8MissouriMean = 13.12Median = 5

Iowa Angler Survey 269
Q168. How safe from contamination do you consider fish caught in Iowa to be for eating?
(Asked of those who have ever eaten or have had family members who have ever eaten the fish
he/she caught.)
4
1
6
2
45
43
0 20 40 60 80 100
Very safe
Somewhat safe
Not safe norunsafe / neutral
Somewhatunsafe
Very unsafe
Don’t know / can’tsay
Percent (n=1350)

270 Responsive Management
Q167. Do you limit your consumption of fish that you catch in Iowa because of concerns about the
safety of eating fish caught in Iowa? (Asked of those who have ever eaten or have had family members who have ever eaten the fish he/she
caught.)
1
83
10
6
0 20 40 60 80 100
Limit myconsumption very
much
Limit myconsumption a
little
Do not limit myconsumption at
all
Don’t know / can’tsay
Percent (n=1350)

Iowa Angler Survey 271
Q168. How safe from contamination do you consider fish caught in Iowa to be for eating?
(Asked of those who have ever eaten or have had family members who have ever eaten the fish
he/she caught.)
5
1
6
2
45
41
2
1
5
2
44
46
0 20 40 60 80 100
Very safe
Somewhatsafe
Not safe norunsafe /neutral
Somewhatunsafe
Very unsafe
Don’t know /can’t say
Percent
Casual angler (n=615)Avid angler (n=735)
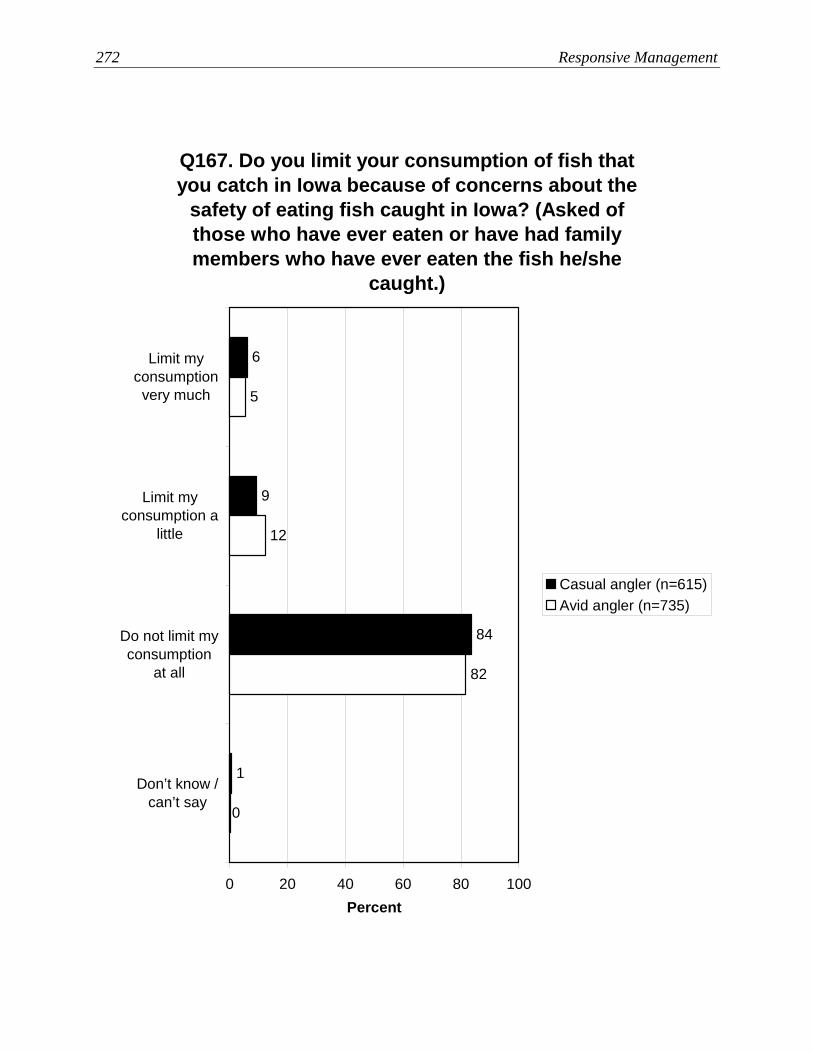
272 Responsive Management
Q167. Do you limit your consumption of fish that you catch in Iowa because of concerns about the
safety of eating fish caught in Iowa? (Asked of those who have ever eaten or have had family members who have ever eaten the fish he/she
caught.)
1
84
9
6
0
82
12
5
0 20 40 60 80 100
Limit myconsumptionvery much
Limit myconsumption a
little
Do not limit myconsumption
at all
Don’t know /can’t say
Percent
Casual angler (n=615)Avid angler (n=735)
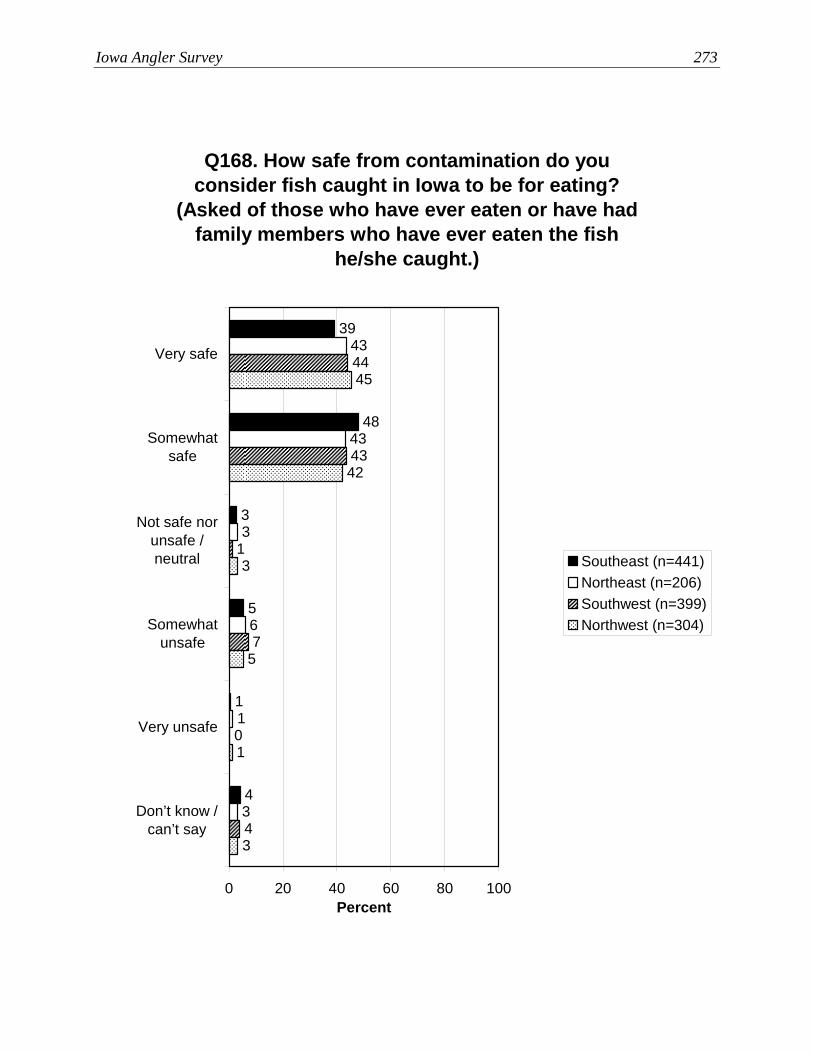
Iowa Angler Survey 273
Q168. How safe from contamination do you consider fish caught in Iowa to be for eating?
(Asked of those who have ever eaten or have had family members who have ever eaten the fish
he/she caught.)
4
1
5
3
48
39
3
1
6
3
43
43
4
0
7
44
43
1
3
1
5
45
42
3
0 20 40 60 80 100
Very safe
Somewhatsafe
Not safe norunsafe /neutral
Somewhatunsafe
Very unsafe
Don’t know /can’t say
Percent
Southeast (n=441)Northeast (n=206)Southwest (n=399)Northwest (n=304)
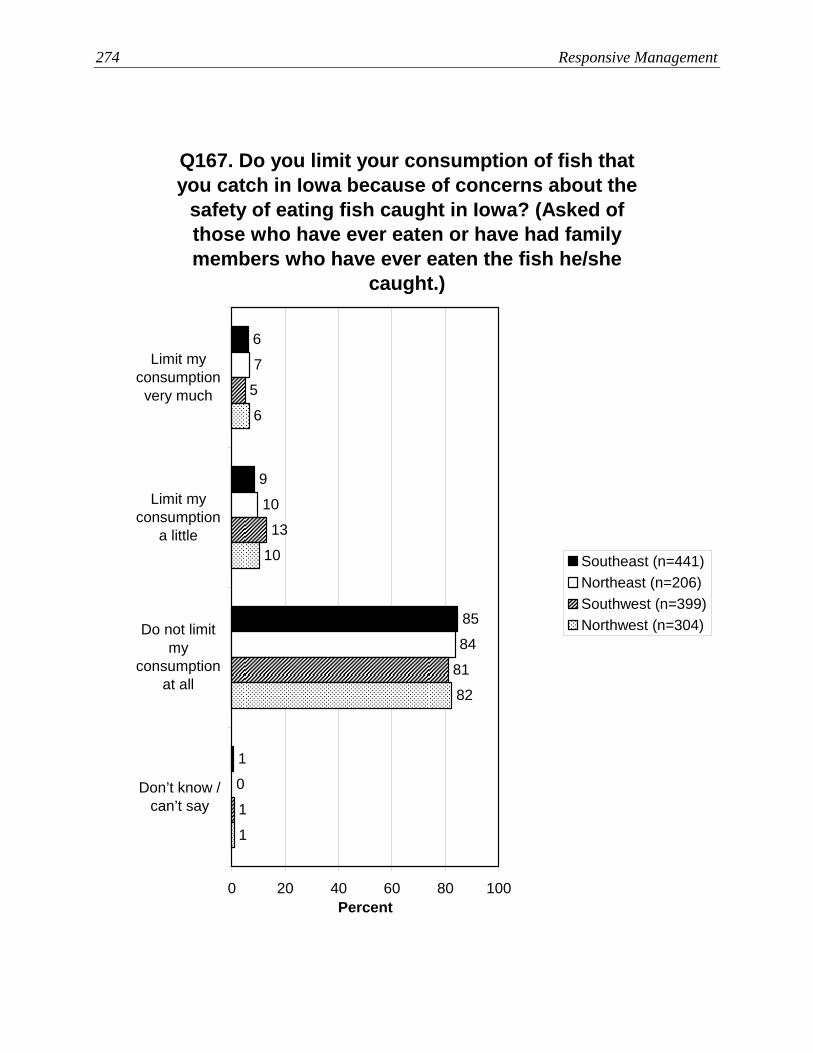
274 Responsive Management
Q167. Do you limit your consumption of fish that you catch in Iowa because of concerns about the
safety of eating fish caught in Iowa? (Asked of those who have ever eaten or have had family members who have ever eaten the fish he/she
caught.)
1
85
9
6
0
84
10
7
1
5
13
81
1
6
10
82
0 20 40 60 80 100
Limit myconsumptionvery much
Limit myconsumption
a little
Do not limitmy
consumptionat all
Don’t know /can’t say
Percent
Southeast (n=441)Northeast (n=206)Southwest (n=399)Northwest (n=304)

Iowa Angler Survey 275
Q168. How safe from contamination do you consider fish caught in Iowa to be for eating?
(Asked of those who have ever eaten or have had family members who have ever eaten the fish
he/she caught.)
4
0
6
2
49
38
1
2
7
1
41
49
0 20 40 60 80 100
Very safe
Somewhat safe
Not safe norunsafe / neutral
Somewhatunsafe
Very unsafe
Don’t know /can’t say
Percent
Mississippi (n=252)Missouri (n=232)
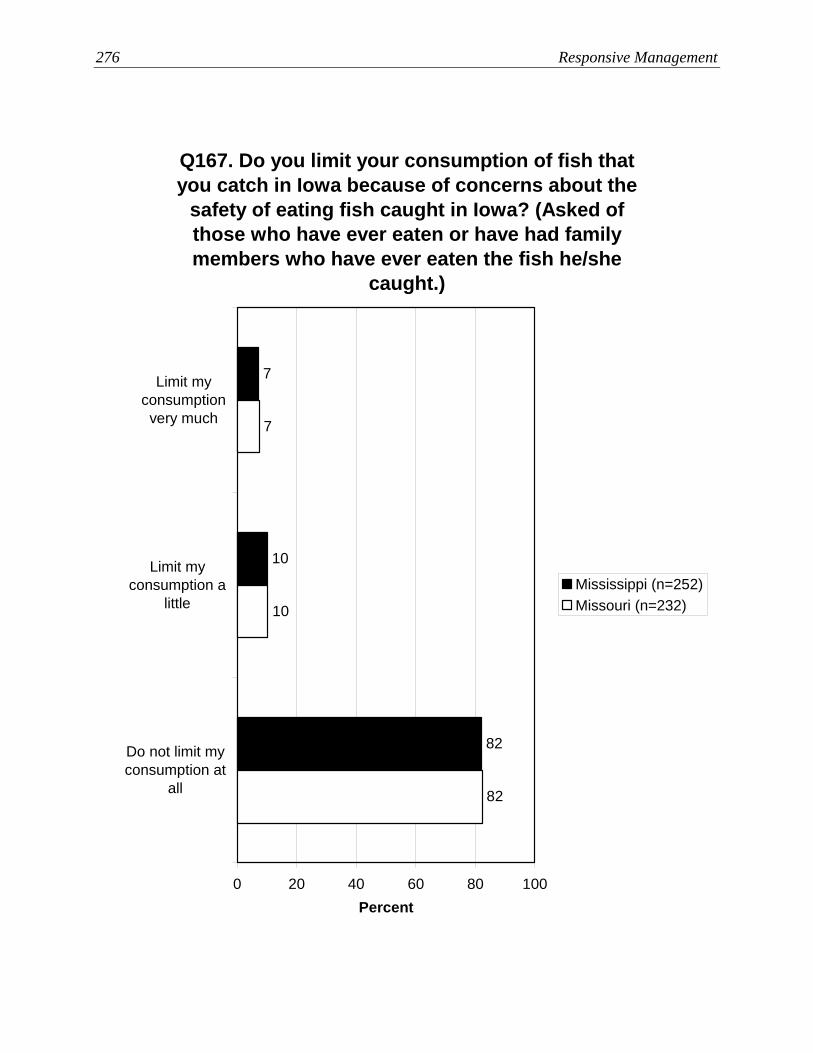
276 Responsive Management
Q167. Do you limit your consumption of fish that you catch in Iowa because of concerns about the
safety of eating fish caught in Iowa? (Asked of those who have ever eaten or have had family members who have ever eaten the fish he/she
caught.)
82
10
7
82
10
7
0 20 40 60 80 100
Limit myconsumptionvery much
Limit myconsumption a
little
Do not limit myconsumption at
all
Percent
Mississippi (n=252)Missouri (n=232)
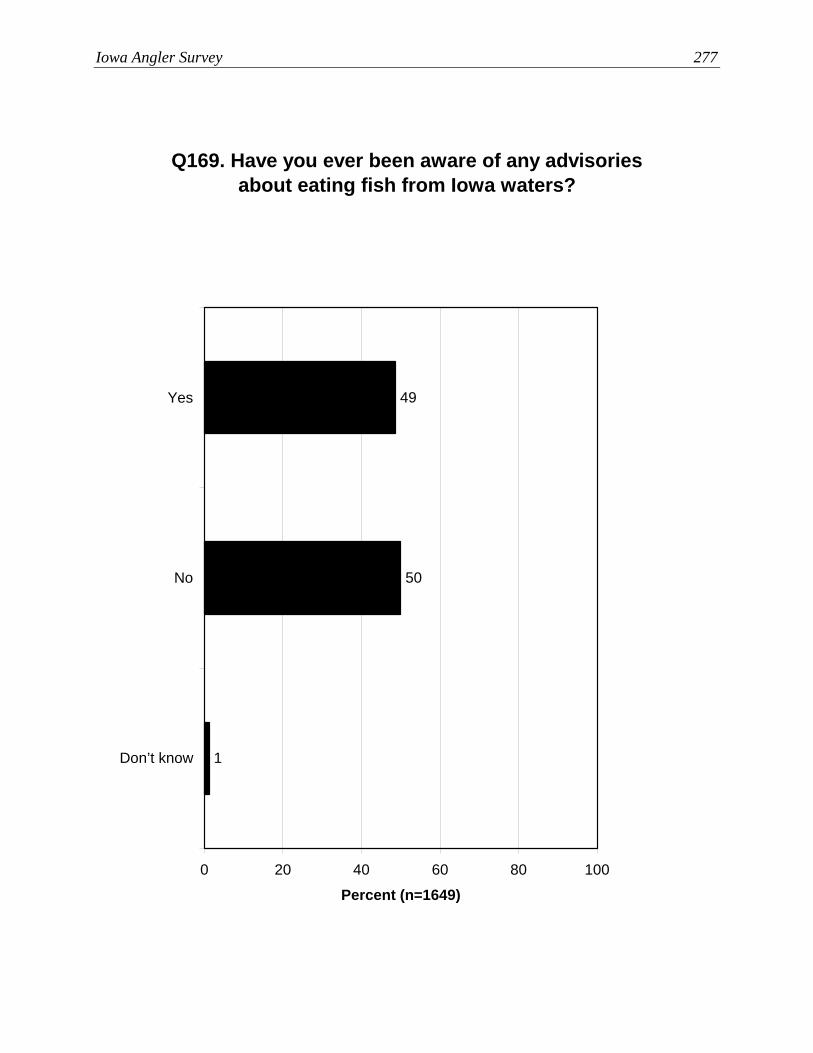
Iowa Angler Survey 277
Q169. Have you ever been aware of any advisories about eating fish from Iowa waters?
1
50
49
0 20 40 60 80 100
Yes
No
Don’t know
Percent (n=1649)

278 Responsive Management
Q169. Have you ever been aware of any advisories about eating fish from Iowa waters?
1
53
46
1
43
55
0 20 40 60 80 100
Yes
No
Don’t know
Percent
Casual angler (n=807)Avid angler (n=842)
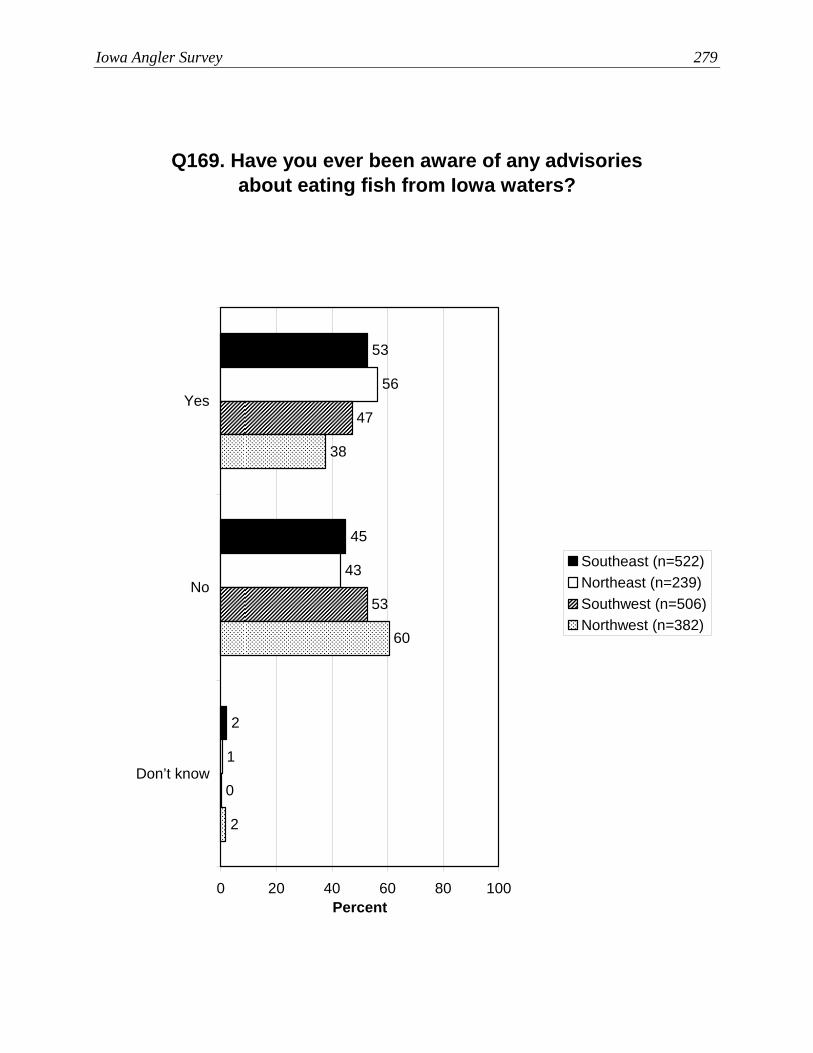
Iowa Angler Survey 279
Q169. Have you ever been aware of any advisories about eating fish from Iowa waters?
2
45
53
1
43
56
47
53
0
38
60
2
0 20 40 60 80 100
Yes
No
Don’t know
Percent
Southeast (n=522)Northeast (n=239)Southwest (n=506)Northwest (n=382)

280 Responsive Management
Q169. Have you ever been aware of any advisories about eating fish from Iowa waters?
2
42
56
1
69
31
0 20 40 60 80 100
Yes
No
Don’t know
Percent
Mississippi (n=291)Missouri (n=302)

Iowa Angler Survey 281
SOURCES OF INFORMATION ABOUT FISHING IN IOWA When asked directly about whether they had ever visited the IDNR’s website, 41% of Iowa
anglers indicated that they had visited the site. Just more than half of those respondents
visited the site for a fishing-related reason.
• The crosstabulation by avid versus casual angler found that avid anglers are more likely
to have visited the website, and they are more likely to have done so for a fishing-related
reason.
• The regional crosstabulation found that Southwest Region anglers are the most likely to
have visited the IDNR website, and Northwest Region anglers are the least likely. The
regional crosstabulation results regarding whether the visit to the website was for
something related to fishing is shown, as well.
• The data analysis by river region found no marked differences in website visiting
between anglers overall and anglers from the river regions.
• Commonly sought information includes fishing locations and regulations (the two
answers markedly higher than the others), as well as the site’s fishing reports, license
information, fishing survey reports, and stocking reports.
• Relative to casual anglers, avid anglers were more likely to have sought fishing reports
on the website.
• The results of the regional crosstabulation indicate that Northwest Region anglers,
relative to other anglers, more often sought information about the regulations. Also,
eastern anglers more often sought stocking reports than did western anglers, and western
anglers more often sought fishing reports than did eastern anglers.
• Missouri River Region anglers more often sought information on fishing locations and
hotspots than did anglers overall. This is the most marked difference between anglers
overall and the river region anglers.
• About 1 in 10 of those going to the site for a fishing-related reason bought a license
on-line.
• Avid and casual anglers are about the same regarding their purpose for going to the site.
• Northeast Region and Southwest Region anglers slightly more often bought a fishing
license on-line, relative to the other regions’ anglers.

282 Responsive Management
• The data analysis by river region found no marked differences between anglers overall
and anglers from either river region on this question.
• Other common sources of information among all anglers include word-of-mouth (34%),
IDNR publications (21%), the IDNR website (15%), other publications (12%), magazines
not otherwise listed (12%), Iowa Game & Fish magazine (10%), newspapers (10%), and
Iowa Outdoors magazine (8%).
• The crosstabulation by avid versus casual angler found that casual anglers more often get
information by word-of-mouth relative to avid anglers. On the other hand, avid anglers
more often get information from the IDNR website and IDNR publications.
• The regional crosstabulation shows no marked differences among the regions on this
question.
• It appears that the river region anglers get information from word-of-mouth more often
than do anglers overall. There is little difference between the two river regions.
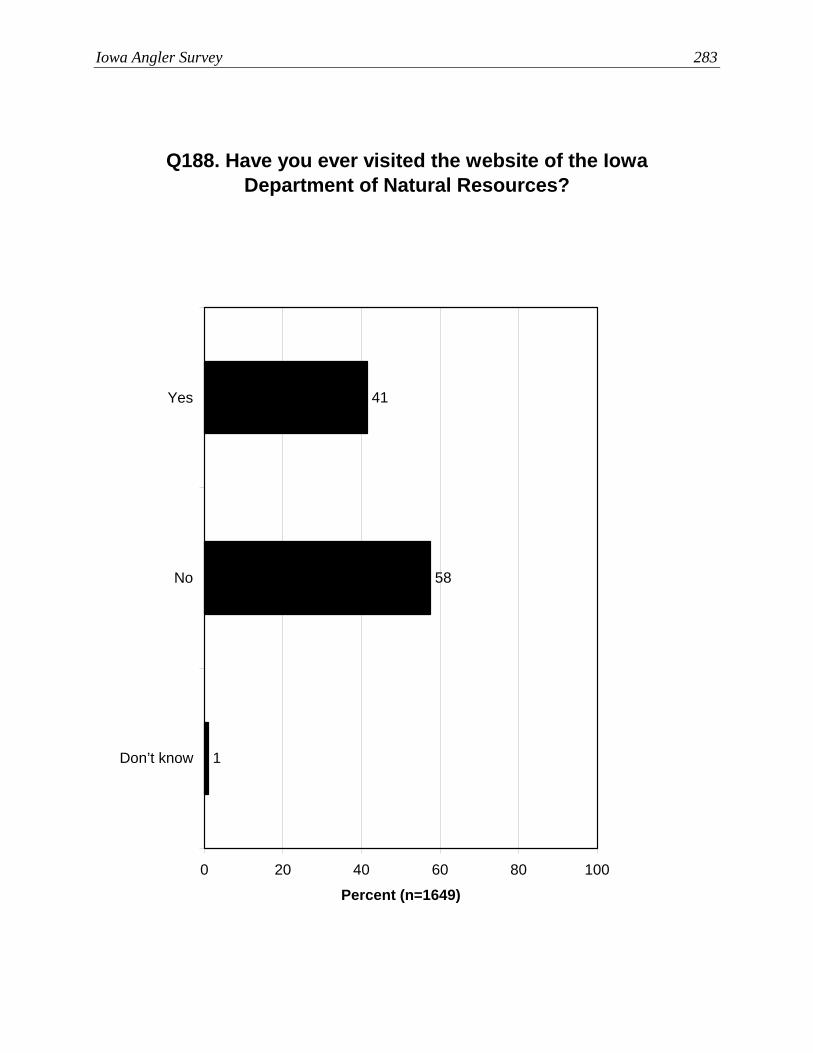
Iowa Angler Survey 283
Q188. Have you ever visited the website of the Iowa Department of Natural Resources?
1
58
41
0 20 40 60 80 100
Yes
No
Don’t know
Percent (n=1649)
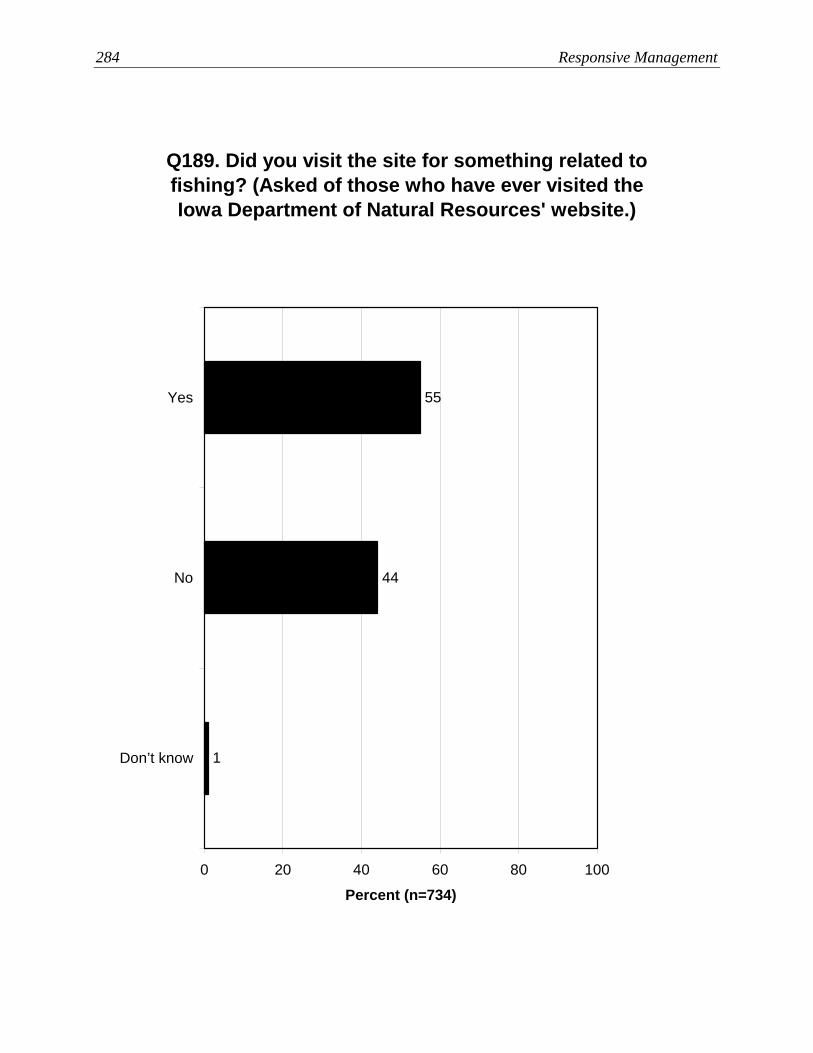
284 Responsive Management
Q189. Did you visit the site for something related to fishing? (Asked of those who have ever visited the Iowa Department of Natural Resources' website.)
1
44
55
0 20 40 60 80 100
Yes
No
Don’t know
Percent (n=734)
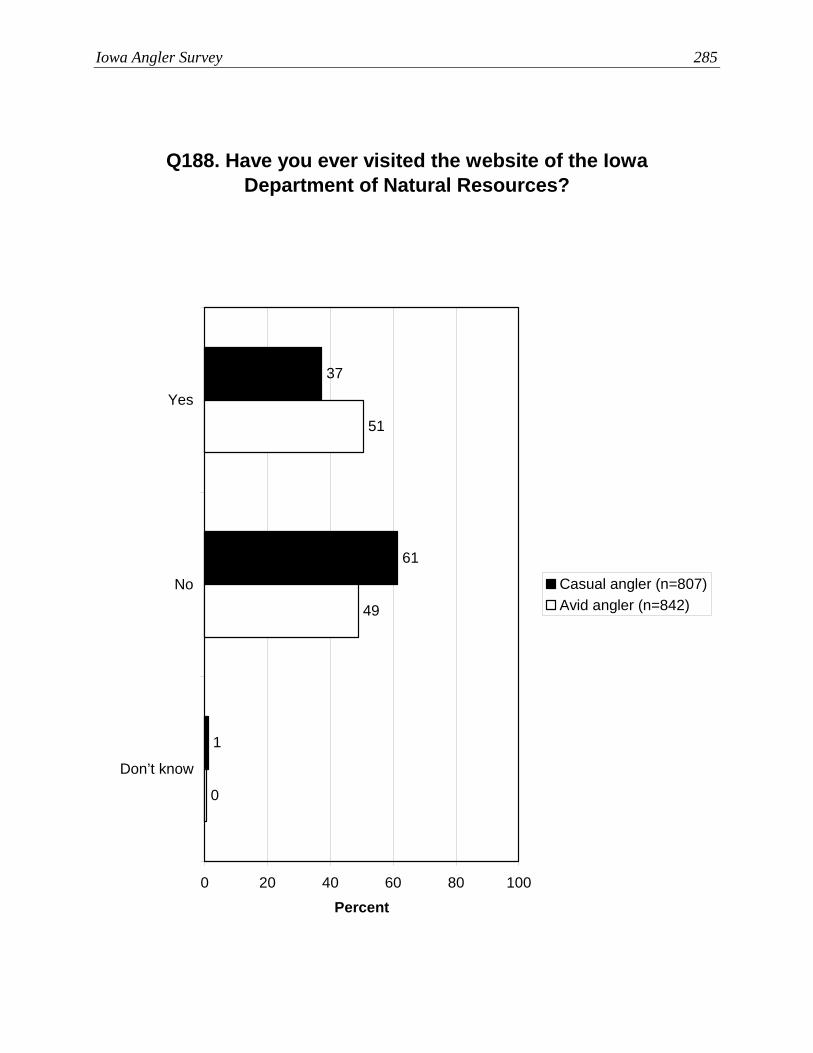
Iowa Angler Survey 285
Q188. Have you ever visited the website of the Iowa Department of Natural Resources?
1
61
37
0
49
51
0 20 40 60 80 100
Yes
No
Don’t know
Percent
Casual angler (n=807)Avid angler (n=842)
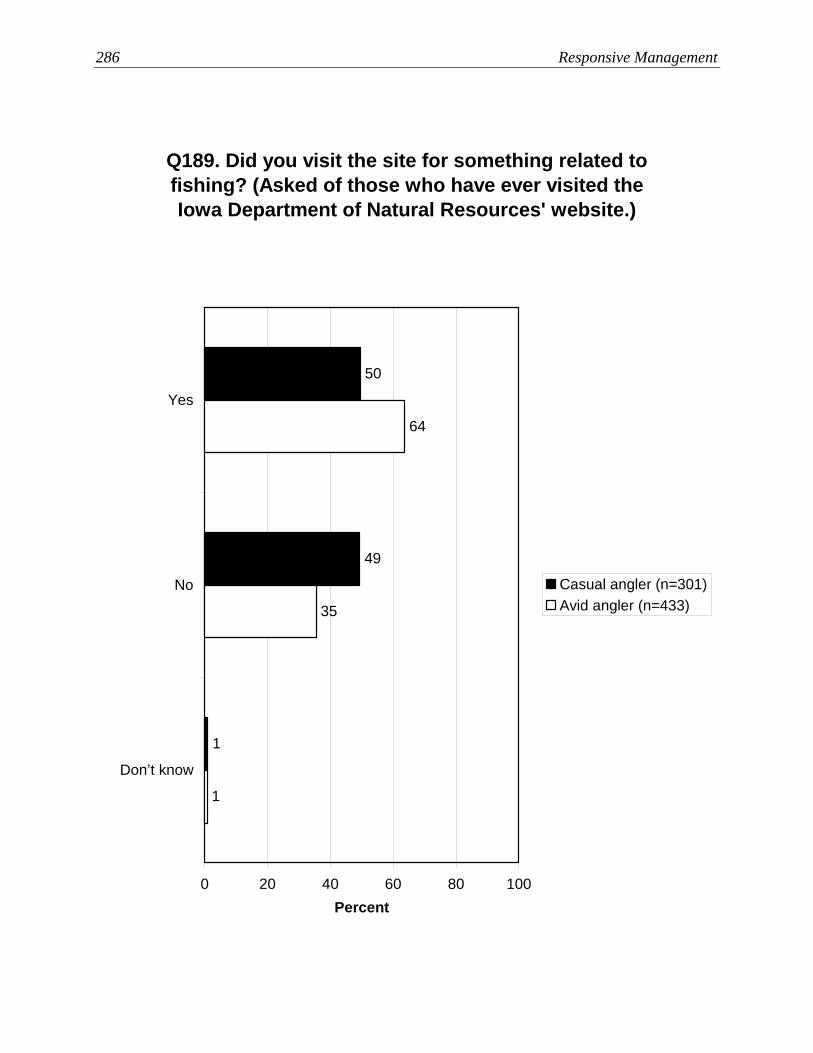
286 Responsive Management
Q189. Did you visit the site for something related to fishing? (Asked of those who have ever visited the Iowa Department of Natural Resources' website.)
1
49
50
1
35
64
0 20 40 60 80 100
Yes
No
Don’t know
Percent
Casual angler (n=301)Avid angler (n=433)

Iowa Angler Survey 287
Q188. Have you ever visited the website of the Iowa Department of Natural Resources?
1
58
41
1
59
40
48
51
1
34
65
2
0 20 40 60 80 100
Yes
No
Don’t know
Percent
Southeast (n=522)Northeast (n=239)Southwest (n=506)Northwest (n=382)

288 Responsive Management
Q189. Did you visit the site for something related to fishing? (Asked of those who have ever visited the Iowa Department of Natural Resources' website.)
0
36
63
0
49
51
52
46
2
48
51
1
0 20 40 60 80 100
Yes
No
Don’t know
Percent
Southeast (n=242)Northeast (n=99)Southwest (n=250)Northwest (n=143)

Iowa Angler Survey 289
Q188. Have you ever visited the website of the Iowa Department of Natural Resources?
2
61
37
1
57
42
0 20 40 60 80 100
Yes
No
Don’t know
Percent
Mississippi (n=291)Missouri (n=302)
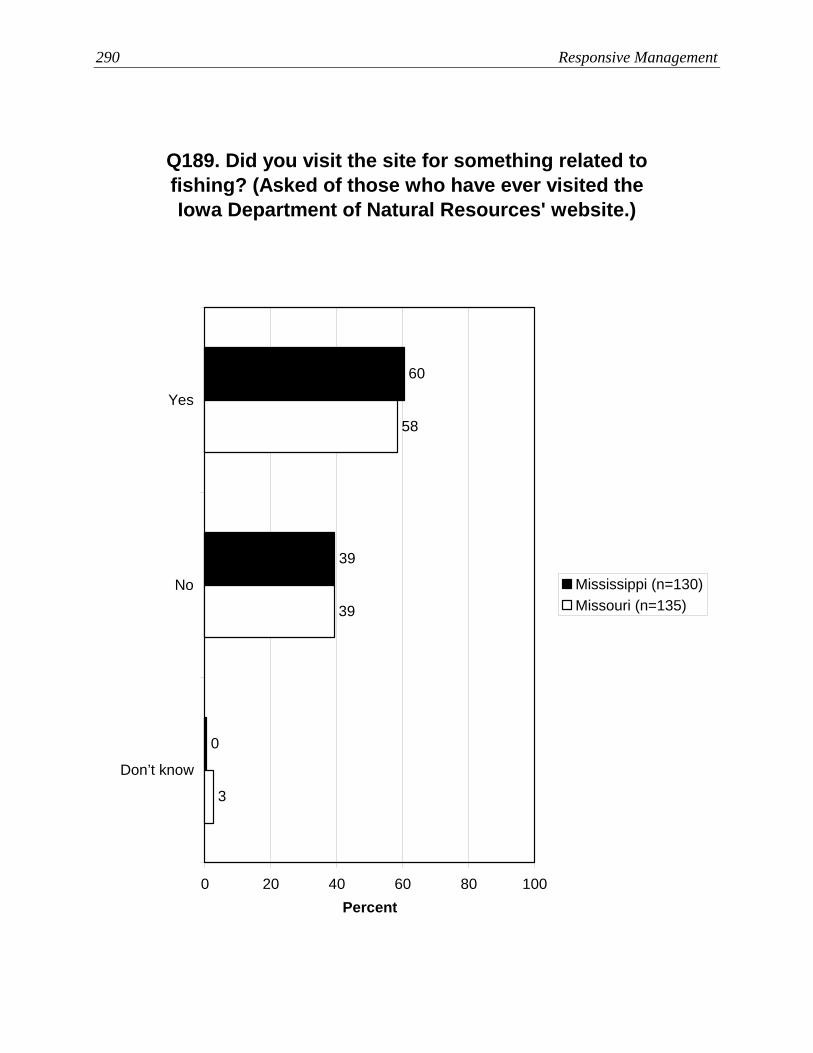
290 Responsive Management
Q189. Did you visit the site for something related to fishing? (Asked of those who have ever visited the Iowa Department of Natural Resources' website.)
0
39
60
3
39
58
0 20 40 60 80 100
Yes
No
Don’t know
Percent
Mississippi (n=130)Missouri (n=135)
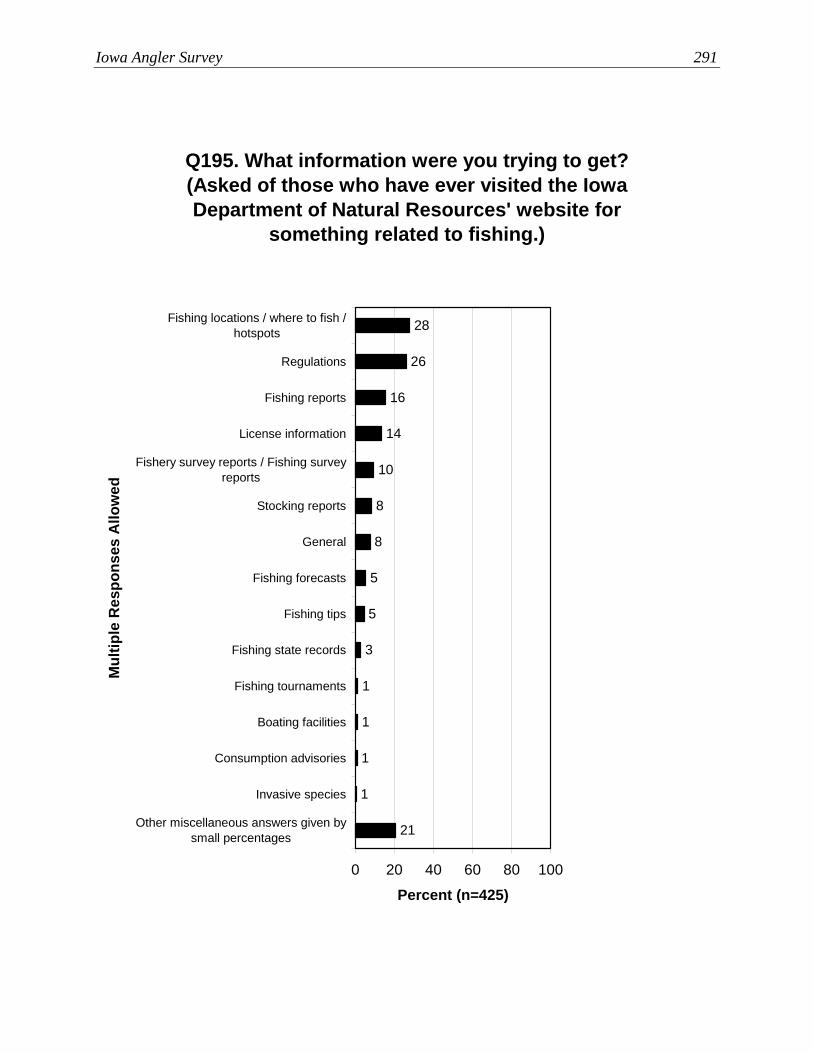
Iowa Angler Survey 291
Q195. What information were you trying to get? (Asked of those who have ever visited the Iowa Department of Natural Resources' website for
something related to fishing.)
21
1
1
1
1
3
8
10
14
16
26
28
8
5
5
0 20 40 60 80 100
Fishing locations / where to fish /hotspots
Regulations
Fishing reports
License information
Fishery survey reports / Fishing surveyreports
Stocking reports
General
Fishing forecasts
Fishing tips
Fishing state records
Fishing tournaments
Boating facilities
Consumption advisories
Invasive species
Other miscellaneous answers given bysmall percentages
Mul
tiple
Res
pons
es A
llow
ed
Percent (n=425)

292 Responsive Management
Q195. What information were you trying to get? (Asked of those who have ever visited the Iowa Department of Natural Resources' website for
something related to fishing.)
22
0
2
1
1
4
10
10
16
11
31
27
8
4
4
19
1
0
2
2
1
5
8
7
6
9
11
22
20
29
0 20 40 60 80 100
Fishing locations / where to fish /hotspots
Regulations
Fishing reports
License information
Fishery survey reports / Fishingsurvey reports
Stocking reports
General
Fishing forecasts
Fishing tips
Fishing state records
Fishing tournaments
Boating facilities
Consumption advisories
Invasive species
Other
Mul
tiple
Res
pons
es A
llow
ed
Percent
Casual angler (n=150)Avid angler (n=275)
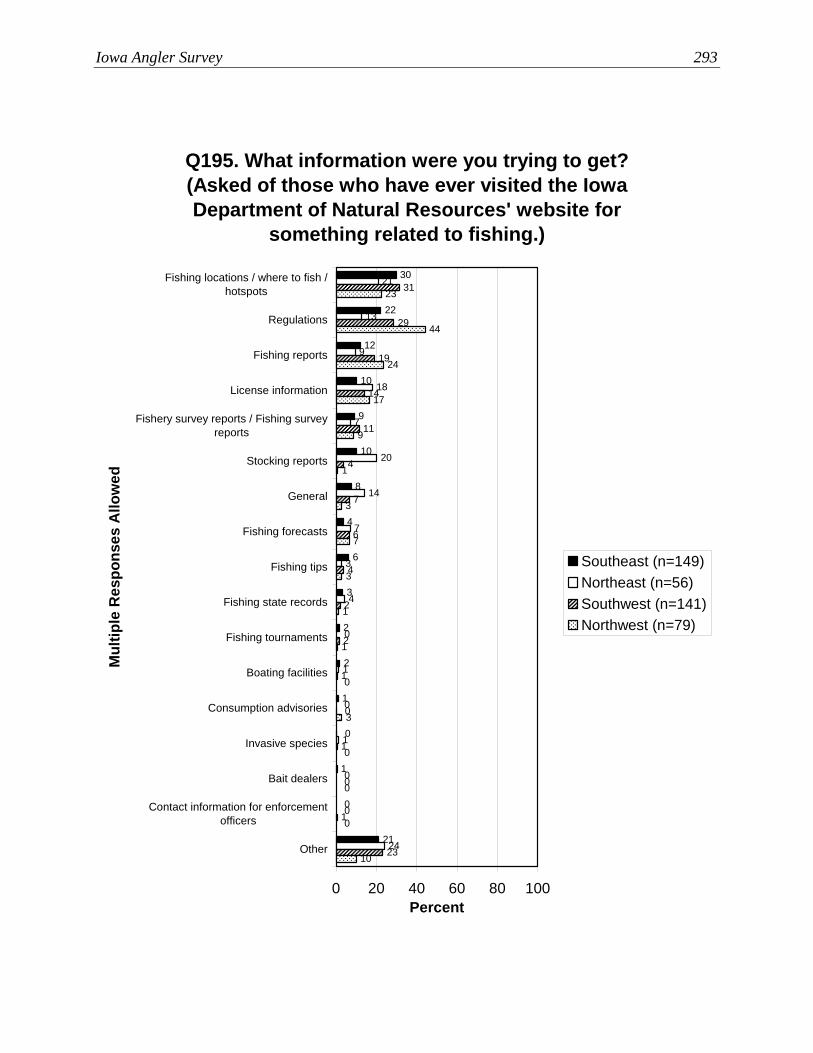
Iowa Angler Survey 293
Q195. What information were you trying to get? (Asked of those who have ever visited the Iowa Department of Natural Resources' website for
something related to fishing.)
21
0
1
0
1
2
2
3
10
9
10
12
22
30
8
4
6
24
0
0
1
0
1
0
4
3
7
14
20
7
18
9
13
21
23
1
0
1
0
1
2
2
4
6
7
4
11
14
31
29
19
10
0
0
0
3
0
1
1
3
7
3
1
9
17
23
44
24
0 20 40 60 80 100
Fishing locations / where to fish /hotspots
Regulations
Fishing reports
License information
Fishery survey reports / Fishing surveyreports
Stocking reports
General
Fishing forecasts
Fishing tips
Fishing state records
Fishing tournaments
Boating facilities
Consumption advisories
Invasive species
Bait dealers
Contact information for enforcementofficers
Other
Mul
tiple
Res
pons
es A
llow
ed
Percent
Southeast (n=149)Northeast (n=56)Southwest (n=141)Northwest (n=79)
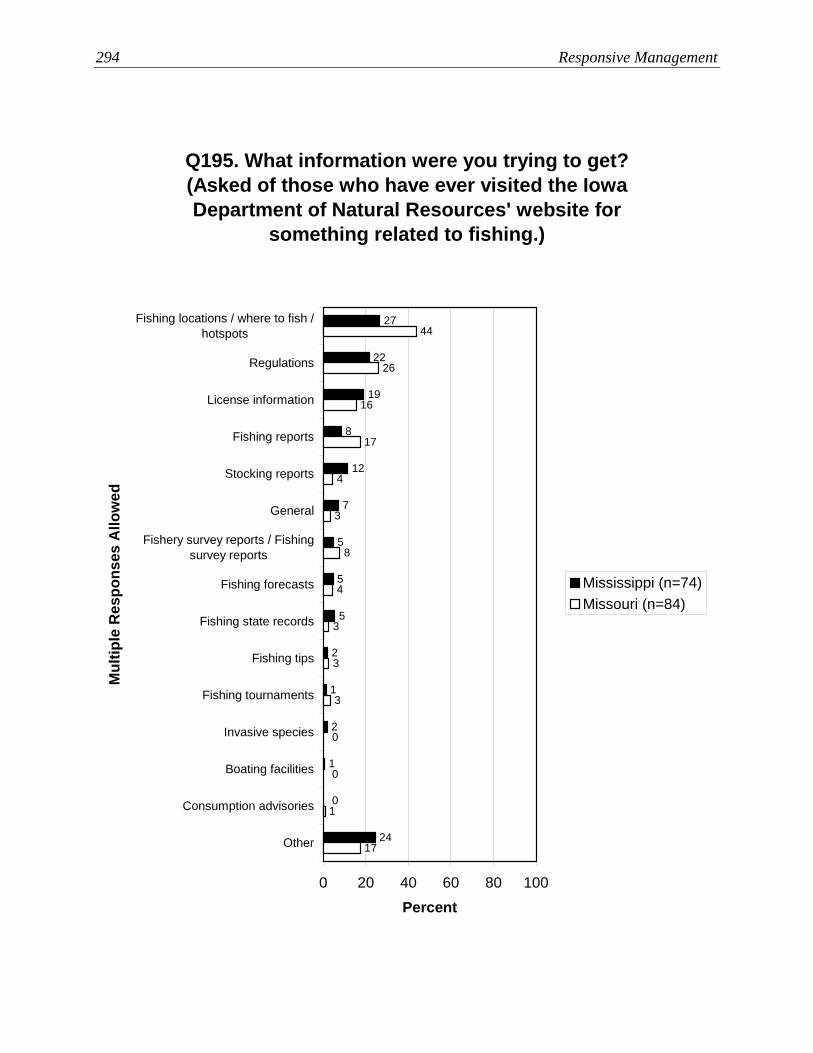
294 Responsive Management
Q195. What information were you trying to get? (Asked of those who have ever visited the Iowa Department of Natural Resources' website for
something related to fishing.)
24
0
1
2
1
2
7
12
8
19
22
27
5
5
5
17
1
0
0
3
3
3
4
8
3
4
17
16
26
44
0 20 40 60 80 100
Fishing locations / where to fish /hotspots
Regulations
License information
Fishing reports
Stocking reports
General
Fishery survey reports / Fishingsurvey reports
Fishing forecasts
Fishing state records
Fishing tips
Fishing tournaments
Invasive species
Boating facilities
Consumption advisories
Other
Mul
tiple
Res
pons
es A
llow
ed
Percent
Mississippi (n=74)Missouri (n=84)

Iowa Angler Survey 295
Q192. Why did you visit the site? (Asked of those who have ever visited the Iowa Department of
Natural Resources' website for something related to fishing.)
2
9
10
83
0 20 40 60 80 100
To getinformation
about fishing
To purchase alicense
Other
Don't know
Mul
tiple
Res
pons
es A
llow
ed
Percent (n=425)
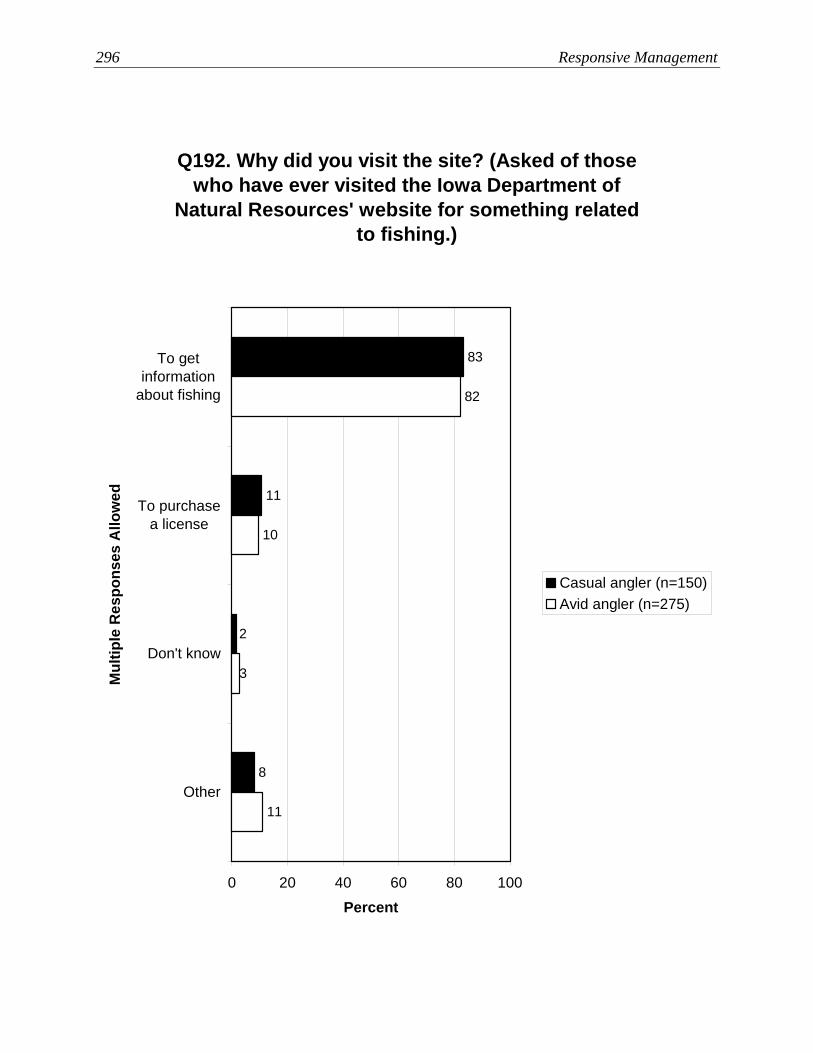
296 Responsive Management
Q192. Why did you visit the site? (Asked of those who have ever visited the Iowa Department of
Natural Resources' website for something related to fishing.)
8
2
11
83
11
3
10
82
0 20 40 60 80 100
To getinformation
about fishing
To purchasea license
Don't know
Other
Mul
tiple
Res
pons
es A
llow
ed
Percent
Casual angler (n=150)Avid angler (n=275)

Iowa Angler Survey 297
Q192. Why did you visit the site? (Asked of those who have ever visited the Iowa Department of
Natural Resources' website for something related to fishing.)
3
0
6
84
1
0
14
77
2
82
15
0
1
88
5
1
0 20 40 60 80 100
To get informationabout fishing
To purchase alicense
To apply for apermit to conduct
a fishingtournament
Don't know
Mul
tiple
Res
pons
es A
llow
ed
Percent
Southeast (n=149)Northeast (n=56)Southwest (n=141)Northwest (n=79)
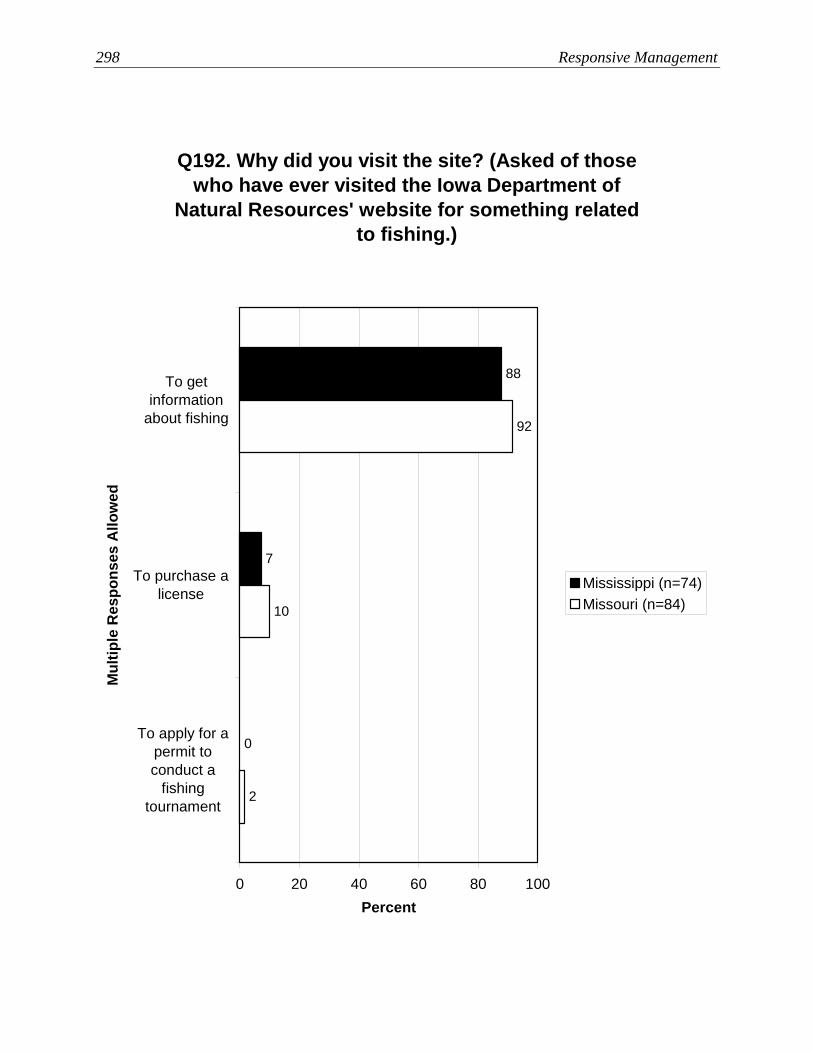
298 Responsive Management
Q192. Why did you visit the site? (Asked of those who have ever visited the Iowa Department of
Natural Resources' website for something related to fishing.)
0
7
88
2
10
92
0 20 40 60 80 100
To getinformation
about fishing
To purchase alicense
To apply for apermit toconduct a
fishingtournament
Mul
tiple
Res
pons
es A
llow
ed
Percent
Mississippi (n=74)Missouri (n=84)
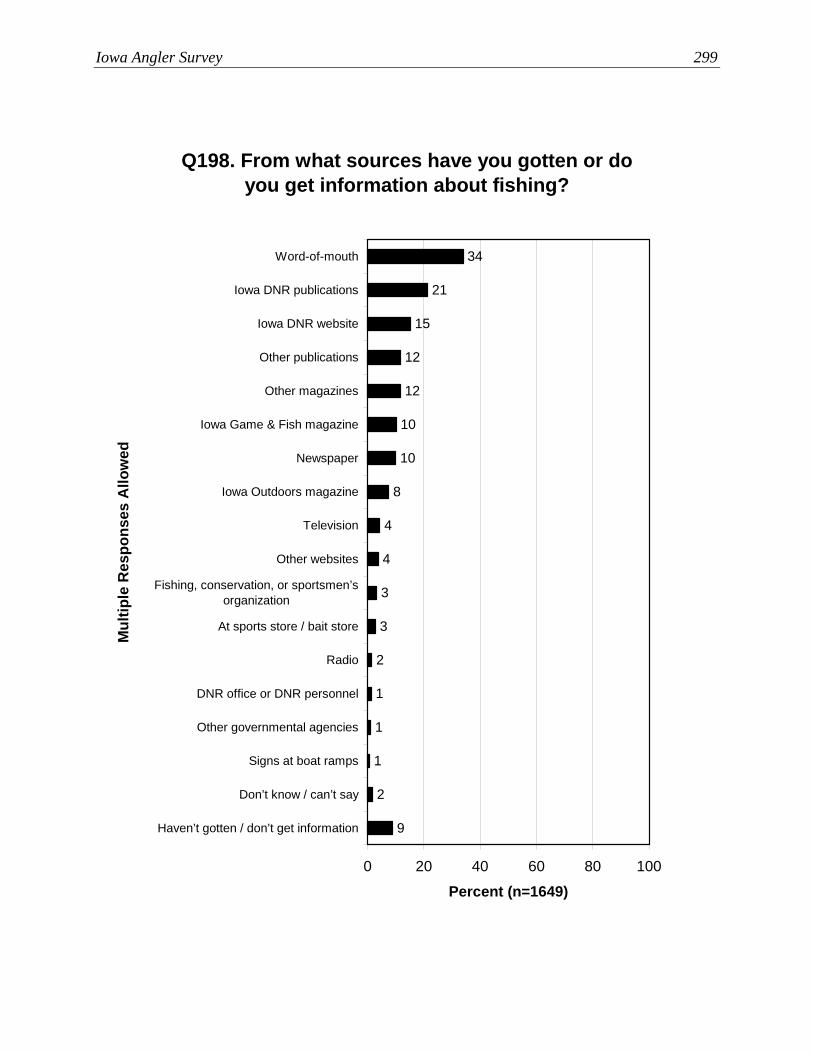
Iowa Angler Survey 299
Q198. From what sources have you gotten or do you get information about fishing?
9
2
1
1
1
2
3
3
4
10
12
12
15
21
34
10
8
4
0 20 40 60 80 100
Word-of-mouth
Iowa DNR publications
Iowa DNR website
Other publications
Other magazines
Iowa Game & Fish magazine
Newspaper
Iowa Outdoors magazine
Television
Other websites
Fishing, conservation, or sportsmen’sorganization
At sports store / bait store
Radio
DNR office or DNR personnel
Other governmental agencies
Signs at boat ramps
Don’t know / can’t say
Haven’t gotten / don’t get information
Mul
tiple
Res
pons
es A
llow
ed
Percent (n=1649)
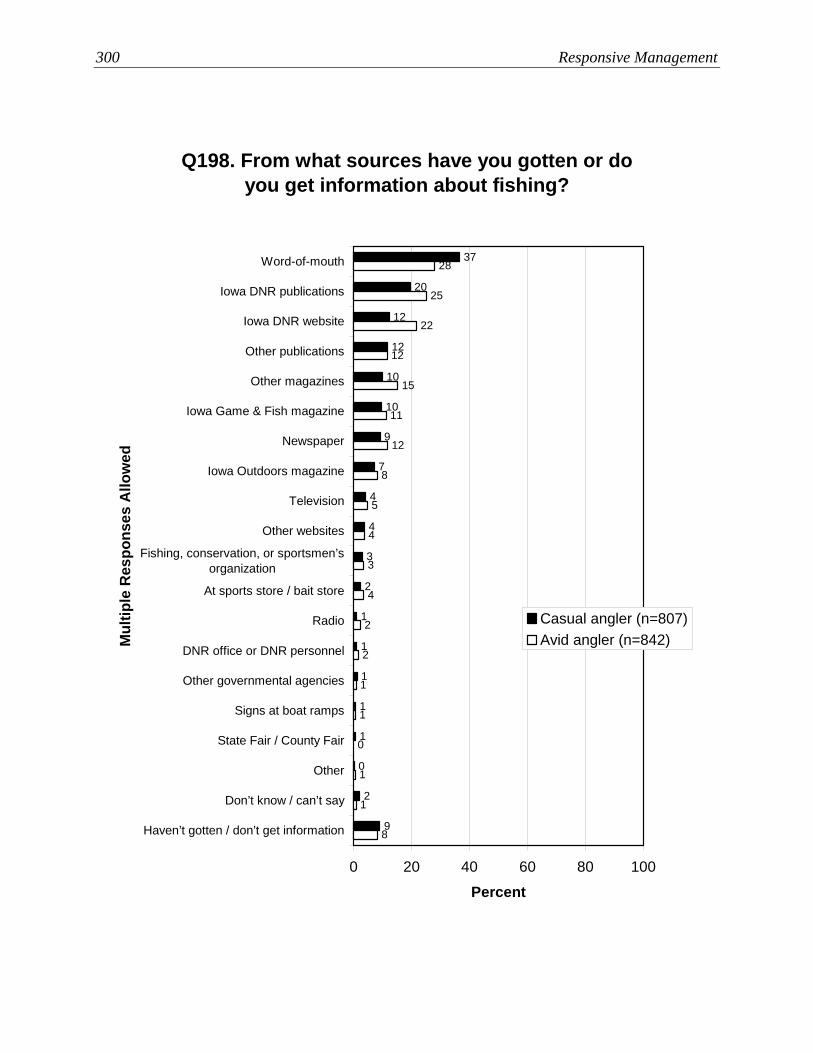
300 Responsive Management
Q198. From what sources have you gotten or do you get information about fishing?
9
2
0
1
1
1
1
1
2
3
4
10
10
12
12
20
37
9
7
4
8
1
1
0
1
1
2
2
4
3
4
5
8
12
11
15
12
22
25
28
0 20 40 60 80 100
Word-of-mouth
Iowa DNR publications
Iowa DNR website
Other publications
Other magazines
Iowa Game & Fish magazine
Newspaper
Iowa Outdoors magazine
Television
Other websites
Fishing, conservation, or sportsmen’sorganization
At sports store / bait store
Radio
DNR office or DNR personnel
Other governmental agencies
Signs at boat ramps
State Fair / County Fair
Other
Don’t know / can’t say
Haven’t gotten / don’t get information
Mul
tiple
Res
pons
es A
llow
ed
Percent
Casual angler (n=807)Avid angler (n=842)

Iowa Angler Survey 301
Q198. From what sources have you gotten or do you get information about fishing?
(Part 1)
2
3
4
11
12
11
17
21
34
10
9
5
2
5
3
3
7
11
10
10
12
13
20
36
4
3
5
5
7
7
11
12
13
31
26
18
3
2
2
5
7
12
7
12
11
36
17
10
0 20 40 60 80 100
Word-of-mouth
Iowa DNR publications
Iowa DNR website
Other publications
Other magazines
Iowa Game & Fish magazine
Newspaper
Iowa Outdoors magazine
Television
Other websites
Fishing, conservation, or sportsmen’sorganization
At sports store / bait store
Mul
tiple
Res
pons
es A
llow
ed
Percent
Southeast (n=522)Northeast (n=239)Southwest (n=506)Northwest (n=382)
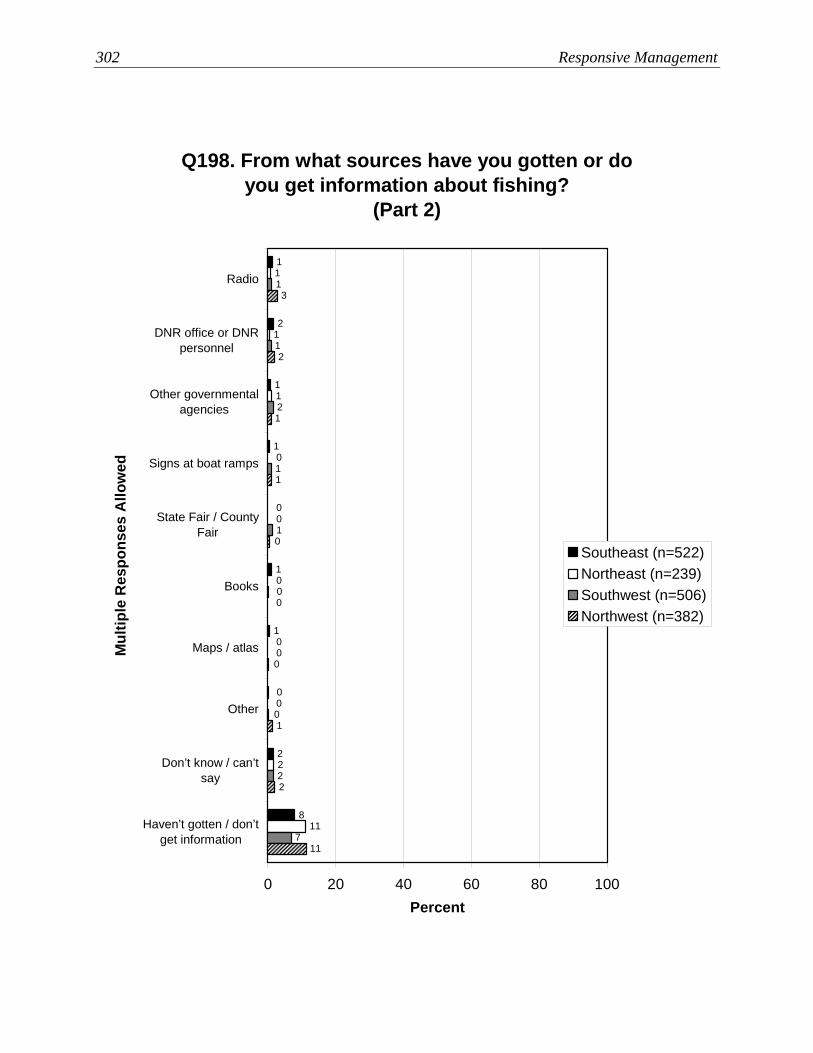
302 Responsive Management
Q198. From what sources have you gotten or do you get information about fishing?
(Part 2)
8
1
0
1
1
2
1
1
0
2
11
2
0
0
0
0
0
1
1
1
7
2
0
0
0
1
1
1
1
2
11
2
1
0
0
0
1
3
2
1
0 20 40 60 80 100
Radio
DNR office or DNRpersonnel
Other governmentalagencies
Signs at boat ramps
State Fair / CountyFair
Books
Maps / atlas
Other
Don’t know / can’tsay
Haven’t gotten / don’tget information
Mul
tiple
Res
pons
es A
llow
ed
Percent
Southeast (n=522)Northeast (n=239)Southwest (n=506)Northwest (n=382)

Iowa Angler Survey 303
Q198. From what sources have you gotten or do you get information about fishing?
10
2
0
0
1
2
1
2
3
2
3
9
10
11
14
26
40
7
5
4
10
0
1
1
1
0
3
0
2
4
5
5
6
8
9
12
10
17
21
39
0 20 40 60 80 100
Word-of-mouth
Iowa DNR publications
Iowa DNR website
Other magazines
Other publications
Newspaper
Iowa Game & Fish magazine
Iowa Outdoors magazine
Television
Other websites
At sports store / bait store
Fishing, conservation, or sportsmen’sorganization
Radio
DNR office or DNR personnel
Books
Other governmental agencies
Signs at boat ramps
Other
Don’t know / can’t say
Haven’t gotten / don’t get information
Mul
tiple
Res
pons
es A
llow
ed
Percent
Mississippi (n=291)Missouri (n=302)
304 Responsive Management
MISCELLANEOUS ISSUES PERTAINING TO FISHING IN IOWA URBAN TROUT FISHERIES
Of those who fished for trout, about half (48%) purchased a trout stamp specifically for an
urban trout fishery.
• The crosstabulation by avid versus casual angler found almost no difference on this
question.
• In the regional crosstabulation, anglers from both eastern regions are more likely to have
bought a trout stamp specifically for an urban trout fishery, relative to the western
regions’ anglers.

Iowa Angler Survey 305
Q80. Did you purchase a trout stamp specifically for an urban trout fishery? (Asked of those who
have fished for trout.)
6
46
48
0 20 40 60 80 100
Yes
No
Don’t know
Percent (n=147)

306 Responsive Management
Q80. Did you purchase a trout stamp specifically for an urban trout fishery? (Asked of those who
have fished for trout.)
6
44
49
6
50
44
0 20 40 60 80 100
Yes
No
Don’t know
Percent
Casual angler (n=69)Avid angler (n=78)
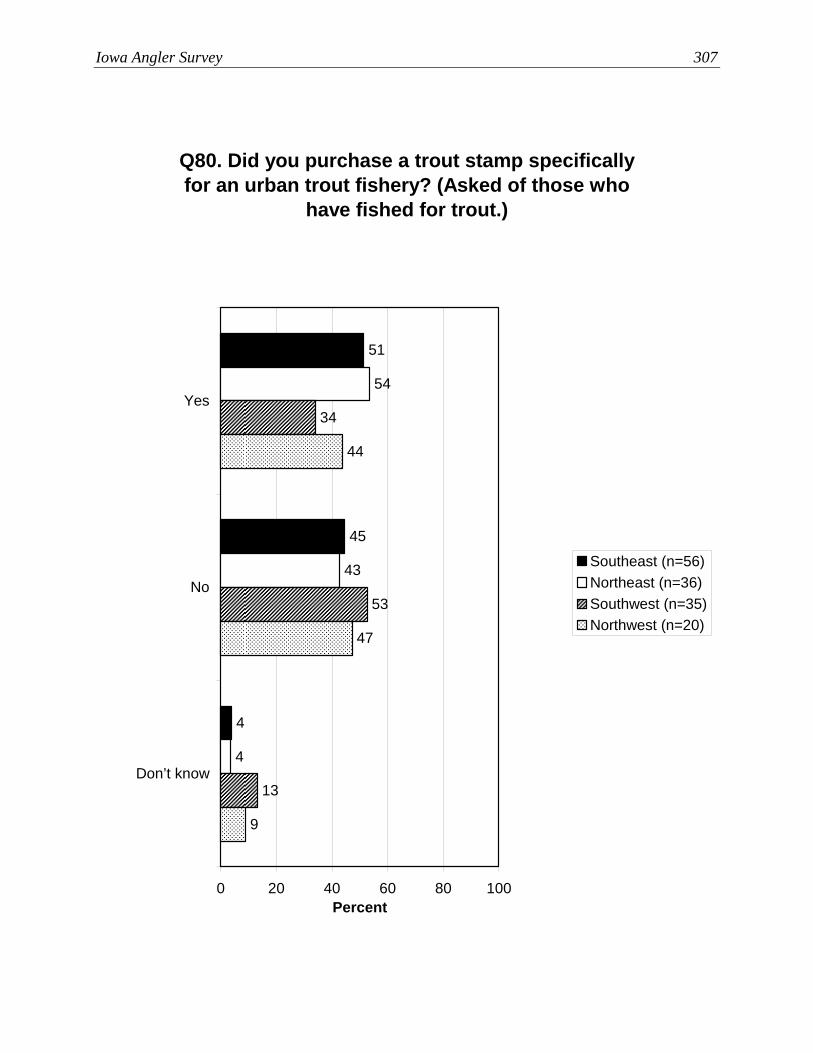
Iowa Angler Survey 307
Q80. Did you purchase a trout stamp specifically for an urban trout fishery? (Asked of those who
have fished for trout.)
4
45
51
4
43
54
34
53
13
44
47
9
0 20 40 60 80 100
Yes
No
Don’t know
Percent
Southeast (n=56)Northeast (n=36)Southwest (n=35)Northwest (n=20)
308 Responsive Management
AWARENESS OF LAKE PROTECTION OR IMPROVEMENT EFFORTS IN IOWA Just more than a third of Iowa anglers (37%) are aware of at least one lake protection or
improvement effort undertaken in Iowa by the IDNR.
• Avid anglers are more aware than are casual anglers of lake protection or improvement
efforts undertaken in Iowa by the IDNR.
• The regional crosstabulation found that Southwest Region anglers are the most aware of
lake protection/improvement efforts, while Northeast Region anglers are the least aware.
• The data analysis by river region found that river region anglers are less aware of lake
protection and improvement projects than are anglers overall.
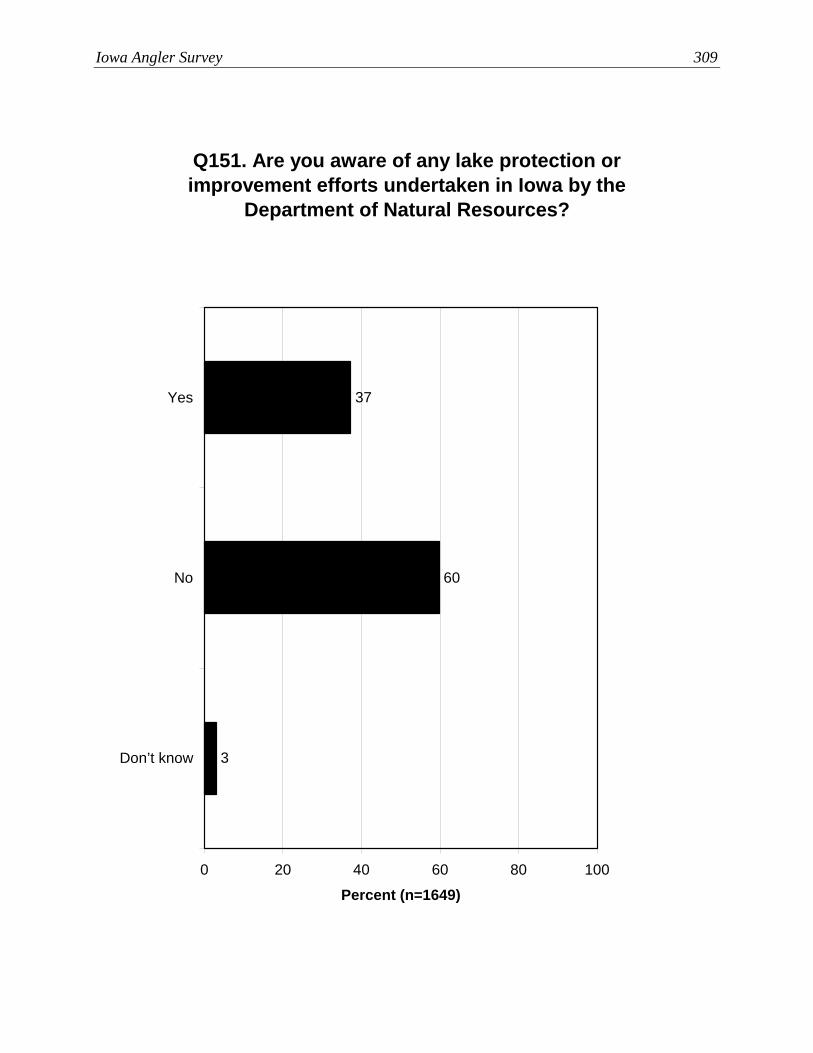
Iowa Angler Survey 309
Q151. Are you aware of any lake protection or improvement efforts undertaken in Iowa by the
Department of Natural Resources?
3
60
37
0 20 40 60 80 100
Yes
No
Don’t know
Percent (n=1649)

310 Responsive Management
Q151. Are you aware of any lake protection or improvement efforts undertaken in Iowa by the
Department of Natural Resources?
3
63
34
2
54
44
0 20 40 60 80 100
Yes
No
Don’t know
Percent
Casual angler (n=807)Avid angler (n=842)

Iowa Angler Survey 311
Q151. Are you aware of any lake protection or improvement efforts undertaken in Iowa by the
Department of Natural Resources?
3
61
36
4
70
27
45
53
1
37
59
4
0 20 40 60 80 100
Yes
No
Don’t know
Percent
Southeast (n=522)Northeast (n=239)Southwest (n=506)Northwest (n=382)

312 Responsive Management
Q151. Are you aware of any lake protection or improvement efforts undertaken in Iowa by the
Department of Natural Resources?
2
72
26
2
65
33
0 20 40 60 80 100
Yes
No
Don’t know
Percent
Mississippi (n=291)Missouri (n=302)

Iowa Angler Survey 313
AQUATIC INVASIVE SPECIES IN IOWA
While most Iowa anglers (60%) are unaware of any invasive species, a substantial percentage are aware of something: 22% mentioned zebra mussels, 9% mentioned carp or Asian carp, and 8% mentioned milfoil. • Avid anglers are more aware of invasive species than are casual anglers, particularly
zebra mussels and milfoil. • Northwest Region anglers are less aware of invasive species than anglers from the other
three regions, particularly zebra mussels. • Mississippi River Region anglers are more aware of zebra mussels than are anglers
overall. Missouri River Region anglers are less aware of zebra mussels compared to anglers overall.
• The majority of those who have fished from a boat and are aware of invasive species take steps to prevent the spread of invasive species. Those who did not take preventive steps most commonly said that they do not believe invasive species are a problem, that they did not boat on infested waters (as far as they knew...), or that they do not know what to do.
• Avid anglers who have fished from a boat and are aware of invasive species are more likely than their casual angler counterparts to take preventive action regarding spread of invasive species. Additionally, among those who do not take steps, avid anglers are less likely to say that they do not believe invasive species are a problem, and they are less likely to say that they do not know what to do, relative to casual anglers who do not take preventive steps.
• The regional crosstabulation results are shown, with only slight differences regarding being aware of invasive species (the second question regarding reasons for not taking action had sample sizes that were too low for meaningful analysis).
• The data analysis by river region found that river region anglers who boat and are aware of invasive species are about the same as anglers overall (who boat and are aware of invasive species) in saying that they do not take preventive steps (small percentages for all groups). Regarding taking preventive steps, Mississippi River Region anglers who boat and know about invasive species are less likely than anglers overall to say that they take preventive steps because Mississippi River Region anglers are less likely to move their boats. Missouri River Region anglers who boat and know about invasive species, on the other hand, are more likely than anglers overall to say that they take preventive actions, mostly because they are more likely to move their boats. (The second question regarding reasons for not taking action had sample sizes that were too low for meaningful analysis.)

314 Responsive Management
Q176. Are you aware of any aquatic invasive species in Iowa? If so, which ones?
4
6
8
9
22
60
0 20 40 60 80 100
Not aware of any aquatic invasivespecies
Zebra mussels
Carp or Asian carp
Milfoil or watermilfoil
Is aware that there are invasivespecies, but can’t name them
Named something not on list
Mul
tiple
Res
pons
es A
llow
ed
Percent (n=1649)
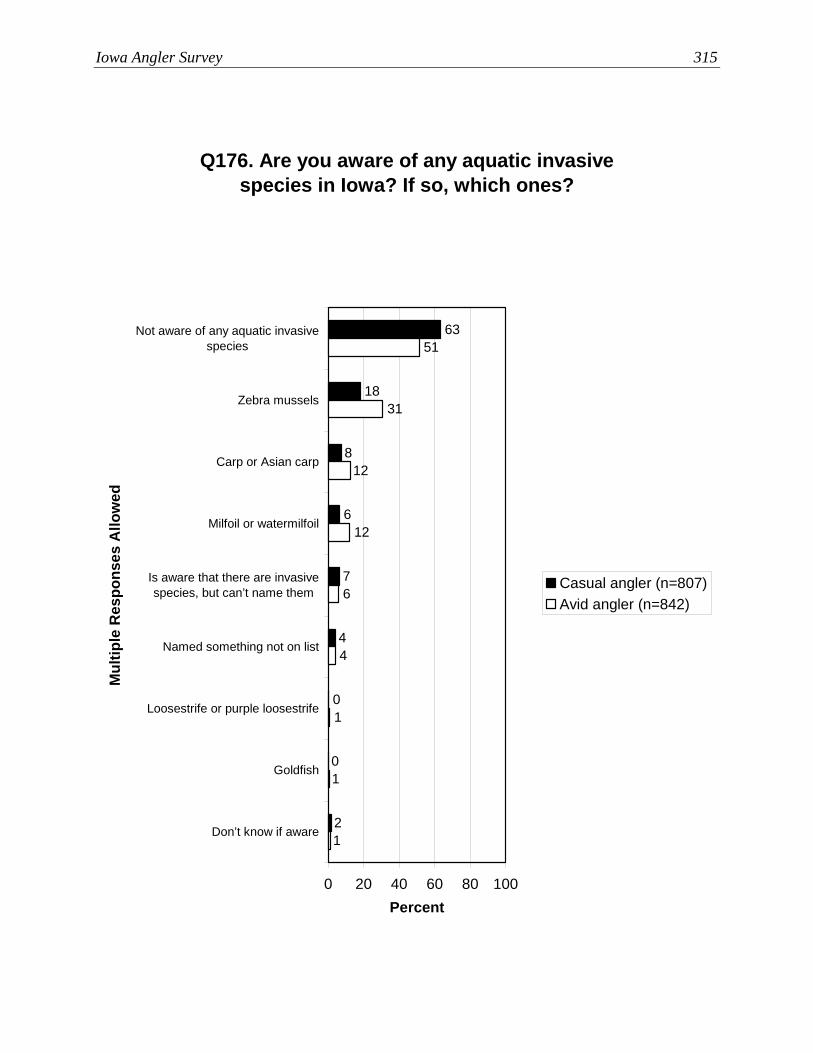
Iowa Angler Survey 315
Q176. Are you aware of any aquatic invasive species in Iowa? If so, which ones?
4
7
6
8
18
63
0
0
21
1
1
4
6
12
12
31
51
0 20 40 60 80 100
Not aware of any aquatic invasivespecies
Zebra mussels
Carp or Asian carp
Milfoil or watermilfoil
Is aware that there are invasivespecies, but can’t name them
Named something not on list
Loosestrife or purple loosestrife
Goldfish
Don’t know if aware
Mul
tiple
Res
pons
es A
llow
ed
Percent
Casual angler (n=807)Avid angler (n=842)
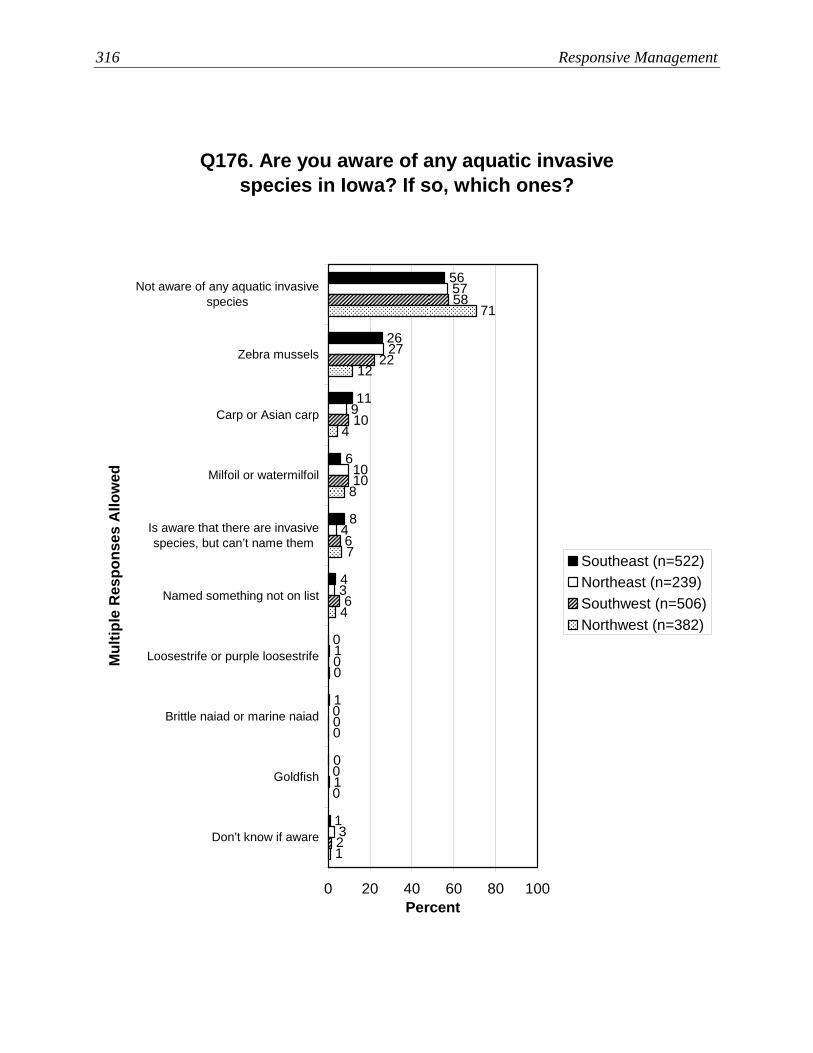
316 Responsive Management
Q176. Are you aware of any aquatic invasive species in Iowa? If so, which ones?
1
4
8
6
11
26
56
0
1
0
3
0
0
1
3
4
10
9
27
57
2
1
0
0
6
6
10
58
22
10
1
0
0
0
4
7
8
71
12
4
0 20 40 60 80 100
Not aware of any aquatic invasivespecies
Zebra mussels
Carp or Asian carp
Milfoil or watermilfoil
Is aware that there are invasivespecies, but can’t name them
Named something not on list
Loosestrife or purple loosestrife
Brittle naiad or marine naiad
Goldfish
Don’t know if aware
Mul
tiple
Res
pons
es A
llow
ed
Percent
Southeast (n=522)Northeast (n=239)Southwest (n=506)Northwest (n=382)

Iowa Angler Survey 317
Q176. Are you aware of any aquatic invasive species in Iowa? If so, which ones?
3
5
7
18
32
51
1
1
01
0
1
4
9
7
10
10
68
0 20 40 60 80 100
Not aware of anyaquatic invasive
species
Zebra mussels
Carp or Asiancarp
Is aware thatthere are invasivespecies, but can’t
name them
Milfoil orwatermilfoil
Named somethingnot on list
Brittle naiad ormarine naiad
Loosestrife orpurple loosestrife
Goldfish
Mul
tiple
Res
pons
es A
llow
ed
Percent
Mississippi (n=291)Missouri (n=302)
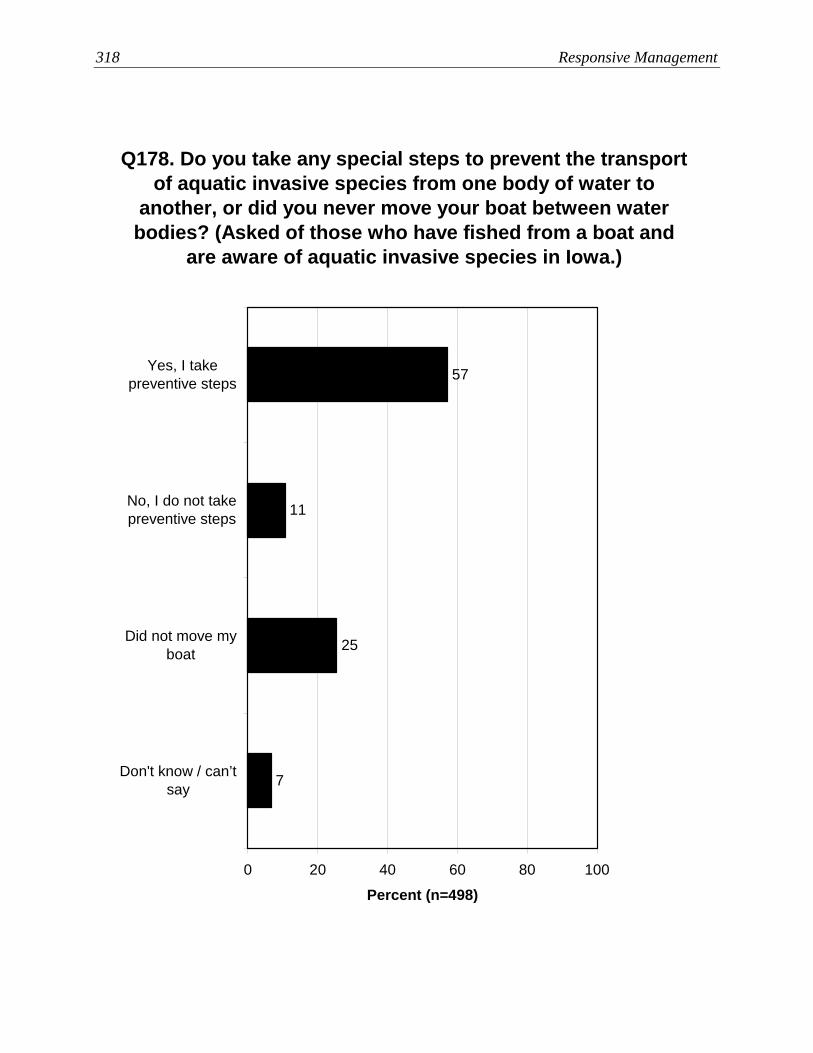
318 Responsive Management
7
25
11
57
0 20 40 60 80 100
Yes, I takepreventive steps
No, I do not takepreventive steps
Did not move myboat
Don't know / can’tsay
Percent (n=498)
Q178. Do you take any special steps to prevent the transport of aquatic invasive species from one body of water to
another, or did you never move your boat between water bodies? (Asked of those who have fished from a boat and
are aware of aquatic invasive species in Iowa.)

Iowa Angler Survey 319
Q179. Why do you not take preventive steps? (Asked of those who have fished from a boat, are aware of aquatic invasive species in Iowa, and do not take special steps to prevent the transport of
aquatic invasive species from one body of water to another.)
36
3
5
14
21
21
0 20 40 60 80 100
I don’t believe aquaticinvasive species are a
problem
I didn’t boat on infestedwaters
I don’t know what to do
It’s inconvenient / notime
Boat washingequipment was not
readily available
Don't know / can’t say
Percent (n=49)
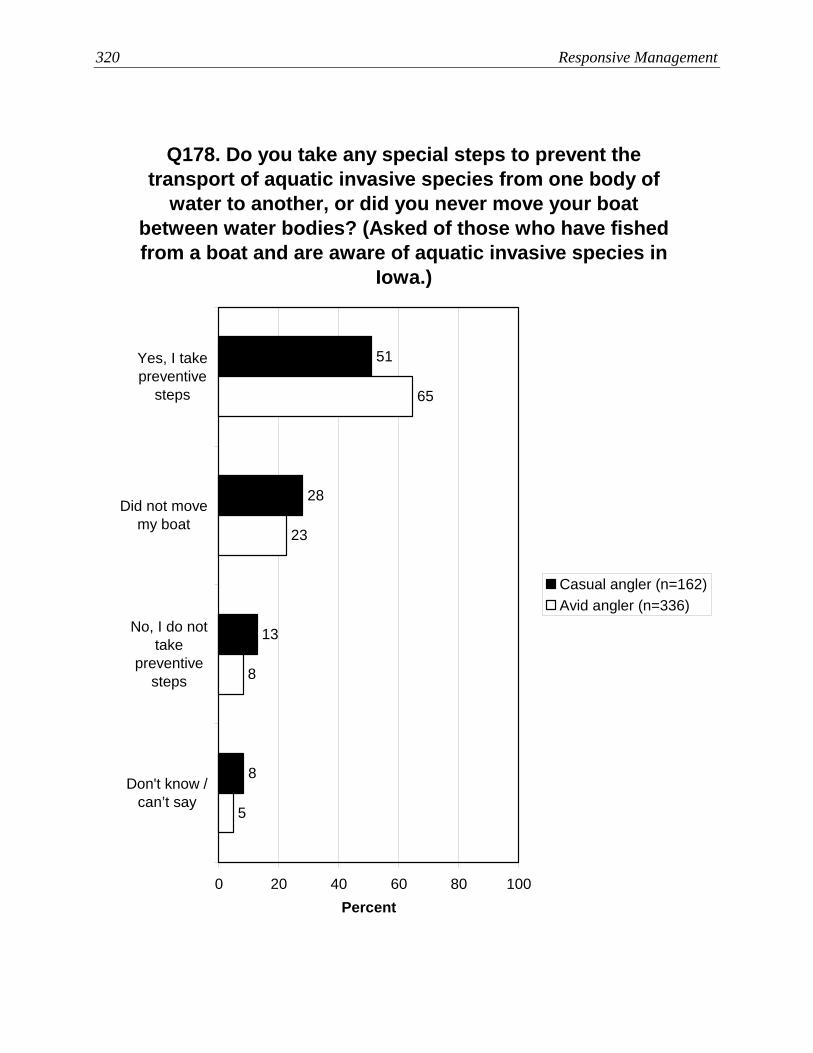
320 Responsive Management
8
13
28
51
5
8
23
65
0 20 40 60 80 100
Yes, I takepreventive
steps
Did not movemy boat
No, I do nottake
preventivesteps
Don't know /can’t say
Percent
Casual angler (n=162)Avid angler (n=336)
Q178. Do you take any special steps to prevent the transport of aquatic invasive species from one body of
water to another, or did you never move your boat between water bodies? (Asked of those who have fished from a boat and are aware of aquatic invasive species in
Iowa.)

Iowa Angler Survey 321
Q179. Why do you not take preventive steps? (Asked of those who have fished from a boat, are aware of aquatic invasive species in Iowa, and do not take special steps to prevent the transport of
aquatic invasive species from one body of water to another.)
27
5
5
16
20
27
54
5
0
10
22
9
0 20 40 60 80 100
I don’t believeaquatic invasive
species are aproblem
I didn’t boat oninfested waters
I don’t know whatto do
Boat washingequipment was not
readily available
It’s inconvenient /no time
Don't know / can’tsay
Percent
Casual angler (n=20)Avid angler (n=29)

322 Responsive Management
7
10
29
55
4
7
27
62
10
54
24
12
3
64
19
14
0 20 40 60 80 100
Yes, I takepreventive
steps
Did not movemy boat
No, I do nottake
preventivesteps
Don't know /can’t say
Percent
Southeast (n=189)Northeast (n=74)Southwest (n=141)Northwest (n=94)
Q178. Do you take any special steps to prevent the transport of aquatic invasive species from one body of
water to another, or did you never move your boat between water bodies? (Asked of those who have fished from a
boat and are aware of aquatic invasive species in Iowa.)
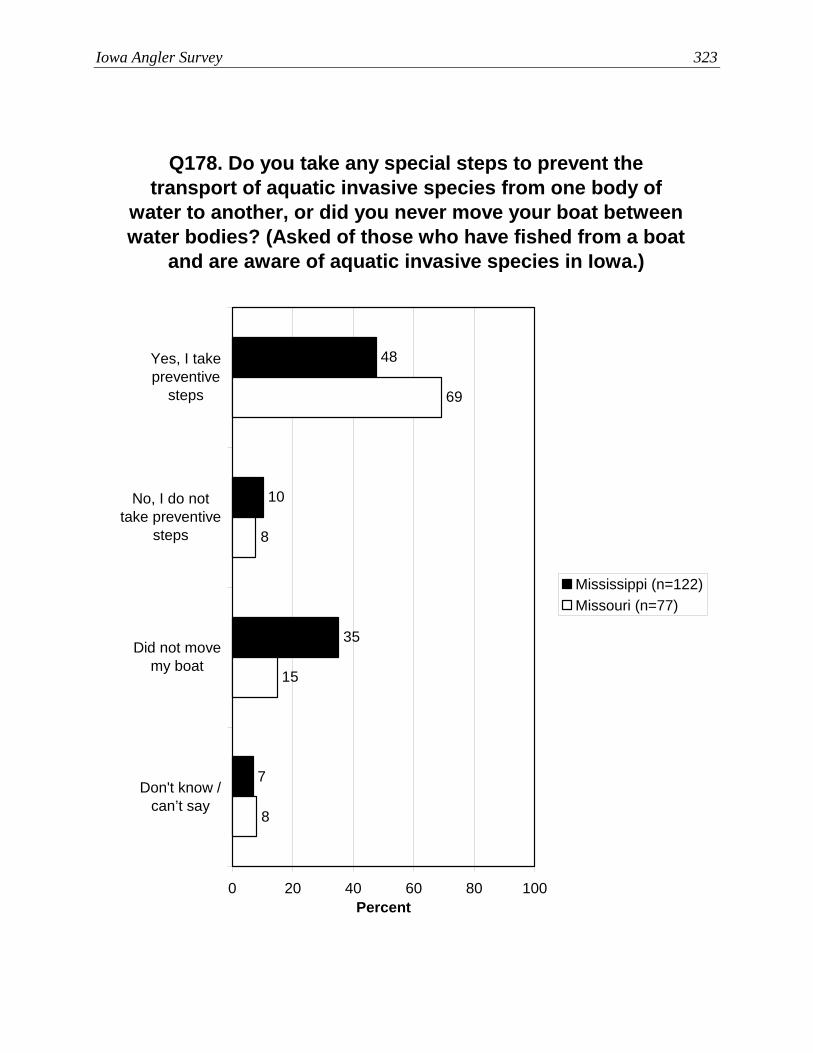
Iowa Angler Survey 323
7
35
10
48
8
15
8
69
0 20 40 60 80 100
Yes, I takepreventive
steps
No, I do nottake preventive
steps
Did not movemy boat
Don't know /can’t say
Percent
Mississippi (n=122)Missouri (n=77)
Q178. Do you take any special steps to prevent the transport of aquatic invasive species from one body of
water to another, or did you never move your boat between water bodies? (Asked of those who have fished from a boat
and are aware of aquatic invasive species in Iowa.)
324 Responsive Management
DEMOGRAPHIC DATA Most Iowa anglers are male (77%).
• A greater percentage of avid anglers relative to casual anglers are male.
• The regional crosstabulation shows no marked differences among the regions on this
question regarding gender.
• The data analysis by river region found no marked differences between anglers overall
and anglers from either river region on gender.
The large majority of licensed anglers are white/Caucasian.
• There is no marked difference between avid and casual anglers on this question.
• The regional crosstabulation shows almost no differences at all among the regions on this
question.
• The data analysis by river region found no marked differences between anglers overall
and anglers from either river region regarding their ethnicity.
Iowa anglers’ ages are shown, which form a bell curve with the peak in the 45-54 years old
category. The mean age is 47.6 years.
• The results of the avid versus casual angler crosstabulation suggest that as anglers
become very old, they switch from avid to casual status, as a higher percentage of casual
anglers than avid anglers are in the oldest age group. Otherwise, casual anglers tend to be
slightly younger than avid anglers outside of that oldest of age categories.
• The regional crosstabulation shows no marked differences among the regions on this
question regarding age.
• In general, Missouri River Region anglers are slightly younger, and Mississippi River
Region anglers are slightly older, than anglers overall.
A graph of counties of residence of Iowa anglers is shown, with Polk, Linn, Scott, and
Dubuque Counties all contributing more than 3% of the state’s anglers. The results are
shown alphabetically, as well, to facilitate finding the data about a specific county.
• A county-by-county breakdown is also shown of avid and casual anglers, with little
differences between them.
Iowa Angler Survey 325
Most commonly, Iowa anglers live in 2-person households (39%). On the other hand, in
looking at sums of categories, 52% live in households of 3 or more people, and 35% live in
households of 4 or more people. In a related question, 82% of those who do not live alone
are married (and more than half of those spouses fish).
• Although casual and avid anglers are about the same regarding the size of their
household, avid anglers are more likely to be married than are casual anglers.
• The regional crosstabulations show no marked differences among the regions on these
questions.
• The data analysis by river region found no marked differences between anglers overall
and anglers from either river region on these questions about the size of household and
marital status.
While the majority of Iowa anglers (57%) do not have children living at home, 41% have at
least one child, and 28% have 2 or more children.
• Only slight differences exist between avid and casual anglers on the number of children
living at home—avid anglers are just slightly less likely to have children living at home.
• The regional crosstabulation shows no marked differences among the regions on this
question.
• The data analysis by river region found no marked differences between anglers overall
and anglers from either river region on this question about children living at home.
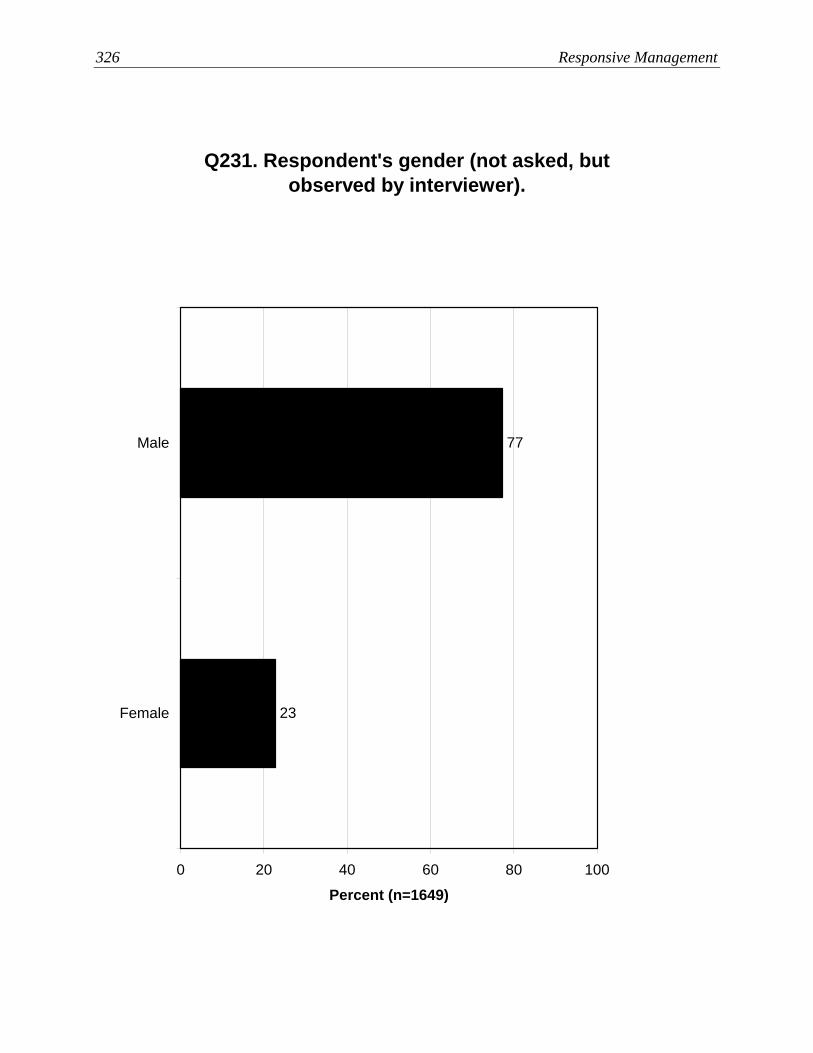
326 Responsive Management
Q231. Respondent's gender (not asked, but observed by interviewer).
23
77
0 20 40 60 80 100
Male
Female
Percent (n=1649)
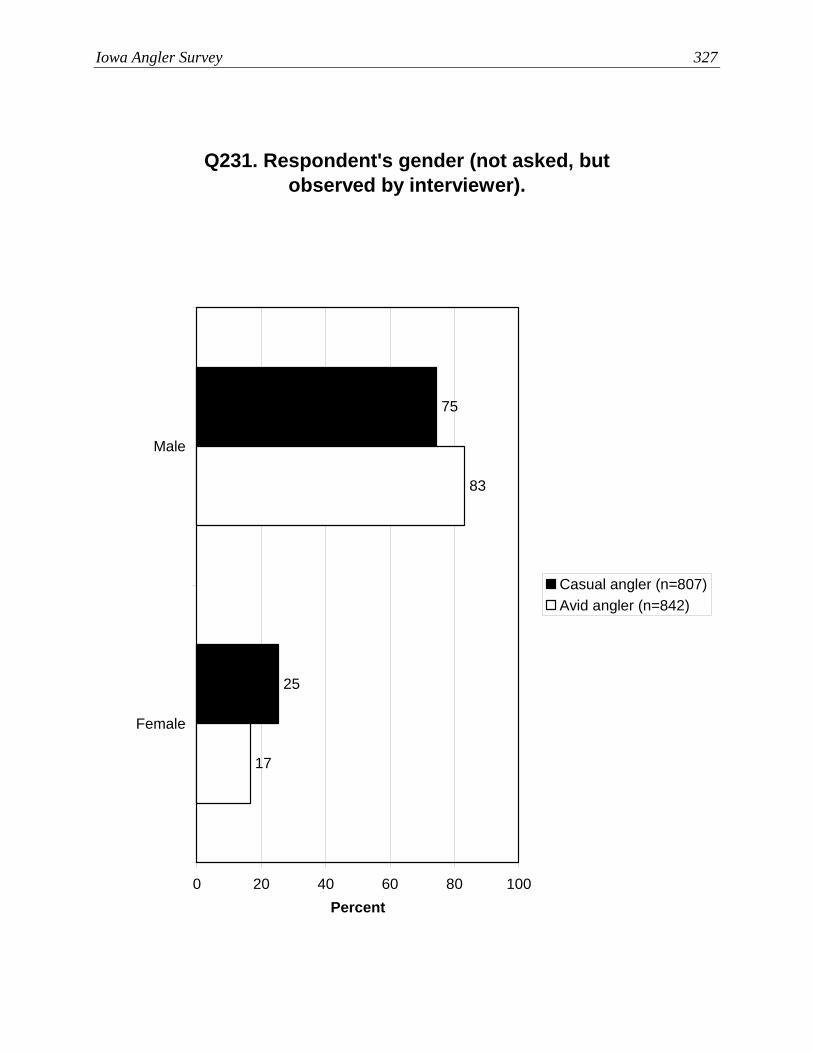
Iowa Angler Survey 327
Q231. Respondent's gender (not asked, but observed by interviewer).
25
75
17
83
0 20 40 60 80 100
Male
Female
Percent
Casual angler (n=807)Avid angler (n=842)

328 Responsive Management
Q231. Respondent's gender (not asked, but observed by interviewer).
23
77
22
78
79
21
76
24
0 20 40 60 80 100
Male
Female
Percent
Southeast (n=522)Northeast (n=239)Southwest (n=506)Northwest (n=382)

Iowa Angler Survey 329
Q231. Respondent's gender (not asked, but observed by interviewer).
21
79
26
74
0 20 40 60 80 100
Male
Female
Percent
Mississippi (n=291)Missouri (n=302)

330 Responsive Management
Q223. What races or ethnic backgrounds do you consider yourself, and please mention all that
apply?
1
1
3
95
0 20 40 60 80 100
White orCaucasian
Refused
Hispanic orLatino
NativeAmerican or
Alaskan nativeor Aleutian
Mul
tiple
Res
pons
es A
llow
ed
Percent (n=1649)
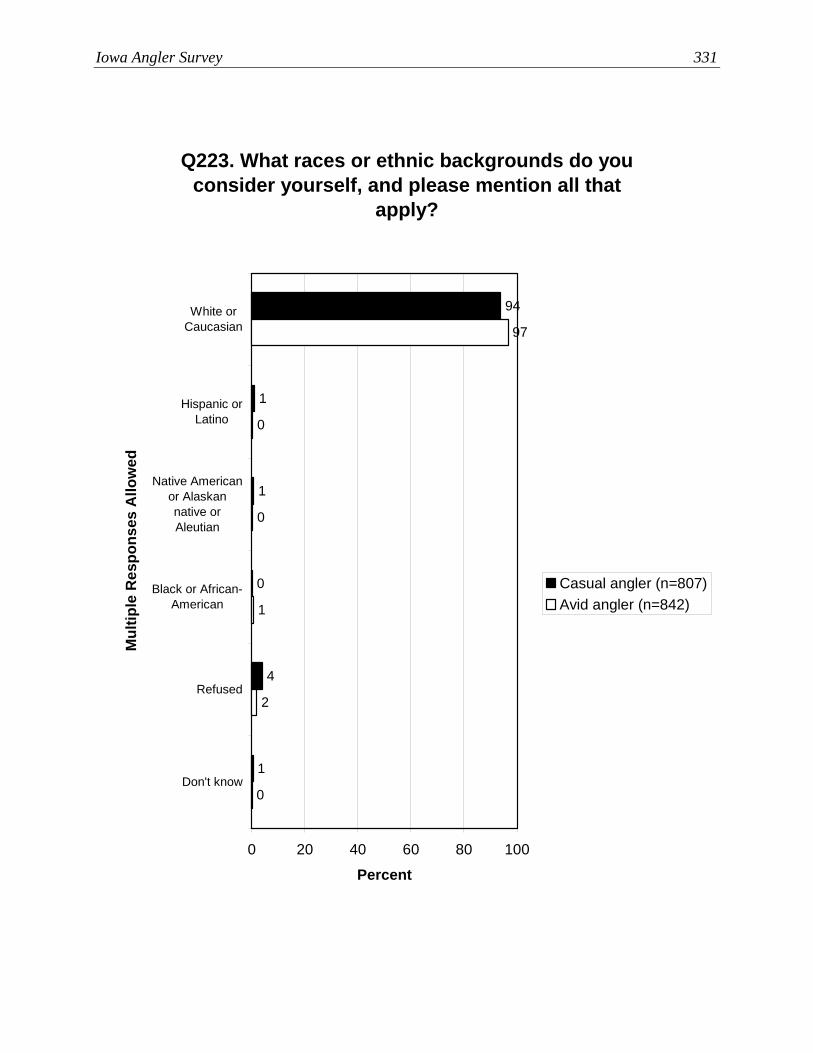
Iowa Angler Survey 331
Q223. What races or ethnic backgrounds do you consider yourself, and please mention all that
apply?
1
4
0
1
1
94
0
2
1
0
0
97
0 20 40 60 80 100
White orCaucasian
Hispanic orLatino
Native Americanor Alaskannative orAleutian
Black or African-American
Refused
Don't know
Mul
tiple
Res
pons
es A
llow
ed
Percent
Casual angler (n=807)Avid angler (n=842)
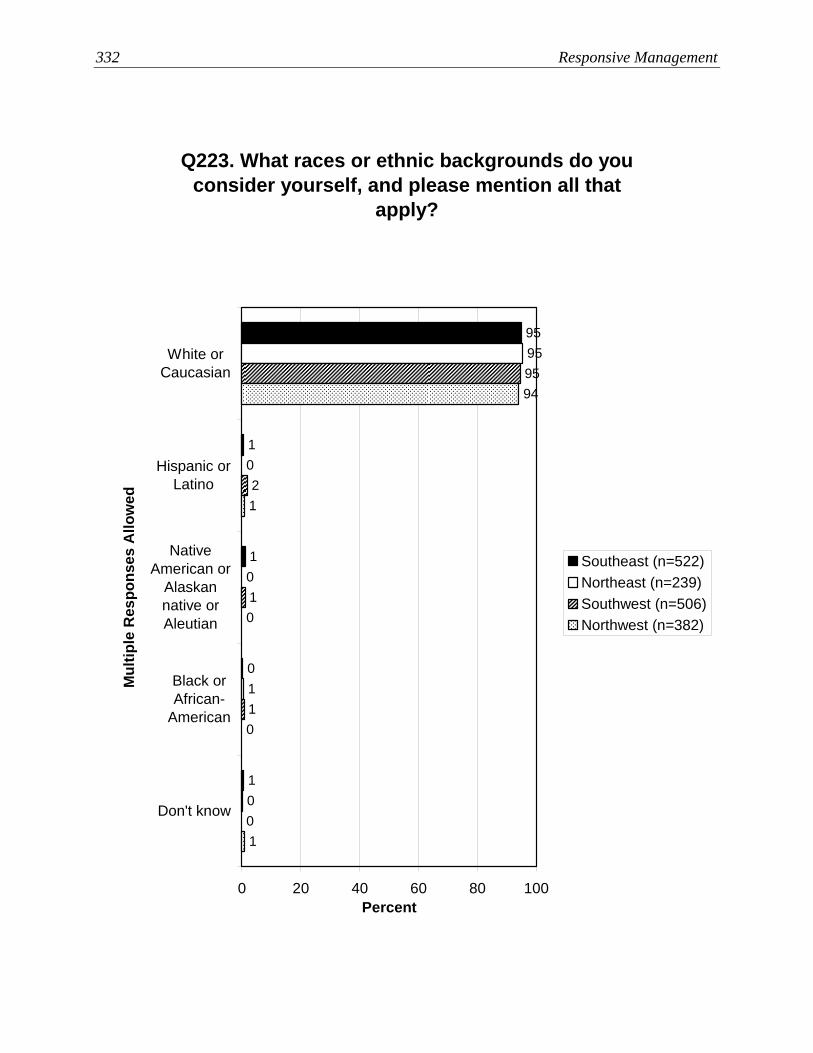
332 Responsive Management
Q223. What races or ethnic backgrounds do you consider yourself, and please mention all that
apply?
1
0
1
1
95
0
1
0
0
95
0
1
95
2
1
1
0
94
1
0
0 20 40 60 80 100
White orCaucasian
Hispanic orLatino
NativeAmerican or
Alaskannative orAleutian
Black orAfrican-
American
Don't know
Mul
tiple
Res
pons
es A
llow
ed
Percent
Southeast (n=522)Northeast (n=239)Southwest (n=506)Northwest (n=382)
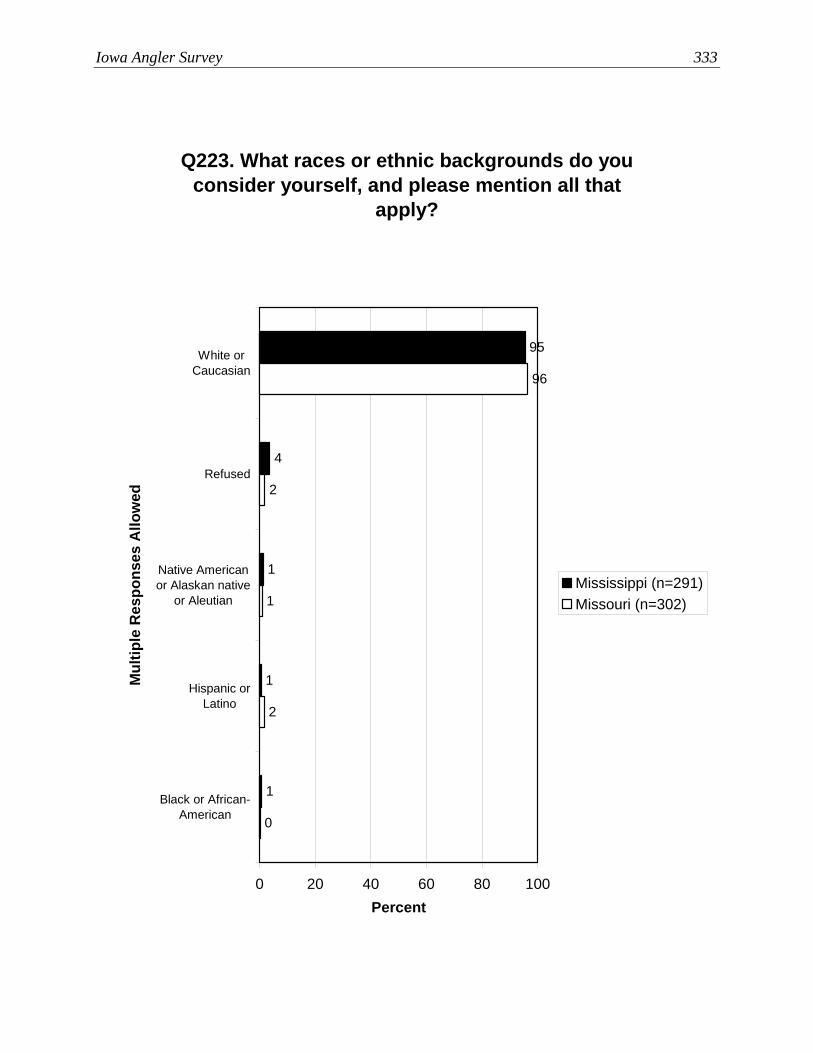
Iowa Angler Survey 333
Q223. What races or ethnic backgrounds do you consider yourself, and please mention all that
apply?
1
1
1
4
95
0
2
1
2
96
0 20 40 60 80 100
White orCaucasian
Refused
Native Americanor Alaskan native
or Aleutian
Hispanic orLatino
Black or African-American
Mul
tiple
Res
pons
es A
llow
ed
Percent
Mississippi (n=291)Missouri (n=302)
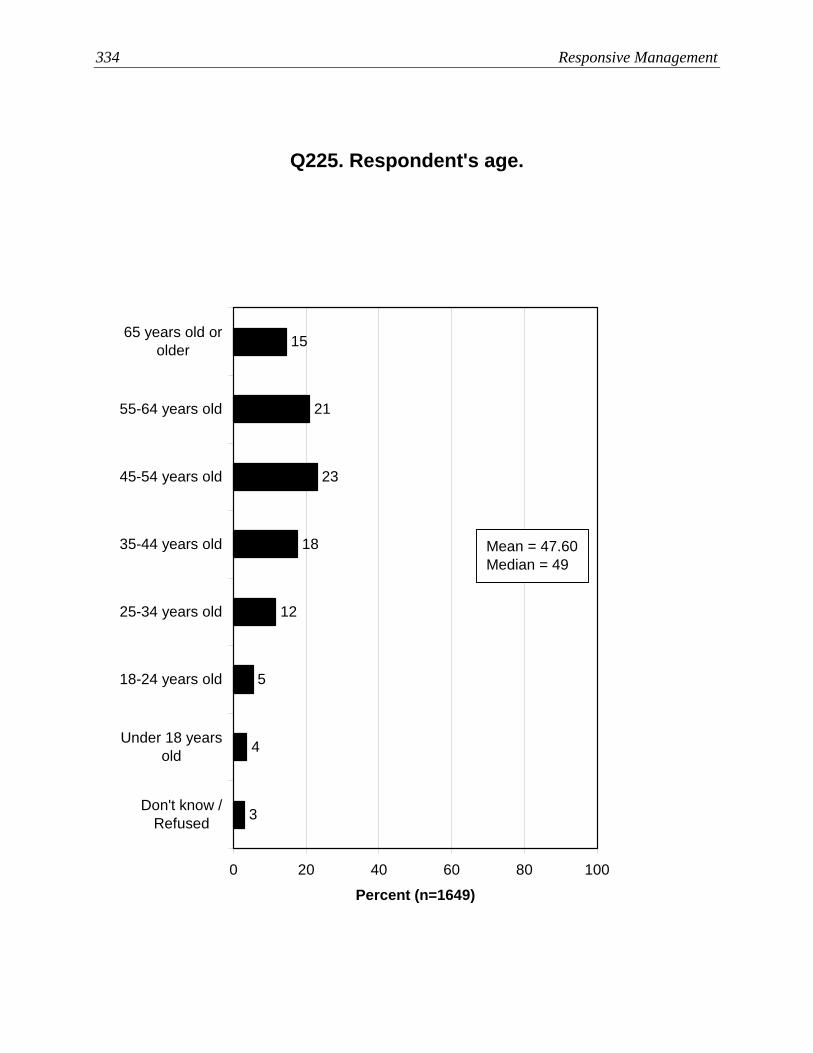
334 Responsive Management
Q225. Respondent's age.
5
12
18
23
21
15
4
3
0 20 40 60 80 100
65 years old orolder
55-64 years old
45-54 years old
35-44 years old
25-34 years old
18-24 years old
Under 18 yearsold
Don't know /Refused
Percent (n=1649)
Mean = 47.60Median = 49
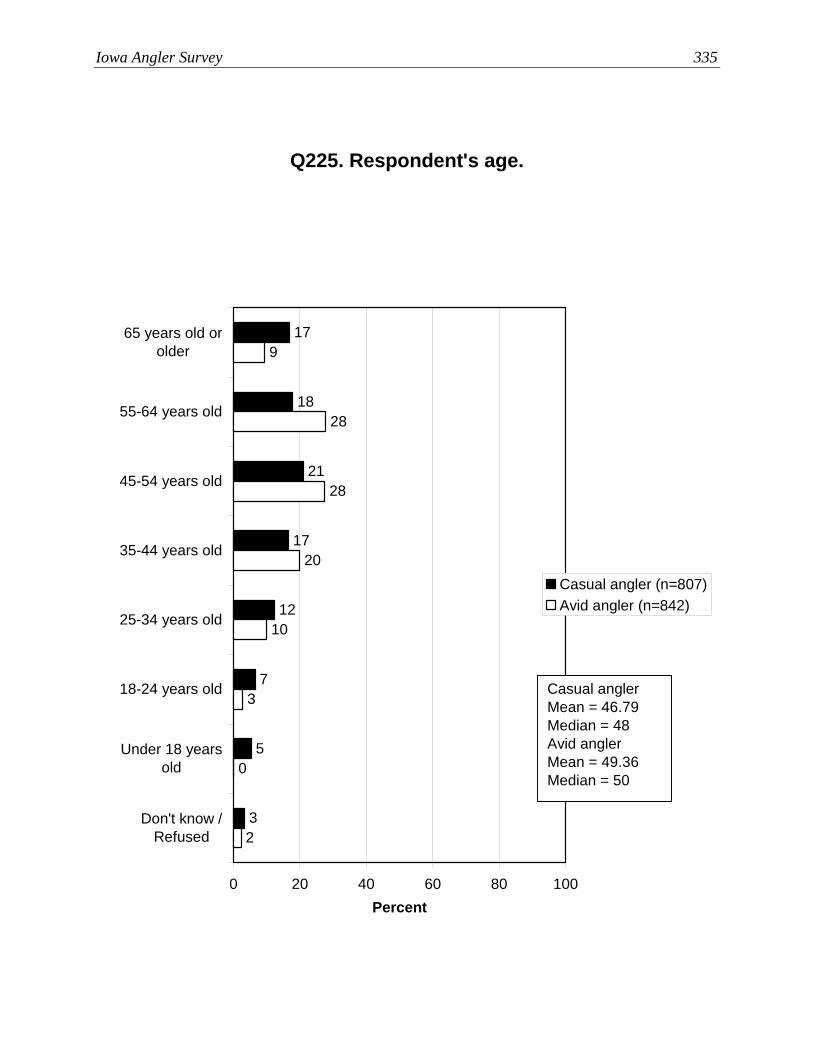
Iowa Angler Survey 335
Q225. Respondent's age.
7
12
17
21
18
17
5
32
0
3
10
20
28
28
9
0 20 40 60 80 100
65 years old orolder
55-64 years old
45-54 years old
35-44 years old
25-34 years old
18-24 years old
Under 18 yearsold
Don't know /Refused
Percent
Casual angler (n=807)Avid angler (n=842)
Casual anglerMean = 46.79Median = 48Avid anglerMean = 49.36Median = 50
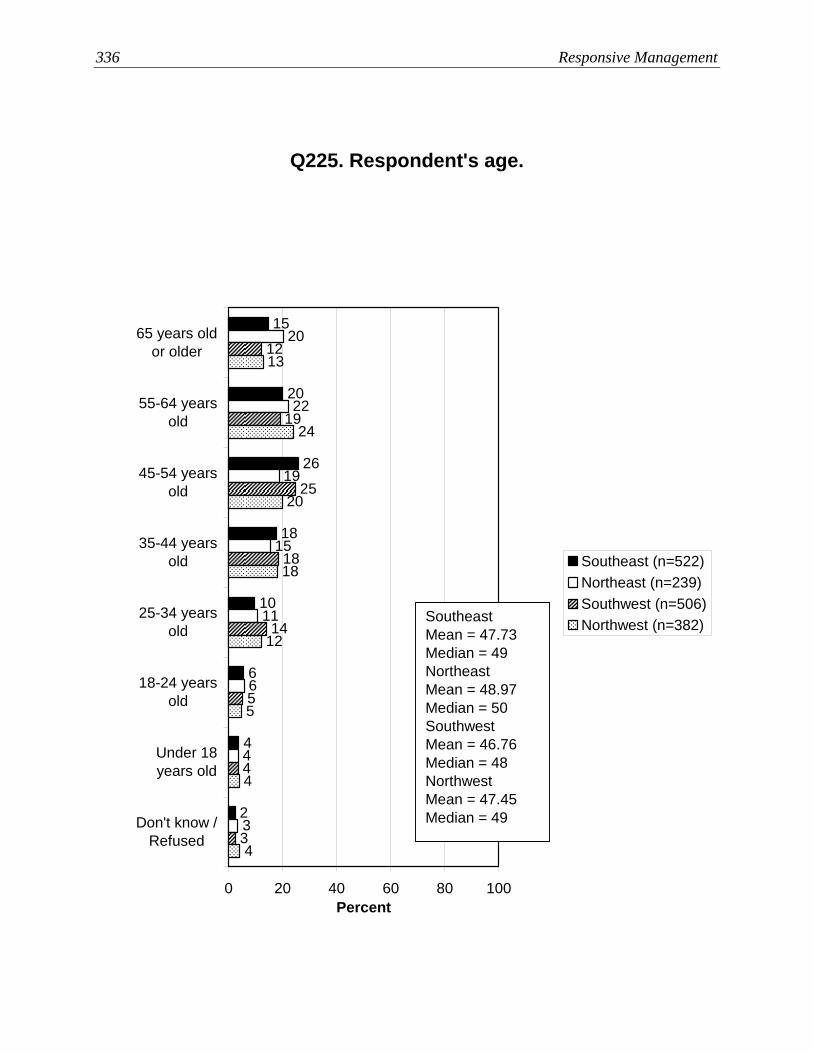
336 Responsive Management
Q225. Respondent's age.
6
10
18
26
20
15
4
23
4
6
11
15
19
22
20
3
4
5
14
18
12
19
25
4
4
5
12
18
13
24
20
0 20 40 60 80 100
65 years oldor older
55-64 yearsold
45-54 yearsold
35-44 yearsold
25-34 yearsold
18-24 yearsold
Under 18years old
Don't know /Refused
Percent
Southeast (n=522)Northeast (n=239)Southwest (n=506)Northwest (n=382)Southeast
Mean = 47.73Median = 49NortheastMean = 48.97Median = 50SouthwestMean = 46.76Median = 48NorthwestMean = 47.45Median = 49
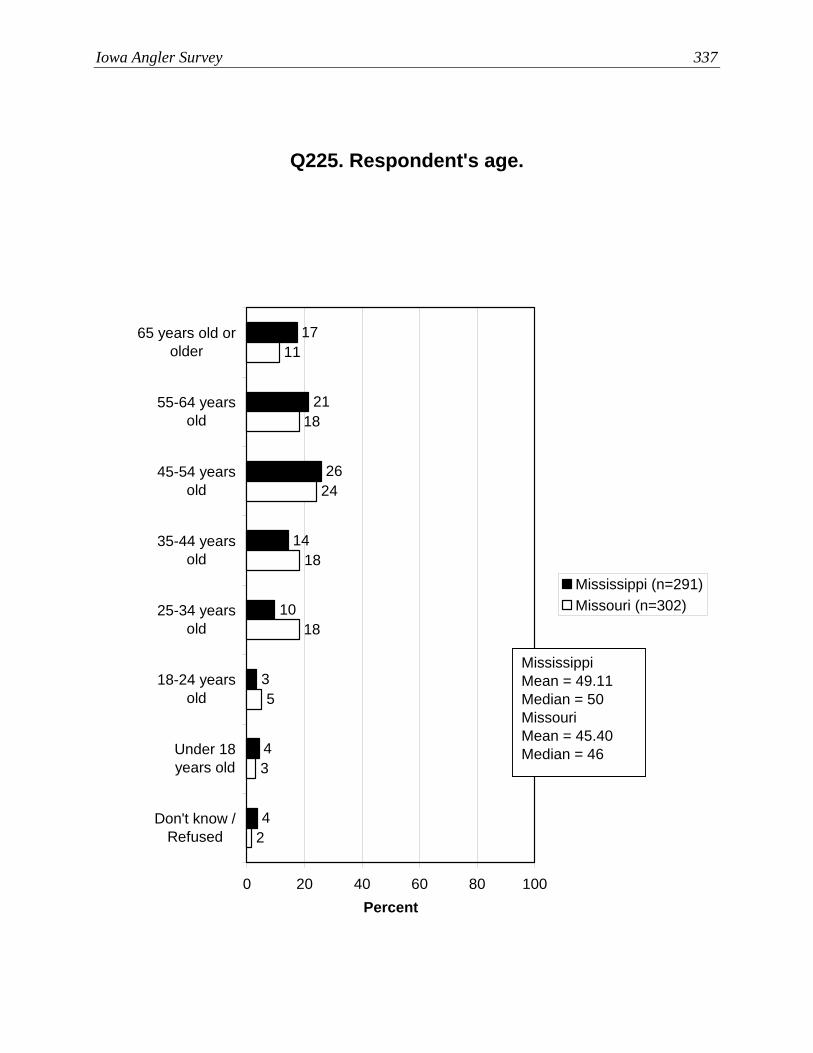
Iowa Angler Survey 337
Q225. Respondent's age.
3
10
14
26
21
17
4
42
3
5
18
18
24
18
11
0 20 40 60 80 100
65 years old orolder
55-64 yearsold
45-54 yearsold
35-44 yearsold
25-34 yearsold
18-24 yearsold
Under 18years old
Don't know /Refused
Percent
Mississippi (n=291)Missouri (n=302)
MississippiMean = 49.11Median = 50MissouriMean = 45.40Median = 46

338 Responsive Management
Q220. In what county do you live?Part 1
1.01.0
1.01.11.11.11.21.21.21.21.21.31.41.41.41.81.81.82.02.1
2.82.93.14.45.78.3
2.62.42.4
0 20 40 60 80 100
Polk CountyLinn County
Scott CountyDubuque County
Story CountyWoodbury County
Pottawattamie CountyJasper County
Black Hawk CountyJohnson CountyWarren CountyClinton CountyBremer County
Lee CountyDes Moines County
Boone CountyBenton CountyMarion CountyGrundy County
Cerro Gordo CountyAllamakee County
Clay CountyMarshall CountyFayette County
Delaware CountyBuchanan County
O'Brien CountyWashington County
Mahaska County
Percent (n=1649)

Iowa Angler Survey 339
Q220. In what county do you live?Part 2
0.80.80.80.80.70.70.70.70.60.60.60.60.60.50.50.50.50.5
0.80.80.80.80.90.9
0.90.91.01.01.01.0
0.90.90.9
0 20 40 60 80 100
Sioux CountyCedar CountyJones County
Plymouth CountyTama County
Webster CountyIowa County
Butler CountyWapello CountyHarrison CountyMadison County
Henry CountyHardin County
Hamilton CountyWinneshiek County
Hancock CountyMontgomery County
Clayton CountyBuena Vista County
Dickinson CountyDallas County
Cherokee CountyWinnebago County
Cass CountyFranklin CountyJackson County
Appanoose CountySac County
Union CountyLouisa County
Lyon CountyGuthrie CountyWright County
Percent (n=1649)
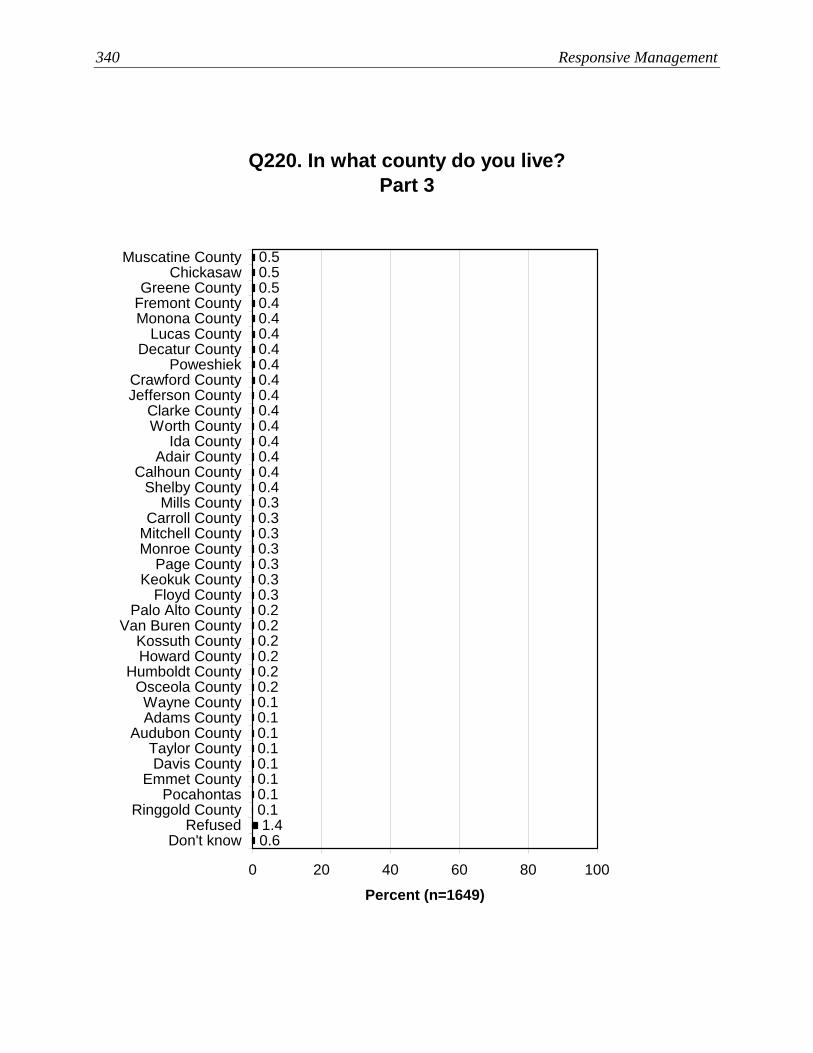
340 Responsive Management
Q220. In what county do you live?Part 3
0.40.30.30.30.30.30.30.30.20.20.20.20.20.20.10.10.10.10.10.10.10.11.40.6
0.40.40.40.40.40.4
0.40.40.40.50.50.5
0.40.40.4
0 20 40 60 80 100
Muscatine CountyChickasaw
Greene CountyFremont CountyMonona County
Lucas CountyDecatur County
PoweshiekCrawford CountyJefferson County
Clarke CountyWorth County
Ida CountyAdair County
Calhoun CountyShelby County
Mills CountyCarroll County
Mitchell CountyMonroe County
Page CountyKeokuk County
Floyd CountyPalo Alto County
Van Buren CountyKossuth CountyHoward County
Humboldt CountyOsceola CountyWayne CountyAdams County
Audubon CountyTaylor CountyDavis County
Emmet CountyPocahontas
Ringgold CountyRefused
Don't know
Percent (n=1649)

Iowa Angler Survey 341
Q220. In what county do you live?Part 1 (Alphabetical)
0.31.1
0.13.1
0.71.41.1
0.40.10.7
0.41.80.81.2
0.40.50.71.21.00.6
0.30.40.90.81.1
1.40.10.61.2
0.10.4
2.41.41.8
0 20 40 60 80 100
Adair CountyAdams County
Allamakee CountyAppanoose County
Audubon CountyBenton County
Black Hawk CountyBoone County
Bremer CountyBuchanan County
Buena Vista CountyButler County
Calhoun CountyCarroll County
Cass CountyCedar County
Cerro Gordo CountyCherokee County
Chickasaw CountyClarke County
Clay CountyClayton CountyClinton County
Crawford CountyDallas CountyDavis County
Decatur CountyDelaware County
Des Moines CountyDickinson CountyDubuque County
Emmet CountyFayette County
Floyd County
Percent (n=1649)
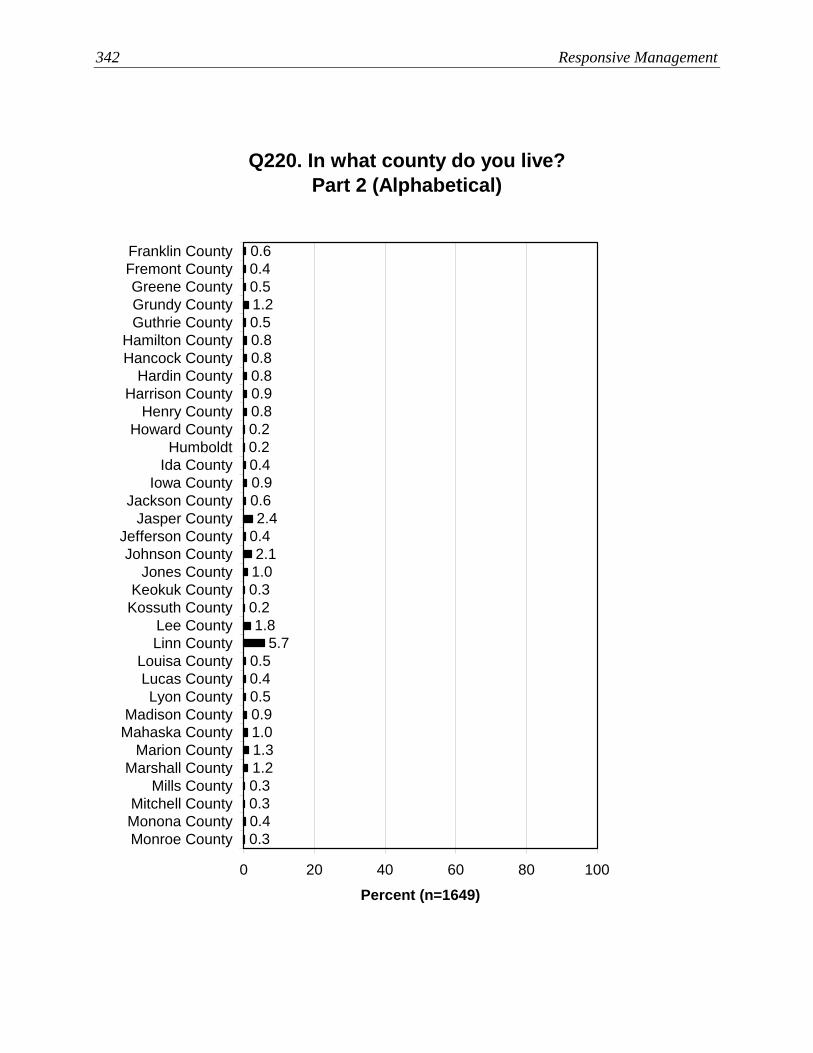
342 Responsive Management
Q220. In what county do you live?Part 2 (Alphabetical)
2.40.42.11.00.30.21.8
5.70.50.40.50.91.01.31.20.30.30.40.3
0.60.90.40.20.20.8
0.80.51.20.50.40.6
0.80.80.9
0 20 40 60 80 100
Franklin CountyFremont CountyGreene CountyGrundy CountyGuthrie County
Hamilton CountyHancock County
Hardin CountyHarrison County
Henry CountyHoward County
HumboldtIda County
Iowa CountyJackson County
Jasper CountyJefferson CountyJohnson County
Jones CountyKeokuk County
Kossuth CountyLee CountyLinn County
Louisa CountyLucas CountyLyon County
Madison CountyMahaska County
Marion CountyMarshall County
Mills CountyMitchell CountyMonona CountyMonroe County
Percent (n=1649)

Iowa Angler Survey 343
Q220. In what county do you live?Part 3 (Alphabetical)
1.02.9
0.90.10.50.20.92.01.00.10.90.70.82.8
0.40.51.40.6
0.44.4
0.60.10.42.6
0.20.30.21.00.50.8
1.00.1
8.3
0 20 40 60 80 100
Montgomery CountyMuscatine County
O'Brien CountyOsceola County
Page CountyPalo Alto CountyPlymouth County
Pocahontas CountyPolk County
PottawattamiePoweshiek County
Ringgold CountySac County
Scott CountyShelby County
Sioux CountyStory CountyTama CountyTaylor CountyUnion County
Van Buren CountyWapello CountyWarren County
Washington CountyWayne County
Webster CountyWinnebago CountyWinneshiek County
Woodbury CountyWorth CountyWright County
RefusedDon't know
Percent (n=1649)

344 Responsive Management
Q220. In what county do you live?(Part 1)
1
1
1
1
1
1
1
1
1
1
1
1
1
1
1
1
1
1
2
2
2
2
2
2
3
3
3
5
6
8
3
2
2
1
1
0
1
1
2
0
1
1
0
1
1
1
1
1
1
1
1
2
2
4
0
1
2
3
1
2
3
2
2
3
6
8
0 20 40 60 80 100
Polk CountyLinn County
Scott CountyStory County
Woodbury CountyDubuque County
Pottawattamie CountyWarren CountyJasper County
Johnson CountyBremer County
Des Moines CountyBlack Hawk County
Lee CountyClinton CountyGrundy CountyBoone County
Allamakee CountyBenton County
Cerro Gordo CountyO'Brien CountyFayette County
Marshall CountyTama County
Washington CountyMahaska CountyMadison County
Marion CountyClay County
Plymouth CountyMontgomery County
Buchanan CountyDelaware County
Percent
Casual angler (n=807)Avid angler (n=842)
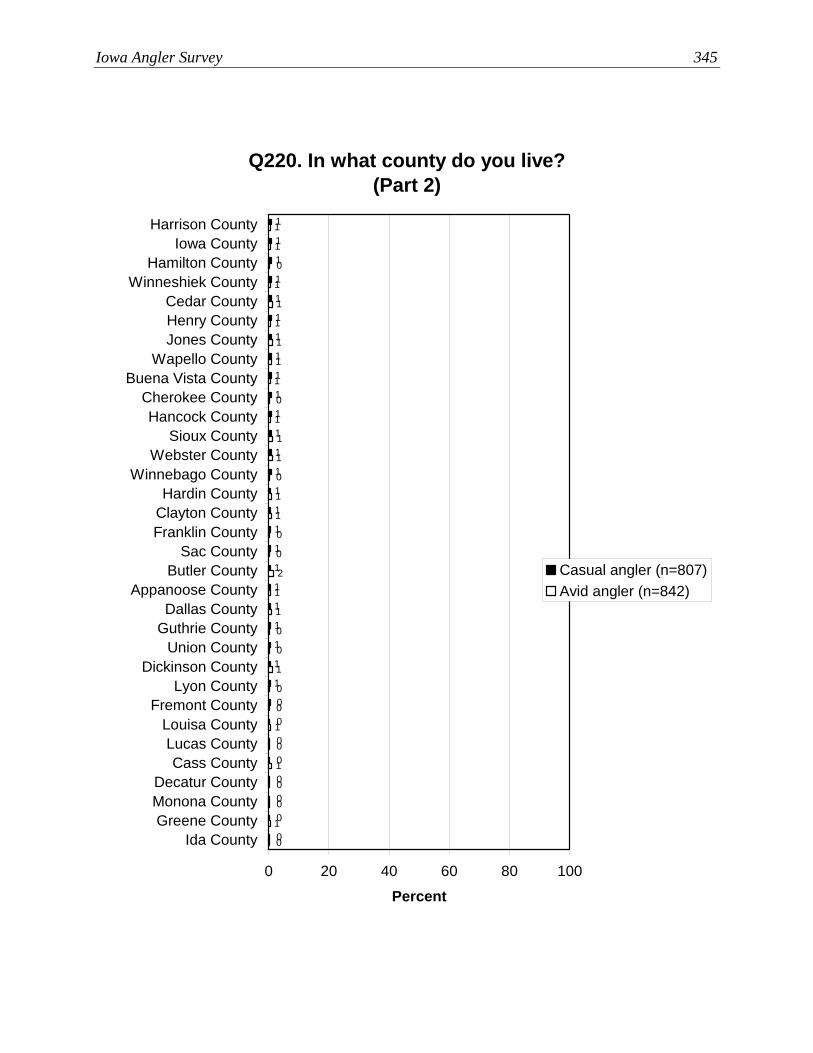
Iowa Angler Survey 345
Q220. In what county do you live?(Part 2)
0
0
0
0
0
0
0
0
1
1
1
1
1
1
1
1
1
1
1
1
1
1
1
1
1
1
1
1
1
1
1
1
1
0
1
0
0
1
0
1
0
0
1
0
0
1
1
2
0
0
1
1
0
1
1
1
0
1
1
1
1
1
1
1
1
0
0 20 40 60 80 100
Harrison CountyIowa County
Hamilton CountyWinneshiek County
Cedar CountyHenry CountyJones County
Wapello CountyBuena Vista County
Cherokee CountyHancock County
Sioux CountyWebster County
Winnebago CountyHardin County
Clayton CountyFranklin County
Sac CountyButler County
Appanoose CountyDallas County
Guthrie CountyUnion County
Dickinson CountyLyon County
Fremont CountyLouisa CountyLucas CountyCass County
Decatur CountyMonona CountyGreene County
Ida County
Percent
Casual angler (n=807)Avid angler (n=842)

346 Responsive Management
Q220. In what county do you live?(Part 3)
1
2
0
0
0
0
0
0
0
0
0
0
0
0
0
0
0
0
0
0
0
0
0
0
0
0
0
0
0
0
0
0
0
0
0
1
1
0
1
0
0
0
0
0
1
0
0
0
0
0
1
1
2
0
0
1
1
0
1
0
1
1
0
1
0
0
1
0
0
0
0 20 40 60 80 100
Worth CountyShelby County
Mills CountyChickasaw County
Floyd CountyMitchell County
Jefferson CountyMonroe County
Adair CountyClarke CountyPage County
Calhoun CountyPalo Alto County
Wright CountyCrawford County
Howard CountyRinggold CountyJackson County
Muscatine CountyPoweshiek CountyVan Buren County
Wayne CountyAdams County
Audubon CountyTaylor CountyCarroll County
Humboldt CountyKossuth CountyOsceola County
Davis CountyEmmet CountyKeokuk County
Pocahontas CountyRefused
Don't know
Percent
Casual angler (n=807)Avid angler (n=842)

Iowa Angler Survey 347
Q203. How many people live in your household including yourself?
7
39
16
21
10
4
2
0 20 40 60 80 100
More than 5people
5 people
4 people
3 people
2 people
1 person
Refused
Percent (n=1649)
Mean = 3.20Median = 3
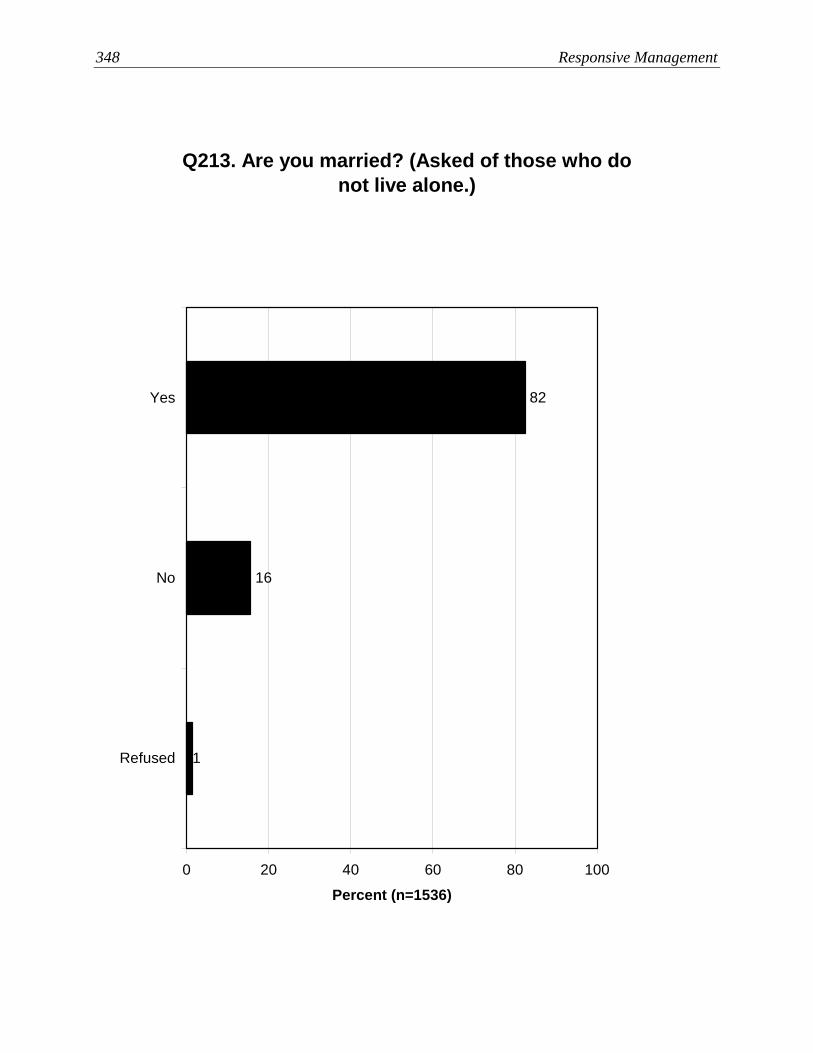
348 Responsive Management
Q213. Are you married? (Asked of those who do not live alone.)
1
16
82
0 20 40 60 80 100
Yes
No
Refused
Percent (n=1536)
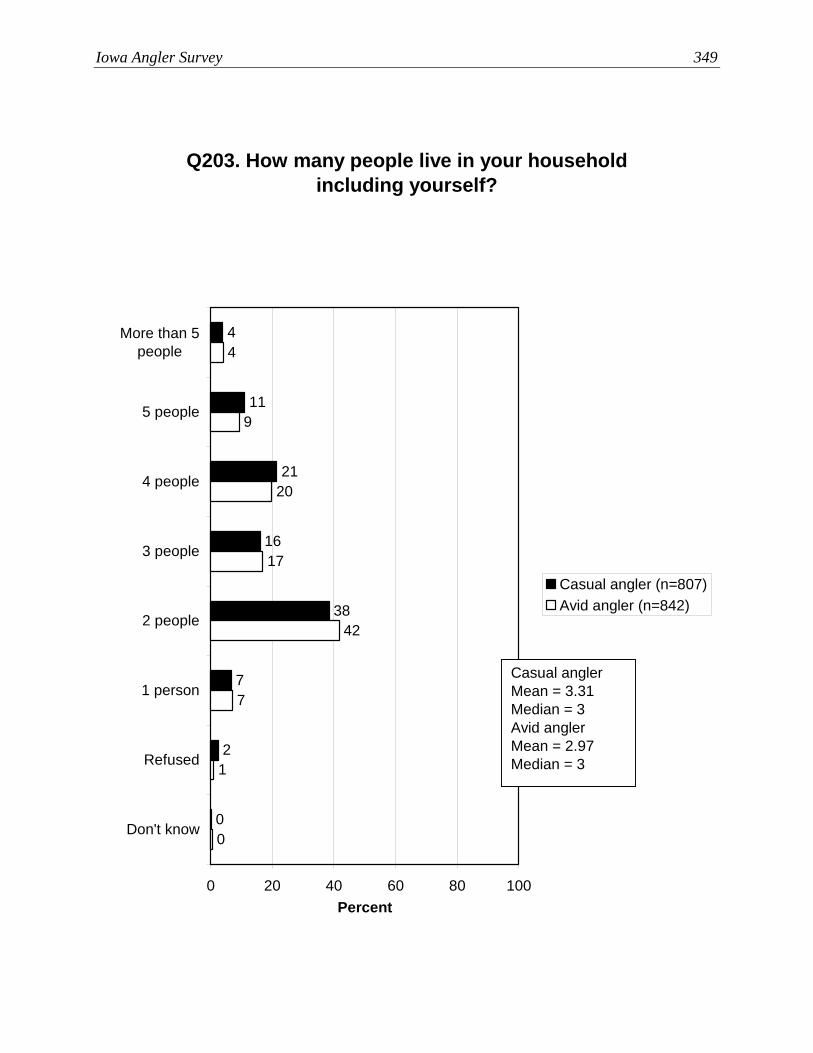
Iowa Angler Survey 349
Q203. How many people live in your household including yourself?
7
38
16
21
11
4
2
00
1
7
42
17
20
9
4
0 20 40 60 80 100
More than 5people
5 people
4 people
3 people
2 people
1 person
Refused
Don't know
Percent
Casual angler (n=807)Avid angler (n=842)
Casual anglerMean = 3.31Median = 3Avid anglerMean = 2.97Median = 3

350 Responsive Management
Q213. Are you married? (Asked of those who do not live alone.)
2
19
79
0
9
90
0 20 40 60 80 100
Yes
No
Refused
Percent
Casual angler (n=752)Avid angler (n=784)
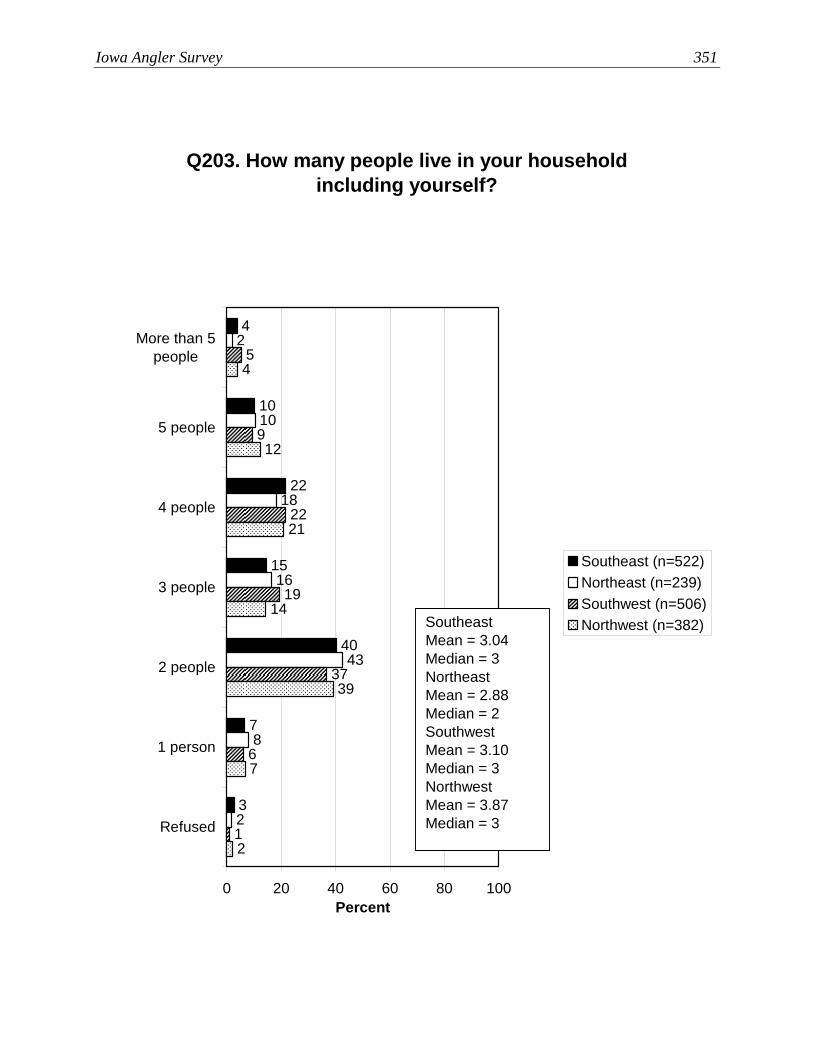
Iowa Angler Survey 351
Q203. How many people live in your household including yourself?
7
40
15
22
10
4
32
8
43
16
18
10
2
1
6
37
19
5
9
22
2
7
39
14
4
12
21
0 20 40 60 80 100
More than 5people
5 people
4 people
3 people
2 people
1 person
Refused
Percent
Southeast (n=522)Northeast (n=239)Southwest (n=506)Northwest (n=382)Southeast
Mean = 3.04Median = 3NortheastMean = 2.88Median = 2SouthwestMean = 3.10Median = 3NorthwestMean = 3.87Median = 3
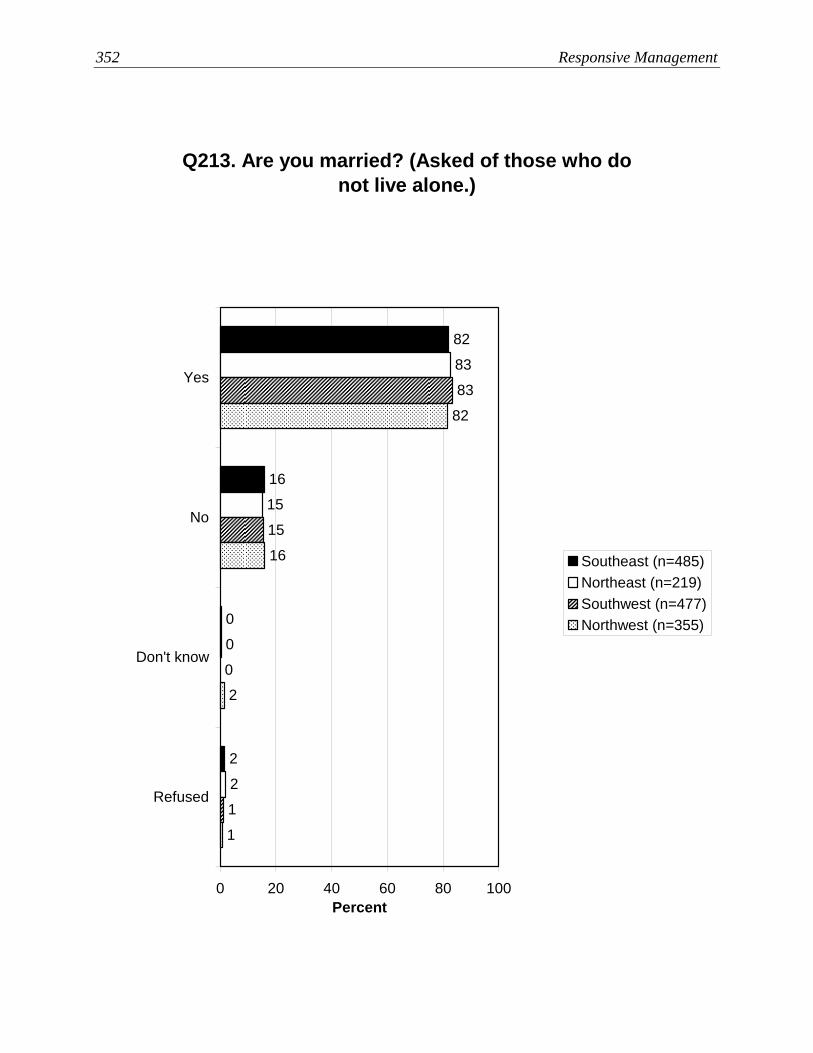
352 Responsive Management
Q213. Are you married? (Asked of those who do not live alone.)
2
0
16
82
2
0
15
83
1
83
15
0
1
82
16
2
0 20 40 60 80 100
Yes
No
Don't know
Refused
Percent
Southeast (n=485)Northeast (n=219)Southwest (n=477)Northwest (n=355)
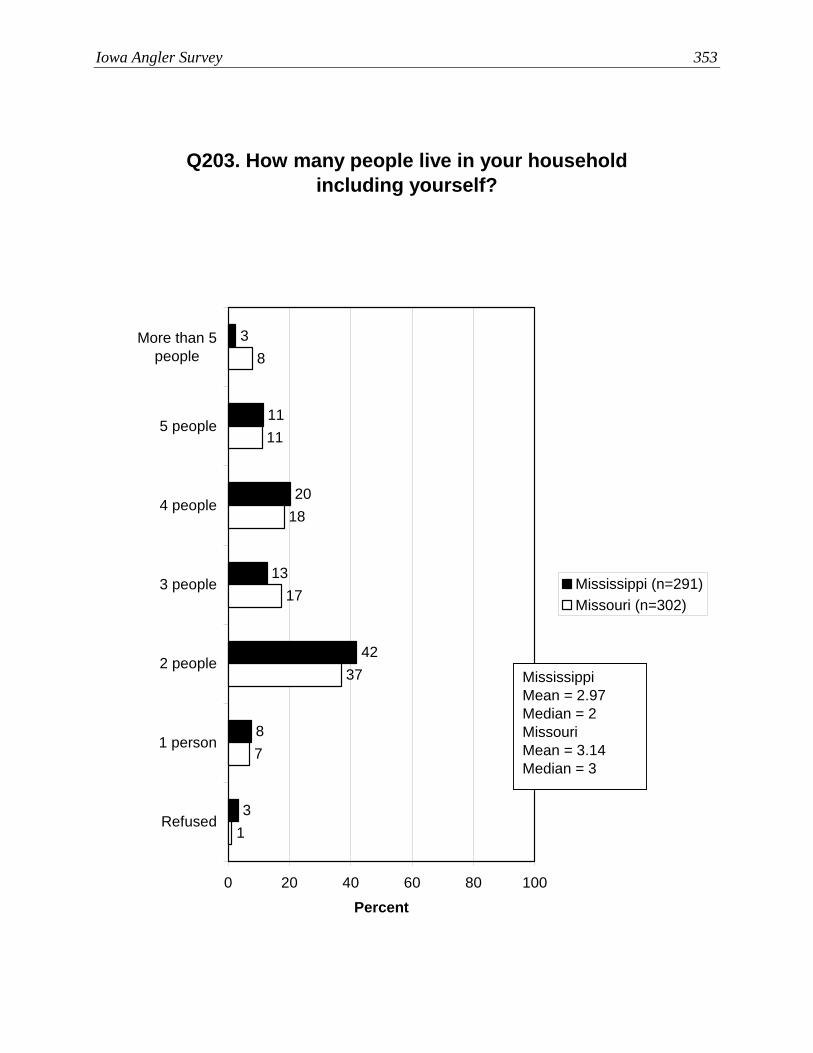
Iowa Angler Survey 353
Q203. How many people live in your household including yourself?
8
42
13
20
11
3
31
7
37
17
18
11
8
0 20 40 60 80 100
More than 5people
5 people
4 people
3 people
2 people
1 person
Refused
Percent
Mississippi (n=291)Missouri (n=302)
MississippiMean = 2.97Median = 2MissouriMean = 3.14Median = 3

354 Responsive Management
Q213. Are you married? (Asked of those who do not live alone.)
3
13
83
1
20
79
0 20 40 60 80 100
Yes
No
Refused
Percent
Mississippi (n=267)Missouri (n=282)

Iowa Angler Survey 355
Q206. How many children under 18 years old live in your household?
57
13
19
7
2
1
2
0 20 40 60 80 100
More than 4children
4 children
3 children
2 children
1 child
No children
Refused
Percent (n=1649)
Mean = 0.84Median = 0
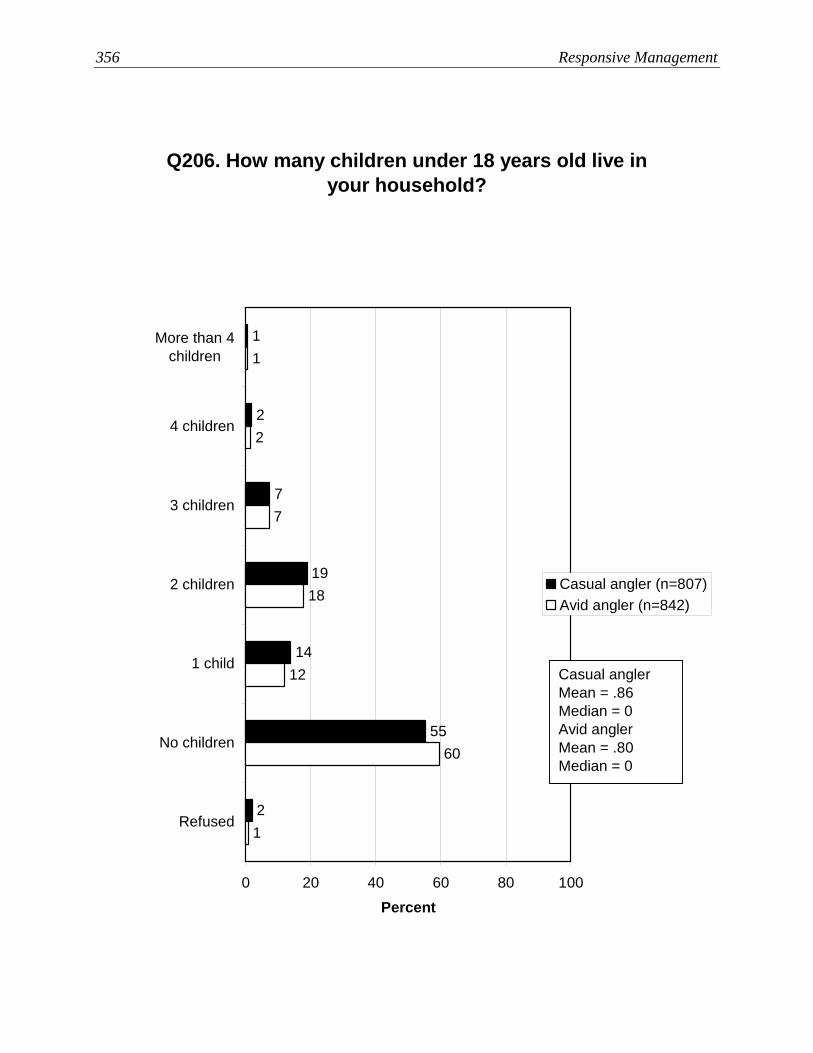
356 Responsive Management
Q206. How many children under 18 years old live in your household?
55
14
19
7
2
1
21
60
12
18
7
2
1
0 20 40 60 80 100
More than 4children
4 children
3 children
2 children
1 child
No children
Refused
Percent
Casual angler (n=807)Avid angler (n=842)
Casual anglerMean = .86Median = 0Avid anglerMean = .80Median = 0

Iowa Angler Survey 357
Q206. How many children under 18 years old live in your household?
58
14
16
7
2
1
22
60
12
18
6
1
0
1
54
13
23
0
2
7
1
55
15
17
0
2
8
0 20 40 60 80 100
More than 4children
4 children
3 children
2 children
1 child
No children
Refused
Percent
Southeast (n=522)Northeast (n=239)Southwest (n=506)Northwest (n=382)
SoutheastMean = .81Median = 0NortheastMean = .77Median = 0SouthwestMean = .90Median = 0NorthwestMean = .87Median = 0

358 Responsive Management
Q206. How many children under 18 years old live in your household?
59
12
15
8
2
1
31
53
15
19
7
5
0
0 20 40 60 80 100
More than 4children
4 children
3 children
2 children
1 child
No children
Refused
Percent
Mississippi (n=291)Missouri (n=302)
MississippiMean = .79Median = 0MissouriMean = .95Median = 0
Iowa Angler Survey 359
ABOUT RESPONSIVE MANAGEMENT Responsive Management is a nationally recognized public opinion and attitude survey research
firm specializing in natural resource and outdoor recreation issues. Its mission is to help natural
resource and outdoor recreation agencies and organizations better understand and work with their
constituents, customers, and the public.
Utilizing its in-house, full-service, computer-assisted telephone and mail survey center with 45
professional interviewers, Responsive Management has conducted more than 1,000 telephone
surveys, mail surveys, personal interviews, and focus groups, as well as numerous marketing and
communications plans, need assessments, and program evaluations on natural resource and
outdoor recreation issues.
Clients include most of the federal and state natural resource, outdoor recreation, and
environmental agencies, and most of the top conservation organizations. Responsive
Management also collects attitude and opinion data for many of the nation’s top universities,
including the University of Southern California, Virginia Tech, Colorado State University,
Auburn, Texas Tech, the University of California—Davis, Michigan State University, the
University of Florida, North Carolina State University, Penn State, West Virginia University, and
others.
Among the wide range of work Responsive Management has completed during the past 20 years
are studies on how the general population values natural resources and outdoor recreation, and
their opinions on and attitudes toward an array of natural resource-related issues. Responsive
Management has conducted dozens of studies of selected groups of outdoor recreationists,
including anglers, boaters, hunters, wildlife watchers, birdwatchers, park visitors, historic site
visitors, hikers, and campers, as well as selected groups within the general population, such as
landowners, farmers, urban and rural residents, women, senior citizens, children, Hispanics,
Asians, and African-Americans. Responsive Management has conducted studies on
environmental education, endangered species, waterfowl, wetlands, water quality, and the
reintroduction of numerous species such as wolves, grizzly bears, the California condor, and the
Florida panther.

360 Responsive Management
Responsive Management has conducted research on numerous natural resource ballot initiatives
and referenda and helped agencies and organizations find alternative funding and increase their
memberships and donations. Responsive Management has conducted major agency and
organizational program needs assessments and helped develop more effective programs based
upon a solid foundation of fact. Responsive Management has developed Web sites for natural
resource organizations, conducted training workshops on the human dimensions of natural
resources, and presented numerous studies each year in presentations and as keynote speakers at
major natural resource, outdoor recreation, conservation, and environmental conferences and
meetings.
Responsive Management has conducted research on public attitudes toward natural resources
and outdoor recreation in almost every state in the United States, as well as in Canada, Australia,
the United Kingdom, France, Germany, and Japan. Responsive Management routinely conducts
surveys in Spanish and has also conducted surveys and focus groups in Chinese, Korean,
Japanese, and Vietnamese.
Responsive Management’s research has been featured in most of the nation’s major media,
including CNN, ESPN, The Washington Times, The New York Times, Newsweek, The Wall Street
Journal, and on the front pages of The Washington Post and USA Today.
Visit the Responsive Management Website at:
www.responsivemanagement.com