Embed Size (px)
Citation preview

Naval Research Laboratory AD-A255 222Dunon C 203MU32 tID~li ___
NR1JMR6176-02-nM3
Ion-Beam-Assisted Deposition ofMoS2 and Other Low-Friction Films
RoBBxr N. BoLurE
Surface Owmlsn BranchOaemLnry Dtivison
September 11, 199
DTICSELECTE
CM ~ A"
92 91 5
Appmwd bt pM. uh& rdne% im osuMsd.

1.AECYUEOLYtss ~ .REPORT DOC ME TT IO S.PARTTYE AND DATE COERE
SeptanberI O1, 1992 0704638 o /
I~cop bea-Auit d& Depsiion of bdoS 2d and Owtawer LOW-Fito FInt Mw W 632C p 611S3Nfr s ov
4. PITERRMND OUBrGAT IO AES)ADAORSIS S. PERFORMNW RA~TO
RobeEPOR N.Bolge
0. SPONSORINGJMONITORING AGENCY NAMEIS) AND ADDRESSIES) 10. SPONSORING/MONITORINGAGENCY REPORT NUMBR
Department of the Air ForceAir Force Wright Aeronautical Lab. (WRDC/MLBT)Wright-Fatterson Air Force Base, OH 45433
I1I. SUPPLEMENTARY N0IIS
1 2a. DISTRIUTIONf/AVALASILITY STATEMENT 12b. DISTRIBUTION CODE
Approved for public release; distribution is unlimited.J
13. ABSTRACT (fxMmrn, 200 iw~tds
Vacuum-deposited films of molybdenum disulfide (MoS2) ame effective as solid lubricants. Ion-beam-assisted deposition, whichemploys ion beam sputtering with an assist beamn impinging on the growing film, has been investigated as a means of preparing low-friction high endurance coatings. The apparatus used and some of the techniquies Involved arc described. Ion source operatingparameters5 were optimized and the assist beamn ion flux was quantified and found to follow a power-law relationship with beampower. The beat way to produce MoS2 films was found to be cosputtering from separate Mo and S targets with deposition ratesadjusted to obtain the desired stoichIometry. Deposition rates were found to also follow a power-law relationship with beamn power.and formulae are given for predicting them, the ratio of assist ions to film atoms, and the effect of assist beam sputtering on filmthickness. Inverse formulae are given for determing process parameters neddto achieve a selected film thickness and composition.A composite target for simultancous Mo and S sputtering was developed. Deposition rates were determined for other metals: W. Ni,Co, Cu, and Pb. Formulae relating target-to-substrate distance to deposition rate are given.
14. SULJECT TERMS 1S. NUMBER OF PAGES
Ion beamn MoS2 Spufttr 34Film deposition Solid lubricant Friction 16. PRICE CODE
17. SECURITY CLASSIFICATION 1S. SECURITY CLASSIICATION 19. SECURITY CLASSFICATION 20. LIMITATION OF ABSTRACTOF REPORT OF THIS PAGE OF ABSTRACT
UNCLASSMIFID UNCLASSIFIED UNCLASSIFIED UL
NWN 7640.01 -2110.5100 b.WO. Pea. 250.,W~. 246)fteguba by Nos U. awls
CONTENTS
BACKGROITND .............................................. 1
APPARATUS . . .. ..... .e ............................. ..... 1
Vacuum Chamber . ... 2Target Holders ..................................... 2Targets ............................................ 3Ion Sources ........................................... 4Stage .............................................. 5Quartz Monitor .............................. ...... 6Residual Gas Analyzer ............................. 6Gas Supply ............................................ 7
PROCEDURES .................. ............................ 8
Deposition ......................................... 8Thickness Measurement ................................. 9Ion Sources ........................................... 10
ASSIST BEAM FLUX MEASUREMENT .................... 13
DEPOSITION RATE CONTROL .................................... 15
MoS 2 and Sulfur ................ o .................... 15Molybdenum and Sulfur .............................. 15Improved No and S Data ............................... 19Assist Beam Effects ................................... 20Film and Process Parameter Ca.'rulation Summary .... 23Composite Mo-S Target . .................... 25Deposition of Various Metals ......................... 26Effect of Target Distance ............................ 27Uniformity of Deposition .......................... 27Intentional Composition Gradients .................. 28
SUMMARY ..................................................... 28
ACKNOWLEDGMENTS ............................................ 29
REFERENCES .............................................. 29
Accesion For
NTIS CRA&IOTIC TABUnannounced
Justification
M QUALrTY INrPzCTE 38y-Oistrutl•on I
Availability Codes
,•,�t Avai
"otit

ION-BEAM-ASSISTED DEPOSITION OFMoS 2 AND OTHER LOW-FRICTION FILMS
BACKGROUND
Films of the solid lubricant molybdenum disulfide (oS2)deposited by vacuum processes such as rf or dc sputtering have beenfound effective for the lubrication of bearings in vacuumenvironments. The Naval Research Laboratory has established afacility for the laboratory scale preparation of such films by ionbeam sputtering. In this process beams of ions, usually of theinert gas argon (Ar), bombard targets imparting sufficient energythat atoms are emitted from the target and deposited as a film onnearby substrates. In addition to controlled deposition of one ormore materials, this process allows ion-beam-assisted deposition(IBAD), where an ion beam directed at the substrate modifies thecomposition and structure of the film as it forms.
Over several years numerous MoS. films have been prepared andsome of their properties have been reported (1,2,3). These includelow friction coefficients, typically 0.01 to 0.02, and remarkableendurance under highly-loaded sliding contact (less than an atomiclayer per cycle). In this report more of the experimental detailsand practical procedures than could be included in otherpublications are collected for use by other researchers or fortransition to industry.
APPARATUS
The apparatus consists of a vacuum chamber mounted atop acabinet containing the high-vacuum pump and various utilities; aconsole containing the ion source power supplies, controls, andinstrumentation; and various accessories such as the mechanical
MaflaF a d July 30,199M.
1

vacuum pump and a gas supply system. The basic apparatus was built
to our specifications by Commonwealth Scientific Corporation of
Alexandria, Virginia. A number of accessories have been added and
modifications made to the system to increase its capabilities.
Vacuum Chamber
The vacuum chamber is cylindrical, 51 cm (20 inches) indiameter and 46 cm (18 inches) deep, with its axis horizontal. Oneend opens to provide access to the interior. The walls arestainless steel, with numerous welded ports for the ion sources,pressure gauges, and other accessories. There are removable linersto facilitate cleaning, and a bake-out jacket. The chamber isrough-pumped by a 760 L/min mechanical pump and automaticallycrosses over to a cryogenic high-vacuum pump with a pumping speedof 4000 L/s for water and 1200 L/s for argon. The normal base
pressure is about 10-7 Torr (10-5 Pa). When the ion sources areoperating the pressure is in the range of 2 to 6 x 10⁻⁴ Torr. A
high-vacuum manipulator has been installed so that substrates canbe moved, covered or uncovered while under vacuum. This permitsmaking several types or thicknesses of films in one run. A diagramof the chamber and its contents is shown if Fig. 1.
Target Holders
Two water-cooled holders for four sputtering targets areprovided. The targets are selected remotely from the operatingconsole. Early films showed considerable nickel contamination,
apparently the result of sputtering from the nickel-plated holderblock and shields by the outer portion of the ion beam. The lefttarget holder has been fitted with a graphite foil shield toprevent the beam from striking any metallic surfaces.
2

VACUUM
TMEAREAE
SPUTERNG PUTERNALZE
THICKNESSIO ASSISRTUE'
MONITOR CONTROLLED ION
Fig. 1 - Arrangement of the major components in the IBAD apparatusvacuum chamber as seen from the front with the stage in the leftposition. The quartz crystal monitor shown beside the substratehere for clarity was actually directly behind it.
Targets
Most of the targets are in the form of 3-inch (7.6 cm) disks1/4 in. (6.4 mm) thick cemented by silver-filled epoxy to copperbacking plates, which are mounted on the holder by threaded studs.Silver-filled vacuum grease between the backing plate and thetarget holder assists the transfer of heat from the target.
P R3

A sulfur (S) target has been prepared by allowing a pool ofmolten sulfur to solidify on a recessed copper disk to which acopper screen had been soldered. The screen provides improvedadhesion and thermal conductance. The target is replenished by
heating it until the sulfur melts (1190C) and adding additionalsulfur. Shrinkage or porosity which occurs during crystallizationis patched by local melting with a soldering gun.
Ion Sources
The three ion sources are of the Kaufman type (4,5). Gas,normally Ar, is supplied to a discharge chamber at the rate of afew standard cubic centimeters per minute (SCCM). Electrons froma hot filament cathode are accelerated toward the cylindrical anodewhich forms the walls of the chamber, ionizing the gas atoms or
molecules by impact. The efficiency of this ionization is increasedby a magnetic field provided by permanent magnets outside thechamber. The positively charged ions are accelerated away from the
anode by the high voltage provided by the beam power supply.
Passing through aligned holes in the screen grid and accelerator
grid, the ions form beamlets which merge to form the ion beam.
Immersed in the beam is a heated tungsten filament which emitselectrons to neutralize the positive charge of the beam.
The sources produce beams of 3 cm diameter, with beam energies(voltages) of 50 to 1500 V and maximum currents of 100 mA. The two
sources used for sputtering are equipped with graphite grids toproduce high-intensity beams, the left source usually with focussed
grids and the right with collimated grids giving a slightly largerbeam. The assist source has convex molybdenum grids to produce a
broader low intensity beam. Operating in manual mode with maximum
accelerator (grid) voltage of 500 V also helps to broaden the
assist beam.
4

Stage
The substrate stage consists of a circular platen 11.5 cm indiameter supported by the stage assembly. Threaded holes around theperiphery facilitate the use of plates or wire loops to holdsubstrates in place. The platen is motor driven in rotation toimprove the uniformity of deposition, and can be heated to 620 K(3500C). The original temperature sensor was inadequate, indicating
a temperature far below actual, and was replaced by a fine-gauge
thermocouple inserted into a bronze shoe riding in contact with the
edge of the platen.
The stage assembly is mounted to the front plate of the
chamber on an eccentric rotating platform with a radius of motionof 3.4 cm which permits limited horizontal and vertical positioningand tilting of the platen. The eccentric platform was normally set300 to the left of the highest position with the platen horizontal.The stage support also swings in a plane parallel to the platensurface 2.6 cm to either side. Normally swung to the left, thecenter of the platen was then 4.3 cm left of the chamber centerplane, 11.9 cm from the center of the left target and 17.5 cm fromthe right target. This position minimized the distance to the lefttarget, which normally was the substance with the lower sputter
yield.
The chamber was designed with the stage platen facing upwardto make possible the coating of loose objects such as bearingballs. This also reduces the fixturing needed for holding flatsubstrates. A disadvantage of this position is that particles canfall onto the substrates during the process creating defects in
the coating.
The platen can be shuttered by a sliding cover operated by afeed-through rod. Three Faraday cups built into the cover serve tocheck the aim and flux of the assist beam. A larger cup with a
5

suppressor electrode has been added to provide more accurate beamflux data.
Quartz Monitor
A quartz crystal deposition rate monitor indicates the rateduring the process and the total thickness deposited. Mounted ona cylindrical feed-through from the top of the chamber, the crystalcan be placed anywhere by raising, lowering and rotating the feed-through or bending the support tubing. For normal operation,repositioning the crystal by manually bending the support isundesirable, so it is placed where different stage positions canbe accomodated by rotation of the feed-through alone. With thestage at the left the crystal is located at the same height as theplaten and directly behind it (at the same distance from thechamber center plane). The mean "tooling factor" for this positionwas found to be 160 ±20%, that is, the film thickness on a
4 substrate at the center of the platen was 1.6 x that on thecrystal. With the stage at the center or right positions thecrystal is moved as close as possible: near the end of the stageframe but 2 or 3 cm to the left of center, or near the corner ofthe frame and 5 or 6 cm left of the platen center. Approximatetooling factors for these positions were: center, left target =
120%; center, right target = 180%; right, right target = 260%.
Residual Gas Analyzer
A quadrupole mass spectrometer residual gas analyzer (RGA)with a differential pumping system has been added to the chamberto monitor the composition of the gases present during depositionand to check the purity of the sputtering gas. For qualitativemonitoring analog mode (graphic mass spectrum display) was usedwith subtraction to eliminate the detector background. With thechamber under vacuum and the high-conductance valve open the RGAsampled the residual gases in the chamber at base pressure. During
6
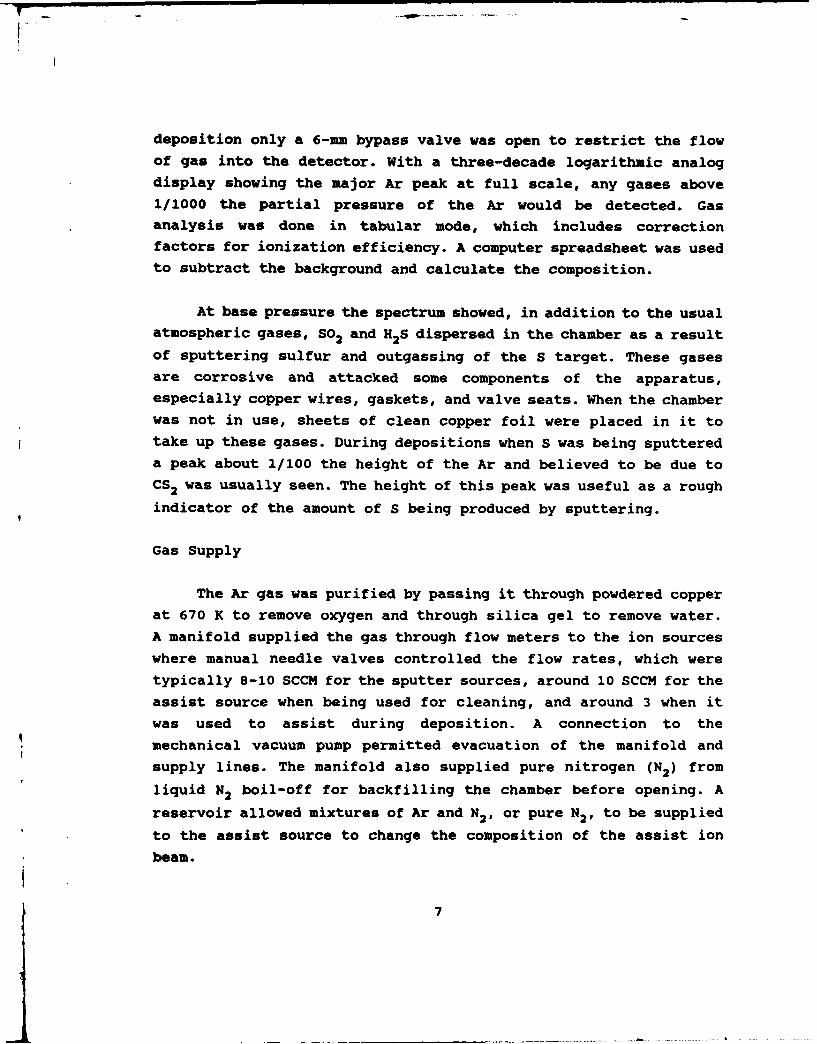
deposition only a 6-mm bypass valve was open to restrict the flowof gas into the detector. With a three-decade logarithmic analogdisplay showing the major Ar peak at full scale, any gases above1/1000 the partial pressure of the Ar would be detected. Gasanalysis was done in tabular mode, which includes correctionfactors for ionization efficiency. A computer spreadsheet was usedto subtract the background and calculate the composition.
At base pressure the spectrum showed, in addition to the usualatmospheric gases, SO2 and H2S dispersed in the chamber as a result
of sputtering sulfur and outgassing of the S target. These gasesare corrosive and attacked some components of the apparatus,especially copper wires, gaskets, and valve seats. When the chamberwas not in use, sheets of clean copper foil were placed in it totake up these gases. During depositions when S was being sputtereda peak about 1/100 the height of the Ar and believed to be due toCS 2 was usually seen. The height of this peak was useful as a rough
indicator of the amount of S being produced by sputtering.
Gas Supply
The Ar gas was purified by passing it through powdered copperat 670 K to remove oxygen and through silica gel to remove water.A manifold supplied the gas through flow meters to the ion sourceswhere manual needle valves controlled the flow rates, which weretypically 8-10 SCCM for the sputter sources, around 10 SCCM for theassist source when being used for cleaning, and around 3 when itwas used to assist during deposition. A connection to themechanical vacuum pump permitted evacuation of the manifold andsupply lines. The manifold also supplied pure nitrogen (N2 ) from
liquid N2 boil-off for backfilling the chamber before opening. A
reservoir allowed mixtures of Ar and N2, or pure N2 , to be supplied
to the assist source to change the composition of the assist ion
beam.
7

Even though the lines from the manifold to the source valveswere kept under Ar pressure, when the source gas was first turnedon the RGA would show substantial amounts of nitrogen and oxygenfor many minutes until the lines were purged. Some of the lineswere of polymeric tubing which apparently allows oxygen andnitrogen to diffuse in and contaminate the Ar. Therefore, the lineswere evacuated and refilled before each deposition.
PROCEDURES
Deposition
Substrates were placed on the platen, sometimes clamped butmore often just restrained by wires to keep them in place. For filmthickness, measurement a piece of glass microscope slide masked witha piece of razor blade was placed near the substrates. Nickel foilsubstrates were often used for analysis of the film by Rutherfordbackscattering spectrometry (RBS). To deposit films of MoS 2 on abase layer (6,2) of titanium nitride (TiN), TiN and Mo targets weremounted in the left target holder and S in the right. The stage waspositioned to the left. Before the chamber was closed, pure N2 gas
from a hand-held nozzle was used to blow loose particulates fromchamber, ion sources, and substrate surfaces. Three to four hourswere allowed fcor the chamber to pump down to base pressure,typically 3 x 10⁻⁷ Torr.
During the coating process the procedure and the operatingparameters were recorded on data sheets which are shown in Figs.2 and 3, filled out with data from a typical run. The processingsteps are listed at the bottom of Fig. 2: The substrates weresputter cleaned using the assist beam at 40 mA for 3 minutes withthe platen rotating, and in this case heated to 2000C. The TiNtarget was then selected, and the base layer deposited using theleft sputter source at 1100 V and 70 mA, with an assist beam of3.5 mA. An Ar flow of only 3 to 4 SCCM was needed to operate the
8

assist source at these low powers. Sputtering was done for one or
two minutes to clean the target, then platen rotation was started,the stage cover was withdrawn, and the crystal monitor and timerwere started. The ion source operating parameters were recorded inthe body of the data sheet. At the top of Fig. 3 periodic rate andthickness data from the crystal monitor were recorded along withthe more variable source parameters and other comments or
observations.
For the top layer the Mo and S targets were selected and asimilar procedure followed. The Mo was usually sputtered at 1000
V and 50 mA, S at 1000 V and about 19 to 20 mA. Assist beam currentwas set to produce the desired ion/atom ratio, usually 0.03, which
required 4 to 5 mA. The quantitative factors involved will bediscussed later. In the case shown, an 8.2-mA beam was used,
resulting in an ion/atom ratio of 0.075.
Thickness Measurement
The thickness of each film was determined from measurement ofthe step height at the edge of the masked area on glass with
Tolansky interferometry. To make the step uniformly reflective itwas coated with sputtered aluminum applied in a separate process
with the same apparatus (4 minutes at a beam power of 45 W). This
allowed step heights to be measured to an accuracy of 5-10 nm. A
correction for the depth of the sputter cleaning etch was added tothe step height, and data from the crystal monitor were used toapportion the thickness between the layers. As an example, the data
of Fig. 3 show the step height was 280 nm. The correction of 35 nmfor the 3-minute cleaning etch was added to give 315 nm, which was
140% of the sum of the crystal monitor thicknesses, acceptablyclose to the nominal tooling factor of 160 ±20%. The separatemonitor thicknesses were multiplied by 1.4 to give the calculated
values.
9

Coating Data ShootNaval Research Lab., Code 6176
Substrate A IS- S7'v- '4, qVec - )' Date ?/-3-I
M'ISlrej C-125;Stage: Mounting Inclin. 0 Ecc. Angle 30o . Swing .F*
Temp.: Cool._ Heat, set _.0_OC Max. '.LO_ Min. 1____7
Rotation: Y I N
Ion Source: Left Left Right Assist Assist
Pressure: /.1 O-V I." 9-f I.? S- 1' 6-4 •. Bas(Each source)
Gas: Flow, SCCM 1.V 9.7 ?.1 1.• ).• AlterationsMor repairsNods: (Auto., Nan.) , A A pi since last
Beam I, mA 70 50 11.Z 'fo t.Z
E, V flo oIw I-OD If" I0"
Accelerator I, mA 2.7 Z.- 0. V /.7 1 .5E, V for 125 I.z 50D gO
Discharge I, A 1.77 I.IS 0.m7 1 J, 01.5L
E, V 148.I 90. 1 4e.q _ ll.g 41 ,.o
Cathode I, A 'I. 2' 3.4. 4.02 1.10 t.Sr5
Neutralizer I, A 3.74 3.0 ;.'i All i.Z3
Neut. Emission, mA 70.1 So 19.5 3Y7 Y? .2
Beau not neut., mA - O 0 0 O O O SubstrateCovers:
Target I, mA 7 1 -6 Close1 Open-Process Target: - In, mA
1. OC IAAg f 6 l
2. SAS T-7 /3.5aM... . . . . .. . . . .. . . . . .-. . . . . . .
4.
Fig. 2 - Coating data sheet, page 1.
Ion Sources
Measurements have shown that sputter deposition rates
increased with beam current and energy until, as shown in Fig. 4,
a maximum and a sharp drop were found as voltages were increased
above 1150 V. It is thought that the beams expand and lose
intensity at higher voltages, perhaps due to mutual repulsion of
10

Coating Data Sheet 2
Data 71-3-/a
Flow meter zero readings: L- 0.10 R- -0-01C A- 0.11.
Left
Base Time, in. A/s Ieut..V11. 2*.i t
1 0 .1 -O.V 2/ j. O 4 117'L
-i 3 o 7 3.37 3? -11T
51).61 301 79
2.02. .5
Top 1 .?-7.o jig 3.51 3.5 I,,"
/I.S"3 '20-. U 1 3. a t t 53 Z-~i*'Vr
6 .I-2.3 757 57
1 g11;4 2.7 17
)2. #53'1 17
15 2. 2. Z 5 )Is 2.5 It
I • 2or) 7.PPED
Thickness: - fringes - 210 na
Plus sub. etch 35 315 na Total Thickness
tield - 11O % of Xtal monitor thickness.
Calc. Thickness Calc. Rate Rc&,.
Base 3o nm 3 , nm/sin. ... , Ion/Atom
Top Z 1? 17.7 0.075
Fig. 3 - Coating data sheet, page 2.
the ions. Expansion of the beam can be detected visually as the
energy approaches 1500 V. Therefore, 1100 V was the maximum, and
1000 V the most commonly used energy. Beams of high intensity are
desirable to maximize the sputtering rate and reduce the time
needed, but repeatability is even more important in quantifying
the relationship between the operating parameters and film
composition and properties.
11

One problem encountered with 16
the sputtering ion sources was 14 70 mA *
Cthat the beams were not always E- 12
coaxial with the source housings, E
even though the grids were kept • 10 60mA
accurately aligned. This caused d 8
the beam axes to be off of the gtarget centers, threatening toalter the geometry and sputtering 4
rate or sputter contaminants from 2 ....... . .the target holders or shields. 600 800 1000 1200 1400 1600
Beam alignment was difficult to BEAM ENERGY,V
check visually through the Fig. 4 - Deposition rate forviewports, even when operating in molybdenum sputtered at t,4o
beam currents and several beakzmanual mode with the neutralizer energies. Bars show the rangefilaments off. Aluminum foil of the data.placed over the targets was usefulin determining the aiming, as the beams would melt a hole in it ina few seconds, marking the position of maximum intensity.Adjustments were made by placing Teflon spacers between the sourcebodies and their sockets to tilt the axes in the proper directions.
Some care was needed to keep the ion sources operatingproperly. Neutralizer filaments lasted only about an hour when thesource was operated at high power due to erosion of the tungstenwire. New filaments draw about 6 A at high beam currents. The
filament current declines steadily as the wire erodes, and failureis imminent when it reaches 3 A. The data in Figs. 2 and 3, for
example, show that the left source neutralizer was in need ofreplacement before the next use.
Cathode filaments last much longer, but replacement maytemporarily reduce the maximum attainable beam current to around25 to 40 mA when the filament power supply reaches its limit. This
problem can sometimes be circumvented by placing the new filament
12

and anode subassembly in the right source and moving the right
subassembly with the "broken-in" filament to the left source.
Increasing the gas flow rate may also help to increase the bean
current. It has been found that a cathode filament can be nbroken
in" by the following procedure: Turn on the source gas flow. Set
power supply to Manual mode, turn on Source power, but leave Bean
off. Set Discharge and Cathode at maximum. The cathode current,
typically about 8.2 A, will slowly decrease. When it reaches 8.0 A
the source should be able to produce a 50 mA beam. Test it and
continue the "break-in" process if necessary.
ASSIST BEAM FLUX MEASUREMENT
For many materials, ion beam sputtering deposits more densefilms than rf or dc plasma sputtering because it is a higher-energy process. Not only do the sputtered atoms arrive with moreenergy, but the growing film is also bombarded by energeticreflected ions and atoms. The ion assist beam provides anadditional controlled source of energetic ions (7,8). In thedeposition of MoS2 the assist beam flux affects the orientationand crystallinity and thus the tribological behavior of the film(6,3).
Measurements of the assist ion flux (current density) at
various beam currents at 1000 V were made with an electro-
statically suppressed Faraday cup having an aperture of 0.25 cm2 .
Placed at the usual substrate-to-source distance of 16 cm, the cup
could be traversed across the beam to determine the flux 6-crease
with off-axis distance. A potential of -50 to -140 V, depending
upon the ion flux, was applied to the suppressor electrode. The
necessary potential was determined by starting with a low value and
increasing it until a constant cup current was reached. The chamber
pressure was either at a low level, about I x 10-4 Torr, or at
typical operating level of 4 x 10"4 Torr (0.05 Pa).
13

Some of the resulting profiles are shown in Fig. 5. Theincrease in ion flux with current and the effect of pressure canbe seen. (Lower pressure increased the flux by reducing thecollisions between bean ions and gas.) The ion flux was found todecrease to half of its maximum at a distance of 4 cm from the beanaxis. Over a range of beam currents from 1 to 40 mA, the ion fluxwas found to fit a power law relationship with the beam current sothat:
F = 3.8 In ".0 [1]
where F is the mean ion flux of the five central measurements(about 5 cm diameter area) in AA/cm2 and I3 is the beam current inmA. This relationship and the regression line are shown in Fig. 6.
I000 1000
E4 E
0[ 20 LOWA ' 8 LOW
04 LOW4 HIGH
00 2 4 6 8 10 12 110 100
ix
POSITON OF FARADAY CUP, cm BEAM CURRENT, mnA
Fig. 5- Assist beam ion f lux Fiq. 6- Relationship betweenprofiles at three beam currents the mean of the f ive centraland two chamber pressures as a measurements of assist beam ionfunction of distance along the flux and the beam _c rrent at abeam 1 i:ýjmeter. Low pressure a pressure of 4 x 10---Torr.1 x I0- Tort, high pressurea4 x 10-4 Torr.
14

The flux of Eq. (1] does not include bombardment by Ar
neutralized by charge exchange collisions in the path between the
assist source and the substrate, as they would not be detected by
the Faraday cup. The total flux of all energetic particles was
probably about 1.5 x larger (9).
DEPOSITION RATE CONTROL
Ordinarily, the highest possible sputter deposition rate is
desired in order to expedite the coating process. However, whentwo different targets are cosputtered to produce a film of mixed
composition, the two deposition rates must be known and controlled
to give the desired composition.
mos, and Sulfur
Films made by sputtering an MoS 2 target were very depleted of
sulfur (S/Mo - 1.1-1.3). To achieve stoichiometry by sputtering
MoS 2 with a small amount of sulfur added from a S target, it was
sufficient to sputter the MoS 2 at the maximum rate and try several
S beam powers. The resulting films were analyzed by RBS and the
beam power corresponding to a S/Mo ratio of 2 was determined.
Stoichiometric films were deposited at rates of 7 to 11 nm/min by
this process, using an MoS2 sputter power of 77 W and a S sputter
power around 4 W.
Molybdenum and Sulfur
Cosputtering No metal and S to form MoS 2 was found to give
higher deposition rates, 15 to 35 nm/min, but with quite variedS/Mo ratios. To achieve the desired stoichiometric ratio moreknowledge of the effects of the ion beam parameters on the sputterdeposition rates of Mo and S separately was needed.
S~15
__

In order to make immediate deposition rate measurements, the
quartz crystal monitor was placed at the usual substrate position,
11.9 cm from the Mo target and 17.5 cm from the S. Deposition ratesfor No were measured at beam energies from 700 to 1500 V and beamcurrents from 10 to 70 mA. Rates increased with increasing currentand energy up to 1150 V. At 1200 V and above the rates declinedsharply as noted above in the discussion of Fig. 4. Over the rangeof 700 to 1100 V, the deposition rate and the beam power closelyfit a power law relationship with the log of the deposition rateproportional to the log of the product of beam current and energy,
as shown by the rectangular markers in Fig. 7. The equation of theregression line (parallel to but above the line shown) is
D.. = 0.035 P[ 1 3 (2]
where D is the rate in nm/min and P is the sputter beam power inwatts.
Similar experiments were then done with the sulfur targetyielding much higher rates, shown by the "X" markers in Fig. 7,and a line with a steeper slope (not shown). Subsequentcodepositions gave still higher rates. Either the monitor was notaccurate in measuring the deposition of pure S, or the stickingcoefficient of S is higher when codeposited with Mo than when itis deposited alone.
At this point it was realized that the crystal monitor could
not be relied upon to give accurate calibration data for the S
deposition rates. A number of films were prepared using a constant(50 W) beam to sputter Mo and varied S sputter powers, and analyzedby RBS to determine their S/Mo ratios. The S deposition rates werethen calculated using the equation
Do - 1.647 Duo (S/Mo) [3]
16

a OMw xCAJi CIL 0 Lb atVW 1 ChdJodx
W+ x
4+
4.4D.
CE
x
<(z xo°
w
a×
0 x
o.I I1 - I II I I I I 1 1 1
0 1 10
SPUTTER ION EAM POWER, WattS
Fig. 7 - Deposition rates vs sputter powers for Mo and S on thecrystal monitor, 19 points for Mo sputtered at 50 W, 18 points for
(10).codeposited with Mo, and the regression lines of Eqs. [9] and
based on the fact that the atomic density of Mo is 1.647 times that
of S. The value of D. was that from the Eq. (2] using 50 W as the
power. From 13 data points a regression line having the equation
DS I 0.00039 pa3.7 [4]
17

was found. The relatively high sputter rate for S is notunexpected, as sputter rates for various materials have been shownto increase rapidly when their temperatures were brought up towithin about 2000 of their melting points (10). Not only does Shave a low melting point, but its relatively low thermalconductivity allows the target surface to be heated more by theion beam. This causes accelerated sputtering and lose of controlat higher beam powers.
Film deposition rates (D.) can be calculated from themolecular weight and density of MoS2 and the atomic weights anddensities of Mo or S, as experiments have shown that IBAD MoS2 isnormally deposited with nearly bulk density (1). The filmdeposition rate is that of the MoS2, either
160.07 x 10.2 x Duo=3.545 Duo
4.8 x 95.94
or
160.1 x 2.07 x Ds= 1.077 Ds
4.8 x 32.06 x 2
plus that of the excess element from Eq. [3],
DS- D., x 2 x 1.647 - Ds - 3.294 Duo
, orS~DS
SDo - DNo - 0. 304 DsS~3.294

which can be simplified to give:
For S/Mo k 2: Dr - 0.251 DKo + Ds, [5)
For S/Mc < 2: DF -0.773 DS + Do. (6]
Improved Mo and S Data
After accumulating data for 27 films analyzed by RBS, more
accurate constants for Eqs. (2] and (4] were obtained. For 19 films
deposited using PHo of 50 W, the Mo deposition rates were
determined from measured film deposition rates and the RBS S/Mo
ratios (diamond markers in Fig. 7). The equations used were derived
by combining Eq. (3] with Eq. [5] or [6]:
For S/Mo ? 2: Duo = DF / (0.251 + 1.647 (S/Mo)) [7]
For S/Mo < 2: Duo = Dp / (1.273 (S/Mo) + 1) (8]
The geometric mean of these rates was used to correct the
coefficient of Eq. [2] to give
D.. - 0.030 PK01"38 [9].
Corrected S rates were then determined from 18 of the 27
films, excluding those with ion/atom (R) ratios > 0.08 and S/Mo > 3
or < 1.5. The films with higher R's were excluded because the
assist beam sputters the film, especially the S, reducing the
growth rate. Eq. [3] was used again to find D., using the RBS S/Mo
ratios and D.,'s calculated using Eq. [9]. The resulting
replacement for Eq. 14] was
19

D= = 0.0031 Ps 3 . 0 [10].
Although Eqs. (4] and (10] appear to have quite different slopes
and intercepts, the lines intersect at 17 W and are quite close inthe region where most of the films were made. For these 18 films,the mean of the measured D. divided by that from Eq. (5] or (6] was
0.99 ±0.19 and the mean of the RBS S/Mo divided by that from Eq.[3] solved for S/Mo was 1.02 ±0.15.
Shown in Fig. 7 are the adjusted regression line of Eq. [9]for Mo, the 18 points for S codeposited with Mo (+ markers), and
the line for Eq. [10].
When the measured and calculated deposition rates for 122
films were compared, it was noted that a group of films havingmeasured rates > 27 nm/min straggled away from the rest. Theseappeared to have high S/Mo ratios and low densities, and may have
resulted from abnormally high S sputter rates.
Assist Beam Effects
When the ratio of measured / calculated rates were plotted as
a function of R (assist beam ions / film atoms deposited), loss due
to sputtering by the assist beam was readily apparent. This plotis shown in Fig. 8 with the high-rate data (D. > 27 nm/min) shown
but separated from the normal rate data (DF < 27 nm/min). A
suitable corrected calculated rate derived from the slope of the
solid line was
D =' = DF(l - 2.5R) [11].
(R 5 0.4)
The assist beam R was calculated from the molecular weight
and density of MoS 2 , number of atoms per molecule, elementary
20

0w
-J & -< 27 xD > 2700 2J
0 15
mX
S xX X X
<
Z0
,
0It
z
A A
Fig. 8 - Ratio of measured to calculated film deposition rates vsassist beam ion per atom ratios for IBAD MoSR films deposited atnormal (D < 27 nm/min.) and high (D > 27 nm/mmn.) rates.
charge, Avogadro constant, measured deposition rate, and beam flux.
The latter was the experimentally determined Eq. [E] times a
correction factor for decreasing beam flux with off-axis distance.
For pure MoS 2 and a beam flux correction of 0.5 this calculation
is:
21

(160 g-Mole-1 x 6.25 x 1012 Ion-*A- 1.s- 1 x 3.8
x Ia1. 0 9 &AAcm- 2 x 0.5 x 60 s'minj- 1 x 10⁷ nm-cm1-)
(4.8 g-cm"3 x 3 Atom'Molec. -1 x 6.02 x 1023 Molec.-Mole-
x DF nm'min -1)
which reduces to
R = 0.13 IB5 '09 / DF [12]
in ions/atom where D was determined from the measured film
thickness in nm and the duration of the deposition in minutes.
In order to have a means of calculating R from the sputterand assist ion source parameters and independent of the assumedstoichiometry and density of MoS 2, the equation
R = 0.012 aI'09 / (0.106 Duo + 0.0646 Ds) [13]
was derived in the same manner as Eqs. (5] and (6] and again
includes the 0.5 correction factor. For all films the R'sdetermined by both methods agreed within a factor of 2, and the
agreement was much better when the high-rate films were excluded.
The R's from Eq. [12] were about 1.25 x higher than those from Eq.
[13] because the former were based on the final film thicknesswhile the latter were based on the arrival of Mo and S at the
substrate and did not allow for sputtering loss. Although the R
from Eq. [12] has been used as a film parameter in our previousstudies, that from Eq. [13] may be more fundamentally important,
as it shows what mix of atoms and ions arrived at the substrate to
interact and form the film. An iterative correction using Eq. [11]
can be applied to Eq. [12] to give R as a ratio to the arriving
atoms:
22

R' = R (1 - 2.5 R) [14]
(R : 0.15).
The conformance is _
shown in Fig. 9, .1where the ratios aCbased on film 0thickness and Eq. 0 075
[12] as corrected Wby Eq. [14] can be 0
.0 0compared with Eithose based on the 0atom and ion 0arrival rates and 0Eq. (13]. U 0----Similarly, the
inverse of Eq. WE(14] can be used a
to convert Eq. T
[13] to the ratio 9 0 rt M
of ions per atoms
in the finished Fig. 9 - Conformance of ion/atom ratiosbased on the film thicknesses and correctedfilm: for sputtering losses with those calculatedfrom atom and ion arrival rates.
R' = (1 - V(l - 10 R)) / 5 (15]
(R • 0.09).
Film and Process Parameter Calculation Summary
In summary, to calculate the film parameters from the processparameters (beam powers) Eqs (9] and [10] are used to find the
23

elemental deposition rates. Eq. [3] is rearranged and solved forthe S/Mo ratio, and the appropriate Eq. [5) or [6) is used to find
the film deposition rate. The arrival-based R is found from Eq.
[13], and then the sputter loss correction of Eq. [11] can beapplied to the rate. If R based on the finished film thickness is
preferred, the correction of Eq. [15) can be applied.
To find the process parameters needed to produce a desiredfilm, Eq. [9] is combined with Eq. [10] solved for P5 and Eq. (3]
to give
PS = 3.23 PHo0 . 4 6 (16]
when S/Mo is taken as 2.1 to provide a slight excess of S. A Mo
sputter power is then chosen in the range of 50 to 65 W. Lowe-powers allow better control, as the S deposition incrr'ases rapidlyat higher powers. To set the assist beam current, - 2xpected D. is
calculated from Eq. [9), [10), and [5). Then from the sameconsiderations as for Eq. (12],
is = (3.77 R D7 / 0.5)0.91 [17)
where 0.5 is the off-axis beam flux correction and D. is in nm/min
In practice, the cono.an- was mult..plied by 6 so that the rate was
in Al/s (the units disp-..ed by the ciystal monitor) and multiplied
by 1.6 ýo compensate for the "tooling factor" to give
IB = (72 R D,)0" [18]
and a table for the desired R and a range of rates was prepared.
During deposition the current was adjusted in accordance with thetable for the rate measured by the crystal monitor.
24

Composite Mo-S Target
For coating non-planar substrates and forming filr.s of MoS 2
alloyed with other metals a means of sputtering a controlled ratioof Mo and S from a single target was desired. Kuwano and Nagai (11)used a composite target to vary the stoichiometry in theirdeposition of MoS 2 and WS2 films. A sulfur target was overlaid by
overlapping fan-shaped segments of metal foil. The stoichicmetry
was changed by altering the angle of overlap. In their system,using a large target and relatively low beam intensity, areas of68% S and 32% Mo were found to give films with S/Mo = 2. Thisarrangement provides little cooling for the Mo foil, which couldget quite hot in our smaller but more intense beam. Aiming andstability of the beam would also be more critical, because movementof the beam of f of the center of the sectors would change thesputtering ratio. With our apparatus, the high sputter yield of Srelative to that of Mo and their different responses to beam poweras shown by Fig. 7 and Eqs. [9] and [10] indicated that a compositetarget with a relatively low S area would be needed to give filmswith a S/Mo ratio of 2, and that the ratio could be adjusted by
changing the sputter beam power.
An experimental composite target was prepared by drillingshallow holes in a Mo target as shown in Fig. 10. Twelve holes of0.20 inch (5.1 mm) diameter were made in a square grid pattern with
a 5/8 inch (1.6 cm) spacing, and then filled with molten sulfur byplacing powdered S in them and heating the target. After the targetcooled and the S solidified, the surface was scraped and abradedto remove any excess S. The resulting S and Mo areas in the central
portion of the target were 8% S and 92% Mo. Gradual cooling of themolten S was found to be important to prevent cracking. Cracksinterfere with heat transfer through the S to the Mo, causing
melting and rapid loss of the S.
25

. in. This target performed reasonably well f or
thin films, though the deposition rate had3nO.D. to be held down to avoid high S/No ratios
W (12). The target required replenishmento 0 0 0 after each use to maintain the S yield,
o 0 0 0i and also tended to produca excessive
amounts of S at the start of a deposition,
then decreasing amounts as the reservoirswere depleted. Figure 11, for example,
shows the composition with depth from RBS
data of an MoS. + Pb film prepared by
Fig. 10 - Composite sputtering at constant powers from a Pbmolybdenum and sulfur target and the composite Mo + S target.sputtering target.
The initial deposit was too rich in S,
with S/Mo > 8, while the final deposit at
the surface was about that desired, S/Mo = 2. The best endurance
was obtained with minimal excess S.
Deposition of Various Metals
In order to make metal- so
alloyed MoS 2 films and mixed metal
films, several metals have been
deposited at different beam powers 2
to determine their rates for 11.9
cm target to substrate distances. P
All of these yielded rate vs beam z
power plots with slopes similar to Z 20that of Mo data shown in Fig. 7. MO
There was no systematic variation 0.
in these slopes, and their 0 200 400 600
differences were not great DEPTH, n
compared with their statistical Fig. 11 - Composition vs depth
uncertainties. It was therefore profile of a film deposited by
considered likely that a formula sputtering from Pb andcomposite Mo + S targets.
26

with a fixed exponent and different coefficients would adequately
fit the data. A weighted mean of the exponents gave 1.45, so the
data for each metal were fitted to:
Do = C Ps 1 .S (19].
The coefficients, C, for the metals were: W: 0.011, Mo: 0.0236,Ni: 0.031, Co: 0.034, Cu: 0.045, and Pb: 0.11. Between 25 and 50
watts, the rates calculated with this equation and those using
individual exponents did not differ by more than 10%. The Mo ratedid not vary more than 3% from that calculated with Eq. [9]. Most
discrepant were the results for Pb.
Effect of Target Distance
Although the sputtered areas on the targets are not point
sources, it was found in this work that the difference indeposition rate at a given power could be adequately estimated from
the inverse of the squares of the radii:
D, / D2 = r 22 / r.2 (20]
where r is the radius (distance from the target to the substrate).
This makes possible the modelling of dual target deposition fromgeometric considerations and individual deposition rates, and was
used to correct some of the data for metals which were sputtered
from radii other than 11.9 cm.
Uniformity of Deposition
Since the distances from the targets to various points on the
platen differ substantially, the instantaneous deposition rates
across it are not uniform. Rotation of the platen reduces this
problem but cannot eliminate it since the gradient is not linear.
Experiments have shown that substrates at the platen edge receive
27

about 80% as much thickness as at the center.
Intentional Composition Gradients
Films with compositions varying across the surface can be made
by cosputtering from two different targets onto a non-rotating
substrate. Mixed metal films on glass for a study of double-oxide
friction were prepared in this manner. A metal plate long enough
to support two microscope slides end-to-end was fastened to the
platen, and the stage was moved to its lowest position and
centered. The plane of the substrates was 16 cm below the targetcenters, which were 9.5 cm from the chamber center plane. Theslides were positioned with their lengths perpendicular to thecenter plane and extending 7.6 cm from it. For any position P alongthe substrate a distance LP from the left end, the radii from theleft (L) and right (R) targets were
rL2 . 260 + 3.8 LP + LP2 [21]
r.2 = 549 - 34 LP + LP2 [22].
Expected deposition rates at points along the substrates could bepredicted from Eq. (19] corrected by Eq. [20] for the radii foundfrom Eq. [21) and [22]. The expected totals could be compared withrates from measured thicknesses, and the theoretical rate andcomposition profiles adjusted to fit. With the beam powers set togive equal rates from both targets, the composition was predictedto be 67% of metal from the closer target at each end with areasonably linear gradient to equality in the center.
SUMMARY
The apparatus and techniques used for ion-beam-assisteddeposition of films, principally of MoS 2 on top of a base layer of
TiN, are described. The most efficient technique for depositing the
28

MoS2 was found to be by codeposition of No and S from separate
targets. The Mo and S deposition rates and assist ion flux have
been measured and simple formulae have been found to relate them
to the operating parameters. This allows films of the desired MoS2
composition and optimum assist ratio to be prepared usingparameters calculated by Eqs. [16] and [18]. Alloyed and graded-composition metal films can likewise be prepared using the guidance
of Eqs. (19] through [22].
ACKNOWLEDGMENTS
We would like to thank the S.D.I. Organization for equipment
funding, SDIO and NRL/ONR for program funding, Graham Hubler of NRLfor advice on Faraday cup design and the effect of ion sourceoperating parameters on the beam properties, and C.R. Gossett, SPA,
Inc., for Rutherford backscattering analyses.
RZFERENCES
1. Bolster, R.N., Singer, I.L., Wegand, J.C., Fayeulle, S., andGossett, C.R., "Preparation by Ion-Beam-Assisted Deposition,Analysis, and Tribological Behavior of MoS 2 Films," Surf. Coat.
Technol., 46, pp. 207-216 (1991).
2. Seitzman, L.E., Singer, I.L., Bolster, R.N., and Goseett, C.R.,"Effect of a Titanium Nitride Interlayer on the Endurance andComposition of a Molybdenum Disulfide Coating Prepared by Ion-Beam-Assisted Deposition," Surf. Coat. Technol. 51, pp. 232-236
(1992).
3. Seitzman, L.E., Bolster, R.N., and Singer, I.L., "X-RayDiffraction of MoS 2 Coatings Prepared by Ion-Beam-Assisted
Deposition," Surf. Coat. Technol. 52, pp. 93-98 (1992).
29

4. Kaufman, H.R., "Technology and Applications of Broad-Beam IonSources Used in Sputtering. Part I. Ion Source Technology," J. Vac.
Sci. Technol., 21, pp.725-736 (1982).
5. Harper, J.M.E., Cuomo, J.J., and Kaufman, H.R., "Technology andApplications of Broad-Beam Ion Sources Used in Sputtering. Part II.Applications," J. Vac. Sci. Technol., 21, pp.737-756 (1982).
6. Kuwano, H., and Nagai, K., "Friction-Reducing Coatings by DualFast Atom Beam Technique," J. Vac. Sci. Technol., A 4, pp. 2993-2996 (1986).
7. Harper, J.M.E., Cuomo, J.J., and Hentzell, H.T.G., "QuantitativeIon Beam Process for the Deposition of Compound Thin Films," Appl.Phys. Lett., 43, pp. 547-549 (1983).
8. Rossnagel, S.M., and Cuomo, J.J., "Film Modification by LowEnergy Ion Bombardment During Deposition," Thin Solid Films, 171,pp. 143-156 (1989).
9. Hubler, G.K., "Fundamentals of Ion-Beam Assisted Deposition:Technique and Film Properties," Mater. Sci. Eng. A, Struct. Mater.,Prop. Microstruct. Process. (Switzerland), A115, pp. 181-192(1989).
10. Kelly, R., "Thermal Effects in Sputtering," Surface Sci., 90,
p. 280 (1979).
11. Kuwano, H., and Nagai, K., "Thin Solid Lubricant Film Formationby Fast Atom Bombardment Sputter Deposition," J. Vac. Sci.
Technol., A 3, pp. 1809-1812 (1985).
12. Bolster, R.N., and Singer, I.L., "IBAD MoS 2 Film Deposition
From a Composite Target," NRL Letter Report 6170-431A of 17 October
1990
30