Embed Size (px)
Citation preview

Iometer User’s Guide
Version 1.1.0
Iometer project, iometer-[user|devel]@lists.sourceforge.net
Information in this document is provided in connection with Intel products. No license, express or implied, by estoppel or otherwise, to any intellectual property rights is granted by this document. Except as provided in Intel’s Terms and Conditions of Sale for such products, Intel assumes no liability whatsoever, and Intel disclaims any express or implied warranty, relating to sale and/or use of Intel products including liability or warranties relating to fitness for a particular purpose, merchantability, or infringement of any patent, copyright or other intellectual property right. Intel products are not intended for use in medical, life saving, or life sustaining applications.
Intel may make changes to specifications and product descriptions at any time, without notice.
Copyright © Intel Corporation 1996-1999. *Third-party brands and names are the property of their respective owners.

Table of Contents
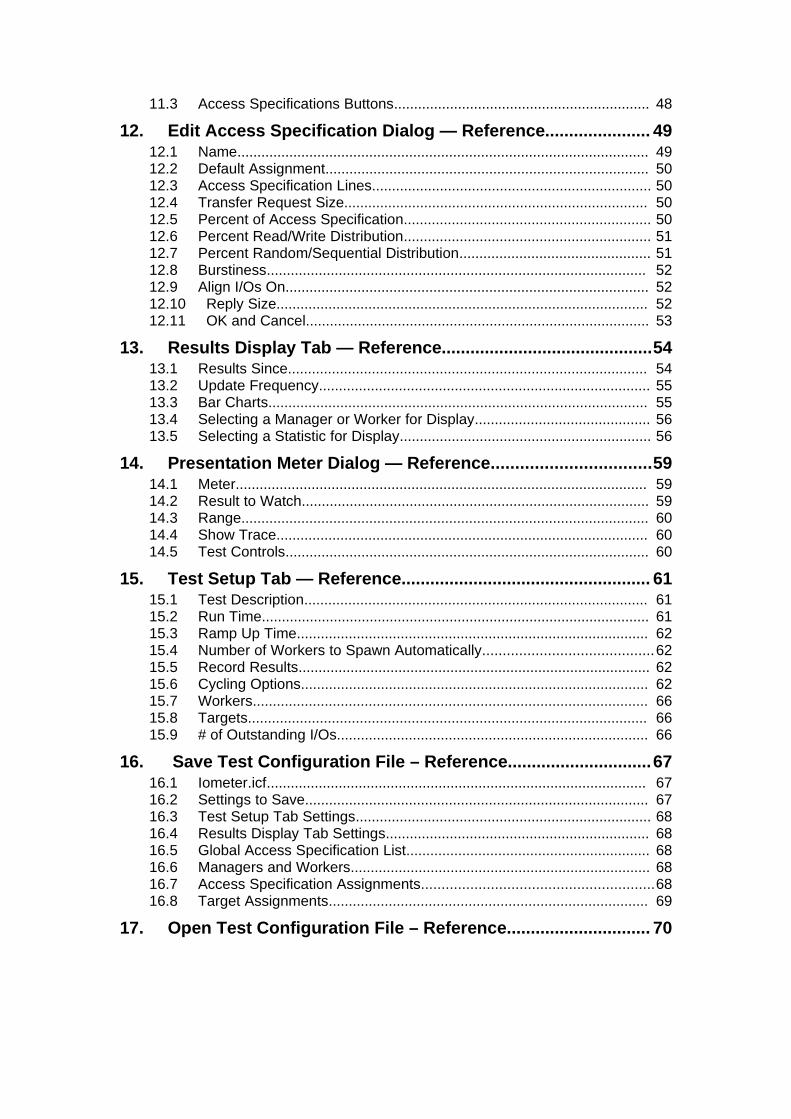
1. Introduction....................................................................................61.1 About this Document................................................................................... 61.2 About Iometer.............................................................................................. 61.3 What's new?................................................................................................ 71.4 System Requirements................................................................................. 71.5 Obtaining Iometer........................................................................................ 71.6 License Agreement..................................................................................... 7
1.6.1 Bug Reports and Feature Requests................................................. 81.6.2 Use of Iometer Results..................................................................... 8
2. Installing Iometer........................................................................... 8
3. Running Iometer............................................................................ 8
4. Quick Start ...................................................................................10
5. Using Iometer...............................................................................135.1 Toolbar — Introduction.............................................................................. 145.2 Status Bar — Introduction......................................................................... 155.3 Topology Panel — Introduction................................................................. 165.4 Disk Targets Tab — Introduction.............................................................. 175.5 Network Targets Tab — Introduction........................................................ 195.6 Access Specifications Tab — Introduction................................................ 215.7 Edit Access Specification Dialog — Introduction......................................235.8 Results Display Tab — Introduction.......................................................... 255.9 Presentation Meter Dialog — Introduction................................................ 275.10 Test Setup Tab — Introduction............................................................... 285.11 Save Test Configuration File — Introduction.......................................... 305.12 Open Test Configuration File — Introduction.......................................... 31
6. Toolbar — Reference .................................................................33
7. Status Bar — Reference..............................................................35
8. Topology Panel — Reference..................................................... 36
9. Disk Targets Tab — Reference...................................................389.1 Targets...................................................................................................... 389.2 Maximum Disk Size................................................................................... 399.3 Starting Disk Sector.................................................................................. 409.4 # of Outstanding I/Os................................................................................ 409.5 Test Connection Rate............................................................................... 40
10. Network Targets Tab — Reference.......................................... 4210.1 Targets.................................................................................................... 4310.2 Network Interface to Use for Connection................................................ 4410.3 Max # Outstanding Sends....................................................................... 4510.4 Test Connection Rate............................................................................. 45
11. Access Specifications Tab — Reference................................4611.1 Global Access Specifications List........................................................... 4611.2 Assigned Access Specifications List....................................................... 47
11.3 Access Specifications Buttons................................................................ 48
12. Edit Access Specification Dialog — Reference...................... 4912.1 Name....................................................................................................... 4912.2 Default Assignment................................................................................. 5012.3 Access Specification Lines...................................................................... 5012.4 Transfer Request Size............................................................................ 5012.5 Percent of Access Specification.............................................................. 5012.6 Percent Read/Write Distribution.............................................................. 5112.7 Percent Random/Sequential Distribution................................................ 5112.8 Burstiness............................................................................................... 5212.9 Align I/Os On........................................................................................... 5212.10 Reply Size............................................................................................. 5212.11 OK and Cancel...................................................................................... 53
13. Results Display Tab — Reference............................................5413.1 Results Since.......................................................................................... 5413.2 Update Frequency................................................................................... 5513.3 Bar Charts............................................................................................... 5513.4 Selecting a Manager or Worker for Display............................................ 5613.5 Selecting a Statistic for Display............................................................... 56
14. Presentation Meter Dialog — Reference.................................5914.1 Meter....................................................................................................... 5914.2 Result to Watch....................................................................................... 5914.3 Range...................................................................................................... 6014.4 Show Trace............................................................................................. 6014.5 Test Controls........................................................................................... 60
15. Test Setup Tab — Reference.................................................... 6115.1 Test Description...................................................................................... 6115.2 Run Time................................................................................................. 6115.3 Ramp Up Time........................................................................................ 6215.4 Number of Workers to Spawn Automatically..........................................6215.5 Record Results........................................................................................ 6215.6 Cycling Options....................................................................................... 6215.7 Workers................................................................................................... 6615.8 Targets.................................................................................................... 6615.9 # of Outstanding I/Os.............................................................................. 66
16. Save Test Configuration File – Reference..............................6716.1 Iometer.icf............................................................................................... 6716.2 Settings to Save...................................................................................... 6716.3 Test Setup Tab Settings.......................................................................... 6816.4 Results Display Tab Settings.................................................................. 6816.5 Global Access Specification List............................................................. 6816.6 Managers and Workers........................................................................... 6816.7 Access Specification Assignments.........................................................6816.8 Target Assignments................................................................................ 69
17. Open Test Configuration File – Reference.............................. 70

17.1 Current Settings...................................................................................... 7017.2 Settings to Restore.................................................................................. 7017.3 Test Setup Tab Settings.......................................................................... 71
17.3.1 Replace/Merge............................................................................. 7117.4 Results Display Tab Settings.................................................................. 71
17.4.1 Replace/Merge............................................................................. 7117.5 Global Access Specifications List........................................................... 71
17.5.1 Replace/Merge............................................................................. 7117.6 Managers and Workers........................................................................... 71
17.6.1 Replace/Merge............................................................................. 7217.6.2 Implementation Details................................................................. 73
17.7 Access Specification Assignments.........................................................7317.7.1 Replace/Merge............................................................................. 73
17.8 Target Assignments................................................................................ 7417.8.1 Replace/Merge............................................................................. 74
18. Iometer Command Line Options.............................................. 7518.1 Getting Command Line Syntax Information............................................ 7518.2 Specifying a Configuration File............................................................... 7518.3 Specifying a Results File......................................................................... 7618.4 Specifying a Timeout Value.................................................................... 7618.5 Omitting Switches................................................................................... 7618.6 Batch Mode............................................................................................. 76
19. Dynamo Command Line Options............................................. 7819.1 Getting Command Line Syntax Information............................................ 7819.2 Specifying a Computer Name................................................................. 7819.3 Specifying a Manager Name................................................................... 7819.4 Specifying a Manager Network Name....................................................7819.5 Specifying excluded filesystem types.....................................................7819.6 Omitting Switches................................................................................... 79
20. The Iometer Configuration File (.icf)........................................ 8020.1 Version.................................................................................................... 8020.2 File Sections............................................................................................ 8020.3 Backward Compatibility........................................................................... 81
21. Configuring Windows NT* and Windows 2000* to Collect Network Performance Statistics.................................................. 8221.1 To configure Windows NT*:.................................................................... 8221.2 To configure Windows 2000*:................................................................. 82
22. Using Iometer to Simulate a Real Workload...........................83

1. Introduction
Iometer is an I/O subsystem measurement and characterization tool for single and clustered systems. Iometer is pronounced “eye-OM-i-ter,” to rhyme with “thermometer.” Iometer does for a computer’s I/O subsystem what a dynamometer does for an engine: it measures performance under a controlled load. Iometer was formerly known as “Galileo.”
Iometer is both a workload generator (that is, it performs I/O operations in order to stress the system) and a measurement tool (that is, it examines and records the performance of its I/O operations and their impact on the system). It can be configured to emulate the disk or network I/O load of any program or benchmark, or can be used to generate entirely synthetic I/O loads. It can generate and measure loads on single or multiple (networked) systems.
Iometer can be used for measurement and characterization of:
• Performance of disk and network controllers.• Bandwidth and latency capabilities of buses.• Network throughput to attached drives.• Shared bus performance.• System-level hard drive performance.• System-level network performance.
1.1 About this DocumentThis document is a combination User’s Guide and External Product Specification for Iometer. It provides a description of each external interface element (GUI control) and some guidance on using the controls to achieve desired results.
This version of the document is dated December 16, 2003.
1.2 About IometerIometer consists of two programs, Iometer and Dynamo.
• Iometer is the controlling program. Using Iometer’s graphical user interface, you configure the workload, set operating parameters, and start and stop tests. Iometer tells Dynamo what to do, collects the resulting data, and summarizes the results in output files. Only one copy of Iometer should be running at a time; it is typically run on the server machine.
• Dynamo is the workload generator. It has no user interface. At Iometer’s command, Dynamo performs I/O operations and records performance information, then returns the data to Iometer. There can be more than one copy of Dynamo running at a time; typically one copy runs on the server machine and one additional copy runs on each client machine.
Dynamo is multithreaded; each copy can simulate the workload of multiple client programs. Each running copy of Dynamo is called a manager; each thread within a copy of Dynamo is called a worker.

1.3 What's new?The current version of Iometer is 2003.12.16. Here are some of the more significant changes since the last version (2003.05.10):
New features:
• Enormous code changes due to code cleanup and portability enhancements.
Bug fixes:
• Fixed the 2 GB limit in the Disk Target tab (Max Disk Size field).
• Solaris: Fixed segmentation fault when having multiple swap devices.
For a complete list of all enhancements and bug fixes since the previous version, please see the file "CHANGELOG".
NOTEIt is important to keep in mind, that resuls might not be comparable between two different Iometer versions. For example if there was an error in the old version you might see this effect.
1.4 System RequirementsIometer currently runs under Windows NT* 4.0. It requires a screen resolution of at least 800x600, and needs approximately 4 MB of free memory.
Dynamo currently runs under Windows NT 4.0. It needs approximately 2 MB of free memory, plus 4 MB of memory per worker.
Some testing has been done under Beta releases of Windows 2000. This version of Iometer ran properly under the most recent release tested, but it may not work with other releases. Please report any problems you may encounter.
1.5 Obtaining IometerThe latest version of Iometer, including the documentation, can be obtained from the Iometer project Web Site at the following URL:
http://www.iometer.org/
1.6 License AgreementIf you use Iometer, you agree to be bound by the Intel Open Software License that is displayed the first time you run a new version of Iometer. Some important terms of the agreement are highlighted below:
1. Iometer is provided “as-is”, without warranty or guarantee of any kind.2. Intel does not endorse, support, or guarantee Iometer performance results.

1.6.1 Bug Reports and Feature RequestsIometer is provided “as-is”, but shure we are interested in input from you. If you have a problem while running Iometer our found a bug you should consult the Know Issues page first:
http://www.iometer.org/doc/issues.html
There you will find workarounds for this known issues. If you have a new issue you might join the iometer-user mailing list (see http://lists.sourceforge.net/lists/listinfo/iometer-user) and ask the community for help. If it is a real bug, then please provide a patch or go ahead and file the bug at:
http://sourceforge.net/projects/iometer
We cannot promise to fix any bugs or provide any requested features, but we try to read and respond to all our mail. Be sure to include all information necessary to reproduce the problem, including the version number of Iometer. If you aren't using the current version, you will be asked to reproduce the problem using the current version before any action is taken on the bug report.
1.6.2 Use of Iometer ResultsIntel does not endorse, support, or guarantee performance results obtained using Iometer. This means that you can do anything you want with the results, including presenting them to the public and using them in advertising, but Intel is not liable for any damages resulting from such use. Any Iometer results that are presented to the public should be accompanied by the following statement: “These results were obtained using Iometer version yyyy.mm.dd, Copyright date by Intel Corporation. Intel does not endorse any Iometer results.”
2. Installing Iometer
Once you have downloaded the Iometer package and uncompressed the files, all that is necessary to install Iometer is to place the files Iometer.exe and Dynamo.exe in the same directory. If you want to run Dynamo on multiple machines, Dynamo.exe must be available on each machine (on either a local or networked disk).
A properly-configured TCP/IP network must be provided between the systems on which Iometer and Dynamo are to be run. No network is needed if Iometer and Dynamo are run on a single system.
3. Running Iometer
To run Iometer, double-click on Iometer.exe. The Iometer GUI appears, and Iometer starts one copy of Dynamo on the same machine.
You can also start Iometer and immediately load a saved setup file by double-clicking on an .icf file, dragging an .icf or.txt file to the Iometer.exe icon, or specifying an .icf or.txt file as a command-line argument. For example:
C:\> iometer myconfig.icf

If other machines will be used during testing, start a copy of Dynamo on each, providing the name of the machine running Iometer as a command-line argument. For example:
C:\> dynamo IOServer
You do not need to start more than one copy of Dynamo on any one machine. To increase the number of workers on a machine, use Iometer to start additional worker threads within that machine’s single copy of Dynamo.
See the Iometer Command Line Options section for more details.
You can start Iometer in "batch mode" by using command line parameters to specify both a configuration file and a results file. This allows Iometer to complete a series of tests and record the results without any user interaction. For example:
C:\> iometer /c bigtest.icf /r bigtest_results.csv
See "Batch Mode" for more details.

4. Quick Start
This section is a rapid introduction to Iometer that will help you get up and running fast.
To test disk performance:
• Double-click on Iometer.exe. The Iometer main window appears, and a Dynamo workload generator is automatically launched on the local computer.
• Click on a manager (the name of the local computer) in the Topology panel on the left side of the Iometer window. The manager’s available disk drives appear in the Disk Targets tab. Blue icons represent physical drives; they are only shown if they have no partitions on them. Yellow icons represent logical (mounted) drives; they are only shown if they are writable. A yellow icon with a red slash through it means that the drive needs to be prepared before the test starts; see the Disk Targets Tab — Reference section for more information on preparation.
• In the Disk Targets tab, select a disk or disks to use in the test (use Shift-click and Control-click to select multiple disks). The selected disks will be automatically distributed among the manager’s workers (threads).
• Switch to the Access Specifications tab. Double-click on “Default” in the Global Access Specifications list (the one with the globe icon). The Edit Access Specification dialog appears.
• The Edit Access Specification dialog shows you how the disk will be accessed. The default is 2-Kilobyte random I/Os with a mix of 67% reads and 33% writes, which represents a typical database workload. You can leave it alone or change it. Press OK to close the dialog when you are through. For maximum throughput (Megabytes per second), try changing the Transfer
Request Size to 64K, the Percent Read/Write Distribution to 100% Read, and the Percent Random/Sequential Distribution to 100% Sequential.
For the maximum I/O rate (I/O operations per second), try changing the Transfer Request Size to 512 bytes, the Percent Read/Write Distribution to 100% Read, and the Percent Random/Sequential Distribution to 100% Sequential.
• Switch to the Results Display tab. Set the Update Frequency to 10 seconds.• Press the Start Tests button (green flag). A standard Save File dialog appears.
Select a file to store the test results (default results.csv).
• After 10 seconds the first test results appear in the Results Display tab, and they are updated every 10 seconds after that. Press the button to the left of each bar chart for a menu of the different results you can display. You can also drag a worker or manager from the Topology panel to a bar chart to see the results of just that worker or manager.
• Press the Stop Test button (stop sign). The test stops and the final results are saved in the results.csv file. This is a comma-separated text file that can be viewed in any text editor or imported into a spreadsheet.
To test network performance between two computers (A and B):
• On computer A, double-click on Iometer.exe. The Iometer main window appears and a Dynamo workload generator is automatically launched on computer A.

• On computer B, open an MS-DOS Command Prompt window and execute Dynamo, specifying computer A’s name as a command line argument. For example:
C:\> dynamo computer_a
• On computer A again, note that computer B has appeared as a new manager in the Topology panel. Click on it and note that its disk drives appear in the Disk Targets tab.
• With computer B selected in the Topology panel, press the Start Network Worker button (picture of network cables). This creates a network server on computer B.
• With computer B still selected in the Topology panel, switch to the Network Targets tab, which shows the two computers and their network interfaces. Select one of computer A’s network interfaces from the list. This creates a network client on computer A and connects the client and server together.
• Switch to the Access Specifications tab. Double-click on “Default” in the Global Access Specifications list. In the Edit Access Specification dialog, specify a Transfer Request Size of 512 bytes. Press OK to close the dialog.
• Switch to the Results Display tab. Set the Update Frequency to 10 seconds.• Press the Start Tests button. Select a file to store the test results. If you specify an
existing file, the new results will be appended to the existing ones.• Watch the results in the Results Display tab. • Press the Stop Test button to stop the test and save the results.
To import a results.csv file into a Microsoft* Access* database using the Import Wizard:
• Double-click on Wizard.mdb to open Access. (If you use Access 2000, you will be notified that the database is not in Access 2000 format. It does not have to be in order to perform the import.) The first page of the wizard appears.
• Specify the results file to import. Use the Browse button to locate it if it isn’t in the same directory as the Wizard.mdb file. Press Next.
• Select the test(s) from the file that you want to import. Press Next.• Select “Create a new database.” Press Next.• Specify the new .mdb file to import into. This must be a different file from
Wizard.mdb. Press Next.
• Review your settings and press Finish. The results are imported into the specified database.
To graph imported results into a Microsoft Excel* spreadsheet using the Graph Wizard:
• Open Wizard.mdb in Access, if necessary.
• Click the Graph Data button.• Specify the database file that contains your imported data. This must be a database
produced by the Import Wizard. Press Next.• Select the test(s) from the database that you want to graph. Press Next.• This list shows predefined graph types that you can use. Press New to define a
new graph type.• Select the “# Disks” database field to graph on the X axis. Press Next.• Type a name to label the X axis, or accept the field name as the default. Press
Next.• Check “Allow multiple Y values.” Select the “IOps” and “MBps” database fields
to graph on the Y axis. Press Next.

• Click on the MBps field and press “Edit selected label.” Click “Right axis” to graph this field on the right axis of the graph. Change the name to be displayed on the Y axis label if you like. Press OK, then Next.
• The grouping criterion can be used to group the data into several distinct lines on the graph. For now, leave “None” selected. Press Next.
• Leave the grouping criterion label blank. Press Next.• Type a name for the graph type you have just defined, or accept the default. Press
Next. • You have now defined a new graph type that you can edit or re-use in the future.
Select it from the list (if it isn’t already selected). Press Next.• Specify an .xls file to receive the graph. This can be a new or existing file; if
the file exists, the graph will be added to it. Press Next.• Review your settings and press Finish. The graph is created in the specified
spreadsheet. (If you just imported the results from one or two tests, it is probably a very boring graph with only one or two points! The Graph Wizard is most useful in graphing the results of multiple tests against each other.)

5. Using Iometer
This section provides an introduction to Iometer’s graphical user interface. Complete details on each component are provided later in the document.
The Iometer user interface has the following major components:
• Toolbar: Performs common operations such as starting and stopping tests.• Status bar: Shows which test in a test series is currently running.• Topology panel: Displays the available managers (Dynamos) and workers
(threads). Actions in the toolbar, Disk Targets, Network Targets, and Access Specifications tabs apply to the manager(s) or worker(s) selected in this panel, and this panel is used to select managers and workers for the Results Display tab.
• Tabbed panels: Several different tabs to control the parameters of the test: Disk Targets tab: Specifies the disks used by each disk worker. Network Targets tab: Specifies the network interfaces used by each network
worker. Access Specifications tab: Specifies the type of I/O operations each worker
performs to its targets. Results Display tab: Displays performance data during the test. Test Setup tab: Specifies the tests to be performed in a test series.
Each of these components is described in the following pages. For complete details on each component, see the corresponding Reference section later in this document.

5.1 Toolbar — Introduction
The toolbar provides buttons for common commands.
Open Test Configuration File — Restores a previously-saved set of test configuration parameters from a file. See the Open Test Configuration File – Introduction section for further details.
Save Test Configuration File — Saves the current test configuration parameters to a file. See the Save Test Configuration File – Introduction section for further details.
Start New Manager — Starts a new manager (copy of Dynamo) on the machine Iometer is running on.
Start Disk Worker — Starts a new disk worker (thread) in the manager selected in the Topology panel.
Start Network Worker — Starts a new network server (thread) in the manager selected in the Topology panel.
Duplicate Selected Worker — Starts an exact duplicate of the worker selected in the Topology panel, on the same manager.
Start Tests — Starts a series of tests. Prompts for a file to save the test results.
Stop Current Test and Save Results — Stops the currently-running test, saving its results, and begins running the next test in the current series.
Abort All Tests — Stops the currently-running test, discarding its results. No more tests are run.
Reset Workers — Resets the worker configuration of all managers to the default state.
Disconnect Selected Worker or Manager — Terminates the worker(s) or manager(s) selected in the Topology panel.
Exit — Terminates Iometer and all connected Dynamo processes.
About Iometer — Displays version and copyright information for Iometer.
For complete details, see the Toolbar — Reference section later in this document.

5.2 Status Bar — Introduction
Whenever you press the Start Tests button, Iometer runs a series of tests, as specified by the Access Specifications and Test Setup tabs. Each access specification is run once; each test is run once for each access specification. The current test number and the total number of tests to be run are displayed in the status bar at the bottom of the Iometer window.
For complete details, see the Status Bar — Reference section later in this document.

5.3 Topology Panel — Introduction
The Topology panel displays a hierarchical list of managers (Dynamos) and workers (threads) currently active.
• Click on a worker, manager, or “All Managers” to see and change its settings in the Disk Targets, Network Targets, and Access Specifications tabs. If you click on a worker, targets (disks or network interfaces) selected in the
Disk Targets or Network Targets tab are used by that worker. The other controls in the Disk Targets, Network Targets, and Access Specifications tabs show current settings for that worker; any changes are applied to that worker.
If you click on a manager, targets selected in the Disk Targets or Network Targets tab are distributed in a round-robin fashion among the manager’s disk or network workers (as appropriate). The other controls in the Disk Targets, Network Targets, and Access Specifications tabs display the common settings of all the manager’s workers of the appropriate type (a value is shown if all workers have the same value, or the control is blank if not all workers have the same value). Any changes you make are applied to all the manager’s workers of the appropriate type.
If you click on “All Managers,” no targets are shown in the Disk Targets or Network Targets tab, because managers’ target lists may be different. The other controls in the Disk Targets, Network Targets, and Access Specifications tabs display the common settings of all workers of the appropriate type; any changes you make are applied to all workers of the appropriate type.
• Double-click on a manager or “All Managers” to hide or display its children.• Right-click on a manager to update its target lists.• Drag a worker, manager, or “All Managers” to a bar chart in the Results Display
tab to see its results as the test is running.
For complete details, see the Topology Panel — Reference section later in this document.
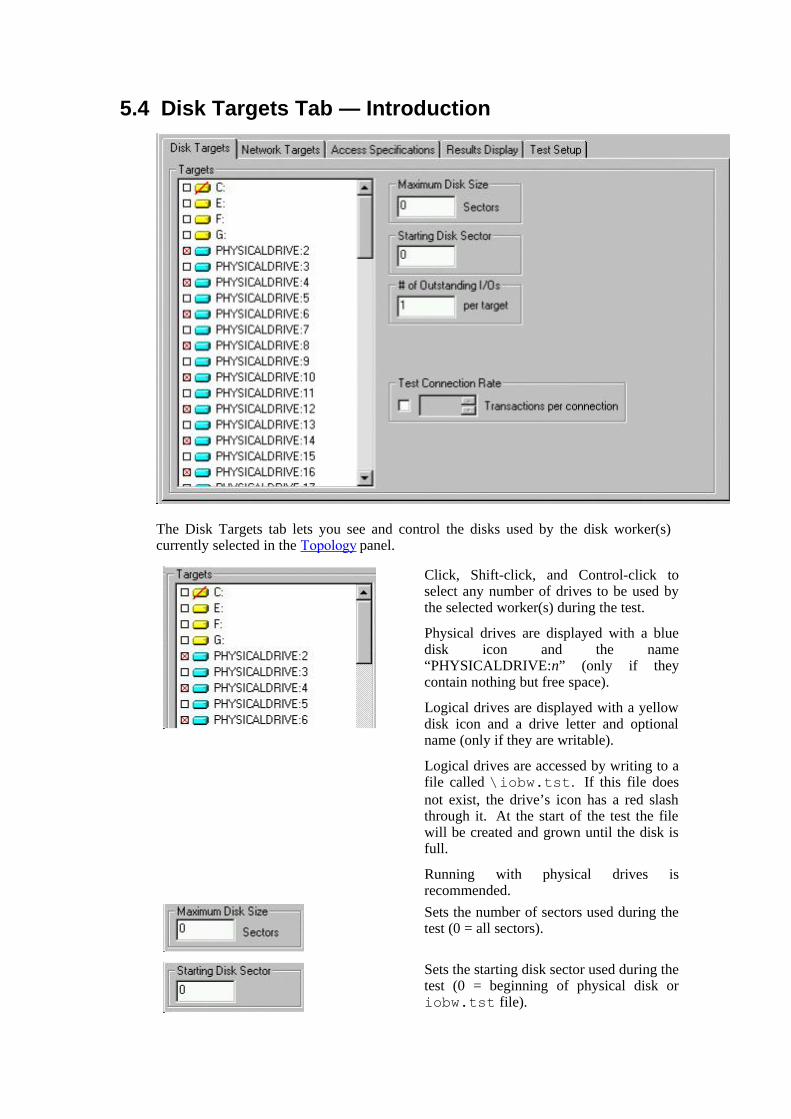
5.4 Disk Targets Tab — Introduction
The Disk Targets tab lets you see and control the disks used by the disk worker(s) currently selected in the Topology panel.
Click, Shift-click, and Control-click to select any number of drives to be used by the selected worker(s) during the test.
Physical drives are displayed with a blue disk icon and the name “PHYSICALDRIVE:n” (only if they contain nothing but free space).
Logical drives are displayed with a yellow disk icon and a drive letter and optional name (only if they are writable).
Logical drives are accessed by writing to a file called \iobw.tst. If this file does not exist, the drive’s icon has a red slash through it. At the start of the test the file will be created and grown until the disk is full.
Running with physical drives is recommended.
Sets the number of sectors used during the test (0 = all sectors).
Sets the starting disk sector used during the test (0 = beginning of physical disk or iobw.tst file).

Sets the number of simultaneous outstanding I/Os per disk.
Specifies whether or not each disk should be opened and closed repeatedly during the test, and sets the number of transactions (request + reply) issued between each open and close.
For complete details, see the Disk Targets Tab — Reference section later in this document.
NOTEIf the total number of outstanding I/Os in the system is very large, Iometer or Windows may hang, thrash, or crash. The exact value of “very large” depends on the disk driver and the amount of physical memory available. This problem is due to limitations in Windows and some disk drivers, and is not a problem with the Iometer software. The problem is seen in Iometer and not in other applications because Iometer makes it easy to specify a number of outstanding I/Os that is much larger than typical applications produce.

5.5 Network Targets Tab — Introduction
The Network Targets tab lets you see and control the network interfaces used by the network server(s) currently selected in the Topology panel.
Click to select network interfaces for network server(s) (at most one per server). Control-click to deselect the currently-selected interface. A network client is automatically created on the selected manager to communicate through the selected interface on that manager.
Specifies the network interface used by the selected network worker for its end of the connection.
Specifies the maximum number of messages a network worker will send to a VI target before waiting for an acknowledgement.
Specifies whether or not the connection should be opened and closed repeatedly during the test, and sets the number of transactions (request + reply) issued between each open and close.
If a network client is selected in the Topology panel, the Network Targets tab displays the client’s configuration, but you cannot change it (a client’s configuration is always the same as its server). If a manager that has network clients is selected, the clients’ configuration is not included in the Network Targets tab, and any changes you make in the Network Targets tab do not affect the clients.

For complete details, see the Network Targets Tab — Reference section later in this document.
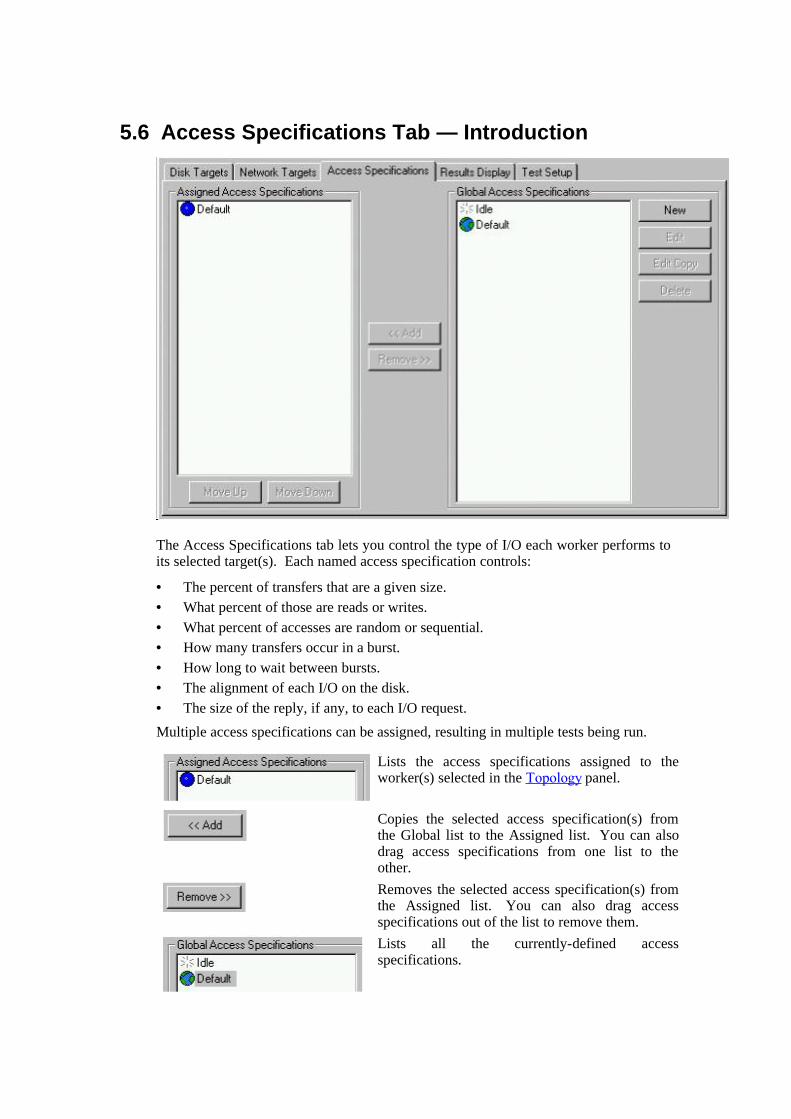
5.6 Access Specifications Tab — Introduction
The Access Specifications tab lets you control the type of I/O each worker performs to its selected target(s). Each named access specification controls:
• The percent of transfers that are a given size.• What percent of those are reads or writes.• What percent of accesses are random or sequential.• How many transfers occur in a burst.• How long to wait between bursts.• The alignment of each I/O on the disk.• The size of the reply, if any, to each I/O request.
Multiple access specifications can be assigned, resulting in multiple tests being run.
Lists the access specifications assigned to the worker(s) selected in the Topology panel.
Copies the selected access specification(s) from the Global list to the Assigned list. You can also drag access specifications from one list to the other.
Removes the selected access specification(s) from the Assigned list. You can also drag access specifications out of the list to remove them.
Lists all the currently-defined access specifications.

Creates a new access specification and edits it.
Edits the definition of the selected access specification in the Global list.
Makes a copy of the selected access specification in the Global list and edits it.
Deletes the selected access specification(s) in the Global list.
Moves an access specification up or down in the Assigned list.
The New, Edit, and Edit Copy buttons pop up the Edit Access Specification dialog.

5.7 Edit Access Specification Dialog — Introduction
The Edit Access Specification dialog lets you see and change the definition of an access specification.
The name of the access specification.
Which workers are automatically assigned this access specification when they are created. (Does not affect existing workers.)
One or more lines that define what kind of I/O to perform. In this example:
• 27 % of accesses are 1 MB, 73% are 64 KB.
• All 1 MB transfers and 58% of 64KB transfers are reads.
• 67% of 1 MB transfers and 80% of 64KB transfers are random to disk.

Use these buttons to delete the current access specification line, add a new line above the current line, or add a new line below the current line.
Sets “Size”, the number of bytes in each I/O request for the current line.
Sets “% Access”, the percentage of the access specification represented by the current line. The “% Access” values of all lines must add up to 100%.
Sets “% Read”, the percentage of accesses from the current line that are reads rather than writes. Each operation is randomly selected, with a “% Read” chance of being a read. For network workers, “write” operations are sends and “read” operations are receives. Network clients always read when the corresponding server is writing, and vice versa.
Sets “% Random”, the percentage of accesses from the current line that are random-access rather than sequential. Each operation is randomly selected, with a “% Random” chance of being random-access. (Ignored by network workers.)
Sets “Delay”, the time in milliseconds between each burst of I/O operations, and “Burst”, the number of I/O operations after each delay, for the current line. (Delay = 0 causes continuous operation.)
Sets “Alignment”, which determines how each I/O is aligned on the disk. (Ignored by network workers.)
Sets “Reply”, which determines the size of the reply (an immediately following I/O in the opposite direction), if any, for each request. The request and reply together make up a transaction.
For complete details, see the Access Specifications Tab — Reference section later in this document.

5.8 Results Display Tab — Introduction
The Results Display tab displays performance statistics while a test is running. You can change the settings of all controls in the Results Display tab while the test is running. Any changes you make take effect immediately.
Determines whether the displayed performance statistics are an average (or sum, as appropriate) of the data collected over the entire test, or the values since the last update.
Specifies how often, in seconds, the displayed statistics are updated. The default is “oo” (infinity), meaning that the display is updated only at the end of each test.
To the left of each bar chart is a button to pop up a menu of many different statistics that can be displayed. For details on each, see Selecting a Statistic for Display in the Results Display Tab — Reference section later in this document.
The left end of each bar chart shows whose statistics are displayed in that chart: a worker, a manager, or all managers. To change, drag an item from the Topology panel to the bar chart.
The middle of each bar chart shows the current numeric value of the selected statistic.

The right end of each bar chart shows the maximum displayable value for the selected statistic. This may change as the test runs.
Pops up the Presentation Meter dialog with the corresponding statistic.
For complete details, see the Results Display Tab — Reference section later in this document.
NOTEObtaining run-time statistics affects the performance of the system. When running a significant test series, the Update Frequency slider should be set to “oo” (infinity). Also, you should be careful not to move the mouse or to have any background processes (such as a screensaver or FindFast) running while testing, to avoid unnecessary CPU utilization and interrupts.
NOTEWhen testing network I/O, the total IOps and MBps values for a manager or “All Managers” include both network servers and the corresponding network clients. For example, suppose a network server on one manager is writing 8 MBps to its client on another manager, which is reading 8 MBps. In this case, the “All Managers” value for total MBps will be 16 MBps (even though only 8 MBps is flowing across the network). You can determine the actual total throughput by examining the I/O of only one worker at a time, or by examining only reads or only writes.

5.9 Presentation Meter Dialog — Introduction
The Presentation Meter dialog displays a single statistic from the Results Display tab in a large size. This is useful for presentations to groups of people.
Selects the statistic to display. See Selecting a Statistic for Display in the Results Display Tab — Reference section for more details.
Specifies the upper bound of the meter. The lower bound is always zero.
If checked, a blue arc marks the highest and lowest values displayed during the test.
Press Start to start the test, or Stop to stop a running test. If a series of tests is running, the Start button changes to “Next” and the Stop button aborts the test series.
For complete details, see the Presentation Meter Dialog — Reference section later in this document.

5.10 Test Setup Tab — Introduction
The Test Setup tab controls the tests that are run for each access specification in the Access Specifications tab, and a number of other details about how Iometer works.
A text field in which you can type any text you like to describe the current series of tests. This text is saved to the results file.
Specifies the run time for each test in the series. Zero means that each test runs until you press the Stop button.
Specifies the number of seconds Iometer waits before beginning to record statistics on each test. You can use this field to avoid recording any statistics during an initial “ramp-up” period.
Specifies what information is recorded in the results file. Each worker’s results are a summary of its targets; each manager’s results are a summary of its workers; the “all managers” results are a summary of all managers. If you select “None,” you will not be prompted for a results file when you start the test.

Specifies the number of workers that is given to a manager when the manager is created.
Specifies the series of tests that is run for each access specification. Cycling options can be used to automatically collect data on a variety of different loads for the current configuration. For details, see Cycling Options in the Test Setup Tab — Reference section later in this document.
Specifies the initial number of workers, step size, and stepping type (linear or exponential) for the test types “Cycle Workers” and “Cycle Targets and Workers.” It is disabled for all other test types.
Specifies the initial number of targets, step size, and stepping type for the test types “Cycle Targets,” “Increment Targets Parallel,” “Increment Targets Serial,” “Cycle Targets and Workers,” and “Cycle # Outstanding I/Os and Targets.” It is disabled for all other test types.
Specifies the initial and final number of outstanding I/Os, step size, and stepping type for the test types “Cycle # Outstanding I/Os” and “Cycle # Outstanding I/Os and Targets.” It overrides the # of Outstanding I/Os field in the Disk Targets tab for these test types; it is disabled for all other test types. It has no effect on network workers (network workers always have a # Outstanding I/Os value of 1).
For complete details, see the Test Setup Tab — Reference section later in this document.

5.11 Save Test Configuration File — Introduction
Pressing the Save Test Configuration File toolbar button brings up the Save Test Configuration File dialog. You may choose which settings to include in the saved file. For further details, see the Save Test Configuration File – Reference section.
The state of each of these checkboxes determines whether the corresponding information is to be included in the saved file.
The last two checkboxes determine which additional details about the workers' setups are to be saved in the file. These checkboxes will be disabled unless the "Managers and Workers" checkbox is checked.
Iometer does not prompt you to save changes that you make to any test settings. You must initiate the save yourself by pressing the Save Test Configuration File toolbar button.

5.12 Open Test Configuration File — Introduction
Pressing the Open Test Configuration File toolbar button brings up the Open Test Configuration File dialog. You may choose which settings to restore from a saved file, and whether those settings replace, or are merged with, the current settings.
The state of each of these checkboxes determines whether the corresponding information is to be restored from the configuration file.
The last two checkboxes determine which additional details about the workers' setups are to be restored from the file. These checkboxes will be disabled unless the "Managers and Workers" checkbox is checked.

Determines whether the loaded settings for the selected sections replace the current settings for those sections, or are merged with the current settings for those sections.
Replace/merge doesn’t apply to the “Test Setup” and “Results Display” tabs. These settings, when restored, always replace the current settings.
For further details, see the Open Test Configuration File – Reference section.

6. Toolbar — Reference
The Iometer toolbar provides buttons for common commands. To perform any of these commands, click once on the button. For a brief explanation (ToolTip) of each button, let the mouse pointer rest, without moving, on the button for a moment.
The buttons in the toolbar perform the following functions:
Open Test Configuration File — Restores a previously-saved set of test configuration parameters. For further details, see the Open Test Configuration File – Reference section.
Save Test Configuration File — Saves the current test configuration parameters to a file (default setup.icf in the current directory). For further details, see the Save Test Configuration File – Reference section.
Start New Manager — Starts a new manager (copy of Dynamo) on the same machine as Iometer. The new manager has the same name as the machine on which it is running. The number and type of workers in the new manager is determined by the Number of Workers to Spawn Automatically control in the Test Setup tab.
Start Disk Worker — Starts a new disk worker (thread) on the selected manager, or the same manager as the selected worker. Each new worker is named “Worker n,” where n is the next available number, and has the default configuration (e.g. no disks selected) This button is disabled unless a manager or worker is selected in the Topology panel.
Start Network Worker — Starts a new network server on the selected manager. Apart from the worker type, this button works the same as the Start Disk Worker button.
Duplicate Selected Worker — Duplicates the selected worker by creating a new worker thread of the same type (disk worker or network server) on the same manager. The new worker has the same name and configuration as the selected worker. If the selected worker is a network server, its corresponding client (if any) is also duplicated. This button is disabled unless a disk worker or network server is selected in the Topology panel.
Start Tests — Starts a series of tests (as specified by the current settings in the Access Specifications and Test Setup tabs).
Before any tests are run, you will be presented with a standard Save File dialog to specify where the results of the tests are to be saved (default results.csv in the current directory). (If the Record Results control is set to "None", no results are saved, and a Save File dialog does not appear.) If you specify a new file, the results are saved to that file. If you specify an existing file, the results are appended to that file. If you press Cancel, the tests are still started, but the results are not saved.
Stop Current Test and Save Results — Stops the currently-running test, saves whatever results it has gathered so far to the results file, and begins running the next test in the current series (if any).

Abort All Tests — Stops the currently-running test and discards its results, writing a “test aborted” record to the results file. No more tests are run, but the results of any tests completed before the current test started are still written to the results file.
Reset Workers — Resets the worker configuration of all managers to the default state. All existing worker threads are terminated, and their configurations are lost; each manager is then given the default number of workers, each with the default configuration.
Disconnect Selected Worker or Manager — If “All Managers” is selected in the Topology panel, terminates all Dynamo processes and all their threads. If a manager is selected, terminates the corresponding Dynamo process and all its threads. If a worker is selected, terminates the corresponding thread. The configuration of the terminated worker(s) or manager(s) is lost.
Exit — Terminates Iometer and all connected Dynamo processes.
About Iometer — Displays version and copyright information for Iometer.
All buttons except Open, Save, Start New Manager, Exit, and About Iometer are grayed out if there are no managers in the Topology panel. All buttons except Stop, Abort, Exit, and About Iometer are grayed out when a test is running. The Stop and Abort buttons are grayed out when no test is running.

7. Status Bar — Reference
Whenever you press the Start Tests button, Iometer runs a series of tests, as specified by the Access Specifications and Test Setup tabs. Each access specification is run once; each test is run once for each access specification. The current test number and the total number of tests to be run are displayed in the status bar at the bottom of the Iometer window.
For example, if there are two access specifications selected for each worker in the Access Specifications tab and two tests specified by the Test Setup tab (see the description of the Cycling Options control group for information on determining the number of tests), Iometer will run a total of four tests:
1. Access specification #1, test #1 (shown as “Run 1 of 4”)2. Access specification #1, test #2 (shown as “Run 2 of 4”)3. Access specification #2, test #1 (shown as “Run 3 of 4”)4. Access specification #2, test #2 (shown as “Run 4 of 4”)
Each test runs for the time specified by the Run Time control group in the Test Setup tab. If the run time is set to zero, each test runs until you press the Stop button.
The status bar may also display other messages, such as “Test Aborted” or “Preparing Drives.” The “Preparing Drives” message indicates that the iobw.tst file is being created on a logical drive, as described in the Disk Targets Tab — Reference section.

8. Topology Panel — Reference
The Topology panel displays a hierarchical list of the managers (copies of Dynamo) and workers (threads within each copy of Dynamo) currently active. This panel is a hierarchical list like the one used in Windows Explorer. To display or hide a manager’s workers, double-click on the manager’s name, or click the plus or minus sign to the left of the manager’s name.
The icons that appear in the Topology panel are as follows:
All managers connected to this copy of Iometer.
A manager.
A disk worker.
A network server.
A network client (created automatically when you select a target for a network server). Its name reflects the name of its corresponding network server.
Network servers and network clients are both referred to as network workers.
Iometer starts a single manager, on the same machine as Iometer, when it starts up. To add a manager on the same machine as Iometer, press the Start New Manager button on the toolbar. To add a manager on another machine, start Dynamo on the desired machine, providing the name of the machine running Iometer as a command-line argument (as described under Running Iometer above); additional managers can be started before or after Iometer. To remove a manager, click on the manager and press the Disconnect button on the toolbar; this terminates the specified Dynamo process. To remove all managers, click on “All Managers” and press the Disconnect button on the toolbar.

By default, each manager starts off with one disk worker for each processor on the manager’s machine. To add a worker to a manager, click on the manager or any of its workers and press the Start Disk Worker or Start Network Worker button on the toolbar. To remove a worker, click on the worker and press the Disconnect button on the toolbar.
By default, each manager has the same name as the machine on which it is running, and each worker has the name “Worker n.” You can change the name of a manager or worker by clicking on the name when the manager or worker is selected (you will have to wait a moment for the name to highlight). The name of “All Managers” cannot be changed.
At most one list item (manager, worker, or “All Managers”) can be selected at a time. The settings for the selected worker or the selected manager’s or managers’ workers are shown in the Disk Targets, Network Targets, and Access Specifications tabs.
Right-clicking on a manager pops up a menu with one item: “Refresh Target Lists.” Selecting this item causes the manager to update its lists of disks and network interfaces. You can use this to update Iometer’s view of the manager if the target status for a manager changes (for example, if you create an iobw.tst file or mount a logical disk).

9. Disk Targets Tab — Reference
The Disk Targets tab lets you see and control the disks used by the disk worker(s) currently selected in the Topology panel. You can control which disks are used, how much of each disk is used, the maximum number of outstanding I/Os per disk for each worker, and how frequently the disks are opened and closed.
If a disk worker is selected in the Topology panel, that worker’s current configuration is displayed in the Disk Targets tab; any changes you make affect only that worker. If a manager or “All Managers” is selected, the disk workers’ common configuration is displayed: controls (other than Target assignments) for which all workers have the same setting show that setting, while controls for which not all workers have the same setting are blank. Any changes you make in the Disk Targets tab are applied to all of the selected manager or managers’ workers.
If a network worker is selected in the Topology panel, the Disk Targets tab is disabled. Clicking on a network worker while the Disk Targets tab is displayed automatically switches to the Network Targets tab. The same applies to a manager that has no disk workers, or “All Managers” if no manager has any disk workers.
9.1 TargetsThe Targets list displays the disk drives available to the worker or manager selected in the Topology panel. Disks that are selected (checked) in the Targets list will be used by the worker(s) during the test.
Yellow disk icons represent logical drives (i.e. those with a drive letter). They are shown only if they are writable. Disk workers access logical drives by reading and writing a file called iobw.tst in the root directory of the drive. If this file exists, the

drive is shown with a plain yellow icon; if the file does not exist, the drive is shown with a red slash through the icon. (If this file exists but is not writable, the drive is considered read-only and is not shown at all.)
If you select a drive that does not have an iobw.tst file, Iometer will begin the test by creating this file and expanding it until the drive is full (this is shown as “Preparing Drives” in the status bar). You can change the size of this file to control how much of the disk Iometer can use by setting the Maximum Disk Size control to the desired size (in sectors).
Blue disk icons represent physical drives. They are shown only if they contain nothing but free space (no defined partitions). Disk workers access physical drives by writing direct to the raw disk. Physical drives do not use an iobw.tst file. Running with physical drives is recommended.
You can select any number of drives; by default, no drives are selected. Click on a single drive to select it; Shift-click to select a range of drives; Control-click to add a drive to or remove a drive from the current selection. You can also use the arrow keys, Home and End keys, and the space bar to move the highlight and select/deselect disks, or press <Control-A> to select all drives (this requires the keyboard focus to be in the Disk Targets tab).
• If a disk worker is selected in the Topology panel, the Targets list displays the disks available to that worker. Drives that you select in the Targets list are used by that worker during the test.
• If a manager is selected in the Topology panel, the Targets list displays the disks available to that manager. Drives that you select in the Targets list are used by that manager’s disk workers during the test. (Network workers are not affected.) The selected drives are distributed in a round-robin fashion among the manager’s disk workers; any previous drive assignments for those workers are replaced by the new assignment. For example, suppose the selected manager has four disk workers and you select seven drives. In this case, drives 1 and 5 will be used by Worker 1; drives 2 and 6 will be used by Worker 2, drives 3 and 7 will be used by Worker 3, and drive 4 will be used by Worker 4.
Note that if you click on a manager, the selected disks for that manager’s workers are shown only if the drives are distributed among the workers in a round-robin fashion. If this is not the case, all the check boxes are gray, and you must click on an individual worker to see its selected disks.
• If “All Managers” is selected in the Topology panel, the Targets list is disabled.
9.2 Maximum Disk SizeThe Maximum Disk Size control specifies how many disk sectors are used by the selected worker(s). The default is 0, meaning the entire disk or \iobw.tst file (beginning with the Starting Disk Sector). If you specify a value other than zero, Iometer uses the specified number of 512-byte disk sectors, beginning with the Starting Disk Sector. If the specified value would extend beyond the end of the disk or file, it is silently ignored, and the default of 0 is used.
For example, if Starting Disk Sector is 5 and Maximum Disk Size is 10, the selected worker(s) will use sectors 5-14 of the disk or \iobw.tst file.
When preparing an unprepared logical drive (that is, the iobw.tst file does not exist), Iometer uses the sum of the values of the Maximum Disk Size + Starting Disk Sector

controls as an upper bound on the size of iobw.tst. The iobw.tst file is created with this size (or available space, if smaller). If the file already exists (the drive has already been prepared), changing this control will not resize iobw.tst.
NOTE:When two or more workers are assigned to the same unprepared logical drive, the Maximum Disk Size + Starting Disk Sector of the first worker[KB2] determines the size of iobw.tst.
9.3 Starting Disk SectorThe Starting Disk Sector control specifies the lowest-numbered disk sector used by the selected worker(s) during the test. The default is 0, meaning the first 512-byte sector in the disk or \iobw.tst file.
9.4 # of Outstanding I/OsThe # of Outstanding I/Os control specifies the maximum number of outstanding asynchronous I/O operations per disk the selected worker(s) will attempt to have active at one time. (The actual queue depth seen by the disks may be less if the operations complete very quickly.) The default value is 1.
Note that the value of this control applies to each selected worker and each selected disk. For example, suppose you select a manager with 4 disk workers in the Topology panel, select 8 disks in the Disk Targets tab, and specify a # of Outstanding I/Os of 16. In this case, the disks will be distributed among the workers (2 disks per worker), and each worker will generate a maximum of 16 outstanding I/Os to each of its disks. The system as a whole will have a maximum of 128 outstanding I/Os at a time (4 workers * 2 disks/worker * 16 outstanding I/Os per disk) from this manager.
This control can be overridden by the # of Outstanding I/Os control group in the Test Setup tab (depending on the Cycling Options).
NOTEIf the total number of outstanding I/Os in the system is very large, Iometer or Windows may hang, thrash, or crash. The exact value of “very large” depends on the disk driver and the amount of physical memory available. This problem is due to limitations in Windows and some disk drivers, and is not a problem with the Iometer software. The problem is seen in Iometer and not in other applications because Iometer makes it easy to specify a number of outstanding I/Os that is much larger than typical applications produce.
9.5 Test Connection RateThe Test Connection Rate control specifies how often the worker(s) open and close their disk(s). The default is off, meaning that all the disks are opened at the beginning of the test and are not closed until the end of the test. If you turn this control on, you can specify a number of transactions to perform between opening and closing. (A transaction is an I/O request and the corresponding reply, if any; see the Reply field in the Edit Access Specification dialog for more information).

If Test Connection Rate is on, the worker opens all its disks at the beginning of the test. When the specified number of transactions has been performed to a particular disk, that disk is closed, and is re-opened again just before the next I/O to the disk. The number of transactions can be zero, in which case the worker just opens and closes the disks repeatedly.
Each open + transactions + close sequence is called a connection. The time from the initiation of the open to the completion of the corresponding close is recorded for each connection, and the maximum and average connection time and the average connections per second are reported.

10. Network Targets Tab — Reference
The Network Targets tab lets you see and control the network interfaces used by the network worker(s) currently selected in the Topology panel. You can control which network interface is used on each end of the connection and how frequently the network connection is opened and closed. Iometer currently supports the TCP/IP and Virtual Interface Architecture network protocols.
VI Architecture testing requires an implementation that conforms to revision 0.95 of the Intel Virtual Interface Architecture Implementation Guide and supports reliable delivery. VI NICs will be automatically detected if they are named VINICn, nicn, or \\.\VIn. If your NICs use any other name, you can set the environment variable VINICn to the name of your NIC number n. This environment variable must be set on the machine on which Dynamo is running, and must be set before Dynamo is launched.
If a network server is selected in the Topology panel, that worker’s current configuration is displayed in the Network Targets tab; any changes you make affect only that worker. If a network client is selected, its configuration is displayed, but cannot be changed (a network client’s configuration is always the same as its corresponding server). If a manager or “All Managers” is selected, the network servers’ common configuration is displayed: controls for which all servers have the same setting show that setting, while controls for which not all servers have the same setting are blank. Any changes you make in the Network Targets tab are applied to all of the selected manager or managers’ network servers (disk workers and network clients are not affected).
If a disk worker is selected in the Topology panel, the Network Targets tab is disabled. Clicking on a disk worker while the Network Targets tab is displayed automatically switches to the Disk Targets tab. The same applies to a manager that has no network servers, or “All Managers” if no manager has any network workers.

10.1 TargetsThe Targets list in the Network Targets panel displays the available network interfaces on all managers. Only interfaces of types (TCP/IP or VI) supported by the selected manager or worker are shown; however, there is no guarantee that all interfaces shown will be accessible to the selected manager or worker (for example, they may be on different subnets).
By default, no interface is selected. Click on an interface to select it; Shift-click to select a range of interfaces; Control-click to add an interface to or remove an interface from the current selection. You can also use the arrow keys, Home and End keys, and the space bar to move the highlight and select/deselect interfaces, or press <Control-A> to select all interfaces (this requires the keyboard focus to be in the Network Targets tab).
• If a network server is selected in the Topology panel, you can see and change the currently selected interface in the Targets list. You can select at most one interface. When you select an interface, a network client is automatically created on the corresponding manager to communicate over the selected interface during the test. If you change the selection, the network client is reconfigured or moved as necessary. Using Control-click to deselect the currently-selected interface removes the corresponding network client.
• If a network client is selected in the Topology panel, you can only see the currently selected interface (that is, the corresponding server) in the Targets list. To make any changes in a network client’s configuration, you must change the corresponding server.
• If a manager is selected in the Topology panel, network interfaces that you select in the Targets list are used by that manager’s network servers during the test. (Disk workers and network clients are not affected.) You can select any number of interfaces, up to the number of network servers the manager has. The selected interfaces are assigned in order to the manager’s network servers; any previous assignments for those servers are replaced by the new assignment. For example, suppose the selected manager has four network servers and you select three interfaces. In this case, the first selected interface in the list will be used by Worker 1, the second by Worker 2, the third by Worker 3, and Worker 4 will be idle. Any network clients that had previously belonged to those servers will be removed and replaced with new clients.
Note that if you click on a manager, the selected interfaces for that manager’s network servers are shown only if the interfaces are assigned to the workers in order. If this is not the case, all the check boxes are gray, and you must click on an individual worker to see its selected interface.
• If “All Managers” is selected in the Topology panel, the Targets list is disabled.

For example, suppose you have two managers, IOANALYSIS and IOLAB, and IOANALYSIS has one worker, a network server called “Worker 1”. If you click on Worker 1 and then select one of IOLAB’s two network interfaces, the display might look like this:
Note that selecting one of IOLAB’s interfaces automatically creates a network client, called “[Worker 1]”, on IOLAB. The name of the client is the name of the corresponding server in [brackets]. This display shows that the newly-created client ([Worker 1] on IOLAB) will use network interface 137.21.66.95 to communicate with its server. Meanwhile, the server (Worker 1 on IOANALYSIS), will use network interface 137.46.126.100 to communicate with its client (see the discussion of the Network Interface to Use for Connection control, below).
Clicking on the client shows the same connections from the other end:
Note that the client’s controls are grayed-out (inactive). You cannot change a connection from the client end, only from the server end.
10.2 Network Interface to Use for ConnectionThe Network Interface to Use for Connection control applies only to network servers. It specifies which of the available network interfaces is used by the selected server for its end of the connection, as described in the Targets for Network Workers section above. The default is the first interface in the list.
If you click on an interface in the Targets list that is of a different type (TCP/IP or VI) from the selected interface in the Network Interface to Use for Connection control, the Network Interface to Use for Connection changes to the first interface of the selected type. If you select an interface in the Network Interface to Use for Connection control that is of a different type than the current selection in the Targets list, the selection in the Targets list is cleared.
10.3 Max # Outstanding SendsThe Max # Outstanding Sends control specifies the maximum number of messages a network worker will send to a Virtual Interface Architecture target before waiting for

an acknowledgement. This control is disabled for workers with no VI Architecture targets. The default value is 1.
In theVI Architecture, a receive operation must be posted for each message before it is received. The sending worker (which could be a server or a client) sends at most the specified number of messages before waiting for an acknowledgement that the messages have been received and it is OK to send more. The receiving worker begins by pre-posting the specified number of receive operations. As each message is received, a new receive operation is posted. When half the specified number of messages has been received, the receiver sends a control message to the sender indicating that the messages have been received. The intention is that the sender will get this message before it finishes sending the other half, allowing it to continue uninterrupted. The sender will block only if it sends the Max # Outstanding Sends without receiving a control message.
NOTEThe Max # Outstanding Sends for VI targets is not the same as the # Outstanding I/Os for disks. Currently Iometer supports only one outstanding I/O at a time to network targets.
10.4 Test Connection RateThe Test Connection Rate control specifies how often the selected worker(s) open and close their network connection. The default is off, meaning that the connection is opened at the beginning of the test and is not closed until the end of the test. If you turn this control on, you can specify a number of transactions to perform between opening and closing. (A transaction is an I/O request and the corresponding reply, if any; see the Reply field in the Edit Access Specification dialog for more information).
If Test Connection Rate is on, the worker opens its network connection at the beginning of the test. When the specified number of transactions has been performed, the connection is closed, and is re-opened again just before the next I/O. The number of transactions can be zero, in which case the worker just opens and closes the connection repeatedly.
Each open + transactions + close sequence is called a connection. The time from the initiation of the open to the completion of the corresponding close is recorded for each connection, and the maximum and average connection time and the average connections per second are reported.

11. Access Specifications Tab — Reference
The Access Specifications tab lets you see and control the type of I/O each worker performs to its selected target(s).
The Global Access Specifications list, on the right, shows all the access specifications currently defined. The Assigned Access Specifications list, on the left, shows the access specifications that are assigned to the worker(s) currently selected in the Topology panel. You assign one or more access specifications to a worker by selecting them in the Global Access Specifications list and pressing the Add button, or by dragging them from the Global Access Specifications list to the Assigned Access Specifications list. You can remove one or more access specifications from a worker by selecting them in the Assigned Access Specifications list and pressing the Remove button, or by dragging them out of the Assigned Access Specifications list.
11.1 Global Access Specifications ListThe Global Access Specifications list shows all the access specifications currently defined. Each access specification is a named collection of I/O characteristics, such as the size of each I/O operation, the ratio of reads to writes, the ratio of random access to sequential I/O, and the “burstiness” of the I/O. An access specification can specify a single type of I/O or a mix of different types.
By default there are two access specifications, called Idle and Default. The Idle access specification does nothing; it cannot be removed, renamed, or edited. The Default access specification initially performs 2K random I/Os with a 2-to-1 mix of reads and writes, but you can change this. You can also create additional access specifications for your own purposes.
Each access specification has a name and an icon. The name is user-defined; you should choose a name that describes what the access specification does (such as “4K

sequential reads” or “Web server workload”). You cannot have two access specifications with the same name at the same time. The icon indicates the access specification’s default assignment, which determines which workers are automatically assigned the access specification when they are created:
Default for workers of all types.
Default for disk workers.
Default for network workers.
Not default for any worker.
Multiple access specifications can have a default assignment at the same time. For example:
Given these five access specifications, a new disk worker would be given access specifications Default, Database, and File Copy, while a new network worker would be given access specifications Default, Database, and Web Traffic.
Note that an access specification’s default assignment only determines whether or not it is assigned to a worker when the worker is created. This occurs when you press the Start New Manager, Reset Workers, Start Disk Worker, or Start Network Worker button on the toolbar or when a manager first makes contact with Iometer after being started from the command line. Changing an access specification’s default assignment, or creating a new access specification with a default assignment, does not affect the access specifications of existing workers.
11.2 Assigned Access Specifications ListThe Assigned Access Specifications list shows the access specifications that are assigned to the worker(s) currently selected in the Topology panel. These determine the I/O operations the worker(s) will perform during the test.
The color of the LED (colored circle) to the left of each access specification in the Assigned Access Specifications list indicates its status while the test is running:
• Blue for an access specification that has not yet run.• Green for an access specification that is currently running.• Red for an access specification that has completed running.
If there is more than one access specification in the Assigned Access Specifications list, a series of tests will be performed. The access specifications are executed in sequence from top to bottom. During each access specification, Iometer runs one or more tests (determined by the settings in the Test Setup tab); if no run time is specified in the Test Setup tab, each test runs until you press the Stop button on the toolbar.
You can assign different access specifications to different workers. For example, you might have your disk workers performing database-like I/O (defined by one access specification), at the same time as your network workers are performing web-server-like I/O (defined by a different access specification). If there are multiple access

specifications in the lists, all workers perform the first access specification in their list at the same time, then all perform the second, and so on. If the number of access specifications is not the same for every worker, the workers with fewer access specifications will be idle while the workers with more access specifications are still working. You can also assign the Idle access specification to force a worker to be idle while others are working.
A single access specification can be assigned more than once to the same worker. For example, if you have two workers (1 and 2) and two access specifications (A and B), you might assign access specifications A and B to worker 1 and two copies of access specification A to worker 2. In this case two tests will be run: in the first test both workers run access specification A, and in the second case worker 1 runs access specification B while worker 2 runs access specification A again.
If a manager or “All Managers” is selected in the Topology panel, this list is blank unless the manager’s or managers’ workers all have the same access specification list. If you make any change in this list while a manager or “All Managers” is selected, the new list resulting from the change will be assigned to all the manager’s or managers’ workers.
11.3 Access Specifications ButtonsThe buttons in the Access Specifications dialog let you manage the two lists of access specifications.
• The buttons below the Assigned Access Specifications list change the order in which the assigned access specifications are executed: The Move Up button moves the selected access specification up in the list. The Move Down button moves the selected access specification down in the
list.• The buttons to the right of the Global Access Specifications list manage the global
access specifications list: New: Creates a new access specification and opens it for editing. Edit: Opens the selected access specification for editing. You can also
double-click on an access specification in the Global Access Specifications list to open it for editing.
Edit Copy: Makes a copy of the selected access specification and opens it for editing.
Delete: Deletes the selected access specification(s).
When you open an access specification for editing, the Edit Access Specification Dialog (described in the next section) appears.
• The buttons between the two lists add and remove access specifications from the Assigned Access Specifications list: The Add button copies the selected access specification(s) from the Global
Access Specifications list to the end of the Assigned Access Specifications list. The Remove button removes the selected access specification(s) from the
Assigned Access Specifications list.
You can also add access specifications by dragging them from the Global Access Specifications list and dropping them in the Assigned Access Specifications list. You can remove access specifications by dragging them out of the Assigned Access Specifications list and dropping them anywhere.

In general, the “selected” access specification for these buttons is the one that is highlighted blue in the relevant Access Specifications list. This only occurs when the access specification is selected and the relevant list has the input focus (for example, when you have just clicked in it). If the list does not have the input focus, any selected access specification will be highlighted gray, and some or all of the buttons associated with that list will be disabled. For example, the Edit button is disabled unless there is a blue highlighted access specification in the Global Access Specifications list, which only occurs when the Global Access Specifications list has the input focus.
12. Edit Access Specification Dialog — Reference
The Edit Access Specification dialog shows the definition of a single access specification and lets you change it.
12.1 NameThe Name control specifies the access specification’s name. The default value for a new access specification is “Untitled n”. The name can be up to 128 characters long, and can contain any characters except commas. It must be unique (that is, you can’t have two access specifications in the Global Access Specifications list with the same name at the same time).

12.2 Default AssignmentThe Default Assignment control specifies which workers are assigned this access specification by default when they are created: All Workers, Disk Workers, Network Workers, or None. The default is None.
Note that changing the default assignment does not affect the access specifications of any existing workers, only new workers that are created after the change.
12.3 Access Specification LinesIn the middle of the Edit Access Specification dialog is a table that shows the I/O that is performed by the access specification. This table consists of a series of lines, each of which has several fields. To select a line, you must click on its Size field.
• To change the field values of the selected line, use the controls below the table.• To add a new line, press the Insert Before or Insert After button. These buttons
insert a copy of the selected line before or after the selected line. (If there are no lines in the list, the Insert After button can be used to insert a line with all default values.)
• To delete the selected line, press the Delete button.• To change the width of a column, drag the divider between the column’s heading
and the next column’s heading.
If you select more than one line (using Shift-click or Control-click), any action you take except Delete applies only to the first selected line.
12.4 Transfer Request SizeThe Transfer Request Size control group specifies the number of bytes read or written in each I/O request, shown in the Size field in the access specification table (default 2K bytes). You can select any value from 1 byte (0 MB + 0 KB + 1 byte) to almost 1 Gigabyte (1023 MB + 1023 KB + 1023 bytes), limited only by the amount of vitual memory available.
12.5 Percent of Access SpecificationThe Percent of Access Specification slider specifies the percentage of the current access specification specified by this line, shown in the % Access field (default 100%). You can select values from 1% to 100% by increments of 1%, or click on the “slot” to the left or right of the slider to move it up or down by 10%. The “% Access” values of the lines of a single access specification must sum to exactly 100%.
If an access specification consists of more than one line, the “% Access” field of each line determines the probability of any given I/O operation being controlled by that line. These probabilities are combined with the probabilities in the “% Read” and “% Random” fields. For example, consider the following three-line access specification (only the first few fields of each line are shown):
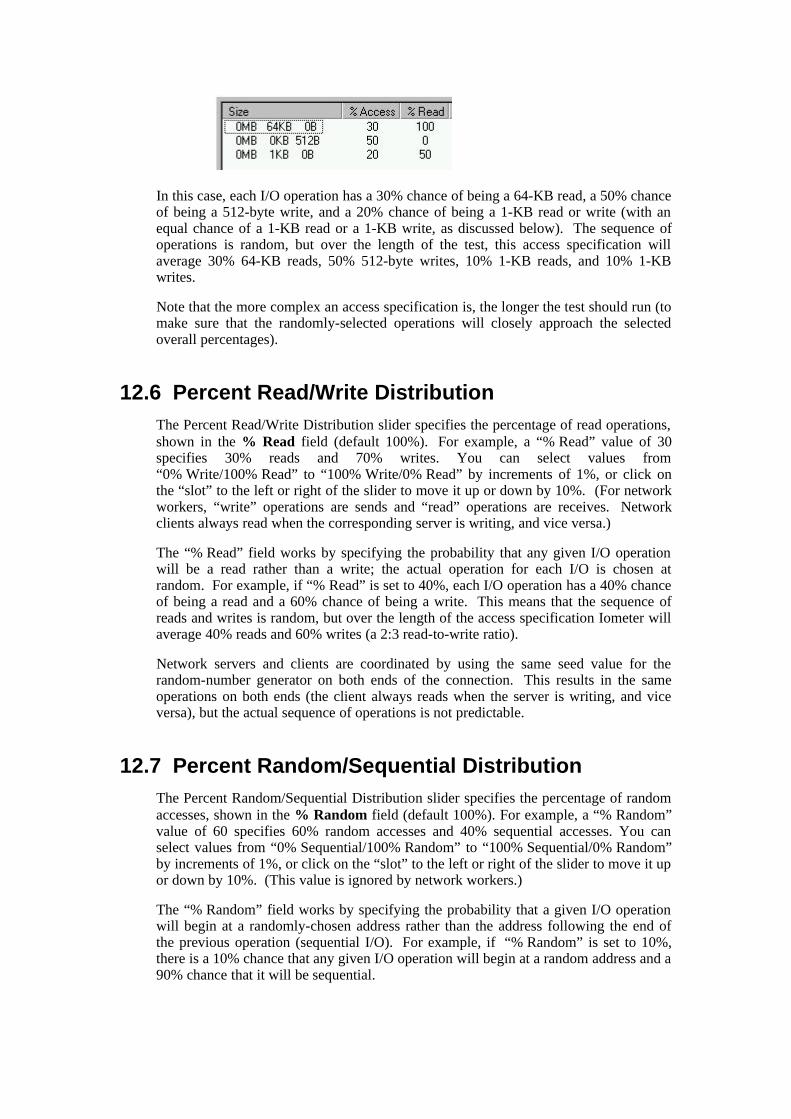
In this case, each I/O operation has a 30% chance of being a 64-KB read, a 50% chance of being a 512-byte write, and a 20% chance of being a 1-KB read or write (with an equal chance of a 1-KB read or a 1-KB write, as discussed below). The sequence of operations is random, but over the length of the test, this access specification will average 30% 64-KB reads, 50% 512-byte writes, 10% 1-KB reads, and 10% 1-KB writes.
Note that the more complex an access specification is, the longer the test should run (to make sure that the randomly-selected operations will closely approach the selected overall percentages).
12.6 Percent Read/Write DistributionThe Percent Read/Write Distribution slider specifies the percentage of read operations, shown in the % Read field (default 100%). For example, a “% Read” value of 30 specifies 30% reads and 70% writes. You can select values from “0% Write/100% Read” to “100% Write/0% Read” by increments of 1%, or click on the “slot” to the left or right of the slider to move it up or down by 10%. (For network workers, “write” operations are sends and “read” operations are receives. Network clients always read when the corresponding server is writing, and vice versa.)
The “% Read” field works by specifying the probability that any given I/O operation will be a read rather than a write; the actual operation for each I/O is chosen at random. For example, if “% Read” is set to 40%, each I/O operation has a 40% chance of being a read and a 60% chance of being a write. This means that the sequence of reads and writes is random, but over the length of the access specification Iometer will average 40% reads and 60% writes (a 2:3 read-to-write ratio).
Network servers and clients are coordinated by using the same seed value for the random-number generator on both ends of the connection. This results in the same operations on both ends (the client always reads when the server is writing, and vice versa), but the actual sequence of operations is not predictable.
12.7 Percent Random/Sequential DistributionThe Percent Random/Sequential Distribution slider specifies the percentage of random accesses, shown in the % Random field (default 100%). For example, a “% Random” value of 60 specifies 60% random accesses and 40% sequential accesses. You can select values from “0% Sequential/100% Random” to “100% Sequential/0% Random” by increments of 1%, or click on the “slot” to the left or right of the slider to move it up or down by 10%. (This value is ignored by network workers.)
The “% Random” field works by specifying the probability that a given I/O operation will begin at a randomly-chosen address rather than the address following the end of the previous operation (sequential I/O). For example, if “% Random” is set to 10%, there is a 10% chance that any given I/O operation will begin at a random address and a 90% chance that it will be sequential.

Hint: To access a disk drive sequentially, select it with a single worker using a “# of Outstanding I/Os” value of 1.
12.8 BurstinessThe Burst Length control specifies the number of I/O operations performed in a row in each “burst,” shown in the Burst field (default 1). If the Reply field is nonzero, this is a number of transactions (request + reply) rather than a number of simple I/Os. You can type in any non-negative value.
The Transfer Delay control specifies the delay before each “burst” of I/O operations, shown in the Delay field (default 0). You can type in any non-negative value in milliseconds (1000 = 1 second).
If the Transfer Delay value is 0, the Burst Length is not significant because there is no delay between bursts.
12.9 Align I/Os OnThe Align I/Os On control group specifies the alignment of each I/O on the disk, shown in the Alignment field (default Sector Boundaries). If the value of this field is n bytes, every I/O will begin at a multiple of n bytes from the beginning of the disk. You can select any value from 1 byte to 1023 MB + 1023 KB + 1023 bytes, but the specified value must be a multiple of the disk’s sector size. Entering the value 0 or selecting the Sector Boundaries radio button causes I/Os to be aligned on sector boundaries. (This value is ignored by network workers.)
Note: If the Alignment field is set to a value other than Sector Boundaries and the Size value is not a multiple of the Alignment value, sequential I/Os will not be truly sequential. For example, if the Size is 3KB and the Alignment is 2KB, each sequential 3KB I/O will be followed by a 1KB “hole” before the beginning of the following I/O.
12.10 Reply SizeThe Reply Size control group specifies the size of the reply to each I/O request, shown in the Reply field (default No Reply). You can select any value from 1 byte to 1023 MB + 1023 KB + 1023 bytes, limited only by the amount of virtual memory available. Entering the value 0 or selecting the No Reply radio button causes no reply to be sent.
If the Reply field is set to a nonzero value, whenever an I/O request completes, it is immediately followed by a reply in the opposite direction — that is, a read will be followed by a write, or a write will be followed by a read. The size of the request is specified by the Size field, and the size of the reply is specified by the Reply field. The request and reply together are called a transaction. The time from the initiation of the request to the completion of the corresponding reply is recorded for each transaction, and the maximum and average transaction time and the average transactions per second are reported.
If a reply is specified, the direction (read or write) of the reply is always the opposite of the corresponding request, while the alignment and random/sequential nature of the reply are the same as the corresponding request. If Burstiness is also specified, the Burst field specifies a number of transactions (request + reply) rather than a number of simple I/Os.

This feature can be used to determine round-trip latency in network testing, or to specify a strict alternation of reads and writes in disk testing.
12.11 OK and CancelThe OK button saves any changes you have made and closes the dialog. The Cancel button closes the dialog without saving changes.

13. Results Display Tab — Reference
The Results Display tab displays performance statistics while a test is running. You can choose which statistics are displayed, which managers or workers are included, and how often the display is updated.
You can change the settings of all controls in the Results Display tab while the test is running. Any changes you make take effect immediately.
The settings of the Results Display tab have no effect on the results file that you specified when you started the current series of tests, as described for the Start Tests button above. The results file is updated at the end of each test; it includes the final value for the test of each statistic for each worker and manager and for all managers (unless otherwise specified by the Record Results control in the Test Setup tab).
Iometer does not begin recording data for any worker until all worker threads are running.
13.1 Results SinceThe "Results Since" group box lets you select the period spanned by the displayed statistics.
• Start of Test: Displays the average or sum of the data gathered since the beginning of the test.
• Last Update: Displays the statistics collected since the previous update. For example, if the Update Frequency is set at 5 seconds, the values displayed will be the average or sum of the data collected during the last 5 seconds.

13.2 Update FrequencyThe Update Frequency slider specifies how often, in seconds, the displayed statistics are updated. The default is “oo” (infinity), meaning that the display is updated only at the end of each test.
When the "Results Since" selected is "Start of Test", each time the display is updated, the displayed values show the average (for most statistics) of the chosen statistics from the beginning of the current test to the present, not the current (instantaneous) value. For this reason, the displayed values will often fluctuate widely at the beginning of a test when the Update Frequency is small, but settle down as the test goes on. All values are reset to zero at the beginning of each test.
NOTEObtaining run-time statistics affects the performance of the system. When running a significant test series, the Update Frequency slider should be set to “oo” (infinity). Also, you should be careful not to move the mouse or to have any background processes (such as a screensaver or FindFast) running while testing, to avoid unnecessary CPU utilization and interrupts.
13.3 Bar ChartsThere are six bar charts in the display, which can display a variety of different statistics. Each bar chart has the following components:
• Statistic displayed by the chart (button to the left of the chart). Pressing this button pops up a hierarchical menu that lets you select a different statistic for the chart. The defaults for the six charts are as follows: Total I/Os per Second Total MBs per Second Average I/O Response Time (ms) Maximum I/O Response Time (ms) CPU Utilization (total) Total Error Count
• Manager or worker whose statistics are displayed (left-hand label above chart). The default for all charts is All Managers.
• Current value (center label above chart). This value changes only when the display is updated, as specified by the Update Frequency slider.
• Scale factor (right-hand label above chart). This number is the value represented by a bar that goes all the way across the chart to the right-hand edge; the left-hand edge of the chart always represents the value zero. The scale factor for each chart is determined by the statistic displayed by that chart.
• The chart itself.• A button to pop up the Presentation Meter dialog with the same statistic as the
chart.
See Selecting a Statistic for Display below for an explanation of each statistic that can be displayed.

13.4 Selecting a Manager or Worker for DisplayTo choose the manager(s) or worker(s) whose statistics are displayed by a particular chart, drag the desired worker, manager, or “All Managers” from the Topology panel to the desired chart or the corresponding button. If you choose a manager or “All Managers,” the displayed value is the average for the selected manager’s or all managers’ workers.
Clicking on the manager or worker name above a bar chart selects the associated manager or worker in the topology tree. This is handy if you have two managers or workers with the same name, and you are unsure which instance is associated with the bar chart.
13.5 Selecting a Statistic for DisplayThe following statistics can be displayed in the bar charts:
• Operations per Second submenu: Total I/Os per Second: Average number of I/O operations per second,
averaged over the length of the test so far. Read I/Os per Second: Average number of read operations per second. Write I/Os per Second: Average number of write operations per second. Transactions per Second: Average number of transactions (request + reply)
per second. If there are no replies in the access specification, this is the same as Total I/Os per Second.
Connections per Second: Average number of connections (open target, perform I/O, close target) per second. If Test Connection Rate is not selected for any targets, this value is zero.
• Megabytes per Second submenu: Total MBs per Second: Average number of Megabytes read and written per
second, averaged over the length of the test so far. A Megabyte is 1,048,576 bytes (1024 * 1024).
Read MBs per Second: Average number of Megabytes written per second. Write MBs per Second: Average number of Megabytes read per second.
• Average Latency submenu: Average I/O Response Time (ms): Average time between initiation and
completion of an I/O operation, averaged over the length of the test so far, in milliseconds.
Avg. Read Response Time (ms): Average time between initiation and completion of a read operation.
Avg. Write Response Time (ms): Average time between initiation and completion of a write operation.
Avg. Transaction Time (ms): Average time between initiation of a request and completion of the corresponding reply. If there are no replies in the access specification, this is the same as Average I/O Response Time.
Avg. Connection Time (ms): Average time between initiation of a connection (opening the target) and completion of the connection (closing the target after all I/O for the connection has been performed). If Test Connection Rate is not selected for any targets, this value is zero.
• Maximum Latency submenu:

Maximum I/O Response Time (ms): Maximum time between initiation and completion of an I/O operation during the test so far, in milliseconds.
Max. Read Response Time (ms): Maximum time between initiation and completion of a read operation.
Max. Write Response Time (ms): Maximum time between initiation and completion of a write operation.
Max. Transaction Time (ms): Maximum time between initiation of a request and completion of the corresponding reply. If there are no replies in the access specification, this is the same as Maximum I/O Response Time.
Max. Connection Time (ms): Maximum time between initiation of a connection (opening the target) and completion of the connection (closing the target after all I/O for the connection has been performed). If Test Connection Rate is not selected for any targets, this value is zero.
• CPU submenu: % CPU Utilization (total): Percentage of processor time spent executing
threads other than the Idle thread (in other words, time spent doing useful work). Also known as % Processor Time.
% User Time: Percentage of processor time spent in User Mode (including application and subsystem code, the graphics engine, graphics device drivers, printer device drivers, and the window manager). Under Linux we count the time spend in user space as well as user space with low priority (nice).
% Privileged Time: Percentage of processor time spent in Privileged Mode (including the Windows NT service layer, the Executive routines, the Windows NT Kernel, and device drivers for most devices other than graphics adapters and printers). Under Linux, this is the time spend in system mode (kernel).
% DPC Time: Percentage of processor time spent in Deferred Procedure Calls. Not supported under Linux – reports 0.0% all the time.
% Interrupt Time: Percentage of processor time spent handling hardware interrupts. Not supported under Linux – reports 0.0% all the time.
Interrupts per Second: Average number of interrupts per second, averaged over the length of the test so far. If there are multiple processors, this is the total number of interrupts for all processors.
CPU Effectiveness: Total I/Os per Second divided by % CPU Utilization, giving a measure in I/Os per second per percent CPU. Indicates how efficient the I/O subsystem is in CPU utilization.
The CPU Utilization, % User Time, % Privileged Time, % DPC Time, % Interrupt Time values displayed in the Results Display tab are averaged over the length of the test so far. If there are multiple processors, these are the average values for all processors.
The % User Time and the % Privileged Time, added together, sum to the CPU Utilization. The % DPC Time and % Interrupt Time are subsets of the % Privileged Time (but they are not the only components of Privileged Time).
Note that the % Interrupt Time and Interrupts per Second statistics include all interrupts, not just those interrupts resulting from I/O.
• Network submenu:

Network Packets per Second: The rate that packets are sent and received on the network interface.
Packet Errors: The number of packets that were chosen to be discarded even though no errors had been detected to prevent their being transmitted. One possible reason for discarding such a packet could be to free up buffer space.
TCP Segments Retrans. per Sec.: The rate that segments are retransmitted, that is, segments transmitted containing one or more previously transmitted bytes.
The Network Packets per Second, Packet Errors, and TCP Segments Retrans. per Sec. statistics are not collected by default and need to be enabled. Until they are enabled, they will always be reported as zero. For instructions on how to enable them, see the Configuring Windows NT to Collect Network Performance Statistics section later in this document.
• Errors submenu:
Total Error Count: Total number of I/O errors that have occurred during the test (normally zero).
Read Error Count: Total number of errors during read operations. Write Error Count: Total number of errors during write operations.
The errors that are counted are only those that cause the ReadFile or WriteFile call to return an error code. Iometer does not perform data verification to make sure the data was read/written properly.
NOTEWhen testing network I/O, the total IOps and MBps values for a manager or “All Managers” include both network servers and the corresponding network clients. For example, suppose a network server on one manager is writing 8 MBps to its client on another manager, which is reading 8 MBps. In this case, the “All Managers” value for total MBps will be 16 MBps (even though only 8 MBps is flowing across the network). You can determine the actual total throughput by examining the I/O of only one worker at a time, or by examining only reads or only writes.

14. Presentation Meter Dialog — Reference
The Presentation Meter dialog displays a single statistic from the Results Display tab in a large size. This is useful for presentations to groups of people.
Use the Windows controls at the right end of the title bar to mimimize or close the dialog. You can have at most one Presentation Meter dialog on the screen at a time.
The update frequency for the Presentation Meter dialog is determined by the Update Frequency slider in the Results Display tab.
14.1 MeterThe meter in the center of the dialog displays the current value of the selected statistic graphically.
14.2 Result to WatchThe “result to watch” button in the Settings control group selects the statistic to display, the same as the corresponding buttons in the Results Display tab. See Selecting a Statistic for Display in the Results Display Tab — Reference section for more details. By default, the Performance Meter dialog displays the same statistic as the bar chart whose button you pressed to pop up the dialog.

The selected statistic is always displayed for the worker, manager, or All Managers selected for the bar chart whose button you pressed to pop up this dialog. To display statistics for a different worker, manager, or All Managers, you must close the Presentation Meter dialog, drag the desired item from the Topology panel to a bar chart (if necessary), and then pop up the Presentation Meter dialog again.
14.3 RangeThe Range control specifies the upper bound of the meter. If the value of the selected statistic is above the Range value, the needle “pegs” at its upper bound, but the text label below the meter displays the correct value. The default value for this control is 100; the lower bound is always zero.
Unlike the bar charts in the Results Display tab, the meter in the Presentation Meter dialog does not automatically adjust itself to fit the value displayed. This lets you select an upper bound that displays the statistic appropriately for your purposes. It also lets you display the same statistic for two different runs, or on two different machines, and be sure that the two meter positions will be directly comparable.
14.4 Show TraceThe Show Trace control selects display of the history trace for the meter. If this control is checked, a blue arc marks the range between the highest and lowest values displayed during the current test.
14.5 Test ControlsThese two buttons let you start and stop the test without closing the Presentation Meter dialog.
• If no test is running, the Start button starts the test series (the same as the Start Tests button on the toolbar) and the Stop button is disabled.
• If a series of tests is running, the Start button’s label changes to Next. Pressing the Next button stops the current test and starts the next one (the same as the Stop Current Test button on the toolbar); the Stop button aborts the test series (the same as the Abort All Tests button on the toolbar).
• If a single test, or the last test of a series, is running, the Next button is disabled and the Stop button stops the test (the same as the Stop Current Test button on the toolbar).

15. Test Setup Tab — Reference
The Test Setup tab controls the tests that are run for each access specification in the Access Specifications tab, and a number of other details about how Iometer works.
(Whenever you press the Start Tests button, Iometer runs a series of tests. Each access specification is run once; each test is run once for each access specification. The current test number is displayed in the status bar at the bottom of the Iometer window.)
15.1 Test DescriptionThe Test Description field is a text field in which you can type any text to describe the current series of tests. This text is saved to the results file (specified when you press the Start Tests button), and can be used to record the current system configuration, test parameters, or any other information you would like.
15.2 Run TimeThe Run Time control group specifies the run time (in hours, minutes, and seconds) for each test in the series. The default value is zero, which means that each test runs until you press the Stop button.
Typical run times vary from 15 to 60 seconds. Complicated access specifications or large systems may require longer times.

15.3 Ramp Up TimeThe Ramp Up Time field specifies the number of seconds Iometer waits, after all workers report that they have begun working, before beginning to record statistics on each test. You can use this field to avoid recording any statistics during an initial “ramp-up” period (for example, while caches are filled with data). The default value is zero.
Typical ramp-up times vary from 15 to 60 seconds. Ramp-up time may need to be increased for caching controllers, large servers, or clustered systems.
15.4 Number of Workers to Spawn AutomaticallyThe Number of Workers to Spawn Automatically control group specifies the number of disk and network workers that are created on a manager by default. This value is used when you press the Start New Manager or Reset Workers button on the toolbar, and when a manager first makes contact with Iometer after being started from the command line. You can specify a number of workers, or select “# of CPUs” to specify one worker for each processor on the manager’s machine. The default value is “# of CPUs” disk workers and zero network workers.
These controls do not affect the Start Disk Worker, Start Network Worker, or Duplicate Selected Worker button. When you press any of these buttons, exactly one worker of the selected type is created.
15.5 Record ResultsThe Record Results control specifies what information is recorded in the results file (specified when you press the Start Tests button). Normally, results are recorded for each target, each worker, each manager, and all managers. Each worker’s results are a summary of its targets; each manager’s results are a summary of its workers; the “all managers” results are a summary of all managers. (“Summary” means the total, average, or maximum for each statistic, as appropriate.)
This control has the following options:
• All: Records results for each target, worker and manager and all managers. (This is the default.)
• No Targets: Records results for each worker and manager and all managers.• No Workers: Records results for each manager and all managers.• No Managers: Records only the summary of all managers.• None: Does not record anything. You will not be prompted to select a results file
when you start the test.
15.6 Cycling OptionsThe Cycling Options control group specifies the series of tests that is run for each access specification. It can be used to automatically collect data on a variety of different loads for the current configuration. Data from each test in the series is recorded separately in the results file.
All test types except Normal specify a series of tests in which one or more of the following quantities is varied in each test:

• Number of workers per manager.• Number of targets per worker.• Number of outstanding I/O operations per target (disk workers only).
Any of these quantities that is not varied by the test type is set to its default (maximum) value for all tests.
For each of these quantities, you can specify the starting value, the stepping type (linear or exponential), and the step value (the amount added each step for linear stepping, or the power base for exponential stepping) in the Workers, Targets, and # of Outstanding I/Os control groups. For example, if the starting value is 3, the stepping type is linear, and the step value is 2, the resulting sequence is 3, 5, 7, 9…. If the starting value is 1, the stepping type is exponential, and the power base is 2, the resulting sequence is 1, 2, 4, 8…. Workers are added in the order they are shown in the Topology panel; selected targets are added to each worker in the order they are shown in the Disk Targets or Network Targets tab for that worker.
The ending value for each sequence is determined differently for each quantity. For the number of workers per manager, it is determined by the manager with the most workers in the Topology panel. For the number of targets per worker, it is determined by the worker with the most targets selected in the Disk Targets or Network Targets tab. For the outstanding I/Os per target, it is determined by the # of Outstanding I/Os control group in the Test Setup tab. If not all managers have the same number of workers, or not all workers have the same number of targets, those managers/workers with less than the maximum number of workers/targets will repeat at their highest value while other managers/workers continue to increase.
NOTENetwork clients are ignored when cycling workers or targets. For example, suppose you have five managers: four managers with one network server each, and one manager with four network clients (each associated with one of the other managers’ network servers). Running a “Cycle Workers” test in this configuration will run only one test, because the maximum number of network servers per manager is one (the manager with four network clients is treated as though it had no workers at all).
The following test types are available. For simplicity, the example for each test assumes that for all quantities the starting value is 1, the stepping type is linear, and the step value is 1.
• Normal -- run all selected targets for all workers.
This test type runs one test with the default values for all quantities: all workers are active in all managers, all selected targets are used by each worker, and the number of outstanding I/Os per disk is specified by the # of Outstanding I/Os field in the Disk Targets tab.
This test type can be used for a quick test of the current system configuration. This is the default test type.
• Cycle Targets -- add step targets for all workers at a time.
This test type increases the number of targets for each worker in each test. The number of tests is determined by the maximum number of targets per worker. For example, if each worker has three selected targets, this test type will run three tests:
1. All workers use 1 target (the first selected target in the Disk Targets or Network Targets tab).

2. All workers use 2 targets (the first two selected targets).3. All workers use 3 targets (all three selected targets).
This test type can be used in several different ways. For example:
Assign workers to disk drives from different adapter cards to show system scalability with work distributed over adapter cards.
Assign workers to the same drives to see results of having increased transferred request queues.
Place workers on separate systems to see scaling effects on a shared bus.• Cycle Workers -- add step workers using all selected targets at a time.
This test type increases the number of workers for each manager in each test. The number of tests is determined by the maximum number of workers per manager. For example, if each manager has three workers, this test type will run three tests:
1. All managers use 1 worker (the first worker shown in the Topology panel).2. All managers use 2 workers (the first two workers).3. All managers use 3 workers (all three workers).
Here are some ways this test type can be used:
If workers are on separate systems, allows testing of shared buses. Assign workers to disk drives on different adapters to show interaction of
heavily loaded cards within the same system. Assign workers to the same drives to see the results of increasing the request
queue.• Increment Targets Parallel -- add step targets to all managers at a time.
This test type increases the number of targets for each manager in each test, distributed over the manager’s workers. The number of tests is determined by the product of the maximum number of targets per worker and the maximum number of workers per manager. For example, if each manager has two workers and each worker has two targets, this test type will run four tests:
Manager 1 Manager 2 Targets perTest #
Worker 1 Worker 2 Worker 1 Worker 2 Manager
1 1 target 0 targets 1 target 0 targets 1 target2 2 targets 0 targets 2 targets 0 targets 2 targets3 2 targets 1 target 2 targets 1 target 3 targets4 2 targets 2 targets 2 targets 2 targets 4 targets
This test type can be used to determine the effect of increasing load on the server from all clients at once.
• Increment Targets Serial -- add step targets at a time.
This test type increases the total number of targets for all managers in each test, distributed over each manager’s workers. The number of tests is determined by the product of the number of managers, the maximum number of workers per manager, and the maximum number of targets per worker. For example, if each manager has two workers and each worker has two targets, this test type will run eight tests:
Manager 1 Manager 2 TotalTest #
Worker 1 Worker 2 Worker 1 Worker 2 Targets
1 1 target 0 targets 0 targets 0 targets 1 target2 2 targets 0 targets 0 targets 0 targets 2 targets3 2 targets 1 target 0 targets 0 targets 3 targets

4 2 targets 2 targets 0 targets 0 targets 4 targets5 2 targets 2 targets 1 target 0 targets 5 targets6 2 targets 2 targets 2 targets 0 targets 6 targets7 2 targets 2 targets 2 targets 1 target 7 targets8 2 targets 2 targets 2 targets 2 targets 8 targets
This test type can be used to determine the effect of total increasing load on the server from a number of clients.
• Cycle Targets and Workers -- add step targets at a time spread across workers.
This test type increases the number of targets for one worker in each test, then starts over and increases the number of targets for two workers in each test, and so on. The number of tests is determined by the product of the maximum number of workers per manager and the maximum number of targets per worker. For example, if each manager has three workers and each worker has two targets, this test type will run six tests:
Test # Worker 1 Worker 2 Worker 3
Targets per Manager
1 1 target 0 targets 0 targets 1 target2 2 targets 0 targets 0 targets 2 targets3 1 target 1 target 0 targets 2 targets4 2 targets 2 targets 0 targets 4 targets5 1 target 1 target 1 target 3 targets6 2 targets 2 targets 2 targets 6 targets
This test type can be used for scalability characterization of buses and networks.
• Cycle # Outstanding I/Os -- run step outstanding I/Os on all disks at a time.
This test type increases the number of outstanding I/Os per disk for each disk worker in each test (for network workers, this value is always 1). The number of tests is determined by the # of Outstanding I/Os control group. For example, if the # of Outstanding I/Os End With setting is 4, this test type will run four tests:
1. All workers use 1 outstanding I/O per target on all selected targets.2. All workers use 2 outstanding I/Os per target on all selected targets.3. All workers use 3 outstanding I/Os per target on all selected targets.4. All workers use 4 outstanding I/Os per target on all selected targets.
Note that the total number of outstanding I/Os seen by each target is the product of the number of outstanding I/Os in each worker and the number of workers using that target.
• Cycle # Outstanding I/Os and Targets -- run step outstanding I/Os on step targets at a time.
This test type increases the number of outstanding I/Os for all workers using one target, then increases the number of targets for all workers, and begins again the cycle of increasing the number of outstanding I/Os (for the increased number of targets), and so on. The number of tests is determined by the product of the maximum number of targets per worker and the End With value in the # of Outstanding I/Os control group. For example, if each worker has two targets and the # of Outstanding I/Os End With setting is 3, this test type will run six tests:
1. All workers use 1 outstanding I/O per target on 1 target.2. All workers use 2 outstanding I/Os per target on 1 target.3. All workers use 3 outstanding I/Os per target on 1 target.4. All workers use 1 outstanding I/O per target on 2 targets.

5. All workers use 2 outstanding I/Os per target on 2 targets.6. All workers use 3 outstanding I/Os per target on 2 targets.
This test type tests increasing load on the targets as well as buses.
15.7 WorkersThe Workers control group determines the initial number of workers, the step size, and the stepping type (linear or exponential) for the test types “Cycle Workers” and “Cycle Targets and Workers” (see the test types, above, for more information). It is ignored for all other test types. The default is a start value of 1, a step size of 1, and linear stepping.
15.8 TargetsThe Targets control group determines the initial number of targets, the step size, and the stepping type (linear or exponential) for the test types “Cycle Targets,” “Increment Targets Parallel,” “Increment Targets Serial,” “Cycle Targets and Workers,” and “Cycle # Outstanding I/Os and Targets” (see the test types, above, for more information). It is ignored for all other test types. The default is a start value of 1, a step size of 1, and linear stepping.
15.9 # of Outstanding I/OsThe # of Outstanding I/Os control group determines the initial and final number of outstanding I/Os, the step size, and the stepping type (linear or exponential) for the test types “Cycle # Outstanding I/Os” and “Cycle # Outstanding I/Os and Targets” (see the test types, above, for more information). It overrides the # of Outstanding I/Os field in the Disk Targets tab for these test types; it is ignored for all other test types. The default is a start value of 1, an end value of 32, a power base of 2, and exponential stepping.
This value is ignored by network workers; network workers always have a # Outstanding I/Os of 1.

16. Save Test Configuration File – Reference
Pressing the Save Test Configuration File toolbar button brings up the Save Test Configuration File dialog.
16.1 Iometer.icfWhen Iometer starts, it looks for a file named "iometer.icf" from which to load a previously saved test configuration. (A different filename can be specified by using a command line parameter. See "Specifying a Configuration File" for further details.) Save your test configuration to "iometer.icf" if you want the settings automatically loaded. If the file does not exist, Iometer loads with internally created default settings.
16.2 Settings to SaveUse the checkboxes in this control group to specify which settings to include in the saved file.

16.3 Test Setup Tab SettingsIf this option is selected, the current state of the Test Setup tab will be preserved in the file.
16.4 Results Display Tab SettingsIf this option is selected, the current settings of the Results Display tab will be preserved in the file. A results display performance bar can reflect the performance of specific managers and workers, and it is not possible to restore this information if the specified manager or worker isn’t currently logged into Iometer. This is explained in more detail in the Results display tab settings section of Open Test Configuration File – Reference.
16.5 Global Access Specification ListIf this option is selected, the Global Access Specifications list from the Access Specifications tab will be preserved in the file. This includes all information needed to restore these access specifications.
To preserve the assignments of these access specifications to workers in the Assigned Access Specifications list, the Access specification assignments checkbox must be selected.
16.6 Managers and WorkersIf this checkbox is not checked, the two checkboxes below it cannot be checked.
If this checkbox is selected, each manager and worker present in Iometer's Topology window is recorded in the file. The information recorded about each manager is the manager's name (which you see in the Topology window) and the computer-level address derived from the address Iometer is using to talk to that manager. This is not necessarily the network address other managers are using to talk to this manager (via network worker pairs).
A "Manager ID" is also saved for each manager. This disambiguates managers with the same name, with the same network address. This is NOT a unique identifier at the file scope. It is only unique to managers with the same name and network address.
When restoring the manager/worker configuration, it may not be possible to exactly recreate the preserved state. See the Open Test Configuration File – Reference section for details.
16.7 Access Specification AssignmentsIf this option is selected, the Assigned Access Specifications list from the Access Specifications tab will be preserved in the file. This list can be different for each worker, so separate Assigned access specifications information is saved for each Worker.

When this list is saved, only the names of the access specifications are recorded. If the actual content of the access specifications should be preserved, the Global Access Specification list checkbox should also be selected.
Only the names of the access specifications are stored because there are situations in which you may wish to save how the access specifications are assigned, but not necessarily the content of the access specifications. Suppose, for example, half of the workers should get access specification 1 and half should get access specification 2, with nothing said in the saved file about exactly what those access specifications are.
See the Open Test Configuration File – Reference section for more details.
16.8 Target AssignmentsIf this option is selected, the assigned disk and network targets for each worker will be preserved in the file.
For a disk target, the only information stored is the name of the assigned disk.
For a network target, the information stored is the name of the remote (target) network adapter and the remote manager identification information, which consists of the manager’s name, the network name used by Iometer to communicate with that manager, and a disambiguating integer (see “Managers and Workers” section above).
It may not always be possible to recreate target assignments when a file is being restored. See the Open Test Configuration File – Reference section for details.

17. Open Test Configuration File – Reference
Pressing the Open Test Configuration File toolbar button brings up the Open Test Configuration File dialog. In addition to the following, also see the Iometer Configuration File (.icf) section for further information.
17.1 Current SettingsThe "Current settings" control group determines whether the restored settings replace, or are merged with, the current settings.
See each setting's descriptions (below) for information on how this "Replace/Merge" selection affects the loading of that setting.
17.2 Settings to RestoreThe "Settings to restore" control group allows you to choose which settings to restore from a saved file. If you select a setting to restore that is not present in the file being opened, the selection is silently ignored. Except as noted below, if an error occurs during the restore, the remainder of the configuration file will not be processed.

17.3 Test Setup Tab SettingsIf this option is selected, the state of the “Test Setup” tab will be restored from the configuration file.
17.3.1 Replace/MergeThe state of the replace/merge radio button has no effect on the Test Setup settings. All previous settings will be lost.
17.4 Results Display Tab SettingsIf this option is selected, the state of the “Results Display” tab will be restored from the configuration file.
The performance bars on this tab can reflect the performance of specific managers and workers. If a bar’s specified manager cannot be found in the current Iometer setup, the bar will be reset to monitor “All Managers”. If a bar’s specified worker cannot be found, an attempt will be made to find that worker’s manager instead. If the manager cannot be found, the bar will be reset to monitor “All Managers”.
17.4.1 Replace/MergeThe state of the replace/merge radio button has no effect onthe Results Display settings. All previous settings will be lost.
17.5 Global Access Specifications ListIf this option is selected, the saved “Global Access Specifications” list will be restored from the configuration file.
17.5.1 Replace/MergeIf the replace radio button is selected, the current access specifications list and workers’ access specification assignments will be removed before the saved access specifications are restored.
If the merge radio button is selected, the saved access specifications will be added to the current “Global Access Specifications” list. If an access specification in the configuration file has the same name as an access specification that is already listed, it will silently overwrite the old access specification.
17.6 Managers and WorkersIf this checkbox is not checked, the two checkboxes below it cannot be checked.
If this checkbox is selected, managers specified in the configuration file being opened are matched to managers currently connected to Iometer (see Implementation Details below), and the worker configurations for those managers are restored accordingly. If a manager specified in the configuration file isn’t logged into Iometer, it is placed on a waiting list, and this dialog box appears.

Iometer examines each of the network addresses for the managers on the waiting list. If the network address is local, Iometer starts a copy of Dynamo for that manager . Iometer can start copies of Dynamo on the local machine only. You are responsible for starting Dynamo on all other machines, specifying a command line parameter indicating the computer name of the machine running Iometer. See "Specifying a Computer Name" below.
If a manager on the local machine has a nonstandard name (that is, a name other than its hostname), Iometer will use the /n switch to set the manager name as it starts Dynamo. If a manager on a remote machine has a nonstandard name, you must use the /n switch when you start it. See "Specifying a Manager Name" for more information.
If you click Abort, the dialog disappears and the file restore operation stops. An automatic abort will occur after a number of seconds. The default for this timeout is 10 seconds, but another value can be specified on the command line. (See "Specifying a Timeout Value" below.)
As managers log in, their entries are removed from the waiting list. Once all managers on the waiting list log in, the dialog disappears and the file restore operation continues.
17.6.1 Replace/MergeIf the replace radio button is selected, all managers logged into Iometer but not associated with managers in the configuration file for the restore operation are disconnected from Iometer. All workers are removed from the remaining managers, including assigned targets and access specifications, and the workers specified in the configuration file are created. As described in "Managers and Workers", above, managers in the configuration file that are not currently logged in are created (if local) or placed in a waiting list (if remote).
If the merge radio button is selected, all managers remain connected and no workers are removed. The workers specified in the configuration file are added to the managers’ worker lists. If a worker exists on a certain manager in both the current Iometer setup and the configuration file, the two workers are merged, including their access specification assignments and target assignments. No target will be selected more than once. As described in "Managers and Workers", above, managers in the configuration file that are not currently logged in are created (if local) or placed in a waiting list (if remote).
17.6.2 Implementation DetailsWhat follows is an explanation of the rules used to match managers in a saved file to managers in the running copy of Iometer. It is necessary to read this only if you are

customizing the manager/worker configuration section of the file by hand and you need to understand the meaning of the Manager ID values specified in the file.
The general rule: Managers can be restored only if the manager names [KB3] and network addresses match. The network address, in this case, is the address Iometer uses to talk to Dynamo. (If the manager is running on a system with more than one NIC or supporting more than one protocol, this may not be the same address as one that is being used as a target by a network worker.)
If there is more than one manager with the same name, they are distinguished by disambiguating Manager ID’s. The first manager encountered with a given name and network address is assigned ID 1, the second, ID 2. (There may be many managers with the same ID, but the ID will be unique among managers of the same name.)
Network workers need these IDs to decide which manager to connect to in the event that there are several with the same name.
An error will be reported if there wasn’t a connected Dynamo with the correct manager name for every entry in the configuration file.
The exception: If there is only one manager (Dynamo) connected to Iometer, and you are restoring a file that contains only one manager, the settings for the saved manager are used to configure the single connected manager. The manager names and network addresses do not have to match.
17.7 Access Specification AssignmentsThis checkbox corresponds to each worker’s Assigned Access Specifications list in the Access Specifications tab.When the Assigned Access Specifications list is saved, only the names of the assigned access specifications are recorded. The information that defines an access specification (transfer size, reply size, random/sequential distribution) is maintained only in the Global Access Specification list.
When restoring the access specification assignments, if a Global Access Specifications list is available in the configuration file and is also being restored, workers are assigned the access specifications from the global list by name.
If the global list is not being restored at the same time as the access specification assignments, the access specifications being assigned are assumed to be available already in Iometer’s Global Access Specifications list. If, in this case, a specification is named in a worker’s access specification assignments section that doesn’t already exist in Iometer’s global access specifications list, an error will be reported and the remainder of the file will continue to load.
See Save Test Configuration File – Reference section for more information.
17.7.1 Replace/MergeSee the Replace/Merge explanation for Managers and Workers, above.
17.8 Target AssignmentsThis checkbox corresponds to each worker’s Target assignments subsection in the configuration file.

If this option is selected, the assigned disk and network targets for each worker will be restored from the configuration file.
If a worker is being assigned a disk target, the target in the saved file must have the same name as the one Iometer displays in the Targets list on the Disk Targets tab. If there is no disk target by that name available to the worker, an error will be reported.
Four pieces of information are maintained about network targets: the target interface (an IP or VI address), the name of the manager that owns that interface, the network address Iometer uses to talk to that manager, and a disambiguating integer ID. (See Managers and Workers above for more information.) If the manager that owns the specified network target cannot be found, an error is reported.
17.8.1 Replace/MergeSee the Replace/Merge explanation for Managers and Workers, above.

18. Iometer Command Line Options
18.1 Getting Command Line Syntax InformationTo get syntax help, specify a question mark on the command line used to start Iometer:
Iometer /?
18.2 Specifying a Configuration FileTo have Iometer automatically open a configuration file at startup, specify the /c switch and provide the name of an Iometer configuration file. For example:
iometer /c setup.icf
iometer /c "c:\This filename has spaces.icf"
NOTE:If no configuration file parameter is specified, Iometer looks for an “iometer.icf” file in the current directory. If this file is found, it restores it automatically on startup. If this default configuration file is not found, Iometer starts with its internal default values for all controls.

18.3 Specifying a Results FileTo avoid being prompted for a filename every time you begin a test for which results are to be recorded, specify the /r switch and provide the name of a results file. If this file exists, the new information is appended to the existing file. Otherwise, the file is created. For example:
iometer /r out.csv
iometer /r "c:\This filename has spaces.txt"
If no result file parameter is specified on the command line and the “Record Results” option on the “Test Setup” tab is set to record results, Iometer will prompt you for a results filename every time a test is started.
NOTE:If you specify a results parameter on the Iometer command line and the “Record Results” option on the “Test Setup” tab is set to “None”, Iometer will ignore the setting and instead record all results (as if this option was set to “All”).
18.4 Specifying a Timeout ValueTo specify the amount of time the “Waiting for Managers” dialog will wait before automatically aborting a configuration restore, specify the /t parameter and a number of seconds the dialog should use as a countdown value. For example
iometer /t 30
If no timeout parameter is specified, the timeout defaults to 10 seconds.:
18.5 Omitting SwitchesYou may omit the command line switches if you prefer. Iometer assumes the first parameter found is a configuration filename, the second (if one) is a results filename, and the third (if one) is a timeout value. For example:
iometer c:\iometer\bigtest.icf bigtest_results.csv 60
18.6 Batch ModeIf both the configuration file and results file parameters are specified on the command line, Iometer attempts to run in “batch mode”, in which it follows these steps:
• Wait for necessary managers to log in. This will require you to start managers manually on any remote machines involved in the testing. Note that you may start the managers before starting Iometer. You can control a multiple-machine test from a batch file by using a third-party "rsh" service to start the remote Dynamos before invoking Iometer.
• Restore the specified Iometer configuration file (.icf).
• Begin testing.
• Stop each test when the specified run time (in “Test Setup” tab) has elapsed.

• Write the results to the specified results file after each test completes.
• Close Iometer after the last test is complete.
Most error notifications are suppressed and are quietly appended to the result file. However, if either the configuration file or the results file cannot be accessed, an error message requiring user interaction will appear.
NOTE:If the run time for a test is not set (is zero), the testing phase will continue indefinitely. Make sure the configuration file you are restoring specifies a nonzero run time in its TEST SETUP section if you desire true batch processing behavior. Any interaction with the toolbar, including pressing the "Stop" or "Stop All" buttons, puts Iometer back in interactive mode.
For example:
iometer /c test.icf /r results.csv
iometer /r "test results.csv" /c test.icf
iometer /c iometer.icf /r results.csv /t 100
iometer iometer.icf results.csv /t 100
The last 2 examples load the default .icf file (iometer.icf), run the tests defined, save the results to "results.csv", and exit. You can load the default .icf file, run the tests in interactive mode, and save the results to "results.csv", by not specifying the name of the configuration file. (Recall that to run Iometer in batch mode, both the configuration filename and the results filename must be specified.) For example:
iometer /r results.csv /t 30
19. Dynamo Command Line Options
19.1 Getting Command Line Syntax InformationTo get syntax help, specify a question mark on the command line used to start Dynamo.
Dynamo /?
19.2 Specifying a Computer NameIf you are executing Dynamo on a computer other than the one Iometer is running on, you must specify the Iometer computer name. Use the /i switch followed by the name of the computer running Iometer. For example
dynamo /i xanadu
If you do not specify this parameter, Dynamo searches for Iometer on the local host only.
19.3 Specifying a Manager NameYou may specify the name of the Dynamo instance you are executing by using the /n switch, followed by the desired name. For example
dynamo /n genie
If you do not specify this parameter, Dynamo uses its hostname as the manager name.
19.4 Specifying a Manager Network NameYou may specify the network name of the Dynamo instance you are executing by using the /m switch, followed by the network name of the computer or its IP address. For example
dynamo /m 192.168.2.42
If you do not specify this parameter, Dynamo uses the IP address of the first network interface card (NIC).
19.5 Specifying excluded filesystem typesFor the case, that you would like to exclude different file systems from the device search (which later will be shown on the Disk Targets tap of Iometer), you can do this with the /x switch. For example
dynamo /x “proc shm swap devpts nfs”
Please notice, that this switch is used for UNIX operating systems only. The default for Linux is “proc shm swap devpts” and for Solaris we have “proc specfs config” as a default.

19.6 Omitting SwitchesYou may omit the command line switches if you prefer. Dynamo assumes the first parameter found is a computer name, and the second (if one) is a manager name. The third (if one) is the manager network name. For example:
dynamo xanadu genie 192.168.2.42
This looks for Iometer on machine "xanadu", then logs in using manager name "genie".Iometer will use the IP address 192.168.2.42 to address/communicate with the Dynamo instance.

20. The Iometer Configuration File (.icf)
An Iometer Configuration File (.icf) is a standard text file with rigid formatting rules. If you intend to modify an .icf file using a text editor, care should be taken to preserve the formatting conventions of the file.
Some general guidelines follow:
• On any line, leading and trailing whitespace (spaces and tab characters) is ignored.
• Case is ignored in comparisons, but preserved when appropriate.
• Do not insert blank lines in an .icf file.
• When several values are present on a single line (identifiers, integer values), they should be separated with commas and/or whitespace.
• Identifiers that can contain special characters such as commas or spaces (test description, manager/worker names, access specification names) are on lines by themselves.
• File sections (described below) can be in any order in the file.
• Lines that begin with apostrophes are NOT ignored. They are headers that describe the format of the data.
20.1 VersionThe first and last lines in an .icf file are version markers. A version marker looks like this:
'Version yyyy.mm.dd
20.2 File SectionsAn .icf file has four sections:
• TEST SETUP
• RESULTS DISPLAY
• ACCESS SPECIFICATIONS
• MANAGER LIST
Each section of the file is identified in this way:
'SECTION NAME ======================================
zero or more lines of headers and data
'END section name

Sections may or may not be present in a file. If, when opening a file, you choose to restore a section that isn’t present in the file, no error is reported. (The rationale is that you should not have to know what is available in a given file before choosing which sections you would like to restore.)
20.3 Backward CompatibilityThis version of Iometer can read saved files generated by all previous versions of Iometer. Earlier versions of Iometer cannot read files generated by this version. This policy is not guaranteed to hold true in the future.

21. Configuring Windows NT* and Windows 2000* to Collect Network Performance Statistics
Some of the network performance statistics are not collected by default and need to be enabled. Until they are enabled, they will be reported as zero. To enable Iometer to collect and report these statistics, perform the following steps.
21.1 To configure Windows NT*:1. From the Start menu, select Settings, then launch the Control Panel.2. Within the Control Panel, launch Network.3. Within the Network window, select the Services tab.4. Select the SNMP Service and press OK.5. Enter the Windows NT 4.0 installation CD and press Continue.6. Use the default settings and press OK for the Microsoft SNMP Properties.7. Close the Network window.8. Reboot the system to have the changes take effect.
If Iometer still does not collect all of the network performance statistics, and you have installed an NT service pack, reinstalling the service pack after performing these steps should solve the problem.
21.2 To configure Windows 2000*:1. From the Start Menu, select Settings, then Network and Dial-up Connections.
This will display the Network and Dial-up Connections folder.2. Select the Advanced menu.3. Choose Optional Networking Components.4. Install the Management and Monitoring Tools component by selecting its check
box and pressing Next.5. Follow the installation instructions.

22. Using Iometer to Simulate a Real Workload
To use Iometer to simulate the workload of a particular application or benchmark, observe the application using the Windows NT Performance Monitor and then set Iometer’s controls to approximate the application’s workload.
In order to gather disk performance statistics using Performance Monitor, you need to prepare your system as follows:
• Open the Control Panel.• View Devices.• Select Diskperf.• Click on Startup and set it to Automatic.• Press OK, then Close.• Reboot for changes to take effect.
You should also be aware that, due to a bug in Performance Monitor under Windows NT 4.0, the values reported for the following quantities are doubled from the correct value if you are accessing a physical disk (PHYSICALDRIVE:n):
• Avg. Disk Queue Length• Disk Reads/sec• Disk Read Bytes/sec• Disk Transfers/sec• Disk Write Bytes/sec• Disk Writes/sec• Disk Bytes/sec
Note that this bug does not affect Iometer. Iometer gathers these statistics directly from Dynamo, not from Performance Monitor.