Embed Size (px)
Citation preview

International Journal of Research in Social Sciences Vol. 8 Issue 5, May 2018, ISSN: 2249-2496 Impact Factor: 7.081
Journal Homepage: http://www.ijmra.us, Email: [email protected]
Double-Blind Peer Reviewed Refereed Open Access International Journal - Included in the International Serial
Directories Indexed & Listed at: Ulrich's Periodicals Directory ©, U.S.A., Open J-Gage as well as in Cabell‟s
Directories of Publishing Opportunities, U.S.A
9 International Journal of Research in Social Sciences
http://www.ijmra.us, Email: [email protected]
INVESTOR’S PERCEPTIONS OF SECTORS EQUITY
MUTUAL FUND IN INDIA
Mr. MEGHARAJA.B1
Dr. CHALAWADI C.I2
Abstract
Investment takes vital role in the present economy for the movements of inflations rate year by
year due to the changes in the rules and regulations of the Indian government to the changes of
ruling party once in five years, therefore the investors indented to make their money safety and
maintain with same values for the future. Hence investors make savings through the sacrifice
their day to day activities for the sake of future benefits. In the present economy have different
investment avenues in India such as Post office savings, bank deposit, insurance, securities
market, real estate, mutual funds and gold etc. In these avenues few of them high risk and return,
low risk and low returns, but some avenues require knowledge for deployment of savings except
mutual fund. A mutual fund managed by the professionals, the study was conducted to know the
investor who belongs to Bellary district, who actively participated investing in mutual fund, their
perceptions on sectors equity mutual fund in India. The study data analysed and interpreted of
questionnaire through the statistical tools. Hence the researcher attempted to know the investors‟
perceptions of sectors equity mutual fund in India.
Key words: Descriptive statistics, one sample t test, Chi-square test etc.
1 Assistant Professor and Research Scholar,Department of Studies and Research in
Commerce,Vijayanagara Sri Krishnadevaraya University, Jnanasagara Campus,Vinayaka
Nagar –Bellary. Karnataka State, India.
2 Research Guide and Assistant Professor,Department of Studies and Research in
Commerce,Vijayanagara Sri Krishnadevaraya University, Post Graduate Centre,
Yelburga ( Post &Tq) Koppal (Dist), Karnataka (State)
ISSN: 2249-2496 Impact Factor: 7.081
10 International Journal of Research in Social Sciences
http://www.ijmra.us, Email: [email protected]
Introduction
The investment is a commitment of fund by person intention to earning additional return for the
their investment and mutual funds collected savings from the small investor and invest them in
corporate securities and government securities, in the present day economy mutual fund has been
playing vital role for attracting potential investors and existing investors who had invested others
than mutual funds such as stock market, bank deposit, post office and real estate. A mutual fund
is an investment vehicle made up of a pool of funds collected from many investors for the
purpose of investing in assets and securities such as stocks, bonds or money market instruments.
Mutual funds are operated by fund managers, who invest the fund capital and attempt to produce
capital gains and income for the fund investors. An asset management company (AMC) is a
company that manages a mutual fund. For all practical purposes, it is an organized form of a
money portfolio manager which has several mutual fund schemes with similar or varied
investment objectives. The AMC hires a professional money manager, who buys and sells
securities in line with the fund's stated objective. A mutual fund portfolio is structured and
maintained to match the investment objectives stated in its prospectus. Each investor owns
shares, which represent a portion of the holdings of the fund. Thus, a mutual fund is one of the
most viable investment options for the small investor as it offers an opportunity to invest in a
diversified, professionally managed basket of securities at a relatively low cost. Mutual funds
invest in a wide amount of securities, and performance is usually tracked as the change in the
total market cap of the fund, derived by aggregating performance of the underlying investments.
Mutual fund units, or shares, can typically be purchased or redeemed as needed at the fund's
current net asset value (NAV) per share. A fund's NAV is derived by dividing the total value of
the securities in the portfolio by the total amount of shares outstanding. Mutual funds allow
investors to pool in their money for a diversified selection of securities, managed by a
professional fund manager. It offers an array of innovative products like fund of funds,
exchange-traded funds, Fixed Maturity Plans, Sectoral Funds and many more.
The intention of the investors to invest at mutual funds are as follows

ISSN: 2249-2496 Impact Factor: 7.081
11 International Journal of Research in Social Sciences
http://www.ijmra.us, Email: [email protected]
along with Beat Inflation, Expert Managers, Convenience, Low Cost, Diversification, Higher
Return Potential, Liquidity, Safety &Transparency etc..
Statement of the problem
The mutual fund has been made tremendously significant role in the present scenario and it has
been attracting the unknown and prospective investor who would like to invest, hence the study
attempt to know the investors who made investment especially risky securities by the mutual
funds such as sectors equity mutual funds, those sectors are Banking, Fast Moving Consumer
Goods, Infrastructure, Pharmacy and others those involved high risky securities. The study went
to attempt to know the investors‟ perceptions of sectors equity mutual fund India. The researcher
has collected data from the investors who actively involved sectors equity mutual fund at Bellary
district in Karnataka by using structure questionnaire and evaluated them through the suitable
statistical tools on an entailed “investor‟s perceptions of sectors equity mutual fund in India”
Objectives of the study
To know the profile of the investors who invested in sectors equity mutual fund in India.
To examine the investors‟ perceptions of sectors equity mutual fund in India
To analyses the investors‟ perceptions and opinions by the statistical tools
Hypotheses of the study
Ho1 – There is no significant difference in perceptions for investment given by investors

ISSN: 2249-2496 Impact Factor: 7.081
12 International Journal of Research in Social Sciences
http://www.ijmra.us, Email: [email protected]
Sources of the study
The study data was collected by distributed purely based (Primary data) on close ended
structured questionnaire, those investors belong to Bellary district and actively invested sectors
equity mutual fund in India.
Types of research design: Descriptive research
Sampling technique: connivance sampling in non probability sampling
Sampling frame or Unit: The research was conducted in Bellary city only and Investors who
invested at sectors equity mutual fund in India.
Period of the study: From 01-01-2017 to 31- 10-2017.
Sample size of the study: A sample of 50 investors used to conduct the study
Tools used for the study: close ended structured questionnaire used for the collecting
perceptions and opinions of the investors who actively invested in sectors equity mutual fund in
India.
Statistical Tools: the tools used in this study are: descriptive statistics‟ and Chi-Square Test for
Association two hypotheses were made in this study and hypothesis testing was done using Chi
square for association using ms excel. Both hypotheses were tested with 95% confidence level
i.e. at 5% significant level.
Scaling technique: Five point Likert type scale used for analysis of the study and interpretation
(Strongly disagree-1, Disagree-2, neutral -3, Agree-4, strongly agree-5)
Limitations of the study
The study data was collected from investors who at the stock broking working hours.
The study scope has limited Bellary District only.
The study data collected of 50 filed questionnaires from the investors.

ISSN: 2249-2496 Impact Factor: 7.081
13 International Journal of Research in Social Sciences
http://www.ijmra.us, Email: [email protected]
Primary data analyses and interpretations
Profile of the investors
Age <35 35-45 45-55 >55 Total
Respondents 20 15 5 10 50
Percentage 40 30 10 20 100
Members of the
Family
<2 2-4 4-6 >6
Respondents 25 15 7 3 50
Percentage 50 30 14 6 100
Educ.
Qualification.
Primary Secondary Graduate Post Graduate
Respondents 3 10 25 12 50
Percentage 6 20 50 24 100
Occupation Employee Business Former Others
Respondents 30 17 0 3 50
Percentage 60 34 0 6 100
Monthly savings
(„000)
<5 5-10 10-15 >15
Respondents 23 17 7 3 50
Percentage 46 34 14 6 100
Analyses and interpretation
The study demographical area base on that 20 percent of the respondents age less than the 35
years and 30 percent of respondents age between 35 to 45, 10 percent of the respondents age
between 45 to 55, rest of the percent of the respondent age more than the 55 ages.
Respondent‟s intention to invest in mutual funds beyond family responsibility indicates that 50
percent of the respondents have simple family, and 30 percent of the respondents were 2 to 4
members and 14 and 6 percents of the respondent‟s family member are up to 6 and more than 6
respectively, totally concludes that more family member are not able to investment at mutual
fund and less family member may not be invest at mutual funds.

ISSN: 2249-2496 Impact Factor: 7.081
14 International Journal of Research in Social Sciences
http://www.ijmra.us, Email: [email protected]
The study respondents educational qualification, 26 percent of the respondents belonging to
primary and secondary education, 74 percent of the respondents are graduate and post graduate,
it concludes that higher the qualification of the investors have more aware of mutual funds in
study area.
The respondent‟s occupation of the study, among 94 percent respondents belong to Employees
and business and rest of the respondents are others occupations. It clearly tells that it was
attracted of employees and business in the sample study.
The investor‟s savings of the study express that 46 percent of the respondents made savings less
than the Rs. 5000, and 34 percent made savings between 5000 to 10000 and 14 and 6 percent of
the respondents made investment at mutual funds more than 10000. It concludes that less savers,
it was attracted and not to more savers in the sample area.
Investors Perceptions of the statements codes for analysis and interpretation of the data.
Codes Statements to the investors
X1 Are you satisfied by investing mutual fund?
X2 Do you have a satisfaction for investing in equity mutual funds?
X3 Do you have a satisfaction for investing in sectors equity mutual funds?
X4 How do you feel about services of the sectors equity mutual fund AMC‟s India?
X5 What about your perceptions toward AMC‟s services India?
X6 How do you feel about the fund managers in your AMCs?
X7 Are you satisfied by getting options from the fund manager in your AMCs?
X8 How do you feel about AMC‟s Service fee charges in India?

ISSN: 2249-2496 Impact Factor: 7.081
15 International Journal of Research in Social Sciences
http://www.ijmra.us, Email: [email protected]
Table-1
Investor‟s satisfaction of mutual funds in India (X1)
X1
Frequency Percent Valid Percent Cumulative Percent
Valid
Highly
Dissatisfied 1 2.0 2.0 2.0
Dissatisfied 7 14.0 14.0 16.0
Neutral 9 18.0 18.0 34.0
Satisfied 14 28.0 28.0 62.0
Highly Satisfied 19 38.0 38.0 100.0
Total 50 100.0 100.0
Interpretation: The above table 1 and Chart 1 depicted that majority of the respondents (19) are
highly satisfied, 14 respondents‟ satisfied and 9 respondents are neutral and remaining
respondents are dissatisfied. Hence it shows that the selected investors 67 percents are satisfied
and highly satisfied and 16 percent of the investors are not satisfied towards mutual fund in
India.

ISSN: 2249-2496 Impact Factor: 7.081
16 International Journal of Research in Social Sciences
http://www.ijmra.us, Email: [email protected]
Table-2
Satisfaction for investing in equity mutual funds (X2)
Frequency Percent Valid Percent Cumulative
Percent
Valid
Highly
Dissatisfied 1 2.0 2.0 2.0
Dissatisfied 6 12.0 12.0 14.0
Neutral 12 24.0 24.0 38.0
Satisfied 17 34.0 34.0 72.0
Highly Satisfied 14 28.0 28.0 100.0
Total 50 100.0 100.0
Interpretation: The above table 2 and Chart 2 shows that majority of the respondents (17) are
satisfied, 14 respondents‟ highly satisfied and 12 respondents are neutral and remaining
respondents are dissatisfied. Hence it shows that the selected majority investors 62 percents are
satisfied and highly satisfied and 14 percent of the investors are dissatisfied and highly
dissatisfied on investing on equity mutual funds in India.
ISSN: 2249-2496 Impact Factor: 7.081
17 International Journal of Research in Social Sciences
http://www.ijmra.us, Email: [email protected]
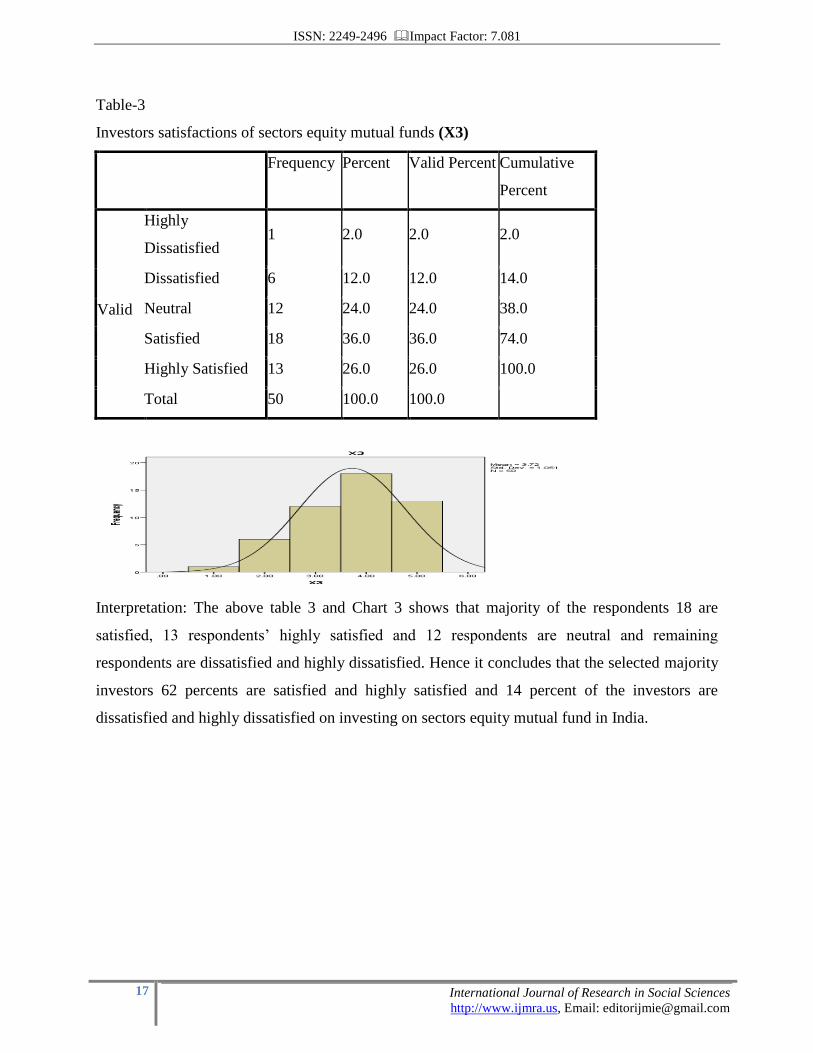
Table-3
Investors satisfactions of sectors equity mutual funds (X3)
Frequency Percent Valid Percent Cumulative
Percent
Valid
Highly
Dissatisfied 1 2.0 2.0 2.0
Dissatisfied 6 12.0 12.0 14.0
Neutral 12 24.0 24.0 38.0
Satisfied 18 36.0 36.0 74.0
Highly Satisfied 13 26.0 26.0 100.0
Total 50 100.0 100.0
Interpretation: The above table 3 and Chart 3 shows that majority of the respondents 18 are
satisfied, 13 respondents‟ highly satisfied and 12 respondents are neutral and remaining
respondents are dissatisfied and highly dissatisfied. Hence it concludes that the selected majority
investors 62 percents are satisfied and highly satisfied and 14 percent of the investors are
dissatisfied and highly dissatisfied on investing on sectors equity mutual fund in India.

ISSN: 2249-2496 Impact Factor: 7.081
18 International Journal of Research in Social Sciences
http://www.ijmra.us, Email: [email protected]
Table-4
Investors satisfactions of services offered by the AMCs on sectors equity
mutual fund in India (X4)
Frequency Percent Valid Percent Cumulative
Percent
Valid
Highly
Dissatisfied 1 2.0 2.0 2.0
Dissatisfied 6 12.0 12.0 14.0
Neutral 12 24.0 24.0 38.0
Satisfied 17 34.0 34.0 72.0
Highly Satisfied 14 28.0 28.0 100.0
Total 50 100.0 100.0
Interpretation: The above table 4 and Chart 4 states that majority of the 17 respondents are
satisfied, 13 respondents‟ highly satisfied and 12 respondents are neutral and rest of the
respondents are dissatisfied and highly dissatisfied. Hence it concludes that the selected majority
investors 62 percents are satisfied and highly satisfied and 14 percent of the investors are
dissatisfied and highly dissatisfied on services offered by the AMCs on sectors equity mutual
fund in India.
ISSN: 2249-2496 Impact Factor: 7.081
19 International Journal of Research in Social Sciences
http://www.ijmra.us, Email: [email protected]
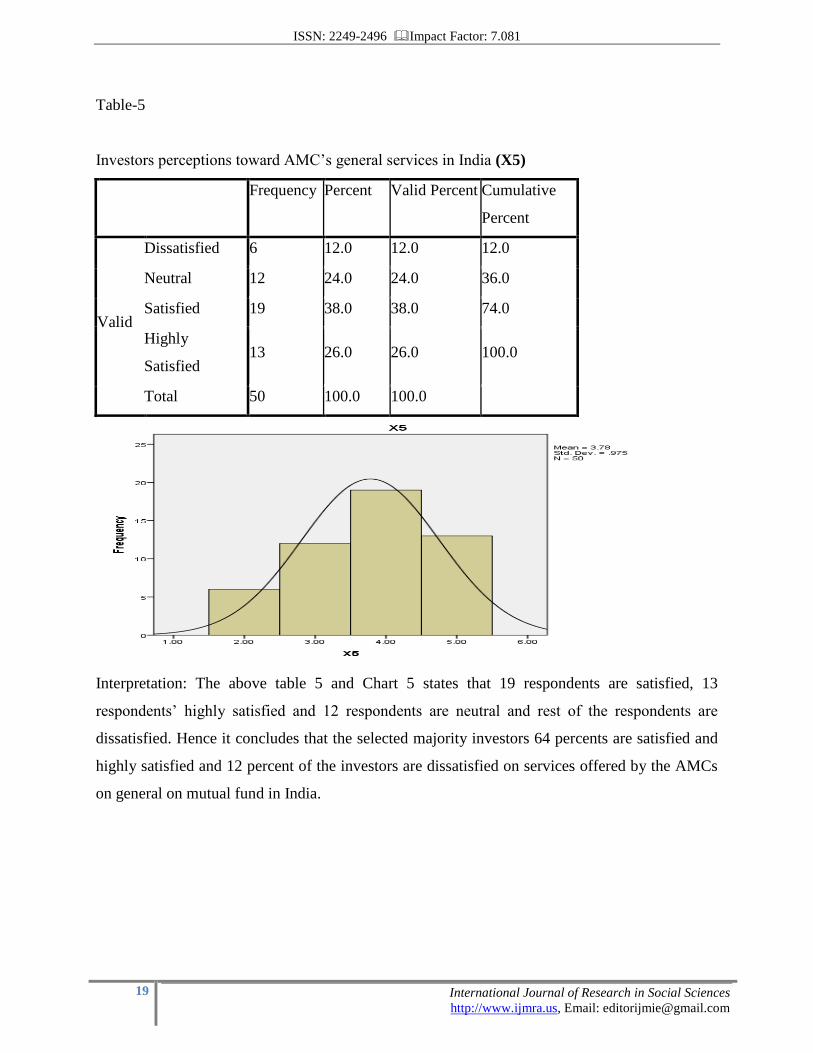
Table-5
Investors perceptions toward AMC‟s general services in India (X5)
Frequency Percent Valid Percent Cumulative
Percent
Valid
Dissatisfied 6 12.0 12.0 12.0
Neutral 12 24.0 24.0 36.0
Satisfied 19 38.0 38.0 74.0
Highly
Satisfied 13 26.0 26.0 100.0
Total 50 100.0 100.0
Interpretation: The above table 5 and Chart 5 states that 19 respondents are satisfied, 13
respondents‟ highly satisfied and 12 respondents are neutral and rest of the respondents are
dissatisfied. Hence it concludes that the selected majority investors 64 percents are satisfied and
highly satisfied and 12 percent of the investors are dissatisfied on services offered by the AMCs
on general on mutual fund in India.

ISSN: 2249-2496 Impact Factor: 7.081
20 International Journal of Research in Social Sciences
http://www.ijmra.us, Email: [email protected]
Table-6
Investors perceptions on the fund managers in AMCs (X6)
Frequency Percent Valid Percent Cumulative
Percent
Valid
Highly
Dissatisfied 2 4.0 4.0 4.0
Dissatisfied 5 10.0 10.0 14.0
Neutral 11 22.0 22.0 36.0
Satisfied 19 38.0 38.0 74.0
Highly Satisfied 13 26.0 26.0 100.0
Total 50 100.0 100.0
Interpretation: The above table 6 and Chart 6 states that majority of the 19 respondents are
satisfied, 13 respondents‟ highly satisfied and 11 respondents are neutral and rest of the
respondents are dissatisfied and highly dissatisfied. Hence it concludes that the selected majority
investors 64 percents are satisfied and highly satisfied and 14 percent of the investors are
dissatisfied and highly dissatisfied on the fund managers in AMCs.

ISSN: 2249-2496 Impact Factor: 7.081
21 International Journal of Research in Social Sciences
http://www.ijmra.us, Email: [email protected]
Table -7
Investors satisfaction on options given by the fund manager in AMCs (X7)
Frequency Percent Valid Percent Cumulative
Percent
Valid
Highly
Dissatisfied 1 2.0 2.0 2.0
Dissatisfied 6 12.0 12.0 14.0
Neutral 11 22.0 22.0 36.0
Satisfied 18 36.0 36.0 72.0
Highly Satisfied 14 28.0 28.0 100.0
Total 50 100.0 100.0
Interpretation: The above table 7 and Chart 7 shows that majority of the respondents 18 are
satisfied, 14 respondents‟ highly satisfied and 11 respondents are neutral and rest of the
respondents are dissatisfied and highly dissatisfied. Hence it concludes that the selected majority
investors 64 percents are satisfied and highly satisfied and 14 percent of the investors are
dissatisfied and highly dissatisfied on investing on Investors satisfaction on options given by the
fund manager in AMCs.

ISSN: 2249-2496 Impact Factor: 7.081
22 International Journal of Research in Social Sciences
http://www.ijmra.us, Email: [email protected]
Table-8
Investors perceptions towards AMC‟s Service fee charges in India (X8)
Frequency Percent Valid Percent Cumulative
Percent
Valid
Highly
Dissatisfied 2 4.0 4.0 4.0
Dissatisfied 6 12.0 12.0 16.0
Neutral 11 22.0 22.0 38.0
Satisfied 17 34.0 34.0 72.0
Highly Satisfied 14 28.0 28.0 100.0
Total 50 100.0 100.0
Interpretation: The above table 8 and Chart 8 shows that majority of the respondents 17 are
satisfied, 14 respondents‟ highly satisfied and 11 respondents are neutral and remaining
respondents are dissatisfied and highly dissatisfied. Hence it concludes that the selected majority
investors 62 percents are satisfied and highly satisfied and 16 percent of the investors are
dissatisfied and highly dissatisfied on investing towards AMC‟s Service fee charges in India

ISSN: 2249-2496 Impact Factor: 7.081
23 International Journal of Research in Social Sciences
http://www.ijmra.us, Email: [email protected]
Table-9
Descriptive statistics of selected investors’ perceptions on sectors equity mutual fund in
India
Analysis and interpretation:
N: (Numbers of the observation), it represents the 50 respondents given their perceptions on
sectors equity mutual fund in India and there is no missing observation all statements
Mean: The mean is the average perceptions level of a group of students and the study selected
respondents shared their view under five point likert scale express that majority of the
respondents positive perceptions more than the 3, hence that selected investors are satisfied on
statistical data.
Descriptive Statistics
X1 X2 X3 X4 X5 X6 X7 X8
N Valid 50 50 50 50 50 50 50 50
Missing 0 0 0 0 0 0 0 0
Mean 3.8600 3.7400 3.7200 3.7400 3.7800 3.7200 3.7600 3.7000
Median 4.0000 4.0000 4.0000 4.0000 4.0000 4.0000 4.0000 4.0000
Mode 5.00 4.00 4.00 4.00 4.00 4.00 4.00 4.00
Std. Deviation 1.14304 1.06541 1.05056 1.06541 .97499 1.08872 1.06061 1.12938
CV 0.296 0.285 0.282 0.285 0.258 0.293 0.282 0.305
Variance 1.307 1.135 1.104 1.135 .951 1.185 1.125 1.276
Skewness -.654 -.505 -.504 -.505 -.361 -.694 -.563 -.611
Std. Error of Skewness .337 .337 .337 .337 .337 .337 .337 .337
Kurtosis -.656 -.501 -.438 -.501 -.806 -.053 -.414 -.369
Std. Error of Kurtosis .662 .662 .662 .662 .662 .662 .662 .662
Range 4.00 4.00 4.00 4.00 3.00 4.00 4.00 4.00
Minimum 1.00 1.00 1.00 1.00 2.00 1.00 1.00 1.00
Maximum 5.00 5.00 5.00 5.00 5.00 5.00 5.00 5.00
Sum 193.00 187.00 186.00 187.00 189.00 186.00 188.00 185.00

ISSN: 2249-2496 Impact Factor: 7.081
24 International Journal of Research in Social Sciences
http://www.ijmra.us, Email: [email protected]
The median is the point in the distribution that splits the scores in two equal groups, which is
also known as the midpoint of a distribution, or the 50th percentile.
The mode is the most frequently occurring score in a distribution
The selected respondents standard Deviations are more than the 1 and less than the 1.5 except the
X5 (.97).The higher the standard deviation, the wider the distribution of the scores is around the
mean. This indicates a more heterogeneous or dissimilar spread of raw scores on a scale. A lower
value of the standard deviation indicates a narrower distribution (more similar or homogeneous)
of the raw scores around the mean.
The CV makes interpreting a bit easier by dividing the standard deviation by the mean
(1.143/3.86=0.296). Higher values indicate higher variability. Hence the above data shows that
less variations means investors have consistent perceptions on sectors equity mutual fund.
Skewness: A symmetrical distribution has a skewness of zero. An asymmetrical distribution
with a long tail to the right (higher values) has a positive skew and an asymmetrical distribution
with a long tail to the left (lower values) has a negative skew.
Kurtosis: it is measured against the normal distribution. If the kurtosis is close to 0, then a
normal distribution is often assumed. These are called mesokurtic distributions. If the kurtosis
is less than zero, then the distribution is light tails and is called a platykurtic distribution. If the
kurtosis is greater than zero, then the distribution has heavier tails and is called a leptokurtic
distribution
The range, R, is the difference between the lowest and the highest scores in a distribution. The
range is easy to compute and interpret, but it only indicates the difference between the two
extreme scores in a set.

ISSN: 2249-2496 Impact Factor: 7.081
25 International Journal of Research in Social Sciences
http://www.ijmra.us, Email: [email protected]
The table shows the One-Sample T Test
Test Value = 0
T df Sig. (2-tailed) Mean
Difference
95% Confidence Interval of
the Difference
Lower Upper
X1 23.879 49 .000 3.86000 3.5352 4.1848
X2 24.822 49 .000 3.74000 3.4372 4.0428
X3 25.038 49 .000 3.72000 3.4214 4.0186
X4 24.822 49 .000 3.74000 3.4372 4.0428
X5 27.414 49 .000 3.78000 3.5029 4.0571
X6 24.161 49 .000 3.72000 3.4106 4.0294
X7 25.068 49 .000 3.76000 3.4586 4.0614
X8 23.166 49 .000 3.70000 3.3790 4.0210
Analysis: The above calculated value of the investors‟ perceptions on sectors equity mutual fund
in India shows that calculated values of one sample T test greater than the table value is 1.960 at
5 percent level of significance and 49 degree of freedom for two tailed test. Hence the null
hypotheses have rejected and alternative hypotheses accepted. It concludes that there is
significant difference between the selected investors‟ perceptions on sectors equity mutual fund
in India.
The table shows the Chi-Square Test Statistics
X1 X2 X3 X4 X5 X6 X7 X8
Chi-Square 18.800a 16.600
a 17.400
a 16.600
a 6.800
b 18.000
a 17.800
a 14.600
a
df 4 4 4 4 3 4 4 4
Asymp. Sig. .001 .002 .002 .002 .079 .001 .001 .006
a. 0 cells (0.0%) have expected frequencies less than 5. The minimum expected cell frequency is
10.0.
b. 0 cells (0.0%) have expected frequencies less than 5. The minimum expected cell frequency is
12.5.

ISSN: 2249-2496 Impact Factor: 7.081
26 International Journal of Research in Social Sciences
http://www.ijmra.us, Email: [email protected]
Ho- there is no significance difference between the investors‟ perceptions on sectors equity
mutual fund in India.
Ha- there is significance difference between the investors‟ perceptions on sectors equity mutual
fund in India.
Analysis and interpretation: The above sampled fifty investors‟ perceptions to words sectors
equity mutual funds were evaluated that those investor‟s perceptions were same on sectors equity
mutual fund in India. The data was analysed using a chi-square goodness of fit test. The null
hypotheses were rejected (P< .05) to all except X5, under 5 percent levels of significance table
value is 11.668 at 4 degree of freedom but X5 calculated value is 6.8 less than the above table
value, hence its null hypothesise has accepted and others are rejected. The majority of the
investors have the same perceptions towards the sectors equity mutual fund but not on the
AMCs.
Finding and conclusion
The study attempt to know the investors‟ perceptions sectors equity mutual fund in India,
descriptive research used for analyses and interpretation of the collected structured questionnaire,
those are issued to the Bellary District in Karnataka State on random sampling. The study has
analysed that 68 percent of the respondents are satisfied of mutual fund. The 62 percent of the
respondents are satisfied by investing in the equity and sectors equity mutual fund. The 62
percent of the respondents satisfied services and fee charges of the AMCs on sectors equity
mutual fund. The 64 percent of the respondents are satisfied on services given by the AMC‟s. 66
percent of the respondents are satisfied which is options given by the fund managers in the
AMC‟s. One sample t test, the null hypotheses have rejected and alternative hypotheses
accepted. It concludes that there is significant difference between the selected investors‟
perceptions on sectors equity mutual fund in India. The majority of the investors have the same
perceptions towards the sectors equity mutual fund but not on the AMCs. Overall paper says that
investors who invested sectors equity mutual fund are satisfied by taking high risk as well as
high returns.

ISSN: 2249-2496 Impact Factor: 7.081
27 International Journal of Research in Social Sciences
http://www.ijmra.us, Email: [email protected]
Reference
1. Sundar Sankaran, (2010) “Indian mutual funds handbook” 2nd
edition vision book.
2. Kothari, S.P. and Jerold B. Warner, 2001, “Evaluating mutual fund performance” Journal
of finance Vol. 56, No. 1, pp. 1985-2010.
3. Megharaja B & Chalawadi C.I, “Performance Evaluation of HDFC Taxsaver Fund with
Benchmark Nifty 50 Index” International Journal of Commerce and Management, May issue
(2017).
4. Sharpe WF (1966) Mutual Fund Performance. Journal of Business 39: 119-138.
5. Treynor JL (1965) How to rate management of investment funds? Havard Business
Review 43: 63-75.
6. Jensen M C (1968) the performance of mutual funds in the period 1945-1964, Journal of
Finance 23: 389–416.
7. Fama EF (1972) Components of Investment Performance, Journal of Finance 27: 551-
567
8. Financial Services by Dr.S.Guruswamy, McGraw Hill Publication, 2nd Edition, Fourth
Reprint 2012, p: 216.
9. Aswath Damodaran (2016) “Damodaran on Valuation-Security analysis for investment
and corporate finance, Second Edition, Willy publication.
10. Jeelan Bhasa and Veeresh (2014), “Foreign tourist satisfaction-a case of Hampi visit”,
Southern Economist, June 15, 2014 page: 25-29
11. Megharaja & Chalawadi C.I, “Performance evaluation of equity mutual fund in India
with special reference to sector funds” International Journal of Commerce and Management,
February issue (2017).
12. Financial Services by Dr.S.Guruswamy, McGraw Hill Publication, 2nd Edition, Fourth
Reprint 2012, pp: 229-233.
13. Franco Modigliani and Leah Modigliani, “Risk-Adjusted Performance: How to Measure
It and Why,” Journal of Portfolio Management, Vol. 23, No. 2, Winter 1997, pp: 45-54.
14. Gangadhar, V.(1992). The Changing Pattern of Mutual Funds in India, Management
Accountant, 27(12): 924-928.
15. Garg, S. (2011). A Study on Performance Evaluation of Selected Indian Mutual Funds.
International Journal of Innovation Creativity and Management (IJICM), 1(1):1-10.

ISSN: 2249-2496 Impact Factor: 7.081
28 International Journal of Research in Social Sciences
http://www.ijmra.us, Email: [email protected]
16. S.Kevin, Security Analysis and Portfolio Management, PHI Learning Private Limited,
New Delhi, Oct-2012, pp: 222-3.
17. Shakeela Naz & others, “Risk Adjusted Performance Evaluation of Balanced Mutual
Fund Schemes in Pakistan” European Journal of Business and Management ISSN 2222-1905
(Paper) ISSN 2222-2839 (Online) Vol.7, No.1, 2015
18. Timotej jagric risk-adjusted performance of mutual funds: Some tests, south-eastern
Europe journal of economics 2 (2007) 233-244.
19. Syed Husain Ashraf Performance Evaluation of Indian Equity Mutual Funds against
Established Benchmarks Index, International Journal of Accounting Research, 2014,
20. Dr. J K Raju & Mr. Manjunath B R, Performance Evaluation Of Indian Equity Mutual
Fund Schemes, Journal of Business Management & Social Sciences Research (JBM&SSR) ISSN
No: 2319-5614 Volume 4, No.11,November 2015


