Embed Size (px)
Citation preview

Investor’s Presentation
FY’2016-17

GROWTH CHART – CAPACITY & PRODUCTION – JKLCMn. MT.
2011 2012
Clinker Capacity
Cement Capacity
Production
2013 2014 2015
JKLC CAGR during FY’12 to FY’17 – 20%
2016
4.75 4.75 5.29
4.31 4.72 5.00 5.23
3.96 4.13 4.29 4.62
6.64
6.27
8.30
6.27
8.65
*Without considering 1.60 Mn. MT of Udaipur Cement Works Ltd., a 71% subsidiary of JK Lakshmi Cement Ltd.
5.47
2017
6.60
10.90
As on 31st March
6.88
Mar’18(E)
6.77
11.50
PRODUCTION
(Lac. MT)
SALES
(Lac. MT)
3 Months Ended
31.03.2017 31.03.2016
21.77 20.51
6%
12 Months Ended
31.03.2017 31.03.2016
74.78 68.83
9%
3 Months Ended
31.03.2017 31.03.2016
22.90 21.59
6%
12 Months Ended
31.03.2017 31.03.2016
79.49 73.24
9%
7.48
1
*
*
*

Industry Growth Vs JKLC
Particulars
Apr.12 - Mar.13 Apr.13 - Mar.14 Apr.14 - Mar.15 Apr.15 - Mar.16 Apr.16 - Mar.17
(12M) (12M) (12M) (12M) (12M)
All India 5% 3% 5% 5% -1%
North + Gujarat Zone 4% - 3% 2% -4%
JK Lakshmi Cement - Existing 8% 7% 6% 3% 1%
East Zone 5% 5% 1%
JK Lakshmi Cement - including
East Zone 23% 9%
% Growth
2

Capacity Utilisation – Year (Apr.-Mar.)
Particulars Apr.12 - Mar.13 Apr.13 - Mar.14 Apr.14 - Mar.15 Apr.15 - Mar.16 Apr.16 - Mar.17
(12M) (12M) (12M) (12M) (12M)
All India 70% 68% 66% 66% 62%
North + Gujarat Zone 86% 83% 78% 72% 67%
JK Lakshmi Cement - Existing 94% 99% 82% 85% 76%
East Zone 80% 74% 69%
JK Lakshmi Cement - Durg 69% 92%
JK Lakshmi Cement - including
East Zone 82% 79%
3

Jaykaypuram
Durg
Kalol(Grinding Unit)
Jharli(Grinding Unit
& AAC Block)
Odisha(Grinding Unit)
Mother Plants – Cement (Clinker) - Mn.MT
Udaipur
Surat(Grinding Unit)
UCWL1.60(1.20)
1.30
4.65(4.79)
0.90
1.352.70(1.98)
0.60
4

Markets
Rajasthan (26%)
Gujarat (34%)
Haryana
Delhi
Mumbai (4%)
Punjab
J&K
H.P.
W.U.P.&
Utt.
(36%)
Madhya Pradesh(9%)
Maharashtra(10%)
Andhra Pradesh(2%)
Odisha(17%)
W.Bengal(1%)
5

Region-wise Cement Sales - Sirohi
Regions 2012-13 2013-14 2014-15 2015-16 (12M) 2016-17 (12M)
% sales % sales % sales % sales % sales
Rajasthan / MP 23 26 27 26 26
Gujarat 34 35 36 35 34
Maharashtra 8 7 8 6 4
North 35 32 29 33 36
6
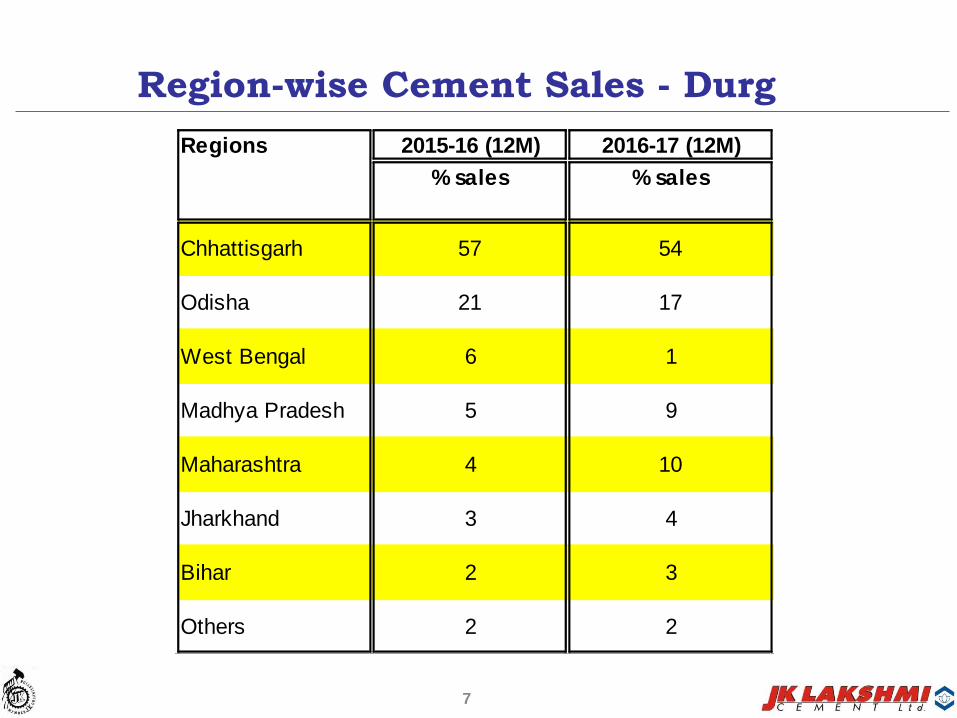
Region-wise Cement Sales - Durg
Regions 2015-16 (12M) 2016-17 (12M)
% sales % sales
Chhattisgarh 57 54
Odisha 21 17
West Bengal 6 1
Madhya Pradesh 5 9
Maharashtra 4 10
Jharkhand 3 4
Bihar 2 3
Others 2 2
7

Financial Highlights – For 3 Months ended 31.03.2017
8
Sr. Particulars Unit For the IVth Qtr. ended For Twelve Months ended
No. 31.03.17 31.03.16
Existing Durg Total Existing Durg Total Figures %
1 Production (Incl. Clinker Sale) Lac MT 16.44 5.33 21.77 15.90 4.61 20.51 1.26 6%
2 Sales Lac MT 17.58 5.32 22.90 16.94 4.65 21.59 1.31 6%
3 Turnover Rs. Cr. 710 194 904 662 163 825 80 10%
4 Net Sales Rs. Cr. 636 171 807 596 140 735 72 10%
5 PBIDT (before other Income) Rs. Cr. 67 4 72 80 5 85 -14 -16%
6 PBIDT (after other Income) Rs. Cr. 94 4 98 93 5 98 0 0%
7 Interest Rs. Cr. 26 21 47 26 24 50 -4 -7%
8 PBDT Rs. Cr. 68 -16 51 66 -19 47 4 8%
9 Depreciation Rs. Cr. 32 14 46 28 13 40 6 14%
10 PBT (before exceptional items) Rs. Cr. 36 -30 6 39 -32 7 -2 -
11 Exceptional Items Rs. Cr. 0 0 0 0 0 0 0 -
12 PBT Rs. Cr. 36 -30 6 39 -32 7 -2 -
13 PAT Rs. Cr. 41 -20 21 47 -21 26 -5 -
14 OCI after Tax Rs. Cr. -1 0 -1 1 0 1 -2 -
15 Total CI after Tax Rs. Cr. 40 -20 20 47 -21 27 -7 -
16 Basic EPS (After Tax) Rs. 1.77 2.20 -0.43 -
17 OPM (On Net Sales) % 11% 2% 9% 13% 4% 12% -3%
Incr. / Decr. (-) in

Financial Highlights – For 12 Months ended 31.03.2017
9
Sr. Particulars Unit For Twelve Months ended 31.12.2016
No. 31.03.17 31.03.16
Existing Durg Total Existing Durg Total Figures %
1 Production (Incl. Clinker Sale) Lac MT 56.85 17.93 74.78 56.44 12.39 68.83 5.95 9%
2 Sales Lac MT 61.46 18.03 79.49 61.00 12.24 73.24 6.25 9%
3 Turnover Rs. Cr. 2598 662 3260 2479 461 2939 321 11%
4 Net Sales Rs. Cr. 2332 579 2910 2223 397 2620 291 11%
5 PBIDT (before other Income) Rs. Cr. 350 15 365 282 -10 272 93 34%
6 PBIDT (after other Income) Rs. Cr. 420 15 435 331 -10 321 115 36%
7 Interest Rs. Cr. 98 91 189 101 96 197 -8 -4%
8 PBDT Rs. Cr. 322 -76 247 230 -106 124 123 99%
9 Depreciation Rs. Cr. 116 56 172 108 54 163 9 6%
10 PBT (before exceptional items) Rs. Cr. 206 -132 74 121 -160 -39 113 -
11 Exceptional Items Rs. Cr. 0 0 0 5 6 11 -11 -100%
12 PBT Rs. Cr. 206 -132 74 117 -166 -50 124 -
13 PAT Rs. Cr. 168 -86 82 102 -109 -7 89 -
14 OCI after Tax Rs. Cr. -1 0 -1 -1 0 -1 0 -
15 Total CI after Tax Rs. Cr. 168 -86 81 101 -109 -8 89 -
16 Basic EPS (After Tax) Rs. 6.97 -0.56 7.53 0%
17 OPM (On Net Sales) % 15% 3% 13% 13% -3% 10% 3%
Incr. / Decr. (-) in

Major Performance IndicatorsPower Consumption (Kwh./ MT of cement)
10
2009-10 2010-11 2011-12 2012-13 2013-14 2014-15 2015-16 2016-17Sirohi
2016-17Durg
79 7978
7573 74
75 74
71

Major Performance IndicatorsFuel Consumption (K.Cal./Kg.of clinker)
11
2009-10 2010-11 2011-12 2012-13 2013-14 2014-15 2015-16 2016-17Sirohi
2016-17Durg
763
746 742 738
726
704 703 700 703

KEY FINANCIAL RATIOS
12
Particulars Unit 2011-12 2012-13 2013-14 2014-15 2015-16 2016-17
Operating Profit
Margin ( net of Excise)% 19 21 15 15 10 13
Interest Coverage Times 5 6 4 4.16 1.63 2.31
Total Debt / Equity Times 0.96 1.09 1.27 1.41 1.47 1.57
Net Debt / Equity Times 0.48 0.77 0.97 1.18 1.26 1.20
EV per Ton
(1US$ = Rs. 67)US $/MT 36 63 78 125 100 103

7 MW WHR at Durg
Sl No. Particulars Rs. Cr.
1 Capacity (MW) 7
2 Project Cost 90
3 Debt 60
4 Internal Accruals 30
5 Debt : Equity Ratio 2.00
6 CAPEX upto Mar.'17 79
Expected Commissioning - Qtr.ending Dec'17
13

20 MW TPP at Durg
S.No. Particulars Rs. Cr.
1 Capacity (MW) 20
2 Project Cost 135
3 Debt 100
4 Internal Accruals 35
5 Debt : Equity Ratio 2.86
Expected Commissioning - Oct'18
14

Split Grinding Unit at Odisha
15
S.No. Particulars Rs. Cr.
1 Capacity (Mn. MT) 0.60
2 Project Cost 150
3 Debt 100
4 Internal Accruals 50
5 Debt : Equity Ratio 2.00
6 CAPEX upto Mar.'17 45

Revival & Rehabilitation of UCWL
16
S.No. Particulars Rs. Cr.
1 Capacity (Mn. MT) 1.60
2 Project Cost - Rs.Cr. 815
- Rs/MT 5,094
3 Term Loan from Bank/MFs 525
4 Promoters Contribution 290
5 Debt : Equity Ratio 1.91
Commissioned - Mar'17

Means of Finance for UCWL
Means of Finance
A.Equity
1.Equity/other instruments from JKLC 205
2. Equity 10
3. Internal Accruals 65
4. Unsecured Loan from JKLC 10
Total Equity 290
B.Term Loan from Bank/MFs 525
Total (A+B) 815
Rs. Cr.
17

Advantages to JKLC from UCWL
1. Commissioned in Mar’2017.
2. Investment cost in UCWL is US $ 72 per MT as against the
cost of US $ 120 per MT for a new Green field Cement Plant
i.e., about 40% cheaper.
3. The plant has an excellent location, well connected by Road,
Rail & Air and is close to the National Highway.
4. The plant is having railway siding – easy movements of
goods.
5. Plant has the benefit of 50% Sales Tax Incentive of about Rs.
140 /MT
6. Proximity of the Plant to the Consumption Centers has
freight advantage.
18
7. The accumulated tax losses of UCWL of over Rs.100 Cr.
will result in tax savings in future years.
8. The combined capacities of JKLC & UCWL would increase
the market share and consolidation of capacities would give
benefits of synergy & logistics.
9. Availability of surplus land for commercial use and further
expansion.
10.JKLC’s holding is already 71% & Group holding is 74%.
11. Future option for JKLC : Merger/Dilution in Stake
for future Growth in JKLC.
Advantages of UCWL Revival
19

Shareholding Pattern of JKLC as on 31st Mar’2017
20
I Promoters & Promoter Group 45.94%
II FIIs,MFs,Banks etc. 33.47%
III Public 20.59%
Total 100.00%
I Total Share Capital (Rs. Cr.) 58.85
II Total No. of Shares (Cr.)
(Face Value Rs. 5/- each) 11.77

1. Buy-back upto Rs. 97.5 Cr. at a Cap of Rs. 70/- per share inFeb’2012.
Cap of Rs. 70/- per share represents :
57% Premium over 12 months average price.
68% Premium over 6 months average price.
67% Premium over 3 months average price.
66% Premium over 1 months average price.
43% Premium over 15 days average price.
The Company Utilised only Rs. 30.47 Cr. for the Buy-back
2. Share Split from - Rs. 10/- per share into 2 Shares of Rs. 5/- each.
Shareholder’s friendly Initiatives
21

3. Consistent Dividend Payout Ratio
13% for FY 2017.
56% for FY 2016.
30% for FY 2015.
30 % for FY 2014.
20% for FY 2013.
25% for FY 2012.
30% for FY 2011.
29% Average for last 7 Years
Shareholder’s friendly Initiatives (Contd..)
22

JKLC among Best Performers on the bourses
Annualised Stock Price Return since January 2003
55.5
39.4
36.8
33.8
30.0
29.6
25.4
24.9
24.9
24.0
22.8
22.3
19.9
18.3
16.5
Shree cement
JK lakshmi Cement
Chettinad Cement
Birla Corp
Mangalam Cement
Madras Cement
Ambuja Cement
Grasim Inds
ACC
Prism Cement
Century Textiles
Heidelberg Cement
Sensex
India Cements
Kesoram Industries
CompanyCAGR return (%)
Source : Capitaline, BSE, BCCI Annual Report/Business Standard 30.05.13
23

Setting up WHR Plant of 7MW at Durg.
Setting up TPP Plant of 20 MW at Durg.
At Durg in 2016-17 the Company has achieved much improvedefficiencies.
Premium Brands Pro+, Platinum Cement is sold from Durg Plant.
Reduction in Borrowing Cost on LT Loans through annual resetting.
Purchase of Power at Cheaper rate through Exchange.
Pro+ Cement sale to increase in Northern Markets too.
The Company has penetration in rural markets.
Way Forward
24

Increasing volumes through split location Grinding unit and outsourcing Grinding Arrangement.
Short Term rating continues at A1+ (highest possible rating).
Long Term rating is ‘AA’.
Way Forward
25

JKLC became a 11 Mn MT Cement Company in Mar’2017.
Cement Capacity (including UCWL) has gone up from 9.35 Mn. MT in Mar’16 to 13 Mn. MT in Mar’2017.
Efficiency Parameters amongst best in Industry.
Key Financial Ratios well within accepted Norms.
Become PAN India Player (Barring South).
JKLC has breached 10 Mn MT in Oct’16.
26

Thank You